acta parasitologica, 2015, 60(1), 85–98; issn 1230-2821 ... et al., acta... · département de...
TRANSCRIPT

DOI: 10.1515/ap-2015-0011© W. Stefański Institute of Parasitology, PASActa Parasitologica, 2015, 60(1), 85–98; ISSN 1230-2821
Phylogeography analysis and molecular evolution patternsof the nematode parasite Heligmosomum mixtum
based on mitochondrial DNA sequences
Hela Sakka1,2,3*, Heikki Henttonen5, Ghada Baraket1, Salhi-Hannachi Amel1* and Johan Michaux3,4
1Laboratoire de Génétique Moléculaire, Immunologie et Biotechnologie. Département de Biologie, faculté des Sciences de Tunis. Unversité Tunis El Manar 2092 El Manar, Tunis, Tunisie; 2Faculté des Sciences de Bizerte, 7021 Zarzouna, Tunisie;
3 INRA, UMR CBGP 1062, Campus international de Baillarguet, CS 30016, F-34988 Montferrier-sur-Lez cedex, France;4Conservation Genetics Unit, University of Liège, Institute of Botany (Bat. 22) 4000 Liège, Belgium;
5The Finnish Forest Research Institute Vantaa Research Unit, Vantaa Unit, Finland
AbstractMitochondrial DNA was explored to study phylogeography of the nematode parasite Heligmosomum mixtum and elucidate
molecular evolution pattern of cytochrome b gene. The size of cyt b gene ranged from 511 bp to 591 bp and the average of GC
contents was 28.9%. The overall transition/transversion ratio R was 5.773 indicating that the transitions are more frequent than
transversion. The aligned sequences allowed identifying 54 mtDNA haplotypes among the 119 examined individuals. The
genetic divergence registered among the populations of H. mixtum was low (0.3% to 1.5%). Neighbor–joining and maximum
Likelihood trees evidenced a huge polytomy and unstructured phylogeographic pattern among the studied populations. The
demographic analyses tend to evidence a recent and rapid expansion of H. mixtum. Our results imply a positive selection and
the genetic hitchhiking effect is unlikely. Parameters performed supported scenario of sweep selection and recent expansion of
H.mixtum populations. Both positive selection and demographic histories have jointly contributed to the observed patterns of
nucleotide diversity and haplotypes structure. The comparison of the phylogeographical pattern of H. mixtum with the one of
its most common rodent host M. glareolus, confirmed a strong incongruence between the two species. These results strongly
suggest that the parasite would not be specific to M. glareolus and that it would switch easily from one rodent species to
another. The mitochondrial diversity seems to be unstructured with any biogeographic repartition of the variability and that the
genetic structure of H. mixtum is probably associated with weak host specificity.
KeywordsMitochondrial DNA, Cytochrome b gene, Phylogeography, Myodes glareolus, Nematode parasite, Heligmosomum mixtum
Introduction
Phylogeography is a field of research that studies the
processes determining the geographical distribution of ge-
netic lineages at the intra-specific or congeneric levels and is
useful for detecting processes such as population subdivision,
speciation events and ecological adaptation, and migration
routes associated with past climatic changes (Avise 2000).
However, the phylogeography of invertebrate taxa, particu-
larly parasite species, was still poorly studied until recently
(Wickström et al. 2003; Nieberding et al. 2004, 2005, 2008).
Indeed, over the last few years, there has been increasing in-
terest in investigating the dispersal abilities of invertebrates
and micro-organisms (Nieberding et al. 2005). In this con-
text, phylogeographical studies have been performed on par-
asites like nematodes and they enabled to understand whether
and how the Pleistocene climatic fluctuations may have af-
fected the genetic structure of parasite species. H. mixtum has
a direct life-cycle (no intermediate host), it reproduces sexu-
ally with three free-living larval stages and a 4th, parasitic
larval stage dwelling in the intestinal wall (Asakawa 1987).
The micro-habitat of the adult is the lumen of the anterior
small intestine (duodenum) (Haukisalmi and Henttonen
1993). The mating habits of H. mixtum are unknown, but
polygamy is thought to prevail in nematodes (Haukisalmi
et al. 1996). Its first larval stages are free and require 3 days
to become infective. Host contamination occurs after inges-
tion of contaminated faeces. Adult parasites live in the intes-
*Corresponding author: [email protected]

Hela Sakka et al.86
tine and produce eggs in the host faeces about 12 days after
ingestion. Individuals in the free-living stage have no disper-
sal activity, so it seems that the gene flow in this species is de-
termined by host movements (Goüy de Bellocq et al. 2002,
2003). The prevalence of H. mixtum (percentage of host in-
fected) and its abundance (average number of parasites per
host) on Myodes glareolus, are high, 45% and 12 corre-
spondingly (N’Zobadila 1994).
Myodes glareolus (Arvicolinae, Rodentia) is a forest
dweller present throughout Europe since at least the middle
Pleistocene (1.2 Ma) (Bauchau and Chaline 1987). The phy-
logeography and the post glacial colonization history of the
bank vole have been extensively studied in Europe showing a
complex phylogeographical structure (Deffontaine et al. 2005,
2009). The results revealed the presence of four Mediterranean
(Basque, Spanish, Italian and Balkan) and three continental
(western, eastern and ‘Ural’) phylogroups.The host and its par-
asite are common and geographically widespread in all over
the western Palearctic region except in the Mediterranean
biome (Spitzenberger 1999).
Comparative phylogeographical approaches have also
been developed in several studies (Wickström et al. 2003;
Nieberding et al. 2005; Biek et al. 2006; Whiteman et al.2007). Parasites have notably been used to resolve the evolu-
tionary and ecological history of their host (Nieberding and
Olivieri 2007). It have been found to have often more struc-
tured populations than their host, suggesting lower rates of
gene flow, but the reverse has also been found in some species
(McCoy et al. 2005). The extent to which the spatial structure
of parasite populations mirrors patterns seen in host popula-
tions seems to depend on the degree to which they are de-
pendent on the host (Barrett et al. 2008). Indeed, host vagility
should be a major determinant of parasite gene flow because
many parasites have no free-living stages or have low disper-
sal capability in their free-living stages (McCoy et al. 2003;
Criscione et al. 2005). Consequently, gene flow in a parasite
with multiple host species will be controlled by the more mo-
bile host (Criscione et al. 2005). Divergent patterns between
host and parasite may imply that additional host species play
a role in dispersing the parasite (Jones and Britten 2010).
However, the links between the host specificity of a parasite
and a congruent signal between their phylogeographic patterns
are still poorly studied.
Mitochondrial DNA was used for phylogeographic stud-
ies. It is a molecule that has specific characteristics different
from those of the nuclear DNA, which made it very attrac-
tive for the researchers (Ballard and Whitlock 2004). Char-
acteristics as its abundance, its simple genetic structure
(haploid) due to its uniparental transmission (maternal inher-
itance generally), its small size and the absence of introns and
recombination facilitate its amplification and its sequencing.
The arrangement of its genes was very stable between various
taxonomic classes. However, phylogeographic studies using
genetic marker such as the gene coding for the cytochrome b
of the mitochondrial DNA (mtDNA) have been developed in
order to examine the phylogeographic patterns of vertebrate
and invertebrate taxa. For this purpose, we studied the phy-
logeographical structure of the nematode parasite (Heligmo-somum mixtum) (Heligmosomidae) and we compared it to
those of its most commonly host, the bank vole (Myodesglareolus). However, this nematode seems to have also the
ability to infect other rodent hosts such as Clethrionomys ru-tilus, the vole Microtus arvalis, Microtus agrestis and Micro-tus socialis and the gerbill Meriones persicus (Haukisalmi
et al. 1996; Mezeika et al. 2003; Grikieniennë 2005; Kia et al.2010; Zhigileva 2011). In contrast to its related species, the
nematode Heligmosomoides polygyrus, which is character-
ized by an important congruent phylogeographic pattern as
compared to its specific host, the wood mouse (Apodemussylvaticus), we therefore hypothesize that H. mixtum would
be characterized by a weaker phylogeographic structure,
which would be divergent to those of its major host, the bank
vole. In this scope, the aims of the present study are: (i) to
verify, by sequencing the mitochondrial DNA cytochrome b
gene (cyt b), the hypothesis of a weak congruence between
the phylogeographic structure of H. mixtum and M. glareolus;
and (ii) to discuss the particularities of H. mixtum phylogeo-
graphical pattern as compared with those of other invertebrate
taxa, in the light of the knowledge on the population genetic
structure and the genetic diversity of nematode parasite
species.
Materials and Methods
Sample collection and sequencing
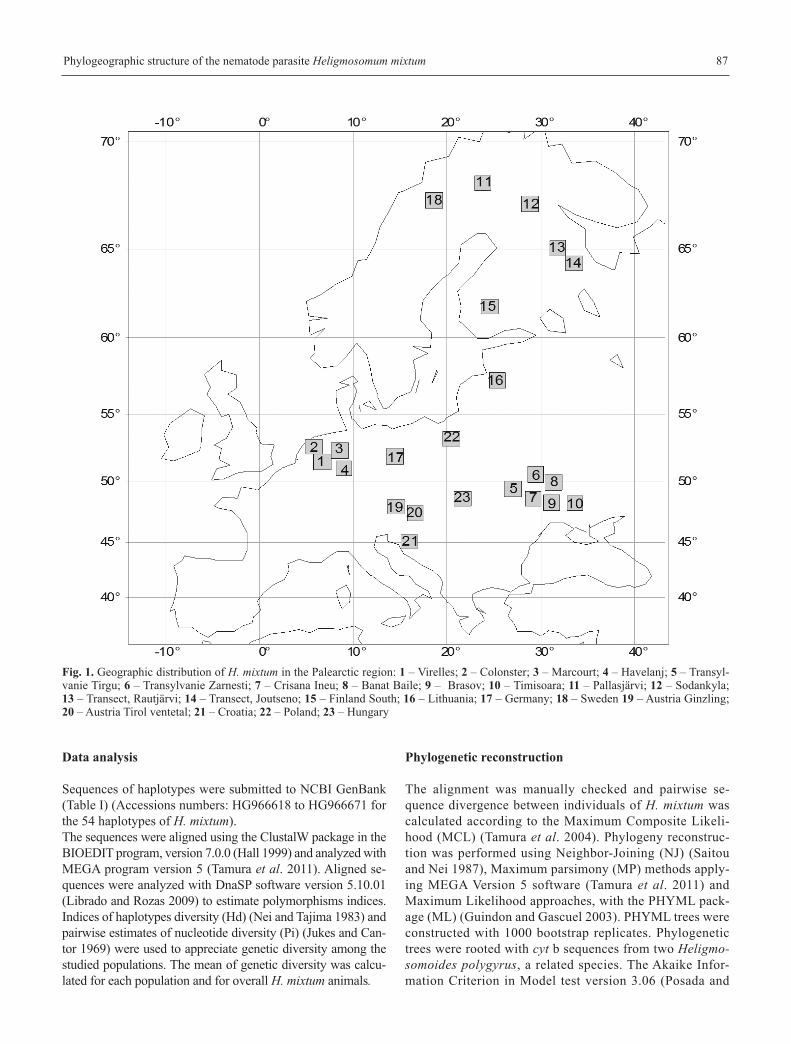
A set of 119 adult Heligmosomum mixtum from 10 localities
in Europe were analyzed (Table I, Fig. 1). All samples were
identified at the species level. Tissues are held in the collection
of Michaux J., Nieberding C., Deffontaine V., Libois R., Hent-
tonen H., Niemima J.
DNA from H. mixtum was extracted as reported by Goüy
de Bellocq et al. (2001). A total of 591 bp for the cyt b gene
were amplified by the polymerase chain reaction (PCR).
Specific primers are used 3F (5’-CTGCTGATGGYTCAA
TAGCTT-3’) and 3R (5’-GGGTCACCCAACCTAAAAGG-
3’. These primers were defined using Primer3 software (ver-
sion 4.0.0) (Koressaar and Remm 2007). Amplifications were
carried out in 50µL volumes including 0.35 µL of each 100
µM primer, 4 µL of 1 mM dNTP, 10 µL of 5Xreaction buffer,
29 µL of purified water, 4µL DMSO and 0.5 µL of 5U/µL Go
TAQ DNA polymerase. PCR amplification used 2 µL of DNA
extract. Amplifications were performed at 94°C for 4 min, fol-
lowed by 40 cycles (45 s at 94°C, 45 s at 54°C and 1 min 30
s at 72°C) with final extension cycle of 10 min at 72°C with a
Labover PTC100 Thermal Cycler. PCR products were puri-
fied using the Ultrafree DA Amicon kit and directly se-
quenced. Both strands were sequenced by Macrogen Society
(Seoul, South Korea).
Phylogeographic structure of the nematode parasite Heligmosomum mixtum 87
Data analysis
Sequences of haplotypes were submitted to NCBI GenBank
(Table I) (Accessions numbers: HG966618 to HG966671 for
the 54 haplotypes of H. mixtum).
The sequences were aligned using the ClustalW package in the
BIOEDIT program, version 7.0.0 (Hall 1999) and analyzed with
MEGA program version 5 (Tamura et al. 2011). Aligned se-
quences were analyzed with DnaSP software version 5.10.01
(Librado and Rozas 2009) to estimate polymorphisms indices.
Indices of haplotypes diversity (Hd) (Nei and Tajima 1983) and
pairwise estimates of nucleotide diversity (Pi) (Jukes and Can-
tor 1969) were used to appreciate genetic diversity among the
studied populations. The mean of genetic diversity was calcu-
lated for each population and for overall H. mixtum animals.
Phylogenetic reconstruction
The alignment was manually checked and pairwise se-
quence divergence between individuals of H. mixtum was
calculated according to the Maximum Composite Likeli-
hood (MCL) (Tamura et al. 2004). Phylogeny reconstruc-
tion was performed using Neighbor-Joining (NJ) (Saitou
and Nei 1987), Maximum parsimony (MP) methods apply-
ing MEGA Version 5 software (Tamura et al. 2011) and
Maximum Likelihood approaches, with the PHYML pack-
age (ML) (Guindon and Gascuel 2003). PHYML trees were
constructed with 1000 bootstrap replicates. Phylogenetic
trees were rooted with cyt b sequences from two Heligmo-somoides polygyrus, a related species. The Akaike Infor-
mation Criterion in Model test version 3.06 (Posada and
Fig. 1. Geographic distribution of H. mixtum in the Palearctic region: 1 – Virelles; 2 – Colonster; 3 – Marcourt; 4 – Havelanj; 5 – Transyl-vanie Tirgu; 6 – Transylvanie Zarnesti; 7 – Crisana Ineu; 8 – Banat Baile; 9 – Brasov; 10 – Timisoara; 11 – Pallasjärvi; 12 – Sodankyla; 13 – Transect, Rautjärvi; 14 – Transect, Joutseno; 15 – Finland South; 16 – Lithuania; 17 – Germany; 18 – Sweden 19 – Austria Ginzling;20 – Austria Tirol ventetal; 21 – Croatia; 22 – Poland; 23 – Hungary

Hela Sakka et al.88
Table I. Geographical locations, sample abbreviations and Genbank accession numbers of H. mixtum haplotypes used in this study
CountriesTotal
number of samples
Localities
Number ofanimals
(number ofhaplotypes)
Ab
bre
via
tion
s
Seq
uen
ces
cod
e
Genbank accession
numbers (forhaplotypes only)
Belgium 12 Virelles 5 (3) Be1 Be1.1 HG966618
Be1.2 HG966619
Be1.3 HG966620
Colonster 3 (1) Be2 Be2 HG966621
Marcourt 3 (1) Be3 Be 3 HG966622
Havelanj 1 (1) Be4 Be4 HG966623
Romania 29 Transylvanie, Tirgu Mures, Sovata 7 (5) Ro1 Ro1.1 HG966624
Ro1.2 HG966625
Ro1.3 HG966626
Ro1.4 HG966627
Ro1.5 HG966628
Transylvanie, Zarnesti, Plaiul Foii 6 (3) Ro2 Ro2.1 HG966629
Ro2.2 HG966630
Ro2.3 HG966631
Crisana, Ineu, Moneasa 4 (2) Ro3 Ro3.1 HG966632
Ro3.2 HG966633
Banat, Baile, Herculane, Vallée de la Cerna 5 Ro4
Brasov 5 (3) Ro5 Ro5.1 HG966634
Ro5.2 HG966635
Ro5.3 HG966636
Timisoara 1 Ro6
Finland 23 Pallasjärvi: kittila 6 (2) PJ PJ1 HG966637
PJ2 HG966638
Sodankyla 3 (2) So So1 HG966639
So2 HG966640
Transect: Finland SE (Rautjärvi) 5 (3) T1 T1.1 HG966641
T1.2 HG966642
T1.3 HG966643
Transect: Finland SE (Joutseno) 4 (1) T2 T2 HG966644
Finland South 5 (4) Fin Fin1 HG966645
Fin2 HG966646
Fin3 HG966647
Fin5 HG966648
Lithuania 2 SE, Alytus 2 (2) Li Li1 HG966649
Li2 HG966650
Germany 14 Gera 14 (5) Ger Ger1 HG966651
Ger2 HG966652
Ger3 HG966653
Ger4 HG966654
Ger5 HG966655
Sweden 10 Norrbotten-northeasternmost Sweden 10 (3) Sw Sw1 HG966656
Sw2 HG966657
Sw3 HG966658
Austria 10 Ginzling, Tirol, Zemmtal 5 (3) Au1 Au1.1 HG966659

Phylogeographic structure of the nematode parasite Heligmosomum mixtum 89
Crandall 1998) was used to select the best substitution
model for the parasite data in the ML reconstructions which
was GTR plus gamma.
The genetic relationship of the haplotypes was also graph-
ically displayed using the algorithm MINSPNET available in
the program Arlequin 3.5 (Excoffier et al. 2005). The Mini-
mum Spanning Network (MSN) computes a Minimum Span-
ning Tree (MST) and Network (MSN) among haplotypes.
Fst
(Hudson et al. 1992), Gst
(Nei 1973) and Nst
(Lynch and
Crease 1990) were analyzed with DnaSP, version 5.10.01
(Librado and Rozas 2009). Fst
index is widely used to estimate
the degree of subdivision between populations and Gst
depends
only on the frequencies of the haplotypes. Nst is influenced by
both haplotype frequencies and genetic distances between
haplotypes. Moreover, the strengths of gene flow (Nm) and
random drift were accessed from Fst, Gst and N
stparameters.
Phylogeographical and genetic structure analyses
Selection neutrality for the detected mutations was tested by
both Tajima’s D (Tajima 1989) and Fu and Li’s D* and F*
methods (Fu and Li 1993). Demographic parameters were as-
sessed using the distribution of pairwise sequence differences
(mismatch distribution) of Rogers and Harpending (1992) and
site-frequency spectra (distribution of the allelic frequency at
a site) of Tajima (1989) using the program DnaSP software
version 5.10.01 (Librado and Rozas 2009). This analysis pro-
vided an estimate of the population dynamics either in recent
expansion or rather stable in time in the different lineages. The
smoothness of the observed distribution was quantified by the
raggedness statistic, r (Harpending 1994) and Ramos-Onsins
statistic, R2 (Ramos-Onsins et al. 2002). The confidence in-
tervals were provided by computer simulations using the
coalescent algorithm in DnaSP software. This powerful pop-
ulation expansion test takes into account haplotype frequen-
cies under neutrality, stationarity and panmixis, as described
by Ewens (1972), but is sensitive to background selection.
Fu’s Fs test (Fu and Li 1993) was used to access historical
changes in population size. Fu’s Fs is sensitive to demographic
expansion and can be used to estimate exponential population
growth or decline (Lessa et al. 2003).
On the basis of the percentage of genetic divergence (GD)
obtained with a distance analysis (K2P distance), and was cor-
rected for ancestral mtDNA polymorphism, as proposed by
Avise (2000) using the formula: Pnet
= PAB
–0.5 (PA+P
B). Where
Pnet
is the correcteddistance between the isolated lineages A and
B, PAB
is the mean genetic distance in pairwise comparisons of
individuals A vs. B, and PA
and PB
are mean genetic distance
among individuals within these lineages. However, it is gener-
ally problematic to calibrate the absolute rate of evolution of in-
vertebrate parasites because of lacking fossil records.
Results
Sequence variation in the cytochrome b gene
The length of the cytb mt DNA ranged from 511 bp to 591 bp
with an average of 596 bp among the 119 sequences of H. mix-tum analysed. The average GC contents of the cytb mt DNA
was 28.9%. The transition/transversion rate ratios were: K1 =
21.104 (purines) and K2 = 10.067 (pyrimidines). The overall
transition/transversion bias (R) was 5.773. This result shows
that the transitions are more frequent than transversions at the
cytb mtDNA (Table II). The different substitutions detected
are given in table II and shows that the A→G and T→C tran-
sitions are more frequent than G→A and C→T transitions in
the cyt b gene.
CountriesTotal
number of samples
Localities
Number ofanimals
(number ofhaplotypes) A
bb
revia
-ti
on
s
Seq
uen
ces
cod
e
Genbank accession
numbers (forhaplotypes only)
Au1.3 HG966661
Tirol, Ventetal 5 (2) Au2 Au2.1 HG966662
Au2.2 HG966663
Croatia 12 Croatia 12 (5) Cr Cr1 HG966664
Cr2 HG966665
Cr3 HG966666
Cr4 HG966667
Cr5 HG966668
Poland 8 O Lublin: Pulawi PO45 8 (3) Po Po1 HG966669
Po2 HG966670
Po3 HG966671
Hungary 1 Zala 1 Hun
H. polygyrus 2 AJ608890;AJ608902

Hela Sakka et al.90
Table II. Maximum Composite Likelihood Estimate of the Pattern of Nucleotide Substitution in cytochrome b gene
A T C G
A – 2.78 0.45 26.17
T 1.4 – 4.54 1.24
C 1.4 28 – 1.24
G 29.55 2.78 0.45 –
Rates of different transitional substitutions are shown in bold and those of transversionsal substitutions are shown in italics. Evolutionary analyses were conducted in MEGA5 (Tamura et al. 2011)
Table III. Summary of genetic polymorphisms observed in H. mixtum animals used in this study
H. mixtum All individuals
Number of sequences 119
Alignment length (bp) 487
Monomorphic characters 422
Variable characters 65
Parsimony informative characters 36
Singleton variable sites 29
Total number of mutations 66
Number of polymorphic sites (S) 65
Number of haplotypes (H) 54
Haplotype diversity (Hd) ± SD 0.968 ± 0.007
Variance of haplotype diversity 0.00004
Nucleotide diversity (Pi) ± SD 0.00851 ± 0.00048
Theta (per site) from Eta 0.02532
Average of pairwise differences (K) 4.144
Minimum number of recombination events (Rm) 8
%GD genetic diversity (K2P) 0.009
Tajima’s D–2.10850(*P<0.05)
Fu and Li’s D*–3.30214
(**P<0.02)
Fu and Li’s F*–3.35691
(**P<0.02)
Fu’s Fs statistic–52.426
(P=0.000)
SD: Standard deviation, Tajima’s D, Fu and Li’s D* and Fu and Li’s F*: neutrality tests
Table IV. Genetic variability and mean genetic diversity observed within the different populations of Heligmosomum mixtum
Heligmosomum mixtum Number of samples
% GD genetic diversity (K2P)
Number of haplotypes
Hd ± SD Pi ± SD
Belgium 12 1 9 0.939 ± 0.058 0.00905 ± 0.00086
Romania 28 0.5 13 0.854 ± 0.055 0.00481 ± 0.00091
Lithuania 2 1.5 2 1 ± 0.5 0.01197 ± 0.00598
Austria 10 0.5 6 0.844 ± 0.103 0.00437 ± 0.00058
Hungary 1 n/c n<2
Poland 8 0.9 3 0.607 ± 0.164 0.00768 ± 0.00192
Croatia 12 0.3 6 0.818 ± 0.096 0.00433 ± 0.0014
Germany 14 0.5 5 0.769 ± 0.083 0.00539 ± 0.00118
Sweden 11 0.3 5 0.618 ± 0.164 0.00316 ± 0.00125
Finland 21 0.6 15 0.938 ± 0.04 0.00636 ± 0.00052
SD: Standard deviation; Hd: haplotypic diveristy; Pi: nucleotide diversity; GD: genetic diversity

Phylogeographic structure of the nematode parasite Heligmosomum mixtum 91
Sequence alignment resulted in a matrix of 591 bp char-
acters. Of the 65 variable sites, 36 were parsimony-informa-
tive and 29 were singleton variable sites (Table II). The
nucleotide frequencies were 23.84%, 47.36%, 21.12% and
7.6% for A, T, C and G respectively.
Genetic variability and differentiation
The Aligned Sequences allowed identifying 54 mtDNA hap-
lotypes among 119 individuals examined. Within the whole
dataset, the haplotype diversity (Hd) was estimated to 0.968
and the nucleotide diversity (pi) to 0.00851 (Table III). The
mean of genetic diversity was estimated to 0.9% for the
studied H. mixtum animals (Table III). The Théta (per site)
from Eta and the average number of pairwise differences
(K) are 0.02532, 4.144 respectively for overall data set
(Table III).
The recombination rate is also an important parameter af-
fecting patterns of DNA polymorphism. In H. mixtum, 8 re-
combination events were detected at whole data sequences.
Sites touched by recombination events were (99,243);
(267,285); (285,303); (324,327); (390,396); (396,417);
(438,447) and (447,477). Value of Rm per informative sites
was 0.222 for the overall data set sequences (Table III).
The nucleotide diversity was calculated for each popula-
tion of H. mixtum. The results of these analyses are summa-
rized in table IV and indicate that the Belgium and Poland
animals have the highest level of nucleotide diversity 0.00905
and 0.00768, respectively. Moreover, the Finnish animals
showed a relatively high level of nucleotide diversity
(0.00636). The other populations have an intermediate value
of nucleotide diversity. Animals from Lithuania showed a high
value of nucleotide diversity. However, this result must be
taken with caution because the sampling for this region was
very low (N = 2) (Table IV).
The genetic variability registered between the populations
of H. mixtum was low and ranged from 0.3 to 1.5% (maxi-
mum 1.5% K2P genetic diversity is observed in Lithuania an-
imals). However, these data must be interpreted with caution
because the sampling for this region was very low (N = 2).
Populations of H. mixtum from Belgium and Poland showed
a relatively high level of genetic diversity, 1% and 0.9%
respectively (Table IV). The K2P genetic distances observed
among the animals from the different regions were high (be-
tween 0.2 to 1.7% of K2P distance; Table V). Fst, G
stand N
st
parameters were estimated. Gst
was calculated based on hap-
lotype frequencies, whereas Nst
takes into account the genetic
relation among haplotypes. The level of differentiation in al-
lele frequencies between groups was measured by Fst
(Wright
1951). When Nst
value is higher than the Gst
estimated, it in-
dicates the presence of a phylogeographical structure as noted
by Petit et al. (2005). The Fst
values in the range of 0.07–0.59
were registered between the different populations of H. mix-tum.The highest value of F
st(0.59) is registered between pop-
ulations from Croatia and Sweden. Parasites from LithuaniaTab
le V
. G
enet
ic d
iver
gen
ces
(K2P
dis
tance
s) b
etw
een t
he
popula
tions
of
Hel
igm
osom
um m
ixtu
m
H. m
ixtu
mR
om
an
iaB
elgiu
mL
ith
ua
nia
Fin
lan
dS
wed
enG
erm
an
yC
roati
aA
ust
ria
Pola
nd
Hu
ngary
Rom
an
ia
Bel
giu
m0.0
10/
0.0
03
Lit
hu
an
ia0.0
12/
0.0
02
0.0
15/0
.003
Fin
lan
d0.0
08/0
.003
0.0
11/0
.003
0.0
12/0
.002
Sw
eden
0.0
08/0
.004
0.0
11/0
.005
0.0
13/0
.004
0.0
05/0
.000
Ger
man
y0.0
08/0
.003
0.0
11/0
.003
0.0
12/0
.002
0.0
09/0
.003
0.0
09/0
.005
Cro
ati
a0.0
07/0
.003
0.0
10/0
.003
0.0
10/0
.001
0.0
07/0
.003
0.0
08/0
.005
0.0
08/0
.003
Au
stri
a0.0
08/0
.003
0.0
10/0
.003
0.0
11/0
.001
0.0
08/0
.002
0.0
08/0
.004
0.0
07/0
.002
0.0
07/0
.003
Pola
nd
0.0
14/0
.007
0.0
16/0
.007
0.0
17/0
.006
0.0
13/0
.005
0.0
13/0
.007
0.0
12/0
.005
0.0
14/0
.008
0.0
13/0
.006
Hu
ngary
0.0
03/0
.000
0.0
08/0
.003
0.0
10/0
.003
0.0
06/0
.003
0.0
07/0
.005
0.0
07/0
.004
0.0
05/0
.004
0.0
06/0
.003
0.0
12/0
.008
The
two
valu
es c
orre
spon
d to
the
Pmea
n an
d P
dist
ance
s

Hela Sakka et al.92
and Poland have a low value of Fst
(0.08) suggesting a fre-
quent gene flow between these regions. However, Fst
is also
low between the Finnish animals and those from Sweden
(0.07) suggesting recent contacts between these regions
(Table VI).
The estimated Fst
(0.365) and Gst
(0.175) are low and agree
with assumption that a balancing selection activates at the cytbmtDNA. Here, the N
st (0.366) and the G
st(0.175) (P < 0.05)
suggested the presence of gene flow between the different
populations of H. mixtum as demonstrated by values of Nm
(0.43; 1.17 and 0.43 estimated on the basis of Fst, G
stand N
st
indices, respectively).
Genetic relationships based on cytochrome b
Phylogenetic trees were reconstructed using Maximum Parsi-
mony (MP), ML and neighbor-joining (NJ) methods. Parsimony
analysis showed a low homoplasy. Indeed, the consistency
index (CI), the retention index (RI) and the homplasy index (HI)
were 0.7364, of 0.7434 and 0.2566, respectively. The Maximum
Fig. 2. Most likely tree of the PHYML reconstruction for the 54 mt DNA haplotypes of Heligmosomum mixtum and the two Heligmosomoidespolygyrus outgroups. Numbers on branches indicate, from left to right (a) bootstrap support in the PHYML analysis, (b) bootstrap supportobtained in the NJ reconstruction

Phylogeographic structure of the nematode parasite Heligmosomum mixtum 93
Likelihood (ML) tree is illustrated in Fig. 2. This tree shows a
huge polytomy among the studied animals and suggests the ex-
istence of a great genetic homogeneity within this dataset. The
topology of ML tree is made independently of the geographic
origin of parasites. Indeed, the NJ tree showed similar topology
than obtained by ML. The bootstrap values of this last analysis
were added to the ML tree (Fig. 2).
Demographic analysis
We employed different statistical methods to determine if the
patterns of diversity observed in H. mixtum species in the cy-tochrome b of mtDNA deviated significantly from an equilib-
rium neutral model. Selective neutrality tests show that
Tajima’s as well and Fu and Li’s tests were negative and sig-
nificant for the animals studied (Table III). The observed vari-
ation patterns provide evidence that H. mixtum have been
undergoing rapid expansion. The Fu’s Fs statistic results
demonstrate that the genetic effect of hitchhiking was ruled
out by Fu’s test. The calculated values were highly negative
and significant (Fu’s Fs = –52.426; P = 0.000 for the all data
set sequences) (Table III and Fig. 3a). This result confirms a
signal of population expansion of H. mixtum and positive se-
lection without a hitchhiking effect (negative D-value) as de-
scribed by Eswaran et al. (2005). This was also supported by
significant values of Fu and Li’s statistical tests (F*:–3.30214;
**P<0.02; D*: –3.35691; **P<0.02) for all data set sequences.
A signature of population growth (unimodal pattern) was also
clearly evident in the distribution of pairwise nucleotide dis-
tribution within the total animals (n = 119) (Fig. 3b). These
results are corroborated by Harpending’s raggedness index
and Ramos-Onsins statistic (r = 0.08921, R2 = 0.16021) in
H. mixtum cytb DNA sequences.
Haplotype distribution
To improve the genealogical relationships assessment between
haplotypes in H. mixtum, a minimum spanning network was
Table VI. Genetic differentiation (Fst
values) between the studied populations of Heligmosomum mixtum
H. mixtum Belgium Romania Lithuania Austria Poland Croatia Germany Sweden Finland
Belgium
Romania 0.27956
Lituania 0.16898 0.18981
Austria 0.25613 0.39139 0.11111
Poland 0.42483 0.50611 0.33049 0.47913
Croatia 0.31074 0.44707 0.08442 0.40783 0.55694
Germany 0.28303 0.41351 0.19741 0.28790 0.43574 0.45320
Sweden 0.41209 0.52410 0.30376 0.52823 0.53416 0.59753 0.55248
Finland 0.26256 0.34902 0.13418 0.32218 0.42130 0.39158 0.36957 0.07121
Fig. 3. Site frequency spectra and mismatch distribution of the cytochrome b sequences of H. mixtum based on pairwise nucleotide differ-ences in the overall data set sequences. (a) Solid lines in the site-frequency spectra indicate the expected distributions under neutrality and at equilibrium. Fu’s Fs statistics and corresponding P- values are given; (b) Solid lines in the curves indicate the expected distribution underexpansion and dotted lines indicate the observed distribution under population expansion. The ranggedness and Ramos-Onsins and Rozas statistics, corresponding r and R2 statistic values are given.
Hela Sakka et al.94
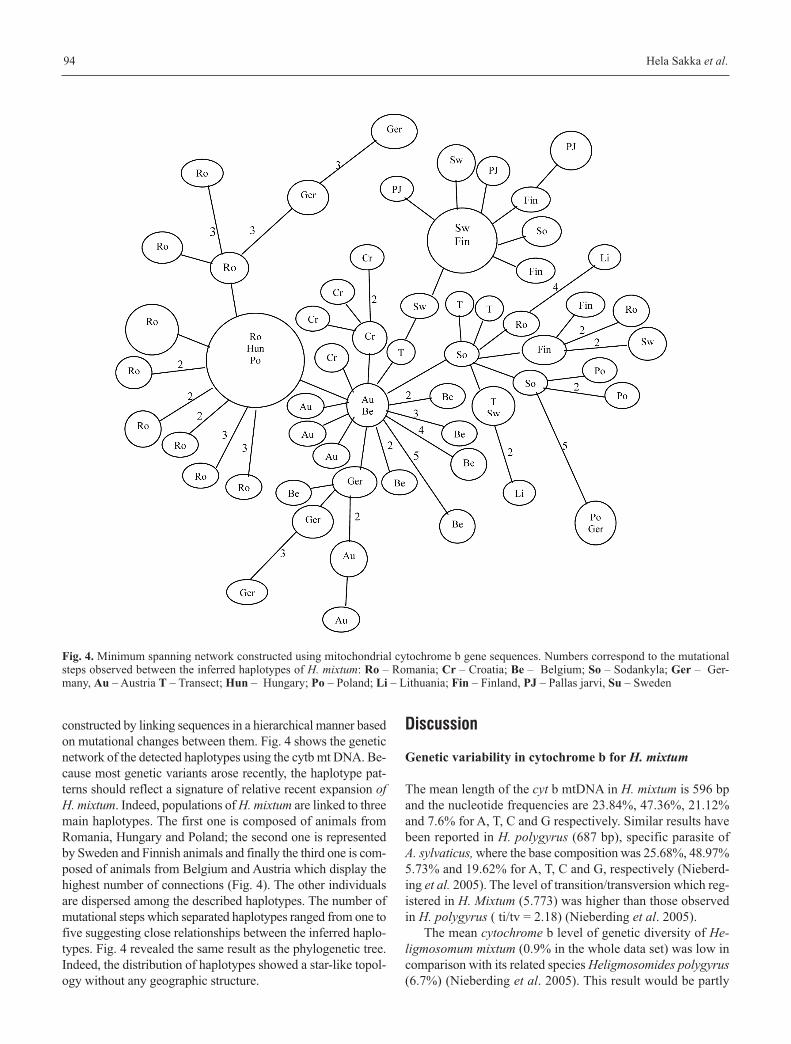
constructed by linking sequences in a hierarchical manner based
on mutational changes between them. Fig. 4 shows the genetic
network of the detected haplotypes using the cytb mt DNA. Be-
cause most genetic variants arose recently, the haplotype pat-
terns should reflect a signature of relative recent expansion of H. mixtum. Indeed, populations of H. mixtum are linked to three
main haplotypes. The first one is composed of animals from
Romania, Hungary and Poland; the second one is represented
by Sweden and Finnish animals and finally the third one is com-
posed of animals from Belgium and Austria which display the
highest number of connections (Fig. 4). The other individuals
are dispersed among the described haplotypes. The number of
mutational steps which separated haplotypes ranged from one to
five suggesting close relationships between the inferred haplo-
types. Fig. 4 revealed the same result as the phylogenetic tree.
Indeed, the distribution of haplotypes showed a star-like topol-
ogy without any geographic structure.
Discussion
Genetic variability in cytochrome b for H. mixtum
The mean length of the cyt b mtDNA in H. mixtum is 596 bp
and the nucleotide frequencies are 23.84%, 47.36%, 21.12%
and 7.6% for A, T, C and G respectively. Similar results have
been reported in H. polygyrus (687 bp), specific parasite of
A. sylvaticus, where the base composition was 25.68%, 48.97%
5.73% and 19.62% for A, T, C and G, respectively (Nieberd-
ing et al. 2005). The level of transition/transversion which reg-
istered in H. Mixtum (5.773) was higher than those observed
in H. polygyrus ( ti/tv = 2.18) (Nieberding et al. 2005).
The mean cytochrome b level of genetic diversity of He-ligmosomum mixtum (0.9% in the whole data set) was low in
comparison with its related species Heligmosomides polygyrus(6.7%) (Nieberding et al. 2005). This result would be partly
Fig. 4. Minimum spanning network constructed using mitochondrial cytochrome b gene sequences. Numbers correspond to the mutationalsteps observed between the inferred haplotypes of H. mixtum: Ro – Romania; Cr – Croatia; Be – Belgium; So – Sodankyla; Ger – Ger-many, Au – Austria T – Transect; Hun – Hungary; Po – Poland; Li – Lithuania; Fin – Finland, PJ – Pallas jarvi, Su – Sweden

Phylogeographic structure of the nematode parasite Heligmosomum mixtum 95
explained by abundance and prevalence of H. polygyrus on
A. sylvaticus which is quite high, involving a rapid accumula-
tion of mutations and ensuring the parasite genetic diversity
(Nieberding et al. 2005). The level of genetic diversity ob-
served in H. mixtum also appears very low as compared to
other invertebrate taxa like the cestode Paranoplocephala arc-tica paraziting collared lemmings (4.5%) (Wickström et al.2003) and other species like the snails Biomphalaria glabrata(5.9%); the insects (e.g. Maoricicada campbelli (2%); Pel-toperla tarteri (4%); Tarphius canariensis (5.8%)) (Emerson
et al. 2000; Buckley et al. 2001; Trewick and Wallis 2001;
Mavarez et al. 2002; Schulthesis et al. 2002). The nucleotide
and haplotype diversities observed in H. mixtum appear also
very low as compared to the values observed in other parasite
or invertebrate species. Such results could be explained by
three scenarios:
– (1) A historical one: the parasite may have undergone
frequent bottlenecks during the quaternary glaciations which
may have induced a reduction of the genetic diversity of this
parasite.
– (2) The eradication of the diversity within populations of the
parasite may also be related to its biology and the reproduc-
tive cycle. Indeed, cold conditions may affect the living
cycle of H. mixtum and the development of the free-living
larval stages to infective L3s is almost certainly slowed and
or suspended during cold winter (Haukisalmi et al. 1988).
– (3) The low genetic variation in H. mixtum is explained by
the fact that H. mixtum is a host generalist. It seems that host
specialist parasites have more genetic structure.
Lack of phylogeographic structure in H. mixtum
The different phylogenetic trees constructed with the inferred
haplotypes evidenced a great genetic homogeneity among the
studied H. mixtum (Fig. 2) as compared to the complex phy-
logeographic structure of its main host, the bank vole
(M. glareolus) (see Deffontaine et al. 2005, 2009). This strong
incongruence between the host and parasite phylogeographic
patterns could be explained by the ability of H. mixtum to
switch on different other host species like the fieldmouse
Apodemus flavicollis, the vole Microtus arvalis and Microtussocialis and even the gerbill Meriones persicus (Mezeika et al.2003; Grikieniennë 2005; Kia et al. 2010). Indeed, the high
vagility of H. mixtum and its host generalist behavior proba-
bly influenced its degree of genetic differentiation and its phy-
logeographic structure. Switching on different host species,
its dispersal habits could be totally different as compared to
those of its main host, M. glareolus. This would have facili-
tated a genetic homogenisation of its populations throughout
all Europe, which lead to the present weak phylogeographic
structure. Similar data have been found since unstructured ge-
netic variability have been registered using other molecular
markers (Dybdahl and Lively 1996; Nieberding et al. 2008).
This host switching hypothesis was also proposed to ex-
plain some incongruences between the phylogeographic struc-
ture of H. polygyrus and A. sylvaticus (Nieberding et al. 2008).
Indeed, this parasite species can also switch sometimes on
other Apodemus species (eg A. flavicollis, A. uralensis, etc.).This probably led to particular phylogeographic patterns
observed in some regions for the parasite, as compared to the
one of its host (Nieberding et al. 2008).
The same signal of a weak geographic structure was also
observed on the cestode Paranoplocephala artica. For this lat-
ter species, an indeterminate intermediate host might be
responsible of such pattern (Wickström et al. 2003). Another
example concerns the snail Potamopyrgus antipodarum,
which forms a collection of highly structured populations;
whereas its trematode parasite Microphallus exhibits weak
population structure because of the dispersal abilities of its
final bird host species (Dybdahl and Lively 1996).
Our results and these last examples tend to confirm that
the phylogeographic congruence between parasites and their
host should be rather rare and that this phenomenon would be
only observed when there is a high specificity between the
parasite and its host (e.g. Nadler and Hafner 1990; Mulvey
et al. 1991; Parker and Spoerke 1998).
In contrast, when some particular conditions exist, like a (i)
strong host–parasite specificity, (ii) a direct cycle of the para-
site, (iii) a short survival time of larvae during the free stage,
and (iv) a limited dispersal abilities of the parasites on their
own, consequently the genetic structure of the parasite could
be higher. This was particularly illustrated on the nematode
Heligmosomoides polygyrus (Heligmosomoidea) which was
more strongly structured than its host (Apodemus sylvaticus).
This result suggests lower rates of gene flow, the parasite play-
ing the role of a biological “evolutionary print” (Nieberding
et al. 2004, 2005).
Population expansion
Population size changes give particular footprints that may
eventually be detected in DNA sequence data (Tajima 1989;
Slatkin and Hudson 1991; Rogers and Harpending 1992). The
haplotypic relationships portrayed in the network (Fig. 4)
showed clear the structuring independently of geographical
origin, and the presence of a star-like topology, which suggest
a recent population expansion of H. mixtum. Further expan-
sion was provided by the smooth mismatch distributions of
mtDNA haplotypes observed in the whole sampled animals.
Simulations based on coalescent process provided statistical
support for the smoothness of the observed distributions (as
quantified by the raggedness indices). At demographic equi-
librium, mismatch distribution is usually multi-modal, but uni-
modal in a population having passed through a recent
demographic expansion (Slatkin and Hudson 1991; Rogers
and Harpending 1992). Although, the mismatch distribution
of H. mixtum is unimodal for the overall dataset suggesting
that the parasite has undergone rapid population expansion.
This result is corroborated by Fu’s Fs statistic (Fu’s Fs =
–52.426; P = 0.000 for the all data set sequences) which con-

Hela Sakka et al.96
firmed these inferences about the population dynamics of H.mixtum. Moreover, negative and significant Fs statistical val-
ues in the total sample gave strong evidence of past population
expansion and the positive selection undergone the cytb of mt
DNA (F*:–3.30214; **P<0.02; D*:–3.35691; **P<0.02) for
all data set sequences.
Although it is difficult to date accurately the expansion time
from mtDNA data, we may suggest that the recent expansion in
H. mixtum population reported here could be facilitated by the
Pleistocene or glaciation’s overflow. Phylogeography studies
on many mammals and plants have revealed that their genetic
structure were influenced by geological and climatic events of
Pleistocene, which result in population isolation or extinction,
and subsequent expansion of the surviving types when envi-
ronmental conditions became favourable. Pleistocene violent
climatic cycles were occurring and geological evidence sug-
gested considerable geological activity occurred in middle
Pleistocene, affecting climate and hydrology of this region
(Cordy 1991). Indeed, the expansion signal in H. mixtum pop-
ulations would be associated to past bottlenecks associated to
the last glacial maximum, which would have been followed by
rapid population expansions at the beginning of the present in-
terglacial period. The host generalist behavior of H. mixtum,
would have favoured its postglacial recolonisation, switching
from one rodent species to another and leading to its particular
genetic patterns: weak phylogeographic structure, low level of
genetic diversity and a rapid population expansion signal.
Conclusion
This study represents the first attempt to use DNA sequence
data in a study of intraspecific relationships in H. mixtum. This
study has shown that intraspecific variations occur in the mt
DNA of H. mixtum parasites which indicates that there has
been a recent and rapid expansion in their evolutionary history.
According to Price (1980), parasites populations will tend to be
more strongly structured than their hosts suggesting lower rates
of gene flow (Burban and Petit 2003; Galbreath et al. 2012)
and in a few cases host and parasites showed similar degrees of
population structure (Nieberding et al. 2005). Our results
showed that H. mixtum is less structured than its main host M.glareolus. Indeed, this nematode is not specific to one host
species and can authorize host switching events between other
syntopic species (Nieberding et al. 2008). The cytoplasmic di-
versity seems to be unstructured with any biogeographic repar-
tition of the variability. The general conclusion emerging from
the present study is that the genetic structure of H. mixtum is
probably associated to weak host specificity.
Acknowledgements. This work was supported by grants from theIslamic Development Bank (Référence: FN : 24/TUN-05/PD26) andfrom the Tunisian ‘Ministère de l’Enseignement Supérieur et de laRecherche Scientifique et de la Technologie ’ (Projet LabB02). Thisarticle is dedicated to the late Professor Mohamed Marrakchi died 2April 2008 for his help and fruitful advises.
References
Asakawa M. 1987. Genus Heligmosomoides Hall, 1916 (Heligmoso-moidae: Nematoda) from the Japanese wood mice, Apodemusspp. III. The life-cycle of Heligmosomoides kurilensis koba-yashii (Nadtochii, 1966) in ICR mice and preliminary experi-mental infection to jirds. Journal of the College of Dairying,12, 131–140
Avise J.C. 2000. Phylogeography. The History and Formation ofSpecies. Harvard University Press, Cambridge, MA
Ballard J.W.O., Whitlock M.C. 2004. The incomplete natural historyof mitochondria. Molecular Ecology, 13, 729–744. DOI: 10.1046/j.1365-294X.2003.02063.x
Barrett L.G., Thrall P.H., Burdon J.J., Linde C.C. 2008. Life historydetermines genetic structure and evolutionary potential ofhost–parasite interactions. Trends in Ecology and Evolution,23, 678–685. DOI: 10.1016/j.tree.2008.06.017
Bauchau V., Chaline J. 1987. Variabilité de la troisième molaire in-férieure de Clethrionomys glareolus (Arvicolidae, Rodentia)et sa signification évolutive. Mammalia, 51, 587–598
Biek R., Drummond A.J., Poss M. 2006. A virus reveals populationstructure and recent demographic history of its carnivore host.Science, 311, 538–541. DOI: 10.1126/science.1121360
Buckley T.R., Simon C., Chambers G.K. 2001. Phylogeography ofthe New Zealand cicada Maoricicada campbelli based on mi-tochondrial DNA sequences: ancient clades associated withCenozoic environmental change. Evolution, 55, 1395–1407.DOI: 10.1111/j.0014-3820.2001.tb00661.x
Burban C., Petit R.J., 2003. Phylogeography of maritime pine in-ferred with organelle markers having contrasted inheritance.Molecular Ecology, 12, 1487–1495. DOI: 10.1046/j.1365-294X.2003.01817.x
Cordy J.M. 1991. Paleoecology of the late glacial and early post-glacial of Belgium and neighbouring areas. In: The late glacial in Northwest Europe: human Adaptation and envi-ronmental Change at the End of the Pleistocene (eds BartonN, Robers AJ, Roe DA), pp.40–47. Council for British Ar-chaeology, London
Criscione C.D., Poulin R., Blouin M.S. 2005. Molecular ecology ofparasites: elucidating ecological and microevolutionaryprocesses. Molecular Ecology, 14, 2247–2257. DOI: 10.1111/j.1365-294X.2005.02587.x
Deffontaine V., Libois R., Kotlík P., Sommer R., Nieberding C., Par-adis E., Searle J.B., Michaux J.R. 2005. Beyond the Mediter-ranean peninsulas: evidence of central European glacialrefugia for a temperate forest mammal species, the bank vole(Clethrionomys glareolus). Molecular Ecology, 14, 1727–1739. DOI: 10.1111/j.1365-294X.2005.02506.x
Deffonatine V., Ledevin R., Fontaine M.C., Quéré J-P., Renaud S., Li-bois R., Michaux J.R. 2009. A relict bank vole lineage high-lights the biogeographic history of the Pyrenean region inEurope. Molecular Ecology, 18, 2489–2502. DOI: 10.1111/j.1365-294X.2009.04162.x
Dybdahl M.F., Lively C.M. 1996. The geography of co-evolution:comparative population structures for a snail and its nema-tode parasite. Evolution, 50, 2264–2275
Emerson B.C., Oromi P., Hewitt G.M. 2000. Tracking colonizationand diversification of insect lineages on islands: mitochondr-ial DNA phylogeography of Tarphius canariensis Coleoptera:Colydidae) on the Canary Islands. Proceedings of the RoyalSociety of London. Series B, Biological Sciences, 267, 2199–2205
Eswaran V., Harpending H., Roger A.R. 2005. Genomics refutesand exclusively African origin of humans. Journal ofHuman Evolution, 49, 1–18. DOI: 10.1016/j.jhevol.2005.02.006

Phylogeographic structure of the nematode parasite Heligmosomum mixtum 97
Ewens W.J. 1972. The sampling theory of selective neutral alleles.Theoretical Population Biology, 3, 87–112. DOI: 10.1016/0040-5809(72)90035-4
Excoffier L., Laval G., Schneider S. 2005. Arlequin (version 3.0):an integrated software package for population genetics dataanalysis. Evolutionary bioinformatics, 1, 47–50
Fu Y.X., Li W.H. 1993. Statistical tests of neutrality of mutations.Genetics, 133, 693–709
Galbreath K.E., Eric P., Hoberg E.P. 2012. Return to Beringia: para-sites reveal cryptic biogeographic history of North Americanpikas. Proceedings of the Royal Society B, 279, 371–378.DOI: 10.1098/rspb.2011.0482
Goüy de Bellocq J., Ferté H., Depaquit J., Justine J.L., Tillier A.,Durette-Desset M.C. 2001. Phylogeny of the Trichostrongylina(Nematoda) inferred from 28S rDNA sequences. MolecularPhylogenetics and Evolution, 19, 430–442. DOI: 10.1006/mpev.2001.0925
Goüy de Bellocq J., Morand S., Feliu C. 2002. Patterns of parasitespecies richness of western Paleartic micro-mammals: islandeffects. Ecography, 25, 173–183
Goüy de Bellocq J., Sara M., Casanova J.C., Feliu C., Morand S. 2003.A comparaison of the strcuture of helminth communities in thewoodmouse, Apodemus sylvaticus, on islands of the Westernmediterranean and continental Europe. Parasitology Research,90, 64–70. DOI: 10.1007/s00436-002-0806-1
Grikieniennë J. 2005. Investigations into endoparasites of smallmammals in the environs of Lake Drûkdiai. Acta ZoologicaLituanica, 15, 109–114
Guindon S., Gascuel O. 2003. A simple, fast, and accurate algorithm toestimate large phylogenies by maximum likelihood. SystematicBiology, 52, 696–704. DOI: 10.1080/10635150390235520
Hall T.A. 1999. BioEdit: a user-friendly biological sequence align-ment editor and analysis program for Windows 95/98/ NT.Nucleic Acids Symposium Series, 41, 95–98
Harpending H.C. 1994. Signature of ancient population growth in alow-resolution mitochondrial DNA mismatch distribution.Human Biology 66, 591–600
Haukisalmi V., Henttonen H., Tenora F. 1988. Population dynamicsof common and rare helminths in cyclic vole populations.Journal of Animal Ecology, 57, 807–825
Haukisalmi V., Henttonen H. 1993. Populations dynamics of taeniapolyacantha metacestodes in the bank vole Clethrionomysglareolus. Annales Zoologici Fennici, 30, 81–84
Haukisalmi V., Henttonen H., Vikman P. 1996. Variability of sexratio, mating probability and egge production in an intestinalnematode in its fluctuating host population InternationalJournal for Parasitology, 26, 755–764. DOI: 10.1016/0020-7519(96)00058-6
Hudson R.R., Salatkin M., Maddison W.P. 1992. Estimation of levelsof gene flow from DNA sequence data. Genetics, 132, 583–590
Jones P.H., Britten H.B. 2010. The absence of concordant population ge-netic structure in the black-tailed prairie dog and the flea, Orop-sylla hirsuta, with implications for the spread of Yersinia pestis.Molecular Ecology, 19, 2038–2049. DOI: 10.1111/j.1365-294X.2010.04634.x
Jukes T.H., Cantor C.R. 1969. Evolution of protein molecules. In:Munroled, H.N. (Ed.), Mammalian Protein Metabolism.Academy Press, New York, pp. 31–132
Kia E.B., Shahryary-Rad E., Mohebali M., Mahmoudi M., Mobedi I.,Zahabiun F., Zarei Z., Miahipoor A., Mowlavi Gh., AkhavanA.A., Vatandoost’ H. 2010. Endoparasites of Rodents andTheir Zoonotic Importance in Germi, Dashte–Mogan, ArdabilProvince, Iran. Iranian Journal of Parasitology, 5, 15–20
Koressaar T., Remm M. 2007. Enhancements and modifications ofprimer design program Primer3 . Bioinformatics, 23, 1289–1291. DOI: 10.1093/bioinformatics/btm091
Lessa E.P., Cook J.A., Patton J.L. 2003. Genetic footprints of demo-graphic expansion in North America, but not Amazonia, dur-ing the Late Quaternary. Proceedings of the NationalAcademy of Sciences of the United States of America, 100,10331–10334. DOI: 10.1073/pnas.1730921100
Librado P., Rozas J. 2009. DnaSP v5: a software for comprehensiveanalysis of DNA polymorphism data. Bioinformatics, 25,1451–1452. DOI: 10.1093/bioinformatics/btp187
Lynch M., Crease T. 1990. The analysis of population survey data onDNA sequence variation. Molecular Biology and Evolution ,7, 377–394
Mavarez J., Pointier J-P., David P., Delay B., Jarne P. 2002. Geneticdifferentiation, dispersal and mating system in the schisto-some-transmitting freshwater snail Biomphalaria glabrata.Heredity, 89, 258–265. DOI: 10.1038/sj.hdy.6800127
Mazeika V., Paulauskas A., Balciauskas L. 2003. New data on thehelminth fauna of rodents of Lithuania. Acta Zoologica Litu-anica, 13, 41–47. DOI: 10.1080/13921657.2003.10512542
McCoy K., Boulinier T., Tirard C., Michalakis Y. 2003. Host-depen-dent genetic structure of parasite populations: differential dis-persal of seabird tick host races. Evolution, 57, 288–296.DOI: 10.1111/j.0014-3820.2003.tb00263.x
McCoy K., Boulinier T., Tirard C. 2005. Comparative host–parasitepopulation structures: disantangling prospecting and dispersalin the black-legged kittiwake Rissae tridactyla. Molecular Ecol-ogy, 14, 2825–2838. DOI: 10.1111/j.1365-294X.2005.02631.x
Mulvey M., Aho J.M., Lydeard C. 1991. Comparative population ge-netic structure of a parasite (Fascioloides magna) and its defin-itive host. Evolution, 45, 1628–1640. DOI: 10.2307/2409784
Nadler S.A., Hafner M.S. 1990. Genetic differentiation among chew-ing louse populations (Mallaphaga: Trichodectidae) in apocket gopher contact zone (Rodentia: Geomyidae). Evolu-tion, 44, 942–951
Nieberding C., Morand S., Libois R., Michaux J.R. 2004. A parasitereveals cryptic phylogeographic history of its host. Proceed-ings of the Royal Society of London. Series B, 271, 2559–2568. DOI: 10.1098/rspb.2004.2930
Nieberding C., Libois R., Douady S., Morand S., Michaux J.R. 2005.Phylogeography of a nematode (Heligmosomoides polygyrus)in the western Palearctic region: persistence of northern cryp-tic populations during ice ages? Molecular Ecology, 14, 765–779. DOI: 10.1111/j.1365-294X.2005.02440.x
Nieberding C.M., Olivieri I. 2007. Parasites: proxies for host ge-nealogy and ecology? Trends in Ecology and Evolution, 22,156–165. DOI: 10.1016/j.tree.2006.11.012
Nieberding C., Durette-Desset M.C., Vanderpoorten A., CasanovaJ.C., Ribas A., Deffontaine V., Feliu C., Morand S., Libois R.,Michaux J.R. 2008. Geography and host biogeography mat-ter for understanding the phylogeography of a parasite. Mo-lecular Phylogenetics and Evolution, 47, 538–554.DOI:10.1016/j.ympev.2008.01.028
Nei M. 1973. Analysis of gene diversity in subdivided populations.Proceedings of the National Academy of Sciences of theUnited States of America, 70, 3321–3323
Nei M., Tajima F. 1983. Maximum likelihood estimation of the num-ber of nucleotide substitutions from restriction sites data. Ge-netics 105, 207–217
N’Zobadila G. 1994. Biologie d’Heligmosomoides polygyrus poly-gyrus (Dujardin, 1845) (Nematoda-Trichostrongylina). Com-paraison avec les espèces proches et sa sous spéciationaméricaine. Thèse de Doctorat. Muséum National d’HistoireNaturelle, pp. 183
Petit R.J., Duminil J., Fineshi S., Hampe A., Salvini D., Vendramin G.V.2005. Comparative organization of chloroplast, mitochondrialand nuclear diversity in plant populations. Molecular Ecology,14, 689–701. DOI: 10.1111/j.1365-294X.2004.02410.x

Hela Sakka et al.98
Parker M.A., Spoerke J.M. 1998. Geographic structure of lineage associations in a plant-bacterial mutualism. Journal of Evo-lutionary Biology, 11, 549–562. DOI: 10.1046/j.1420-9101.1998.11050549.x
Posada D., Crandall K.A. 1998. Modeltest: testing the model of DNAsubstitution. Bioinformatics, 14, 817–818. DOI: 10.1093/bioin-formatics/14.9.817
Price P.W. 1980. Evolutionary Biology of Parasites. Princeton Uni-versity Press, Princeton, New Jersey, USA
Ramos-Onsins S.E., Rozas J. 2002. Statistical properties of new neu-trality tests against population growth. Molecular Biology andEvolution, 19, 2092–2100
Rogers A.R., Harpending H. 1992. Population growth makes wavesin the distribution of pairwise genetic differences. MolecularBiology and Evolution, 9, 552–569
Saitou N., Nei M. 1987. The neighbor-joining method: a new methodfor reconstructing phylogenetic trees. Molecular Biology andEvolution, 4, 406–425
Schulthesis A.S., Weigt L.A., Hendricks A.C. 2002. Gene flow, dispersal, and nested clade analysis among populations of the stonefly Peltoperla tarteri in the southern Appalachians.Molecular Ecology, 11, 317–327. DOI: 10.1046/j.1365-294X.2002.01445.x
Slatkin M., Hudson R.R. 1991. Pairwise comparaisons of mitochon-drial DNA sequences in stable and exponentially growingpopulations. Genetics, 12, 555–562
Spitzenberger F. 1999. Clethrionomys glareolus. In: The Atlas of Eu-ropean Mammals (eds Mitchell-Jones AJ, Amori G, Bog-danowicz. W et al.), Academic Press, London. pp. 212–213
Tajima F. 1989. Statistical method for testing the neutral mutationhypothesis by DNA polymorphism. Genetics, 123, 585–595
Received: July 14, 2014Revised: August 29, 2014Accepted for publication: September 9, 2014
Tamura K., Nei M., Kumar S. 2004. Prospects for inferring very largephylogenies by using the neighbor-joining method. Proceed-ings of the National Academy of Sciences of the United Statesof America, 101, 11030–11035
Tamura K., Peterson D., Peterson N., Stecher G., Nei M., Kumar S.2011. MEGA5: Molecular Evolutionary Genetics Analysisusing Maximum Likelihood, Evolutionary Distance, andMaximum Parsimony Methods. Molecular Biology and Evo-lution, 28, 2731–2739. DOI: 10.1093/molbev/msr121
Trewick S.A., Wallis G.P. 2001. Bridging the ‘beech-gap’: NewZealand invertebrate phylogeography implictes Pleistocenglaciation and Pliocene isolation. Evolution, 55, 2170–2180
Wickström L.M., Haukisalmi V., Varis S., Hantula J., Fedorov V.B.,Henttonen H. 2003. Phylogeography of the circumpolar Para-noplocephala arctica species complex (Cestoda: Anoplo-cephalidae) parasitizing collared lemmings (Dicrostonyxspp.). Molecular Ecology, 12, 3259–3371. DOI: 10.1046/j.1365-294X.2003.01985.x
Whiteman N.K., Kimball R.T., Parker P.G. 2007. Co-phylogeographyand comparative population genetics of the threatened Galá-pagos hawk and three ectoparasite species: ecology shapespopulation histories within parasite communities. MolecularEcology, 16, 4759–4773. DOI: 10.1111/j.1365-294X.2007.03512.x
Wright S. 1951. The genetical structure of populations. Ann. Eugen.,15, 323–354
Zhigileva O.N. 2011.Correlation between Biodiversity Indices ofSmall Mammals and Their Helminths in West SiberianEcosystems. Contemporary Problems of Ecology, 4, 416–422