circabc.europa.eu acti… · web viewcircabc.europa.eu
TRANSCRIPT
EUROPEAN COMMISSION
DIRECTORATE-GENERAL CLIMATE ACTIONDirectorate C – Mainstreamin Adaptation on Low Carbon TechnologyCLIMA.C.2 – Transport and Ozone
JOINT RESEARCH CENTREInstitute for Energy and Transport (Ispra)JRC.F.8 - Sustainable Transport Unit
Technical Guidelinesfor the preparation of applications for the approval of innovative
technologies pursuant to Regulation (EC) No 443/2009 and Regulation (EU) No 510/2011
DRAFT
Revision: April 2015
Commission européenne/Europese Commissie, 1049 Bruxelles/Brussels, BELGIQUE/BELGIË – Tel. +32 22991111Contact: [email protected]
Contents
1. INTRODUCTION.......................................................................................................6
1.1. Objective............................................................................................................61.2. Legal background...............................................................................................6
1.2.1. Regulation (EC) No 443/2009 and Regulation (EU) No 510/2011.....61.2.2. Commission Regulation (EU) No 725/2011 – eco-innovations for
passenger cars......................................................................................71.2.3. Commission Regulation (EU) No 427/2014 – eco-innovations for light
commercial vehicles.............................................................................71.3. Experiences and new developments..................................................................7
1.3.1. Eco-innovations for light commercial vehicles (N1)...........................71.3.2. Short applications and short assessment with regard to technologies
that have already been approved by the Commission..........................7
2. PROCEDURE..............................................................................................................8
2.1. Discussing candidate applications.....................................................................82.2. Application procedure........................................................................................8
2.2.1. Full assessment....................................................................................82.2.2. Short assessment................................................................................10
2.3. Procedure for assessing the applications for eco-innovations.........................112.4. The recording of the eco-innovation savings in the certificate of conformity.122.5. The monitoring of the implementation of eco-innovations.............................122.6. Information......................................................................................................12
3. DEMONSTRATION OF CO2 SAVINGS.................................................................13
3.1. Testing methodology.......................................................................................133.1.1. European driving patterns..................................................................13
3.2. Calculation procedure......................................................................................14
4. ELIGIBILITY CRITERIA.........................................................................................16
4.1. Integrated approach measures..........................................................................164.2. Innovativeness..................................................................................................164.3. Necessity (non-comfort)..................................................................................184.4. Verifiability (minimum threshold)...................................................................18
4.4.1. Statistical significance.......................................................................184.4.2. Technology package..........................................................................19
4.5. Coverage (type approval procedure)................................................................194.6. Accountability (influence of driver)................................................................19
5. CLASSES OF POTENTIAL ECO-INNOVATION TECHNOLOGIES..................21
5.1. Improved electrical components......................................................................215.2. Improved mechanical components..................................................................215.3. Use of ambient energy sources........................................................................215.4. Heat energy storing systems............................................................................21
5.5. Kinetic energy storing systems........................................................................215.6. Heat energy – to – electricity converters.........................................................225.7. Kinetic energy – to – electricity converters.....................................................225.8. Measures lowering engine speed.....................................................................225.9. Active aerodynamics........................................................................................22
6. TESTING METHODOLOGIES................................................................................23
6.1. Simplified approach.........................................................................................246.2. Comprehensive methodology..........................................................................246.3. Data quality and uncertainties..........................................................................25
6.3.1. Statistical error of the mean...............................................................256.3.2. Propagation of the error.....................................................................266.3.3. Number of test....................................................................................26
6.4. Deterioration....................................................................................................306.5. Interactions.......................................................................................................316.6. Verification report............................................................................................31
6.6.1. Simplified approach:..........................................................................316.6.2. Comprehensive methodology:...........................................................31
6.7. Summary of the application.............................................................................31
7. DATA SETS FOR TESTING METHODOLOGIES................................................32
7.1. Efficiencies......................................................................................................327.1.1. Efficiency of engine...........................................................................327.1.2. Efficiency of alternator......................................................................327.1.3. Electrical solar system efficiency......................................................33
7.2. Driving cycle characteristics............................................................................337.3. Fuel characteristics...........................................................................................33
7.3.1. Fuel densities.....................................................................................337.3.2. Conversion fuel consumption – CO2 emission..................................34
7.4. Usage factors....................................................................................................347.4.1. M1 Vehicle lighting...........................................................................347.4.2. Shading of solar panels......................................................................357.4.3. Windscreen wipers.............................................................................35
7.5. Power requirements of lighting types..............................................................357.5.1. Halogen tungsten...............................................................................357.5.2. Xenon gas discharge..........................................................................36
7.6. Emissions due to extra weight.........................................................................367.7. Total electric power requirements...................................................................367.8. Solar radiation..................................................................................................36
7.8.1. Solar radiation in Europe...................................................................367.8.2. Solar correction coefficient................................................................37
7.9. Ambient temperature.......................................................................................377.10. Parking time distribution..................................................................................38
4
7.11. Mileages...........................................................................................................387.12. Road roughness................................................................................................387.13. Stiffness of one tire..........................................................................................39
8. QUALIFICATION OF TECHNOLOGIES...............................................................40
8.1. Potentially qualifying technologies..................................................................408.2. Potentially non-qualifying technologies..........................................................40
9. EXAMPLES..............................................................................................................41
9.1. Class 1 – Improved electrical components......................................................419.1.1. Efficient wiper motor.........................................................................419.1.2. LED exterior lighting.........................................................................45
9.2. Class 3 – Use of ambient energy sources.........................................................529.2.1. Battery charging solar roof................................................................52
9.3. Class 4 – Energy storing systems.....................................................................589.3.1. Engine heat storage............................................................................58
9.4. Class 5 – Kinetic energy of the vehicle...........................................................659.4.1. Predictive energy management..........................................................65
9.5. Class 7 – Kinetic energy – to – electricity converters.....................................719.5.1. Efficient alternator.............................................................................71
APPENDIX I – TEMPLATE FOR A FULL APPLICATION..........................................78
APPENDIX II – TEMPLATE FOR THE SUMMARY DESCRIPTION OF THE FULL APPLICATION.........................................................................................................80
APPENDIX III – TEMPLATE FOR SHORT APPLICATION........................................81
APPENDIX IV – TEMPLATE FOR THE SUMMARY DESCRIPTION OF THE SHORT APPLICATION.........................................................................................................82
ANNEX I – DATA SOURCES OF CHAPTER 7.............................................................83
1. EFFICIENCIES.........................................................................................................83
Efficiency of engine.........................................................................................83Efficiency of alternator....................................................................................83Electrical solar system efficiency....................................................................83
2. DRIVING CYCLE CHARACTERISTICS...............................................................83
3. FUEL CHARACTERISTICS....................................................................................84
Fuel densities...................................................................................................84Conversion fuel consumption - CO2 emission.................................................84
4. USAGE FACTORS...................................................................................................84
Vehicle lighting................................................................................................84Shading of solar panels....................................................................................84Windscreen wipers...........................................................................................84
5. POWER REQUIREMENTS OF LIGHTING TYPES..............................................84
Halogen tungsten.............................................................................................84
5
Xenon gas discharge........................................................................................85Total electric power requirements...................................................................85
6. EMISSIONS DUE TO EXTRA WEIGHT................................................................85
7. SOLAR RADIATION...............................................................................................85
Solar radiation in Europe.................................................................................85Solar correction coefficient..............................................................................85
8. AMBIENT TEMPERATURE...................................................................................85
9. ENGINE STARTING TEMPERATURE..................................................................86
10. PARKING TIME DISTRIBUTION..........................................................................86
11. MILEAGES...............................................................................................................86
12. ROAD ROUGHNESS...............................................................................................87
13. STIFFNESS OF ONE TIRE......................................................................................87
6

1. INTRODUCTION
1.1. Objective
These guidelines provide:
Technical guidance for preparing applications for the approval and certification of innovative technologies (‘eco-innovations’) to reduce CO2 emissions from passenger cars and from light commercial vehicles.
Case studies.
In-put data for the preparation of testing and calculation methodologies.
1.2. Legal background
1.2.1. Regulation (EC) No 443/2009 and Regulation (EU) No 510/2011
Regulation (EC) No 443/20091 setting emission performance standards for new passenger cars as part of the Community's integrated approach to reduce CO2 emissions from light duty vehicles, provides an average CO2 emission target for new passenger cars of 130 g CO2/km from 2015 onwards to be phased-in from 2012. Specific emission targets are assigned to each manufacturer, based on the average specific emissions for each new passenger car registered in the preceding calendar year. Additional measures specified in Commission Communication (2007) 192 final should bring a further reduction of 10 g CO2/km. A new target of 95 g CO2/km will be phased in from 2020 and fully applicable from 2021.
Similarly Regulation (EU) No 510/20113 setting emission performance standards for new light commercial vehicles as part of the Union's integrated approach to reduce CO2 emissions from light duty vehicles, provides for a short term target of 175 g CO2/km to be phased in from 2014 and a long term target of 147 g CO2/km which will apply from 2020.
Article 12 of Regulation (EC) No 443/20091 and Regulation (EU) No 510/20113 provide a possibility for manufacturers to take into account CO2 savings from innovative technologies, ‘eco-innovations’ in order to meet their specific CO2 emissions targets. The Commission will assess applications for the approval of technologies as ‘eco-innovations’. Applications may be submitted by both manufacturers and suppliers. An approval decision may be used by manufacturers for the purpose of certifying the CO2 savings as part of the type approval process. The maximum savings that a manufacturer may take into account for reducing the average emissions in a given calendar year is 7 g CO2/km.
Example:
Manufacturer X fits, in year Y, an eco-innovation in 200 000 cars. Each eco-innovation brings a saving of 1.5 g CO2/km. The total number of new vehicles registered in year Y of that manufacturer is 800 000. The total eco-innovation savings that the manufacturer X can use for reducing its average emissions are:
1.5 ∙ 200 000800 000
=0.4 gC O2/km
The average NEDC emissions in year Y of that fleet is 132.0 g CO2/km. Since the total eco-innovation savings are less than 7 g CO2/km, the average emissions can be reduced to 131.6 g CO2/km.
1 Regulation (EC) No 443/2009: http://europa.eu/!tJ77dB2 Commission Communication (2007) 19: http://europa.eu/!xx84dR3 Regulation (EU) No 510/2011: http://europa.eu/!Rd67Bu
7
Testing methodologies for eco-innovations that have been approved by the Commission will be available for manufacturers other than the holder of the approval and may be used for the certification of any relevant vehicle fitted with a technology corresponding to the approved eco-innovation, provided that the minimum savings threshold is met (see second subparagraph of Article 11(2) of Regulation (EU) No 725/2011 4). The approval decisions will be accessible on Eur-Lex as well as on the Commission website5. See also Chap 2.2.2 for information about a short application procedure in the case of already approved technologies.
1.2.2. Commission Regulation (EU) No 725/2011 – eco-innovations for passenger cars
Commission Regulation (EU) No 725/20114 establishing a procedure for the approval and certification of innovative technologies for reducing CO2 emissions from passenger cars pursuant to Regulation (EC) No 443/20091 of the European Parliament and of the Council specifies the eligibility criteria and sets out the application procedure. These guidelines give additional information on how to prepare the application as well as practical examples of potential technologies and testing methodologies.
1.2.3. Commission Regulation (EU) No 427/2014 – eco-innovations for light commercial vehicles
Regulation (EU) No 427/20146 is in all essential elements similar to Regulation (EU) No 725/20114. Eco-innovation savings will be available for manufacturers of complete N1 vehicles, and in the case of multi-stage vehicles, the manufacturer of the base vehicle. These guidelines will apply also with regard to eco-innovations for N1 vehicles. However, it should be noted that the recording of eco-innovation savings in the certificates of conformity for N1 vehicles will be possible from 2016 only (see Directive 2007/46/EC7).
The Technical Guidelines will be further reviewed with regard to eco-innovations for N1 vehicles as this will require further collection of statistical data.
1.3. Experiences and new developments
1.3.1. Eco-innovations for light commercial vehicles (N1)
Specific datasets will be needed both for the preparation and assessment of applications for N1 eco-innovations. The data which is collected for passenger cars cannot be fully used for N1 vehicles. For instance the parking time distribution, the mileage, and the power consumption will differ. The Commission will therefore approach relevant stakeholders to identify appropriate datasets.
1.3.2. Short applications and short assessment with regard to technologies that have already been approved by the Commission
In the case of technologies which have already been approved by the Commission a short application should be available. The applicant may in those cases as an alternative to requesting a full assessment, refer to an existing approval decision and indicate that the same testing methodology should apply in the case of his application.
4 Regulation (EU) No 725/2011: http://europa.eu/!xC77mW5 DG CLIMA: http://europa.eu/!RG73tN6 Regulation (EU) No 427/2014: http://europa.eu/!jT67kv 7 Directive 2007/46/EC: http://europa.eu/!gf96mW
8
2. PROCEDURE
2.1. Discussing candidate applications
It is recommended to contact the Commission prior to submitting the application in order to ensure that the application meets all the conditions required to be considered complete. The following functional mailbox can be used: [email protected].
2.2. Application procedure
Before submission, every applicant should ensure that the application includes the items indicated in Article 4 of Regulation (EU) No 725/20114 and (EU) No 427/20146. It should be stressed that the assessment of the application will only start if it is complete. The application should also clearly indicate any parts that are confidential.
The applicant should choose the type of assessment for his applicationthat wants to follow:
Full assessment
Short assessment
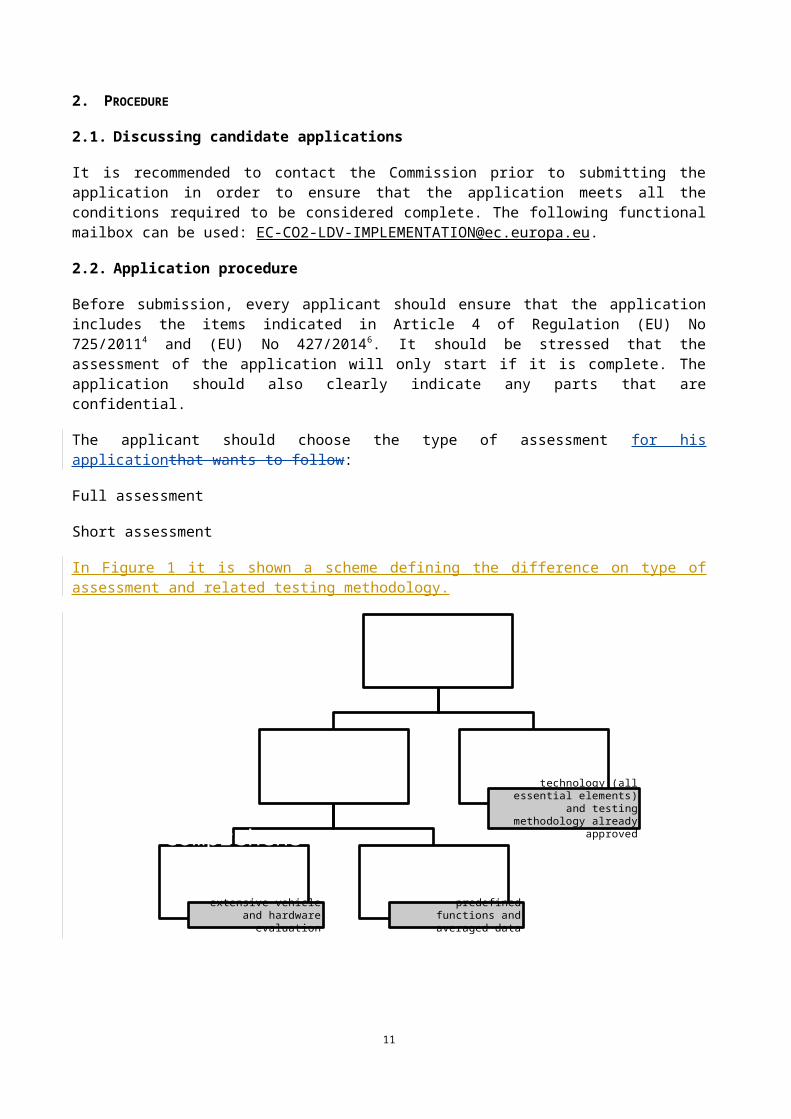
In Figure 1 it is shown a scheme defining the difference on type of assessment and related testing methodology.
Figure 1: difference on type of assessment and related testing methodology
2.2.1. Full assessment
When a supplier or an OEM proposes a technology which does not fall under the short assessment (see Chap 2.2.2) then a full assessment will be carried out by the Commission. In the sub-paragraph below (Chap 2.2.1.1) the checklist is given for the information which must be provided by the applicant.
9
Application
Full assessment
Comprehensive methodology
extensive vehicle and hardware evaluation
Simplified approach
predefined functions and averaged data
Short assessment
technology (all essential elements) and testing
methodology already approved
2.2.1.1. Checklist for a full application
The following documents and data should be provided with an application for full assessment of an innovative technology:
(1) Name and address and contact person of the applicant
(2) Choice of type of testing methodology:
(a) Simplified approach
(b) Comprehensive methodology
(3) A summary of the application for publication
(4) List of supporting documentation
(5) Technical description of the eco-innovation and the way it is fitted on a vehicle, in words and, where appropriate, illustrated by technical drawings
(6) Supporting documentation demonstrating that the innovative technology does not exceed 3 % in the reference year 2009
(7)[(6)] Prediction on which vehicle segments the eco-innovation will be applied (estimate only)
(8)[(7)] Expected number of vehicles per vehicle segment equipped with the particular eco-innovation coming to the market with expected timescale (estimate only)
(9)[(8)] Identification of the baseline technology for the envisaged vehicle segments
(10)[(9)] Technical description of the baseline technology
(11) Description of the technology characteristics that could lead to increased CO2
emission (e.g. higher mass, higher drag resistance)
(12) Check of possible deterioration effects
[(10)] Description of testing methodology (modelling / measurements)and corresponding calculation procedure for the case study:
(a) Measurement or modelling condition and equipment
(b) Measurement or modelling procedure
(c) Method of calculation of CO2 savings
(d) Identification of the uncertainties and description of the methodology to quantify the statistical errors
(13) Description of the case study
[(11)] Resulting Application of the testing methodology (modelling / measurements)and corresponding calculation procedure for the case of study and calculation of the
10
corresponding resulting CO2 savings (differentiated per envisaged vehicle segment, where relevant)
[(12)] Comprehensive uncertainty analyses and q Application of uncertainty analysis and quantification of statistical errorsuantification of statistical errors
(14)[(13)] Check if all eligibility criteria specified in Article 2 and Article 4(2)(e), (f) and (g) of Regulation (EU) No 725/20114 and (EU) No 427/20146, described in Chap. 4 of these guidelines, are fulfilled; reasons and evidential data have to be provided for each of them:
(a) Non-exceeding requirements in EU law
(b) Innovativeness of technology
(c) Necessity of technology (non-comfort)
(d) Verifiability of CO2 saving (minimum threshold)
(e) Coverage (type approval procedure)
(f) Accountability (influence of driver)
(15)[(14)] Verification report from an independent certification body, including:
(a) Testing protocols of all relevant measurements
(b) C heck of fulfilment of the eligibility criteria
(c) Check of possible deterioration effects
In the case of the comprehensive methodology the applicant should also provide:
(16)[(15)] Detailed technical data of case study vehicle(s) and hardware (see Chap. 6.2)
(17)[(16)] Data about experimental analyses of deterioration effects or sound argumentation in case of non-existence
(18)[(17)] A verification report including the following additional tasks:
(a) Check of suitability of the testing methodology for determining the CO2
savings from the eco-innovation
(b) Check of suitability of parametric function (if CO2 saving depends on one or more vehicle parameters)
2.2.2. Short assessment
A technology that a manufacturer wishes to use with a view to benefitting from the CO 2 emission savings in accordance with Article 12 of Regulation (EC) No 443/20091 and (EU) No 510/20118 must be approved by the Commission through a Commission Implementing Decision. A reference to the corresponding approval Decision is needed for the purpose of the certification of the savings by the type approval authority (see Directive 2007/46/EC7).
8 Regulation (EU) No 510/2011: http://europa.eu/!Rd67Bu
11
In the case of technologies which have already been approved by the Commission, the applicant may make use of a short application procedure. This means that the applicant may refer to an existing approval decision and indicate that the same testing methodology should apply in the case of his application. In this case, the application may be limited to a declaration by the applicant that the technology is in all essential elements the same as the one subject to the approval decision (based on the information included in the approval decision), that the approved testing methodology is applicable and that the level of savings is consistent with the 1g CO2/km threshold.
Each application must, in accordance with Article 12(3), be accompanied by a report, including a verification report undertaken by an independent and certified body. In the case of a short application, the verification should be limited to verifying and confirming that the declaration by the applicant concerning the similarity of the technology (based on the information included in the approval decision), the applicability of the testing methodology and the level of savings are correct.
In the sub-paragraph below (Chap 2.2.2.1) the checklist is given for the information which must be provided by the supplier or the OEM to execute such a simplified short assessment.
Even if a technology is similar or equal to an approved technology, the applicant may request a full assessment. This should be the case if he proposes a testing methodology that is substantially different from the approved methodology.
The Commission nevertheless reserves the right to make an independent assessment of the similarity of the technology and the potential need for a full application as well as whether to maintain or change an already approved testing methodology in accordance with Article 10(3) of Regulation (EU) No 725/2011 4 and (EU) No 427/20146. In the case an already approved testing methodology will apply, the approval decision will contain a reference to a previous approval decision setting out the relevant testing methodology.
2.2.2.1. Checklist for a short application
The following documents and data should be provided with an application for short assessment of an innovative technology:
(1) Name, address and contact person of the applicant
(2) List of supporting documentation
(3) Reference to the relevant existing Commission Implementing Decision approving a similar technology
(4) Formal declaration that the technology is in all essential elements the same as the one subject to the approval decision, that the approved testing methodology is applicable and that the level of savings are consistent with the 1 g CO2/km threshold. The formal declaration should be based on the information included in the approval decision
(5) A summary of the application for publication
(6) A summary technical description of the eco-innovation and the way it is fitted on a vehicle
(7) Prediction on which vehicle segments the eco-innovation will be applied (estimate only)
(8) Expected number of vehicles per vehicle segment equipped with the particular eco-innovation coming to the market with expected timescale (estimate only)
12
(9) Verification report from an independent certification body, including check of fulfilment of the eligibility criteria
2.3. Procedure for assessing the applications for eco-innovations
An OEM or a supplier sends in an application for the approval of an eco-innovation to the Commission. It is important to note that this application should also contain a report of an independent verifier.
After receipt of the application, the Commission starts the assessment. In practice this work is divided between the Joint Research Centre that carries out the technical assessment and the Directorate General for Climate Action that is responsible for preparing the final decision to be adopted by the Commission.
The first step in this process is a completeness check, i.e. whether all necessary documents to start the assessment have been provided with the application. This step should take a maximum of fifteen working daystwo weeks.
If the application is found to be complete, the Commission has nine months, from the date the complete application is found completereceived, to finalize the assessment and take a decision to approve or reject it.
If the application is incomplete, the assessment deadline is not activated and the applicant is asked to provide the missing information. Only when the applications which areis found to be complete will be further assessed. It should also be underlined that if an application cannot be completed within three months from the initial submission, the application will be considered void and the applicant will be requested to submit a new complete application.
The technical assessment of the complete application may take several weeks, depending on the complexity of the technology and the testing methodology. It may also require some further exchanges between the Commission and the applicant in order to clarify issues.
The technical assessment should demonstrate that the eligibility criteria are met and that the testing methodology is fit for use. A draft decision is prepared outlining the reasons why the application should be approved or rejected. In case of an approval, the decision includes a description of the technology and the testing methodology or a reference to an already approved methodology. Following a consultation of other Commission services the decision is finally adopted by the Commission and is published in the Official Journal in all languages.
2.4. The recording of the eco-innovation savings in the certificate of conformity
A manufacturer can use eco-innovation CO2 savings to lower its annual average CO2 emissions in view of meeting its annual specific emission target. The maximum savings that can be taken into account for that purpose are 7 g CO2/km per year. The manufacturer must submit a request for the certification of the CO2
savings for an eco-innovation fitted in a vehicle version9 to the type approval authority. In this request a reference must be given to the relevant approval Commission Implementing Decision. The type approval authority will certify the savings if the manufacturer can demonstrate that the savings for the relevant vehicle version9 are 1 g CO2/km or more. The certification request should be accompanied by a report with the CO2 savings based on the specific testing methodology. The certified savings should be indicated in the certificate of conformity of the vehicles concerned.
Approval Commission Implementing Decisions are published in the EU Official Journal and on DG CLIMA website5.
9 In terms of ‘vehicle type, variant and version’ as defined in Annex II B1 to Directive 2007/46/EC (type approval framework Directive). A vehicle version can differ, for instance in engine capacity, and power output. These differences can influence the CO2 saving effect.
13
2.5. The monitoring of the implementation of eco-innovations
Every approved eco-innovation will get its own specific number which can be used to monitor the implementation of these eco-innovations. This monitoring is done by the Member States and the Commission in order to determine the performance of a manufacturer in meeting its annual targets.
2.6. Information
Detailed information about legislation, approved eco-innovations, and monitoring can be found in the DG CLIMA website5.
14
3. DEMONSTRATION OF CO2 SAVINGS
3.1. Testing methodology
Article 6 of Regulations (EU) No 725/2011 and (EU) No 427/2014
The reference method to demonstrate the CO2 saving effect of an innovative technology should be to perform vehicle measurements on a chassis dynamometer. However, in accordance with Article 5(2) of Regulation (EU) No 725/20114 and (EU) No 427/20146, the ‘testing methodology’ to demonstrate the CO2
savings could also include calculation or modelling methodologies.
3.1.1. European driving patterns
Article 6(1). of Regulations (EU) No 725/2011 and (EU) No 427/2014
In order to ensure a level playing field and to have a common reference for all applications, the driving patterns specified in the ‘New European Driving Cycle’ (NEDC) set out in UN/ECE Regulation No 8310 for the ‘Type I test’ should be used as a basis for the measurements pending the adoption of a new test cycle. The NEDC should therefore be used as test cycle for validation purposes within the testing methodologies in terms of velocity-over-time function. Test cycles or driving patterns with other speed/time profiles than the NEDC or the restriction or over-weighting of specific parts of that cycle would therefore not be accepted. The NEDC should therefore be followed as a whole, including an engine start at the beginning of the cycle
Where it is clear that the CO2 reducing effect of an innovative technology cannot be adequately demonstrated on a vehicle chassis dynamometer or from the use of the speed/time-profile of the NEDC, it should be assessed on a case by case basis whether a deviation from the NEDC is appropriate. A request for such deviation in the testing methodology should be supported by a detailed justification. The independent and certified body should confirm in its verification report that the deviations are appropriate.
Example A:
The CO2 saving potential of a start/stop system depends on the number and duration of idling phases at the test cycle. A driving cycle with an overweighting of idling phases compared to the NEDC would not be considered representative.
Example B:
A technology results in CO2 savings when the vehicle is operated under warm (start) conditions. The warming up of the vehicle should be done using the NEDC. The impact of the warm non-standard starting conditions should be demonstrated under the NEDC as well. The final CO2 saving is the difference between the two test results.
Example C:
A technology shows its CO2 reduction potential mainly at highest vehicle velocities. The maximum speed in the NEDC is 120 km/h, and only the CO2 emission reduction up to 120 km/h should be considered for the application. An over-weighting of the 120 km/h part of the NEDC (> 7 seconds) would not be considered representative.
3.2. Calculation procedure
Article 8 of Regulations (EU) No 725/2011 and (EU) No 427/2014
10 UN/ECE Regulation No 83: http://www.unece.org/fileadmin/DAM/trans/main/wp29/wp29regs/r083r4e.pdf
15

The generic procedure to determine the CO2 savings of a particular innovative technology is described by Equation 1. This procedure, including vehicle testing on a chassis dynamometer, may be used by an applicant within the process of the ‘comprehensive methodology’ or ‘simplified approach’ (see Chap. 6). The testing conditions (e.g. ambient conditions, temperatures, activation of safety devices, tyre pressure) specified for the testing methodology of an innovative technology may be modified from those defined for type approval11.
Equation 1:
CC O2=[ (BMC−EMC )−(BTA−ETA ) ] ∙UF
CC O2: CO2 savings [g CO2/km]
BMC : CO2 emissions of the baseline technology vehicle under modified testing conditions [g CO2/km]
EMC: CO2 emissions of the eco-innovation technology vehicle under modified testing conditions [g CO2/km]
BTA: CO2 emissions of the baseline technology vehicle under type approval testing conditions [g CO2/km]
ETA: CO2 emissions of the eco-innovation technology vehicle under type approval testing conditions [g CO2/km]
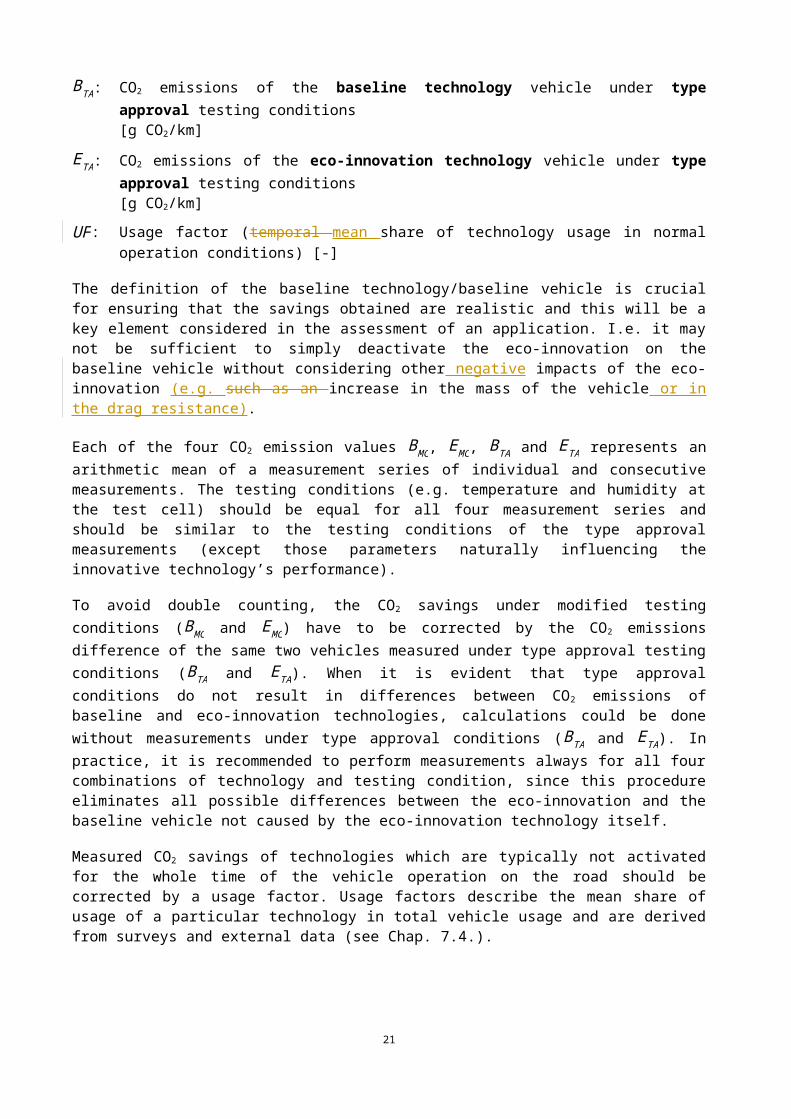
UF: Usage factor (temporal mean share of technology usage in normal operation conditions) [-]
The definition of the baseline technology/baseline vehicle is crucial for ensuring that the savings obtained are realistic and this will be a key element considered in the assessment of an application. I.e. it may not be sufficient to simply deactivate the eco-innovation on the baseline vehicle without considering other negative impacts of the eco-innovation (e.g. such as an increase in the mass of the vehicle or in the drag resistance).
Each of the four CO2 emission values BMC , EMC, BTA and ETA represents an arithmetic mean of a measurement series of individual and consecutive measurements. The testing conditions (e.g. temperature and humidity at the test cell) should be equal for all four measurement series and should be similar to the testing conditions of the type approval measurements (except those parameters naturally influencing the innovative technology’s performance).
To avoid double counting, the CO2 savings under modified testing conditions (BMC and EMC) have to be corrected by the CO2 emissions difference of the same two vehicles measured under type approval testing conditions (BTA and ETA). When it is evident that type approval conditions do not result in differences between CO2 emissions of baseline and eco-innovation technologies, calculations could be done without measurements under type approval conditions (BTA and ETA). In practice, it is recommended to perform measurements always for all four combinations of technology and testing condition, since this procedure eliminates all possible differences between the eco-innovation and the baseline vehicle not caused by the eco-innovation technology itself.
Measured CO2 savings of technologies which are typically not activated for the whole time of the vehicle operation on the road should be corrected by a usage factor. Usage factors describe the mean share of usage of a particular technology in total vehicle usage and are derived from surveys and external data (see Chap. 7.4).
11 Pursuant to Commission Regulation (EC) No 692/2008 implementing and amending Regulation (EC) No 715/2007 of the European Parliament and of the Council on type-approval of motor vehicles with respect to emissions from light passenger and commercial vehicles (Euro 5 and Euro 6) and on access to vehicle repair and maintenance information
16
The uncertainty of the CO2 savings determined in such a way has to be assessed by the use of appropriate statistical measures (see Chap. 6.3).
In addition to the procedure described above, these guidelines offer the possibility to use ‘simplified approaches’ (see Chap. 6.1) in providing averaged data and basic calculation methods.
17

4. ELIGIBILITY CRITERIA
Innovative technologies have to fulfil the following criteria to qualify for an application for eco-innovation:
4.1. Integrated approach measures
Article 2(1) of Regulations (EU) No 725/2011 and (EU) No 427/2014.
Some individual CO2 saving technologies have been regulated in EU legislation or are going to be developed within a short period of time. Regulations (EC) No 443/20091 and (EU) No 510/20113 explicitly exclude these technologies from the scope of eco-innovation procedure.
Any technology falling within the scope of the following measures covered by the integrated approach, shall not be considered as innovative technologies:
Efficiency improvements for air-conditioning systems
Tyre pressure monitoring systems falling within the scope of Regulation (EC) No 661/200912
Tyre rolling resistance falling within the scope of Regulations (EC) No 661/2009 12 and (EC) No 1222/200913
Gear shift indicators falling within the scope of Regulation (EC) No 661/200912
Use of bio fuels
4.2. Innovativeness
Article 2(2)(a) of Regulations (EU) No 725/2011 and (EU) No 427/2014
Technologies that are already well represented in the existing fleet should not qualify as eco-innovations. Incentives should only be given to new technologies with a real CO2 reducing potential with the aim of facilitating their introduction and wide-spread penetration into the market.
According to the Regulations, technologies with a market penetration of 3% or less in newly registered vehicles in Europe in the reference year 2009 may be considered meeting the innovativeness criterion. Where the innovative technology consists of a combination of several technologies with similar technical features and characteristics (referred to in these guidelines as a ‘technology package’, see Chap. 4.4.2) each individual technology has to fulfil the innovativeness criterion defined above separately.
Applicants are asked to provide supporting information, such as the 2009 sales numbers of vehicles already equipped with the innovative technology, or the number of products including the innovative technology that were sold to vehicle manufacturers in that year.
Where no such information is available due to the novelty of the technology, the applicant should provide a statement to that effect. It is recognised that precise data may not always be readily accessible. Where relevant data bases are not available, an estimate based on the best information available to the applicant, such as information about the applicant's own products, should be made. Well-argued expert judgements on market penetration would be considered. It should be noted that evidence provided to support this part of the application will be made public as part of the summary to be provided in accordance with Article 4(2)(c) of Regulation (EU) No 725/20114 and (EU) No 427/20146.
12 Regulation (EC) No 661/2009: http://europa.eu/!Qq67yf 13 Regulation (EC) No 1222/2009: http://europa.eu/!pp74pN
18
Example A (lighting technologies)
In order to determine the market penetration of lighting technologies, a reference was made to the CLEPA Light Sight Safety14 initiative. As part of that initiative, suppliers of headlamps and rear lamps have individually estimated the penetration rates of innovative technologies in the different lighting applications, based on production in figures the EU for the year 2009.
In a subsequent market review these figures have been condensed to a single value per application and technology. The Commission considered this result as representative since the companies providing the information represent the majority of the actors present in the automotive lighting market in Europe (around 75%).
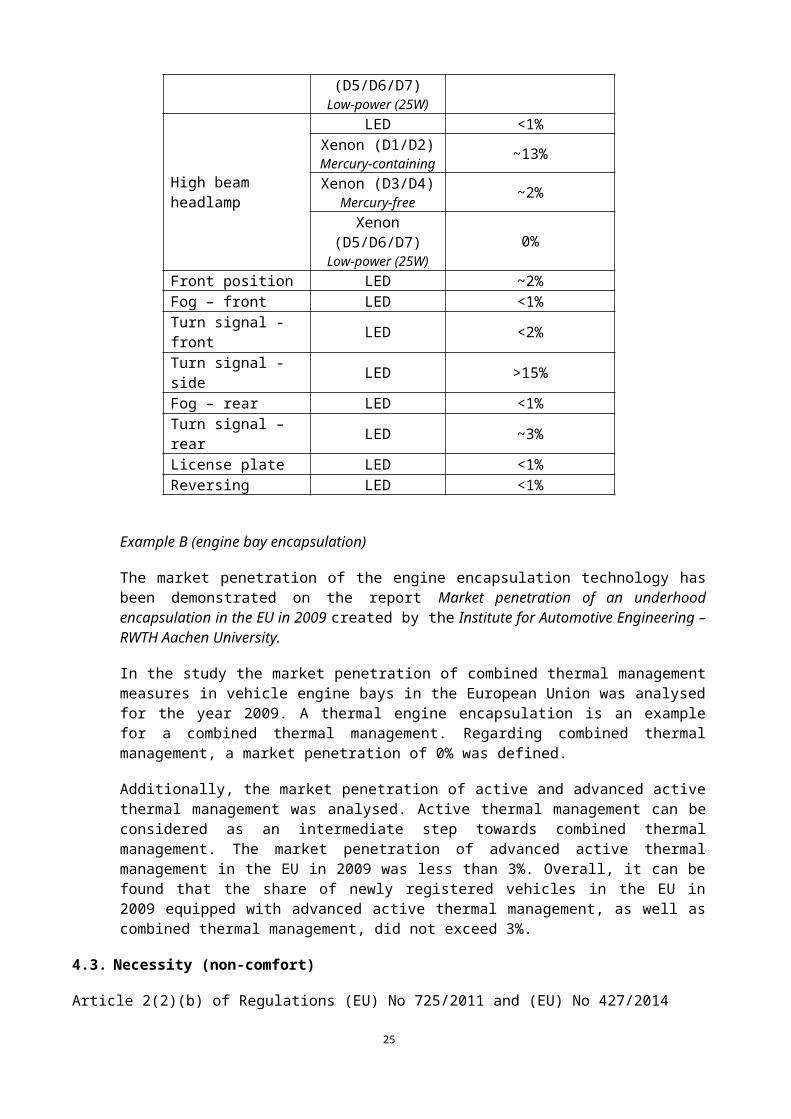
Type of lighting Technology Estimated Fitting rate(new cars, EU 2009)
Low beam headlamp
LED <1%Xenon (D1/D2)
Mercury-containing ~13%
Xenon (D3/D4)Mercury-free ~2%
Xenon (D5/D6/D7)Low-power (25W) 0%
High beam headlamp
LED <1%Xenon (D1/D2)
Mercury-containing ~13%
Xenon (D3/D4)Mercury-free ~2%
Xenon (D5/D6/D7)Low-power (25W) 0%
Front position LED ~2%Fog – front LED <1%Turn signal - front LED <2%Turn signal - side LED >15%Fog – rear LED <1%Turn signal – rear LED ~3%License plate LED <1%Reversing LED <1%
Example B (engine bay encapsulation)
The market penetration of the engine encapsulation technology has been demonstrated on the report Market penetration of an underhood encapsulation in the EU in 2009 created by the Institute for Automotive Engineering – RWTH Aachen University.
In the study the market penetration of combined thermal management measures in vehicle engine bays in the European Union was analysed for the year 2009. A thermal engine encapsulation is an example for a combined thermal management. Regarding combined thermal management, a market penetration of 0% was defined.
Additionally, the market penetration of active and advanced active thermal management was analysed. Active thermal management can be considered as an intermediate step towards combined thermal management. The market penetration of advanced active thermal management in the EU in 2009 was less than 3%. Overall, it can be found that the share of newly registered vehicles in the EU in 2009 equipped with advanced active thermal management, as well as combined thermal management, did not exceed 3%.
14 CLEPA Light. Sightt. Safety, March 2nd, 2012: http://www.clepa.eu/working-groups/lightsightsafety-initiative-lss/
19
4.3. Necessity (non-comfort)
Article 2(2)(b) of Regulations (EU) No 725/2011 and (EU) No 427/2014
An applicant should demonstrate that the technology does not serve purely for comfort, without any link to either the performance or the safety of the vehicle. A technology that improves the energy use of a vehicle compared to a baseline technology and that in addition is relevant for the transport function of the vehicle could however qualify as an eco-innovation. This would also include technologies which are able to convert unused (internal or external) energy into usable energy or improve the energy storage capacity. However, in order to accurately take into account the extent to which the energy use of a vehicle may be improved through such technologies, it is necessary to get a better understanding of the energy consumed for the operation of devices aimed at enhancing the comfort of the driver or the passengers.
Example A:
Technologies like photo-voltaic elements applied on the vehicles (solar roof), heat recovery systems, more efficient generators and more efficient lighting (LED) may potentially qualify as eco-innovations.
Example B:
Technologies like efficient seat or cabin heating and efficient HiFi systems would not qualify for eco-innovations.
4.4. Verifiability (minimum threshold)
Article 4(2)(f)(i) of Regulations (EU) No 725/2011 and (EU) No 427/2014
The CO2 savings of an eco-innovation should be verifiable. Hence, the technical limits of determination of standard measurement equipment should not exceed the total CO2 savings value. The savings should be calculated in accordance with the procedure described in Chap. 3.2 and should be 1 g CO2/km or more in order for the technology to be eligible. For this comparison, calculated CO 2 savings values must not be rounded up and expressed to a maximum of two decimal places.
4.4.1. Statistical significance
Article 6(1) of Regulations (EU) No 725/2011 and (EU) No 427/2014
The applicant should demonstrate that the minimum threshold is exceeded in a statistically significant way. A confidence interval of at least 84 % should be observed. This means, that the statistical error determined as described in Chap. 6.3 and indicated as a standard deviation should not be greater than the difference between the total CO2 savings and the minimum threshold (see Equation 2).
Equation 2:
MT ≤CC O2−❑❑❑❑
❑❑❑❑
MT : Minimum thresholdCC O2
: Total CO2 saving❑❑❑❑
❑❑❑❑
: Standard deviation of the total CO2 saving (see Chap. 6.3)
If the total CO2 saving exceeds the minimum threshold but its standard deviation is greater than the difference between the total CO2 saving and the minimum threshold, the verifiability criterion is not fulfilled. In this case, the applicant should undertake suitable measures to reduce the uncertainty of the total CO2 saving (e.g. by increasing the number of measurements, by updating the measurement instrumentation, by improving the modelling method).
20
4.4.2. Technology package
Article 3(a) of Regulations (EU) No 725/2011 and (EU) No 427/2014
The combination of different innovative technologies into one ‘technology package’ to exceed the minimum threshold of 1 g CO2/km should in principle be admissible. The individual technologies combined into one ‘technology package’ should be tested using one and the same testing methodology and should therefore belong to the same technology class as specified in Chap. 5.
The total CO2 savings should be determined taking into account the interaction between the technologies forming the package. The single CO2 savings for each technology being part of the package may be shown in the verification report, but only one figure should be reported for the final total savings of the combined technologies, taking into account any potential interaction between the single technologies.
Example A:
A considered valid ‘technology package’ is the combination of different lighting technologies.
Example B:
A combination of heat recovery and lighting system would not be considered a valid ‘technology package’.
4.5. Coverage (type approval procedure)
Article 4(2)(f)(ii) of Regulations (EU) No 725/2011 and (EU) No 427/2014
Incentives can be granted to technologies whose CO2 saving is not already covered by the CO2 type approval test procedure. If the CO2 reducing effect of an eco-innovation is only partially covered by the type approval procedure, the granted CO2 saving is the difference between the CO2 saving at modified testing modalities and CO2 saving under type approval conditions (see Equation 1): e.g. any savings that can be demonstrated using the normal type approval procedure must be deducted from the total savings of the eco-innovation in order to avoid double counting. Technologies whose CO2 reducing effects are fully covered by the EC type approval procedure will not qualify.
4.6. Accountability (influence of driver)
Article 4(2)(f)(iii) of Regulations (EU) No 725/2011 and (EU) No 427/2014
CO2 savings of eco-innovations must be accountable to the applicants (e.g. manufacturers or suppliers). All other possible influencing parameters should be excluded to ensure a verifiable and constant rate of activation. Where basic technical features are not activated permanently during a vehicle’s operation, average usage factors should be derived from strong statistical data. Normally, such statistical surveys cannot be performed for new technologies before their market introduction.
In general, only technologies whose CO2 saving effect is not under the influence of the driver’s choice or behaviour would normally qualify. However, devices which can be switched on and off, but are normally activated or deactivated because of changing ambient conditions to ensure a safe operation of the vehicle would be eligible, provided that relevant statistical data can be provided to support the CO2 reducing effect of the device (usage factor).
Example A:
Lighting as technology can be switched on and off by the user. However, the normal way of using lights will not change with the lighting technology. In this case the technology might be eligible.
Example B:
21

Amongst the possible technologies that should not qualify as eco-innovations are driver-aid systems indicating the “eco level” of a driver, eco-driving training and engine control systems for more ecological driving that can be switched on/off by the user.
As regards eco-driving devices it should be noted that these could be eligible only where the manufacturer or supplier can prove that these devices have a CO2 reducing effect that is independent of the driver's behaviour. This could potentially be the case where the device ensures an eco-driving mode regardless of the choices of the driver, i.e. no switch on/off possible.
For any other type of device which depends on the driver behaviour, the manufacturer/supplier would have to demonstrate either that the mere existence of an eco-driving device in a vehicle has a positive and quantifiable effect on fuel consumption/CO2 emissions. The causal link between the device, the driver's behaviour and the subsequent CO2 reductions should be statistically proven to such a degree that variations in the driver’s behaviour would have an insignificant impact on the final savings (see Chap 6.3). In general, the driver should not be conscious of the existence of the technology.
22
5. CLASSES OF POTENTIAL ECO-INNOVATION TECHNOLOGIES
Potential eco-innovation technologies have been grouped into classes of similar technical features and characteristics. The following list describes the current state of knowledge, must not be seen as finalised or completed and should not exclude potential technologies belonging to other classes.
The following 8 9 classes are described:
Class 1: Improved electrical components
Class 2: Improved mechanical components
Class 3: Use of ambient energy sources
Class 4: Heat energy storing systems
Class 5: Kinetic energy storing systems
Class 6: Heat energy – to – electricity converters
Class 7: Kinetic energy – to – electricity converters
Class 8: Measures lowering engine speed
Class 9: Active aerodynamics
5.1. Improved electrical components
Any improvement of the efficiency of electrical components lowers the total electric power requirement. Hence, the mechanical workload of the alternator gets reduced and fuel consumption and CO2 emissions fall. For calculation approaches it is essential to know the efficiencies of both alternator and engine. For electrical components which are not always activated during vehicle’s operation, a particular temporal share of usage has to be taken into account. Possible opponent effects, e.g. caused by extra required control units, have to be taken into account when calculating the CO2 benefit. Especially for electrical components it is important to check if the ‘necessity’ eligibility criteria are fulfilled since not every electrical device is essential for the operation of the vehicle.
5.2. Improved mechanical components
Any improvement of mechanical components which lowers the driving resistance of the vehicle leads directly to reductions of fuel consumption and CO2 emissions. Measures of this class may reduce the rolling resistance, aerodynamic drag or the friction of mechanical devices. They may also improve the engine’s efficiency.
5.3. Use of ambient energy sources
Ambient energy sources like solar radiation, wind, heat etc. may be transformed to usable energy by special devices. If these external energy flows are used directly for propulsion of the vehicle or are transformed to electric energy, the energy requirement from on-board fuels gets reduced.
5.4. Heat energy storing systems
Heat energy which cannot be used or only be used at a low efficiency level at a certain time may be stored and used afterwards at a more favourable opportunity. E.g. heat storage by measures of insulation may increase the temperature of vehicle parts and, hence, reduce friction of mechanical components.
5.5. Kinetic energy storing systems
Kinetic energy which cannot be used or only be used at a low efficiency level at a certain time may be stored and used afterwards at a more favourable opportunity.
23
5.6. Heat energy – to – electricity converters
Waste heat from the exhaust or from the coolant may be transformed to electricity and can therefore reduce the alternator’s workload. Possible technologies are:
Heat exchanger, turbine and generator
Turbo compressor and generator
Heat exchanger and thermoelectric semiconductor
Exhaust heat recovery systems reduce the exhaust temperature and increase the exhaust back pressure. This counter-reaction has to be taken into account when determining the CO2 saving effect of the system. Current standard vehicle models are not able to cover the complex interactions of these systems. Hence, the testing methodology should be based on measurements.
5.7. Kinetic energy – to – electricity converters
Kinetic energy may be transformed to additional electric energy in different ways, like efficiency improvements of the alternator.
In case of efficiency improvement of an already existing converter, the baseline technology is the converter with the highest market penetration at the reference period.
5.8. Measures lowering engine speed
Measures lowering engine speed may include changes in transmission ratios, different gear changing strategies or engine shut-off during idling phases. These measures are widely covered by the type approval test procedure or are influenced strongly by the behaviour of the driver. Hence, the fulfilment of the eligibility criteria has to be checked carefully.
5.9. Active aerodynamics
Devices adapting the vehicle aerodynamic to the environmental conditions or vehicles parameters (e.g. speed, ambient temperature, engine temperature). These devices can modify the drag resistance and, as consequence, the coast down curve.
24
6. TESTING METHODOLOGIES
The application for an approval of an innovative technology as eco-innovation has to include a testing methodology that is suitable to determine and quantify the CO2 saving effect of the technology. The methodology should provide accurate and verifiable results. In principle, a measurement, a modelling approach or a combination of both may be applied. Occurring statistical errors resulting from uncertainties of the measurement or modelling techniques have to be quantified and reported (see Chap. 6.3).
Where an application for approval concerns an innovative technology for which an appropriate testing methodology has already been approved, it is recommended that the application refers to the approval decision setting out the relevant testing methodology. This means that the same testing methodology may be used for several eco-innovations (e.g. alternators, lighting systems), see also Chap 2.2.2. For information about approved eco-innovations see the DG CLIMA website5.
In the case of an application for which there is no existing approved testing methodology or if the applicant proposes a testing methodology that is substantially different from the approved methodology, the applicant may choose between two different possible approaches:
The ‘simplified approach’; the applicant can use predefined functions and averaged data (e.g. given in these guidelines, open literature, technical standard). The verification report may in this case be limited to include the certified testing protocols, the measurements, the statistical analysis and the determination of the error in the CO2 savings.
The Commission nevertheless reserves the right to ask for extensive analysis based on vehicle or hardware data to demonstrate the representativeness of the proposed functions.
Example A:
The CO2 savings of innovative lighting systems and of innovative alternators can be evaluated by using predefined functions and averaged data given in these guidelines. The power consumption of the innovative lighting systems and of the innovative alternators must be measured in accordance with the applicable UN/ECE Regulation.
Example B:
The CO2 savings of innovative alternators can be evaluated by using predefined functions and averaged data given in these guidelines. The efficiency of innovative alternators must be measured in accordance with the applicable ISO standard.
The ‘comprehensive methodology’; when predefined functions and/or averaged data cannot be used or the applicant considers that a ‘simplified approach’ an approved testing methodology may be improved. The applicant should develop a comprehensive testing methodology and, where necessary, base it on extensive vehicle data and hardware. This documentation should in principle be provided as part of the application and should be assessed by the independent and certified body for the purposes of the verification report. The error in the CO2 savings, resulting from measurements, should be determined on the basis of statistical analysis.
Chap. 7 of these guidelines provides a list of data sets that can be used for the ‘simplified approach’ and for the ‘comprehensive methodology’. All assumptions – other than those given in Chap. 7 – used for calculating the CO2 reduction potential of an innovative technology by a ‘comprehensive methodology’ need to be justified and, if applicable, should be accompanied by relevant data. Calculation methodologies and equations taken from open literature or technical standard should be correctly cited. A detailed derivation of equations is in this case not needed.
25
A mixture of the ‘comprehensive methodology’ and the ‘simplified approach’ is should in principle possible. be in not avoided. However, wWhere the generic data defined for the ‘simplified approach’ in Chap. 7 is not vehicle specific (e.g. usage factors) it may be used also for the ‘comprehensive methodology’.
Where the ‘simplified approach’ is used, all relevant data in Chap. 7 should in principle be used. However, deviations from that rule could be permitted, where the applicant can justify this by providing data that for a specific vehicle that is more realisticare representative for the case of study, based on robust statistical evidence. That data should be non-confidential.
The methodology should not exceed a certain level of complexity in order to ensure its reproducibility by third parties. Specific models owned by the applicant will in principle not be considered as valid basis for demonstrating CO2 savings.
If the CO2 savings depend on the vehicle version9, a parametric function has to be developed and applied. Where such a parametric function cannot remove the differences between the vehicle versions completely, an appropriate security margin added to the resulting CO2 savings should be taken into account. This ensures that all vehicle versions concerned by the specific eco-innovation application are covered by the proposed testing methodology. The eligibility of the parametric function should be checked by the independent and certified body. The results of this assessment should be included in the verification report (see Chap. 6.6). The derived equations should be used for the certification procedure for a specific vehicle version.
Example:
The CO2 saving effect of a heat storage measure depends on the engine size of the vehicles. The connection can be described with the following equation:
CC O2=A+B ∙(engine displacement [cm3]) .
This equation has to be submitted together with the engine displacement of the specific vehicle version to the national type approval authority for certification of the CO2 saving of a specific vehicle version.
6.1. Simplified approach
The main features of the ‘simplified approach’ are:
Averaged functions and factors (e.g. defined in these guidelines, open literature, technical standard)
Security margins included to ensure coverage of all potentially qualifying vehicles, measurement / modelling uncertainties and deterioration effects
6.2. Comprehensive methodology
The main features of the comprehensive methodology are:
Measurements or modelling or a combinations of both
Vehicle and hardware test results should in principle be reproducible by a third party on a standard chassis dynamometer equipped with standard measurement techniques
Modelling results should in principle be reproducible by a third party with commercial vehicle simulation software
The applicant may have to provide hardware (both baseline and eco-innovation technologies) for validation
26
The applicant may need to provide comprehensive vehicle data to be used for modelling approaches. A first list of possible data needs include:
Engine: type, displacement, number of cylinders, number of strokes, idle speed, maximum speed, mass moment of inertia, heat capacity, full load characteristic
Coolant temperature increase after engine start
CO2 emission engine map
Fuel consumption engine map
Fuel density
Efficiency map of alternator
Gear box: type, number of gears, transmission ratios
Efficiency map of gearbox
Axle drive: transmission ratio, efficiency
Curb weight
Driving resistance parameters
Frontal area
Drag coefficient
Clutch: maximum transferable torque
Wheel: inertia moment, dynamic rolling radius
Alternator: inertia moment, nominal voltage, maximum current, efficiency curve, idle voltage, torque loss
Battery: nominal voltage, charge capacity, idle voltage, internal resistance
Data specific for the individual eco-innovation technology
6.3. Data quality and uncertainties
The testing methodology should provide verifiable and accurate results as defined in of Article 6(1) Regulation (EU) No 725/20114 and (EU) No 427/20146. The resulting CO2 savings have to be reproducible by a third party equipped with standard measurement and modelling techniques.
[6.3.1.] Statistical error of arithmetic the mean
Statistical errors of the testing methodology’s outcomes results (caused due by to measurement or modelling uncertainties) should be quantified and given together with the determined resulting CO2 saving value.
To allow a straightforward statistical treatment of test results, it is here assumed that the error distribution is characterized byThe format of the error value shall be a its standard deviation (being equivalent, in the case of a normally distributed error, to a two-sided 68% confidence interval of 68 %around the mean). (see Equation 3). reports the formulation to quantify this standard deviation.
27
Equation 3:
❑x=❑❑
√❑ √∑i=1
n
(xi−x )2
n (n−1 )
❑x: Standard deviation of arithmetic the sample mean x❑❑ Standard deviation of the sample x
x i: Measurement valueSample data
x: Arithmetic mMean of the measurement valuessample data
n: Number of measurementsobservations of the sample
All occurring statistical errors should be minimised by applying suitable measures. In case of high variation between the individual measurement values, the number of measurements should be further increased to reduce the uncertainty of the resulting mean value.
6.3.1.[6.3.2.] Propagation of the error
The propagation of the error should be taken into consideration.
The uncertainty values of the variables (e.g. individual measurement series) shall be combined to a total statistical error value using the error propagation law (Equation 4) or a more sophisticated ‘Monte Carlo method’.
Equation 4:
❑❑❑❑
❑❑❑❑
=√∑j=1
m
(❑❑❑
❑❑|❑❑❑❑
❑❑❑
❑❑❑
❑❑❑❑❑)
2
❑❑❑❑
❑❑❑❑
: Standard deviation of the total CO2 saving
❑❑❑
❑❑|❑❑❑❑
❑❑❑
❑❑: Sensitivity of calculated CO2 saving related to input valuethe variable x j
❑❑❑❑❑❑: Standard deviation of input value x j❑❑
m: Number of input valuesvariables with measurement uncertainty
6.3.2.[6.3.3.] Number of test
All measurements should be validated by the independent verification body. Discarded tests have to be documented, and reasons for discarding them have to be given.
All measurements should be performed at least a minimum number offive (5) times.
At least two (2) times for testing vehicles
At least five (5) times for testing devices
In exceptional cases, when the applicant can demonstrate an inappropriate high effort in testing, a reduction on the minimum number of measurement could be proposed, pending the compliance with stricter requirements on the statistical error.
28
In case of high variation between the individual measurement values, the number of measurements should be further increased to reduce the uncertainty of the resulting mean value.
The number or the accuracy of the measures should be increased until the following criteria are fulfilled:
The variation coefficient of the arithmetic means is below 1%
The standard deviation of the determined total CO2 saving is not exceeding 0.5 g CO2/km
The minimum threshold is exceeded in a statistically significant way
Variation coefficient
The complete test procedure shall be repeated until the variation coefficient of the arithmetic means is below 1% (Equation 5).
Equation 5:
❑❑❑❑
❑
❑❑: Coefficient of variance❑❑: Standard deviation of arithmetic mean
❑: Arithmetic mean of the measurement values
Standard deviation of the CO2 saving
The standard deviation of the determined total CO2 saving of the proposed testing methodology should not exceed 0.5 g CO2/km (Equation 6).
Equation 6:
❑❑❑❑
❑❑❑❑
=√∑j=1
m
(❑❑❑
❑❑|❑❑❑❑
❑❑❑
❑❑❑
❑❑❑❑❑)
2
≤ 0.5 g C O2/km
❑❑❑❑
❑❑❑❑
: Standard deviation of the total CO2 saving
❑❑❑
❑❑|❑❑❑❑
❑❑❑
❑❑: Sensitivity of calculated CO2 saving related to the variableinput value x j
❑❑❑❑❑❑: Standard deviation of ❑❑input value ❑❑
m: Number of input valuesvariables with measurement uncertainty
Minimum threshold statistical significance
Concerning the check of the fulfilment of the verifiability criterion (see Chap. 6.3.1), the statistical error determined should not be greater than the difference between the total CO2 savings and the minimum threshold of 1 g CO2/km (see Equation 7).
Equation 7:
MT❑❑ /❑≤ CC O 2−❑❑❑❑
❑❑❑❑
MT : Minimum threshold of 1 g CO2/km
29
CC O2: Total CO2 saving, rounded maximum to two decimal places
❑❑❑❑
❑❑❑❑
: Standard deviation of the total CO2 saving (see Chap. 6.3.2)
Example A:
Standard deviation of the CO2 saving criteria
Two vehicles are tested under modified conditions on a roller bench. The results are given in the Table 1.
Table 1
BMC
[g CO2/km]EMC
[g CO2/km]
Test 1 131.0 127.9
Test 2 133.7 130.4
Test 3 132.4 128.1
Test 4 134.4 130.8
Test 5 130.4 126.8
Arithmetic mean after 5 tests [g CO2/km] 132.37 128.80
Standard deviation of the mean after 3 5 tests[g CO2/km]
0.78 0.80
Variation coefficient after 3 tests[%] 0.6 0.6
This means that after the third test the statistical significance of the arithmetic mean of the datasets is sufficient.
Each of the 2 measurement series described at Table 1 consists of 5 individual values.
The total CO2 saving (TS) is
TS=BMC−EMC=3.57 gC O2/km
without consideration of the usage factor.
The usage factor UF=0.7 has a standard deviation of the mean of ❑UF=0.05
The total CO2 saving (CC O2) is therefore
CC O2=TS ∙ UF=0 gC O2/km
Standard deviation of the total saving (TS) is calculated as linear combination of the 2 arithmetic means (pursuant Equation 4)
30
❑TS=√∑j=1
m
( ∂TS∂ x j |x j=x j
∙ sx j❑❑)2
=√sB MC
2+❑E MC
2=¿
❑TS=√(0.78g C O2/km )2+(0.80 g C O2/km )2=1.12 g C O2/km
Standard deviation of the total CO2 saving (CC O2) (pursuant Equation 4):
❑❑❑❑
❑❑❑❑
=√∑j=1
m
(❑❑❑
❑❑|❑❑❑❑
❑❑❑
❑❑❑
❑❑❑)2
=√( ∂CCO2
∂ TS∙ sTS)
2
+( ∂CCO2
∂UF∙ sUF)
2
=¿
❑❑❑❑
❑❑❑❑
=√(UF∙ sTS )2+ (TS ∙ sUF )2=¿
❑❑❑❑
❑❑❑❑
=√ (0.7 ∙1.12 )2+(3.57 ∙ 0.05 )2=0.80 gC O2/km
The total standard deviation of the CO2 saving determined with 0.8 g CO2/km exceeds the minimum requirement of 0.5 g CO2/km.
❑❑❑❑
❑❑❑❑
=0.8 ≤> 0.5 g C O2/km
Further efforts are necessary to lower the uncertainties.
Minimum threshold statistical significance criteria
The uncertainties of the previous example have been decreased e.g. using a driving robot for chassis dynamometer measurements. All other parameters are unchanged.
The new standard deviations are:
❑B MC=❑EMC
=0.32 g C O2 /km
Following the previous calculation, the standard deviation of the total saving (TS) is
❑TS=0.45 g C O2/km
Standard deviation of the total CO2 saving (CC O2) (pursuant Equation 4):
❑❑❑❑
❑❑❑❑
=√(UF∙ sTS )2+ (TS ∙ sUF )2
❑❑❑❑
❑❑❑❑
=√(0.7 ∙0.45 gC O2/km )2+(57 gC O2/km∙0.05 )2=0.3 gC O2/km
The minimum requirement on data quality is fulfilled now.
❑❑❑❑
❑❑❑❑
=0.3 gC O2 /km<0.5 g C O2/km
The requirement is that the statistical error determined should not be greater than the difference between the total CO2 savings and the minimum threshold.
MT ≤CC O2−❑❑❑❑
❑❑❑❑
MT❑❑ /❑≤ 2.50 g C O2/km−0.36 g C O2/km
31
The criterion is fulfilled.
Example B:
Standard deviation of the CO2 saving criteria
The efficiency of the high efficient alternator has been tested in accordance with the ISO 8854:2012 (see Chap 9.5.1 for details).
A result of this test is the efficiencies of the alternator (A-EI ) at 4 different speeds in rounds per minute (rpm):
- At a speed of 1 800 rpm
- At a speed of 3 000 rpm
- At a speed of 6 000 rpm
- At a speed of 10 000 rpm
For each speed 5 tests are performed as minimum requirement. The results are given in the Table 2.
Table 2Speed 1 800 rpm 3 000 rpm 6 000 rpm 10 000 rpm
EfficiencyA-EI [%]
Test 1 87.70 89.93 84.89 74.50Test 2 88.23 90.46 85.40 74.95Test 3 87.53 89.75 84.72 74.35Test 4 88.05 90.28 85.23 74.80Test 5 88.14 90.37 85.31 74.87
Arithmetic mean [%] 87.93 90.16 85.11 74.70Standard deviation of arithmetic means [%] 0.6143 0.614 0.613 0.511
Variation coefficient [%] 0.7 0.7 0.7 0.7
The coefficient of variation of the four datasets is below 1%.
The statistical significance of the arithmetic mean of the datasets is sufficient and no extra measurements are needed.
The efficiency of the alternator is calculated as follows.
ηA−EI=0.25∙ η@1800+0.40∙ η@3 000+0.25∙ η@6 000+0.10 ∙η@10 000
❑❑
Then the standard deviation of the efficiency (ηA−EI) is
❑ηA−EI=√(0.25 ∙ sη A@1 800)
2+(0.40 ∙ sη A@ 3 000)2+(0.25 ∙ sη A@6 000)
2+ (0.10 ∙ sηA@ 10 000)2=¿
❑ηA−EI=0.00
32
Standard deviation of the total CO2 saving (CC O2) (pursuant Equation 4):
❑❑❑❑
❑❑❑❑
=√( ∂ CCO2
∂ ηA−EI∙ sηA−EI)
2
❑❑❑❑
=(❑❑❑❑ )❑❑
❑ ❑❑❑❑ /❑❑❑❑=0.00 gC O2/km
❑❑❑❑
<0.5 gC O2/km
The minimum requirement on data quality is fulfilled
Minimum threshold statistical significance criteria
The requirement that statistical error determined should not be greater than the difference between the total CO2 savings and the minimum threshold is also fulfilled.
MT ≤CC O2−❑❑❑❑
❑❑❑❑
MT❑❑ /❑≤ 2. g C O2 /km−0.0gC O2/km
6.4. Deterioration
The certified CO2 savings of a particular eco-innovation is related to an aged system. The ageing procedure and the criteria to reach the aged condition of the particular technology should be sufficient to reach the aged condition being equivalent to a total vehicle mileage of 160 000 km or, in case of expected exchange of the technology during a vehicle’s lifetime, being equivalent to the innovative technology’s expected lifetime. The use of fixed deterioration factors should not be allowed.
There is no need to age a complete vehicle system. It would also be sufficient to age the specific technology device under realistic conditions. Even time reduced bench testing under tighter conditions (e.g. higher temperatures) could be feasible.
If there is expected to be no deterioration of the eco-innovation with time and mileage, the applicant should demonstrate this by suitable measurements or by sound argumentation (expert’s judgement).
The assessment of the deterioration procedure and the influence of ageing effects to the CO 2 saving effect shall be part of the verification report undertaken by an independent and certified body.
6.5. Interactions
The identification and quantification of interactions with other eco-innovations do not need to be included in the application. The identification and quantification of interaction between eco-innovations have to be performed by an OEM when it applies for a type-approval certificate for a vehicle fitted with more than one eco-innovation.
Where interaction between eco-innovations cannot be ruled out, the manufacturer shall indicate this in the application to the type approval authority and shall provide a report from the independent and certified body on the impact of the interaction on the savings of the eco-innovations in the vehicle (see Article 11(4) of Regulation (EU) No 725/20114 and (EU) No 427/20146).
A decision scheme has been developed by JRC. This decision scheme can be used by the OEMs and the type approval authority to define the CO2 savings of a combination of eco-innovations.
33
6.6. Verification report
The applicant should provide a verification report established by an independent and certified body.
6.6.1. Simplified approach:
If the applicant follows a ‘simplified approach’ as set out in Chap. 6.1, the verification report may be limited to include the testing protocols on the required measurements.
6.6.2. Comprehensive methodology:
The verification report should include a complete scrutiny of the fulfilment of the eligibility criteria and of the suitability of the testing methodology for determining the CO2 savings from the eco-innovation. It should also include a confirmation that the structure of the testing methodology allows an independent verification of the resulting CO2 saving by standard measurement techniques or commercial vehicle modelling software. Where an improved testing methodology is concerned the verification report should specify in whichwhy respects the new methodology is better chosen in contrast to the than an already approved methodology. The verification report should also consider the deterioration effects. If one or more parametric functions have to be applied, the verification report should confirm its suitability and its accuracy.
6.7. Summary of the application
When a complete application has been received by the Commission a summary of the application will be published on the Commission website. This summary is to be prepared by the applicant and should accompany the application. The following items should be included in the summary:
Applicant name
Summary description of the technology
Summary description of the testing methodology or a reference to the ‘simplified approach’ in these Guidelines
Evidence supporting that the innovativeness criterion of less than 3% market penetration set out in Article 2(2)(a) of Regulation (EU) No 725/20114 and (EU) No 427/20146 is met
Evidence supporting that the criterion set out in Article 2(2)(b) of Regulation (EU) No 725/20114 and (EU) No 427/20146 is met
It is important that the applicant indicates clearly which parts of the application should be considered as confidential commercial information and provides the relevant justifications. The testing methodology will however be publicly accessible once the eco-innovation is approved.
34
[7.] DATA SETS FOR SIMPLIFIED TESTING METHODOLOG IES
This chapter contains a collection of data that should could be used as input data for the testing methodologies. The data should be used in the ‘simplified approach’ but can also be used following a ‘comprehensive methodology’.
The data sets represent average values for mean European conditions on an annual time basis. Where technical data vary between different vehicle versions9, a security margin is included in the listed values to ensure that all potential vehicles are covered by the ‘simplified approach’. Another security factor is included where deterioration effects have to be taken into account.
The data sources of the dataset are described in Annex I of this document.
6.8.[7.1.] Efficiencies
6.8.1.[7.1.1.] Efficiency of engine
A reduction of electrical or mechanical power requirement lowers fuel consumption rates and CO 2
emissions. The ‘consumption of effective power’ V Pe describes the reduced fuel consumption with a reduction of required power at a particular point of the engine map and represents the marginal engine’s efficiency. Following the ‘Willans’ approach’, the ‘consumption of effective power’ is nearly constant and almost independent from engine speed at low engine loads.
Type of engine Consumption of effective power V Pe UnitPetrol E0 (V Pe−P) 0.264 l/kWhPetrol E0 Turbo (V Pe−PT ) 0.28 l/kWhDiesel B0 (V Pe−D) 0.22 l/kWhPetrol Hybrid (❑❑) ?? l/kWhPetrol Turbo Hybrid (❑❑) ?? l/kWhDiesel Hybrid (❑❑) ?? l/kWhLPG (V Pe−LPG) 0.342 l/kWhLPG Turbo (V Pe−LPG) 0.363 l/kWhE85 (V Pe−E 85) 0.367 l/kWhE85 Turbo (V Pe−E85) 0.389 l/kWhCNG (G20) (V Pe−NG) 0.259 m3/kWhCNG (G20) Turbo (V Pe−NG) 0.275 m3/kWh
6.8.2.[7.1.2.] Efficiency of alternator
The knowledge about the efficiency of the alternator is essential for the conversion from mechanical into electric power and vice versa:
Type of vehicle Efficiency of alternator (ηA)15
15 Thiese values isare calculated pursuant to the “VDA approach”ISO 8854:2012. Theise values can be used for calculating the effect of new electric devices. It, hHowever, where the technology is fitted on an existing vehicle type, the baseline technology should be the alternator of the most recent version of that type placed on the market.may not be used as a baseline value for the calculation of CO2 savings caused by alternators with improved efficiency. The formula of the VDA-approach is explained in Annex 1 (Data sources of Chapter 7) of this document
35
M1 0.67N1 0.67
6.8.3.[7.1.3.] Electrical solar system efficiency
The conversion of solar radiation into electric energy, the DC-DC transformation, the storage in a battery and the use by an electrical consumer is linked with energy losses:
Component EfficiencyDC/DC-converter (to 12V16 0.92DC/DC-converter (to 48V) ??Battery (charge and discharge) 0.94Temperature, reflection and deterioration effects 0.88Total solar system (ηSS)17 0.76
6.9.[7.2.] Driving cycle characteristics
Cycle Distance [km] Duration [s] Mean speed [km/h]UDC 4 052 780 18.70EUDC 6 955 400 62.60NEDC 11 007 1 180 33.58
6.10.[7.3.] Fuel characteristics
6.10.1.[7.3.1.] Fuel densities
Type of fuel Density at 15 °C[kg/m3]
Petrol E0 743Diesel B0 833LPG 550CNG 0.790E85 786
16 The value is valid in the range of 12V to 48V (secondary)17 The total efficiency of the solar system does not include the efficiency of the PV cells which is already covered by
the PV peak power value
36
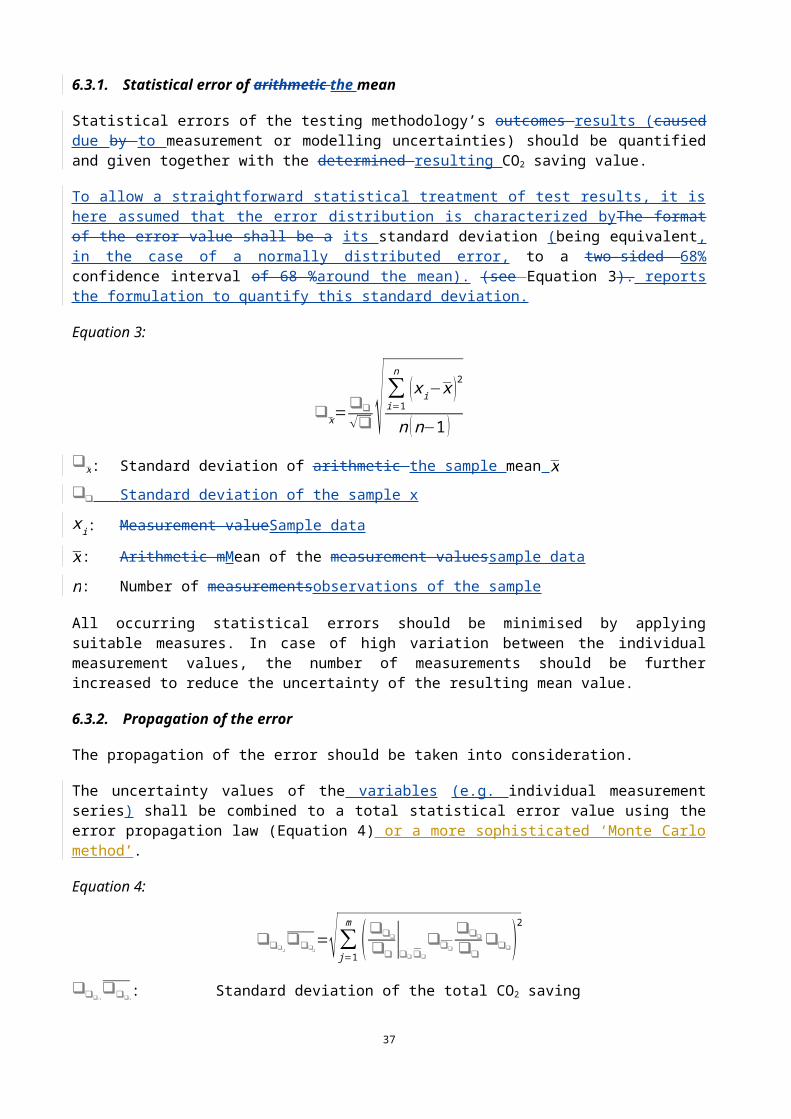
6.10.2.[7.3.2.] Conversion fuel consumption – CO2 emission
Type of fuel
Conversion factor(l/100 km) → (g CO2/km)
[100 g CO2/l] [g CO2/l]Petrol E0 23.3 2330Diesel B0 26.4 2640LPG 16.3 1629E85 16.6 1657
[100 g CO2/m3] [g CO2/m3]CNG (G20) 18.0 1795
6.11.[7.4.] Usage factors
If a technology is not activated to full extent during the whole time of vehicle’s operation, a usage factor UF should be applied to the measured or modelled results of CO2 savings:
6.11.1.[7.4.1.] M1 Vehicle lighting
Type of lighting Usage factorLow beam headlamp 0.33High beam headlamp 0.03Daytime running light (DRL)18 --Front position 0.36Fog – front 0.01Turn signal - front 0.15Turn signal - side 0.15Centre High-Mount Stop Light (CHMSL)19 --Rear position 0.36Stop19 --Fog – rear 0.01Turn signal – rear 0.15License plate 0.36Reversing 0.01
[7.4.2.] N1 Vehicle lighting
– Type of lighting – Usage factor
18 DRL is mandatory for newly type-approved M1 and N1 vehicles since 7 February 2011 (Directive 2008/89/EC and Annex III to Regulation (EC) No 692/2008). DRL is automatically activated with running engine. Potential improvements of DRL technologies are therefore fully covered by the type approval measurements and cannot qualify for an eco-innovation.
19 The temporal share of deceleration phases during the NEDC amounts to 15.1% in relation to roughly 11% of braking during ‘real-world’ conditions. Potential improvements of brake lights technologies are therefore fully covered by the type approval measurements and cannot qualify for an eco-innovation.
37
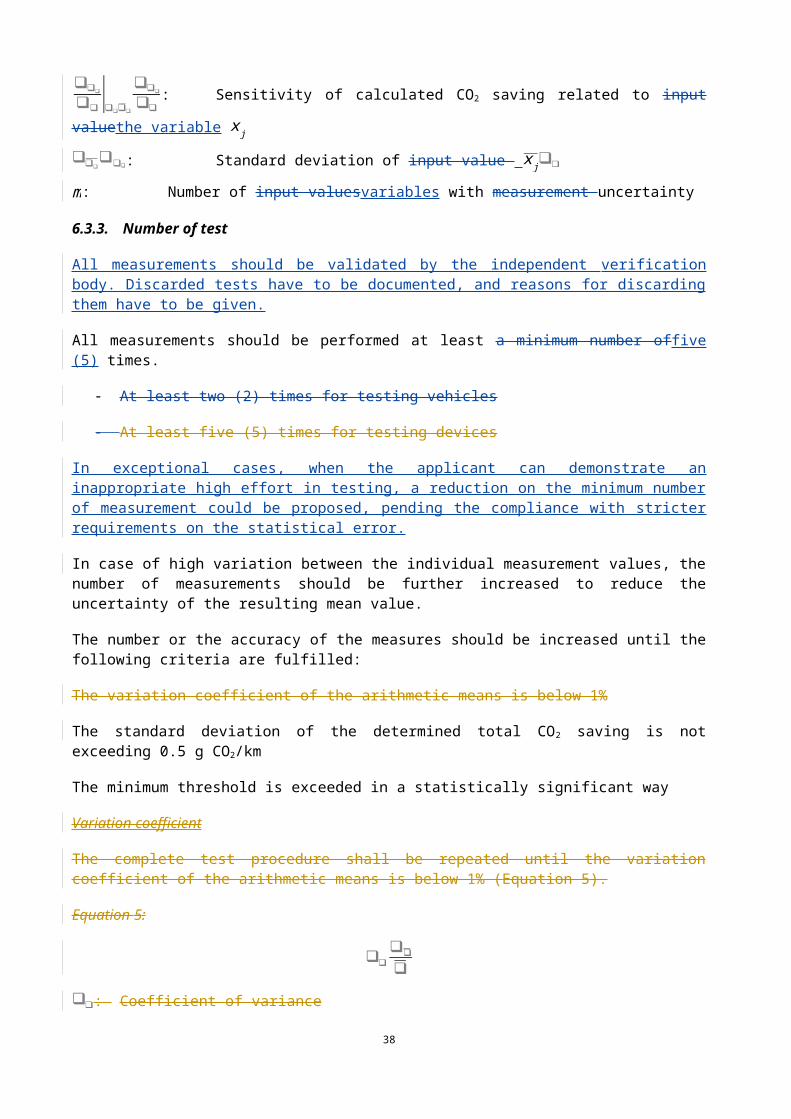
– Low beam headlamp – ??
– High beam headlamp – ??
– Daytime running light (DRL)18 – --
– Front position – ??
– Fog – front – ??
– Turn signal - front – ??
– Turn signal - side – ??
– Centre High-Mount Stop Light (CHMSL)19 – --
– Rear position – ??
– Stop19 – --
– Fog – rear – ??
– Turn signal – rear – ??
– License plate – ??
– Reversing – ??
–
[7.4.3.] Shading of solar panels
Vehicles equipped with photovoltaic panels may be shaded by buildings, trees, garages, etc. Hence, the maximum amount of solar radiation cannot be achieved. In this case the usage factor is: (1 – share of shading).
Type of vehicle Irradiation of solar panelsUsage Factor
M1 (UF IR−M 1) 20 0.51
6.11.2.[7.4.4.] Windscreen wipers
Type of vehicle Speed of wiper motor Usage factor
M1 (UFwm−M 1)low speed (front wiper) 0.08high speed (front wiper) 0.02
20 This usage factor is based on research done by the JRC in September 2012. It consists of two parts: 1. Average shading during parking 57% 2. Average shading during driving 20%
38
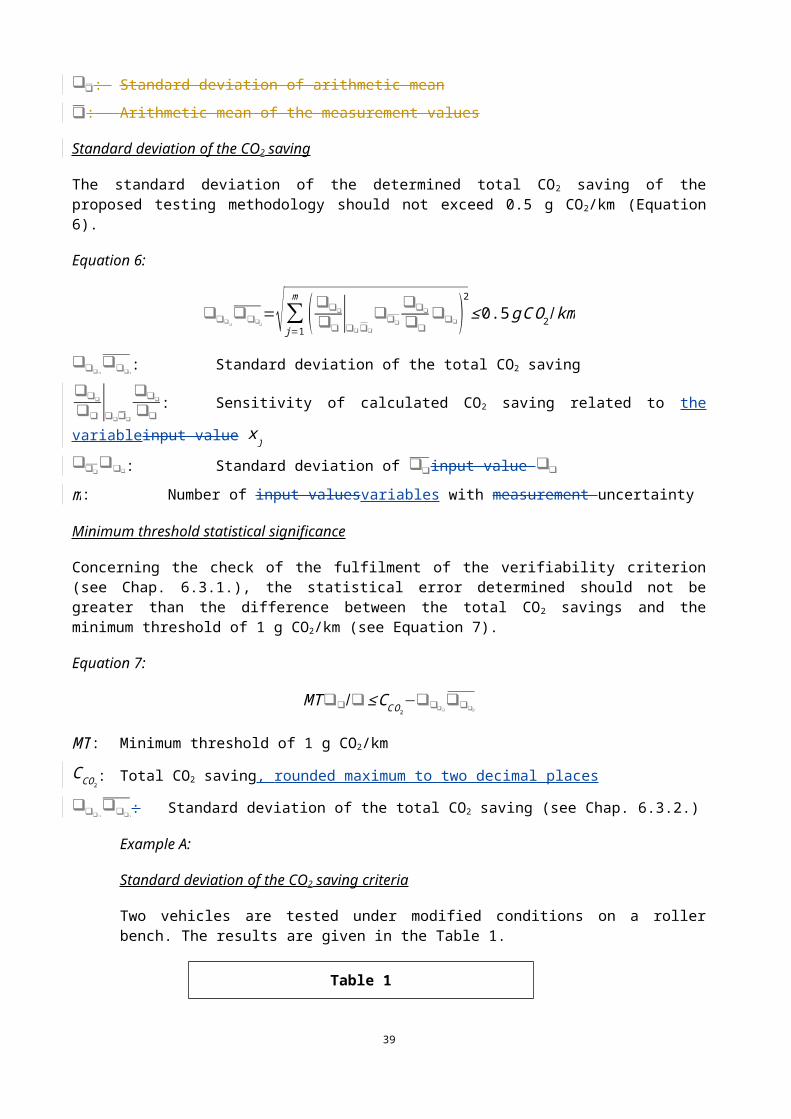
6.12.[7.5.] Power requirements of lighting types
6.12.1.[7.5.1.] Halogen tungsten
Type of lighting Numberof lights
Halogen tungstenNominal power
per light[W] (12 V)
Total electricpower
[W] (13.4 V)
Low beam headlamp 2 55 137High beam headlamp 2 60 150Daytime running light (DRL)18 2 21 52Front position 2 5 12Fog – front 2 55 124Turn signal – front 221 21 1322
Turn signal – side 222 5 323
Centre High-Mount Stop Light (CHMSL)19 3 5 19Rear position 2 5 12Stop 19 2 21 52Fog – rear 1 21 26Turn signal – rear 222 21 1323
License plate 2 5 12Reversing 2 21 52
[7.5.2.] Xenon gas discharge23
Type of lighting Numberof lights
Xenon high intensity gas discharge (HID)Power perlight [W]
Electronicdriver [W]
Total electricpower [W]
Low / high beam “Xenon 35 W” 2 35 5 80Low / high beam “new Xenon 25 W” 2 25 5 60
6.13.[7.6.] Emissions due to extra weight
The CO2 correction coefficient due to the extra mass of the eco-innovative technology and, where applicable, the additional components needed.
Type of fuel CO2 correction coefficientdue to the extra mass [g CO2/km kg]24
Petrol E0 0.0277Diesel B0 0.0383
21 Only one side activated22 Assuming a 50/50 flashing cycle23 The figures in this table are based on input from CLEPA Light Sight Safety given in December 201224 There are uncertainties around these values, therefore the values might be revised in the future
39
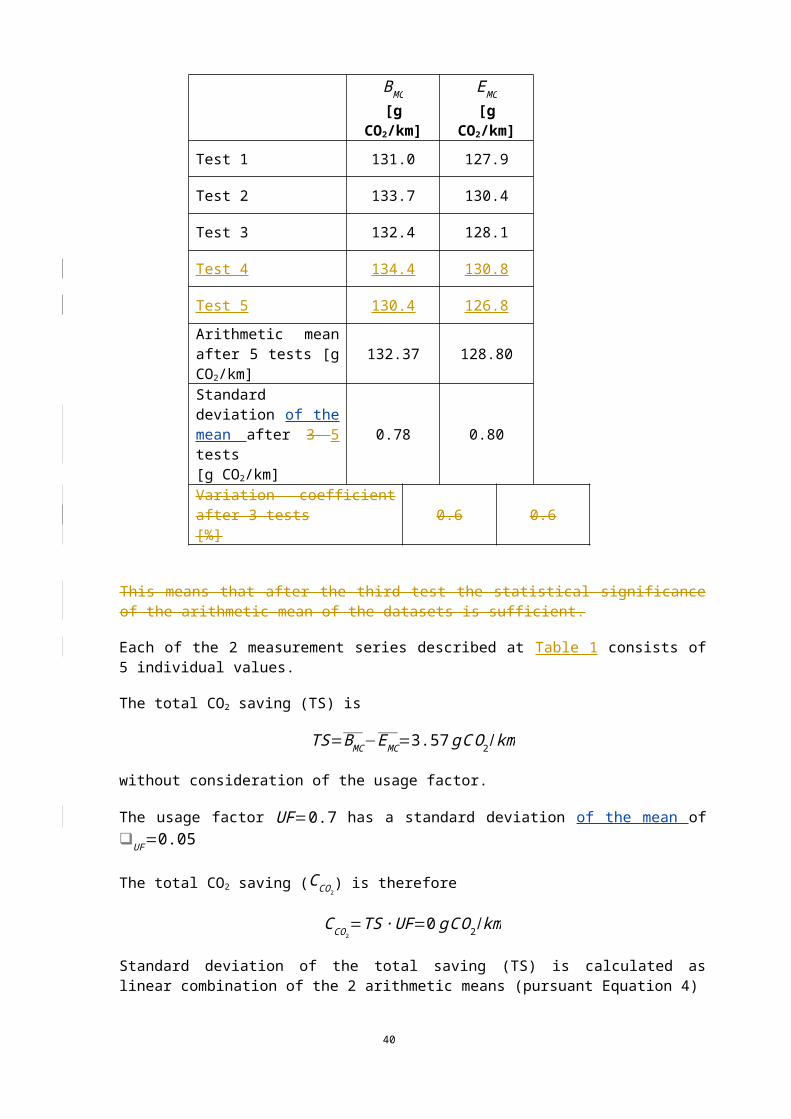
6.14.[7.7.] Total electric power requirements
The vehicle’s total electric power requirement during the NEDC testing under type-approval conditions differs from that one of averaged “real-word” driving.
Driving condition Type of vehicle Total electricpower requirement [W]
Type-approval NEDC25M1 (PTA−M1) 350N1 (PTA−N 1) 350
Real-world drivingM1 (PRW−M 1) 750N1 ¿¿) 750
6.15.[7.8.] Solar radiation
6.15.1.[7.8.1.] Solar radiation in Europe
Applications for technologies converting solar radiation into usable electric energy may use a uniform value. The annual average horizontal solar radiation for Europe on the earth’s surface is:
Solar irradiation in Europe [W/m2] (PSR)26 120
6.15.2.[7.8.2.] Solar correction coefficient
The gain of additional electric power depends on the electric on-board storage capacity. If the reserved capacity in the battery system on sunny and clear summer days is below 8 Wh (or 0.666 Ah for a 12V battery system) per Watt peak power of the PV panel, the arising solar radiation arising on sunny and clear summer days cannot be used completely because of fully charged batteries. In this case a correction coefficient has to be applied to derive the usable share of the incoming solar energy. For ratios between the given data points in the table below, the solar correction coefficient can be determined by linear interpolation.
Total storage capacity battery system ❑❑) /PV peak power (PP) [Wh/Wp]
1.2 2.4 3.6 4.8 6.0 7.2 > 8
Total storage capacity 12 V battery system ¿❑❑) /PV peak power (PP) [Ah/Wp]27
0.10 0.20 0.30 0.40 0.50 0.60 > 0.666
Solar correction coefficient (SCC) 0.481 0.656 0.784 0.873 0.934 0.977 1
6.16.[7.9.] Ambient temperature
The mean ambient air temperature in Europe is calculated considering the distribution of the cars on the European land surface and the car density of the Member States.25 All switchable electrical consumers off26 This minimum value covers more than 80 % of the population of the EU-27 countries27 The total storage capacity includes a mean usable storage capacity of the starter battery of 10 Ah (12 V). All
values refer to a mean annual solar radiation of 120 W/m2, a shading share of 0.49 and a mean vehicle driving time of 1 hour per day at 750 W electric power requirement
40
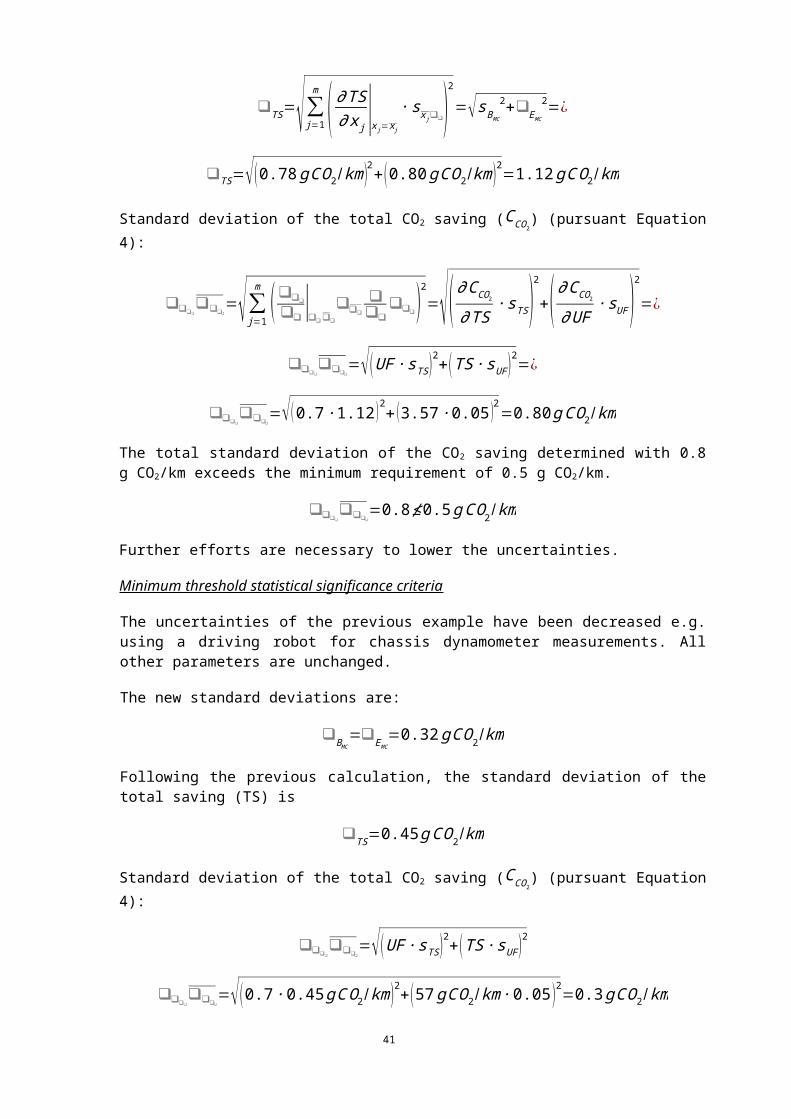
Since the temperature encountered by vehicles is dependent on their use, two main vehicle statuses are defined: driving time and parking time.
Driving ambient temperature
The value for the mean ambient air temperature during driving time includes a security margin to cover uncertainties caused by regional differences in ambient temperatures and in the driving distribution over the day.
Mean annual ambient air temperature in Europeduring driving time for M1 vehicles [°C] (T Adt−M 1)
12
Mean monthly ambient air temperature in Europeduring driving time for M1 vehicles [°C] (T Mdt−M 1)
January February March April May June3 3 7 12 15 19
July August September October November December22 21 17 13 8 4
Parking ambient temperature
The value for the mean ambient air temperature during parking time includes a security margin to cover uncertainties caused by regional differences of ambient temperatures, parking distribution over the day and share of vehicles parked inside garages at higher temperatures.
Mean annual ambient air temperature in Europeduring parking time for M1 vehicles[°C] (T Apt−M 1)
14
6.17.[7.10.] Parking time distribution
M1 vehicles
Parking times [h]< 1 1-2 2-3 3-4 4-5 5-6 6-7 7-8 8-9 9-10 10-11 11-12
Share ofvehicle stops[%] (SVS)
36 13 6 4 2 2 1 1 3 4 3 1
Parking times [h]12-13 13-14 14-15 15-16 16-17 17-18 18-19 19-20 20-21 21-22 22-23 23-24
Share ofvehicle stops[%] (SVS)
1 3 3 2 1 1 1 1 1 1 1 1
(> 24 h: 7 %)
41
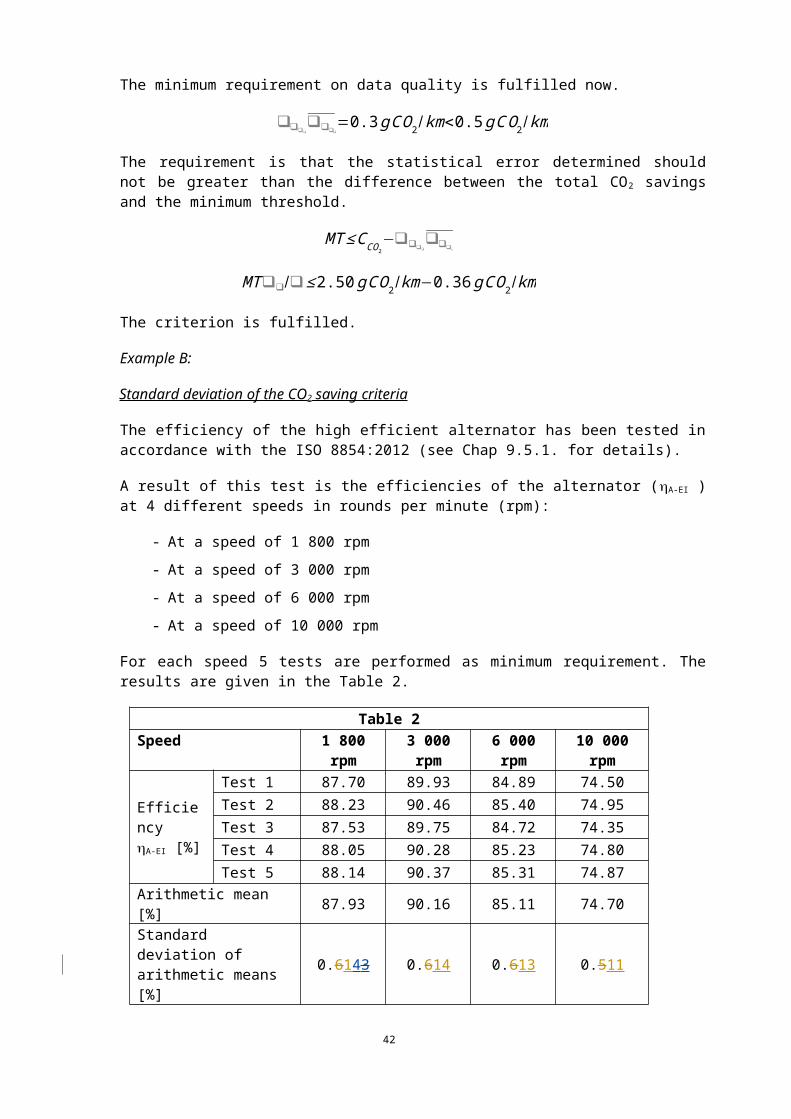
6.18.[7.11.] Mileages
The mean annual driven mileages for passenger cars in Europe (EU-27) are:
Type of vehicle Type of fuel Mean annual mileage[km/y]
M1Petrol (M P−M 1) 12 700Diesel (M D−M 1) 17 000LPG (M LPG−M 1) 22 300
6.19.[7.12.] Road roughness
The road roughness coefficients for the road classes from A to C
Road class Road roughness coefficient (Gr)[m∙cycle]
A 4 ∙10−7
B 16 ∙ 10−7
C 64 ∙ 10−7
6.20.[7.13.] Stiffness of one tire
The average stiffness of one tire
Type of vehicle Stiffness (k1)[N/m]
M1 200 000N1 300 000
42
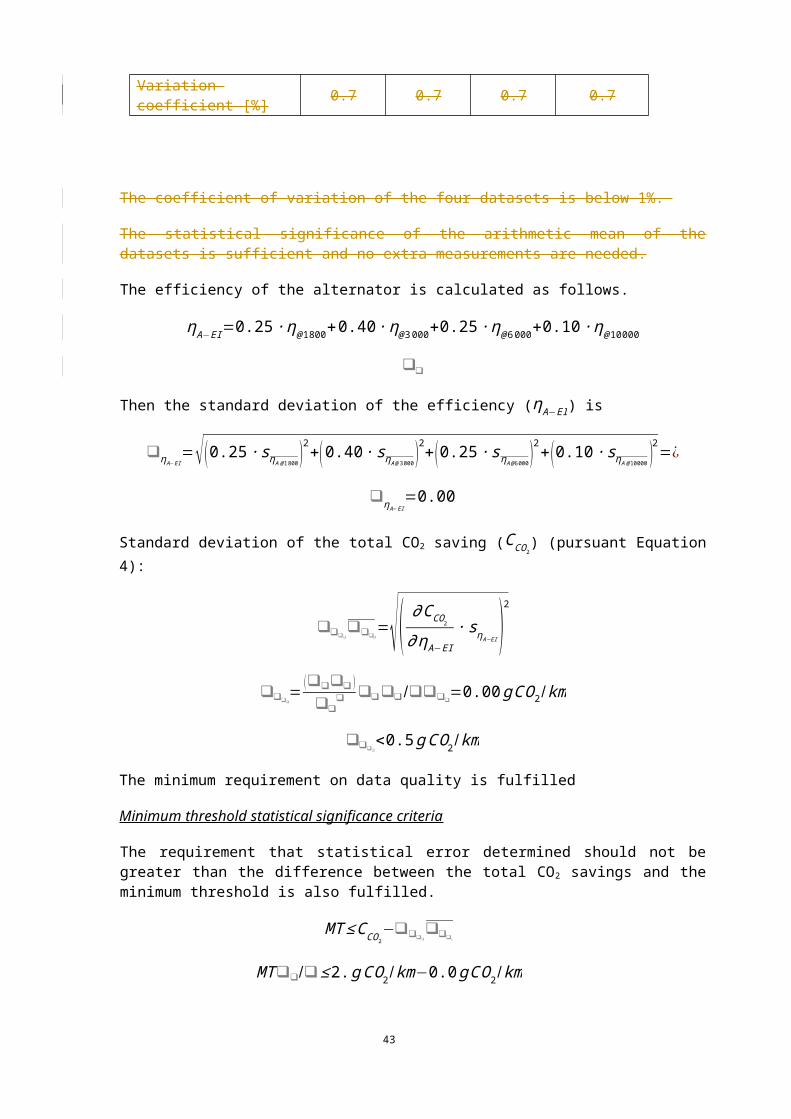
7.[8.] QUALIFICATION OF TECHNOLOGIES
In the following, a first, preliminary and not binding, assessment on the potential qualification of vehicle technologies as ‘eco-innovation’ is given. ‘Potentially qualifying’ technologies may be linked to certain conditions that are cited in the table in Chap. 8.1. If a technology is assessed as ‘potentially non-qualifying’, the reasons for this assessment are cited in the table in Chap. 8.2.
7.1.[8.1.] Potentially qualifying technologies
No. Technology Technologyclass Conditions
Q01 LED exterior lighting 1 Also packaging of different lighting types will fulfil ‘verifiability’ criterion
Q02 Battery charging solar roof 3Q03 Engine heat storage 4
Q05 Predictive energy management 5
Q06 Thermoelectric generator 6 Coverage criterion to be fulfilledQ07 Efficient alternator 7 Verifiability criterion to be fulfilled
7.2.[8.2.] Potentially non-qualifying technologies
No. TechnologyTechnolog
yclass
Reasons for non-qualification
N01 Recuperation 7 2.2 - ‘Innovativeness’ criterion not fulfilledN02 Efficient seat heating 1 2.3 - ‘Necessity’ criterion not fulfilledN03 Efficient HiFi system 1 2.3 - ‘Necessity’ criterion not fulfilledN04 Efficient PTC cabin heater 1 2.3 - ‘Necessity’ criterion not fulfilledN05 Efficient cabin lighting 1 2.4 - ‘Verifiability criterion not fulfilledN06 Efficient wiper motor 1 2.4 - ‘Verifiability criterion not fulfilledN07 Start/Stop system 8 2.5 - ‘Coverage’ criterion not fulfilledN08 Electronic valve gear 2 2.5 - ‘Coverage’ criterion not fulfilledN09 Flywheel 5 2.5 - ‘Coverage’ criterion not fulfilledN10 Eco-driving mode 8 2.6 - ‘Accountability’ criterion not fulfilled
N11 Gear shift indicator 8 2.1 - ‘Integrated approach measure’ +2.6 - ‘Accountability’ criterion not fulfilled
N12 Efficient air-conditioning system 2 2.1 - ‘Integrated approach measure’ +2.3 - ‘Necessity’ criterion not fulfilled
N13 Tyre pressure monitor 2 2.1 - ‘Integrated approach measure’ +2.6 - ‘Accountability’ criterion not fulfilled
N14 Low rolling resistance tyres 2 2.1 - ‘Integrated approach measure’ +2.5 - ‘Coverage’ criterion not fulfilled
N15 Daytime running lights (DRL) 1 2.5 - ‘Coverage’ criterion not fulfilledN16 Brake lights 1 2.5 - ‘Coverage’ criterion not fulfilled
43
8.[9.] EXAMPLES
In this chapter some calculation examples are provided following the ‘simplified approach’ or the ‘comprehensive methodology’.
They examples give advice to potential applicants on extent and level of detail of the submitted documents for individual technologies and on the calculation procedure. They are not exhaustively including all the required information and data.
The list of technologies currently cited is not finalised, and covers technologies that are already approved.
Generic data being defined in Chap. 7 is used here.
All data used for the following examples being not included in Chap. 7 must be seen as purely arbitrary. The values might not be taken for the applications. Instead, profound data justified by measurements or from other reliable sources has to be used.
8.1.[9.1.] Class 1 – Improved electrical components
8.1.1.[9.1.1.] Efficient wiper motor
Introduction
In this example an efficient wiper motor has been considered.
Technical description of the innovative technology
Technical description of the eco-innovation and the way it is fitted on a vehicle in words and, when appropriate, illustrated technical drawings.
# TO INSERT HERE: applicant provides technical description of the measures appliedtechnology including technical drawings
Innovativeness
The market share of the innovative technology does not exceed 3 % in the reference year 2009.
# TO INSERT HERE: applicant provides proving documents and/or data or an expert judgement on the market share of the innovative technology in the reference year.
Market Vehicle S s egment prediction
Prediction on which vehicle segments the eco-innovation will be applied.
# TO INSERT HERE: applicant provides an estimate
Expected number of vehicles
Expected number of vehicles per vehicle segment equipped with the particular eco-innovation coming to the market with expected timescale.The expected up-take of the innovative technology in different segments
# TO INSERT HERE: applicant provides an estimate
Definition of the baseline technology
44
The baseline wiper motor with the highest market penetration in the reference year is:
# TO INSERT HERE: applicant provides label and short technical description of the baseline technology
# TO INSERT HERE: applicant provides proving documents and/or data or an expert judgement on the market share of the baseline technology in the reference year.
Example
The electric power requirement of the fitted baseline wiper motor (operated at low power level) is:
PLbase=100 W
The electric power requirement of the fitted baseline wiper motor (operated at high power level) is:
PHbase=150 W
Calculation procedure Testing methodology
Procedure
Measurements are to be performed using a power supply unit and multi meters to measure the DC-current and the DC-voltage.
# TO INSERT HERE: applicant provides the description of the methodology to evaluate the power consumption of the technology.
In total 5 measurements is to be done with the defined voltages.
# TO INSERT HERE: applicant provides the vehicle working voltages.
Calculation of the power savings
For each of the 5 measurements the power which is used is to be calculated by multiplying the installed voltage with the measured current. This will result in 5 values. Each value must be expressed in 4 decimals. Then the mean value of the used power will be calculated, which is the sum of the 5 values for the power divided by 5.
The resulting power savings are to be calculated with the following formula:
Equation 8
❑❑❑❑
: Saved electrical power [W]
❑❑: Power of the baseline [W]
❑❑: Mean value of the used power of the eco-innovation [W]
Calculation of the CO2 savings
The total CO2 savings of the wiper motor are to be calculated using the following equations.
For petrol-fuelled vehicle:
45
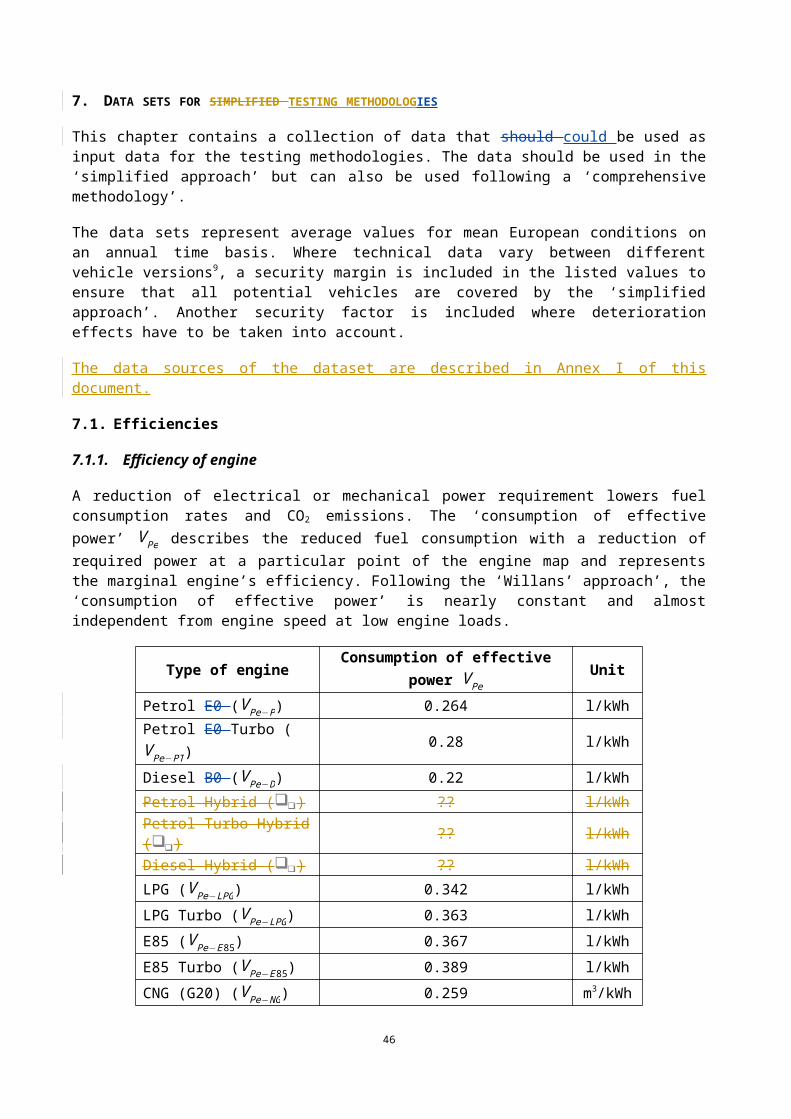
Equation 9
CC O2=(∆ PL ∙ UFL+∆ PH ∙UFH ) ∙ V Pe−P/ηA ∙CF P/v
For Diesel-fuelled vehicle:
Equation 10
CC O2=(∆ PL ∙ UFL+∆ PH ∙ UFH ) ∙ V Pe−D /η A∙ CFD/ v
∆ PL: Saved electric power at low power level [W]
∆ PH: Saved electric power at high power level [W]
UF L: Usage factor at low power level [-]
UF H: Usage factor at high power level [-]
v: Mean driving speed of the NEDC (see Chap. 7.2) [km /h]
V Pe−P: Consumption of effective power for petrol-driven vehicles [l /kWh]
V Pe−D: Consumption of effective power for Diesel-driven vehicles [l /kWh]
ηA: Efficiency of the alternator [-]
CFP: Conversion factor (l/100 km) - (g CO2/km) for petrol fuel [gC O2/ l]
CFD: Conversion factor (l/100 km) - (g CO2/km) for Diesel fuel [gC O2/ l]
Calculation of the statistical error
The standard deviation of the CO2 savings is to be calculated by means of the following equations.
# TO INSERT HERE: applicant provides the description of the methodology to quantify the statistical errors following the procedure described in Chap. 6.3.
Description of the case study
# TO INSERT HERE: applicant provides short technical description of the case study.
Application of the testing methodology
Example
The electric power requirement of the fitted innovative wiper motor (operated at low power level) is:
PLeco=50W
The electric power requirement of the fitted innovative wiper motor (operated at high power level) is:
PHeco=75 W
The electric power requirement is not varying between different vehicle versions.
# TO INSERT HERE: applicant provides technical explanation
46
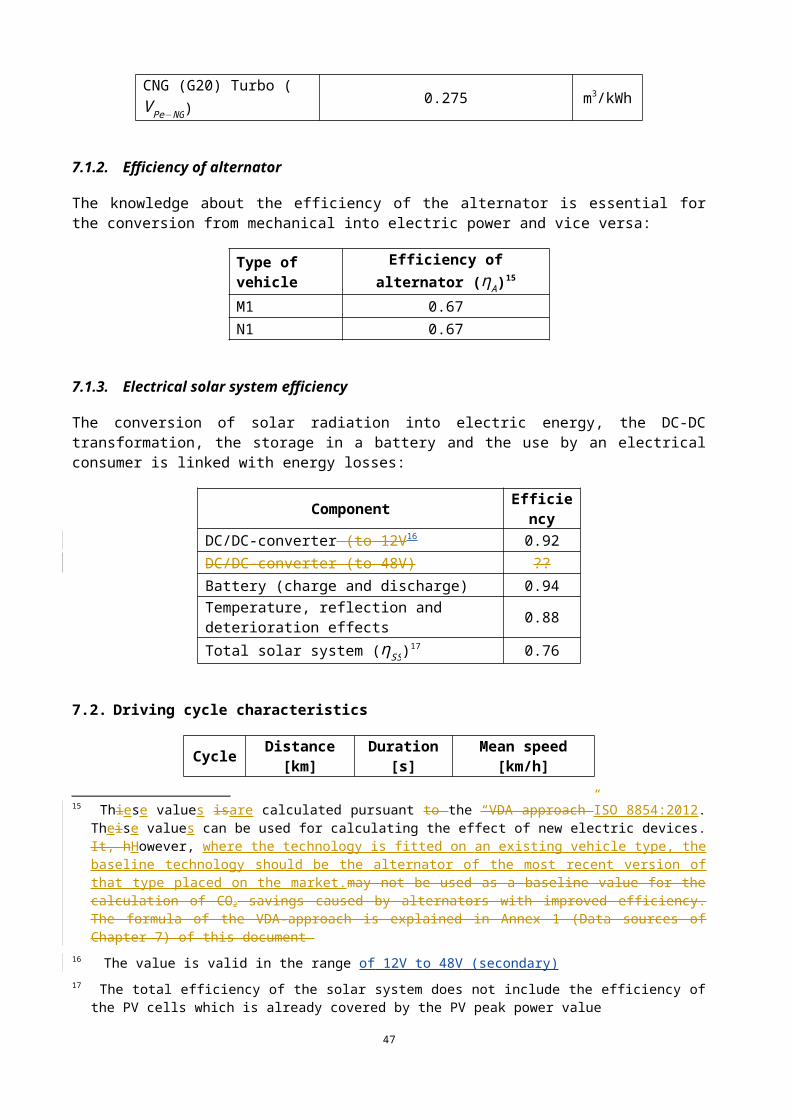
Input data:
∆ PL=PLbase−PL
eco=100 W−50 W=50W
∆ PH=PHbase−PH
eco=150W−75 W=75 W
UF L=0.08 (see Chap. 7.4.4)
UF H=0.02 (see Chap. 7.4.4)
v=33.58 km /h (see Chap. 7.2)
V Pe−P=0.264 l /kWh (see Chap. 7.1.1)
ηA=0.67 (see Chap. 7.1.2)
CFP=2330 gC O2/ l (see Chap. 7.3.2)
Calculation of the CO2 saving per petrol-engine vehicle:
CC O2=(∆ PL ∙ UFL+∆ PH ∙UFH ) ∙ V Pe−P/ηA ∙CF P/v
CC O2=(50W∙0.08+75 W ∙0.02 )∙ 0.264 l /kWh
0.67∙
2330 gC O2/ l33.58 km /h
=0.1504 gC O2 /km
Result, rounded to one decimal place:
CC O2=0.2 gC O2 /km
# TO INSERT HERE: applicant provides the evaluation of the data quality and of the uncertainties following the procedure described in Chap. 6.3.
Check of eligibility criteria
Non-exceeding requirements in EU law:
Currently there is no legislation about CO2 saving requirements on wiper motors.FULFILLED
Innovativeness:
It has been demonstrated that the market penetration of the eco-innovation technology does not exceed 3 % in the reference year.
FULFILLED
Necessity:
Windscreen wipers are essential for the safe operation of the vehicle (no further documents necessary)FULFILLED
Verifiability:
The rounded (maximum to two decimal places)unrounded CO2 saving of the eco-innovation technology of 0.1504 g CO2/km, subtracted by its standard deviation, does not exceed the minimum threshold of 1 g CO2/km.
NOT FULFILLED
Coverage:
47
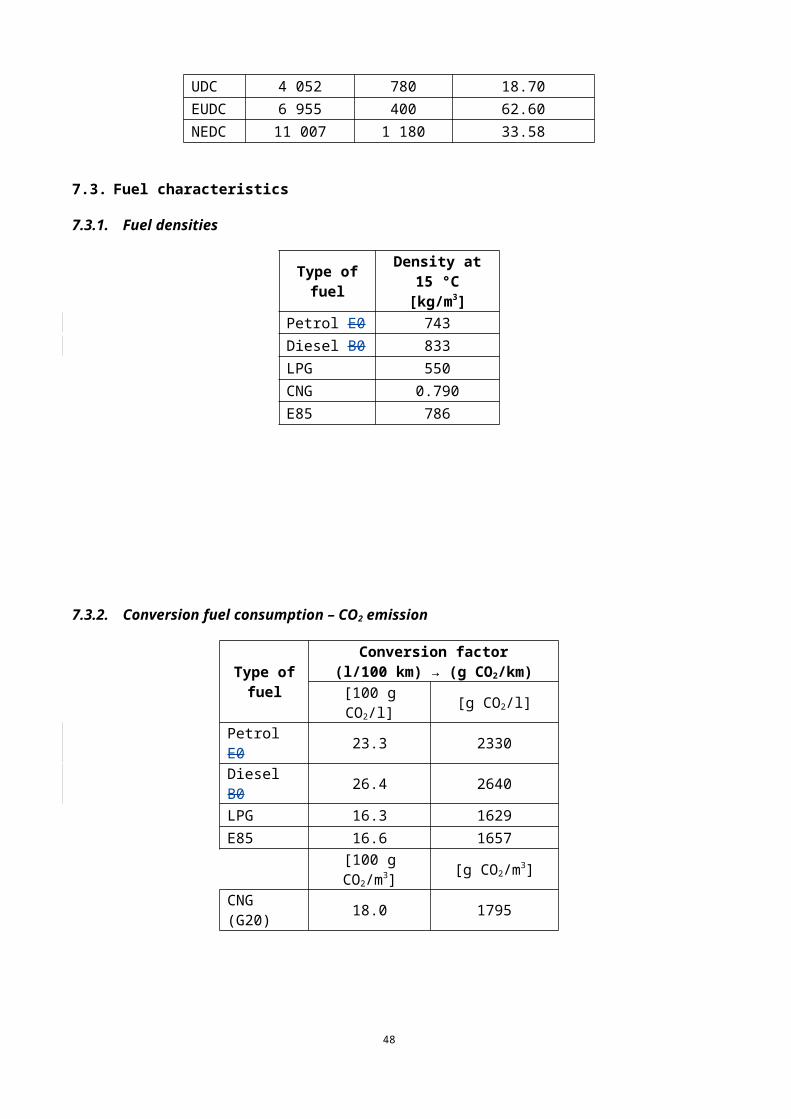
The eco-innovation technology is not covered by the CO2 type approval test procedure, since the activation of windscreen wipers is not included in the current CO2 type approval test procedure.
FULFILLED
Accountability:
Windscreen wipers are under the influence of the driver’s choice, but they belong to devices which have to be activated because of changing ambient conditions (rainfall) to ensure a safe operation of the vehicle.
FULFILLED
Total result
In this example, the application cannot be granted because of non-compliance with the ‘verifiability’ criteria.
8.1.2.[9.1.2.] LED exterior lighting
Introduction
In this example an efficient exterior lighting system has been considered.
LED exterior lighting systems have been approved as eco-innovations by Commission Decisions 2013/128/EU28, and 2014/128/EU29 and 2015/20630.
LED is an abbreviation of Light-Emitting Diode. It consists of semiconductors. When direct current (DC) is connected to these semiconductors light is produced. The efficacy of the lighting source is expressed in lm/W indicating the amount of produced luminous flux per used electric power.
In the table below the efficacy of some light sources31 are given.
Light sources Lumen/WattTungsten light bulb 15Tungsten/halogen 35Arc xenon 50-55LED 101.9Theoretical limit (white LED with phosphorescence colour mixing) 260–300
Technical description of the innovative technology
For different types of exterior lighting the baseline halogen tungsten lamps are replaced by LED lamps. The combination of different lighting types is considered as a ‘technology package’.
28 Commission Implementing Decision 2013/128/EU:: http://europa.eu/!Ch46gt 29 Commission Implementing Decision 2014/128/EU:: http://europa.eu/!CU64Wd 30 Commission Implementing Decision 2015/206: http://europa.eu/!kx66Gw 31 Luminous efficacy:: http://en.wikipedia.org/wiki/Luminous_efficacy
48
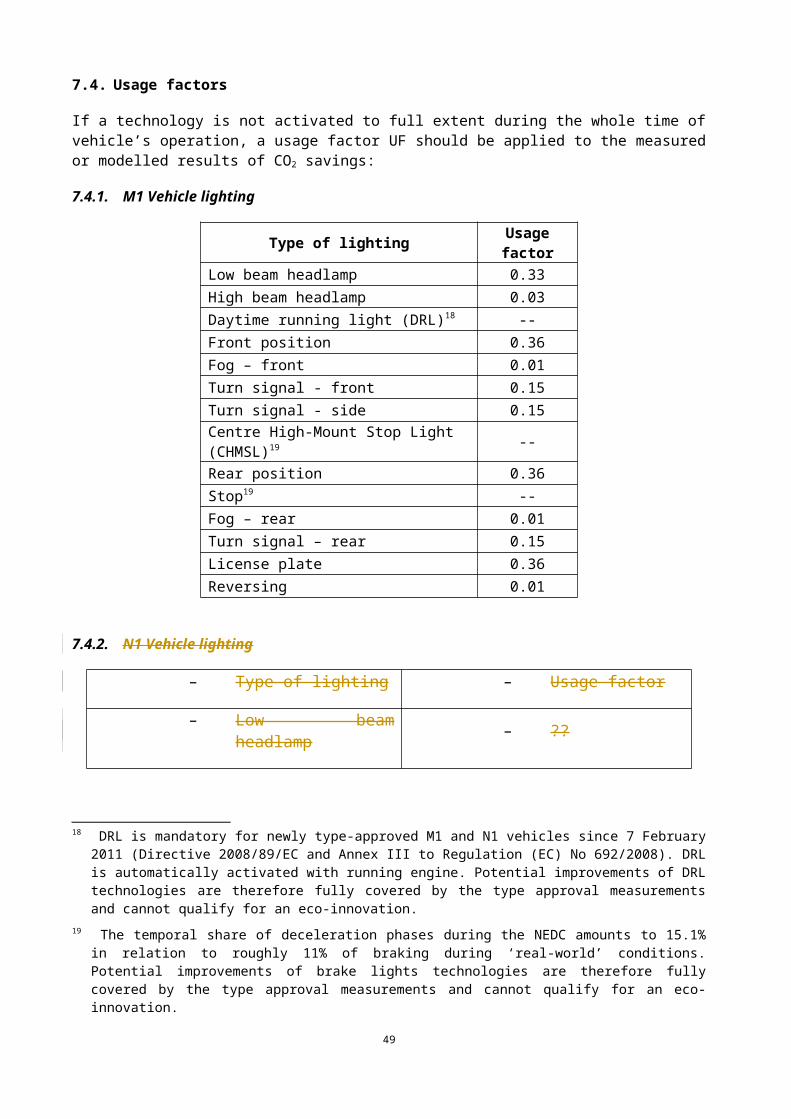
Daytime running lights (DRL) cannot be included in such a package since they became mandatory for newly type-approved M1 and N1 vehicles on 7 February 2011 (see Directive 2008/89/EC32). Therefore DRL are fully covered by type approval measurements and do not qualify for an innovative technology.
Brake lights cannot be included since their temporal share of activation during the NEDC fully covers the average use during on-road operation.
# TO INSERT HERE: applicant provides technical description and technical drawings
Innovativeness
The market share of the innovative technology does not exceed 3 % in the reference year 2009.
Example:
In order to determine the market penetration of LED lights, a reference is the CLEPA Light Sight Safety14 initiative. As part of that initiative, suppliers of headlamps and rear lamps have individually estimated the penetration rates of innovative technologies in the different lighting applications, based on production in figures the EU for the year 2009.
Type of lighting Estimated Fitting rate(new cars, EU 2009)
Low beam headlamp <1%High beam headlamp <1%Front position ~2%Fog – front <1%Turn signal - front <2%Fog – rear <1%Turn signal – rear ~3%License plate <1%Reversing <1%
Vehicle segment prediction
Prediction on which vehicle segments the eco-innovation will be applied.
# TO INSERT HERE: applicant provides an estimate
Expected number of vehicles
Expected number of vehicles per vehicle segment equipped with the particular eco-innovation coming to the market with expected timescale.
# TO INSERT HERE: applicant provides an estimate
The expected up-take of the innovative technology in different segments
# TO INSERT HERE: applicant provides an estimate
Definition of the baseline technology
The baseline lighting technology with the highest market penetration in the reference year is:
32 Directive 2008/89/EC: http://europa.eu/!rW96Yv
49
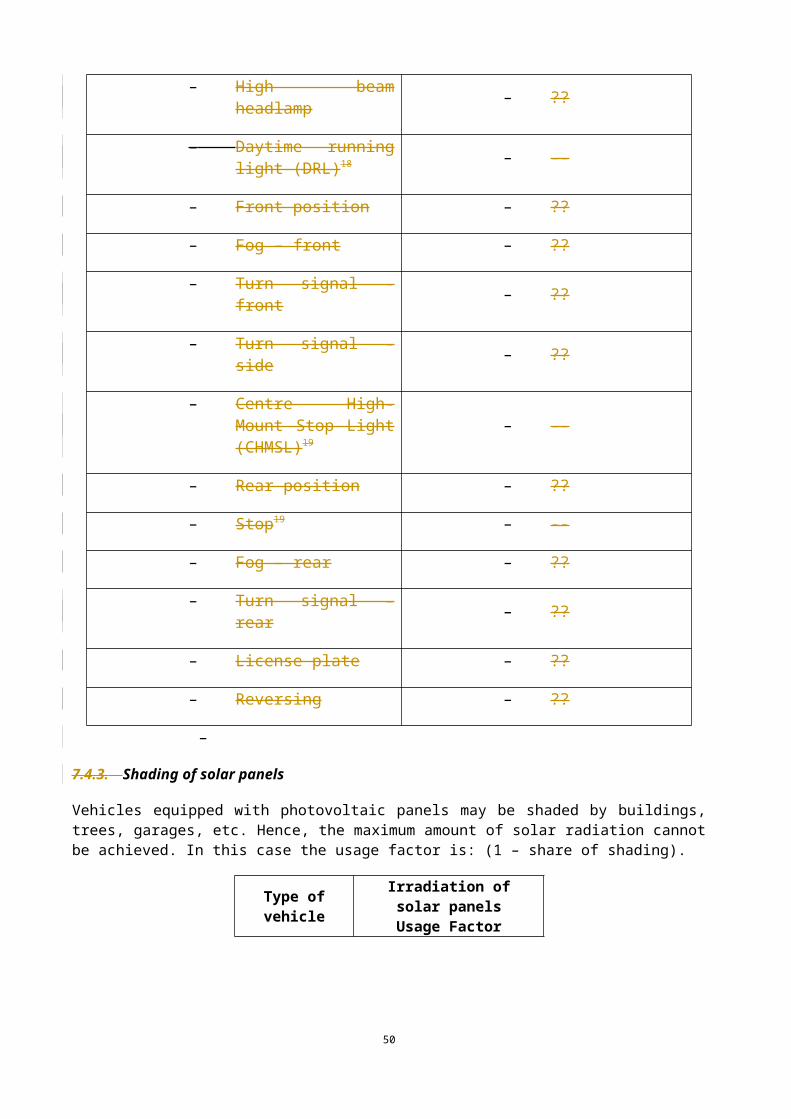
# TO INSERT HERE: applicant provides label and short technical description of the baseline technology for each type of lighting.
The electric power requirements of the fitted baseline technologies related to an on-board voltage of 13.4 V are (see Chap. 7.5):
Type of lighting Electric power [W]Low beam headlamp 137High beam headlamp 150Front position 12Fog – front 124Turn signal - front 13Fog – rear 26Turn signal – rear 13License plate 12Reversing 52
Testing methodology
Conditions
The requirements of UN/ECE Regulation No 11233 (1) on Uniform provisions concerning the approval of motor vehicle headlamps emitting an asymmetrical passing beam or a driving beam or both and equipped with filament lamps and/or light-emitting diode (LED) modules shall apply. For determining the power consumption, the reference is to be made to point 6.1.4 of Regulation No 112, and points 3.2.1 and 3.2.2 of Annex 10 of Regulation No 112.
Procedure
Measurements are to be performed using a power supply unit and multi meters to measure the DC-current and the DC-voltage.
In total 5 measurements is to be done with the defined voltages.
# TO INSERT HERE: applicant provides the vehicle working voltages .
Calculation of the power savings
For each of the 5 measurements the power which is used is to be calculated by multiplying the installed voltage with the measured current. This will result in 5 values. Then the mean value of the used power will be calculated, which is the sum of the 5 values for the power divided by 5.
The resulting power savings are to be calculated with the following equation.
33 E/ECE/324/Rev.2/Add.111/Rev.3 — E/ECE/TRANS/505/Rev.2/Add.111/Rev.3, 9 January 2013
50
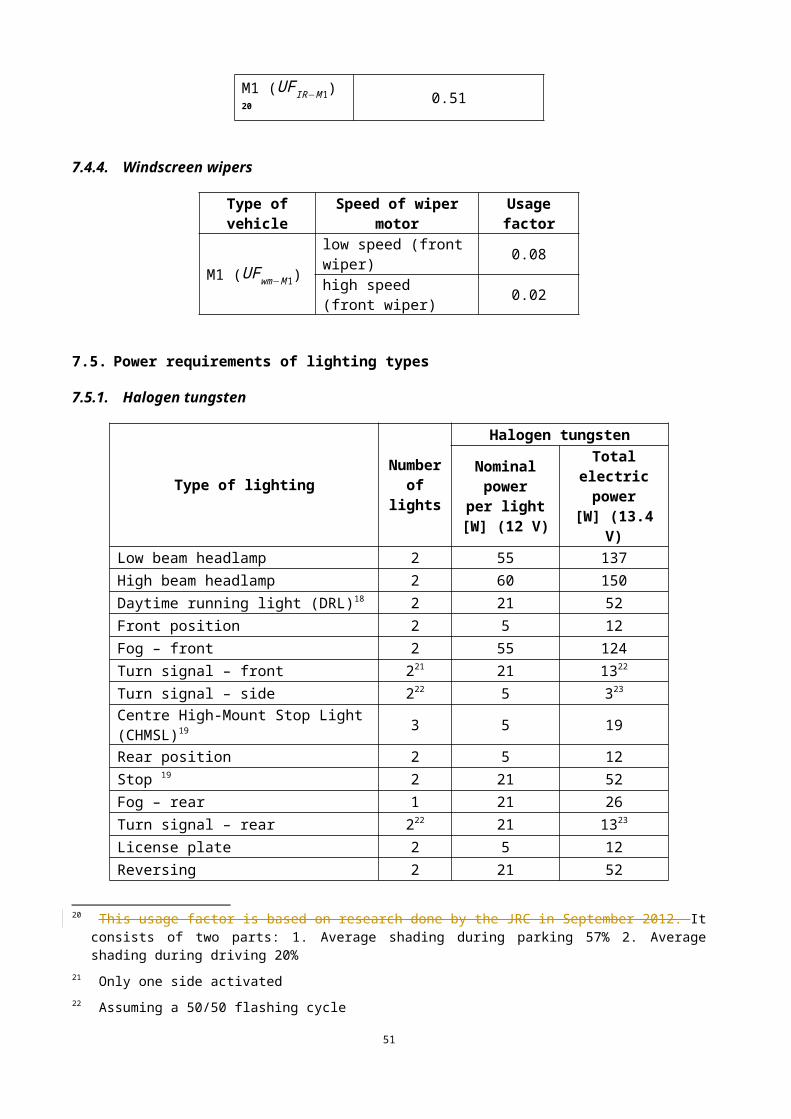
Equation 11
❑❑❑❑
: Saved electrical power [W]
❑❑: Power of the baseline [W]
❑❑: Mean value of the used power of the eco-innovation [W]
Calculation of the CO2 savings
The total CO2 savings of the lighting package are to be calculatedThe testing methodology to evaluate of the CO2 benefits of the technology can be evaluated using the following equations.
For petrol-fuelled vehicle:
Equation 12
CC O2=(∑j=1
m
ΔP j ∙UF j) ∙ V Pe−P/ηA ∙ CF P/v
For Diesel-fuelled vehicle:
Equation 13
CC O2=(∑j=1
m
ΔP j ∙UF j) ∙V Pe−D /η A ∙CF D/ v
Δ P j: Saved electrical power of lighting type j [W]
UF j: Usage factor of lighting type j [-]
m: Type of lighting
v: Mean driving speed of the NEDC [km /h]
V Pe−P: Consumption of effective power for petrol-driven vehicles [l /kWh]
V Pe−D: Consumption of effective power for Diesel-driven vehicles [l /kWh]
ηA: Efficiency of the alternator [-]
CFP: Conversion factor (l/100 km) - (g CO2/km) for petrol fuel [gC O2/ l]
CFD: Conversion factor (l/100 km) - (g CO2/km) for Diesel fuel [gC O2/ l]
Calculation of the statistical error
The standard deviation of the CO2 savings is to be calculated by means of the following equations.
# TO INSERT HERE: applicant provides the description of the methodology to quantify the statistical errors following the procedure described in Chap. 6.3.
Description of the case study
The types of lighting that have been tested are the following: low beam headlamp, high beam headlamp, front position, fog-front, turn signal-front, fog-rear, turn signal-rear, licence plate and reversing.
# TO INSERT HERE: applicant provides the description of the case study.
51
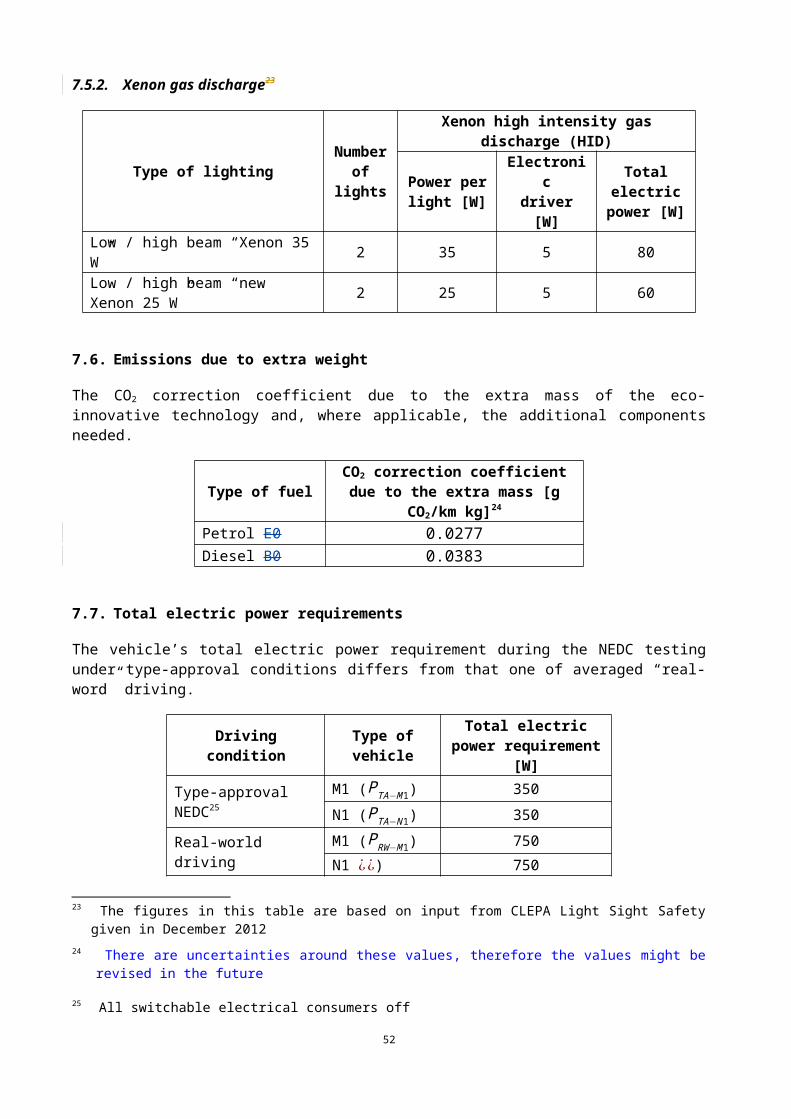
Application of the testing methodology
# TO INSERT HERE: applicant provides technical description of the measures applied including data on electrical power requirements and measurement protocols verified by an independent technical body
Example
By this example, the electric power requirements of the fitted innovative LED technologies inclusive of required control and cooling units are:
Type of lighting Electric power [W]Low beam headlamp 40High beam headlamp 40Front position 2Fog – front 25Turn signal - front 2.5Fog – rear 3Turn signal – rear 1.5License plate 2Reversing 4
The electric power requirement is not varying between different vehicle versions.
# TO INSERT HERE: applicant provides technical explanation
Calculation example for low beam headlamp
Input data:
ΔP=137 W – 40W=97 W
UF=0.33 (seeChap . REF Ref 393203787¿¿¿MERGEFORMAT 7.4 .1)
v=33.58 km /h (see Chap. 7.2)
V Pe−P=0.264 l /kWh (see Chap. 7.1.1)
V Pe−D=0.22 l /kWh (see Chap. 7.1.1)
ηA=0.67 (see Chap. 7.1.2)
CFP=2330 gC O2/ l (see Chap. 7.3.2)
CF D=2640 gC O2/ l (see Chap. 7.3.2)
Calculation of the CO2 saving per petrol-fuelled vehicle:
CC O2=ΔP ∙UF ∙V Pe−P/ηA ∙ CFP/v=97W∙0.33∙ 0.264 l /kWh
0.67∙2330 gC O2/l33.58 km /h
=0.8752 gC O2 /km
Calculation of the CO2 saving per Diesel-fuelled vehicle:
52
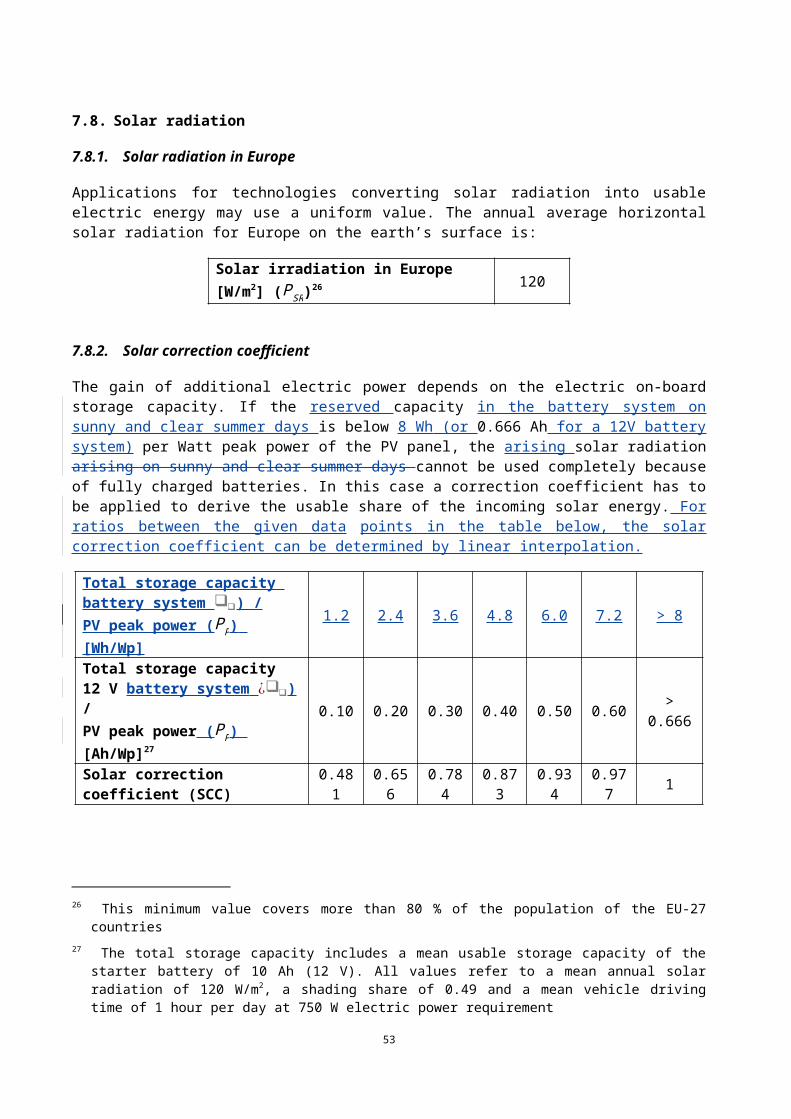
CC O2=ΔP ∙UF ∙V Pe−D/ηA ∙CF D/ v=97W∙0.33∙ 0.22 l /kWh
0.67∙2640 gC O2/l33.58 km /h
=0.8264 gC O2/km
Results for all types of exterior lighting:
Type of lighting Usage factor
CO2 savingpetrol [g/km]
CO2 savingdiesel [g/km]
Low beam headlamp 0.33 0.8752 0.8264High beam headlamp 0.03 0.0902 0.0852Front position 0.36 0.0985 0.0929Fog – front 0.01 0.0270 0.0255Turn signal - front 0.15 0.0431 0.0407Fog – rear 0.01 0.0062 0.0059Turn signal – rear 0.15 0.0471 0.0445License plate 0.36 0.0985 0.0929Reversing 0.01 0.0131 0.0124
Total CO2 savings as sum of savings of all individual types of lighting (package):
Petrol-fuelled vehicles: CC O2=1.2989 gC O2 /km
Diesel-fuelled vehicles: CC O2=1.2264 gC O2 /km
Results, rounded to one decimal place:
Petrol-fuelled vehicles: CC O2=1.3 gC O2 /km
Diesel-fuelled vehicles: CC O2=1.2 gC O2/km
# TO INSERT HERE: applicant provides the evaluation of the data quality and of the uncertainties following the procedure described in Chap. 6.3.
Check of eligibility criteria
Non-exceeding requirements in EU law:
Currently there is no legislation about CO2 saving requirements on exterior lighting.FULFILLED
Innovativeness:
53
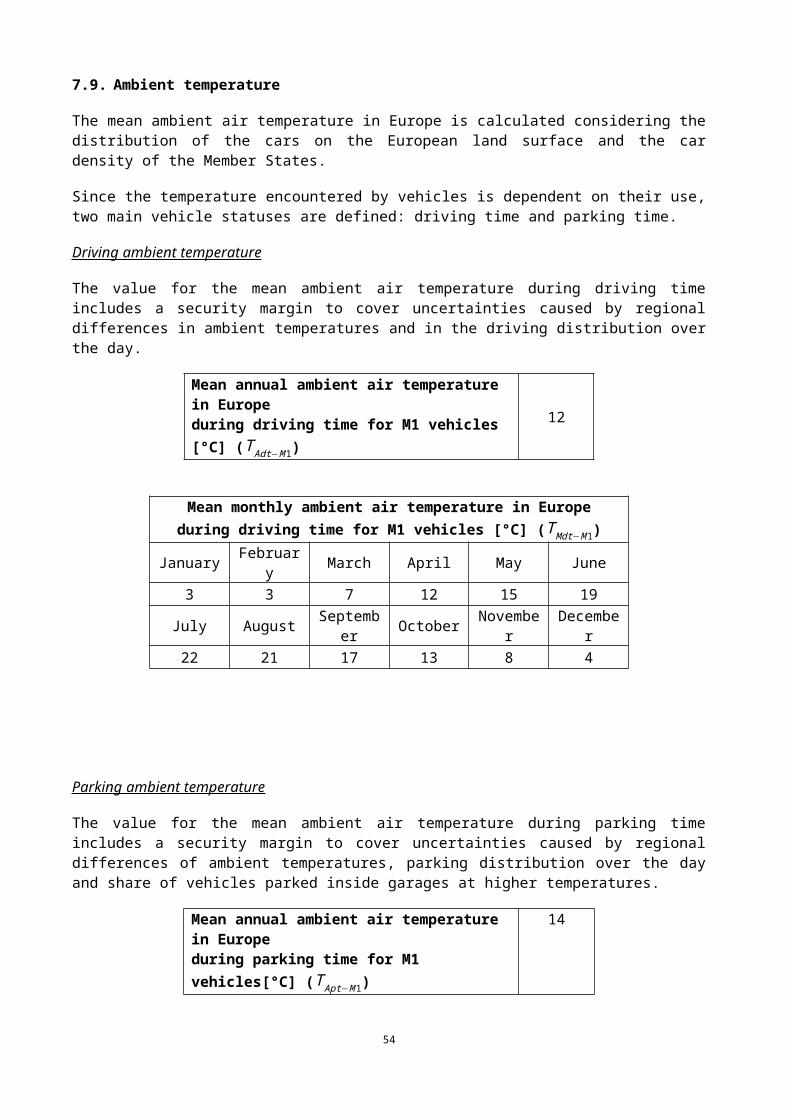
In the table below has been demonstrated that the market penetration of the eco-innovation technologies included in the ‘technology package’ do not exceed 3 % in the reference year.
FULFILLED
Necessity:
Exterior lighting is essential for the safe operation of the vehicle (no further documents necessary).FULFILLED
Verifiability:
The rounded (maximum to two decimal places)unrounded total CO2 savings of the eco-innovation technology as a package, subtracted by its standard deviation, exceed the minimum threshold of 1 g CO2/km.
FULFILLED
Coverage:
The eco-innovation technology is not covered by the CO2 type approval test procedure, since the activation of exterior lighting is not included in the current CO2 type approval test procedure (except DRL and brake lights).
FULFILLED
Accountability:
Exterior lightings are under the influence of the driver’s choice, but they belong to devices which have to be activated because of changing ambient conditions (e.g. darkness) and to ensure a safe operation of the vehicle.
FULFILLED
Total result
The application can be granted.
54
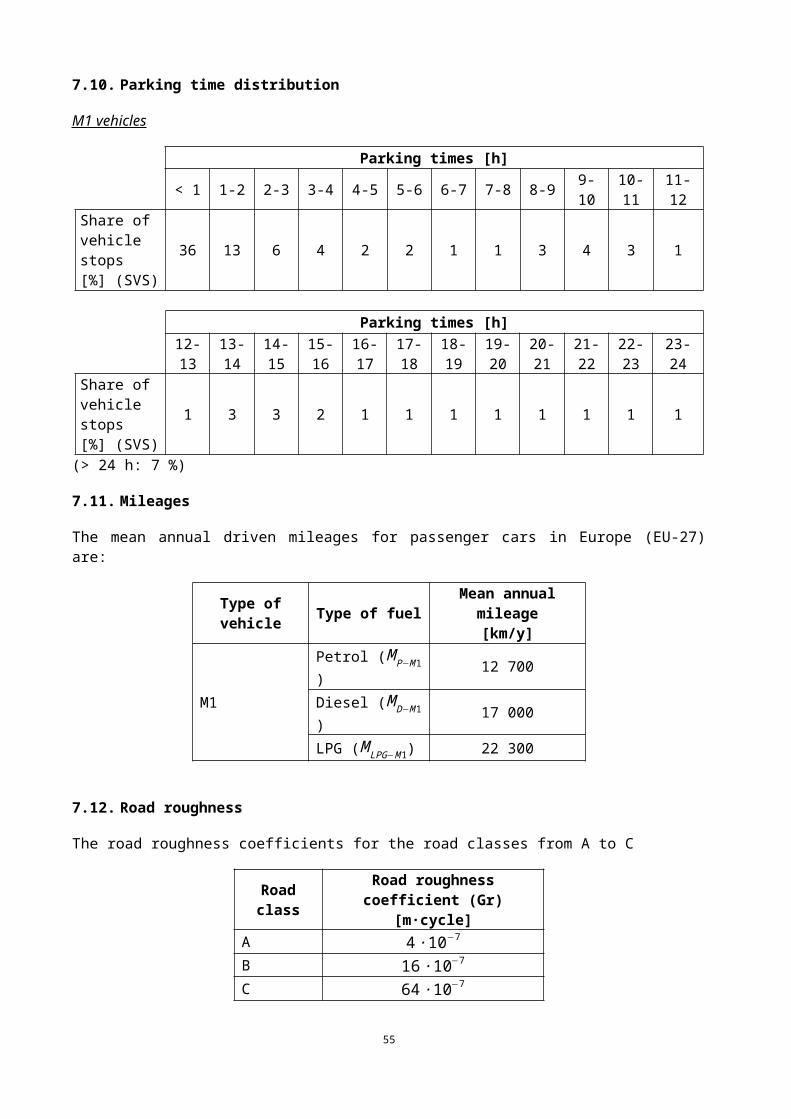
8.2.[9.2.] Class 3 – Use of ambient energy sources
8.2.1.[9.2.1.] Battery charging solar roof
Introduction
In this example a battery charging solar roof system has been considered.
Battery charging solar roof has been approved as eco-innovations by Commission Decisions 2014/806/EU34 and 2015/27935.
Photovoltaic panels consist of semiconducting materials. Sunlight consists of photons. A certain percentage of photons that hit the solar panel will be absorbed by the semiconducting materials. With the energy of the photons electrons can become detached from their atoms. And so the electrons are able to flow. Due to the semi conducting material the electrons can flow only in one direction and so forming direct current (DC). This current will be used to charge the battery.
Mainly at daytime and when the car is not parked inside or not parked in the shadow the solar roof will produce electricity. So it is important to collect statistical information about these parking situations and also to define a so-called shading factor. This factor reflects the percentage of time that the car is parked in a shaded situation. The JRC has conducted a study on these items.
Evaluating the eco-innovation
Technical description of the innovative technology
A photovoltaic (PV) panel is integrated in the roof of the vehicle. The incoming solar radiation during the day is converted to electric energy which is stored in a the supplementary battery system of the vehicle. During the operation of the vehicle the stored energy is fed into the on-board grid and the alternator’s burden gets reduced.
# TO INSERT HERE: applicant provides technical description of the measures applied including technical drawings
The electric power production depends on the surface area and efficiency of the PV panel. Variations between different vehicle versions have to be taken into account by the usage of a parametric function.
# TO INSERT HERE: applicant provides technical explanation
The usable share of the incoming solar radiation depends on the reserved electric storage capacity of the supplementary battery system. Variations between different vehicle versions have to be taken into account by the usage of a parametric function.
# TO INSERT HERE: applicant provides technical explanation
Innovativeness
The market share of the innovative technology does not exceed 3 % in the reference year 2009.
# TO INSERT HERE: applicant provides proving documents and/or data or an expert judgement on the market share of the innovative technology in the reference year.
34 Commission Implementing Decision 2014/806/EU: http://europa.eu/!JY48Wf 35 Commission Implementing Decision 2015/279: http://europa.eu/!kF44Rm
55
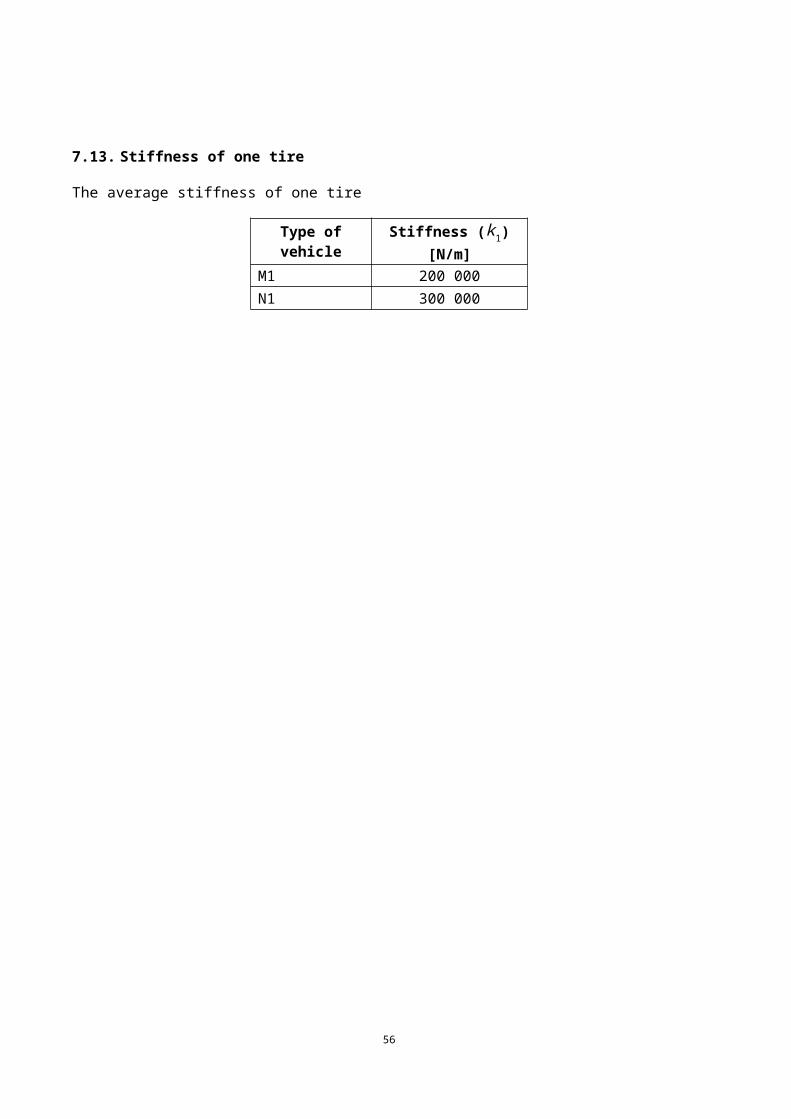
Vehicle segment prediction
Prediction on which vehicle segments the eco-innovation will be applied.
# TO INSERT HERE: applicant provides an estimate
Expected number of vehicles
Expected number of vehicles per vehicle segment equipped with the particular eco-innovation coming to the market with expected timescale.
# TO INSERT HERE: applicant provides an estimate
Market segment
The expected up-take of the innovative technology in different segments
# TO INSERT HERE: applicant provides an estimate
Definition of the baseline technology
There are three situations which can be distinguished:
A totally new version/vehicle equipped with a solar panel is brought on the EU market. In this situation the baseline vehicle is the vehicle with the solar panel installed but disconnected;
An existing version is brought on the market in which the solar panel is installed. The baseline vehicle is the existing version without the solar panel. The difference in mass should be determined and the extra CO 2
emissions, calculated with the Equation 14 and Equation 15 should be subtracted
An existing version is brought on the market in which the solar panel and an extra battery are installed. The baseline vehicle is the existing version without the solar panel and the extra battery. The difference in mass should be determined and the extra CO2 emissions, calculated with the formulae below, should be subtracted
Evaluation of negative effects
The difference in mass between the baseline vehicle and the eco-innovation vehicle due to the installation of the solar roof and where relevant, the extra battery, is to be taken into account by applying the mass correction coefficient. The baseline vehicle is to be a vehicle variant that in all aspects is identical to the eco-innovation vehicle with the exception of the solar roof and, where applicable, without the additional battery and other appliances needed specifically for the conversion of the solar energy into electricity and its storage.
For a new version of a vehicle in which the solar roof panel is installed the baseline vehicle is to be specified as follows: it is the vehicle in which the solar roof panel is disconnected and the change in mass due to the installation of the solar roof is taken into account. In case the solar roof panel is made of glass a correction for the change in mass is to be introduced. . In case the solar roof panel is made of low weight synthetic material no correction for the change in mass has to be made. On this change of mass the manufacturer must hand over verified documentation to the Type-Approval Authority.
# TO INSERT HERE: applicant provides technical explanation
56
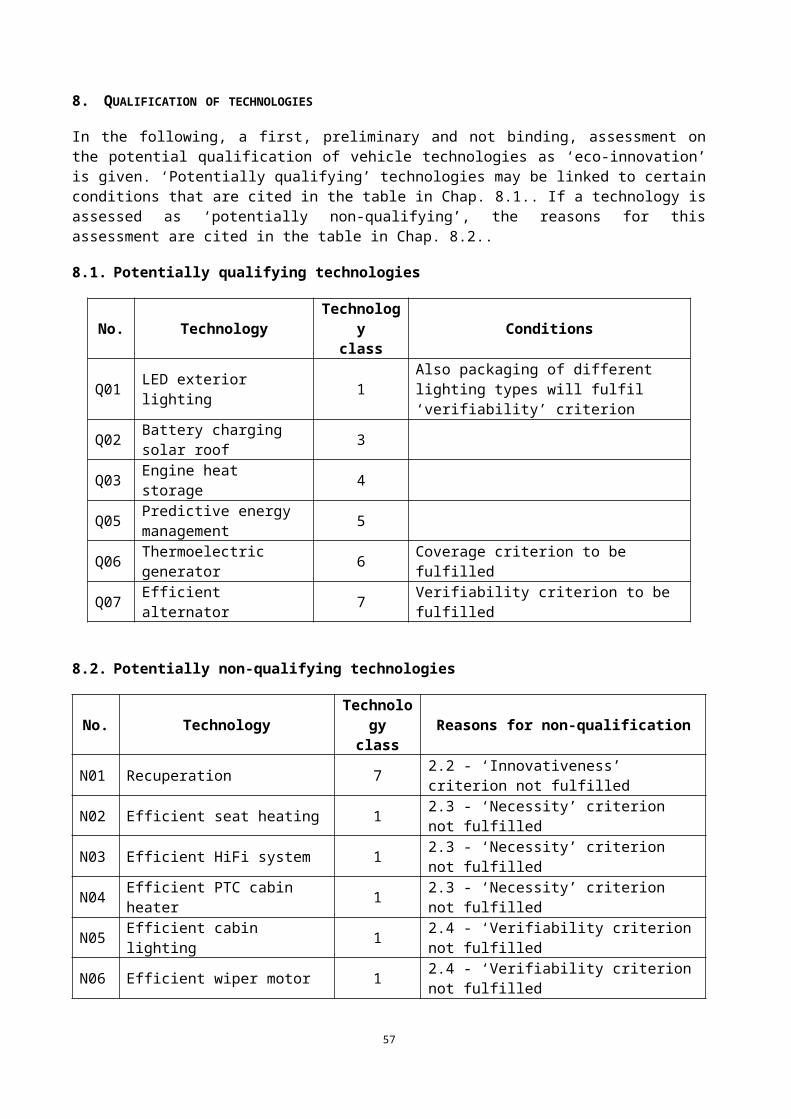
The CO2 correction coefficient due to the extra mass has to be calculated by Equation 14 and Equation 1536.
For petrol-fuelled vehicle:
Equation 14
∆ C O2 mP=0.0277 ∙ ∆ m for a petrol fuelled vehicle
For Diesel-fuelled vehicle:
Equation 15
∆ C O2 mD=0.0383 ∙∆ m for a diesel fuelled vehicle
∆ C O2m: CO2 correction coefficient due to the extra mass of the solar roof and, where applicable, the additional battery and other appliances needed specifically for the conversion of the solar energy into electricity and its storage for diesel vehicles [g CO2 /km]
∆ m: Extra mass due to the installation of the solar roof and, where applicable, the additional battery and other appliances needed specifically for the conversion of the solar energy into electricity and its storage.
Testing methodology
Conditions
Measurements
The peak power output of the PV panel has to be determined experimentally for each vehicle variant. This is because of the individual characteristics concerning PV roof surface area, curvature, materials and panel efficiencies.
Measurements should be performed following norm IEC 6121537 under supervision of an independent and certified body.
Procedure
A dismantled complete PV panel should be used. The four corner points of the panel should touch the horizontal measurement plane. A possible lengthwise inclination of the car roof may be corrected mathematically afterwards by applying a cosine function.
Equation 16
PP=m PP ∙cos∝
PP: Peak power of the photovoltaic panel [W P]
m PP: Measured peak power of the photovoltaic panel measured following norm IEC 61215 [W P]
∝: Lengthwise inclination of the car roof [°]
Calculation of the CO2 savings
36 Parameterisation of fuel consumption and CO2 emissions of passenger cars and light commercial vehicles for modelling purposes: http://europa.eu/!qN68wc
37 IEC 61215 – Crystalline silicon terrestrial photovoltaic (PV) modules – Design qualification and type approval
57
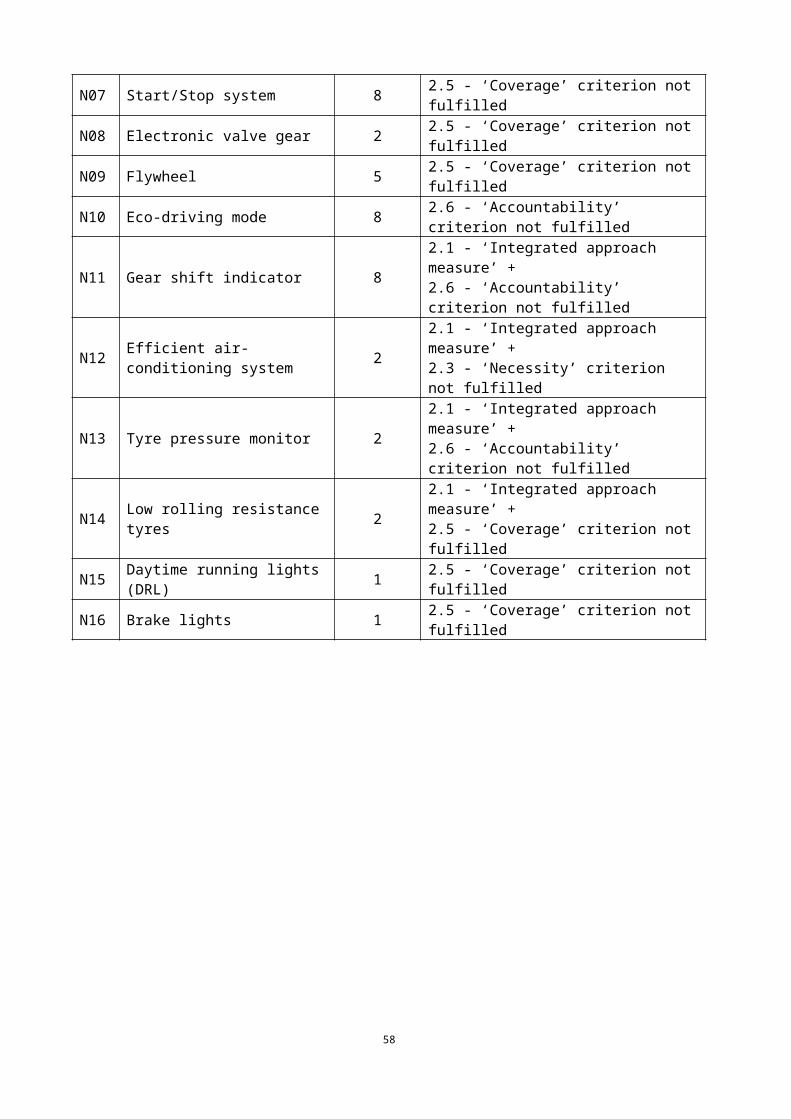
The evaluation of the CO2 benefits savings of the technology can be performed using the following equations.
For petrol-fuelled vehicle:
Equation 17
CC O2=PSR ∙UF IR ∙❑SS ∙PP ∙ SCC ∙V Pe−P/ηA ∙CFP /M P−∆C O2mP
For Diesel-fuelled vehicle:
Equation 18
CC O2=PSR ∙UF IR ∙❑SS ∙ PP ∙ SCC ∙V Pe−D/ηA ∙ CFD/M D−∆ C O2mD
PSR: Mean solar irradiation [W /m2]
UF IR: Usage factor / shading effect [-]
ηSS: Efficiency of the solar system [-]
SCC: Solar correction coefficient [-]
V Pe−P: Consumption of effective power for petrol-driven vehicles [l /kWh]
V Pe−D: Consumption of effective power for Diesel-driven vehicles [l /kWh]
ηA: Efficiency of the alternator [-]
CFP: Conversion factor (l/100 km) - (g CO2/km) for petrol fuel [gC O2/ l]
CFD: Conversion factor (l/100 km) - (g CO2/km) for Diesel fuel [gC O2/ l]
M P: Mean annual mileage for petrol-fuelled vehicles [km /a]
M D: Mean annual mileage for diesel-fuelled vehicles [km /a]
The calculation of the solar correction coefficient is directly dependent on the power peak of the solar panel (PP) and on the capacity in the battery system reserved of solar energy (CN) as on table below.
Total storage capacity battery system ¿) /PV peak power (PP) [Wh/Wp]
1.2 2.4 3.6 4.8 6.0 7.2 > 8
Solar correction coefficient (SCC) 0.481 0.656 0.784 0.873 0.934 0.977 1
Calculation of the statistical error
The standard deviation of the CO2 savings is to be calculated by means of the following equations.
# TO INSERT HERE: applicant provides the description of the methodology to quantify the statistical errors following the procedure described in Chap. 6.3.
Description of the case study
# TO INSERT HERE: applicant provides short technical description of the case study. It should contain all necessary technical data (like surface area, curvature angles, materials, efficiencies etc.) to enable a clear identification of the PV panel.
58
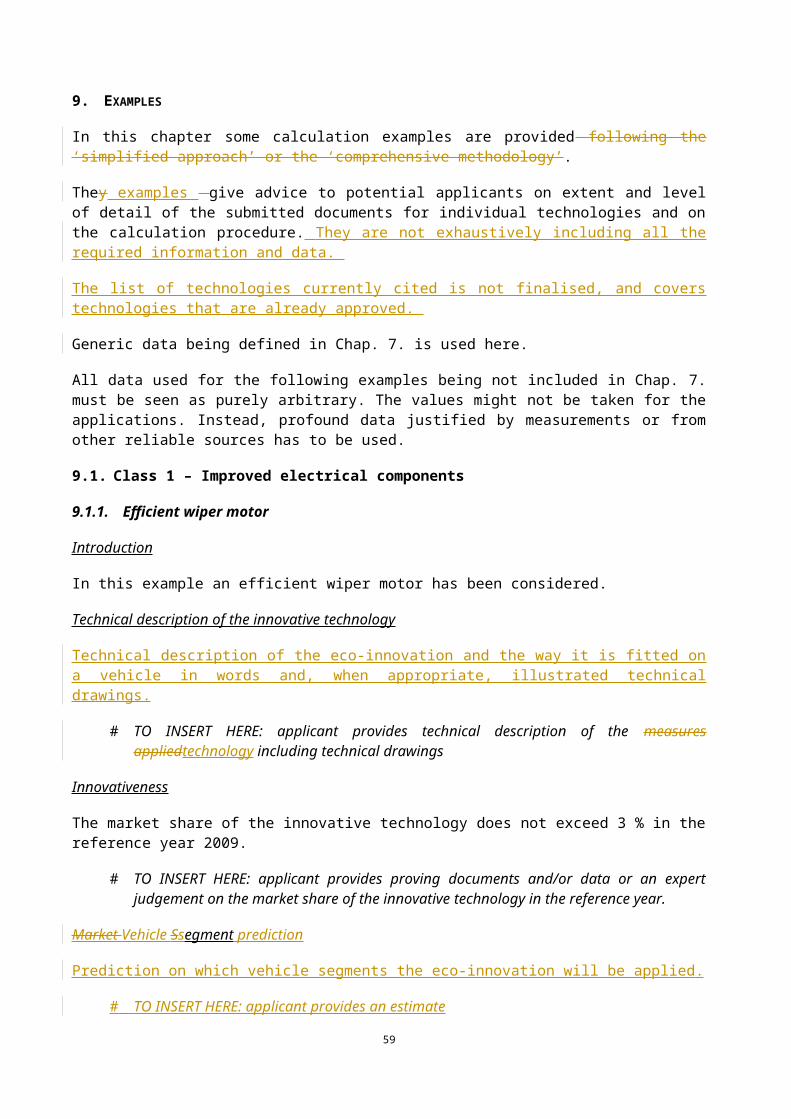
Application of the testing methodology
Calculation procedureExample:
The measurements of a dismantled PV module under IEC 6121538 result in a peak power output of 101.0 Wp. The lengthwise inclination of the implemented solar roof is 8°. The peak power output of the PV panel used for the certification process may be calculated by:
101.0 W P∙ cos8 °=100 W P
# TO INSERT HERE: applicant provides proving documents (measurement protocols) on the peak power output of a specific PV roof panel. The protocol should be attested by an independent and certified body.
The battery system reserved for solar energy has a capacity of ❑❑.
Input data:
PSR=120W /m2 (see Chap. 7.8.1)
UF IR=0.51 (see Chap. 7.4.3)
ηSS=0.76 (see Chap. 7.1.3)
PP=100 W P=100 W /1000 W /m2
V Pe−P=0.264 l /kWh (see Chap. 7.1.1)
V Pe−D=0.22 l /kWh (see Chap. 7.1.1)
ηA=0.67 (see Chap. 7.1.2)
CF P=2330 gC O2/ l (see Chap. 7.3.2)
CF D=2640 gC O2/ l (see Chap. 7.3.2)
M P=12700 km /a=1449.8 m /h (see Chap. 7.11)
M D=17000 km /a=1940.6 m /h (see Chap. 7.11)
Calculation of the solar correction coefficient:
❑❑
❑❑ /❑❑❑/❑❑❑/❑❑
Calculation of the CO2 saving per petrol-fuelled vehicle:
CC O2=PSR ∙UF IR ∙❑SS ∙ PP ∙ SCC ∙V Pe−P/ηA ∙CFP /M P−∆C O2mP
CC O2=120 W /m2 ∙0.51 ∙0.76 ∙ 100 W /1000W /m2 ∙0.873∙ 0.264 l /kWh
0.67∙2330 gC O2/l1449.8 m/h
−∆C O2 mP=2.5720 gC O2/km−∆ C O2 mP
Calculation of the CO2 saving per diesel-fuelled vehicle:
CC O2=PSR ∙UF IR ∙❑SS ∙ PP ∙ SCC ∙V Pe−D/ηA ∙ CFD/M D−∆ C O2mD
59
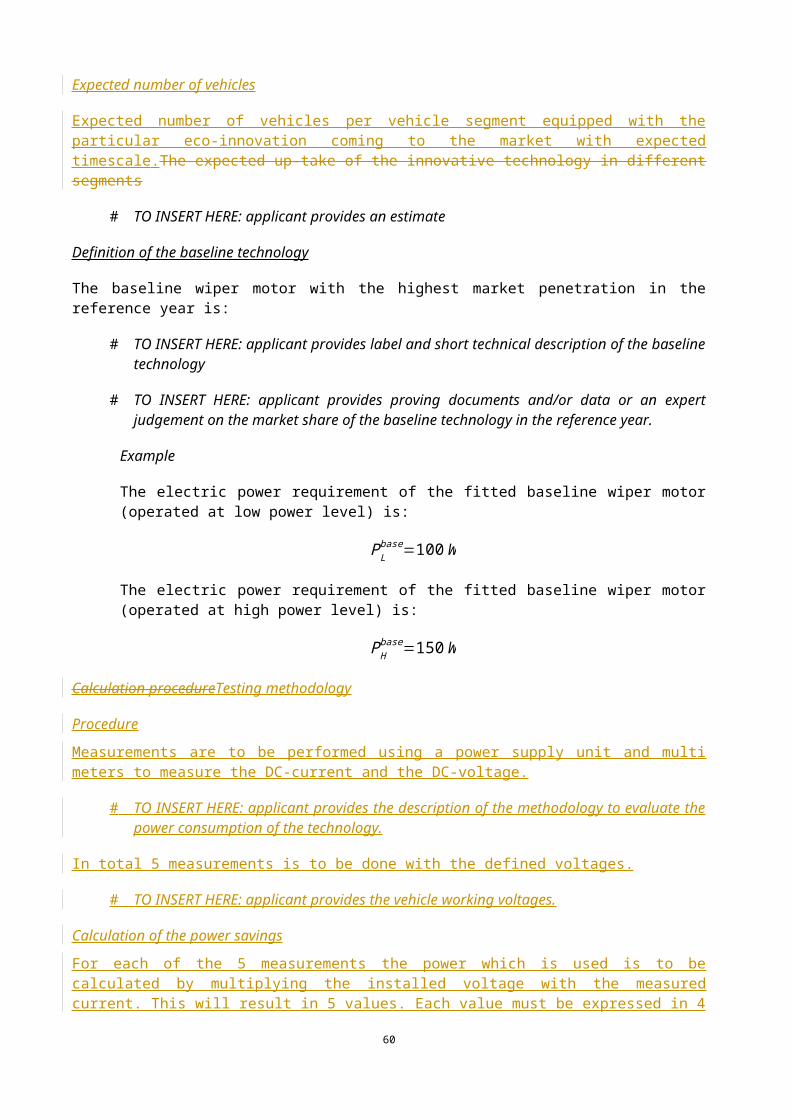
CC O2=120 W /m2 ∙0.51 ∙0.76 ∙ 100 W /1000W /m2 ∙0.873∙ 0.22l /kWh
0.67∙2640 gC O2/ l1940.6 m /h
−∆ C O2 mD=1.8138 gC O2 /km−∆ C O2 mD
Results, rounded to one decimal place:
Petrol-fuelled vehicles: CC O2=2.6 gC O2 /km−∆C O2mP
Diesel-fuelled vehicles: CC O2=1.8 gC O2 /km−∆ C O2 mD
# TO INSERT HERE: applicant provides the evaluation of the data quality and of the uncertainties following the procedure described in Chap. 6.3.
Check of eligibility criteria
Non-exceeding requirements in EU law:
Currently there is no legislation about mandatory solar roofs.FULFILLED
Innovativeness:
It has been demonstrated that the market penetration of the eco-innovation technology does not exceed 3 % in the reference year.
FULFILLED
Necessity:
Photovoltaic panels convert ambient energy (solar radiation) into usable electric energy.FULFILLED
Verifiability:
The rounded (maximum to two decimal places)unrounded CO2 savings of the eco-innovation technology, subtracted by its standard deviation, exceed the minimum threshold of 1 g CO2/km.
FULFILLED
Coverage:
The eco-innovation technology is not covered by the CO2 type approval test procedure, since the process of battery charging by solar radiation during parking time is not included in the current CO2 type approval test procedure.
FULFILLED
Accountability:
The processes of charging a supplementary battery by solar radiation and discharging this battery under driving conditions are not under the influence of the driver’s choice.
FULFILLED
Total result
The application can be granted.
60
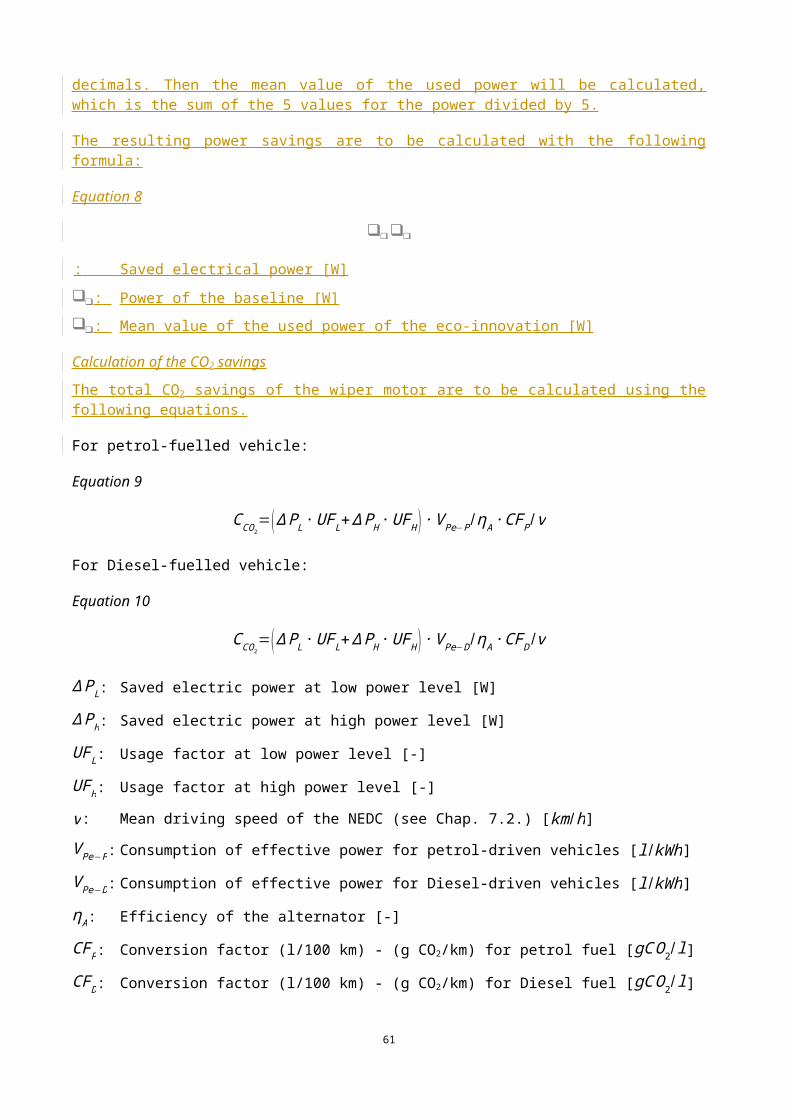
8.3.[9.3.] Class 4 – Energy storing systems
8.3.1.[9.3.1.] Engine heat storage
Introduction
In this example engine heat storage has been considered.
Engine heat storage system has been approved as eco-innovations by Commission Decisions 2013/451/EU38.
The advantage of using the heat of an engine is that the friction of the engine will be lower, because of the better performance of the lubrication oil at higher temperatures of the power train. There are different ways of using the heat of the engine. One of these is engine encapsulation.
An engine compartment encapsulation system permits the reduction of heat loss after the vehicle is turned off by sealing the engine compartment and by closing of grille openings by a radiator shutter. The stored heat yields a delayed cool-down of the powertrain. The fuel consumption and CO2 emissions of the vehicle after restarting is decreased due to lower friction caused by the higher powertrain temperature.
Technical description of the innovative technology
The vehicle’s engine gets enclosed by insulating material to delay heat dissipation. The cooling down process of the engine after cut-off gets decelerated. Hence, re-starting the engine after a certain parking time can be done at a higher engine temperature which reduces friction losses and fuel consumption.
# TO INSERT HERE: applicant provides technical description of the measures applied including technical drawings
Innovativeness
The market penetration of the engine encapsulation technology has been demonstrated on the report Market penetration of an underhood encapsulation in the EU in 2009 created by the Institute for Automotive Engineering – RWTH Aachen University.
In the study the market penetration of combined thermal management measures in vehicle engine bays in the European Union was analysed for the year 2009. A thermal engine encapsulation is an example for a combined thermal management. Regarding combined thermal management, a market penetration of 0% was defined.
Additionally, the market penetration of active and advanced active thermal management was analysed. Active thermal management can be considered as an intermediate step towards combined thermal management. The market penetration of advanced active thermal management in the EU in 2009 was less than 3%. Overall, it can be found that the share of newly registered vehicles in the EU in 2009 equipped with advanced active thermal management, as well as combined thermal management, did not exceed 3%.
# TO INSERT HERE: applicant provides proving documents and expert judgement document on the market share of the innovative technology in the reference year.
Vehicle segment prediction
Prediction on which vehicle segments the eco-innovation will be applied.
# TO INSERT HERE: applicant provides an estimate
38 Commission Implementing Decision 2013/451/EU: http://europa.eu/!Jd88bP
61
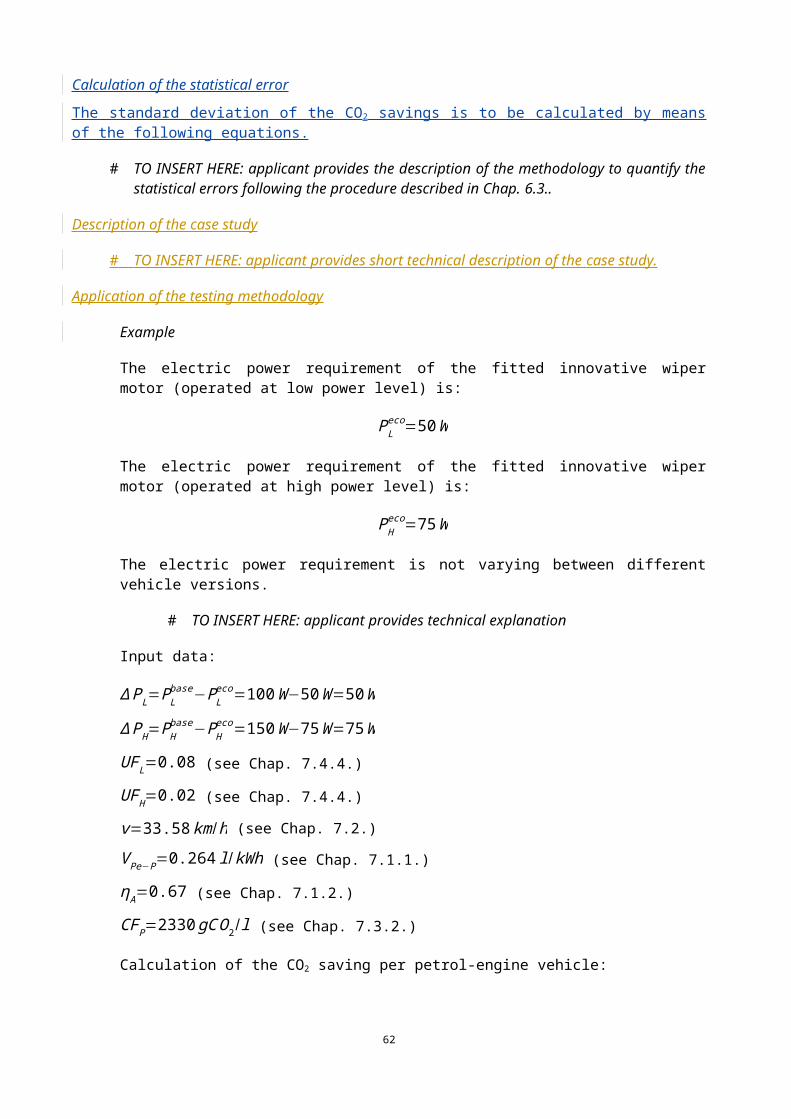
Expected number of vehicles
Expected number of vehicles per vehicle segment equipped with the particular eco-innovation coming to the market with expected timescale.
# TO INSERT HERE: applicant provides an estimate
Definition of the baseline technology
The baseline technology is the standard technology without eco-innovation technology (without engine compartment encapsulation).
In the case of a new version of the vehicle in which the eco-innovation is already installed, the baseline vehicle is the vehicle in which this energy storing device is deactivated.
Testing methodology
Determination of the cool-down curves
The cool-down curves of both the baseline and the EI eco-innovative vehicle have to be determined experimentally for each vehicle variant. This is because of the individual characteristics concerning heat capacities, engine bay packaging and engine heat insulation. Continuous measurements of representative coolant temperatures by means of a thermocouple should be performed at constant ambient temperature of at least 14°C over 24 hours (see Chap. 7.9). The engine should be heated up to the maximum coolant temperature before cut-off by a sufficient number of consecutive NEDC cycles.
After preconditioning, for deactivation of all pumps and fans, the ignition should be switched off and the dash key pulled out. The car’s bonnet should be closed completely. Any artificial ventilation systems inside the test cell should be switched off. All measurements should be performed under supervision of an independent and certified body. The resulting measurement curves should be converged by the mathematical approach described by the formula above.
The least squares method should be used for the fitting of the two curves. To do that, the temperature measurement data of the first minutes after engine cut-off should be cut because of the untypical behaviour of the coolant temperature after switching off the coolant circuit.
The cooling behaviour of a vehicle’s engine after cut-off can be described mathematically by the following equation
Equation 19
T ( t )=T A+(T 0−T A )e−d ∙t
T (t ): Temperature over time [°C]
T 0: Temperature of the operating engine [°C]
T A: Ambient temperature [°C]
d : Decay constant [1/h]
Determination of the hot start benefit (HSB)
The CO2 saving effect depends on the temperature difference between the eco-innovativeon (EI) vehicle with and the baseline vehicle without insulated engine after a certain parking time. The temperature difference gets multiplied by a CO2 reduction factor (RFT) which describes the relation between CO2
reduction and increased starting temperature. Finally the temporally resolved CO2 reductions have to be aggregated by weighting with an averaged parking time distribution.
62
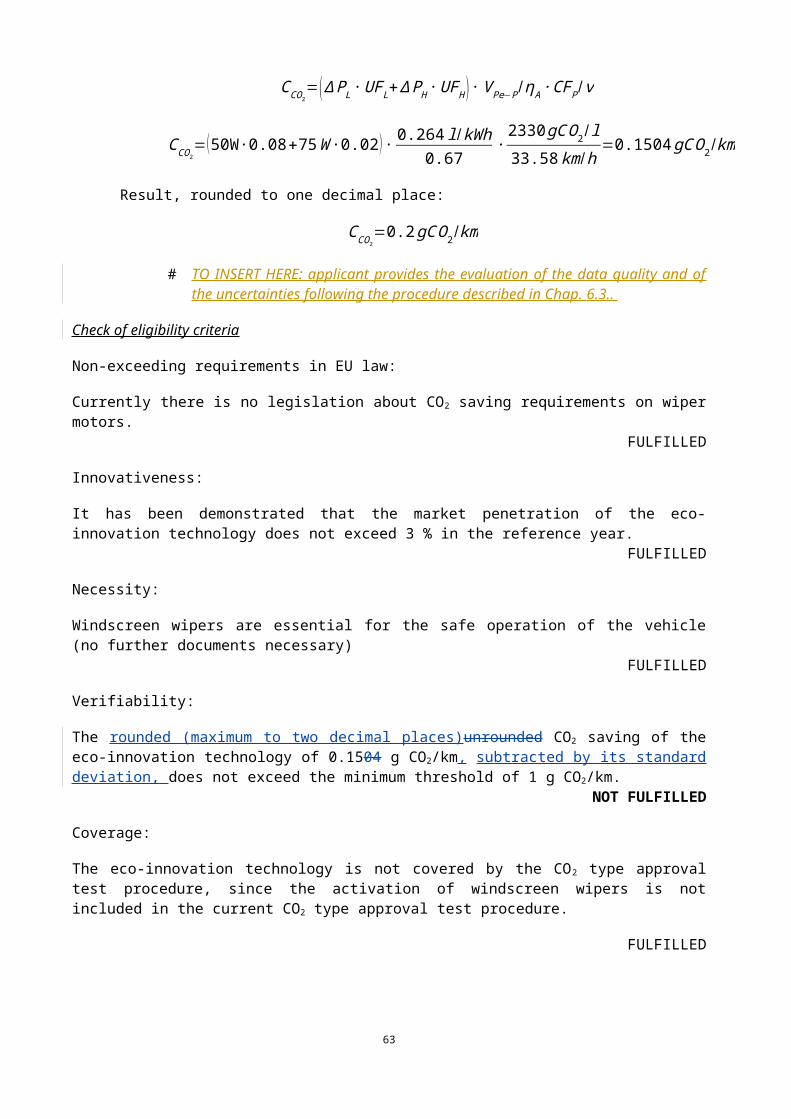
The hot start benefit (HSB) of the EI eco-innovative vehicle has to be determined experimentally. This value describes the difference of CO2 emissions between a cold start and a hot start NEDC test in relation to the cold start result.
Equation 20
HSB=1−C O2 (hot )C O2 (cold )
HSB: Hot start benefits [-]
C O2 (hot ): CO2 emissions at hot start engine temperature [gC O2/km]
C O2 (cold ): CO2 emissions at cold start engine temperature [gC O2/km]
The coolant temperature at the beginning of the cold start test and the ambient temperature in the test cell should not be below 14°C (see Chap. 7.9). The hot start NEDC test should be conducted following the cold start NEDC test. It is possible to perform one or two preconditioning NEDC tests between the cold start and the hot start NEDC test. It should be ensured and documented that the state of charge (SOC) (e.g. CAN signal) of the starter battery after each test is within 5%.
All measurements should be performed under supervision of an independent and certified body.
Calculation of the CO2 savings
The relative CO2 reduction potential ∆ C O2 (t pt ) for different parking times shall be calculated using the following equation.
Equation 21
Calculation of the relative CO2 reduction potential ∆ C❑❑ (❑❑) for different parking times:
∆ C O2 (t pt )=1.443 ∙ ln( e−d E ∙t pt+1e−d B∙ t pt+1 ) ∙HSB
d E: Decay constant of the eco-innovative vehicle [1/h]
d B: Decay constant of the baseline vehicle [1/h]
t pt: Parking time [h]
The total CO2 savings, weighted by the parking times (t pt) shall be calculated using the following equation.
Equation 22
CC O2=TAC O2
∙∑pt=1
24
∆ C O2 (t pt )∙ SVS pt
TAC O2: CO2 emission under type approval procedure [gC O2/km]
SVSpt: Parking time distribution [-] (see Chap 7.10)
Parametric function
The CO2 saving of an engine heat storage device depends on the ‘hot start benefit’ (HSB) as a relation between CO2 NEDC results with cold and hot engine at test start. This parameter might vary between
63
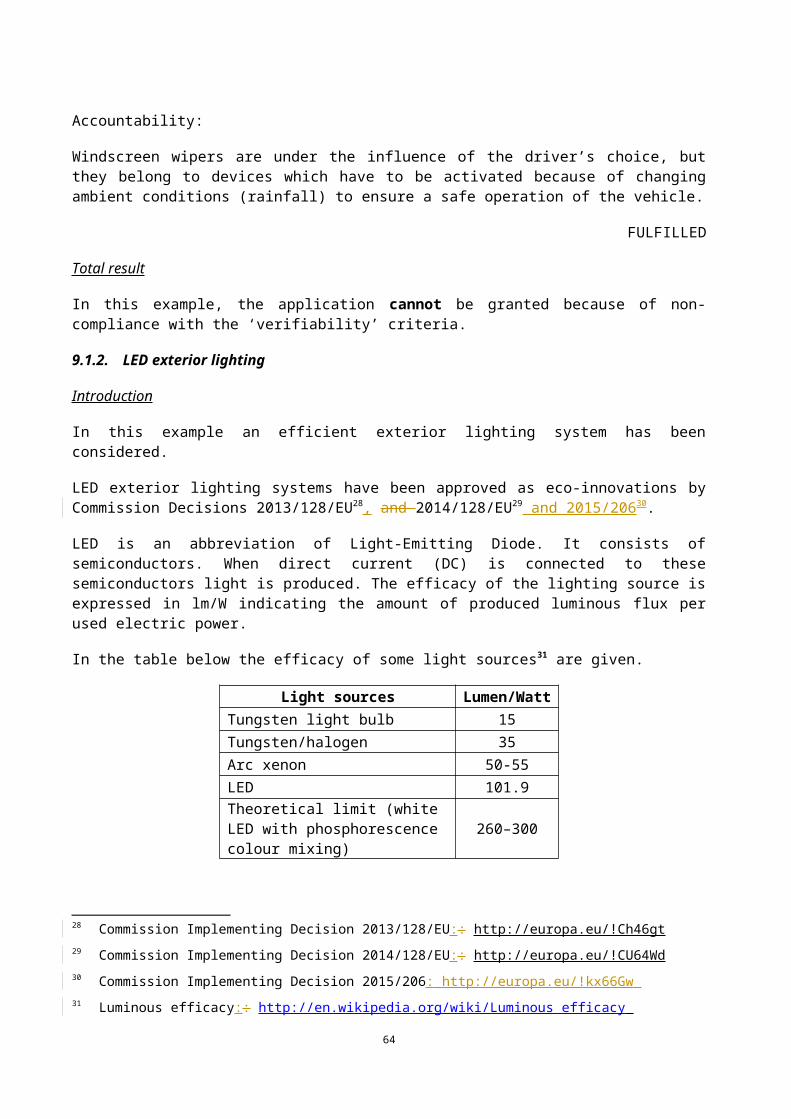
different vehicle versions because of different engine types and sizes. To cover mathematically different vehicle versions with varying engine types and sizes, a parametric function may be applied. This function would replace the experimental determination of the HSB by performing hot and cold (14°C) start NEDC tests.
To describe the dependencies of the HSB on the type of engine (petrol or diesel) and the engine size (engine displacement), a linear parametric function could be used:
HSB=HSB0+SF ∙ De
De: Engine displacement [cm3]HSB0: Hot start benefit (for petrol or diesel engines)SF: Slope factor [% / (K ∙ cm3 )] (for petrol or diesel engines)
The parameters HSB0 and SF have to be determined experimentally by the applicant. The applicability of such a linear approach should be checked carefully.
Calculation of the statistical error
The complete test procedure should be repeated at least two times. Arithmetic means of the cold start and of the hot start CO2 results and the respective variation coefficients of the means should be calculated. Further test repetitions of the NEDC tests are required as long as the variation coefficients of both arithmetic means are below 1%.
# TO INSERT HERE: applicant provides the description of the methodology used to quantify the statistical errors following the procedure described in Chap. 6.3.
# TO INSERT HERE: applicant demonstrates an inappropriate high effort in testing, and proposes a reduction on the minimum number of measurement pending the compliance with stricter requirements on the statistical error.
Description of the case study
# TO INSERT HERE: applicant provides short technical description of the case study. It should contain all necessary technical data (chassis, engine etc.) to enable a clear identification of the surveyed vehicles.
Application of the testing methodology
Example:
The measured coolant curve has been measured 20 minutes after engine cut off to avoid the untypical behaviour of the coolant temperature.
The measured coolant curve of the baseline vehicle (without heat storage measures) has been approached by a decay constant of d B=0.5 h−1. The measured coolant curve of the EI eco-innovative vehicle has been approached by a decay constant of d E=0.3 h−1.
64
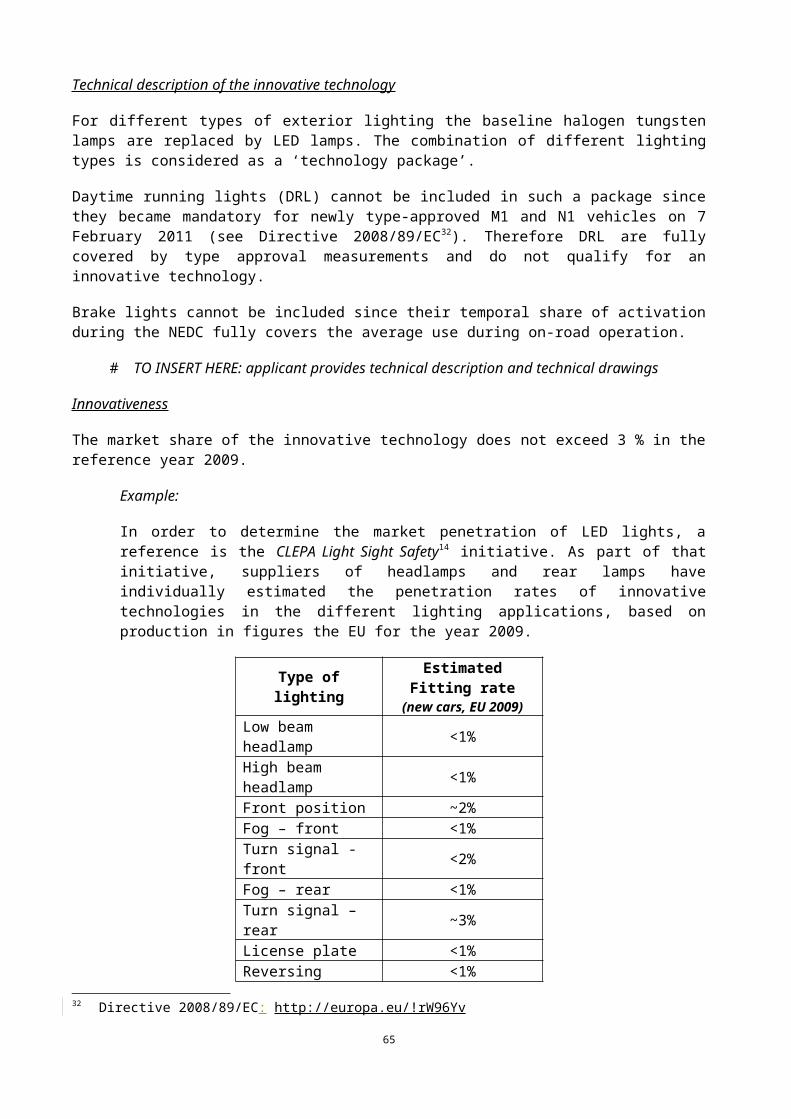
0
10
20
30
40
50
60
70
80
90
100
0 2 4 6 8 10 12 14 16 18 20 22 24Parking time [h]
Tem
pera
ture
[°C
]
0
5
10
15
20
25
30
35
40
SVS
[%]
T baseline
T eco-innovation
delta T
parking timedistribution (SVS)
Figure 2: Cool-down curves of baseline and eco-innovation technologies, temperature differences and parking time distribution
# TO INSERT HERE: applicant provides proving documents (measurement protocols) on the cool-down curves and the converged mathematical functions including decay constants. The documents should be attested by an independent and certified body.
The measured CO2 emissions in the different testing conditions are shown in the Table below.
CO2 [g/km] Cold start NEDC (14°C) Hot start NEDC1. Test 136 1162. Test 140 1203. Test 134 119Arithmetic mean 136.7 118.3Variation coefficient of mean 1.29% 1.02%4. Test 138 117Arithmetic mean 137 118Variation coefficient 0.94% 0.80%
HSB=1−118 gC O2 /km137 gC O2 /km
=13.87 %
# TO INSERT HERE: applicant provides proving documents (measurement protocols) on the cold and hot start NEDC tests including coolant temperatures at the beginning of the test and SOC at the beginning and the end of each test. The documents should be attested by an independent and certified body.
CO2 emission under type approval procedure:
TAC O2=130 gC O2/km
65
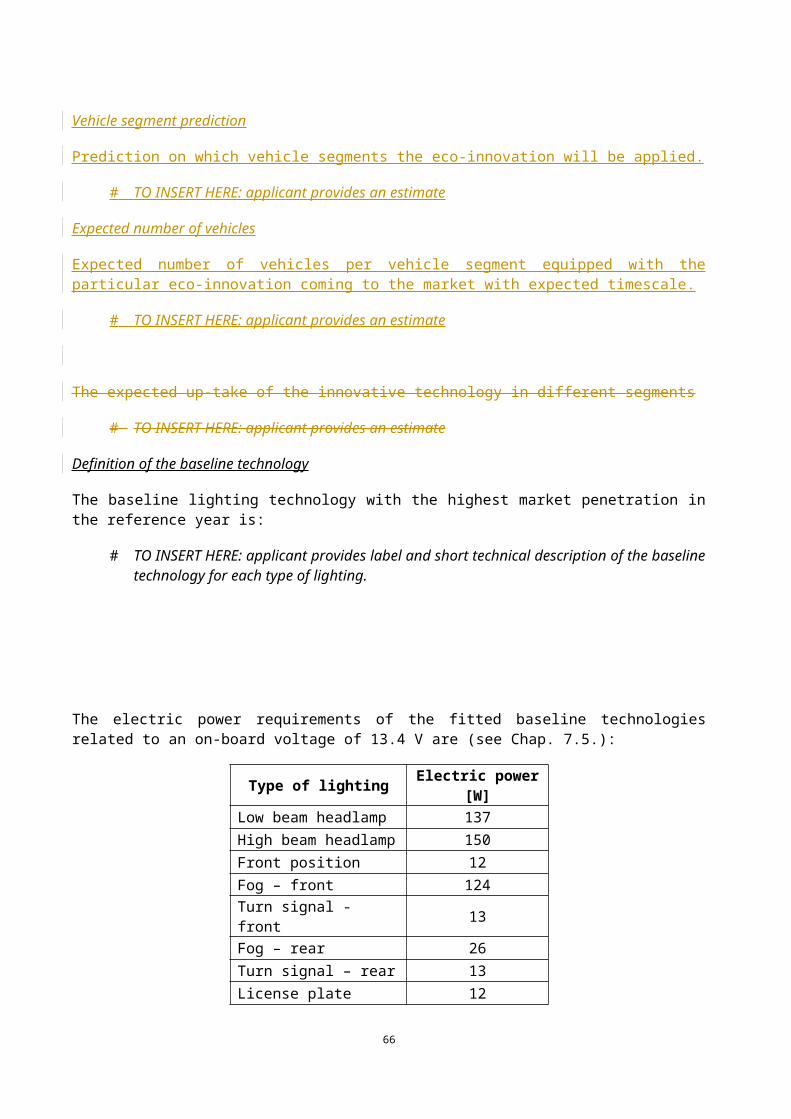
Calculation of the relative CO2 reduction potential ∆ C O2 (t pt ) for different parking times.
Parking time [h] 0.5 1.5 2.5 3.5 4.5 5.5 6.5 7.5 8.5 9.5 10.5 11.5
∆ C O2 (t pt ) [%] 0.90 2.13 2.70 2.80 2.61 2.28 1.90 1.54 1.22 0.95 0.73 0.56
Parking time [h] 12.5 13.5 14.5 15.5 16.5 17.5 18.5 19.5 20.5 21.5 22.5 23.5
∆ C O2 (t pt ) [%] 0.43 0.32 0.24 0.18 0.14 0.10 0.08 0.06 0.04 0.03 0.02 0.02
Calculation of the total CO2 saving, weighted by the parking times (t pt).
Parking time [h] 0.5 1.5 2.5 3.5 4.5 5.5 6.5 7.5 8.5 9.5 10.5 11.5
SVS [%] 36 13 6 4 2 2 1 1 3 4 3 1
Parking time [h] 12.5 13.5 14.5 15.5 16.5 17.5 18.5 19.5 20.5 21.5 22.5 23.5
SVS [%] 1 3 3 2 1 1 1 1 1 1 1 1
CC O2=130 gC O2/km∙ 1.1392%=1.4810 gC O2/km
Result, rounded to one decimal place:
CC O2=1.5 gC O2 /km
# TO INSERT HERE: applicant provides the evaluation of the data quality and the documentation that demonstrate the compliance with stricter requirements on the statistical error.
Check of eligibility criteria
Non-exceeding requirements in EU law:
Currently there is no legislation about minimum requirements on engine heat storage systems.FULFILLED
Innovativeness:
It has been demonstrated that the market penetration of the eco-innovation technology does not exceed 3 % in the reference year.
FULFILLED
Necessity:
The combustion engine is an essential device for the safe operation of the vehicle. Engine compartment encapsulation reduces heat dissipation and improves the over-all engine efficiency (no further documents necessary).
FULFILLED
Verifiability:
66
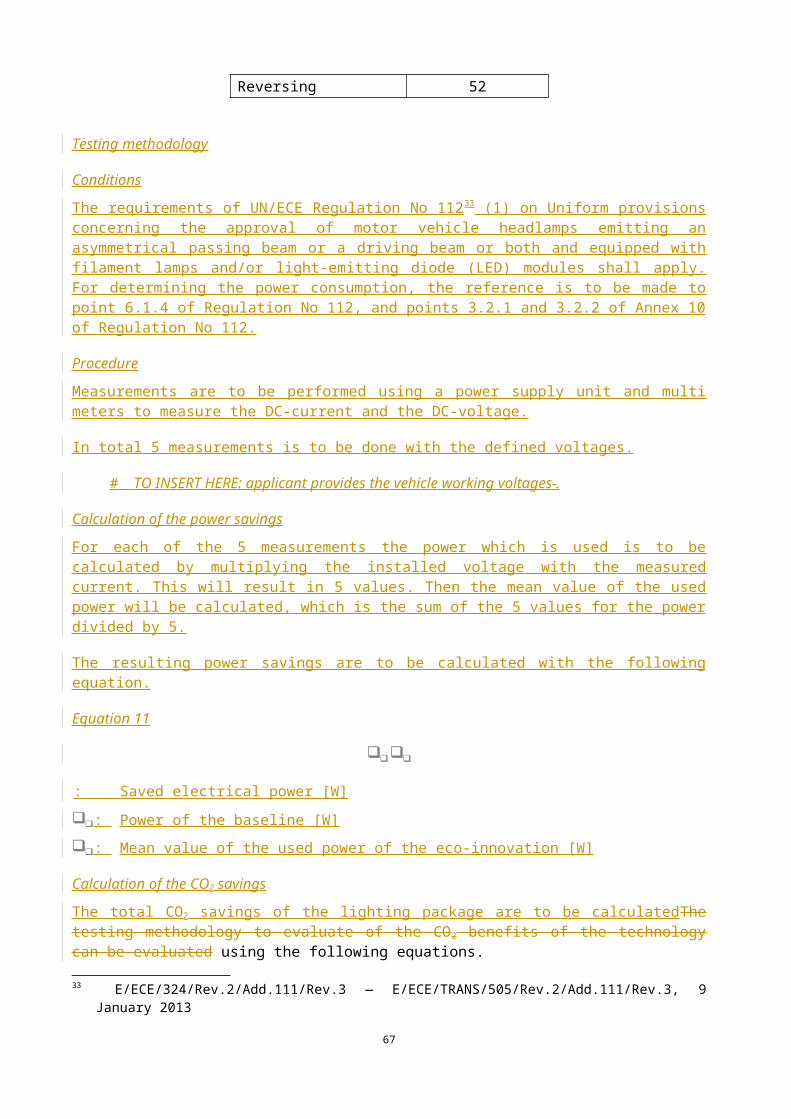
The rounded (maximum to two decimal places)unrounded total CO2 saving of the eco-innovation technology, subtracted by its standard deviation, exceeds the minimum threshold of 1 g CO2/km.
FULFILLED
Coverage:
The eco-innovation technology is not covered by the CO2 type approval test procedure. Current legislation for testing prescribes a maximum engine starting temperature not exceeding the ambient test cell temperature by more than 2°C. Hence, effects of reduced engine cooling after engine cut-off are not reflected in the CO2 type approval results.
FULFILLED
Accountability:
Engine compartment encapsulation does not require any manual activation or deactivation. Its effect on CO 2
emissions of the vehicle is not under the influence of the driver’s choice.FULFILLED
Total result
The application can be granted.
67
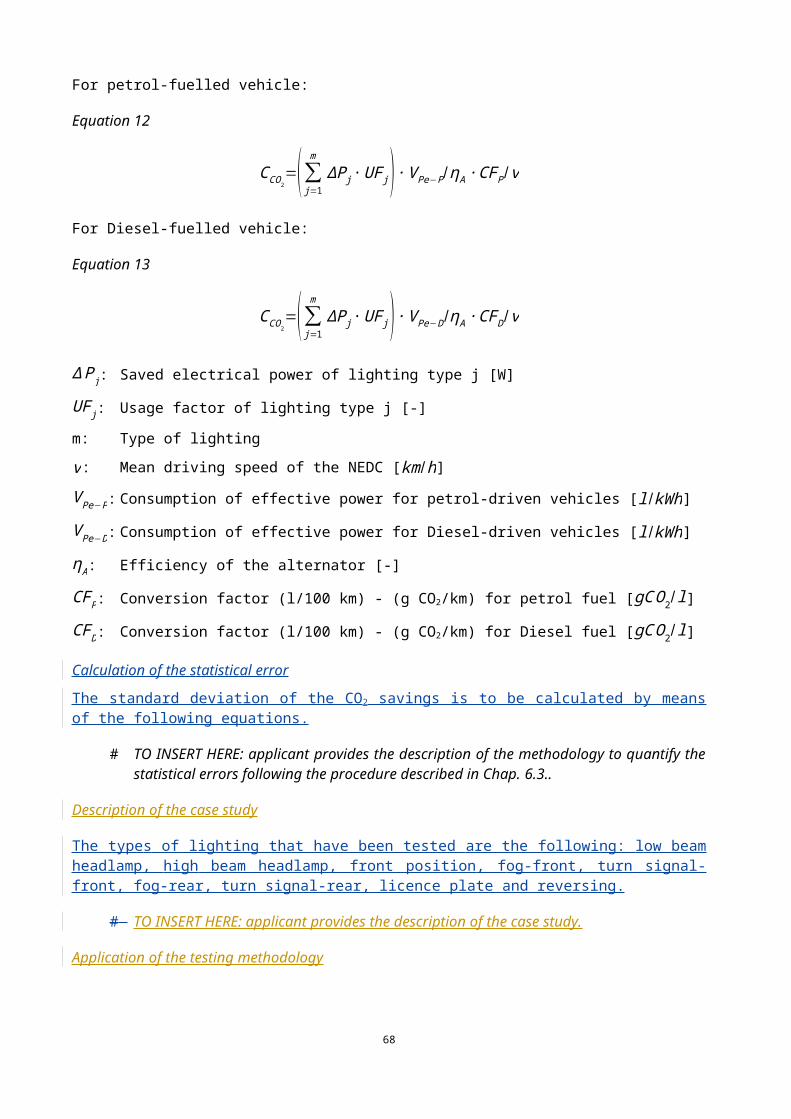
8.4.[9.4.] Class 5 – Kinetic energy of the vehicle
8.4.1.[9.4.1.] Predictive energy management
Introduction
In this example a predictive energy management system has been considered.
Predictive energy management has been approved as eco-innovations by Commission Decisions 2013/529/EU39.
The potential energy of a vehicle can be recuperated when the vehicle goes downhill. The energy can be used to charge the battery of hybrid electric vehicles, thus reducing the CO2 emissions.
In order to increase the potential energy recuperation, navigation systems can be used to predict when a car will go uphill or downhill and consequently adapt the state of charge of the battery.
Technical description of the innovative technology
The innovative technology consists of a system for controlling the state of charge of a battery in a hybrid electric vehicle through a navigation system that continuously monitors the geospatial positioning of the vehicle and provides information on the slope profile of the driving route in order to estimate recuperation potentials on the route.
Based on this potential, the system adapts the state of charge of the battery so that maximal energy utilization and recuperation is realised: when the car goes uphill the electric power of the battery is used, and when the car goes downhill the potential energy of the slope of the road is used to charge the battery.
# TO INSERT HERE: applicant provides technical description of the measures applied including technical drawings
Innovativeness
The market share of the innovative technology does not exceed 3 % in the reference year 2009.
# TO INSERT HERE: applicant provides proving documents and/or data or an expert judgement on the market share of the innovative technology in the reference year.
Vehicle segment prediction
Prediction on which vehicle segments the eco-innovation will be applied.
# TO INSERT HERE: applicant provides an estimate
Expected number of vehicles
Expected number of vehicles per vehicle segment equipped with the particular eco-innovation coming to the market with expected timescale.
# TO INSERT HERE: applicant provides an estimate
Market segment39 Commission Implementing Decision 2013/529/EU: http://europa.eu/!kx84Pp
68
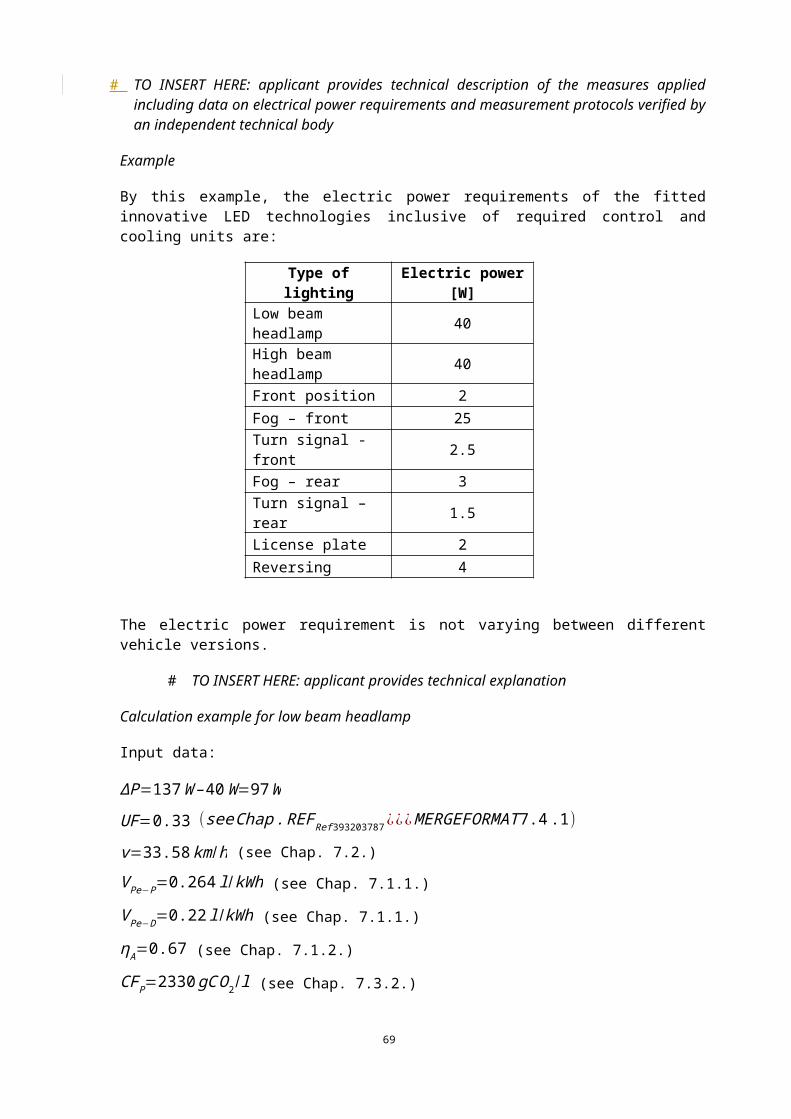
The expected up-take of the innovative technology in different segments
# TO INSERT HERE: applicant provides an estimate
Definition of the baseline technology
The baseline technology is the standard technology without eco-innovation technology activated (i.e. without the predictive energy management system activated).
This deactivation can be established by not providing GPS-time data to the navigation system. For the purpose of the roller bench test, it must be possible to activate and deactivate the usage of the innovative technology
Testing methodology
Conditions
The following conditions shall be met:
(a) The navigation system of the innovative technology has to be able to use the GPS-time data for performing the test cycle.
(b) The roller test bench shall be able to test hybrid electric vehicles (PHEV/HEV) and shall be able to support road slope profiles. Given the variety of hybrid powertrain architectures, a four wheel enabled test bench is required.
Procedure
Since it is clear that the CO2 reducing effect of the innovative technology cannot be demonstrated from the use of the speed/time-profile of the NEDC, a deviation from the NEDC was defined.
The emissions of CO2, fuel consumption and electric energy consumption of the tested vehicles are to be measured in accordance with UN/ECE Regulation No 101. Only the speed profiles and the test bench settings shall be modified according to the following:
Test bench
The slope-time data shall be used as control input for the roller test bench.
The speed-time data shall be used as instructions for the test driver for performing the test. The speed and time tolerances shall be in accordance with paragraph 1.4 of Annex 7 to UN/ECE Regulation No 101.
The reference test cycle that can be attributed to evaluate the CO2 reduction of the innovative technology in is representative of the European situation is shown in Figure 3 and Figure 440 (further details in Commission Decisions 2013/529/EU42).
The reference cycle contains speed and slope profiles and it is representative of the European situation. The deviation in the testing methodology from the NEDC speed/time profile has been considered appropriate since conservative for the evaluation of the benefits of the technology.
# TO INSERT HERE: applicant provides proving documents demonstrating the appropriateness of the deviation from the NEDC speed/time profile.
40 Further details in Commission Decisions 2013/529/EU
69
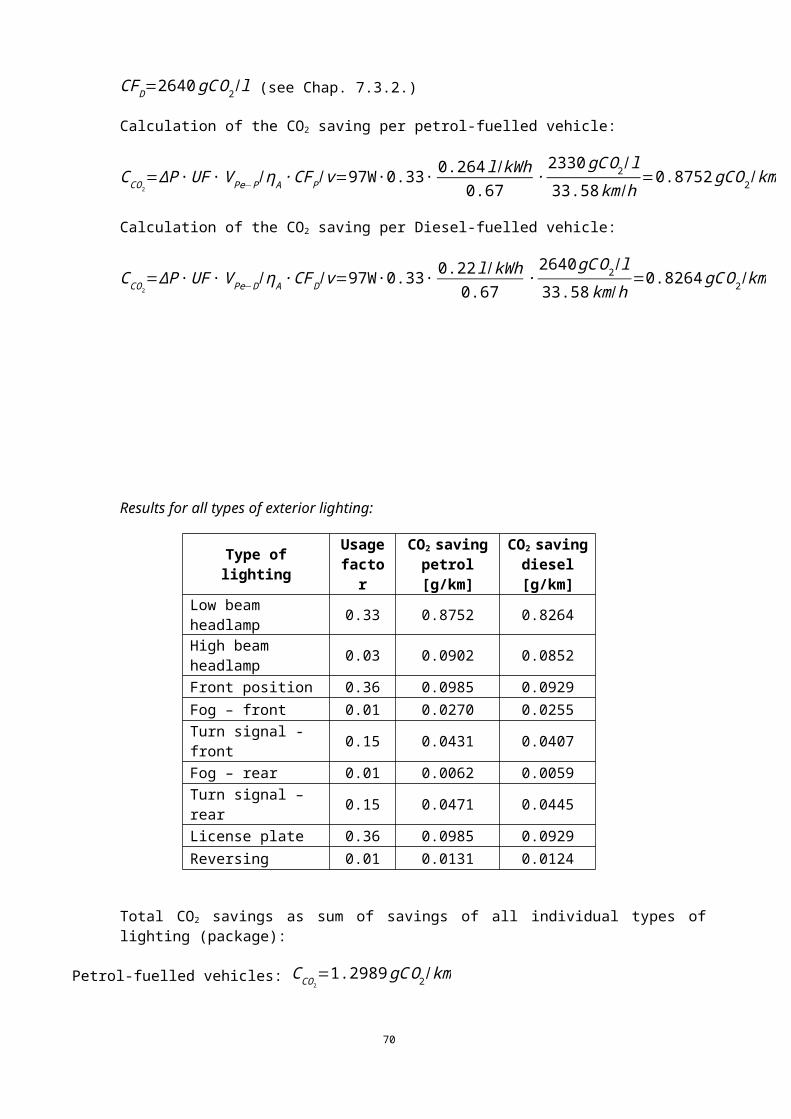
Figure 3: speed profile over time
Figure 4: slope profile over time
Pre-conditioning of the vehicle
One complete test cycle shall be performed with the innovative technology deactivated to reach the standard hot testing conditions of engine, electric motor and battery with regard to temperatures and state of charge, i.e. a state of charge of 50–60 percent.
Navigation system
During the test of the eco-innovation vehicle, the navigation system has to simulate the GPS position of the vehicle using the GPS–time data provided using one of the following methodologies:
The GPS-time data is provided to the navigation system using a data carrier (e.g. SD-Card, USB-Stick, DVD) plugged into the navigation device. The GPS data stored into the data carrier shall be as a text data in a file (e.g.‘.csv’) or as a file format comprehensibly generated from the GPS system.
70
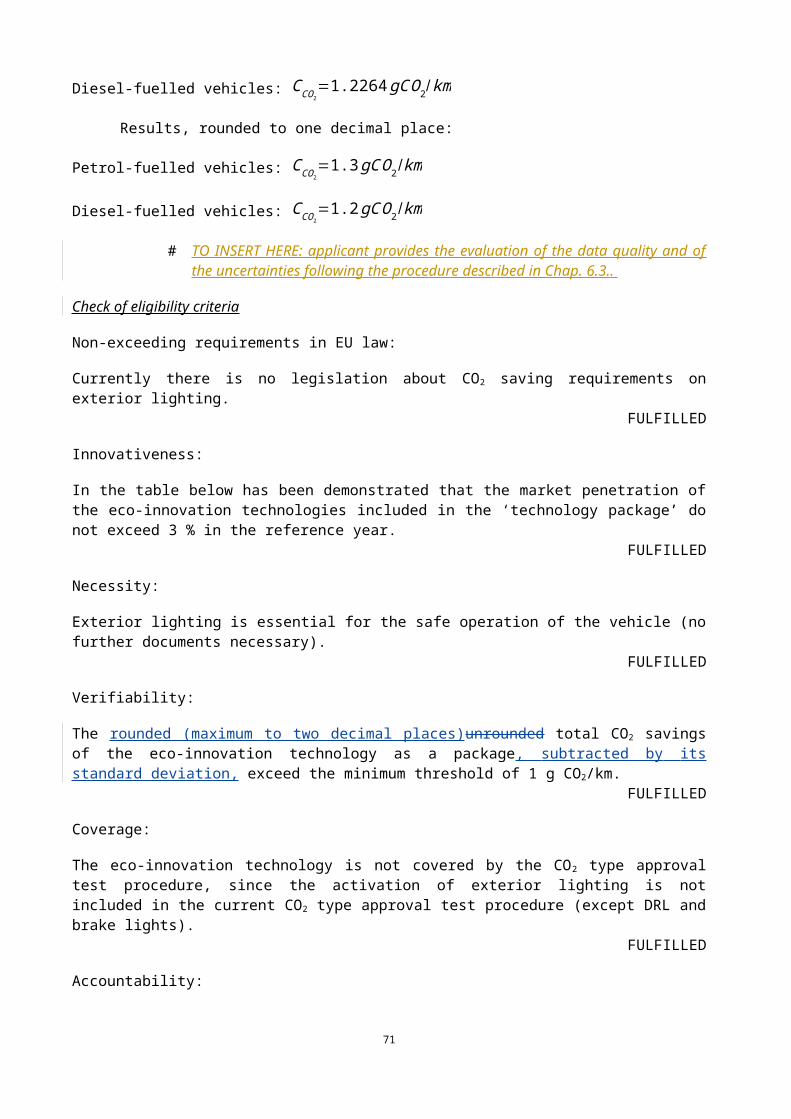
The GPS-time data is used as input for a GPS-Signal Generator that is part of the roller dynamometer setting. The GPS-Signal Generator and the roller dynamometer shall be synchronized on a time basis.
Executing the test
To synchronise the roller dynamometer movement with the output of the navigation system, both systems (test bench and the navigation system) have to be started at the same point in time (± 1 s).
# TO INSERT HERE: applicant provides proving documents (measurement protocols) on the predictive energy management system technology.
#
Number of test
Two series of measurements have to be done using the reference test cycle. One series of measurements has to be done with the vehicle in which the predictive energy management system is activated. During the tests the navigation system has to simulate the GPS position of the vehicle using the GPS-time data of the reference cycle. The other series of measurements has to be done with the vehicle in which the predictive energy management system is not activated.
Calculation of the CO2 savings
The formula to calculate the CO2 savings is the following:
Equation 23
CCO2=(BMC – EMC ) ∙UF
CCO2: CO2 savings [g CO2/km]
EMC: CO2 emissions of the eco-innovation vehicle using the reference test cycle [g CO2/km]
BMC: CO2 emissions of the baseline vehicle using the reference test cycle [g CO2/km]
UF: Temporal share of the technology usage in normal operation conditions [-]
Calculation of the statistical error
The complete test procedure on the test bench shall be repeated at least two times. The arithmetic means of the CO2 emissions from the eco-innovation vehicle, and of the baseline vehicle and the respective variation coefficients of the means shall be calculated. Further test repetitions on the dynamometer are required until the variation coefficients of both arithmetic means are below 1 %.
# TO INSERT HERE: applicant provides the description of the methodology used to quantify the statistical errors following the procedure described in Chap. 6.3.
# TO INSERT HERE: applicant demonstrates an inappropriate high effort in testing and proposes a reduction on the minimum number of measurement pending the compliance with stricter requirements on the statistical error.
Application of the testing methodology
Calculation procedure
Example:
71

The results of the measurement performed using the reference test cycle are shown on the Table below.
CCO2 [g CO2/km] BMC EMC
Test 1 130 120Test 2 129 119Test 3 130 120Arithmetic mean 130 120
It has been evaluated that the temporal share of the technology usage in normal operation conditions is the 15%.
# TO INSERT HERE: applicant provides proving documents (measurement protocols) on the evaluation of the temporal share of the technology usage in normal operating conditions.
The calculate CO2 savings are the following:
CCO2=(BMC – EMC ) ∙UF=(130 – 120 ) ∙0.15=1.50 gC O2/km
Result, rounded to one decimal place:
CC O2=1.5 gC O2 /km
# TO INSERT HERE: applicant provides the evaluation of the data quality and the documentation that demonstrate the compliance with stricter requirements on the statistical error.
Check of eligibility criteria
Non-exceeding requirements in EU law:
Currently there is no legislation about minimum requirement on potential energy recuperation for hybrid vehicles.
FULFILLED
Innovativeness:
It has been demonstrated that the market penetration of the eco-innovation technology does not exceed 3 % in the reference year.
FULFILLED
Necessity:
This technology allows the potential energy recuperation into usable electric energy.FULFILLED
Verifiability:
The rounded (maximum to two decimal places)unrounded CO2 savings of the eco-innovation technology, subtracted by its standard deviation, exceed the minimum threshold of 1 g CO2/km for hybrid vehicles with
72
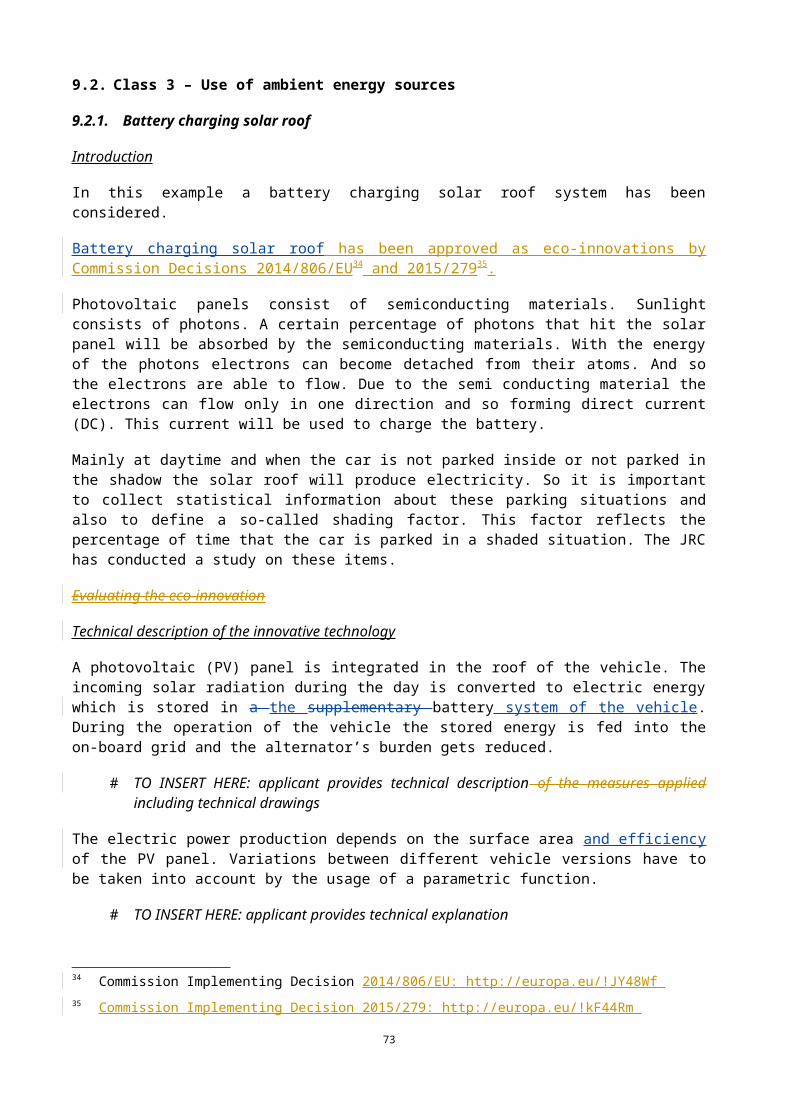
a mass in running order of 1 650 kg or more. For vehicles with a mass in running order below 1 650 kg, it has not been demonstrated that the savings are sufficiently high to meet the 1 g CO2/km threshold.
FULFILLED
Coverage:
The eco-innovation technology is not covered by the CO2 type approval test procedure, since slope information is not available.
FULFILLED
Accountability:
The technology is not under the influence of the driver’s choice, since the device is always active and the driver cannot switch it off intentionally or accidentally.
FULFILLED
Total result:
The application can be granted.
73
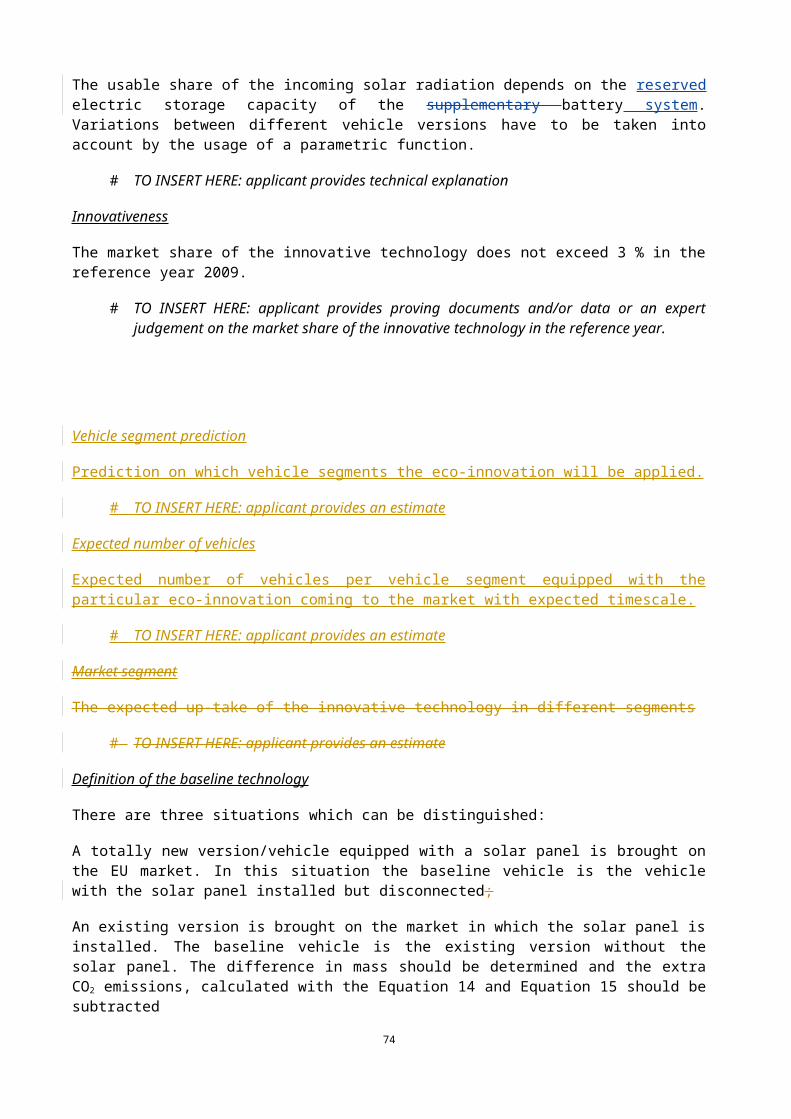
8.5.[9.5.] Class 7 – Kinetic energy – to – electricity converters
8.5.1.[9.5.1.] Efficient alternator
Introduction
In this example an efficient alternator has been considered.
Efficient alternators have been approved as eco-innovations by Commission Decisions 2013/341/EU41 an,d 2014/465/EU42, 2015/15843 and 2015/29544.
An alternator is an electrical generator that converts mechanical energy to electrical energy in the form of alternating current (AC). Mostly also a rectifier is built in the alternator so that direct current (DC) is produced.
The efficiency of present to day alternators is in the order of magnitude of 67%. This means that about 33% of the energy is lost. The main losses are:
Mechanical losses;
Rectifying losses;
Stator losses;
Iron losses;
Rotor losses.
This means that the efficiency of the alternator can be improved by reducing (combinations) of these losses.
Technical description of the innovative technology
Example
The efficiency of an alternator has been improved by 5 20 % by optimising the rectification by the use of ‘high efficient diodes’ and by ‘active rectification’.
# TO INSERT HERE: applicant provides technical description of the measures applied including technical drawings
The efficiency of the new alternator (ηA−EI) is: 0.72 (determination pursuant to the VDA methodology).
# TO INSERT HERE: applicant provides measurement protocols verified by an independent technical body
The CO2 saving effect is restricted to vehicles that are equipped with this special type of alternator. It does not vary between different vehicle versions, if the vehicles’ consumption on electric power does not differ. The effect is partially covered by the type-approval test procedure. The electric power demand during ‘real-world’ driving exceeds that one of NEDC testing. Therefore the total CO2 saving is not fully reflected by the type approval results.
41 Commission Implementing Decision 2013/341/EU: http://europa.eu/!Nx99mr 42 Commission Implementing Decision 2014/465/EU: http://europa.eu/!gu34tt 43 Commission Implementing Decision 2015/158: http://europa.eu/!Jk96vB 44 Commission Implementing Decision 2015/295: http://europa.eu/!RW48yw
74
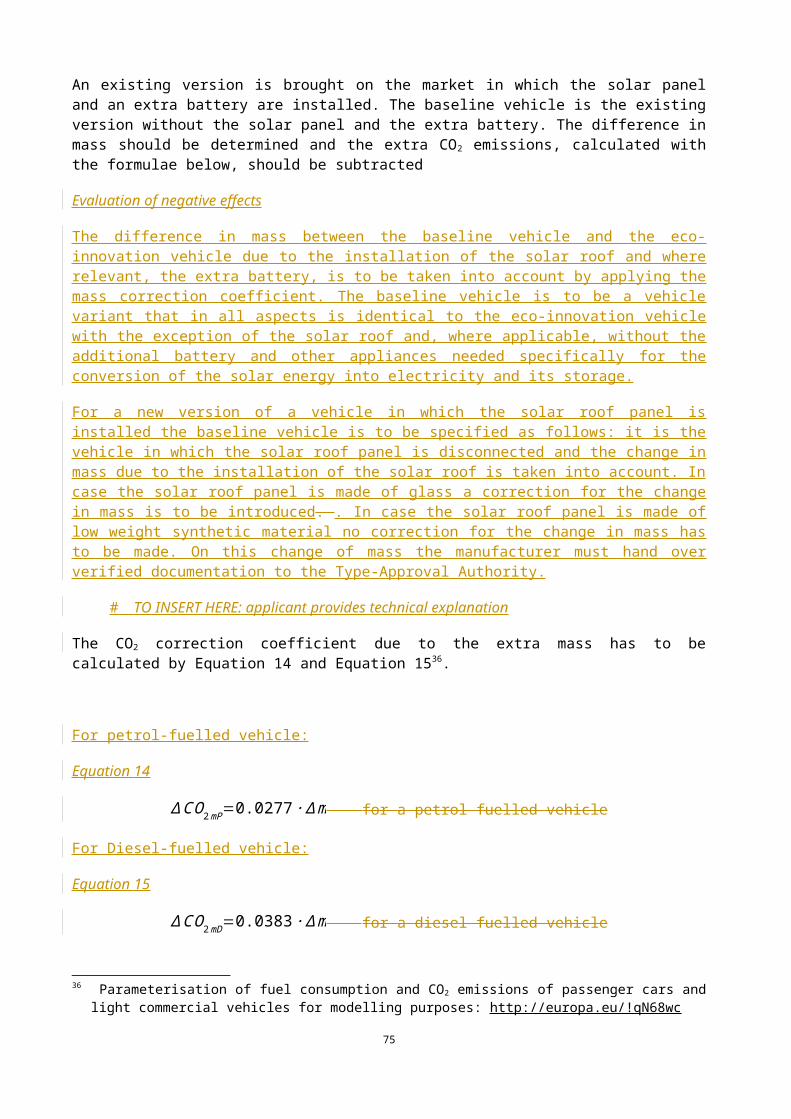
Innovativeness
The market share of the innovative technology does not exceed 3 % in the reference year 2009.
# TO INSERT HERE: applicant provides proving documents and/or data or an expert judgement on the market share of the innovative technology in the reference year.
Vehicle segment prediction
Prediction on which vehicle segments the eco-innovation will be applied.
# TO INSERT HERE: applicant provides an estimate
Expected number of vehicles
Expected number of vehicles per vehicle segment equipped with the particular eco-innovation coming to the market with expected timescale.
# TO INSERT HERE: applicant provides an estimate
Market segment
The expected up-take of the innovative technology in different segments
# TO INSERT HERE: applicant provides an estimate
Definition of the baseline technology
The baseline technology is an alternator with 67% efficiency in the case the innovative technology is fitted on a new vehicle type.
Where the alternator is fitted to an existing vehicle type, the baseline technology should be the alternator of the most recent version of that type placed on the market.
# TO INSERT HERE: applicant provides label and short technical description of the baseline technology
# TO INSERT HERE: applicant provides proving documents and/or data or an expert judgement on the market share of the baseline technology in the reference year.
# TO INSERT HERE: applicant provides measurement protocols verified by an independent technical body
Testing methodology
Procedure
The efficiency of the alternator must be determined by doing measurements in accordance with the ISO 8854:2012.
The test bench is to be a ‘direct drive’ alternator test bench. The alternator is to be directly linked to the torque meter and to the shaft of the drive train. The alternator is to be loaded with a battery and an electronic load.
At each speed the alternator is charged at 50 % of the rated current.
75
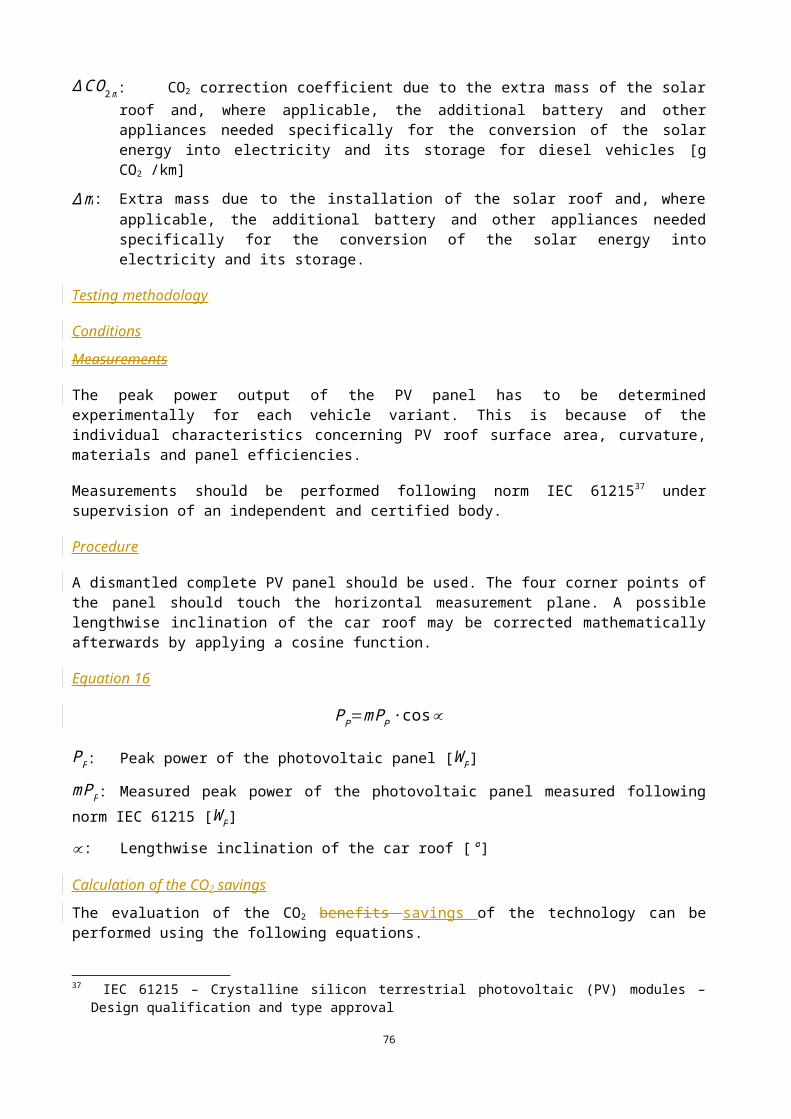
A result of this test is the efficiencies of the alternator (A-EI ) at 4 different speeds in rounds per minute (rpm):
- At a speed of 1 800 rpm
- At a speed of 3 000 rpm
- At a speed of 6 000 rpm
- At a speed of 10 000 rpm
This leads to the following equation.
Equation 24
❑❑❑❑❑❑❑❑❑❑
❑❑: Average efficiency of the alternator [-]
❑❑: Efficiency of the alternator at 1 800 rpm and 0.5 maximum load [-]
❑❑: Efficiency of the alternator at 3 000 rpm and 0.5 maximum load [-]
❑❑: Efficiency of the alternator at 6 000 rpm and 0.5 maximum load [-]
❑❑: Efficiency of the alternator at 10 000 rpm and 0.5 maximum load [-]
Calculation of the share of saved mechanical power savings
The high efficient alternator leads to the saved mechanical power which is to be calculated in two steps. In the first step the saved mechanical power is to be calculated under ‘real world’ conditions. The second step is to calculate the saved mechanical power under type approval conditions. Subtracting these 2 mechanical power savings is to result in the accountable share of the saved mechanical power.
Equation 25
∆ Pm=∆ Pm−RW−∆ Pm−TA
Where the saved mechanical power under ‘real-world’ conditions is
Equation 26
∆ Pm−RW=PRW
ηA−B−
PRW
ηA−EI
and the saved mechanical power under type-approval conditions is
Equation 27
∆ Pm−TA=PTA
ηA−B−
PTA
ηA−EI
PRW: Power requirement under ‘real-world’ conditions [W]
PTA: Power requirement under type-approval conditions [W]
76
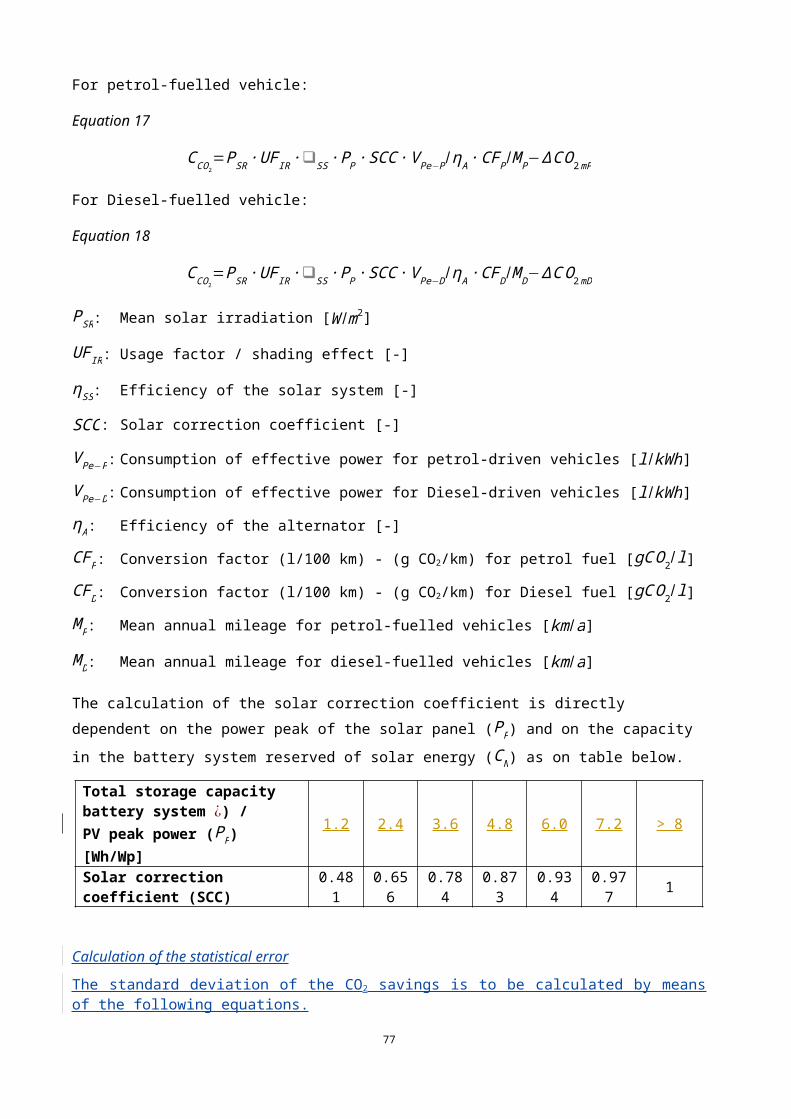
ηA−B: Efficiency of the baseline alternator [-]
ηA−EI : Efficiency of the eco-innovative alternator [-]
Calculation of the CO2 savings
The testing methodology to evaluate of the CO2 benefits savings of the technology can be evaluated using the following equations.
For petrol-fuelled vehicle:
Equation 28
CC O2=∆ Pm ∙ V Pe−P ∙CF P/ v
For Diesel-fuelled vehicle:
Equation 29
CC O2=∆ Pm ∙ V Pe−D ∙ CFD /v
Δ Pm: Share of saved mechanical power [W]
v: Mean driving speed of the NEDC [km /h]
V Pe−P: Consumption of effective power for petrol-driven vehicles [l /kWh]
V Pe−D: Consumption of effective power for Diesel-driven vehicles [l /kWh]
CFP: Conversion factor (l/100 km) - (g CO2/km) for petrol fuel [gC O2/ l]
CFD: Conversion factor (l/100 km) - (g CO2/km) for Diesel fuel [gC O2/ l]
Calculation of the statistical error
The standard deviation of the CO2 savings is to be calculated by means of the following equations.
For petrol-fuelled vehicle:
Equation 30
❑❑❑❑√(❑❑❑
❑❑❑❑❑)
❑ (❑❑❑❑ )❑❑
❑ ❑❑❑❑/❑❑❑❑
For Diesel-fuelled vehicle:
Equation 31
❑❑❑❑√(❑❑❑
❑❑❑❑❑)
❑ (❑❑❑❑ )❑❑
❑ ❑❑❑❑/❑❑❑❑
# TO INSERT HERE: applicant provides the description of the methodology to quantify the statistical errors following the procedure described in Chap. 6.3.
Implementation
77
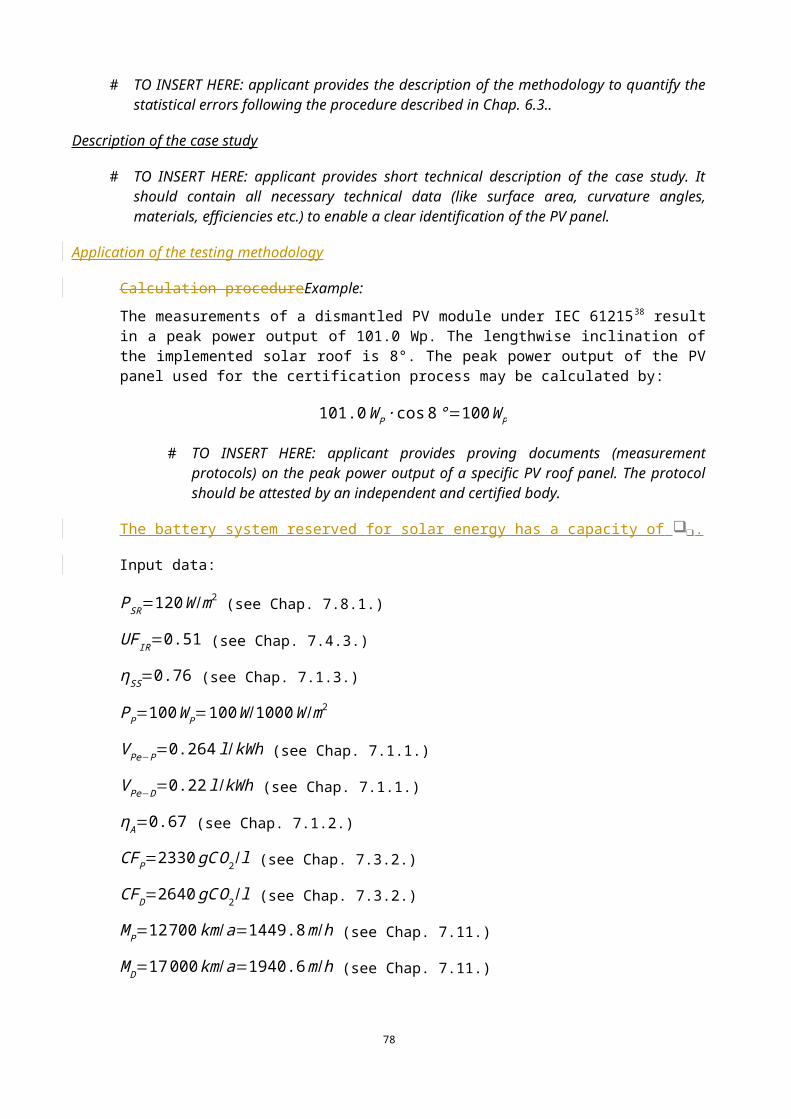
For determining the CO2 savings to be certified by the type approval authority, the manufacturer of the M1 vehicle in which the alternator is fitted has to designate an eco-innovation vehicle fitted with the eco-innovative alternator and either of the following baseline vehicles:
- if the eco-innovation is fitted to a new vehicle type which will be submitted to a new type approval, the baseline vehicle is to be the same as the new vehicle type in all respects except with regard to the alternator which is to be an alternator with an efficiency of 67 %, or
- if the eco-innovation is fitted to an existing vehicle version for which the type approval will be extended following the replacement of the existing alternator by the eco-innovation, the base vehicle is to be the same as the eco-innovation vehicle in all respects except with regard to the alternator which is to be the alternator of the existing vehicle version.
Application of the testing methodology
Calculation procedure
Example
Input data:
PRW=750W (see Chap. 7.6)
PTA=350 W (see Chap. 7.6)
v=33.58 km /h (see Chap. 7.2)
V Pe−P=0.264 l /kWh (see Chap. 7.1.1)
V Pe−D=0.22 l /kWh (see Chap. 7.1.1)
ηA=0.67 (see Chap. 7.1.2)
CFP=2330 gC O2/ l (see Chap. 7.3.2)
CF D=2640 gC O2/ l (see Chap. 7.3.2)
Calculation of the saved mechanical power under ‘real-world’ conditions:
∆ Pm−RW=PRW
ηA−B−
PRW
ηA−EI=750 W
0.67−750 W
0.=W
Calculation of the saved mechanical power under type-approval conditions:
∆ Pm−TA=PTA
ηA−
PTA
ηA−EI=350W
0.67−350 W
0.=W
Calculation of the accountable share of saved mechanical power:
∆ Pm=∆ Pm−RW−∆ Pm−TA=W−W=W
Calculation of the CO2 saving per petrol-fuelled vehicle:
CC O2=∆ Pm ∙ V Pe−P ∙CFP/ v=W ∙0.264 l /kWh∙
2330 gC O2/ l33.58 km /h
=gC O2/km
Calculation of the CO2 saving per diesel-fuelled vehicle:
78
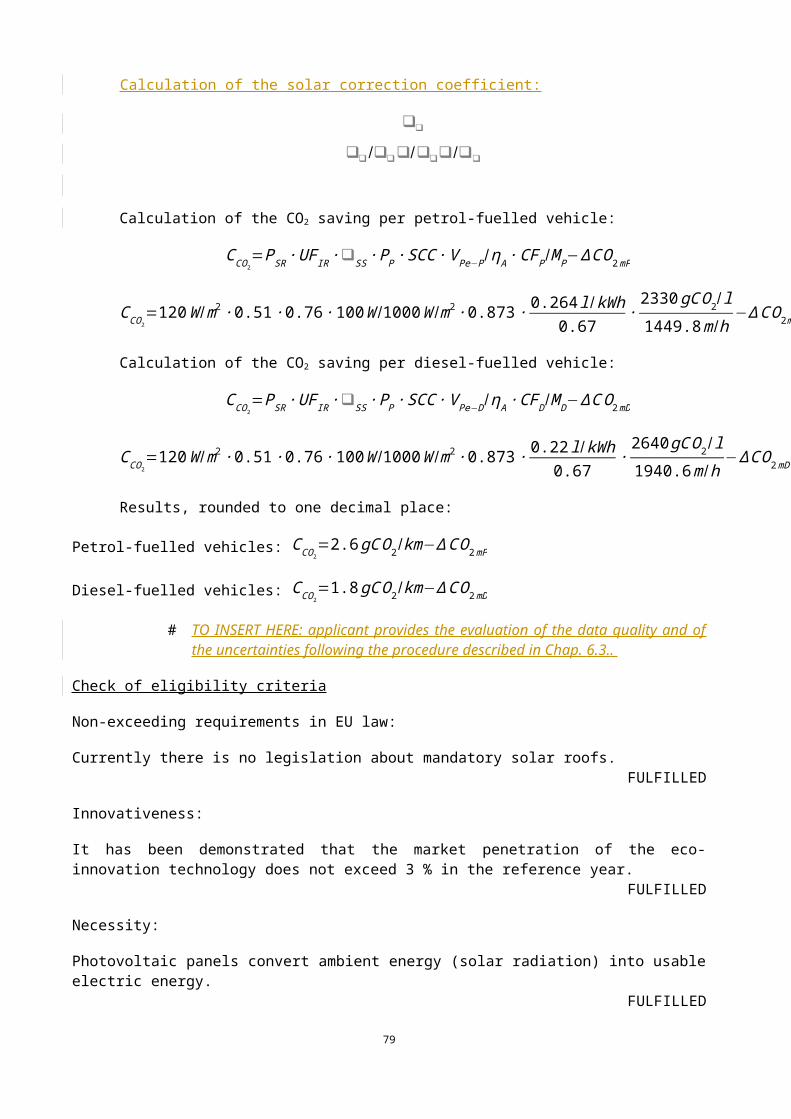
CC O2=∆ Pm ∙ V Pe−D ∙ CFD /v=W ∙0.22 l /kWh∙
2640 gC O2/ l33.58 km /h
=gC O2/km
Results, rounded to one decimal place:
Petrol-fuelled vehicles: CC O2=gC O2/km
Diesel-fuelled vehicles: CC O2=gC O2 /km
# TO INSERT HERE: applicant provides the calculation of the evaluation of the data quality and of the uncertainties following the procedure described in Chap. 6.3.
For petrol-fuelled vehicle:
❑❑❑❑
(❑❑❑❑)❑❑
❑ ❑❑❑❑ /❑❑❑❑❑❑ /❑
For Diesel-fuelled vehicle:
❑❑❑❑
(❑❑❑❑)❑❑
❑ ❑❑❑❑ /❑❑❑❑❑❑ /❑
Check of the standard deviation of the total CO2 saving criteria:
❑❑❑❑
❑❑/❑
In the Commission Implementing Decisions of the applications of Valeo41 and Denso42 the statistical analysis which must be performed is explained in detail.
Check of eligibility criteria
Non-exceeding requirements in EU law:
Currently there is no legislation about minimum requirements on efficiencies of alternators.FULFILLED
Innovativeness:
It has been demonstrated that the market penetration of the eco-innovation technology does not exceed 3 % in the reference year.
FULFILLED
Necessity:
Alternators are essential for the on-board production of electric energy and, therefore, are essential for the safe operation of the vehicle (no further documents necessary).
FULFILLED
Verifiability:
The rounded (maximum to two decimal places) unrounded CO2 savings of the eco-innovation technology, subtracted by its standard deviation of 0.7595 g CO2/km (petrol-fuelled) resp. 0.7171 g CO2/km (diesel-fuelled) do not exceed the minimum threshold of 1 g CO2/km.
NOT FULFILLED
Coverage:
79
The eco-innovation technology is partially covered by the CO2 type approval test procedure, since the alternator is also activated during the NEDC to compensate the power requirement of all non-switchable electric devices. The CO2 saving effect occurring under type-approval conditions has been subtracted from the total “real-world” effect.
FULFILLED
Accountability:
The on-board energy management and the activation of the alternator are not under the influence of the driver’s choice.
FULFILLED
Total result
In the example, the application cannot be granted because of non-compliance with the ‘verifiability’ criteria.
Considerations
Below two calculations are given on fictive examples to illustrate that value of the baseline alternator is rather sensitive when this baseline alternator is replaced by an alternator with a higher efficiency.
Example A: An alternator is replaced by an alternator with a higher efficiency.
An alternator with an efficiency of 77% is introduced.
When this alternator replaces a baseline alternator with an efficiency of 67%, then you will get
∆ Pm−TA=PTA
ηA−
PTA
ηA−EI=350W
0.67−350 W
0.77=67.8W
When this alternator replaces a baseline alternator of 71%, then you will get
∆ Pm−TA=PTA
ηA−
PTA
ηA−EI=350W
0.71−350 W
0.77=38.4 W
The difference between the two alternators is 43.3 %.
Example B: The CO2-effect of a new electric device is calculated (for instance LED).
Due to LED lighting a saving is realized of 97 W.
With a baseline alternator with an efficiency of 67% this leads to:
CC O2=∆ Pm ∙ UF ∙ V Pe−P /ηA ∙CFP/ v=97 W ∙ 0.264 l /kWh
0.67∙2330 gC O2/ l33.58 km /h
=0.8752 gC O2/km
And with a baseline alternator of 71% this leads to:
CC O2=∆ Pm ∙ UF ∙ V Pe−P /ηA ∙CFP/ v=97 W ∙ 0.264 l /kWh
0.71∙2330 gC O2/ l33.58 km /h
=0.8259 gC O2 /km
The difference between the two alternators is 5.6 %.
80
The conclusion is that the value of the baseline alternator is rather sensitive when an alternator is replaced by another alternator. For the calculation of the benefits of electric devices this effect is less sensitive.
Therefor two measurements are needed when an alternator replaces another alternator: the measurement of the baseline alternator and the measurement of the high efficient alternator.
81
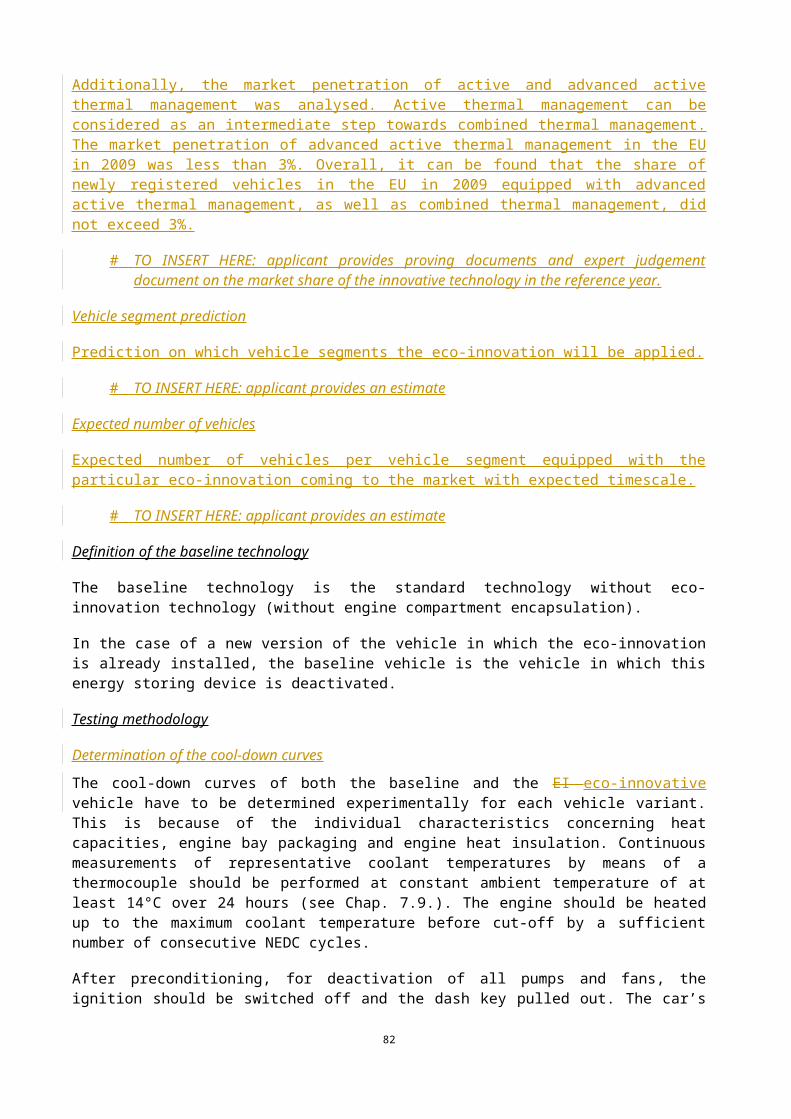
Appendix I – Template for a full application
APPLICANT CONTACTS
Name and address and contact person of the applicant
TESTING METHODOLOGY
Choice of type of testing methodology:
Simplified approach (Chap 6.1).
Comprehensive methodology (Chap 6.2).
SUMMARY OF THE APPLICATION
Summary of the application for publication (Chap 6.7) on the DG CLIMA website5. The summary should not contain confidential information.
A template for the summary of the full application can be found in the Appendix II.
SUPPORTING DOCUMENTATION
List of supporting documentation.
TECHNICAL DESCRIPTION
Technical description of the eco-innovation and the way it is fitted on a vehicle in words and, when appropriate, illustrated technical drawings.
INNOVATIVENESS
Supporting documentation demonstrating that the innovative technology does not exceed 3 % in the reference year 2009 (Chap 4.2).
VEHICLE SEGMENTS PREDICTION
Prediction on which vehicle segments the eco-innovation will be applied (estimate only).
EXPECTED NUMBER OF VEHICLES
Expected number of vehicles per vehicle segment equipped with the particular eco-innovation coming to the market with expected timescale (estimate only).
DEFINITION OF THE BASELINE TECHNOLOGY
Identification of the baseline technology for the envisaged vehicle segments.
TECHNICAL DESCRIPTION OF THE BASELINE TECHNOLOGY
Technical description of the baseline technology.
EVALUATION OF NEGATIVE EFFECTS
82
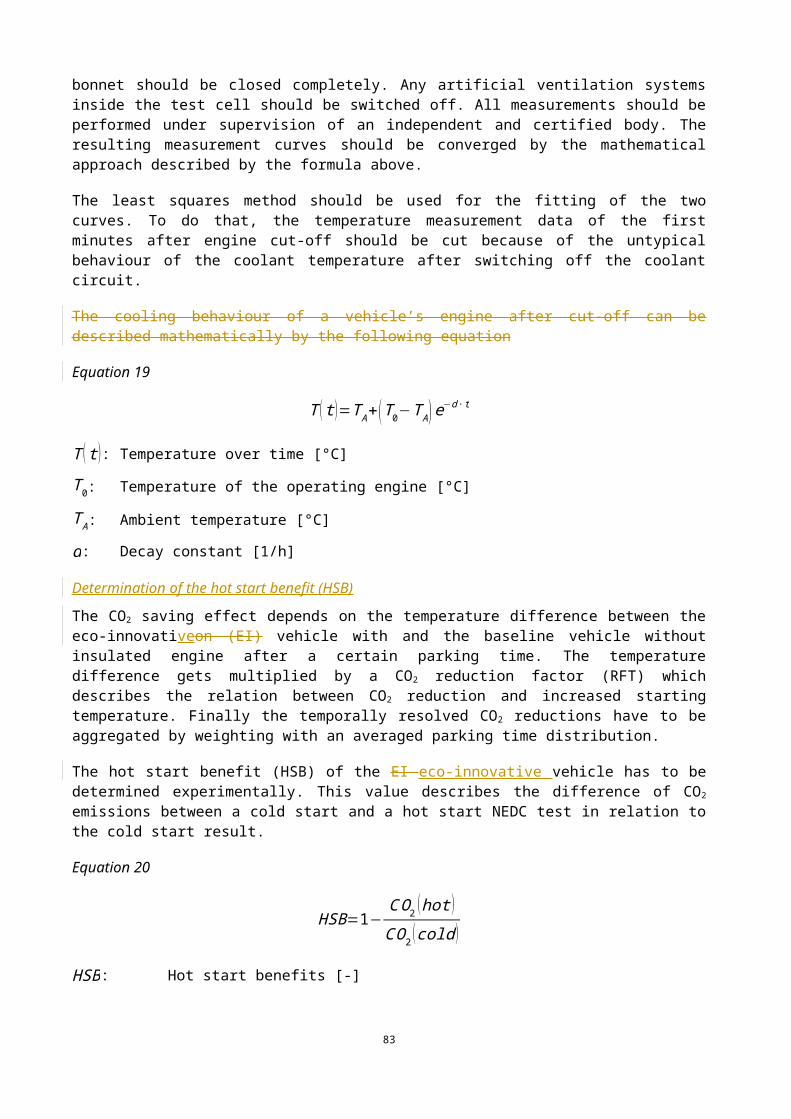
Description of the technology characteristics that could lead to increased CO2 emission (e.g. higher mass, higher drag resistance).
DETERIORATION EFFECTS OR SOUND ARGUMENTATION
In case of comprehensive methodology, eWhen relevant, experimental analyses of deterioration effects or sound argumentation should be evaluated (see Chap. 6.2).
TESTING METHODOLOGY
Description of the testing methodology, including measurement/modelling condition and equipment, measurement/modelling procedure and method of calculation of the CO2 savings (see Chap. 3).
Identification of the uncertainties and description of the methodology to quantify the statistical errors (see Chap 4.4.1).
CALCULATION DESCRIPTION OF THE CASE STUDY PROCEDURE
Description of the calculation procedure for the case study (see Chap. 3).
DETAILED TECHNICAL DATA
In case of comprehensive methodology, further detailed technical data of case study vehicle(s) should be provided (see Chap. 6.2)
RESULTING APPLICATION OF THE TESTING METHODOLOGY CO 2 SAVINGS
Application of the testing methodology for the case study and calculation of the corresponding resulting CO2 savings (differentiated per envisaged vehicle segment, where relevant) (see Chap. 3).Resulting CO2
savings (differentiated per envisaged vehicle segment, where relevant) (see Chap. 3)
UNCERTAINTY ANALYSES
Comprehensive Application of uncertainty analysessis and quantification of statistical errors (Chap 4.4.1.)
CHECK IF ALL ELIGIBILITY CRITERIA
Check if all eligibility criteria specified in Article 2 and Article 4(2)(e), (f) and (g) of Regulation (EU) No 725/2011 and described in Chap. 4 of these guidelines are fulfilled; reasons and evidential data have to be provided for each of them:
(10) Non-exceeding requirements in EU law
(11) Innovativeness of technology
(12) Necessity of technology (non-comfort)
(13) Verifiability of CO2 saving (minimum threshold)
(14) Coverage (type approval procedure)
83
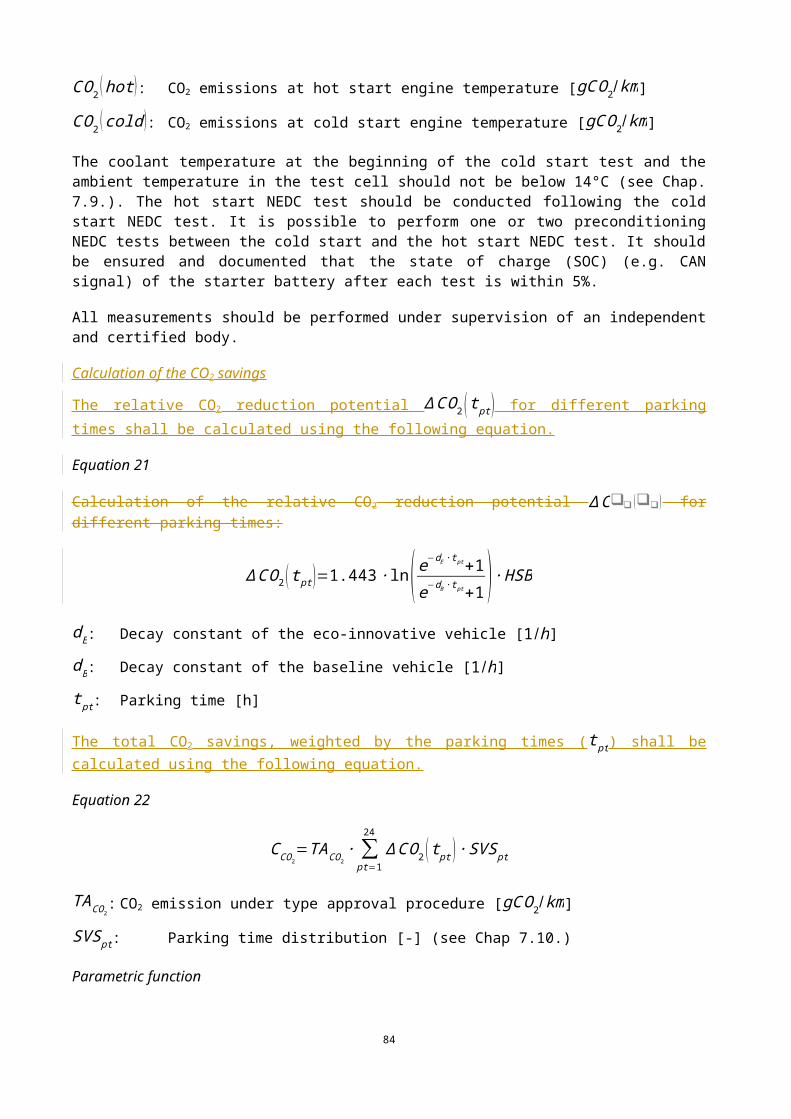
(15) Accountability (influence of driver)
- Description of testing methodology (modelling / measurements)
VERIFICATION REPORT
Verification report from an independent certification body (Chap 6.6)
(16) Testing protocols of all relevant measurements
(17) Check of fulfilment of the eligibility criteria
(18) Check of possible deterioration effects
(19) Check of suitability of the testing methodology for determining the CO2 savings from the eco-innovation (only comprehensive approach)
[(19)] Check of possible deterioration effects (only comprehensive approach)
[(20)] Check of suitability of parametric function (if CO2 saving depends on one or more vehicle parameters) (only comprehensive approach)
84
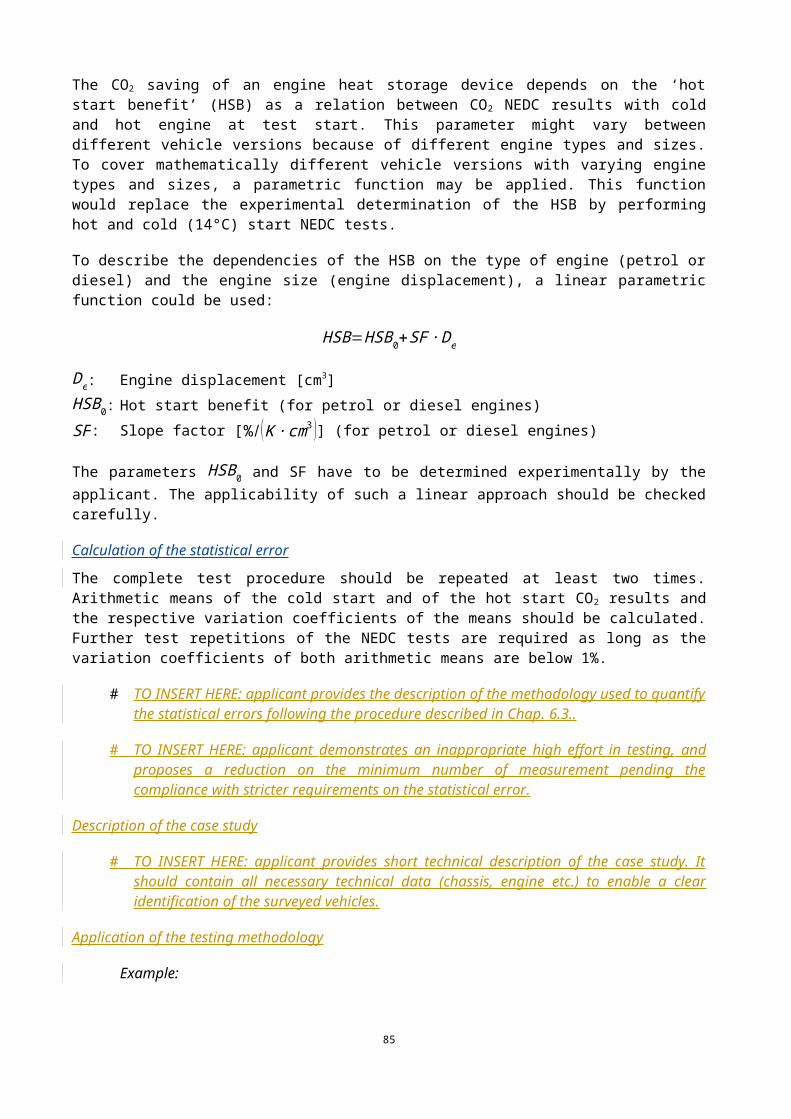
Appendix II – Template for the summary description of the full application
CONTACT DETAILS
Applicants name:
SUMMARY
Brief description of the innovative technology and its potential CO2 savings:
INNOVATIVENESS
Market penetration of the new technology based on the reference year 2009:
NECESSITY
Information whether the innovative technology is intrinsic to the efficient operation in terms of performance and/or safety of the vehicle:
MEASUREMENT METHODOLOGY
Description of the measurement methodology or reference to a methodology set out in the Technical Guidelines:
85
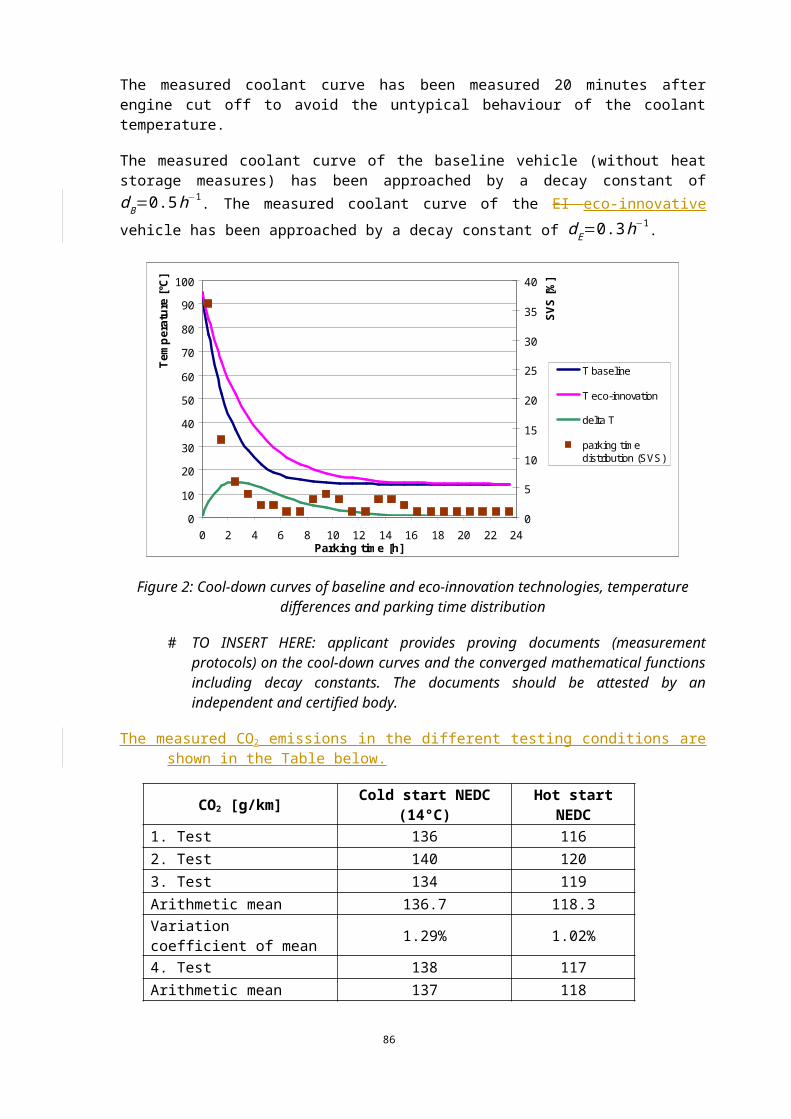
Appendix III – Template for short application
APPLICANT CONTACTS
Name and address and contact person of the applicant
SUMMARY OF THE APPLICATION
Summary of the application for publication (Chap 6.7) on the DG CLIMA website5. The summary should not contain confidential information.
A template for the summary for the short application can be found in the Appendix IV.
SUPPORTING DOCUMENTATION
List of supporting documentation.
COMMISSION IMPLEMENTING DECISION REFERENCE
Reference to the relevant existing Commission Implementing Decision approving a similar technology and formal declaration that the technology is in all essential elements the same as the one subject to the approval decision, that the approved testing methodology is applicable and that the level of savings are consistent with the 1 g CO2/km threshold.
TECHNICAL DESCRIPTION
Technical description of the eco-innovation and the way it is fitted on a vehicle in words and illustrated by technical drawings
VEHICLE SEGMENTS PREDICTION
Prediction on which vehicle segments the eco-innovation will be applied (estimate only)
EXPECTED NUMBER OF VEHICLES
Expected number of vehicles per vehicle segment equipped with the particular eco-innovation coming to the market with expected timescale (estimate only)
VERIFICATION REPORT
Verification report from an independent certification body.
86
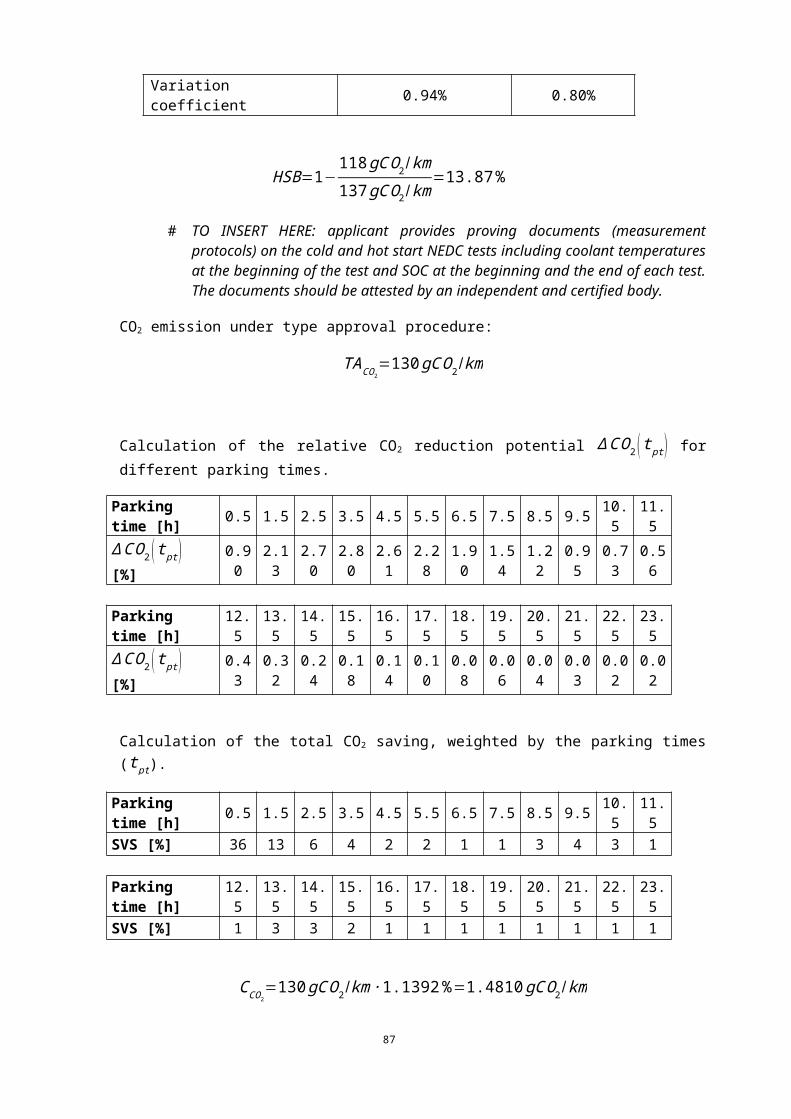
Appendix IV – Template for the summary description of the short application
CONTACT DETAILS
Applicants name:
SUMMARY
Brief description of the innovative technology and its potential CO2 savings:
REFERENCE TO THE EXISTING COMMISSION IMPLEMENTING DECISION
Reference to the relevant existing Commission Implementing Decision approving a similar technology
87
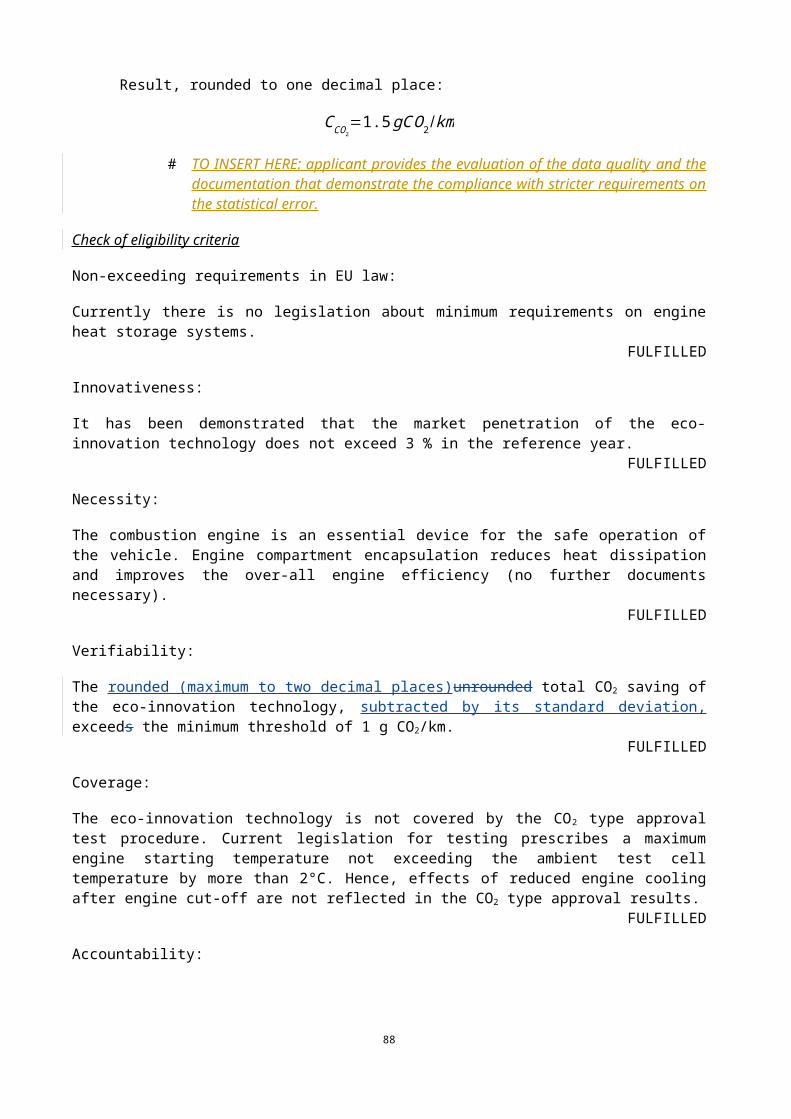
Annex I – Data sources of Chapter 71. EFFICIENCIES
Efficiency of engine
European Commission - Joint Research CentreInstitute for Energy and TransportSustainable Transport UnitVehicle Emissions Laboratory (VELA)- Internal measurements
European Association of Automobile Suppliers (CLEPA)
ECE/TRANS/WP.29/2014/27
Efficiency of alternator
European Commission - Joint Research CentreInstitute for Energy and TransportSustainable Transport UnitVehicle Emissions Laboratory (VELA)- Internal measurements
‘VDA approach’:ηA=0.25 ∙ η1 800rpm ,0.5 l N
+0.40 ∙ η3000rpm ,0.5 l N+0.25 ∙ η6000rpm ,0.5 l N
+0.10 ∙ η10 000rpm ,0.5 lN
ISO 8854:2012 Alternators with regulators - Test methods and general requirements45
European Association of Automobile Suppliers (CLEPA)
- Notice in writing
Electrical solar system efficiency
European Commission - Joint Research CentreInstitute for Energy and TransportSustainable Transport UnitVehicle Emissions Laboratory (VELA)European Solar Test Installation (ESTI)46
- Internal measurements based on:
Hacker, F.; Zimmer, W.; Vonk, W.; Bleuanus, S.: Assessment of eco-innovation technologies - Final report. On behalf of the European Commission, framework contract no.: ENV/C.5/FRA/2006/0071. 18 May 2010.
2. DRIVING CYCLE CHARACTERISTICS
UN/ECE Regulation No. 83: Uniform provisions concerning the approval of vehicles with regard to the emission of pollutants according to engine fuel requirements47.
45 ISO 8854:2012: 46 European Solar Test Installation (ESTI): http://re.jrc.ec.europa.eu/esti/ 47 UN/ECE Regulation No 83: http://www.unece.org/fileadmin/DAM/trans/main/wp29/wp29regs/r083r4e.pdf
88

3. FUEL CHARACTERISTICS
Fuel densities
European Commission - Joint Research CentreInstitute for Energy and Transport
Commission Regulation (EC) No 692/2008 of 18 July 2008 implementing and amending Regulation (EC) No 715/2007 of the European Parliament and of the Council on type-approval of motor vehicles with respect to emissions from light passenger and commercial vehicles (Euro 5 and Euro 6) and on access to vehicle repair and maintenance information48
Hass, H.; Huss, A.; Maas, H.: Tank-to-Wheels Report TANK-TO-WHEELS Report – Version 4.a. JRC Technical Reports.49
European Commission - Joint Research CentreInstitute for Energy and Transport
Conversion fuel consumption - CO2 emission
European Automobile Manufacturers’ Association (ACEA) / Verband der Automobilindustrie (VDA)Notice in writing
4. USAGE FACTORS
Vehicle lighting
European Association of Automobile Suppliers (CLEPA)
Notice in writing
Shading of solar panels
European Commission - Joint Research CentreInstitute for Energy and TransportSustainable Transport UnitVehicle Emissions Laboratory (VELA)- Internal calculations, Bbased on calculations on vehicles GPS-data of vehicles in the city of Modena.
Hacker, F.; Zimmer, W.; Vonk, W.; Bleuanus, S.: Assessment of eco-innovation technologies - Final report. On behalf of the European Commission, framework contract no.: ENV/C.5/FRA/2006/0071. 18 May 2010.
Windscreen wipers
European Commission - Joint Research CentreInstitute for Energy and TransportSustainable Transport Unit- Expert judgement
48 Regulation (EC) No 692/2008: http://europa.eu/!Fp86uj 49 Tank-to-Wheels Report: http://europa.eu/!tU34TV
89
5. POWER REQUIREMENTS OF LIGHTING TYPES
Halogen tungsten
European Association of Automobile Suppliers (CLEPA)
Based on input from CLEPA Light Sight Safety given in December 2012
Notice in writing
Xenon gas discharge
European Association of Automobile Suppliers (CLEPA)
Based on input from CLEPA Light Sight Safety given in December 2012
Notice in writing
Total electric power requirements
European Automobile Manufacturers’ Association (ACEA) / Verband der Automobilindustrie (VDA)Notice in writing
European Association of Automobile Suppliers (CLEPA)
Notice in writing
6. EMISSIONS DUE TO EXTRA WEIGHT
Mellios, G.; Hausberger, S.; Keller, M.; Samaras C.; Ntziachristos L.; Dilara P.: Fontanas G.: Parametrisation of fuel consumption and CO2 emissions of passenger cars and light commercial vehicles for modelling purposes. JRC Scientific and Technical Reports. European Commission - Joint Research CentreInstitute for Energy and Transport
7. SOLAR RADIATION
Solar radiation in Europe
European Commission - Joint Research CentreInstitute for Energy and TransportRenewable Energy Unit- Photovoltaic Geographical Information System (PVGIS)50
Solar correction coefficient
European Commission - Joint Research CentreInstitute for Energy and TransportSustainable Transport UnitRenewable Energy UnitVehicle Emissions Laboratory (VELA)- Internal calculations based on measurements of solar radiation in Europe by the BSRN Network51
50 Photovoltaic Geographical Information System (PVGIS): http://re.jrc.ec.europa.eu/pvgis/ 51 World Radiation Monitoring Center (WRMC): www.bsrn.awi.de
90
8. AMBIENT TEMPERATURE
European Environment AgencyEuropean Commission - Joint Research CentreInstitute for Energy and TransportSustainable Transport UnitRenewable Energy Unit- Internal calculation based on:
Global and European temperature (CSI 012). Assessment published June 201052
Corine Land Cover 200653
ECMWF operational forecast data54
TRACCS transport data collection55
9. ENGINE STARTING TEMPERATURE
European Commission - Joint Research CentreInstitute for Energy and TransportSustainable Transport UnitVehicle Emissions Laboratory (VELA)- Internal measurements
10. PARKING TIME DISTRIBUTION
European Commission - Joint Research CentreInstitute for Energy and TransportSustainable Transport Unit- Expert judgement based on:
Kühlwein, J.: Unsicherheiten bei der rechnerischen Ermittlung von Schadstoffemissionen des Straßenverkehrs und Anforderungen an zukünftige Modelle. - Dissertation, University of Stuttgart, 30.11.200456
Infras AG: Handbook emission factors for road transport (HBEFA). Version 3.1. Parking time distribution for Switzerland57
11. MILEAGES
University of Stuttgart, GermanyInstitute for Energy Economics and the Rational Use of EnergyUnit for Technology Assessment and Environment
European Commission - Joint Research CentreInstitute for Energy and TransportSustainable Transport Unit- Internal calculations based on:
52 Global and European temperature (CSI 012/CLIM 001): http://europa.eu/!KW77kj 53 Corine Land Cover 2006: http://europa.eu/!mK84bQ 54 ECMWF: http://old.ecmwf.int/research/ifsdocs/CY38r1/ 55 TRACCS: http://traccs.emisia.com/ 56 Uncertainties in the arithmetical determination of pollutant emissions from road traffic and demands on future
models: http://elib.uni-stuttgart.de/opus/volltexte/2004/2079/57 HBEFA: http://www.hbefa.net/e/index.html
91
Transport & Mobility Leuven, Belgium: TREMOVE: an EU-wide transport model (Calculations for Euro 3, Euro 4 and Euro 5 passenger cars in 2010)58
TRACCS transport data collection59
12. ROAD ROUGHNESS
European Commission - Joint Research CentreInstitute for Energy and TransportSustainable Transport Unit- Expert judgement based on:
Zuo, L.; Nayfeh, S.A.: Structured H2 Optimization of Vehicle Suspensions Based on Multi-Wheel Models. Vehicle System Dynamics, Vol. 40, No. 5, pages 351 – 371
Greco, G.; Nepote, A.; Van Grootveld, G.; Martini, G.: Kinetic Energy to Electric Energy Conversion Using Regenerative Shock Absorbers. FISITA 2014 World Automotive Congress p. F2014-IVC-02060
13. STIFFNESS OF ONE TIRE
European Commission - Joint Research CentreInstitute for Energy and TransportSustainable Transport Unit- Expert judgement based on:
van Zyl, S.; van Goethem, S.; Kanarachos S.; Rexeis, M.; Hausberger, S.; Smokers, R.: Study on Tyre Pressure Monitoring Systems (TPMS) as a means to reduce Light-Commercial and Heavy-Duty Vehicles fuel consumption and CO2 emissions. Final Report. TNO 2013 R1098661.
58 TREMOVE economic transport and emissions model: http://www.tmleuven.be/methode/tremove/home.htm 59 TRACCS: http://traccs.emisia.com/ 60 FISITA 2014 World Automotive Congress p. F2014-IVC-020:
http://www.fisita2014.com/programme/sessions/F2014-IVC-020 61 TNO 2013 R10986: http://europa.eu/!uC94hG
92