action plan for nuclear safety - project marine … · iaea action plan for nuclear safety -project...
TRANSCRIPT

1
Action Plan for Nuclear Safety - Project
Marine Monitoring: Confidence Building and
Data Quality Assurance
PROGRESS REPORT
Inter-laboratory comparisons 2014-2015
Determination of radionuclides
in seawater, sediment and fish

2
IAEA Environment Laboratories
Monaco, April 2016

3
IAEA Action Plan for Nuclear Safety - Project “Marine Monitoring: Confidence Building and Data Quality Assurance” Progress Report on Inter-laboratory comparisons 2014-2015: Determination of radionuclides in seawater, sediment and fish
SUMMARY REPORT
In the context of the IAEA Action Plan on Nuclear Safety, the IAEA, through its Environment Laboratories, is assisting the Government of Japan in ensuring that the Sea Area Monitoring Plan is comprehensive, credible and transparent. As part of the project “Marine Monitoring: Confidence Building and Data Quality Assurance”, four interlaboratory comparisons (ILCs) and two proficiency tests (PT) were organized in 2014 and 2015. The PT results published so far can be accessed on the IAEA web pages 1. The current progress report focuses on ILCs, which are a standard means for laboratories to assess the quality of their measurement results as compared to that of other participating laboratories and identify any potentially needed improvements. Within this project, joint sampling campaigns to collect seawater (Fig A), sediment and fish samples were undertaken. The resulting samples were subsequently analysed in each participating laboratory and the results were compared.
FIG. A. Collection of seawater samples for interlaboratory comparison immediately offshore
Fukushima Daiichi Nuclear Power Plant (November 2014).
In total, eight laboratories participated in at least one of the ILCs: five from Japan (participating on behalf of the Japanese authorities); the IAEA Environment Laboratories in Monaco; and, for the purpose of additional independent verification and transparency, one laboratory from Ireland and one from New Zealand, both members of the network of Analytical Laboratories for the Measurement of Environmental Radioactivity (ALMERA). Surface seawater samples were collected during each of the four sampling missions at five sampling stations in the proximity of the Fukushima Daiichi nuclear power plant. The sampling of marine 1 2014 Proficiency Test report accessible at http://www-pub.iaea.org/MTCD/Publications/PDF/IAEA_AQ_43_web.pdf

4
sediment was done during a mission in May 2015 at two sampling stations in the proximity of the Fukushima Daiichi nuclear power plant. Five batches of fresh fish samples (cod, flounder and mackerel) caught at locations in the vicinity of Fukushima Daiichi Nuclear Power Plant were collected during a mission in November 2015. Radionuclides of interest in seawater, sediment and fish were determined by participating laboratories using radioanalytical methods, including liquid scintillation counting (for 3H), gas-flow proportional counting (for 90Sr), alpha spectrometry (for 239+240Pu) and gamma spectrometry (for 134Cs and 137Cs). The results of the laboratories were collected by the IAEA, compared and evaluated with statistical tests. For one of the exercises an independent ALMERA laboratory in Hungary (Radioanalytical Reference Laboratory of the National Food Chain Safety Office) assisted in the collection and assessment of the data. From the statistical analysis it can be concluded that the overwhelming majority of the results are not significantly different from each other (see example in Fig. B). An analysis of the whole data set demonstrated that 202 out of the 205 statistical tests applied to the data for different radionuclides and samples, i.e. over 98.5%, were passed with a high level of confidence (99%). Given that departures found are minor, i.e. for 1.5% of the statistical tests applied to the data, it can be said with confidence that the laboratories are reporting reliable and comparable results for the tested radionuclides in seawater, sediment and fish samples prepared and analysed according to each laboratory’s regularly used methods.
FIG. B. Example of results of an interlaboratory comparison exercise organised in May 2015: Good agreement was obtained between activity concentrations of 137Cs reported by laboratories in Japan (Japan Chemical Analysis Center - JCAC), Ireland (Environmental Protection Agency – EPA), New
Zealand (Institute of Environmental Science and Research – ESR) and the IAEA for each of five seawater samples (for details please refer to extended report).
Following the four sampling missions organized since mid-2014, the IAEA can confidently report that Japan's sample collection procedures follow the appropriate methodological standards required to obtain representative samples. The results obtained so far in ILCs demonstrate a high level of accuracy and competence on the part of the tested Japanese laboratories involved in the analyses of radionuclides in marine samples for the Sea Area Monitoring programme.

5
1. BACKGROUND
In the context of the IAEA Action Plan on Nuclear Safety, the IAEA Environment Laboratories assist the Government of Japan in ensuring that the Sea Area Monitoring Plan is comprehensive, credible and transparent. Four sampling missions were organized in 2014 and 2015 to collect seawater, sediment and fish samples for interlaboratory comparisons (ILCs). The missions were carried out within the project “Marine Monitoring: Confidence Building and Data Quality Assurance”. TABLE 1. OVERVIEW OF INTERLABORATORY COMPARISONS
Intercomparison Seawater Sediment Fish Participating laboratories
September 2014
3H 90Sr
134Cs 137Cs
– – GSL (3H) IAEA KANSO (90Sr, 134Cs and 137Cs)
November 2014
3H 90Sr
134Cs 137Cs
– – GSL (3H) IAEA KANSO (90Sr, 134Cs and 137Cs)
May 2015
3H 90Sr
134Cs 137Cs
134Cs 137Cs
239/240Pu –
EPA ESR IAEA JCAC
November 2015
3H 90Sr
134Cs 137Cs
– 134Cs 137Cs
GSL (seawater: 3H) IAEA (seawater and fish) JCAC (seawater and fish) KANSO (seawater: 90Sr, 134Cs and 137Cs) JFFIC (fish) MERI (fish)
Participating laboratories: EPA Environmental Protection Agency, Ireland ESR Institute of Environmental Science and Research, New Zealand GSL Geo Science Laboratory, Japan IAEA IAEA Environment Laboratories, Monaco JCAC Japan Chemical Analysis Center, Japan JFFIC Japan Frozen Foods Inspection Corporation, Japan KANSO General Environmental Technos, Japan MERI Marine Ecology Research Institute, Japan

6
2. SEAWATER, SEDIMENT AND FISH SAMPLING AND PREPARATION 2.1. SEAWATER Surface seawater samples were collected during all four sampling missions at five sampling stations (M-101, M-102, M-103, M-104 and T-D1) offshore Fukushima Daiichi nuclear power plant. The coordinates of the sampling stations are given in Table 2 and shown in Figure 1. TABLE 2. COORDINATES OF THE SAMPLING STATIONS
Sampling station Latitude (N) Longitude (E) M-101 (seawater) 37°25′36″ 141°02′36″ M-102 (seawater) 37°25′06″ 141°02′36″ M-103 (seawater) 37°26′42″ 141°02′48″ M-104 (seawater) 37°24′06″ 141°02′48″
T-D1 (seawater and sediment) 37°30′00″ 141°04′20″ T-D9 (sediment) 37°19′23″ 141°04′01″
FIG. 1. Locations of sampling stations offshore Fukushima Daiichi nuclear power plant.
During the September and November 2014 missions, two surface seawater samples were collected from each sampling location for subsequent analysis for 90Sr, 134Cs and 137Cs at a Japanese laboratory (KANSO) and the IAEA Environment laboratories in Monaco. Two separate surface seawater samples were collected at the same locations for subsequent analysis for 3H at a Japanese laboratory (GSL) and the IAEA laboratories. Identical and homogeneous samples were collected using the procedures outlined below. The surface seawater was collected in Niskin bottles, mixed in a 50 L container and subsequently divided into two 20 L samples. This procedure was repeated three times at each sampling station, resulting in two 60 L of seawater samples being collected. Each sample was acidified to

7
pH 1-2 with concentrated HNO3. Upon arrival at the laboratory, the 60 L of seawater sample collected from each sampling station was mixed again before analysis. In the case of samples for analysis for 3H, two 2 L surface seawater samples were collected for the determination of tritium at each sampling station. These samples were not acidified. During the May and November 2015 missions, seawater samples were again collected from each sampling location for subsequent analysis for 90Sr, 134Cs and 137Cs and, separately, for 3H. As more laboratories participated in each of these exercises, a greater number of seawater samples were collected from each sampling location. In both missions, the procedure regarding the collection of 2 L seawater samples for analysis of 3H was identical to the 2014 exercises described above. In the case of samples for analysis for 90Sr, 134Cs and 137Cs, the collection and distribution method was changed however. A 400 L plastic container with four valves was first filled with seawater. 20 L containers were filled, three at a time, from each of the three/four valves (depending on the number of laboratories participating), resulting in a total of nine/twelve 20 L samples from each sampling station. Each sample was acidified to pH 1-2 with concentrated HNO3, as for the 2014 missions. Three 20 L samples were provided to each laboratory. The seawater sampling procedure and the distribution matrix, meant to ensure the homogenisation of the samples distributed to the four laboratories participating in the May 2015 exercise, is shown in Table 3, while the distribution matrix distributed to the three laboratories participating in the November 2015 exercise is shown in Table 4. TABLE 3. SAMPLE DISTRIBUTION BETWEEN FOUR LABORATORIES (MAY 2015)
Valve number 1 2 3 4
Seawater sample codes 1-1 1-2 1-3
2-1 2-2 2-3
3-1 3-2 3-3
4-1 4-2 4-3
Distribution pattern of the participating laboratories coded A, B, C and D
A 1-1 2-2 3-3
B 2-1 3-2 4-3
C 3-1 4-2 1-3
D 4-1 1-2 2-3
TABLE 4. SAMPLE DISTRIBUTION BETWEEN THREE LABORATORIES (NOV 2015)
Valve number 1 2 3 4
Seawater sample codes 1-1 1-2 1-3
2-1 2-2 2-3
3-1 3-2 3-3
Not used
Distribution pattern of the participating laboratories coded A, B, and C
A 1-1 2-2 3-3
B 2-1 3-2 1-3
C 3-1 1-2 2-3
–
2.2. SEDIMENT The sampling of sediment was done during May 2015 offshore Fukushima Daiichi nuclear power plant. Sediment samples at stations T-D1 and T-D9 off Fukushima were collected using a grab sampler. The coordinates of the sampling stations are given in Table 2. The sediment samples were oven dried at 105 °C on large stainless steel trays, crushed using stainless steel spatulae and sieved through a 2-mm mesh sieve at the KANSO laboratory. No grinding was required prior to sieving due to the sandy nature of the sediments. The sieved sample was grinded using mortars and pestles, then placed in a plastic bag and mixed thoroughly to ensure homogeneity. An incremental division method

8
was used for sample splitting. Each sample was split into two aliquots using a splitter, one aliquot was archived and the second one was further split until the required sample weight for each laboratory was attained. The sequence of splitting of each sample depended on the total weight of the sieved and grinded sample. The samples were then bottled in 500 mL plastic bottles and their homogeneity was re-checked using gamma-spectrometry. Approximately 350 g of dried sediment from each station was delivered to each participant. 2.3. FISH Five batches of fresh fish samples (two batches of cod, two batches of flounder and one batch of mackerel) caught at locations in the vicinity of Fukushima Daiichi Nuclear Power Plant were collected from the fish landing port of Onahama on 18 November 2015 (see Table 5). The fresh fish samples were prepared the next day at the Marine Ecology Research Institute (MERI) in Onjuku (Japan) and subsequently analysed for 134Cs and 137Cs at MERI. After subsequent measurement on 20 November 2015 at the Japan Chemical Analysis Center (JCAC) in Chiba (Japan) and the Japan Frozen Foods Inspection Corporation (JFFIC) in Yokohama (Japan), the fresh fish samples were frozen and shipped to the IAEA Environmental Laboratories in Monaco in early January 2016. After defrosting, the fresh fish samples were measured at the IAEA Environmental Laboratories between 26 and 30 January 2016. All measurements were done by gamma spectrometry with germanium semiconductor detectors. The measurement time per sample was 1 hour for MERI, JCAC and JFFIC and between 22 and 47 hours for the IAEA. All massic activities were reported at a reference time of 18 November 2015 0:00 UTC. TABLE 5. COORDINATES OF THE CATCH POSITION
Batch Latitude (N) Longitude (E) 15FA0001 cod 36°59′19″ 141°28′44″ 15FA0002 cod 36°59′19″ 141°28′44″ 15FA0003 flounder 37°06′16″ 141°07′49″ 15FA0004 flounder 36°54′42″ 141°02′16″ 15FA0005 mackerel 37°04′12″ 141°16′22″

9
3. METHODOLOGY OF RADIONUCLIDE DETERMINATION 3.1. SEAWATER Radionuclides of interest in seawater were determined by six laboratories participating in one or more inter-laboratory comparison: GSL, KANSO and JCAC, all participating on behalf of the Japan Nuclear Regulation Authority, and EPA, ESR and IAEA (see Table 1). 3.1.1. GSL methodology for seawater 3.1.1.1. Tritium analysis Tritium was determined by low-background liquid scintillation counting after distillation and electrolytic enrichment. 3.1.2. KANSO methodology for seawater 3.1.2.1. 90Sr analysis KANSO used an ion exchange resin for pre-concentration of strontium from seawater sample followed by precipitation of carbonates and barium chromate. After reaching of secular equilibrium, 90Y was separated using a Fe co-precipitation and measured by a gas-flow counter (Aloka LBC-472). 3.1.2.2. 134Cs and 137Cs analysis Chemical separation of caesium by using AMP followed by gamma-ray spectrometry was used for 134Cs and 137Cs determination in seawater. 3.1.3. JCAC methodology for seawater 3.1.3.1. Tritium analysis JCAC used liquid scintillation counter (Aloka LB-5) for measurement of tritium in seawater after distillation, electrolytic enrichment and second distillation. 3.1.3.2. 90Sr analysis For strontium determination ion exchange resins were used for pre-concentration of strontium from seawater sample followed by precipitation of carbonates and additional ion exchange for separation of calcium. 90Y was removed by scavenging and measurement was done after reaching of secular equilibrium by low background beta counter (Aloka LBC-4211). 3.1.3.3. 134Cs and 137Cs analysis Chemical separation of caesium by using AMP followed by gamma-ray spectrometry was used for 134Cs and 137Cs determination in seawater. 3.1.4. EPA methodology for seawater 3.1.4.1. 134Cs and 137Cs analysis At EPA, the previously acidified seawater samples were filtered through 0.45 μm filters and caesium was extracted using Triskem AMP-PAN resin based on a method published by Pike et al. [1]. The

10
AMP-PAN resin, containing 134Cs and 137Cs, was counted by gamma ray spectrometry using a high-purity germanium (HPGe) well type detector (Canberra GCW2023). 3.1.5. ESR methodology for seawater 3.1.5.1. 90Sr analysis ESR used a method based on Eichrom Sr resin was used for the determination of 90Sr in seawater. 3.1.5.2. 134Cs and 137Cs analysis ESR used the Eichrom potassium nickel ferrocyanate (KNiFC-PAN) resin method for determination of 134Cs and 137Cs from 20 L of seawater. The resin containing caesium radioisotopes was counted by gamma spectrometry. 3.1.6. IAEA methodology for seawater 3.1.6.1. Tritium analysis Tritium was determined by liquid scintillation counting after double vacuum distillation (at 35°C) and electrolytic enrichment followed by a second distillation (under atmospheric pressure). An ultra-low level liquid scintillation counter (Quantulus 1220) was used for the counting of an aliquot of the enriched and distilled sample mixed with Quicksafe 400 scintillation cocktail. 3.1.6.2. 90Sr analysis At the IAEA, liquid-liquid extraction with di-(2-ethylhexyl)phosphoric acid (HDEHP) was used for the separation of yttrium from seawater samples, while caesium was precipitated from the same sample by using ammonium molybdophosphate (AMP). Only for the samples from sampling stations M-101 and M-102 in the September 2014 mission, sequential separation by precipitation of MnO2 (Pu and Am), AMP (Cs) and oxalate (Sr) was used. The 90Sr activity concentration is calculated based on the measurement of 90Y (yttrium oxalate source) beta activity using a proportional counter (Risø National Laboratory model GM-25-5, Roskilde, Denmark) with an efficiency of up to 44%. 3.1.6.3. 134Cs and 137Cs analysis 134Cs and 137Cs were measured by low-level HPGe gamma-ray spectrometry (EURISYS SYSTEME coaxial HPGe detector model EGC 50-200-R with 47.5 % relative efficiency). The counting time was set to obtain a counting uncertainty of less than 5%. 3.2. SEDIMENT Radionuclides of interest in sediment samples were determined by four laboratories participating in the May 2015 inter-laboratory comparison: JCAC, participating on behalf of the Japan Nuclear Regulation Authority, and EPA, ESR and IAEA (see Table 1). 3.2.1. JCAC methodology for sediment 3.2.1.1. 134Cs and 137Cs analysis JCAC used direct counting by a p-type coaxial gamma-ray detector with a relative efficiency 31% for determination of 134Cs and 137Cs in sediments.
11
3.2.1.2. 239+240Pu analysis Plutonium radioisotopes in sediments were determined by alpha spectrometry after leaching, separation of plutonium by using of ion exchange and preparation of source by electrodeposition. 3.2.2. EPA methodology for sediment 3.2.2.1. 134Cs and 137Cs analysis At EPA, 134Cs and 137Cs in re-homogenised and re-dried sediment samples were counted on a germanium detector (Canberra GC7520/S). Canberra ApexGamma (Genie 2k) software was used for the analysis of the obtained spectra, while coincidence summing and attenuation corrections were applied using the GESPECOR Monte-Carlo software. 3.2.2.2. 239+240Pu analysis The method for the determination of plutonium radioisotopes used at EPA is based on work by Luisier et al. [2]. This technique utilises Triskem DGA resin in association with TEVA resin for the sequential determination of plutonium and americium radioisotopes in environmental samples. Alpha spectrometry has been used for the measurement of 239+240Pu in sediments. 3.2.3. ESR methodology for sediment 3.2.3.1. 134Cs and 137Cs analysis ESR counted 134Cs and 137Cs in sediments in a cylinder geometry by gamma spectrometry. 3.2.3.2. 239+240Pu analysis An Eichrom method based on using of TEVA and TRU resins followed by alpha spectrometry was used for the determination of plutonium isotopes. 3.2.4. IAEA methodology for sediment 3.2.4.1. 134Cs and 137Cs analysis At the IAEA, 40 g of sediment was sealed in a tin can and 134Cs and 137Cs were measured by a germanium detector (EURISYS SYSTEME coaxial HPGe detector model EGPC 170-210-R) with cosmic veto shielding and relative efficiency of 170 %. 3.2.4.2. 239+240Pu analysis The method for the determination of plutonium radioisotopes in sediments was based on classical digestion followed by ion exchange, electrodeposition and counting by alpha spectrometry. An aliquot of 5 g of sediment sample was ashed and spiked with 242Pu tracer. The sample was totally dissolved by using concentrated acids. After Fe(OH)3 precipitation and plutonium oxidation state adjustment, double ion exchange (DOWEX 1X4) was used for Pu purification. Plutonium was electrodeposited from Na2SO4/H2SO4 electrolyte solution on stainless steel discs and counted by alpha spectrometry.

12
3.3. FISH Radionuclides of interest in fish samples were determined by four laboratories participating in the November 2015 inter-laboratory comparison: MERI, JCAC and JFFIC, all participating on behalf of the Japan Fisheries Agency, and IAEA (see Table 1). 3.3.1. MERI methodology for fish MERI used direct counting by p-type coaxial Ge gamma-ray detectors with relative efficiencies between 28% and 46% for the determination of 134Cs and 137Cs in fish. The sample mass was 2 kg and each sample was measured for 1 hour. 3.3.2. JCAC methodology for fish JCAC used direct counting by p-type coaxial Ge gamma-ray detectors with relative efficiencies between 29% and 33% for the determination of 134Cs and 137Cs in fish. The sample mass was 2 kg and each sample was measured for 1 hour. 3.3.3. JFFIC methodology for fish JFFIC used direct counting by p-type coaxial Ge gamma-ray detectors with relative efficiencies between 22% and 32% for the determination of 134Cs and 137Cs in fish. The sample mass was 2 kg and each sample was measured for 1 hour. 3.3.4. IAEA methodology for fish IAEA used direct counting by a coaxial Ge gamma-ray detector with relative efficiency of 48% for the determination of 134Cs and 137Cs in fish. The sample mass was 1 kg and the samples were measured between 22 and 47 hours.

13
4. RESULTS 4.1. GENERAL 4.1.1. Uncertainties Uncertainties quoted in this report are combined standard uncertainties with a coverage factor of k = 1. The numerical result of a measurement is stated in the format xxx ± yyy, where the number following the symbol ± is the numerical value of the combined standard uncertainty and not a confidence interval, unless otherwise indicated (i.e. in Tables 14–16). 4.1.2. Reference time All activity concentrations and massic activities were reported at reference times specific for each of the four sampling missions. 4.2. SEAWATER Tables 6–9 contain the results reported by the participating laboratories for the activity concentrations of radionuclides in the seawater samples. TABLE 6. 3H ACTIVITY CONCENTRATIONS (Bq L–1) IN SEAWATER
IAEA GSL JCAC
Sep 2014
M-101 0.17 ± 0.04 0.171 ± 0.016 – M-102 0.14 ± 0.03 0.129 ± 0.015 – M-103 0.16 ± 0.04 0.101 ± 0.014 – M-104 0.15 ± 0.03 0.151 ± 0.016 – T-D1 0.10 ± 0.03 0.123 ± 0.015 –
Nov 2014
M-101 0.12 ± 0.04 0.175 ± 0.016 – M-102 0.16 ± 0.04 0.114 ± 0.013 – M-103 0.12 ± 0.04 0.118 ± 0.014 – M-104 0.14 ± 0.04 0.117 ± 0.013 – T-D1 0.14 ± 0.04 0.083 ± 0.013 –
May 2015
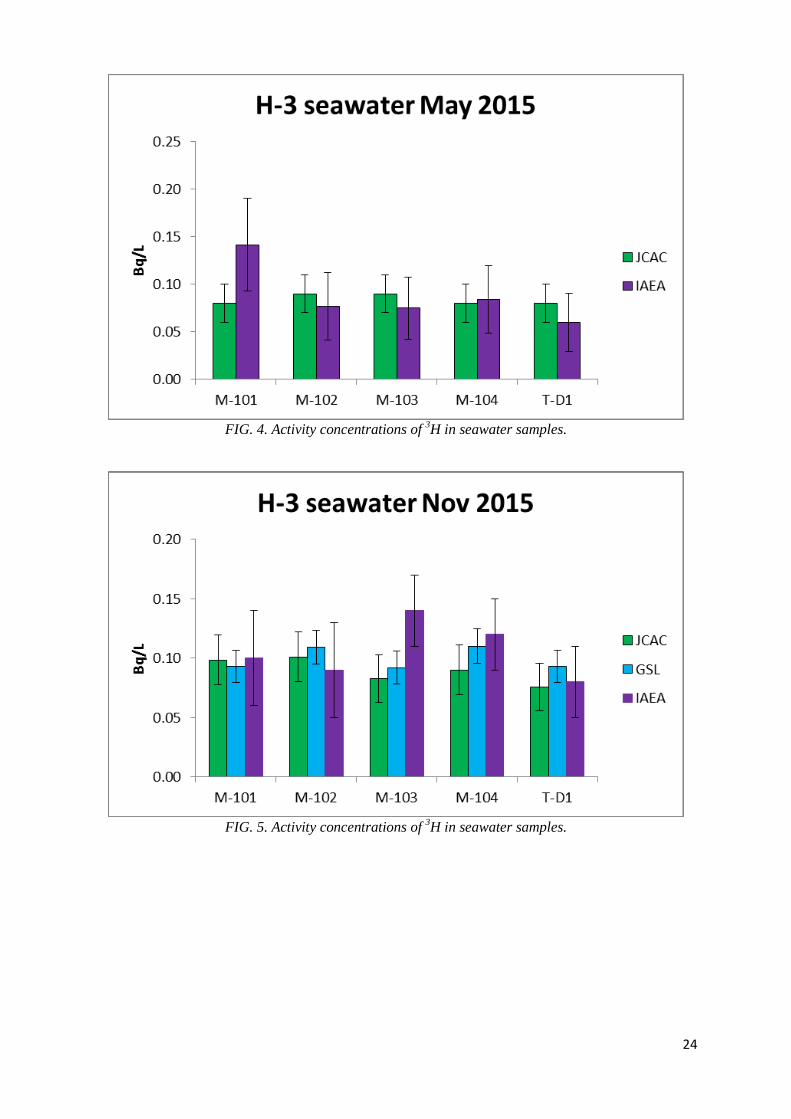
M-101 0.14 ± 0.05 – 0.08 ± 0.02 M-102 0.08 ± 0.04 – 0.09 ± 0.02 M-103 0.07 ± 0.03 – 0.09 ± 0.02 M-104 0.08 ± 0.04 – 0.08 ± 0.02 T-D1 0.06 ± 0.03 – 0.08 ± 0.02
Nov 2015
M-101 0.10 ± 0.04 0.093 ± 0.014 0.099 ± 0.021 M-102 0.09 ± 0.04 0.109 ± 0.014 0.101 ± 0.021 M-103 0.14 ± 0.03 0.092 ± 0.014 0.083 ± 0.020 M-104 0.12 ± 0.03 0.110 ± 0.014 0.090 ± 0.021 T-D1 0.08 ± 0.03 0.093 ± 0.014 0.076 ± 0.020

14
TABLE 7. 90Sr ACTIVITY CONCENTRATIONS (Bq L–1) IN SEAWATER IAEA KANSO JCAC
Sep 2014
M-101 0.026 ± 0.003 0.0190 ± 0.0011 – M-102 0.0110 ± 0.0014 0.0100 ± 0.00007 – M-103 0.00125 ± 0.00009 0.00110 ± 0.00020 – M-104 0.0080 ± 0.0006 0.0069 ± 0.0006 – T-D1 0.00101 ± 0.00008 0.00086 ± 0.00017 –
Nov 2014
M-101 0.0100 ± 0.0005 0.0087 ± 0.0007 – M-102 0.00377 ± 0.00020 0.0036 ± 0.0004 – M-103 0.00276 ± 0.00015 0.0025 ± 0.0003 – M-104 0.00386 ± 0.00020 0.0039 ± 0.0004 – T-D1 0.00098 ± 0.00006 0.00110 ± 0.00021 –
May 2015*
M-101 0.00153 ± 0.00008 – 0.00160 ± 0.00016 M-102 0.00103 ± 0.00006 – 0.00105 ± 0.00013 M-103 0.00129 ± 0.00007 – 0.00162 ± 0.00017 M-104 0.00084 ± 0.00005 – 0.00109 ± 0.00014 T-D1 0.00128 ± 0.00007 – 0.00168 ± 0.00017
Nov 2015
M-101 0.00174 ± 0.00010 0.00150 ± 0.00020 0.00177 ± 0.00017 M-102 0.0180 ± 0.0009 0.0170 ± 0.0010 0.0174 ± 0.0009 M-103 0.00161 ± 0.00009 0.00160 ± 0.00020 0.00134 ± 0.00015 M-104 0.00119 ± 0.00007 0.00120 ± 0.00020 0.00112 ± 0.00014 T-D1 0.00135 ± 0.00008 0.00110 ± 0.00020 0.00110 ± 0.00014
* additional values reported by ESR (Bq L–1) were <0.015 (M-101), <0.014 (M-102), <0.033 (M-103), <0.046 (M-104) and <0.022 (T-D1)

15
TABLE 8. 134Cs ACTIVITY CONCENTRATIONS (Bq L–1) IN SEAWATER IAEA KANSO ESR JCAC
Sep 2014
M-101 0.046 ± 0.005 0.040 ± 0.005 – – M-102 0.037 ± 0.004 0.039 ± 0.005 – – M-103 0.0179 ± 0.0018 0.0160 ± 0.0021 – – M-104 0.035 ± 0.004 0.030 ± 0.004 – – T-D1 0.0023 ± 0.0003 0.0023 ± 0.0004 – –
Nov 2014
M-101 0.0238 ± 0.0021 0.021 ± 0.003 – – M-102 0.0170 ± 0.0016 0.0150 ± 0.0020 – – M-103 0.0111 ± 0.0008 0.0094 ± 0.0013 – – M-104 0.0120 ± 0.0009 0.0096 ± 0.0013 – – T-D1 0.0072 ± 0.0006 0.0059 ± 0.0009 – –
May 2015
M-101 0.00227 ± 0.00023 – 0.00196 ± 0.00022 0.0025 ± 0.0003 M-102 0.0030 ± 0.0003 – 0.00288 ± 0.00018 0.0027 ± 0.0003 M-103 0.00195 ± 0.00019 – 0.00174 ± 0.00013 0.0022 ± 0.0003 M-104 0.00246 ± 0.00024 – 0.0025 ± 0.0005 0.0018 ± 0.0003 T-D1 0.00143 ± 0.00016 – 0.0013 ± 0.0004 0.0015 ± 0.0003
Nov 2015
M-101 0.0066 ± 0.0006 0.0069 ± 0.0003 – 0.0074 ± 0.0005 M-102 0.0154 ± 0.0015 0.0140 ± 0.0006 – 0.0141 ± 0.0009 M-103 0.0083 ± 0.0008 0.0093 ± 0.0004 – 0.0111 ± 0.0007 M-104 0.0047 ± 0.0004 0.0051 ± 0.0003 – 0.0052 ± 0.0004 T-D1 0.0038 ± 0.0004 0.00420 ± 0.00025 – 0.0054 ± 0.0004

16
TABLE 9. 137Cs ACTIVITY CONCENTRATIONS (Bq L–1) IN SEAWATER IAEA KANSO JCAC EPA ESR Reference
Sep 2014
M-101 0.134 ± 0.013 0.120 ± 0.007 – – – – M-102 0.113 ± 0.011 0.120 ± 0.006 – – – – M-103 0.052 ± 0.005 0.052 ± 0.003 – – – – M-104 0.104 ± 0.010 0.094 ± 0.005 – – – – T-D1 0.0085 ± 0.0009 0.0070 ± 0.0005 – – – –
Nov 2014
M-101 0.076 ± 0.007 0.070 ± 0.004 – – – – M-102 0.052 ± 0.005 0.0470 ± 0.0025 – – – – M-103 0.0357 ± 0.0025 0.0350 ± 0.0019 – – – – M-104 0.038 ± 0.003 0.0350 ± 0.0018 – – – – T-D1 0.0214 ± 0.0016 0.0210 ± 0.0012 – – – –
May 2015
M-101 0.0096 ± 0.0009 – 0.0092 ± 0.0006 0.0095 ± 0.0005 0.0087 ± 0.0004 0.0092 ± 0.0003 M-102 0.0115 ± 0.0011 – 0.0114 ± 0.0007 0.0110 ± 0.0005 0.0117 ± 0.0004 0.0114 ± 0.0003 M-103 0.0084 ± 0.0008 – 0.0084 ± 0.0005 0.0086 ± 0.0004 0.0089 ± 0.0005 0.0086 ± 0.0003 M-104 0.0093 ± 0.0009 – 0.0081 ± 0.0005 0.0092 ± 0.0004 0.0103 ± 0.0010 0.0091 ± 0.0004 T-D1 0.0063 ± 0.0006 – 0.0062 ± 0.0004 0.0060 ± 0.0003 0.0060 ± 0.0003 0.00609 ± 0.00017
Nov 2015
M-101 0.031 ± 0.003 0.0310 ± 0.0010 0.0326 ± 0.0017 – – – M-102 0.067 ± 0.006 0.0610 ± 0.0020 0.066 ± 0.003 – – – M-103 0.041 ± 0.004 0.0410 ± 0.0013 0.0472 ± 0.0024 – – – M-104 0.0219 ± 0.0020 0.0230 ± 0.0008 0.0251 ± 0.0013 – – – T-D1 0.0187 ± 0.0017 0.0190 ± 0.0007 0.0240 ± 0.0013 – – –

17
4.3. SEDIMENT Table 10 contains the results reported by the four participating laboratories (EPA, ESR, IAEA and JCAC) for the massic activities of radionuclides in the sediment samples. TABLE 10. RADIONUCLIDE MASSIC ACTIVITIES (Bq kg–1) IN SEDIMENT
IAEA EPA JCAC ESR Reference
134Cs T-D1 5.0 ± 0.3 5.20 ± 0.25 6.5 ± 0.5 6.6 ± 0.4 5.8 ± 0.4 T-D9 7.15 ± 0.20 7.6 ± 0.4 7.1 ± 0.6 6.6 ± 0.3 7.12 ± 0.20
137Cs T-D1 18.3 ± 1.0 18.9 ± 0.7 27.6 ± 1.6 23.7 ± 1.0 22.0 ± 2.2 T-D9 25.4 ± 0.5 26.8 ± 0.9 28.0 ± 1.6 23.6 ± 0.9 25.8 ± 0.9
239+240Pu T-D1 0.232 ± 0.012 0.32 ± 0.04 0.283 ± 0.016 0.5 ± 0.4 0.27 ± 0.03 T-D9 0.503 ± 0.022 0.54 ± 0.09 0.490 ± 0.022 0.4 ± 0.4 0.499 ± 0.019
4.4. FISH Tables 11 and 12 contain the results reported by the four participating laboratories (JFFIC, JCAC, MERI and IAEA) for the massic activities of radionuclides in the fish samples. TABLE 11. Cs-134 MASSIC ACTIVITIES (Bq kg–1) IN FISH
IAEA JFFIC JCAC MERI Reference 15FA0001 cod 0.29 ± 0.03 0.27 ± 0.08 0.27 ± 0.15 0.40 ± 0.11 0.30 ± 0.03 15FA0002 cod 0.36 ± 0.03 < 0.6 < 0.6 0.31 ± 0.07 –
15FA0003 flounder 0.76 ± 0.04 0.74 ± 0.16 1.00 ± 0.21 0.88 ± 0.15 0.79 ± 0.05 15FA0004 flounder 0.74 ± 0.03 0.88 ± 0.15 1.02 ± 0.22 0.83 ± 0.11 0.79 ± 0.04 15FA0005 mackerel 0.108 ± 0.017 0.19 ± 0.13 < 0.5 0.16 ± 0.06 –
TABLE 12. Cs-137 MASSIC ACTIVITIES (Bq kg–1) IN FISH
IAEA JFFIC JCAC MERI Reference 15FA0001 cod 1.18 ± 0.04 1.14 ± 0.19 1.45 ± 0.22 1.26 ± 0.20 1.20 ± 0.05 15FA0002 cod 1.51 ± 0.04 1.88 ± 0.25 1.00 ± 0.21 1.39 ± 0.15 1.44 ± 0.17
15FA0003 flounder 3.50 ± 0.07 3.6 ± 0.3 3.6 ± 0.3 3.9 ± 0.3 3.56 ± 0.08 15FA0004 flounder 3.39 ± 0.07 4.1 ± 0.3 3.4 ± 0.3 3.58 ± 0.25 3.57 ± 0.15 15FA0005 mackerel 0.585 ± 0.022 0.59 ± 0.13 0.68 ± 0.17 0.49 ± 0.10 0.58 ± 0.03
18
5. STATISTICAL EVALUATION OF THE RESULTS For the May 2015 mission (seawater and sediment), the collection of the data was carried out by the Radioanalytical Reference Laboratory of the National Food Chain Safety Office, Hungary, while the data evaluation was done by the IAEA. For all other missions, the data was collected and evaluated by the IAEA. The statistical evaluation method used for the results depended on the size of the data set. If two or three results were received, one or three zeta tests [3] were performed. The zeta test was defined as:
𝜁𝜁𝑖𝑖,𝑗𝑗 = � 𝑥𝑥𝑖𝑖−𝑥𝑥𝑗𝑗
�𝑢𝑢𝑖𝑖2+𝑢𝑢𝑗𝑗
2� (1)
where: xi is the value of laboratory i [Bq L–1] xj is the value of laboratory j [Bq L–1] ui is the standard uncertainty (at k = 1) for the value of laboratory i [Bq L–1] uj is the standard uncertainty (at k = 1) for the value of laboratory j [Bq L–1] If two results were received, ζ1,2 was calculated, while for three received results ζ1,2, ζ1,3 and ζ2,3 were calculated. If the value of the zeta test exceeded 2.58, the results were evaluated as being significantly different (at a 99% confidence level). If the data set contained four results, the statistical evaluation consisted of a method for calculating comparison reference values [4], which is currently being used by the Consultative Committee for Ionizing Radiation, Section II: Measurement of radionuclides, CCRI(II). After calculating a reference value, a relative degree of equivalence (DoE) was calculated for each submitted result and if this relative DoE was significantly different from zero, the corresponding result was evaluated as being discrepant. The relative DoE (%) was calculated according to:
DoE (%) = 𝑥𝑥lab−𝑋𝑋ref𝑋𝑋ref
100 (2)
where: xlab is the individual laboratory result Xref is the reference value calculated as the power-moderated mean of the combined results The standard uncertainty of the relative DoE, uDoE, was calculated according to reference [4]. If the absolute value of the relative DoE exceeded 2.58 times uDoE, the corresponding result was evaluated as being discrepant (at a 99% confidence level), as the relative DoE in this case would be significantly different from zero.

19
5.1. SEAWATER Table 13 contains the zeta scores for the activity concentrations of radionuclides in the seawater samples. TABLE 13. RADIONUCLIDES IN SEAWATER; ZETA SCORES
Sep 2014 Nov 2014 May 2015 Nov 2015
3H
M-101 0.02 1.29 1.17 0.17 / 0.03 / 0.22 M-102 0.28 1.17 0.32 0.45 / 0.24 / 0.32 M-103 1.34 0.03 0.39 1.45 / 1.59 / 0.38 M-104 0.10 0.48 0.10 0.30 / 0.82 / 0.79 T-D1 0.61 1.29 0.55 0.39 / 0.12 / 0.71
90Sr
M-101 1.97 1.59 0.40 1.07 / 0.17 / 1.03 M-102 0.66 0.38 0.17 0.70 / 0.44 / 0.30 M-103 0.70 0.70 1.81 0.06 / 1.57 / 1.04 M-104 1.39 0.09 1.68 0.04 / 0.46 / 0.33 T-D1 0.82 0.55 2.16 1.15 / 1.55 / 0.00
134Cs
M-101 0.86 0.82 0.98 / 0.57 / 1.39 0.44 / 1.00 / 0.80 M-102 0.36 0.78 0.35 / 0.61 / 0.40 0.88 / 0.75 / 0.10 M-103 0.67 1.10 0.89 / 0.68 / 1.38 1.09 / 2.61 / 2.26 M-104 0.87 1.51 0.05 / 1.71 / 1.17 0.83 / 0.77 / 0.10 T-D1 0.08 1.25 0.25 / 0.33 / 0.44 0.77 / 2.60 / 2.33
137Cs
M-101 0.91 0.75 * 0.00 / 0.46 / 0.81 M-102 0.51 1.03 * 0.95 / 0.20 / 1.19 M-103 0.04 0.23 * 0.00 / 1.33 / 2.27 M-104 0.84 0.91 * 0.51 / 1.34 / 1.39 T-D1 1.55 0.21 * 0.16 / 2.48 / 3.43
NOTE: Format “x.xx” refers to ζ1,2; format “x.xx / y.yy / z.zz” refers to ζ1,2, ζ1,3 and ζ2,3. * see Table 14 Table 14 contains the degrees of relative equivalence for the activity concentrations of 137Cs in the seawater samples in the May 2015 mission. TABLE 14. RADIONUCLIDES IN SEAWATER; RELATIVE DEGREE OF EQUIVALENCE (%)
IAEA EPA JCAC ESR
137Cs May 2015
M-101 5 ± 23 3 ± 11 0 ± 14 –5 ± 10 M-102 1 ± 22 –4 ± 10 0 ± 14 3 ± 8 M-103 –2 ± 21 0 ± 10 –3 ± 14 4 ± 13 M-104 3 ± 23 1 ± 14 –11 ± 16 13 ± 25 T-D1 3 ± 22 –2 ± 11 2 ± 16 –1 ± 9
NOTE: The numerical results in this Table are stated in the format xx ± yy, where the number following the symbol ± is the 99% confidence interval.
20
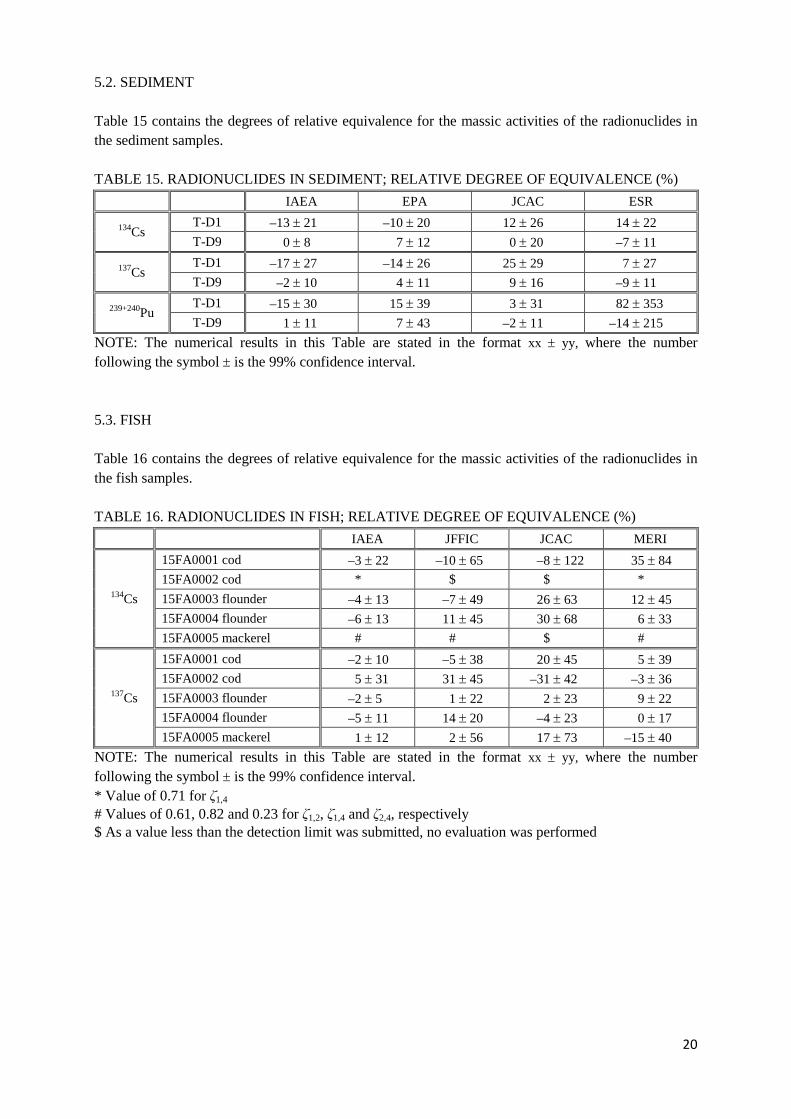
5.2. SEDIMENT Table 15 contains the degrees of relative equivalence for the massic activities of the radionuclides in the sediment samples. TABLE 15. RADIONUCLIDES IN SEDIMENT; RELATIVE DEGREE OF EQUIVALENCE (%)
IAEA EPA JCAC ESR
134Cs T-D1 –13 ± 21 –10 ± 20 12 ± 26 14 ± 22 T-D9 0 ± 8 7 ± 12 0 ± 20 –7 ± 11
137Cs T-D1 –17 ± 27 –14 ± 26 25 ± 29 7 ± 27 T-D9 –2 ± 10 4 ± 11 9 ± 16 –9 ± 11
239+240Pu T-D1 –15 ± 30 15 ± 39 3 ± 31 82 ± 353 T-D9 1 ± 11 7 ± 43 –2 ± 11 –14 ± 215
NOTE: The numerical results in this Table are stated in the format xx ± yy, where the number following the symbol ± is the 99% confidence interval. 5.3. FISH Table 16 contains the degrees of relative equivalence for the massic activities of the radionuclides in the fish samples. TABLE 16. RADIONUCLIDES IN FISH; RELATIVE DEGREE OF EQUIVALENCE (%)
IAEA JFFIC JCAC MERI
134Cs
15FA0001 cod –3 ± 22 –10 ± 65 –8 ± 122 35 ± 84 15FA0002 cod * $ $ * 15FA0003 flounder –4 ± 13 –7 ± 49 26 ± 63 12 ± 45 15FA0004 flounder –6 ± 13 11 ± 45 30 ± 68 6 ± 33 15FA0005 mackerel # # $ #
137Cs
15FA0001 cod –2 ± 10 –5 ± 38 20 ± 45 5 ± 39 15FA0002 cod 5 ± 31 31 ± 45 –31 ± 42 –3 ± 36 15FA0003 flounder –2 ± 5 1 ± 22 2 ± 23 9 ± 22 15FA0004 flounder –5 ± 11 14 ± 20 –4 ± 23 0 ± 17 15FA0005 mackerel 1 ± 12 2 ± 56 17 ± 73 –15 ± 40
NOTE: The numerical results in this Table are stated in the format xx ± yy, where the number following the symbol ± is the 99% confidence interval. * Value of 0.71 for ζ1,4 # Values of 0.61, 0.82 and 0.23 for ζ1,2, ζ1,4 and ζ2,4, respectively $ As a value less than the detection limit was submitted, no evaluation was performed

21
6. CONCLUSION A detailed data analysis was performed on activity concentrations reported for 3H, 90Sr, 134Cs and 137Cs in twenty seawater samples, massic activities reported for 134Cs, 137Cs and 239+240Pu in two sediment samples and massic activities reported for 134Cs and 137Cs in five fish samples, all collected offshore Fukushima Daiichi nuclear power plant between September 2014 and November 2015. The samples were shared between the eight laboratories [EPA (Ireland), ESR (New Zealand), GSL (Japan), IAEA (Monaco), JCAC (Japan), JFFIC (Japan), KANSO (Japan) and MERI (Japan)]. From this analysis it can be concluded that the overwhelming majority of the results are not significantly different from each other. A global analysis of the whole data set demonstrated that 202 out of the 205 statistical tests applied to the data, i.e. over 98.5%, were passed with a high level of confidence (99%). The only exceptions were two zeta scores that were just marginally higher than the critical limit of 2.58 (ζ = 2.61 for 134Cs in seawater sample M-103 in Nov 2015 between IAEA and JCAC; ζ = 2.60 for 134Cs in seawater sample T-D1 in Nov 2015 between IAEA and JCAC) and one zeta score that was clearly higher than the critical value (ζ = 3.43 for 137Cs in seawater sample T-D1 in Nov 2015 between KANSO and JCAC). Despite these minor departures, it can be said with confidence that the laboratories are reporting reliable and comparable results for the tested radionuclides in seawater, sediment and fish samples prepared and analysed according to each laboratory’s regularly used methods. Following the four sampling missions organized since mid-2014, the IAEA can confidently report that Japan's sample collection procedures follow the appropriate methodological standards required to obtain representative samples. The results obtained so far in ILCs demonstrate a high level of accuracy and competence on the part of the tested Japanese laboratories involved in the analyses of radionuclides in marine samples for the Sea Area Monitoring programme.

22
REFERENCES [1] PIKE, S., et al., Extraction of cesium in seawater off Japan using AMP-PAN resin and
quantification via gamma spectrometry and inductively coupled mass spectrometry. J. Radioanal. Nucl. Chem. 296 (2013) 369.
[2] LUISIER, F., ALVARADO, J.A.C., STEINMANN, P., KRACHLER, M., FROIDEVAUX,
P., A new method for the determination of plutonium and americium using high pressure microwave digestion and alpha-spectrometry or ICP-SMS, J. Radioanal. Nucl. Chem. 281 (2009) 425.
[3] INTERNAL ORGANIZATION FOR STANDARDIZATION, Statistical methods for use in
proficiency testing by interlaboratory comparisons, ISO 13528:2005, Geneva (2005). [4] POMMÉ, S., KEIGHTLEY, J., Determination of a reference value and its uncertainty through
a power-moderated mean, Metrologia 52 (2015) S200.

23
FIG. 2. Activity concentrations of 3H in seawater samples.
FIG. 3. Activity concentrations of 3H in seawater samples.
24
FIG. 4. Activity concentrations of 3H in seawater samples.
FIG. 5. Activity concentrations of 3H in seawater samples.

25
FIG. 6. Activity concentrations of 90Sr in seawater samples.
FIG. 7. Activity concentrations of 90Sr in seawater samples.

26
FIG. 8. Activity concentrations of 90Sr in seawater samples.
FIG. 9. Activity concentrations of 90Sr in seawater samples.

27
FIG. 10. Activity concentrations of 134Cs in seawater samples.
FIG. 11. Activity concentrations of 134Cs in seawater samples.

28
FIG. 12. Activity concentrations of 134Cs in seawater samples.
FIG. 13. Activity concentrations of 134Cs in seawater samples.

29
FIG. 14. Activity concentrations of 137Cs in seawater samples.
FIG. 15. Activity concentrations of 137Cs in seawater samples.

30
FIG. 16. Activity concentrations of 137Cs in seawater samples.
FIG. 17. Activity concentrations of 137Cs in seawater samples.

31
FIG. 18. Massic activities of 134Cs in sediment samples.
FIG. 19. Massic activities of 137Cs in sediment samples.

32
FIG. 20. Massic activities of 239+240Pu in sediment samples.

33
FIG. 21. Massic activities of 134Cs in fish samples.
FIG. 22. Massic activities of 137Cs in fish samples.