action without vision? - diva portal737584/fulltext01.pdf · action without vision? ... managerial...
TRANSCRIPT

1
Action without Vision? An Investigation on whether Frequency of Mandatory Financial
Reporting Affects Management Focus on Long-term Growth
Marie Wennergren & Therése Wentser
Stockholm Business School
Master’s Thesis (one year) 30 HE credits
Study Program in Business and Economics, 240 HE credits
Spring Semester 2014
Supervisor: Patrick L’Espoir Decosta

2
Abstract
This thesis aims to investigate whether frequency of mandatory financial reporting affects management focus on long-term growth. Evidence from the market has illustrated how managers within listed firms sometimes strive to meet market expectations on the latest reported earnings regardless of long-term consequences (see for example Graham, Harvey & Rajgopal, 2005; Grinyer, Russell & Collison, 1998). Yet, the existing literature has neglected to research market pressure in terms of financial reporting frequency and its proposed influence on long-term growth. This study seeks to find if a more frequent mandatory reporting affects managers to more often sacrifice long-term growth in terms of reduced R&D investments. By comparing six different stock exchanges with different interim reporting requirements, this study empirically examines the hypothesized relationship, using a robust multiple regression analysis based on 320 observations during the sample period 2008-2012. The statistically significant results show a negative correlation, suggesting that firms that are required to disclose quarterly reports invest less in R&D than firms that are only required to disclose semi-annual reports. A negative correlation is observed for the whole sample as well as for the five sectors individually. The results provide additional empirical evidence to the research fields of financial reporting, managerial myopia and earnings management.
Key words: Financial reporting, managerial myopia, earnings management, NASDAQ OMX Nordic

3
Acknowledgements
First of all, we would like to sincerely thank our supervisor Patrick L’Espoir Decosta for valuable inputs and support during the process of writing this thesis. A special thank you to Mikael Andéhn for very helpful advices with regards to the methodology. Also, we would like to thank all other involved parties for valuable comments. Lastly, we would like to thank our family and friends for continuous support during the whole process. May 30th, 2014 Stockholm, Sweden Marie Wennergren & Therése Wentser

4
Table of Contents
1. Introduction .............................................................................................................................. 6
1.1. Rationale for the Study ................................................................................................................. 6
1.2. Research Purpose and Question ................................................................................................... 8
1.3. Theoretical Framework ................................................................................................................ 8
1.4. Method ......................................................................................................................................... 8
1.5. Outline of the Thesis .................................................................................................................... 9
2. Literature Review ................................................................................................................... 10
2.1. Theoretical Framework .............................................................................................................. 10
2.1.1. Corporate Governance: The Agency Theory ....................................................................... 10
2.1.2. Economic Growth Theory: The Role of R&D Investments ................................................ 11
2.2. Previous Research ...................................................................................................................... 12
2.2.1. Financial Reporting ............................................................................................................. 12
2.2.2. Managerial Myopia ............................................................................................................. 13
2.2.3. Earnings Management ......................................................................................................... 14
2.3. Hypothesis Development............................................................................................................ 15
3. Method and Data .................................................................................................................... 16
3.1. Research Paradigm ..................................................................................................................... 16
3.2. Data Acquisition and Research Design ...................................................................................... 16
3.3. Sample ........................................................................................................................................ 17
3.4. Ethical Considerations ................................................................................................................ 17
3.5. Empirical Methodology .............................................................................................................. 18
3.5.1. Hypothesis Testing .............................................................................................................. 18
3.5.2. Selection of Variables.......................................................................................................... 18
3.5.3. Multiple Regression Analysis .............................................................................................. 20
3.5.4. Limitations of Empirical Methodology ............................................................................... 21
3.6. Quality of Method ...................................................................................................................... 22
3.6.1. Reliability ............................................................................................................................ 22
3.6.2. Validity ................................................................................................................................ 23
4. Empirical Results ................................................................................................................... 24
4.1. Descriptive Statistics .................................................................................................................. 24

5
4.2. Test for Multicollinearity ........................................................................................................... 27
4.2.1. Pearson’s Correlation Table ................................................................................................ 27
4.2.2. Variance Inflation Factor ..................................................................................................... 27
4.3. Robust Regression Statistics....................................................................................................... 28
5. Discussion of Empirical Results ............................................................................................ 30
6. Conclusion ............................................................................................................................... 32
6.1. Significance of the Study ........................................................................................................... 32
6.2. Limitations of the Study ............................................................................................................. 33
6.3. Suggestions for Future Research ................................................................................................ 34
References ............................................................................................................................................ 35
Appendices ........................................................................................................................................... 39
Appendix 1: Change of Reporting Regulations, NASDAQ OMX Nordic Stockholm ..................... 39
Appendix 2: Interim Reporting Regulations ..................................................................................... 40
Appendix 3: List of Sample Firms .................................................................................................... 41
Appendix 4: Test for Heteroscedasticity ........................................................................................... 53
4.1. Graphic Scatterplot ................................................................................................................. 53
4.2. Breusch-Pagan/Cook-Weisberg Test ...................................................................................... 53
4.3. White’s General Test .............................................................................................................. 54
Appendix 5: Test for Linearity .......................................................................................................... 55
Appendix 6: Test for Omitted Variables ........................................................................................... 56
6.1. Link Test ................................................................................................................................. 56
6.2. Ovtest...................................................................................................................................... 56
Appendix 7: Sector Individual Regression Statistics ........................................................................ 57

6
1. Introduction
“If the vast majority of most firms’ value depends on results more than three years from now, but management is preoccupied with what’s reportable three months from now, then capitalism has a problem.” (Barton, 2011, p. 87) The above quotation is found in a Harvard Business Review article where Dominic Barton, managing director of McKinsey & Co, challenges public company managers to turn their focus from short-term goals to long-term performance. In the article, Dominic Barton emphasizes the current issue of a short-termed mindset among managers in the financial markets. This short-termed mindset is also referred to as managerial myopia and can be seen as a desire to achieve a high current stock price by inflating earnings at the expense of longer term economic value (Stein, 1989). Cases from the last decade show how this short-termism and managerial myopia has resulted in bankruptcies and an almost complete financial meltdown in 2007-2009 (see for example Cornand & Gimet, 2012; Dallas, 2012). This demonstrates the extent of managerial myopia and the need for further studies within the area. One aspect of this issue is the potential link between financial reporting and management’s focus on long-term growth. This thesis recognizes a phenomenon of how some managers within listed firms strive to meet market expectations on the latest reported earnings regardless of long-term consequences (see for example Graham, Harvey & Rajgopal, 2005; Grinyer, Russell & Collison, 1998). It further seeks to find if managers who are mandated to report earnings announcements more often sacrifice long-term growth to a larger extent. This is directly associated with the introducing quotation, because if managers continue to focus on the next quarterly report instead of long-term performance, then the financial market might face more set-backs.
1.1. Rationale for the Study
In listed firms, managers are employed to run a business on behalf of the shareholders with the objective to increase firm value, and thus, shareholder wealth (Damodaran, 2001). Although this separation between ownership and control has many practical advantages, it is also associated with information asymmetry, where managers have access to more information than shareholders regarding the true financial position of a firm (Eilifsen, Messier Jr, Glover & Prawitt, 2010). In order to reduce this information asymmetry, financial reports can be disclosed regularly (Butler, Kraft & Weiss, 2007; Leuz & Verrecchia, 2000) to inform present and potential investors and other stakeholders about current company performance (International Accounting Standards Board [IASB], 2010). A more frequent reporting allow the market access to more timely information and will therefore provide investors with the opportunity to make more well-informed investment decisions (Mensah & Werner, 2008). As investors and analysts base their forecasts of future firm value on the latest earnings of the firm (Stein, 1989), they commonly argue for as often disclosed reports as possible (Mensah & Werner, 2008). Consequently, stock exchanges and jurisdictions set rules for the frequency of financial reporting to ensure market transparency. This mandated reporting frequency varies across jurisdictions, for example, up until 2014, firms listed on NASDAQ OMX Nordic Stockholm (SSE) were required to disclose interim reports on a quarterly basis. For the London Stock Exchange (LSE), on the other hand, reports are required to be disclosed half-yearly (NASDAQ OMX Nordic Stockholm, 2013).

7
Despite the importance of financial reports in terms of ensuring market transparency, evidence from the market illustrates that there is a difficult trade-off between the benefits and drawbacks of a more or less frequent reporting. During the spring of 2013, managers from renowned firms at SSE, such as H&M, publicly stated their disapproval of quarterly reports, arguing that important work time and effort consistently go to meeting (or beating) short-term goals. They further argued that an abrogated quarterly reporting, in aid of semi-annually reporting, would lead to an increased focus on long-term economic growth and prosperity (Hugo, 2013a; Hugo, 2013b). SSE responded to these statements by changing the regulations, making the reporting rules more flexible starting from 2014 (see appendix 1). At the same time as the managers on SSE raised concerns regarding mandatory quarterly reporting, they also described scenarios where they give discounts to clients just in order to close a deal before a quarterly report is disclosed (Hugo, 2013b). Setting long-term economic value aside for the purpose of inflating earnings, just before the next quarterly report is filed, clearly illustrates a possible breach in management duties. This shift in focus, where managers sacrifice long-term economic value for the purpose of inflating earnings and meeting short-term goals has been addressed in business research as a phenomenon called managerial myopia (Stein, 1989). In a classic model developed by Stein (1989), he suggests that the behavior of many shareholders, who sell their stocks after disappointing earnings announcements, pressures managers to overemphasize earnings at the expense of long-term investments. Correspondingly, Graham, Harvey and Rajgopal (2005) find that managers often are willing to give up economic value, believing that slightly missing an earnings target will cause turmoil in the stock market. When managers are required to disclose their earnings in financial reports more often, this behavior could also be repeated more often. Therefore, these findings serve as a basis of this thesis, suggesting that frequency of financial reporting act as a form of market pressure that may interfere with management focus on long-term economic value. Previous research has also addressed how managerial myopia can translate into real earnings management, or real actions, such as the timed client discounts explained by some managers on SSE. Real earnings management, or real actions, is accomplished by timing investment decisions to affect reported earnings (Schipper, 1989). An often discussed form of real action in economic theory is related to reducing investments in research and development (R&D) in order to meet or beat market expectations on reported earnings (see for example Barton, 2011; Graham, Harvey & Rajgopal, 2005; Grinyer, Russell & Collison, 1998). Graham, Harvey and Rajgopal (2005) find that an astonishing 80 % of over 400 surveyed managers admit that they would be willing to decrease discretionary spending in R&D, among other things, to meet a short-term earnings target. Research examining the impact of financial reporting on managerial myopia and earnings management is extremely sparse. It has been suggested that managerial myopia can be affected by the frequency of financial reporting (Bhojraj & Libby, 2005). Moreover, previous research has found evidence of real earnings management in terms of reduced R&D investments (Grinyer, Russell & Collsion, 1998). Yet, no research has combined these findings to study if the frequency of mandatory financial reporting leads managers to behave myopically by engaging in real earnings management in terms of reduced R&D investments. This is a noteworthy gap in business research given that frequency of financial reporting, and its proposed impact on long-term growth, is a globally acknowledged issue (see for example Barton, 2011; Kay, 2012; The Business Times, 2014). Also, this gap is remarkable considering that managers have complained that more frequent mandatory reporting will lead them to focus less on long-term growth (Hugo, 2013b; The Business Times, 2014) and possibly reduce R&D investments (Barton, 2011; Graham, Harvey & Rajgopal, 2005).

8
The aim of this thesis is to fill this theoretical research gap by empirically examine if managers within firms that are mandated to disclose financial reports more often focus less on long-term growth. Management focus on long-term growth is measured through investments in R&D1, which are presented separately in annual reports and should only include unambiguous investments made to generate future profits and cash flows (Grinyer, Russell & Collison, 1998). Furthermore, it is the management of a firm that decides what amount is invested in R&D, and therefore, this thesis argues that R&D investments are an appropriate measurement of management focus on long-term growth. This is consistent with the view of Grinyer, Russell and Collison (1998) who argue that it can be interpreted as short-termism if managers spend less in R&D with the incentive of meeting expected levels of reported performance in the current period.
1.2. Research Purpose and Question
As stated above, there is a lack of previous research that combines the fields of financial reporting frequency with managerial myopia and real earnings management. Bhojraj and Libby (2005) claim to be the first to acknowledge the impact of financial reporting frequency on managerial myopia. However, there is no research that has studied the relationship between financial reporting frequency and management’s focus on long-term growth in terms of R&D investments. The purpose of this thesis is to fill this theoretical knowledge gap. Moreover, to add a contribution to the global discussion regarding consequences of a more or less frequent mandatory reporting. To achieve this purpose, the following research question is formulated: How is management focus on long-term growth affected by the frequency of mandatory financial reporting? An answer to this question can provide valuable insights for legislators, stock exchanges and standard setting entities such as the IASB, since these parties have a key regulatory influence on reporting requirements (Cotter, 2012). It can also be of interest to shareholders whom make investment decisions based on financial reports, but are dependent on management actions.
1.3. Theoretical Framework
This thesis is based on the agency theory, the endogenous growth theory and theories related to the concepts of financial reporting, managerial myopia and earnings management. The aim is to combine and use these theories as a framework in order to assess whether management focus on long-term growth is affected by the frequency of mandatory financial reporting.
1.4. Method
This thesis applies a quantitative research strategy using a deductive approach. The research is based on existing theories and literature, which one major hypothesis is derived from and later tested by using empirical data. The data is analyzed with the help of a multiple regression analysis in order to answer the proposed research question.
1 “Research and development by a market producer is an activity undertaken for the purpose of discovering or developing new products, including improved versions or qualities of existing products, or discovering or developing new or more efficient processes of production.” (Organisation for Economic Co-operation and Development [OECD], 2014)

9
1.5. Outline of the Thesis
Chapter one provides an introduction and presents the rationale for the chosen research subject. Chapter two identifies and reviews existing theories and literature related to the research question. Chapter three explains and critically assesses the chosen method. Chapter four presents the obtained results. Chapter five discusses and analyses the obtained results with reference to the theories and literature reviewed in chapter two. Chapter six concludes the findings of the thesis and discusses how they can contribute to academia and practice. It further discusses the limitations of this thesis and leaves suggestions for further research to be done in the area.

10
2. Literature Review
This chapter gradually reviews the existing literature within the fields of financial reporting, managerial myopia and earnings management. The emphasis is put on these concepts and their relevance to the question of how management focus on long-term growth is affected by the frequency of mandatory financial reporting. A theoretical framework consisting of the agency theory and the endogenous growth theory is introduced to demonstrate possible breaches in management duties within publicly traded firms, as well as the importance of R&D investments. The reviewed literature and discussed theories ultimately build the one major hypothesis of this study.
2.1. Theoretical Framework
2.1.1. Corporate Governance: The Agency Theory
In order to fully understand the role of financial reports, it is important to reflect upon corporate governance: how a firm is managed and controlled (Cotter, 2012). Corporate governance, even though discussed since a century ago, is still a relevant matter that many corporations discuss today. Berle and Means (1932) argued that when there is a separation between ownership and control – in other words, when managers are hired to control the company on behalf of the shareholders – conflicts of interests will arise. This assertion was later developed into the agency theory by Ross (1973) and Mitnick (1975) separately. As of today, the agency theory, with its origin in the work of Berle and Means (1932), is commonly referred to within economic theory (see for example Davidson III, Jiraporn, Young Sang & Nemec, 2004; Graham, Harvey & Rajgopal, 2005;; Lee & O’Neill, 2003). An agency relationship exists when one party, designated as the agent, acts on behalf of another party, designated as the principal (Ross, 1973). In the relationship between shareholders and managers, the managers (i.e. agents) should always act to maximize firm value, and thus, the wealth of the shareholders (i.e. principals) (Damodaran, 2001). The key issue discussed in this relationship is to ensure that managers actually act to maximize the utility of the shareholders. Oftentimes, managers have interests different from the shareholders’ and will be tempted to choose options that maximize their self-interests rather than those of the firm (Mitnick, 1975). The agency problem pervades the entire financial system and may unfold in many different situations. For example, Graham, Harvey and Rajgopal (2005) discuss how executives focus on delivering stable earnings instead of longer term economic value due to private career concerns. Their research reveals that managers, when faced with a trade-off between short-term earnings targets and long-term value-maximizing investment decisions, will sacrifice economic value to meet the expectations from the market. If this behavior harms shareholder interests and leads them to make poor investment decisions, agency costs are created (Davidson III et al. 2004). Shareholders may have the possibility to fire managers who favor their own interests above those of the owners. However, this issue can still be difficult to manage since one party often possesses better information than the other in the principal-agent relationship (Ross, 1973). This information asymmetry, where managers have an information advantage compared to shareholders (Eilifsen et al. 2010), is the key to understanding how financial reports build a bridge between the separated parties. Financial reports are necessary to provide shareholders with information and it has been concluded that information asymmetry can be reduced through a more frequent reporting (Butler, Kraft & Weiss, 2007; Leuz & Verrecchia, 2000).

11
The agency theory is vital in order to understand the complications of corporate governance. Also, it provides a basic logic that can enhance the understanding of why managers might choose short-termed behavior instead of focusing on long-term firm value. However, it has been argued that the agency problem should not be taken for granted. Criticism has foremost been leveled against the assumption that there is a disparity between the interests of managers and shareholders. This assumption may not fit all contexts (Boyd, 1995) and if interests among these groups do not differentiate, then the agency theory could potentially be inefficient (Barney & Hansen, 1994). Nevertheless, this thesis is in line with the view of Berle and Means (1932), Graham, Harvey and Rajgopal (2005) and Ross (1973) and thus assumes that there sometimes exists a conflict of interests between managers and shareholders. Furthermore, it is assumed that managers will occasionally choose options that maximize self-interests rather than firm value in a context where information asymmetry exists.
2.1.2. Economic Growth Theory: The Role of R&D Investments
In order to argue for the importance of management focus on long-term growth and the risks related to deprioritizing R&D investments, this thesis reviews economic growth theories. Economic growth is a widely discussed macroeconomic area and has been subject to research for nearly a century. Early economic growth theorists, such as Harrod (1939) and Domar (1946), were the founders of the Harrod-Domar model, which suggests that economic growth is a product of the savings ratio and the capital-output ratio. However, the model has been subject to criticism since it assumes that production occurs under conditions of fixed proportions (Solow, 1956). The groundwork of Harrod (1939) and Domar (1946) has later been extended by neoclassical growth theorists, where Solow (1956) and Swan (1956) were the first to include technological progress or change into economic growth theory. The Solow-Swan model describes how long-term economic growth is a result of external forces such as capital accumulation, population growth and increases in productivity. If this neoclassical model is assumed to be true in effect, then long-term economic growth should be out of the hands of managers. However, later research has suggested the contrary. For example, in Romer’s (1990, 1994) classic works he challenges the models of perfect competition and highlights endogenous growth models. Endogenous growth models differentiate from earlier economic growth theories since it is suggested that economic growth is a result of endogenous variables, such as human capital and innovation (Romer, 1994). Thus, economic growth can be achieved by investments in R&D (Romer, 1990). Furthermore, Grossman and Helpman (1994), among others, have supported and added significant contributions to the endogenous growth theory by emphasizing improvements in technology and innovation as means to increase in economic growth. Although critique has been pointed towards potential misperceptions in some assumptions made by endogenous growth theorists (Al-Ubaydli & Kealey, 2000), the general opinion today is that R&D investments are essential to obtain long-term economic growth (see for example Griffith, Redding & Van Reenen, 2004; Kopf, 2007). Moreover, investments in R&D are especially critical in sectors such as technology and pharmaceuticals, where the survival of a firm often depends on these investments (Lee & O’Neill, 2003). In accordance with Romer (1990, 1994) and Grossman and Helpman (1994), this thesis takes the standpoint that optimal growth cannot be acquired by external forces solely. Therefore, it is crucial for firms to invest in human capital and innovation through investments in R&D to obtain a maximum level of economic growth. For the same reason, managers could be responsible for constraining economic growth and future firm value if they sacrifice R&D investments for the purpose of meeting short-term goals. This relates back to the agency theory and the complications connected to potential breaches in management duties.

12
2.2. Previous Research
2.2.1. Financial Reporting
Due to the separation between firm ownership and control, shareholders must have tools to evaluate management performance. For this reason, measuring and reporting performance has become increasingly important for the market and society (Corvellec, 1997), and meeting or beating expectations on financial results has become crucial, if not expected, for managers (Graham, Harvey & Rajgopal, 2005). The discussion of financial reporting became serious as early as in the mid 1920s, when the New York Stock Exchange (NYSE) started to encourage their listed firms to release interim financial reports (Butler, Kraft & Weiss, 2007). Several decades later, in 1970, quarterly financial reporting was mandated in the United States (Rahman, Tay, Ong & Cai, 2007). Since then, the requirements of financial reporting have been developed globally and in 1998, the International Accounting Standards Board (IASB) issued International Financial Standard number 34 (IAS 34) regarding interim financial reporting (Mensah & Werner, 2008). The IAS 34 sets the standards for the minimum content of a financial report, but the IASB did not decide on a specific reporting interval for interim reporting. Instead, this decision was left to the discretion of national governments and stock exchanges. Today, some countries, such as the Unites States and Canada, apply mandatory quarterly reporting whereas others, such as the United Kingdom and Australia, apply semi-annual reporting (ibid). Within the research field of financial reporting, researchers have often attempted to examine the benefits and drawbacks of financial reports. Given that a more frequent reporting is associated with both benefits and costs, the main focus has been upon comparing the effectiveness of quarterly reporting with semi-annual reporting (see for example Butler, Kraft & Weiss, 2007; Mensah & Werner, 2008; Rahman et al. 2007). Looking at the benefits, it has been suggested that a higher disclosure frequency reduces information asymmetry in the financial markets (Leuz & Verrecchia, 2000), which could in turn reduce agency costs (Lee & O’Neill, 2003). Also, quarterly reporters tend to have higher number of analysts following them than semi-annual reporters (Rahman et al. 2007), which could indicate a more well-informed market. Reviewing the drawbacks, previous research has often discussed the link between reporting frequency and stock price volatility (see for example Mensah & Werner, 2008; Rahman et al. 2007; Yee, 2004). Yee (2004) has developed a theoretical model where he argues that an increased level of reporting should lead to lower stock price volatility. However, empirical studies have indicated the opposite when comparing quarterly reporting to semi-annual reporting (Mensah & Werner, 2008), which could possibly be a consequence of investors’ focus on short-term earnings (Rahman et al. 2007). In a volatile market, where shareholders tend to sell their stocks after disappointing earnings announcements, managers will naturally focus on meeting or beating the expectations from the market due to agency concerns. Thus, the risk of high stock price volatility can increase the risk of earnings management, where managers try to smooth earnings at the expense of long-term prosperity (Graham, Harvey & Rajgopal, 2005). In other words, the more frequent the reporting, the greater the risk of managers behaving short-termed. Nonetheless, Durnev, Morck, Yeung and Zarowin (2003) point out that higher stock price volatility could also indicate a well-informed stock pricing, hence a more efficient market.

13
The discussion above illustrates the difficult trade-off between a more or less frequent reporting. Considering that neither researchers nor the IASB have been able to agree on an optimal reporting frequency, there is a strong need for additional studies within the area. Furthermore, Mensah and Werner (2008) point out that the economic effects of financial reporting cannot be concluded from theoretical analyses, and thus, they encourage further empirical studies. This relates with many manager statements that a mandated quarterly reporting leads them to focus on short-term goals instead of long-term growth, performance and investment (Graham, Harvey & Rajgopal, 2005; Hugo, 2013b; The Business Times, 2014). Therefore, the field of disclosure frequency should be complemented with empirical studies concerning this particular phenomenon. This thesis aims to empirically test this statement by examining if a more frequent mandatory reporting interferes with management focus on long-term growth and leads managers to behave myopically.
2.2.2. Managerial Myopia
Under the hypothesis that agency problems exist in an exchange-traded context, and that R&D investments are essential to obtain optimal economic growth, it is relevant to discuss the concept of managerial myopia. In the late 1980s, Stein (1989) developed a model which suggested that managers will sometimes sacrifice good investments in general – and R&D investments in particular – to boost earnings in order to make the firm appear as a better investment alternative. This phenomenon was referred to as managerial myopia and Stein (1989) suggested that the behavior, or beliefs, of investors is one of the main determinants of reduced R&D investments. Assuming that information asymmetry occurs, investors may fail to value R&D investments, which are inversely related to earnings, and instead, sell their stocks due to a low quarterly earnings announcement (Lee & O’Neill, 2003;; Stein, 1989). This behavior will possibly pressure managers to deliver short-term earnings at the expense of longer term cash flows and/or earnings (Stein, 1989). Even though Stein (1989) fails to test his model empirically, other empirical research has supported this type of behavior (see for example Bushee, 1998; Jacobson & Aaker, 1993; Wang & Wu, 2007). Previous research within the field of myopia has mainly focused on the relation between ownership structure and myopic investment behavior (see for example Bushee, 1998;; Lee & O’Neill, 2003;; Wang & Wu, 2007) and myopia has been measured foremost through investments in R&D (see for example Bushee, 1998;; Lee & O’Neill, 2003;; Nagy & Neal, 2001;; Wang & Wu, 2007). Bushee (1998) and Lee and O’Neill (2003) have controlled for firm size, debt and investment opportunities in their research, since these variables are likely to have an impact on R&D investments. In excess of that, previous research has failed to establish other explanatory factors for, and links to, managerial myopia. Also, most research to date has focused on the United States (Bushee, 1998; Stein, 1989) and Asia (Jacobson & Aaker, 1993; Nagy & Neal, 2001; Wang & Wu, 2007). The lack of studies in other contexts and the recently updated regulations on SSE validates the objective of this thesis, which is to scrutinize the phenomenon of managerial myopia connected to financial reporting in Europe. Bhojraj and Libby (2005) claim to be the first to acknowledge the impact of financial reporting frequency on managerial myopia. The result of their research suggests that an increased reporting frequency can either increase or decrease managerial myopic behavior depending on the presence of market pressure. Thus, Bhojraj and Libby (2005) choose to differ between market pressure and reporting frequency in their research. However, it is not necessarily true that these concepts can be separated without difficulty. One type of market pressure is the market’s expectations on the latest

14
earnings of the firm (Bhojraj & Libby, 2005; Stein, 1989), which with publicly listed firms are disclosed in the latest financial report. This implicates that firms that are required to disclose financial reports more often might also be exposed to the expectations from the market, and thus the pressure from the market, more often. For that reason, quarterly financial reporting, compared to semi-annual reporting, could increase the amount of pressure that managers experience. Since previous research has concentrated foremost upon examining how different ownership structures can lead managers to behave myopically, it is relevant to study if other factors can create such a behavior as well. Although the relationship between financial reporting frequency and managerial myopia has been studied by Bhojraj and Libby (2005), it is necessary to study this link further, using other methods and other markets. In their research, Bhojraj and Libby (2005) perform an experiment where they ask managers to choose between fictional investment projects which generate different cash flows given quarterly reporting or semi-annual reporting. Therefore, it is relevant to test if there is evidence of a lost focus on long-term growth, using numbers from actual reports and from a longer time period than one year.
2.2.3. Earnings Management
Closely linked to managerial myopia is the concept of earnings management. Davidson III et al. (2004, p. 267) define earnings management as “the use of flexible accounting principles that allow managers to influence reported earnings, thereby causing reported income to be smaller or larger than it would otherwise be”. The definition can also be extended to include real earnings management, or real actions, which is accomplished when managers time investment decisions to affect reported earnings (Schipper, 1989). For example, it is considered a real action if managers cut investments in R&D for the purpose of inflating reported earnings (Grinyer, Russell & Collison, 1998). As management performance tends to be evaluated and rewarded based on reported numbers, managers will naturally have incentives to exaggerate firm performance due to self-interests (Davidson III et al. 2004). If managers manipulate numbers to inflate earnings, shareholders will have to make investment decisions based on values that may not be representative for the true financial position of a firm (Neu, 1991). This could result in non-optimal investment decisions, which means that earnings management itself is an agency problem (Davidson III et al. 2004). Also, if managers restrict value-adding investments in order to boost current numbers, this could constrain future growth and thus disfavor the owners of the firm. To illustrate the extent of this issue, Graham, Harvey and Rajgopal (2005) find that an astonishing 80 % of over 400 surveyed managers admit that they would be willing to decrease discretionary spending on R&D to meet an earnings target. Furthermore, research by Grinyer, Russell and Collison (1998) supports this behavior. Given the increasing importance of reported figures (Corvellec, 1997) and the high number of managers who are willing to commit real actions, it is relevant to study potential links to this phenomenon further. Previous research within earnings management has mainly focused on developing models that aim to explain how incentives for earnings management are created and what features that make earnings management possible (see for example Dye, 1988; Trueman & Titman, 1988). Although these models can contribute to a more thorough understanding of how and why earnings management arises, it is important to acknowledge that they are based on assumptions that could be unrealistic (Schipper, 1989). In addition to the analytical models, most research to date consists of qualitative discussions or quantitative surveys that map out manager opinions with regard to the issue of earnings management (see for example Graham, Harvey & Rajgopal, 2005; Grinyer, Russell & Collison, 1998). Thus, there
15
is need for further empirical research within the arena. The current lack of empirical research is most likely a consequence of difficulties with regard to finding relevant data and appropriate measurements that can establish earnings management as a broad phenomenon (Schipper, 1989). Nevertheless, Schipper (1989) points out that some particular types of earnings management that occur under particular contexts can be detected. Therefore, the field of earnings management should be complemented with such research. Previous research has not combined the fields of disclosure frequency and real earnings management, making it legitimate to study the impact of a more frequent reporting on real actions in terms of reduced R&D investments. Also, according to Graham, Harvey and Rajgopal (2005), most research to date has focused on earnings management in terms of accounting adjustments. Yet, they find that managers are more inclined to engage in real earnings management, which further demonstrates the need for additional studies within this specific area.
2.3. Hypothesis Development
The major hypothesis of this thesis is based on the view that an increased frequency of mandatory financial reporting creates incentives for managers to behave myopically, by sacrificing long-term investments for the purpose of meeting short-term earnings targets. The hypothesis is derived from existing theory as well as many manager statements that a mandated quarterly reporting leads them to focus on the next quarterly report instead of longer time prospects (Hugo, 2013b; The Business Times, 2014). The hypothesis derived assumes that (1) when there is a conflict of interests, managers will sometimes consciously make investment decisions that maximize self-interests rather than long-term economic value and (2) reduced investments in R&D can constrain long-term economic value. In the financial market with publicly traded firms, where information asymmetry exists, firm performance is evaluated based on the financial results disclosed in interim financial reports. Generally, the market has expectations on the latest reported earnings of the firm, and if these are not met when the report is disclosed, many shareholders react by selling their stocks (Lee & O’Neill, 2003; Stein, 1989). As management performance tends to be evaluated and compensated based on financial results, this behavior might pressure managers to deliver short-term results at the expense of long-term investments (Davidson III et al. 2004). More explicitly, previous research suggests that many managers are willing to give up investments in R&D to meet an earnings target (Graham, Harvey & Rajgopal, 2005; Grinyer, Russell & Collison, 1998). Based on the theoretical framework and reviewed literature, this thesis aims to investigate a potential relationship between an increased frequency of mandatory financial reporting and a lost focus on long-term growth in terms of reduced R&D investments. It is hypothesized that:
There is a relation between the listed firm’s mandatory financial reporting frequency and investments in research and development.

16
3. Method and Data
This chapter presents and discusses the chosen method and empirical methodology for this thesis. The scientific approach, data collection, research design and sample are presented. Moreover, the statistical tools are described and critically assessed.
3.1. Research Paradigm
This study holds an epistemological position of positivism, meaning that only knowledge confirmed by logic is justified and regarded knowledge (Bryman & Bell, 2011). It is based on existing knowledge within and surrounding the concepts of financial reporting, managerial myopia and earnings management, with the intent to derive a hypothesis. This hypothesis is tested by the employment of empirical data, and by analyzing the results through the theoretical lens of objectivism, this thesis aims to answer the proposed research question. Within positivism, this distinction between theory and research is expressed as a deductive approach. An ontological stance of objectivism means viewing social phenomena as independent and separate from social actors (ibid). Since this thesis applies a deductive approach, it also practices a quantitative research strategy. As in this case, quantitative research generally focuses on variables that can be analyzed and processed by the usage of statistical models (Christensen, Engdahl, Grääs & Haglund, 2010). Commonly, the research is based on hypotheses with the purpose of testing theories and establishing relationships between variables (ibid).
3.2. Data Acquisition and Research Design
All data utilized in this thesis is external secondary data collected from the global database ORBIS. Historical numbers, as stated in each of the sample firms’ annual reports, are collected for the time period 2008-2012. Average figures from a time range of five years is gathered to calculate for potential abnormalities in individual years, where the mean value of these years is viewed as a single observation. Under the event that figures from some years are missing, an average of the available years is used, meaning that this study cannot account for all potential abnormalities. Nonetheless, this increases the chance of reaching a more generalizable result, since a larger amount of firms can be included in the sample. A few outliers, or unusual observations, have been detected by observing a graphic scatterplot in accordance with Dahmström (2005). However, these observations have not been excluded since they are regarded true outliers by the authors, which can contribute to the understanding of the data set. Moreover, a time period of five years allows the figures to be up to date as well as allows for newly listed firms to be included in the sample. The specific time range of 2008-2012 is chosen out of an availability purpose, since all annual reports from these years have been disclosed and made publicly accessible. Also, due to the recent change in regulations at SSE, as well as the global discussion regarding the examined matter, this study aims to provide topical results. The data is quantitative in the sense that it is numerical (Christensen et al. 2010) and it is acquired from several firms simultaneously, which results in a cross-sectional research design (Bryman & Bell, 2011). A cross-sectional research design is suitable for detecting patterns of associations and examining relationships between variables. Furthermore, the research design is comparative since identical methods are applied on different cases, which are compared to each other (ibid). The contrasting cases examined in this thesis relate to the mandatory quarterly reporting frequency set on

17
SSE, the Frankfurt Stock Exchange (FSE)2 and the Helsinki Stock Exchange (HSE), and the semi-annual reporting frequency applied on the London Stock Exchange (LSE), the Copenhagen Stock Exchange (CSE) and the Brussels Stock Exchange (BSE) (see appendix 2 for reporting regulations).
3.3. Sample
The sample consists of all firms listed on SSE, FSE, HSE, LSE, CSE and BSE within five sectors: automobile and parts, chemicals, healthcare (including pharmaceuticals and biotechnology), technology and telecommunications. These stock exchanges are selected for several reasons. Most importantly, there is need to compare firms listed on stock exchanges where regulations are set with a quarterly reporting requirement versus a half-yearly reporting requirement. Moreover, by including several stock exchanges and countries, the risk of the result being heavily caused by individual stock exchange or country characteristics is decreased. Only stock exchanges from northern Europe are included since cultural differences among these countries, possibly influencing R&D investments, are assumed to be smaller than if stock exchanges from other parts of the world were included. This assumption is supported by research that points out unique features of financial markets in countries such as the United States and Japan (see Lee & O’Neill, 2003). Also, by examining six stock exchanges, it is likely that the sample firms operate in different currencies and countries. Thus, the risk of the result being misrepresenting due to temporary exchange rates or business cycles is decreased. All sample firms are divided into the sectors that are being held public by each stock exchange respectively, meaning that no subjective decision regarding the classification is made by the authors. The examined sectors are foremost chosen for the purpose of comparability, since all stock exchanges categorize these sectors similarly. By examining only a few chosen sectors, this thesis can partially control for industry specific characteristics. This is important since firms within industries such as healthcare and technology are known to invest unusually large amounts in R&D (Lee & O’Neill, 2003). A total number of 431 companies3 are listed on the above stock exchanges and within the above industries. Since companies with one or more variables missing are excluded from the sample, a total of 320 observations are processed in the regression analysis (see appendix 3 for more details).
3.4. Ethical Considerations
According to Bryman and Bell (2011), it is important to discuss ethical considerations in business research. Since this thesis relies on quantitative secondary data acquired from public annual reports, it has not received an expressed consent from any included sample firm. However, due to the nature of the data, this study does not involve any participants that can be directly exposed or harmed by previously inaccessible information in any way. Consequently, no ethical problems arose during the data collection process. Furthermore, this thesis collects all data from the global database ORBIS. This source is considered reliable in its context, as it is frequently addressed by researchers published in peer reviewed academic journals, such as the Journal of International Business Studies (see for example Bhaumik, Driffield & Pal, 2010). To further ensure data authenticity, tests have been performed to control the data acquired from ORBIS against random numbers stated in annual reports, with a 100 % consistency. Also, all references have been carefully reviewed to ensure that information is never taken out of its original context. 2 Only the FSE prime standard segment is considered. 3 Out of these companies, 36 are listed on BSE, 29 are listed on CSE, 81 are listed on FSE, 27 are listed on HSE, 74 are listed on SSE and 184 are listed on LSE.

18
3.5. Empirical Methodology
3.5.1. Hypothesis Testing
This thesis tests one main hypothesis that underlies the research. Hypothesis testing assumes a null hypothesis (H0), which is rejected unless there is strong evidence against it. If the null hypothesis is rejected, the alternative hypothesis (H1) is accepted. To determine rejection or confirmation of the hypothesis, a two-sided significance test is applied. A significance level of 5 %, or p < 0.05, is used in this thesis, meaning that the probability of rejecting a true null hypothesis is 5 % (Newbold, Carlson & Thorne, 2010). The sample stated above is used to test whether:
There is no relation between the listed firm’s mandatory financial reporting frequency and investments in research and development ( )
There is a relation between the listed firm’s mandatory financial reporting frequency and investments in research and development ( Where:
= slope coefficient In order to test the hypothesis, a multiple regression analysis is performed with the aim to explain and validate the hypothesized relationship between R&D investments and the mandatory disclosure frequency. The correlation between these variables is expected to be negative, meaning that firms that are mandated to report more frequently are expected to invest less in R&D.
3.5.2. Selection of Variables
It is crucial to select appropriate variables in the regression equation to provide a rationale for the model analysis when executing a regression analysis (Newbold, Carlson & Thorne, 2010). In this section, the chosen dependent variable, R&D investments, and the independent variable, mandatory reporting frequency, are defined. As R&D investments are assumed to be affected by other variables as well, this thesis uses control variables. By applying control variables, a multiple regression analysis can be performed to systematically calculate for variables that are not specifically stated in the formulated hypothesis (ibid). The chosen control variables, firm size and solvency, are defined and motivated below.
3.5.2.1. Dependent Variable: R&D Intensity Ratio
Since this thesis aims to examine how R&D investments are affected by the frequency of mandatory financial reporting, the dependent variable should serve to measure variations in R&D investments. This thesis uses the average R&D intensity ratio for each sample firm during 2008-2012 as the dependent variable. Choosing the R&D intensity ratio as the dependent variable, the multiple regression analysis provides the marginal change in this variable related to changes in the chosen independent variables (Newbold, Carlson & Thorne, 2010). Following Lee and O’Neill (2003), the R&D intensity ratio is defined as: Where: i = index i, notation for each cross-sectional observation
(1)

19
3.5.2.2. Independent Variable: Frequency of Mandatory Financial Reporting
Previous research has established that managers in listed firms often are willing to sacrifice R&D investments to meet an earnings target (Graham, Harvey & Rajgopal, 2005; Grinyer, Russell & Collison, 1998). Therefore, it is adequate to study whether managers, who are mandated to report at a higher frequency, and thus have to comply with more earnings targets per year, invest less in R&D. The independent variable frequency of mandatory financial reporting is a fixed value, either semi-annual or quarterly, and can only take on two values: 0 or 1. This structure is called using a dummy variable (Newbold, Carlson & Thorne, 2010) and is helpful when quantifying categorical variables. (2)
Where: 0 = Semi-annual financial reporting requirement 1= Quarterly financial reporting requirement
3.5.2.3. Control Variable: Firm Size
Economic theory indicates that firm size may influence investments in R&D, since firms of different sizes possess different scales of economies (Lee & O’Neill, 2003). Bushee (1998) also suggests that smaller firms are more likely to suffer from cash flow shortages, which could result in reduced R&D investments. Owing to this, it is reasonable to control for the effect of firm size on R&D investments in the regression model. Previous research employs different techniques to measure firm size, where Lee and O’Neill (2003) use the logarithm of assets, Hill and Snell (1988) the logarithm of revenues and Ortega-Argilés, Moreno and Caralt (2005) use the number of personnel. However, Ortega-Argilés, Moreno and Caralt (2005) point out that the total number of revenues can be used instead, since analyses have observed consistent results regardless of how firm size is measured. Following this advice, firm size is measured in terms of revenues. Revenues are stated in the Swedish Krona, SEK. (3)
3.5.2.4. Control Variable: Solvency Ratio
The effect of capital-structure on R&D investments is a recurring subject discussed by researchers. It has been suggested that a high level of debt can lead to reduced investments in R&D since managers may have a hard time to raise necessary funds under such circumstances (Myers, 1977). A high level of debt can also restrict investments in R&D due to agency problems between managers and shareholders (Jensen, 1989). Former research uses different ratios to control for leverage. For example, Lee and O’Neill (2003) use the book value of debt divided by total assets whereas Czarnitzki and Kraft (2009) use total debt divided by total equity. Although different ratios are employed to measure debt, researchers are consistent in the view that the level of debt should be controlled for when investigating variations in R&D investments (see for example Bushee, 1998; Czarnitzki & Kraft, 2009;; Lee & O’Neill, 2003;; Ortega-Argilés, Moreno & Caralt, 2005). This thesis applies an alternative solvency ratio, or equity ratio, defined as the book value of equity divided by total assets, to control for the effect of capital-structure. The solvency ratio serves as an indicator of leverage since it measures the proportion of assets financed by shareholder equity instead of debt. The decision to use the solvency ratio as opposed to another leverage ratio is foremost out a

20
convenience aspect, since this ratio can be directly acquired from ORBIS. This decreases the risk of potential errors in the collected data. (4)
3.5.3. Multiple Regression Analysis
A multiple regression analysis explains how a dependent variable varies depending on variations in the independent variables (Dahmström, 2005). Also, it gauges the size effect of each independent variable on the dependent variable (Neuman, 2013). Hence, it can explain how R&D investments are affected by the frequency of mandatory financial reporting, firm size and solvency. This is most likely the reason why previous research commonly applies multiple regression analyses to study variations in R&D investments (see for example Chin, Chen, Kleinman & Lee, 2009; Lee & O’Neill, 2003). The multiple regression model used in this thesis is defined as: (5)
Where: RNDi = dependent variable R&D intensity ratio FREQi, SIZEi , SOLVi = independent variables mandatory reporting frequency, firm size and solvency i = index i, notation for cross-sectional observations α = intercept/constant, where the line crosses the y-axis β1, β2, β3 = slope coefficients εi = error term for residuals that cannot be explained by the regression model The constant (α) serves as an estimation of R&D investments when the independent variables equal 0 and the coefficients (β) show the effect on R&D investments for each independent variable (see Neuman, 2013). The error term, εi, represents all influences on R&D investments that are not explained by the mandatory disclosure frequency, firm size and solvency. The deviation of the error term is assumed to be independent of the independent variables (Newbold, Carlson & Thorne, 2010) and is distributed with the variance and an expected value of 0 (Hamilton, 2009): (6)
This thesis uses the ordinary least squares (OLS) model to determine the values of α and β, and thus estimate the regression line. The OLS method minimizes the sum of the residuals, which allow them to fit the model to the sample (Newbold, Carlson & Thorne, 2010). In order to establish the model’s explanatory power, the coefficient of determination, or R2, is observed. The R2-value is interpreted as the proportion of variability in the dependent variable that is explained by the regression equation (Dahmström, 2005). It varies from 0 to 1, where a larger number implies a higher explanatory power due to low variances in the underlying time series (Newbold, Carlson & Thorne, 2010). In this study, the adjusted R2 is observed instead of the usual R2. The adjusted R2 regards that the explanatory power tends to increase when several variables are included in the regression equation, although they may not have any explanatory power (Løvås, 2006). Thus, the adjusted value of R2 is usually slightly lower than the usual R2. This thesis uses STATA to calculate the regression line and the adjusted R2. STATA is also used to process all statistical tests explained below.

21
3.5.3.1. Multicollinearity
A multiple regression model assumes that perfect correlations between two or more independent variables are excluded (Newbold, Carlson & Thorne, 2010). If this assumption does not hold and the independent variables turn out to be strongly correlated to one another, a problem of multicollinearity arises. When multicollinearity is present, the results from the regression analysis become unreliable. To detect for multicollinearity, this thesis (1) conducts a table of Pearson’s correlation coefficients and (2) observes the variance inflation factor (VIF). According to Lee, Lee and Lee (2000), a correlation of 0.8 or higher between the independent variables, or a VIF-value that equals or exceeds 10, indicates a problem of multicollinearity.
3.5.3.2. Autocorrelation
The multiple regression analysis also holds the assumption that the error terms, εi, are independent (Newbold, Carlson & Thorne, 2010). However, when using time series-data, a problem of autocorrelation may arise if there is a correlation between two observed values in the independent variables at two different points in time. Autocorrelation in the error terms from adjacent time-series observations can lead to an underestimation of the coefficients’ standard errors, and as a result, the t-statistic becomes misleading. A likely reason for autocorrelation is related to omitting important variables in the regression model. These variables are implicitly contained within the error terms. However, if these are in turn correlated to one or more of the chosen independent variables and the effect continue over several time-periods, the OLS regression will not present unbiased estimates. Usually, this can be detected for by performing a Durbin-Watson test (ibid). Since this study uses an average value of time-series data, only one observation per company is included in the regression model. This implicates that the observations cannot be ranked in a certain order, which means that it is inappropriate as well as unnecessary to test for autocorrelation.
3.5.3.3. Heteroscedasticity
Given that the data set in this study contains many firms of different sizes, the amount of revenue differentiates vastly from small to large firms. Accordingly, it is likely that the larger firms have larger variances in revenues and other factors compared to smaller firms. These factors are included in the error terms, and if the error terms show different variances, the regression model suffers from heteroscedasticity. When heteroscedasticity is present, the standard OLS regression is not the most appropriate method (Newbold, Carlson & Thorne, 2010). This thesis observes a visual scatterplot in accordance with Lee, Lee and Lee (2000) to detect for patterns that indicate heteroscedasticity. Furthermore, this thesis conducts (1) a Breusch-Pagan/Cook-Weisberg test to test for linear heteroscedasticity and (2) a White’s General test to test for non-linear heteroscedasticity. As these tests indicate the presence of heteroscedasticity for the examined data set (see appendix 4), it is necessary to account for this. In order to adjust for heteroscedasticity, this thesis performs a robust multiple regression analysis with robust standard errors (Hamilton, 2009; White, 1980).
3.5.4. Limitations of Empirical Methodology
As described above, the OLS model assumes an absence of multicollinearity, independent error terms and homoscedasticity of residuals. The model also assumes a linear relationship, where the dependent variable serves as a function of the independent variables (Dahmström, 2005). Under a setting where these variables are related in other ways, the OLS regression will try to fit a straight line to data that is in reality non-linear. Thus, a non-linear relationship can lead to biased results. The data set used in this thesis suffers from non-linearity (see appendix 5), which is a clear limitation of the applied model.
22
Another model specific limitation concerns the risk of omitting important variables from the regression equation. Although the multiple regression model in this thesis helps control for firm size and solvency, it is likely that other omitted variables influence R&D investments as well. If these variables are correlated to the included independent variables, the OLS regression will present biased results (Newbold, Carlson & Thorne, 2010). This thesis conducts a link test and an ovtest in STATA to detect for potential model specification errors, such as omitted variables. Both of these tests indicate that the regression model most likely suffers from omitted variables (see appendix 6), which is a limitation of the model used in this thesis. However, including too many variables in the regression equation can cause a misleading adjusted R2 and including irrelevant variables will also cause model specification errors (Dahmström, 2005). Consequently, there is a difficult, yet thoughtful, selection of the variables in this thesis’ regression equation. It should be pointed out that specification errors could also be a result of including irrelevant variables in the regression equation. Furthermore, a methodology including hypothesis testing always suffers from two potential errors in terms of making biased conclusions. Firstly, there is a risk that the null hypothesis, H0, is incorrectly rejected, which is referred to as Type I Error (Løvås, 2006). As this thesis subjectively chooses a significance level of 0.05, it also means that it accepts a 5 % risk of drawing inaccurate conclusions based on an incorrectly rejected hypothesis. Secondly, there is a risk that the null hypothesis is incorrectly accepted, which is referred to as Type II Error (Newbold, Carlson & Thorne, 2010). Unfortunately, these error types are inversely related to one another, meaning that if very few Type I errors are accepted, more Type II errors are accepted. Type I errors are generally regarded worse than Type II errors (Løvås, 2006), and hence, more important to calculate for. Therefore, this thesis argues that a significance level of 0.05 is appropriate, since it accepts few Type I errors. Still, it allows for a certain risk of accepting Type I errors for the purpose of accepting fewer Type II errors. It should be noted that the assumption of normality of the residuals is rejected in this thesis (see appendix 4), indicating that there is an increased risk of Type I and Type II Errors (see Chen, Ender, Mitchell & Wells, 2003).
3.6. Quality of Method
3.6.1. Reliability
As this thesis takes on a quantitative approach, it must be regarded whether the applied measurements are stable or not. This is referred to as reviewing the reliability and is important for the trustworthiness of research (see Bryman & Bell, 2011). The reliability criterion involves stability, internal reliability and inter-observer consistency. Stability reviews whether the results will be consisted if the study is repeated, or more explicitly, whether a replicated study, using the same measurements, would reach the same results. Internal reliability refers to whether or not a measurement’s result is consistent with itself across a test. Moreover, inter-observer consistency refers to the subjectivity of two independent observers viewing the same events (ibid). Neither internal reliability nor inter-observer consistency is needed to take into consideration in this case, since all data is collected from financial reports, a secondary source. The collection of such data is stable over time, since the figures are highly unlikely to be changed after the reports have been audited and filed. Also, the data quality can be considered high, as it is required to be collected following strict procedures. A replicated study will therefore, most likely, reach the same results. In excess, each methodological procedure of choice is explicitly stated in chapter three in this thesis, with the aim to further enhance reliability. Thus, the reliability in terms of stability can be considered high.
23
3.6.2. Validity
Two types of validity are crucial to take into account when evaluating the applied method of this thesis. The first type is measurement validity, which refers to whether a measurement of a concept really is the appropriate measurement of that concept (Bryman & Bell, 2011). That is, if R&D investments are an appropriate measurement of management’s focus on long-term growth. As managers act in different contexts and under different conditions, it is nearly impossible to find a perfectly valid quantitative measurement of focus on long-term growth. Managers make several decisions that are likely to be long-termed, even though they do not involve R&D investments. Hence, this study suffers from a certain lack of measurement validity. Nevertheless, in consistency with Grinyer, Russell and Collison (1998), this thesis argues that low investments in R&D can indicate short-termism; especially, in sectors such as technology and pharmaceuticals, where the survival of a firm may depend on such investments (Lee & O’Neill, 2003). Furthermore, this study explicitly relies on the endogenous growth model that includes investments in R&D as a means to increase in economic growth. This model does not use R&D investments solely, as in this study, which decreases the validity as opposed to using all components in the endogenous growth model. It should also be noted that R&D investments are highly unsure, and might not result in long-term growth and future returns (Lee & O’Neill, 2003). Hence, R&D investments might not be the optimal measurement for long-sightedness. The second type of validity, internal validity, refers to the causality between two or more variables. It emphasizes whether an independent variable really is responsible for variations in the dependent variable (Bryman & Bell, 2011). Since this study uses a multiple regression model, and can control for some variables, it is more likely that the results show a more valid predictor of a variable than when using a simple regression model. However, this does not mean that the chosen independent variables precede the dependent variable. Given the cross-sectional research design, the internal validity cannot be ensured because of uncertainties in causal directions (ibid). The lack of internal validity is one of the most central issues in this study. Although a relation might be found between R&D investments and the frequency of mandatory financial reporting, this relation could be a coincidence or depend on numerous other mediating factors. In that case, a spurious correlation would occur and the shown relationship would be regarded “false” (Dahmström, 2005). In an attempt to strengthen the internal validity, the sample includes firms from six stock exchanges instead of two. By the use of six different stock exchanges and five different industries, this study can to some extent control for influences from industry, country and stock exchange specific characteristics. Thus, the risk of distinctive features among individual industries, stock exchanges and countries influencing the result is minimized. Still, a causal relationship cannot be ensured.

24
4. Empirical Results
This chapter presents the descriptive statistics, the multicollinearity test statistics and the robust multiple regression results.
4.1. Descriptive Statistics
Table (1) and table (2) below present the descriptive statistics for the examined variables: R&D investments, mandatory reporting frequency, firm size and solvency for the time period 2008-2012. The sample includes all companies listed on SSE, FSE ( the prime standard segment), HSE, LSE, CSE and BSE within the industries: automobile and parts, chemicals, healthcare (including pharmaceuticals and biotechnology), technology and telecommunications (counted and included if complete information is available for all variables). The number of observations differentiates between the variables in table (1) and (2) due to data being unavailable for some observations. A total number of 320 observations are included in the robust multiple regression analysis (see appendix 3 for list of sample firms). The descriptive statistics presented in table (1) show that the sample firms invest on average 12.75 % of their total revenues in R&D. As can be seen in table (2), this value differentiates a lot between the different sectors, where firms within healthcare and technology invest the most. This result is expected, considering that previous research points out that these sectors are heavily dependent on such investments (see for example Lee & O’Neill, 2003). Substantial differences in R&D investments are also found between the different stock exchanges, where table (2) clearly shows that the companies listed on stock exchanges with a semi-annual reporting requirement invest the most on average (for all sectors and sector individually). For example, the average firm listed on a stock exchange with a semi-annual reporting requirement invests 15.04 % whereas its counterpart firm, operating under a mandated quarterly reporting, invests 9.81 % (given the examined data set). However, it should be noted that this result is partially a consequence of the uneven firm distribution between the sectors. A mean frequency of approximately 0.42 is found in table (1), implicating that the sample consists of more firms from stock exchanges with a semi-annual reporting requirement than a quarterly reporting requirement. This is further revealed in table (2), which shows that the sample includes a larger number of observations for each variable for the firms with a required semi-annual reporting. This distribution, together with the uneven firm distribution within the sectors, should be acknowledged since it may interfere with the credibility of the results. The average operating revenue for the sample firms is approximately 42,900,000,000 SEK, implying that many large firms are included in the sample. The average solvency ratio is 52.17 %, indicating that the average sample firm finances its assets with approximately half equity and half debt. As stated in table (2), this distribution varies slightly between the different sectors. However, neither firm size (operating revenues) nor capital structure (equity divided by the book value of total assets) varies substantially between the quarterly and the semi-annual reporters.

25
Table (1) Summarized Statistics Variable Observations Mean Standard Deviation Minimum Maximum
RND 322 0.1274783 0.2045915 0 0.9685
FREQ 431 0.4192037 0.4940076 0 1
SIZE 406 4.29E+10 1.61E+11 0 1.53E+12
SOLV 402 0.5216702 0.2432475 -0.916125 0.97618
Table (1) presents the number of observations as well as average means, standard deviations and minimum/maximum values for each variable for the sample period 2008-2012. RND is defined as R&D investments divided by the operating revenue. FREQ is a dummy and stands for the regulated reporting frequency, where a required semi-annual reporting is denoted 0 and a mandated quarterly reporting is denoted 1. SIZE is defined in terms of operating revenues. SOLV is defined as total equity divided by the book value of total assets. The number of observations differentiates between the variables due to data being unavailable for some observations. The sample constitutes of all firms listed on BSE, CSE, FSE (the prime standard segment), HSE, LSE and SSE within the sectors: automobile and parts, chemicals, healthcare (including pharmaceuticals and biotechnology), technology and telecommunications (see appendix 2 for stock exchange information and appendix 3 for list of sample firms).

26
Table (2) presents the mean values and number of observations (n) for the variables RND, SIZE and SOLV for the sample period 2008-2012. Average numbers are presented stock exchange individually as well as sector individually and are also specified as an average based upon the frequency of mandatory financial reporting. RND is defined as R&D investments divided by the operating revenue. SIZE is defined in terms of operating revenues. SOLV is defined as total equity divided by the book value of total assets. The number of observations differentiates between the variables due to data being unavailable for some observations. The sample constitutes of all firms listed on BSE, CSE, FSE (the prime standard segment), HSE, LSE and SSE within the sectors: automobile and parts, chemicals, healthcare (including pharmaceuticals and biotechnology), technology and telecommunications (see appendix 2 for stock exchange information and appendix 3 for list of sample firms).
Table (2) Summarized Sector Statistics
Semi-Annual Reporting Quarterly Reporting
Variable BSE CSE LSE Average FSE HSE SSE Average Mean (n) Mean (n) Mean (n) Mean (n) Mean (n) Mean (n) Mean (n) Mean (n) All Sectors
RND 12.90 % (25) 15.13 % (27) 15.44 % (129) 15.04 % (181) 7.25 % (74) 5.96 % (12) 14.09 % (55) 9.81 % (141)
SIZE 1.60E+10 (32) 6.90E+09 (29) 6.36E+10 (168) 4.98E+10 (229) 7.75E+10 (77) 1.90E+10 (27) 6.65E+09 (73) 3.94E+10 (177)
SOLV 47.10 % (32) 55.91 % (29) 53.15 % (164) 52.65 % (225) 46.57 % (77) 49.31 % (27) 57.75 % (73) 51.60 % (177)
Automobile & Parts
RND 1.83 % (1) 0.00 % (1) 18.97 % (9) 15.69 % (11) 3.11 % (10) 1.17 % (1) 2.29 % (6) 2.71 % (17)
SIZE 7.235E+10 (2) 1.18E+09 (1) 2.85E+11 (11) 2.34E+11 (14) 3.19E+11 (10) 1.13E+10 (1) 8.10E+09 (6) 1.19E+11 (17)
SOLV 8.85 % (2) -5.00 % (1) 34.50 % (10) 27.48 % (13) 32.52 % (10) 63.84 % (1) 49.36 % (6) 40.31 % (17)
Chemicals
RND 1.20 % (6) 1.96 % (2) 7.39 % (26) 5.98 % (34) 2.35 % (12) 1.95 % (1) 0.87 % (1) 2.22 % (14)
SIZE 3.74E+10 (6) 4.25E+09 (2) 1.08E+10 (30) 1.47E+10 (38) 6.87E+10 (12) 2.31E+10 (1) 4.96E+09 (1) 6.09E+10 (14)
SOLV 47.74 % (7) 29.91 % (2) 54.35 % (29) 51.85 % (38) 38.90 % (12) 46.75 % (1) 40.68 % (1) 39.59 % (14)
Healthcare
RND 30.34 % (7) 21.28 % (17) 25.04 % (36) 24.59 % (60) 14.22 % (24) 5.29 % (2) 24.73 % (25) 19.02 % (51)
SIZE 3.83E+09 (12) 7.70E+09 (19) 1.91E+10 (51) 1.42E+10 (82) 9.07E+09 (26) 5.43E+09 (5) 3.68E+09 (30) 6.12E+09 (61)
SOLV 58.16 % (11) 60.86 % (19) 62.10 % (50) 61.27 % (80) 57.47 % (26) 42.90 % (5) 63.34 % (30) 59.16 % (61)
Technology
RND 11.22 % (9) 7.11 % (6) 15.86 % (35) 13.97 % (50) 6.30 % (21) 8.21 % (7) 7.85 % (18) 7.20 % (46)
SIZE 1.93E+09 (10) 6.40E+08 (6) 5.70E+10 (39) 4.08E+10 (55) 5.54E+09 (21) 2.35E+10 (18) 4.69E+09 (31) 9.41E+09 (71)
SOLV 44.80 % (10) 63.53 % (6) 57.76 % (39) 56.03 % (55) 45.23 % (21) 48.38 % (18) 56.67 % (31) 51.00 % (71)
Telecommunications
RND 0.00 % (2) 0.27 % (1) 7.49 % (23) 6.64 % (26) 0.49 % (7) 0.39 % (1) 0.14 % (5) 0.35 % (13)
SIZE 3.82E+10 (2) 4.03E+10 (1) 1.09E+11 (37) 1.04E+11 (40) 1.04E+10 (8) 1.46E+10 (2) 3.52E+10 (5) 1.92E+10 (15)
SOLV 33.74 % (2) 29.42 % (1) 39.94 % (36) 39.36 % (39) 43.70 % (8) 67.69 % (2) 44.40 % (5) 47.13 % (15)

27
4.2. Test for Multicollinearity
To detect for multicollinearity, table (3) below presents Pearson’s correlation coefficients for each combination of independent variables and table (4) presents the variance inflation factor (VIF).
4.2.1. Pearson’s Correlation Table
Table (3) Pearson's Correlation Table FREQ SIZE SOLV
FREQ 1.0000 SIZE -0.0485 1.0000 SOLV -0.0222 -0.2083*** 1.0000
Table (3) presents Pearson’s correlation coefficients for each combination of independent variables for the sample period 2008-2012. The highest possible correlation is |1| and the lowest possible correlation is 0. A correlation of >|0.8| indicates a presence of multicollinearity. FREQ is a dummy variable and stands for the regulated reporting frequency, either semi-annual or quarterly. SIZE is defined in terms of operating revenues. SOLV is defined as total equity divided by the book value of total asset. The sample constitutes of all firms listed on BSE, CSE, FSE (the prime standard segment), HSE, LSE and SSE within the sectors: automobile and parts, chemicals, healthcare (including pharmaceuticals and biotechnology), technology and telecommunications (see appendix 2 for stock exchange information and appendix 3 for list of sample firms). Significant results are marked with asterisks, as follows: * p < 0.05, ** p < 0.01, *** p < 0.001.
Table (3) presents low negative correlations of approximately 0.05 between FREQ and SIZE, and 0.02 between FREQ and SOLV, indicating that problems of multicollinearity do not exist between these variables (see Lee, Lee & Lee, 2000). A negative correlation of approximately 0.21 is found between SIZE and SOLV at the 0.001 significance level, implicating that larger firms finance their assets with debt to a larger extent than smaller firms. Although being significant, the magnitude of this correlation is not large enough to indicate multicollinearity (see Lee, Lee & Lee, 2000;; Lee & O’Neill, 2003).
4.2.2. Variance Inflation Factor
Table (4) Variance Inflation Factor (VIF)
Variable Variance Inflation Factor (VIF) 1/VIF
SIZE 1.05 0.953194 SOLV 1.05 0.954571 FREQ 1.00 0.997546 Mean VIF 1.03
Table (4) presents the variance inflation factor (VIF) and 1/VIF for each independent variable as well as the mean VIF for the sample period 2008-2012. A VIF of >10 indicates multicollinearity. SIZE is defined in terms of operating revenues. SOLV is defined as total equity divided by the book value of total asset. FREQ is a dummy and stands for the regulated reporting frequency, either semi-annual or quarterly. The sample constitutes of all firms listed on BSE, CSE, FSE (the prime standard segment), HSE, LSE and SSE within the sectors: automobile and parts, chemicals, healthcare (including pharmaceuticals and biotechnology), technology and telecommunications (see appendix 2 for stock exchange information and appendix 3 for list of sample firms).

28
Table (4) presents low VIF-values for all independent variables, and consequently, a low mean VIF. The mean VIF of 1.03 is far below the critical value of 10 (see Lee, Lee & Lee, 2000), thus reinforcing the results observed in Pearson’s correlation table (table 3), suggesting that problems of multicollinearity do not exist for the examined data set.
4.3. Robust Regression Statistics
Table (5) presents the robust multiple regression statistics for the sample period 2008-2012 (see appendix 7 for sector individual robust multiple regression statistics). Table (5) Robust Multiple Regression Statistics
Variable Coefficient Robust Standard Error t-value
Constant 0.0491529 0.0345657 1.42
FREQ -0.049104 0.0215644 -2.28*
SIZE -8.19E-14 3.15E-14 -2.60**
SOLV 0.2001292 0.0613851 3.26***
Adjusted R2
0.07022133
Number of Observations
320
Table (5) presents the OLS estimates and robust standard errors for the sample period 2008-2012. The coefficients capture the effect of each independent variable on RND. The constant shows the value of RND when FREQ, SIZE and SOLV equal 0. RND is defined as R&D investments divided by the operating revenue. FREQ is a dummy and stands for the regulated reporting frequency, where a required semi-annual reporting is denoted 0 and a mandated quarterly reporting is denoted 1. SIZE is defined in terms of operating revenues. SOLV is defined as total equity divided by the book value of total assets. The adjusted R2 denotes the explanatory power of the regression model. The sample constitutes of all firms listed on BSE, CSE, FSE (the prime standard segment), HSE, LSE and SSE within the sectors: automobile and parts, chemicals, healthcare (including pharmaceuticals and biotechnology), technology and telecommunications (see appendix 2 for stock exchange information and appendix 3 for list of sample firms). A total number of 320 observations are processed in the robust multiple regression. Significant results are marked with asterisks, as follows: * p < 0.05, ** p < 0.01, *** p < 0.001.
The robust regression statistics show a significant correlation between the frequency of mandatory financial reporting and investments in R&D. This leads to a rejection of the derived null hypothesis
at the chosen 0.05 level. Hence, the alternative hypothesis, ( , is accepted (see method and data 3.5.1. for further information regarding hypothesis testing). As expected, a negative correlation is observed (see method and data 3.5.1.), indicating that firms that are mandated to disclose quarterly reports invest less in R&D than firms that are required to disclose semi-annual reports. A negative correlation is observed for the whole sample as well as sector individually (see appendix 7 for sector individual regression statistics). This is important to acknowledge since it implicates that no individual sector characteristic influences the whole sample to cause skewed results. The regression results also show a significant negative correlation between firm size and investments in R&D at the 0.01 significance level. This suggests that firms that report higher revenues invest a lower proportion of their total revenues in R&D. This finding is in line with Lee and O’Neill (2003) who also observe a negative correlation between these variables, though using the logarithm of assets

29
as a measurement of firm size. Thereby, also supporting the statement by Ortega-Argilés, Moreno and Caralt (2005), suggesting that consistent results of the correlation between R&D investments and firm size is observed regardless of how firm size is measured. Furthermore, a positive correlation is found between the solvency ratio and R&D investments at the 0.001 significance level, suggesting that firms that finance their assets with equity instead of debt invest more in R&D. Moreover, table (5) presents a low adjusted R2 of approximately 0.07, implying that only a small part of variations in R&D investments are explained by the independent variables included in the regression equation. A low adjusted R2 is expected since several factors are assumed to influence management investment decisions and since important variables are likely to be omitted from the regression equation (see appendix 6). Also, low values of adjusted R2 are a common feature when examining variations in R&D investments (see for example Bushee, 1998;; Lee & O’Neill, 2003). It should be noted that a low value of adjusted R2 does not mean that important conclusions cannot be drawn from the data, since the data set still provides significant results.

30
5. Discussion of Empirical Results
This chapter analyzes and discusses the obtained results with reference to the thesis’ theoretical framework, previous research and formulated research question. The robust regression results presented in chapter four confirm a negative relationship between an increased frequency of mandatory financial reporting and investments in R&D at the 0.05 significance level. Therefore, this thesis suggests that the frequency of mandatory financial reporting has an influence on investments in R&D, on the basis of the examined data set. As this thesis relies on endogenous growth models, which advocate that optimal growth is not only acquired by external forces, R&D investments are considered vital for firms that strive for a maximum level of economic growth (see for example Grossman & Helpman, 1994; Romer, 1990; 1994). Without manager’s decisiveness to invest in R&D, the company will not grow to its full potential, regardless of fortunate macroeconomic situations or other external forces. The negative correlation of the result indicates that managers required to disclosing financial reports at a higher frequency also invest less in R&D. In accordance with the endogenous growth model, investing less in R&D is related to investing less in long-term growth. This confirms some managers public statements that a mandatory quarterly reporting requirement results in a lost focus on long-term growth, compared to a semi-annual reporting requirement (see for example Hugo, 2013b; The Business Times, 2014). From a theoretical perspective, this management behavior possibly takes its root in the agency theory and the pronounced conflict of interests that occurs between owners and managers of a firm (see for example Berle & Means, 1932; Mitnick, 1975; Ross, 1973). Management choices that impact firm performance should in theory always lie in the interest of the shareholders (Damodaran, 2001; Ross, 1973). However, as managers tend to be evaluated based on financial results, previous research has suggested that they have incentives to exaggerate the financial performance of a firm due to self-interests (Davidson III et al. 2004). More explicitly, previous research has found that many managers are willing to decrease discretionary spending in R&D to meet an earnings target, even though this is certainly not in the best interests of shareholders (Graham, Harvey & Rajgopal, 2005; Grinyer, Russell & Collison, 1998). This study extends the existing research by providing topical empirical results indicating that managers, who must comply with earnings targets more often, invest less in R&D compared to less pressured managers. Also, the evidence supports previous research that implies reduced R&D investments for the purpose of meeting or beating short-term earnings target as a real action (see for example Graham, Harvey & Rajgopal, 2005; Grinyer, Russell & Collison, 1998; Schipper, 1989). Consequently, this could imply that an increased frequency of mandatory financial reporting also increases the amount of real actions committed by managers. Furthermore, previous research within managerial myopia suggests that many shareholders tend to sell their stocks in times of low earnings announcements. With information asymmetry present, and R&D investments being a sunk cost inversely related to short-term earnings, shareholders often fail to recognize the value of R&D investments in terms of long-term growth and prosperity (Lee & O’Neill, 2003; Stein, 1989). According to Stein (1989), this short sighted shareholder behavior pressures managers to behave short-termed for the purpose of meeting or beating earnings expectations. This thesis supports the research by Stein (1989) as its empirical result denotes that a more frequent market pressure (in terms of additional earnings announcements) is correlated with less investments in R&D,

31
hence, less investments in future growth. In other words, higher frequency of mandatory financial reporting can be a potential reason for managers to behave myopically. This is partly in line with the research by Bhojraj and Libby (2005), who also suggest a relationship between financial reporting frequency and managerial myopia. However, this thesis extends their research with empirical evidence suggesting that additional earnings targets, in terms of additional financial reports, function as a type of market pressure. To summarize, the robust regression results of this thesis propose that firms mandated to disclose financial reports on a quarterly basis invest slightly less in R&D compared to firms allowed to only disclose semi-annual reports. Thus, with support from discussed theories and literature, the results suggest that managerial myopia exists in an environment where managers more frequently must meet market expectations on interim reported earnings.

32
6. Conclusion
This chapter concludes the findings of this thesis and discusses how they can contribute to academia and practice. It also points out the limitations of this study and leaves suggestions for further research to be done in the area. Today, theorists and jurisdictions are dissentient on whether one reporting frequency is superior another. As a result, some stock exchanges, and/or countries, require their listed firms to disclose semi-annual reports whereas others require quarterly reports. Those in favor of quarterly reporting commonly argue for increased market transparency, while those against it argue that an increased frequency can lead to a lost focus on long-term growth due to continuously having to meet short-term earnings targets. The purpose of this thesis was to empirically investigate how management focus on long-term growth is affected by the frequency of mandatory financial reporting. By applying a robust multiple regression analysis, this thesis provides empirical evidence of a negative correlation between an increased frequency of mandatory financial reporting and investments in R&D at the 0.05 significance level. More explicitly, the findings implicate that firms mandated to disclose quarterly interim reports invest slightly less in R&D than firms required to report half-yearly. A negative correlation is found for the whole sample as well as for each examined sector individually. Overall, the regression model, also controlling for firm size and solvency, concludes that these variables provide a low explanatory power of variations in R&D investments. Nevertheless, the findings of this thesis are still subject to acknowledge further owing to the statistical significance.
6.1. Significance of the Study
The results of this thesis do not only fill a theoretical knowledge gap, but also extend the empirical findings within the research areas of managerial myopia and earnings management. The usage of R&D investments as a measurement of long-term growth is not unfamiliar. Yet, examining an increased frequency as a potential reason for managers to behave myopically is a previously uncharted territory. This thesis distinguishes, as it takes a holistic viewpoint by combining research from different fields to acknowledge how short-termism in the financial markets today may result in decreased prosperity for firms and society at large in the longer term. However, to draw any conclusions regarding this phenomenon as a whole is beyond the scope of this study. Furthermore, this study provides new insights to the area of financial reporting, as it implies that reduced R&D investments is a potential drawback of a mandated quarterly interim reporting, compared to semi-annual reporting. Additionally, the findings can be of interest to practitioners and other parties. First, it should be of interest to legislators, standard setting entities and stock exchanges, which have a key regulatory influence in setting standards with regard to the mandatory reporting frequencies applied on stock exchanges. When legislating about reporting frequency, these parties should consider weighing the benefits of a more frequent reporting against the risk of reduced R&D investments among firms. Second, the findings may be of interest for companies when deciding which stock exchange to be listed on. Lastly, the evidence should be of interest to investors and analysts facing investment decisions or advices. The findings of this thesis suggest that investors who value R&D investments could gain from investing in companies that are only required to report half-yearly.

33
Moreover, the findings suggest an additional factor to take into consideration for all above mentioned parties in their decision-making process. Namely, what is more important, frequently updated information and market transparency or managerial focus on long-term growth in terms of R&D investments?
6.2. Limitations of the Study
To be able to evaluate the results of this thesis, it is important to acknowledge its limitations. Model specific limitations as well as method quality, in terms of reliability and validity, is thoroughly discussed in the quality of method, section 3.6. As previously mentioned, an obvious limitation of this study is the risk of omitting important variables, which can be hypothesized to influence R&D investments. For example, previous research suggests that different ownership structures may cause variations in R&D investments (see for example Bushee, 1998;; Lee & O’Neill, 2003;; Wang & Wu, 2007), which is not controlled for in this thesis. Nonetheless, the chosen variables are systematically motivated in the method and data chapter. The sample examined in this thesis only includes firms listed on six different stock exchanges, all of them from northern Europe. Also, all of the sample firms operate within five examined industries. Due to this, the findings may not be transmittable to other markets, geographical locations or sectors. Out of 431 companies, only 320 disclosed information about all examined variables. Thus, there is a risk that this drop-off can cause skewed results. Furthermore, some sample firms are listed on more than one stock exchange. This means that these companies comply with reporting regulations from several stock exchanges, which can decrease the credibility of the results. If a company is listed on two or more of the examined stock exchanges, it is counted to the stock exchange where it is mainly listed. This fact, along with the fact that some firms might choose to disclose quarterly interim reports, although they are allowed to report half-yearly, is a clear limitation of this study. Still, this thesis subjectively chooses to disregard these facts as well as voluntary disclosures, since it aims to examine the consequences of mandatory interim reporting. This means that the difference of investments in R&D could be even larger, or smaller, between firms that actually report half-yearly, versus firms that report quarterly. Since all data is observed during the time period 2008-2012, the examined sample includes the most recent financial crisis and its aftermath. Thus, there is a risk that this event influences the firm’s revenues, level of debt and intention to invest in new ventures and opportunities. This means that R&D investments could be lower for these years compared to years of prosperity, which in turn could result in misrepresenting empirical results. Also, since relationships have the tendency to change over time, there is always a risk that the examined years is misrepresenting compared to future years. Moreover, due to investments in R&D being a viscous post, it can be questioned whether five years is a long enough time range to observe any real differences that would imply the hypothesized relationship. However, these years are still chosen due to the aim of providing topical results.

34
6.3. Suggestions for Future Research
Financial reporting and its proposed impact on management focus on long-term growth is a globally acknowledged issue, recurrently discussed in the media debate (see for example Hugo, 2013b; The Business Times, 2014). Yet, research examining this matter is extremely sparse, if not nonexistent. Therefore, additional research within this subject is interesting in terms of filling theoretical knowledge gaps as well as providing empirical evidence to real markets. This study is the first of its kind, illustrating the major possibilities of additional research within the area. By utilizing this study as a pre-study, other researchers can attack the research subject with a larger sample, including not only more companies but additional countries and industries. Also, it would be interesting to include additional control variables in the regression equation in order to better explain variations in R&D investments. For example, previous research has suggested that ownership structures (Bushee, 1998; Lee & O’Neill;; Wang & Wu, 2007) and the presence of star scientists (Zucker, Darby & Brewer, 1998) could influence R&D investments. Moreover, it would be of great interest if future research could find the opportunity to perform an event study. Especially, it would be intriguing to examine whether firms that have gone from quarterly reporting to semi-annual reporting, or the other way around, have changed their R&D investment behavior. Furthermore, “management focus on long-term growth” is an extensive concept that includes many different aspects. A suggestion for future research would be to study the relationship between long-term thinking and an increased disclosure frequency by using another measurement than R&D investments. For example, number of patents could be an alternative measurement. Also, it would be enlightening if a new study would combine quantitative and qualitative research. Triangulation would not only strengthen the results, it could also reveal further reasons for management behavior related to reporting frequency and financial reporting in general.

35
References
Al-Ubaydli, O., & Kealey, T. (2000). Endogenous growth theory: a critique. Economic Affairs, 20(3), 10-13.
Barney, J.B., & Hansen, M.H. (1994). Trustworthiness as a Source of Competitive Advantage. Strategic Management Journal, 15(1), 175-190.
Barton, D. (2011). Capitalism for the Long Term. Harvard Business Review, 89(3), 84-91.
Berle, A.A. Jr., & Means, G.C. (1932). The Modern Corporation and Private Property. New York, NY: MacMillan.
Bhaumik, S.K., Driffield, N., & Pal, S. (2010). Does ownership structure of emerging-market firms affect their outward FDI? The case of the Indian automotive and pharmaceutical sectors. The Journal of International Business Studies, 41(3), 437-450.
Bhojraj, S., & Libby, R. (2005). Capital Market Pressure, Disclosure Frequency-Induced Earnings/Cash Flow Conflict, and Managerial Myopia. The Accounting Review, 80(1), 1-18.
Boyd, B.K. (1995). CEO Duality and Firm Performance: A Contingency Model. Strategic Management Journal, 16(4), 301-312.
Bryman, A., & Bell, E. (2011). Business Research Methods. (3rd ed.). New York, NY: Oxford University Press.
Bushee, B.J. (1998). The Influence of Institutional Investors on Myopic R&D Investment Behavior. The Accounting Review, 73(3), 305-333.
Butler, M., Kraft, A., & Weiss, I.S. (2007). The effect of reporting frequency on the timeliness of earnings: The cases of voluntary and mandatory interim reports. Journal of Accounting and Economics, 43(2-3), 181-217.
Chen, X., Ender, P.B., Mitchell, M., & Wells, C. (2003). Regression with Stata. [webb book] Downloaded May 5, from: http://www.ats.ucla.edu/stat/stata/webbooks/reg/chapter2/statareg2.htm.
Chin, C-L., Chen, Y-J., Kleinman, G., & Lee, P. (2009). Corporate Ownership Structure and Innovation: Evidence from Taiwan’s Electronics Industry. Journal of Accounting, Auditing and Finance, 24(1), 145-175.
Christensen, L., Engdahl, N., Grääs, C., & Haglund, L. (2010). Marknadsundersökning – en handbok. (3rd ed.). Lund: Studentlitteratur AB.
Cornand, C., & Gimet, C. (2012). The 2007-2008 financial crisis: Is there evidence of disaster myopia? Emerging Markets Review, 13(3), 301-315.
Corvellec, H. (1997). Stories of Achievements: Narrative Features of Organizational Performance. New Brunswick: Transaction Publishers.
Cotter, D. (2012). Advanced Financial Reporting: A Complete Guide to IFRS. Harlow: Pearson Education Ltd.
Czarnitzki, D., & Kraft, K. (2009). Capital control, debt financing and innovative activity. Journal of Economic Behavior and Organization, 71(2), 372-383.
Dahmström, K. (2005). Från datainsamling till rapport: att göra en statistisk undersökning. (4:6 ed.). Lund: Studentlitteratur AB.
Dallas, L.L. (2012). Short-Termism, the Financial Crisis, and Corporate Governance. The Journal of Corporation Law, 37(2), 265-364.
Damodaran, A. (2001). Corporate Finance: Theory and Practice. (2nd ed.). Hoboken, NY: Wiley & Sons Inc.
Davidson III, W.N., Jiraporn, P., Young Sang, K.., & Nemec, C. (2004). EARNINGS MANAGEMENT FOLLOWING DUALITY-CREATING SUCCESSIONS: ETHNOSTATISTICS, IMPRESSION MANAGEMENT AND AGENCY THEORY. Academy of Management Journal, 47(2), 267-275.
Domar, E.D. (1946). Capital Expansion, Rate of Growth, and Employment. Econometrica, 14(2), 137-147.

36
Durnev, A., Morck, R., Yeung, B., & Zarowin, P. (2003). Does Greater Firm-Specific Return Variation Mean More or Less Informed Stock Pricing? Journal of Accounting Research, 41(5), 797-836.
Dye, R.A. (1988). Earnings Management in an Overlapping Generations Model. Journal of Accounting Research, 26(2), 195-235.
Eilfsen, A., Messier Jr, W.F., Glover, S.M., & Prawitt, D.F. (2010). Auditing & Assurance Services. (2nd ed.). Berkshire: McGraw-Hill Education (UK) Ltd.
Frankfurt Stock Exchange. (2014). Prime Standard – Transparency Standards. Downloaded January 4, 2014 from: http://www.boerse-frankfurt.de/en/basics+overview/market+segments/prime+standard. Appendix 2.
Graham, J.R., Harvey, C.R., & Rajgopal, S. (2005). The economic implications of corporate financial reporting. Journal of Accounting and Economics, 40(1-3), 3-73.
Griffith, R., Redding, S., & Van Reenen, J. (2004). Mapping the Two Faces of R&D: Productivity Growth in a Panel of OECD Industries. Review of Economics and Statistics, 86(4), 883-895.
Grinyer, J., Russell, A., & Collison, D. (1998). Evidence of Managerial Short-termism in the UK. British Journal of Management, 9(1), 13-22.
Grossman G.M., & Helpman, E. (1994). Endogenous Innovation in the Theory of Growth. Journal of Economic Perspectives, 8(1), 23-44.
Hamilton, L.C. (2009). Statistics with STATA: updated for version 10. (6th ed.). Belmont, CA: Brooks/Cole.
Harrod, R.F. (1939). An Essay in Dynamic Theory. The Economic Journal, 49(193), 14-33.
Hill, C.W.L., & Snell, S.A. (1988). EXTERNAL CONTROL, CORPORATE STRATEGY, AND FIRM PERFORMANCE IN RESEARCH-INTENSIVE INDUSTRIES. Strategic Management Journal, 9(6), 577-590.
Hugo, K. (2013a, February 13). H&M:s vd vill slippa kvartalsrapporterna. SvD Näringsliv. Downloaded February 18, 2014 from: http://www.svd.se/naringsliv/branscher/handel-och-tjanster/persson-avundsjuk-pa-ikea_7910084.svd
Hugo, K. (2013b, February 20). Åtta av tio börsbolag vill slopa kvartalsrapporter. SvD Näringsliv. Downloaded February 18, 2014 from: http://www.svd.se/naringsliv/branscher/handel-och-tjanster/atta-av-tio-borsbolag-vill-slopa-kvartalsrapporter_7924810.svd
International Accounting Standards Board (IASB). (2010). The Conceptual Framework for Financial Reporting 2010. London, United Kingdom: IASB. Downloaded February 14, 2014 from: http://www.iasplus.com/en/standards/other/framework
Jacobson, R., & Aaker, D. (1993). Myopic management behavior with efficient, but imperfect, financial markets: A comparison of information asymmetries in the U.S. and Japan. Journal of Accounting and Economics, 16(4), 383-405.
Jensen, M.C. (1989). The takeover controversy: Analysis and evidence. In J. M. Stern, G. B. Stewart III, & D. H. Chew (Eds.), Corporate restructuring and executive compensation: (pp. 3-43). Cambridge: Ballinger.
Kay, J. (2012, July). The Kay Review of UK Equity Markets and Long Term Decision Making. Downloaded February 14, 2014 from: https://www.gov.uk/government/uploads/system/uploads/attachment_data/file/253454/bis-12-917-kay-review-of-equity-markets-final-report.pdf
Kopf, D.A. (2007). Endogenous growth theory applied: Strategies for university R&D. Journal of Business Research, 60(9), 975-978.
Lee, C.F., Lee, J.C., & Lee, A.C. (2000). Statistics for Business and Financial Economics. (2nd. ed.). Singapore: World Scientific Publishing Co. Pte. Ltd.
Lee, P.M., & O’Neill, H.M. (2003). Ownership Structures and R&D Investments of U.S. and Japanese Firms: Agency and Stewardship Perspectives. Academy Of Management Journal, 46(2), 212-225.

37
Leuz, C., & Verrecchia, R.E. (2000). The economic consequences of increased disclosure. Journal of Accounting Research, 38(3), 91-124.
London Stock Exchange. (2010). A guide to listing on the London Stock Exchange, November 2010. London, United Kingdom: London Stock Exchange. Downloaded January 4, 2014 from: http://www.londonstockexchange.com/home/guide-to-listing.pdf. Appendix 2.
Løvås, G. G. (2006). Statistik: metoder och tillämpningar. Malmö: Liber.
Mensah, Y.M., & Werner, R.H. (2008). The capital market implications of the frequency of interim financial reporting: an international analysis. Review of Quantitative Finance and Accounting, 31(1), 71-104.
Mitnick, B.M. (1975). The Theory of Agency: The Policing “Paradox” and Regulatory Behavior. Public Choice, 24(1), 27-42.
Myers, S.C. (1977). Determinants of corporate borrowing. Journal of Financial Economics, 5(2), 147-175.
Nagy, A.L., & Neal, T.L. (2001). An empirical examination of corporate myopic behavior: a comparison of Japanese and U.S. companies. The International Journal of Accounting, 36(1), 91-113.
NASDAQ OMX Nordic Copenhagen. (2013). Rule Book for Issuers, NASDAQ OMX Nordic Copenhagen, 1 June 2013. Copenhagen, Denmark: NASDAQ OMX Nordic Copenhagen. Downloaded January 4, 2014 from: http://www.nasdaqomx.com/digitalAssets/85/85436_rulesforissuersofshares-final06052013clean.pdf. Appendix 2.
NASDAQ OMX Nordic Helsinki LTD. (2013). Rules of the Exchange, NASDAQ OMX Helsinki LTD, 2 October 2013. Helsinki, Finland: NASDAQ OMX Nordic Helsinki LTD. Downloaded January 4, 2014 from: http://www.nasdaqomx.com/digitalAssets/87/87944_rules-of-the-exchange_02102013.pdf. Appendix 2.
NASDAQ OMX Nordic Stockholm. (2013). An Improved Climate for IPOs for Sweden’s Growth – Problem Analysis and Proposed Action. Stockholm, Sweden: NASDAQ OMX Nordic Stockholm. Downloaded January 4, 2014 from: http://www.nasdaqomx.com/digitalAssets/87/87876_ipo_actionplan_20130925.pdf.
NASDAQ OMX Nordic Stockholm. (2014). Rule Book for Issuers, NASDAQ OMX Nordic Stockholm, 1 January 2014. Stockholm, Sweden: NASDAQ OMX Nordic Stockholm. Downloaded January 4, 2014 from: http://www.nasdaqomx.com/digitalAssets/89/89143_nasdaq-omx-stockholm-rule-book-for-issuers---1-januari-2014.pdf. Appendix 1.
Neu, D. (1991). Trust, impression management and the public accounting profession. Critical Perspectives on Accounting, 2(3), 295-313.
Neuman, W.L. (2013). Social Research Methods: Qualitative and Quantitative Approaches. (7th ed.). Upper Saddle River, NJ: Pearson Education Inc.
Newbold, P., Carlson, W.L., & Thorne, B. (2010). Statistics for Business and Economics. (7th ed.). Upper Saddle River, NJ: Pearson Education Inc.
NYSE Euronext Brussels. (2014). Reporting Obligations (Transparency). Downloaded January 4, 2014 from: https://europeanequities.nyx.com/en/listings/reporting-obligations. Appendix 2.
ORBIS Database. (2014). Orbis. London, UK: Bereau Van Dijk. Downloaded February 20 – May 10, 2014 from: https://orbis.bvdinfo.com/version-201457/home.serv?product=orbisneo. Appendix 3.
Organisation for Economic Co-operation and Development (OECD). (2014). Glossary of statistical terms – research and development. Downloaded January 6, 2014 from: http://stats.oecd.org/glossary/detail.asp?ID=2311
Ortega-Argilés, R., Moreno, R., & Caralt, J.S. (2005). Ownership structure and innovation: is there a real link? Annals of Regional Science, 39(4), 637-662.
Rahman, A.R., Tay, T.M., Ong, B.T., & Cai, S. (2007). Quarterly reporting in a voluntary disclosure environment: Its benefits, drawbacks and determinants. The International Journal of Accounting, 42(4), 416-442.

38
Romer, P.M. (1990). Endogenous Technological Change. Journal of Political Economy, 98(5), 71-102.
Romer, P.M. (1994). The Origins of Endogenous Growth. Journal of Economic Perspectives, 8(1), 3-28.
Ross, S.A. (1973). The Economic Theory of Agency: The Principal's Problem. The American Economic Review, 63(2), 134-139.
Schipper, K. (1989). Commentary on Earnings Management. Accounting Horizons, 31(4), 91-102.
Solow, R.M. (1956). A contribution to the theory of economic growth. Quarterly Journal of Economics, 70(1), 65-94.
Stein, J.C. (1989). Efficient Capital Markets, Inefficient Firms: A Model of Myopic Corporate Behavior. Quarterly Journal of Economics, 104(4), 655-669.
Swan, T.W. (1956). Economic Growth and Capital Accumulation. Economic Record, 32(2), 334-361.
The Business Times. (2014, January 27). The value of quarterly reporting. Singapore: The Business Times. Downloaded January 27, 2014 from: http://search.proquest.com/docview/1491755642?accountid=8028
Trueman, B., & Titman, S. (1988). An Explanation for Accounting Income Smoothing. Journal of Accounting Research, 26(3), 127-139.
Wang, D.H-M., & Wu, S-R. (2007). On the Relationship between Corporate Governance and Managerial Myopia, KANSEI Engineering International, 7(1), 9-17.
White, H. (1980). A Heteroskedasticity-Consistent Covariance Matrix Estimator and a Direct Test for Heteroskedasticity. Econometrica, 48(4), 817-838.
Yee, K.K. (2004). Interim Reporting Frequency and Financial Analysts' Expenditures. Journal of Business Finance and Accounting, 31(1-2), 167-198.
Zucker, L.G., Darby, M.R., & Brewer, M.B. (1998). Intellectual Human Capital and the Birth of U.S. Biotechnology Enterprises. American Economic Review, 88(1), 290-306.

39
Appendices
Appendix 1: Change of Reporting Regulations, NASDAQ OMX Nordic Stockholm
Starting from 2014, for firms listed on NASDAQ OMX Nordic Stockholm, the annual report and the half-yearly interim report shall include information required by the IAS 34, but the reports for the first and third quarter only need to include the information required from the Securities Market Act (2007:528) Chapter 16, section 6. See extract from rule book for issuers below.
“3.2.3 Content of financial reports
The announcement containing the financial statement release and the half-yearly financial report shall at least include the information required by IAS 34 “Interim financial reporting”.
The reports for the first and third quarter shall at least include the information stated in chapter 16, section 6 in the Securities Market Act (2007:528), Interim management statement.” (NASDAQ OMX Nordic Stockholm, 2014, p. 32)
Before 2014, the listed companies needed all their interim reports to comply with the IAS 34 (NASDAQ OMX Nordic Stockholm, 2014). This change in regulations are based on a study where NASDAQ OMX Nordic Stockholm recognized many companies complaints that the production of quarterly reports takes too much of an effort and are too costly (NASDAQ OMX Nordic Stockholm, 2013).

40
Appendix 2: Interim Reporting Regulations Appendix (2) lists the stock exchanges included in the sample as well as excerpts regarding reporting requirements from each stock exchange.
Interim Reporting Regulations
Stock Exchange Mandatory Reporting Frequency
Reporting Regulations Extract from Rule Book and/or Guide Regulatory Authority
NYSE Euronext Brussels
(BSE)
Semi-Annual
Listed firms are not required to publish quarterly reports/earnings.
“Financial information: issuers of securities admitted to trading on a regulated market are required to disclose annual and half-yearly financial reports as well as interim financial [i.e. management]statements or quarterly financial reports.” (NYSE Euronext Brussels, 2014)
Financial Services and Market Authority (FSMA), Formerly: Banking, Finance and Insurance Commissions (CBFA)
NASDAQ OMX Nordic Copenhagen
(CSE) Semi-Annual Listed firms are not required to publish quarterly reports/earnings.
“3.2.1. Financial reports The company shall prepare and disclose all financial reporting pursuant to accounting regulations and regulations applicable to the company. Where applicable, a company may disclose interim management statements instead of disclosing quarterly reports. Where a financial statement release is not required, the company may instead disclose the annual financial report as soon as possible following the completion of the report." (NASDAQ OMX Nordic Copenhagen, 2013, p. 26)
Finanstilsynet
Frankfurt Stock Exchange (prime standard segment)
(FSE) Quarterly Listed firms are required to publish quarterly reports/earnings.
"Companies listed in the Prime Standard are required to meet high transparency standards; beyond those of the General Standard which are based on minimum legal requirements set forth by the Official Market and the Regulated Market. These criteria are as follows: • Quarterly reporting both in German and English • Use of international accounting standards (IFRS/IAS or US-GAAP) • Publication of a corporate calendar staging of at least one analyst conference per year • Ad-hoc-disclosure additionally in English." (Frankfurt Stock Exchange, 2014)
Bundesanstalt für Finansdienst-leistungsaufsicht (BAFIN)
NASDAQ OMX Nordic Helsinki
(HSE) Quarterly According to NASDAQ OMX Nordic Helsinki, listed firms are not required to publish quarterly reports. However, Finnish legislation requires listed companies to disclose interim financial statements for the first 3, 6 and 9 months of the financial year (Finnish Securities Market Act, Section 3, Chapter 7, 10-11§§). Exceptions are very rare.
"2.3.2.1. Financial reports The listed company shall prepare and disclose all financial reports pursuant to legislation and other regulations applicable to the listed company. The listed company may disclose interim management statements in accordance with the Securities Market Act instead of disclosing quarterly interim reports." (NASDAQ OMX Nordic Helsinki LTD, 2013, p. 37)
Finanssavalvonta
London Stock Exchange
(LSE) Semi-Annual Listed firms are not required to publish quarterly reports/earnings.
"Once the IPO has been completed and the company has been admitted to the Main Market, a listed company will be subject to a number of reporting obligations. These include: Report and accounts • audited annual report and accounts must be published within four months of the year-end and include corporate governance disclosures • unaudited figures must be prepared for the half-year within two months of the half-year end • interim management statements during each of the first and second halves of the year.” (London Stock Exchange, 2010, p. 55)
Financial Services Authority (FSA)
NASDAQ OMX Nordic Stockholm
(SSE) Quarterly Listed firms were required to publish quarterly reports/earnings up until January 2014 (see appendix 1).
See appendix 1. Finansinspektionen

41
Appendix 3: List of Sample Firms
Appendix (3) presents a list of all sample firms examined in this thesis. The list includes the average R&D intensity ratio, the average operating revenues and the average solvency ratio for each sample firm during the sample period 2008-2012. The R&D intensity ratio is defined as R&D investments divided by the operating revenue. The solvency ratio is defined as total equity divided by the book value of total assets. The data is exclusively collected from the global statistics database ORBIS. All numbers of operating revenues are stated in the Swedish Krona (SEK), and have been directly acquired in SEK from ORBIS. The exchange rates used by ORBIS are collected from IMF (the International Monetary Fund) and the exchange rates used are those of the closing date of each statement (access ORBIS for more information)4. Unavailable numbers are marked n.a. (not available). Firms marked with an asterisk (*) are excluded from the sample due to data being unavailable for one or more examined variables, or for another reason, which is then stated in a footnote.
Company Sector Stock
Exchange
Average R&D Intensity Ratio
2008-2012
Mandatory Reporting Frequency
Average Operating
Revenues 2008-2012 (SEK)
Average Solvency
Ratio 2008-2012
Ford Motor Company (Belgium)* Automobile & Parts BSE n.a. 0 7102967600 13,22% Goodyear Rubber and Tire Co Automobile & Parts BSE 1,83% 0 1,37587E+11 4,47% Scandinavian Breaksystems A/S Automobile & Parts CSE 0,00% 0 1179695400 -5,45% Bayersische Motoren Werke AG Automobile & Parts FSE 3,18% 1 5,85861E+11 21,13% Bertrandt AG Automobile & Parts FSE 0,00% 1 4754771800 54,61%
Continental AG Automobile & Parts FSE 5,78% 1 2,52934E+11 23,78%
Daimler AG Automobile & Parts FSE 3,56% 1 9,40754E+11 24,77%
Elringklinger AG Automobile & Parts FSE 4,80% 1 7964106200 44,33%
Grammer AG Automobile & Parts FSE 3,59% 1 9354406000 32,90%
Leoni AG Automobile & Parts FSE 2,71% 1 29358862600 26,69% Progress-Werkoberkirch AG Automobile & Parts FSE 2,63% 1 2699959000 32,63%
SHW AG Automobile & Parts FSE 1,47% 1 3043439500 42,07%
Volkswagen AG Automobile & Parts FSE 3,40% 1 1,35097E+12 22,31% Nokian Renkaat Oyj Automobile & Parts HSE 1,17% 1 11262301400 63,84%
Amtek Auto Ltd Automobile & Parts LSE 0,00% 0 6968802600 37,43%
Amtel NV Automobile & Parts LSE 1,20% 0 7185752000 -29,22% Enova Systems Inc* Automobile & Parts LSE n.a. 0 47306800 n.a. General Motors Corporation Automobile & Parts LSE 5,31% 0 9,6863E+11 0,68%
GKN Plc Automobile & Parts LSE 1,91% 0 55978406800 25,14% Hyundai Motor Company Ltd Automobile & Parts LSE 0,81% 0 5,39517E+11 26,58% Kumho Tire Co Inc* Automobile & Parts LSE n.a. 0 20958837400 9,88% Mayflower Corporation Plc* Automobile & Parts LSE n.a. 0 n.a. n.a.
4 ORBIS can be accessed via: https://orbis.bvdinfo.com/version-201457/home.serv?product=orbisneo. See ORBIS, 2014 in the reference list for more information.
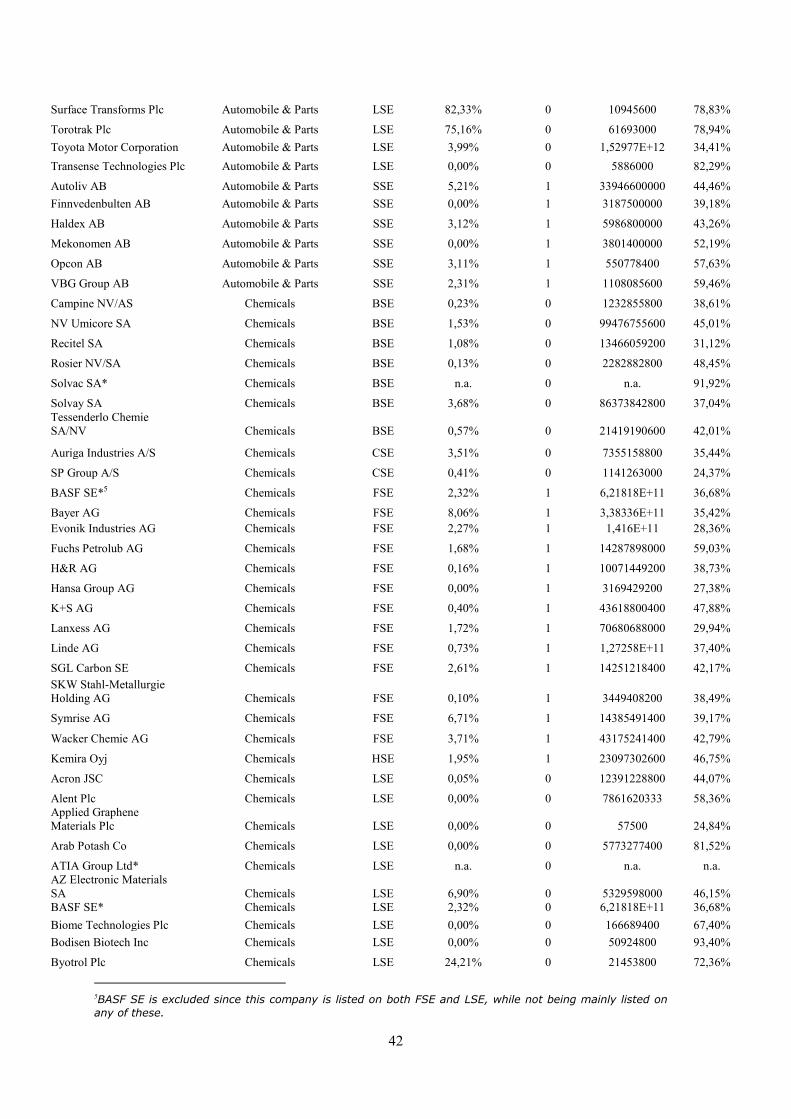
42
Surface Transforms Plc Automobile & Parts LSE 82,33% 0 10945600 78,83%
Torotrak Plc Automobile & Parts LSE 75,16% 0 61693000 78,94% Toyota Motor Corporation Automobile & Parts LSE 3,99% 0 1,52977E+12 34,41% Transense Technologies Plc Automobile & Parts LSE 0,00% 0 5886000 82,29%
Autoliv AB Automobile & Parts SSE 5,21% 1 33946600000 44,46% Finnvedenbulten AB Automobile & Parts SSE 0,00% 1 3187500000 39,18%
Haldex AB Automobile & Parts SSE 3,12% 1 5986800000 43,26%
Mekonomen AB Automobile & Parts SSE 0,00% 1 3801400000 52,19%
Opcon AB Automobile & Parts SSE 3,11% 1 550778400 57,63%
VBG Group AB Automobile & Parts SSE 2,31% 1 1108085600 59,46%
Campine NV/AS Chemicals BSE 0,23% 0 1232855800 38,61%
NV Umicore SA Chemicals BSE 1,53% 0 99476755600 45,01%
Recitel SA Chemicals BSE 1,08% 0 13466059200 31,12%
Rosier NV/SA Chemicals BSE 0,13% 0 2282882800 48,45%
Solvac SA* Chemicals BSE n.a. 0 n.a. 91,92%
Solvay SA Chemicals BSE 3,68% 0 86373842800 37,04% Tessenderlo Chemie SA/NV Chemicals BSE 0,57% 0 21419190600 42,01%
Auriga Industries A/S Chemicals CSE 3,51% 0 7355158800 35,44%
SP Group A/S Chemicals CSE 0,41% 0 1141263000 24,37%
BASF SE*5 Chemicals FSE 2,32% 1 6,21818E+11 36,68%
Bayer AG Chemicals FSE 8,06% 1 3,38336E+11 35,42% Evonik Industries AG Chemicals FSE 2,27% 1 1,416E+11 28,36%
Fuchs Petrolub AG Chemicals FSE 1,68% 1 14287898000 59,03%
H&R AG Chemicals FSE 0,16% 1 10071449200 38,73%
Hansa Group AG Chemicals FSE 0,00% 1 3169429200 27,38%
K+S AG Chemicals FSE 0,40% 1 43618800400 47,88%
Lanxess AG Chemicals FSE 1,72% 1 70680688000 29,94%
Linde AG Chemicals FSE 0,73% 1 1,27258E+11 37,40%
SGL Carbon SE Chemicals FSE 2,61% 1 14251218400 42,17% SKW Stahl-Metallurgie Holding AG Chemicals FSE 0,10% 1 3449408200 38,49%
Symrise AG Chemicals FSE 6,71% 1 14385491400 39,17%
Wacker Chemie AG Chemicals FSE 3,71% 1 43175241400 42,79%
Kemira Oyj Chemicals HSE 1,95% 1 23097302600 46,75%
Acron JSC Chemicals LSE 0,05% 0 12391228800 44,07%
Alent Plc Chemicals LSE 0,00% 0 7861620333 58,36% Applied Graphene Materials Plc Chemicals LSE 0,00% 0 57500 24,84%
Arab Potash Co Chemicals LSE 0,00% 0 5773277400 81,52%
ATIA Group Ltd* Chemicals LSE n.a. 0 n.a. n.a. AZ Electronic Materials SA Chemicals LSE 6,90% 0 5329598000 46,15% BASF SE* Chemicals LSE 2,32% 0 6,21818E+11 36,68% Biome Technologies Plc Chemicals LSE 0,00% 0 166689400 67,40% Bodisen Biotech Inc Chemicals LSE 0,00% 0 50924800 93,40%
Byotrol Plc Chemicals LSE 24,21% 0 21453800 72,36%
5BASF SE is excluded since this company is listed on both FSE and LSE, while not being mainly listed on any of these.

43
Carclo Plc Chemicals LSE 0,00% 0 2547529200 42,06% China Rerun Chemical Group Ltd* Chemicals LSE n.a. 0 n.a. n.a. Croda International Plc Chemicals LSE 2,06% 0 10891454400 29,20%
Elementis Plc Chemicals LSE 1,21% 0 4682667600 49,95% Frutarom Industries Ltd Chemicals LSE 4,71% 0 3467950800 60,72%
Halosource Inc* Chemicals LSE n.a. 0 106674000 n.a.
Hardide Plc Chemicals LSE 4,19% 0 21992600 34,95%
Johnson Matthey Plc Chemicals LSE 0,76% 0 1,02494E+11 43,28%
LG Chem Co Ltd Chemicals LSE 0,22% 0 1,15728E+11 58,52%
OJSC Phosagro Chemicals LSE 0,00% 0 19964950200 68,34% Oxford Advances Surfaces Group Plc* Chemicals LSE n.a. 0 2411200 97,61% Plant Healthcare Plc Chemicals LSE 20,12% 0 94460400 83,17%
Plant Impact Plc Chemicals LSE 73,97% 0 13405800 62,47%
Plastics Capital Plc Chemicals LSE 1,23% 0 322602000 44,53%
Revolymer Plc* Chemicals LSE n.a. 0 4395250 84,20%
Scapa Group Plc Chemicals LSE 1,64% 0 2192034600 35,63%
Synthomer Plc Chemicals LSE 1,36% 0 8519665400 22,11%
Tisza Chemical Group Plc* Chemicals LSE n.a. 0 n.a. n.a.
Treatt Plc Chemicals LSE 0,72% 0 700088600 49,60%
Tyratech Inc* Chemicals LSE n.a. 0 31712000 -4,23%
Urakali JSC Chemicals LSE 0,00% 0 17190909000 65,21%
Versarien Plc Chemicals LSE 43,24% 0 365000 17,41%
Victrex Plc Chemicals LSE 3,41% 0 1912200600 77,36%
Zotefoams Plc Chemicals LSE 2,12% 0 427317800 66,10%
Hexpol AB Chemicals SSE 0,87% 1 4963800000 40,68%
Ablynx NV Heathcare, Pharmaceuticals &
Biotechnology BSE 85,00% 0 247081600 65,48%
Arseus NV Heathcare, Pharmaceuticals &
Biotechnology BSE 0,00% 0 4166434200 37,02%
Cardio3 Biosciences NV* Heathcare, Pharmaceuticals &
Biotechnology BSE n.a. 0 25567333,33 19,56%
Eckert-Ziegler Bebig Heathcare, Pharmaceuticals &
Biotechnology BSE 3,61% 0 280128400 60,69%
Galapagos NV Heathcare, Pharmaceuticals &
Biotechnology BSE 55,14% 0 1119209400 69,43%
Genticel* Heathcare, Pharmaceuticals &
Biotechnology BSE n.a. 0 29381600 87,27% Ion Beam Applications (IBA) SA
Heathcare, Pharmaceuticals & Biotechnology BSE 10,46% 0 2054305400 21,76%
MDxHealth SA* Heathcare, Pharmaceuticals &
Biotechnology BSE n.a. 0 29657600 78,22%
Medivision-Belgium* Heathcare, Pharmaceuticals &
Biotechnology BSE n.a. 0 n.a. n.a.
Pfizer Certificate* Heathcare, Pharmaceuticals &
Biotechnology BSE n.a. 0 4765458000 55,98%
Thrombogenics NV Heathcare, Pharmaceuticals &
Biotechnology BSE 36,18% 0 254570600 93,77%
Tigenix NV* Heathcare, Pharmaceuticals &
Biotechnology BSE n.a. 0 19674400 80,40%
Tubize* Heathcare, Pharmaceuticals &
Biotechnology BSE n.a. 0 n.a. n.a.
UCB NV/SA Heathcare, Pharmaceuticals &
Biotechnology BSE 21,98% 0 33019694000 48,41%

44
Ambu A/S Heathcare, Pharmaceuticals &
Biotechnology CSE 0,41% 0 1159091400 64,53%
Alk-Abello A/S Heathcare, Pharmaceuticals &
Biotechnology CSE 18,24% 0 2696905200 70,31%
Bavarian Nordic A/S Heathcare, Pharmaceuticals &
Biotechnology CSE 52,00% 0 516555800 59,28%
Bioporto A/S Heathcare, Pharmaceuticals &
Biotechnology CSE 37,02% 0 17798200 37,03%
Chemometec A/S Heathcare, Pharmaceuticals &
Biotechnology CSE 0,00% 0 47442400 87,04%
Chr. Hansen Holding A/S Heathcare, Pharmaceuticals &
Biotechnology CSE 4,15% 0 5381706000 30,73%
Coloplast A/S Heathcare, Pharmaceuticals &
Biotechnology CSE 1,63% 0 12099021600 43,37%
Exiqon A/S Heathcare, Pharmaceuticals &
Biotechnology CSE 12,84% 0 136537400 71,76%
Genmab A/S Heathcare, Pharmaceuticals &
Biotechnology CSE 96,85% 0 715677000 44,56%
GN Store Nord A/S Heathcare, Pharmaceuticals &
Biotechnology CSE 0,65% 0 7740457600 62,96%
H. Lundbeck A/S Heathcare, Pharmaceuticals &
Biotechnology CSE 19,00% 0 17882728400 59,36%
Neurosearch A/S Heathcare, Pharmaceuticals &
Biotechnology CSE 0,00% 0 87258600 57,68%
Novo Nordisk A/S Heathcare, Pharmaceuticals &
Biotechnology CSE 14,39% 0 76490606000 62,08%
Novozymes A/S Heathcare, Pharmaceuticals &
Biotechnology CSE 12,67% 0 12230926400 57,51%
Ossur Nordic A/S* Heathcare, Pharmaceuticals &
Biotechnology CSE n.a. 0 48475000 60,29%
Topotarget A/S Heathcare, Pharmaceuticals &
Biotechnology CSE 37,54% 0 79927000 79,27% Veloxis Pharmaceuticals A/S*
Heathcare, Pharmaceuticals & Biotechnology CSE n.a. 0 52900400 84,19%
William Demant Holding A/S
Heathcare, Pharmaceuticals & Biotechnology CSE 8,30% 0 8694195000 33,47%
Zealand Pharma A/S Heathcare, Pharmaceuticals &
Biotechnology CSE 46,04% 0 146169800 91,01%
4 SC AG* Heathcare, Pharmaceuticals &
Biotechnology FSE n.a. 1 n.a. n.a.
AAP Implantate AG Heathcare, Pharmaceuticals &
Biotechnology FSE 4,01% 1 324201200 70,02%
BB Biotech AG Heathcare, Pharmaceuticals &
Biotechnology FSE 0,00% 1 181100 91,82%
Biotest AG Heathcare, Pharmaceuticals &
Biotechnology FSE 11,04% 1 4168609400 47,29%
Carl Zeiss Meditec AG Heathcare, Pharmaceuticals &
Biotechnology FSE 10,54% 1 6607565200 68,47%
Curanum AG Heathcare, Pharmaceuticals &
Biotechnology FSE 0,00% 1 2565667000 22,93% Draegerwerk Verwaltungs AG*
Heathcare, Pharmaceuticals & Biotechnology FSE n.a. 1 76104750 37,81%
Eckert & Ziegler AG Heathcare, Pharmaceuticals &
Biotechnology FSE 2,69% 1 1059206800 46,84%
Epigenomics AG* Heathcare, Pharmaceuticals &
Biotechnology FSE n.a. 1 25653200 78,34%
Evotec AG Heathcare, Pharmaceuticals &
Biotechnology FSE 18,63% 1 594817800 72,32% Fresenius Medical Care & Co KGAA
Heathcare, Pharmaceuticals & Biotechnology FSE 0,81% 1 84340532800 42,18%
Geratherm Medical AG Heathcare, Pharmaceuticals &
Biotechnology FSE 1,53% 1 141789600 77,03%
Gerresheimer AG Heathcare, Pharmaceuticals &
Biotechnology FSE 0,35% 1 10406932000 33,08%
Mediclin AG Heathcare, Pharmaceuticals &
Biotechnology FSE 0,00% 1 4657013400 47,80%

45
Medigene AG Heathcare, Pharmaceuticals &
Biotechnology FSE 43,06% 1 325262800 78,31%
Merck KGAA Heathcare, Pharmaceuticals &
Biotechnology FSE 15,20% 1 87638821800 51,72%
Mologen AG Heathcare, Pharmaceuticals &
Biotechnology FSE 0,00% 1 4130200 88,86%
Morphosys AG Heathcare, Pharmaceuticals &
Biotechnology FSE 55,89% 1 717293000 85,58% Pulsion Medical Systems SE
Heathcare, Pharmaceuticals & Biotechnology FSE 8,67% 1 300537000 68,01%
Qiagen NV Heathcare, Pharmaceuticals &
Biotechnology FSE 10,89% 1 7569501600 62,47%
Rhoen-Klinikum* Heathcare, Pharmaceuticals &
Biotechnology FSE n.a. 1 n.a. n.a.
Sartorius AG Heathcare, Pharmaceuticals &
Biotechnology FSE 6,32% 1 6595222400 32,81%
Stada Arzneimittel AG Heathcare, Pharmaceuticals &
Biotechnology FSE 2,93% 1 16236433400 32,72%
Stratec Biomedical AG Heathcare, Pharmaceuticals &
Biotechnology FSE 5,21% 1 905162400 72,73%
Sygnis Pharma AG Heathcare, Pharmaceuticals &
Biotechnology FSE 66,02% 1 19976600 65,83%
UMS International AG Heathcare, Pharmaceuticals &
Biotechnology FSE 0,00% 1 365388400 48,44%
Vita 34 AG Heathcare, Pharmaceuticals &
Biotechnology FSE 1,50% 1 152879200 56,56%
Wilex AG Heathcare, Pharmaceuticals &
Biotechnology FSE 75,94% 1 86809600 14,18%
Biohit Oyj* Heathcare, Pharmaceuticals &
Biotechnology HSE n.a. 1 227353600 59,90%
Biotie Therapies Oyj* Heathcare, Pharmaceuticals &
Biotechnology HSE n.a. 1 48420400 24,88%
Oral Hammaslaakarit Oyj* Heathcare, Pharmaceuticals &
Biotechnology HSE n.a. 1 363959600 42,69%
Oriola-KD Oyj Heathcare, Pharmaceuticals &
Biotechnology HSE 0,00% 1 18506896000 25,32%
Orion Oyj Heathcare, Pharmaceuticals &
Biotechnology HSE 10,59% 1 8009086200 61,70%
Abcam Plc Heathcare, Pharmaceuticals &
Biotechnology LSE 5,08% 0 779339000 83,48% Alexander David Investments Plc
Heathcare, Pharmaceuticals & Biotechnology LSE 44,92% 0 330800 47,41%
Allergy Therapeutics Plc Heathcare, Pharmaceuticals &
Biotechnology LSE 16,19% 0 440754600 17,01%
Alliance Pharma Plc* Heathcare, Pharmaceuticals &
Biotechnology LSE n.a. 0 416413400 39,80%
Animal Caregroup Plc Heathcare, Pharmaceuticals &
Biotechnology LSE 1,03% 0 166926400 70,12%
Anpario Plc Heathcare, Pharmaceuticals &
Biotechnology LSE 0,46% 0 172225200 78,15% Aqua Bounty Technologies*
Heathcare, Pharmaceuticals & Biotechnology LSE n.a. 0 n.a. n.a.
Ardana Plc* Heathcare, Pharmaceuticals &
Biotechnology LSE n.a. 0 n.a. n.a. Ark Therapeutics Group Plc*
Heathcare, Pharmaceuticals & Biotechnology LSE n.a. 0 41588400 74,46%
AstraZeneca Plc Heathcare, Pharmaceuticals &
Biotechnology LSE 15,12% 0 2,27322E+11 40,27%
Benchmark Holdings Plc* Heathcare, Pharmaceuticals &
Biotechnology LSE n.a. 0 n.a. n.a. Beximo Pharmaceuticals Plc
Heathcare, Pharmaceuticals & Biotechnology LSE 0,27% 0 622930200 69,84%
BTG Plc Heathcare, Pharmaceuticals &
Biotechnology LSE 23,19% 0 1236976800 71,66% Cathay International Holdings Ltd
Heathcare, Pharmaceuticals & Biotechnology LSE 0,69% 0 611000400 35,27%

46
Cyprotex Plc Heathcare, Pharmaceuticals &
Biotechnology LSE 8,09% 0 69712000 71,85%
Dechra Pharmaceuticals Plc Heathcare, Pharmaceuticals &
Biotechnology LSE 1,14% 0 4194123000 38,31%
Eastpharma Ltd Heathcare, Pharmaceuticals &
Biotechnology LSE 1,09% 0 1684645000 62,09% Eco Animal Health Group Plc
Heathcare, Pharmaceuticals & Biotechnology LSE 0,06% 0 267311000 84,93%
Eden Research Plc Heathcare, Pharmaceuticals &
Biotechnology LSE 11,22% 0 1338800 58,48%
Epistem Holdings Plc Heathcare, Pharmaceuticals &
Biotechnology LSE 32,30% 0 52164000 73,24%
E-Therapeutics Plc* Heathcare, Pharmaceuticals &
Biotechnology LSE n.a. 0 531600 69,52%
Evocutis Plc* Heathcare, Pharmaceuticals &
Biotechnology LSE n.a. 0 2782000 78,60%
Futura Medical Plc* Heathcare, Pharmaceuticals &
Biotechnology LSE n.a. 0 1447800 88,59%
Genus Plc Heathcare, Pharmaceuticals &
Biotechnology LSE 7,82% 0 3365905400 45,34%
GlaxoSmithKline Plc Heathcare, Pharmaceuticals &
Biotechnology LSE 13,91% 0 2,99936E+11 20,06%
GW Pharmaceuticals Plc Heathcare, Pharmaceuticals &
Biotechnology LSE 77,48% 0 282183400 29,48%
Hikma Pharmaceuticals Plc Heathcare, Pharmaceuticals &
Biotechnology LSE 3,21% 0 5540137200 59,17% Hutchison China Medictec Ltd
Heathcare, Pharmaceuticals & Biotechnology LSE 4,22% 0 979920000 43,90%
Immupharma Plc Heathcare, Pharmaceuticals &
Biotechnology LSE 23,99% 0 72367400 83,18%
Ixico Plc* Heathcare, Pharmaceuticals &
Biotechnology LSE n.a. 0 11663400 81,77%
Medgenics Inc* Heathcare, Pharmaceuticals &
Biotechnology LSE n.a. 0 n.a. n.a.
Oxford Biometica Plc Heathcare, Pharmaceuticals &
Biotechnology LSE 95,15% 0 142444800 59,10% Oxford Pharma Science Group
Heathcare, Pharmaceuticals & Biotechnology LSE 63,60% 0 3026000 93,28%
Pfeizer Inc Heathcare, Pharmaceuticals &
Biotechnology LSE 14,36% 0 3,88202E+11 45,31%
Pharmstandard OJCS* Heathcare, Pharmaceuticals &
Biotechnology LSE n.a. 0 7292034000 70,15% Plethora Solutions Holdings Plc*
Heathcare, Pharmaceuticals & Biotechnology LSE 38,82% 0 46511400 n.a.
Port Erin Biopharma Investments Ltd*
Heathcare, Pharmaceuticals & Biotechnology LSE n.a. 0 n.a. n.a.
Proteome Sciences Plc Heathcare, Pharmaceuticals &
Biotechnology LSE 26,14% 0 30206800 -5,46%
Reneuron Group Plc* Heathcare, Pharmaceuticals &
Biotechnology LSE n.a. 0 1571600 80,46%
Renovo Group Plc Heathcare, Pharmaceuticals &
Biotechnology LSE 65,95% 0 98797000 74,03% Retroscreen Virology Group Plc
Heathcare, Pharmaceuticals & Biotechnology LSE 2,13% 0 96617000 47,29%
Sareum Holdings Plc* Heathcare, Pharmaceuticals &
Biotechnology LSE n.a. 0 9194500 83,28%
Scancell Holdings Plc Heathcare, Pharmaceuticals &
Biotechnology LSE 42,84% 0 8560750 94,56%
Shire Plc Heathcare, Pharmaceuticals &
Biotechnology LSE 20,34% 0 25636522400 44,38% Silence Therapeutics Group Plc*
Heathcare, Pharmaceuticals & Biotechnology LSE n.a. 0 15783200 92,00%
Sinclair IS Pharma Plc Heathcare, Pharmaceuticals &
Biotechnology LSE 1,96% 0 392622000 73,67%
Skyepharma Plc Heathcare, Pharmaceuticals &
Biotechnology LSE 31,93% 0 648148400 -91,61%

47
Source Bioscience Plc Heathcare, Pharmaceuticals &
Biotechnology LSE 1,52% 0 149999000 73,26%
Summit Corporation Plc* Heathcare, Pharmaceuticals &
Biotechnology LSE n.a. 0 17910400 66,49%
Synairgen Plc* Heathcare, Pharmaceuticals &
Biotechnology LSE n.a. 0 1575000 86,85%
Taihua Plc* Heathcare, Pharmaceuticals &
Biotechnology LSE n.a. 0 44443800 87,87%
Tissue Regenix Group Plc* Heathcare, Pharmaceuticals &
Biotechnology LSE n.a. 0 1145333,333 97,62%
Valirx Plc Heathcare, Pharmaceuticals &
Biotechnology LSE 53,42% 0 3286600 80,68%
Vectura Group Plc Heathcare, Pharmaceuticals &
Biotechnology LSE 92,68% 0 378099600 83,98%
Vernalis Plc Heathcare, Pharmaceuticals &
Biotechnology LSE 58,93% 0 252554200 56,89%
Verona Pharma Plc* Heathcare, Pharmaceuticals &
Biotechnology LSE n.a. 0 0 95,09%
Active Biotech AB Heathcare, Pharmaceuticals &
Biotechnology SSE 94,10% 1 107617000 43,16%
Aerocrine AB Heathcare, Pharmaceuticals &
Biotechnology SSE 58,55% 1 103773200 56,17%
Allenex AB* Heathcare, Pharmaceuticals &
Biotechnology SSE n.a. 1 88396400 64,82%
AstraZeneca AB Heathcare, Pharmaceuticals &
Biotechnology SSE 21,94% 1 59512000000 94,22%
Biogaia AB Heathcare, Pharmaceuticals &
Biotechnology SSE 10,62% 1 308985600 85,62%
Bioinvent International AB Heathcare, Pharmaceuticals &
Biotechnology SSE 80,51% 1 120903400 56,81%
Biotage AB Heathcare, Pharmaceuticals &
Biotechnology SSE 5,70% 1 429675000 83,81%
Boule Diagnostics AB Heathcare, Pharmaceuticals &
Biotechnology SSE 17,93% 1 123621000 72,56%
Cellavision AB Heathcare, Pharmaceuticals &
Biotechnology SSE 14,18% 1 133309200 64,79%
Dedicare AB Heathcare, Pharmaceuticals &
Biotechnology SSE 0,00% 1 428226666,7 40,61%
Elekta AB Heathcare, Pharmaceuticals &
Biotechnology SSE 6,25% 1 7222800000 34,85%
Elos AB Heathcare, Pharmaceuticals &
Biotechnology SSE 4,25% 1 427399200 38,87%
Feelgood Svenska AB Heathcare, Pharmaceuticals &
Biotechnology SSE 0,00% 1 612852200 30,92%
Getinge AB Heathcare, Pharmaceuticals &
Biotechnology SSE 2,12% 1 22132600000 34,90%
Global Health Partner AB Heathcare, Pharmaceuticals &
Biotechnology SSE 0,00% 1 588600000 57,74%
Karo Bio AB* Heathcare, Pharmaceuticals &
Biotechnology SSE n.a. 1 10018400 75,56% Karolinska Development AB*
Heathcare, Pharmaceuticals & Biotechnology SSE n.a. 1 26652800 95,62%
Meda AB Heathcare, Pharmaceuticals &
Biotechnology SSE 5,08% 1 12340000000 40,01%
Medivir AB Heathcare, Pharmaceuticals &
Biotechnology SSE 15,44% 1 295209400 79,63%
Moberg Pharma AB Heathcare, Pharmaceuticals &
Biotechnology SSE 35,73% 1 61618666,67 50,70% Neurovive Pharmaceutical AB*
Heathcare, Pharmaceuticals & Biotechnology SSE n.a. 1 3461000 91,64%
Oasmia Pharmaceutical AB Heathcare, Pharmaceuticals &
Biotechnology SSE 41,42% 1 36584200 77,14%
Orexo AB Heathcare, Pharmaceuticals &
Biotechnology SSE 81,96% 1 249336800 65,60%

48
Ortivus AB Heathcare, Pharmaceuticals &
Biotechnology SSE 35,46% 1 70047800 61,20%
Probi AB Heathcare, Pharmaceuticals &
Biotechnology SSE 20,40% 1 82424000 91,43%
Raysearch Laboratories AB Heathcare, Pharmaceuticals &
Biotechnology SSE 20,33% 1 114479000 77,15%
Recipharm AB* Heathcare, Pharmaceuticals &
Biotechnology SSE n.a. 1 1971122200 34,39%
Sectra AB Heathcare, Pharmaceuticals &
Biotechnology SSE 3,55% 1 837706400 61,79% Swedish Orphan Biovitrum AB
Heathcare, Pharmaceuticals & Biotechnology SSE 30,52% 1 1742459400 62,03%
Vitrolife AB Heathcare, Pharmaceuticals &
Biotechnology SSE 12,30% 1 314624800 76,33% Econocom SA Technology BSE 0,00% 0 10438925000 16,95% Global Graphics SA Technology BSE 51,56% 0 93595200 87,91% IBM Certificate* Technology BSE n.a. 0 n.a. n.a. Keyware Technologies NV Technology BSE 0,00% 0 61183800 55,34% Melexis NV Technology BSE 14,55% 0 1896486000 51,40% Option NV Technology BSE 28,06% 0 1148691800 29,20% Realdolmen NV Technology BSE 0,00% 0 2354926800 52,05% Rentabiliweb Belgique* Technology BSE n.a. 0 372167800 25,81% Transics International NV Technology BSE 3,21% 0 414889600 66,41% Zenitel NV Technology BSE 2,73% 0 636988000 12,71% Zetes Industries Technology BSE 0,86% 0 1879074800 50,18% Cbrain A/S Technology CSE 0,00% 0 42136400 83,84% Columbus A/S Technology CSE 0,00% 0 1133502600 50,19% Comendo A/S Technology CSE 0,00% 0 134326000 58,70% RTX A/S Technology CSE 20,08% 0 274043000 67,56% Simcorp A/S Technology CSE 22,59% 0 1790152600 67,30% Topsil Semiconductor Materials A/S Technology CSE 0,00% 0 465622400 53,58% Adva Optical Networking SE Technology FSE 16,19% 1 2656791400 51,45% Aixtron SE Technology FSE 13,28% 1 4147599200 75,49% Data Modul AG Technology FSE 1,83% 1 1195293400 52,65% Dialog Semiconductor GMBH Technology FSE 21,16% 1 2430561800 29,41% Electronics Line 3000 Ltd Technology FSE 8,11% 1 182265600 22,19% Elmos Semiconductor AG Technology FSE 17,70% 1 1662283200 69,27%
Euromicron AG Technology FSE 0,00% 1 2241173400 43,37% Exceet Group SE Technology FSE 1,47% 1 1071973250 30,26% First Sensor AG Technology FSE 8,37% 1 555175800 48,68% Fortec Elektronik AG Technology FSE 0,00% 1 419747400 80,03% Gigaset AG Technology FSE 3,20% 1 23316583200 16,64% Hoeft & Wessel AG Technology FSE 5,20% 1 877943800 22,99% Infineon Technologies AG Technology FSE 13,44% 1 34918494400 48,91% INIT (Innovation in Traffic Systems) AG Technology FSE 2,95% 1 737300000 53,43%
Intica Systems AG Technology FSE 2,26% 1 301714400 53,74% Kontron AG Technology FSE 7,69% 1 4976095200 65,89% OHB AG Technology FSE 3,99% 1 3993442000 20,50%
Paragon AG Technology FSE 4,89% 1 705711000 16,72% QSC AG Technology FSE 0,02% 1 4211914800 49,87% S&T AG Technology FSE 0,00% 1 3953613000 10,46%

49
Suess Micro Tec AG* Technology FSE n.a. 1 n.a. n.a. Vtion Wireless Technology AG Technology FSE 0,51% 1 737882000 87,94% Affecto Oyj* Technology HSE n.a. 1 1158423400 41,14% Basware Oyj Technology HSE 12,85% 1 951168800 71,38% Comptel Oyj* Technology HSE n.a. 1 792510400 56,04% Digia Oyj Technology HSE 2,84% 1 1142714800 49,56% Elektrobit Oyj* Technology HSE n.a. 1 1616658000 59,77% F-Secure Oyj Technology HSE 23,73% 1 1280964800 46,78% Innofactor* Technology HSE n.a. 1 99720000 1,86% Ixonos Oyj* Technology HSE n.a. 1 697746600 41,02% Nokia Oyj Technology HSE 12,03% 1 3,94541E+11 34,72% Okmetic Oyj* Technology HSE n.a. 1 699411000 73,46% QPR Software Oyj Technology HSE 0,00% 1 72546000 40,35% Soltec Oyj Technology HSE 3,40% 1 290330400 38,55% Soprano Oyj* Technology HSE n.a. 1 41109000 57,75% SSH Communications Security Oyj* Technology HSE n.a. 1 88454800 45,70% Trainers' House Oyj* Technology HSE n.a. 1 235218600 62,68% Tecnotree Oyj* Technology HSE n.a. 1 624205400 58,59% Teleste Oyj* Technology HSE n.a. 1 1524275800 47,88% Tieto Oyj Technology HSE 2,59% 1 17133065600 43,53% Acer Inc Technology LSE 0,27% 0 1,21271E+11 32,52% Amine Technologies Plc Technology LSE 13,29% 0 433157400 68,11% ARM Holdings Plc Technology LSE 30,69% 0 4469519200 84,23% BATM Advanced Communications Ltd Technology LSE 9,66% 0 880593200 72,30% Bede Plc* Technology LSE n.a. 0 n.a. n.a. Belgravium Technologies Plc Technology LSE 3,25% 0 96848400 70,31% Chimei Innolux Corp* Technology LSE n.a. 0 n.a. n.a. CML Microsystems Plc Technology LSE 2,59% 0 226388600 57,00% Compal Electronics Inc Technology LSE 1,43% 0 1,56075E+11 35,09% Concurrent Technologies Plc Technology LSE 10,79% 0 140588400 79,70% CSR Plc Technology LSE 25,84% 0 5659323400 78,23% Cyan Holdings Plc* Technology LSE n.a. 0 2449200 89,22% Filtronic Plc Technology LSE 13,73% 0 328746400 73,26% Himachal Futuristic Communications Ltd Technology LSE 0,00% 0 578681400 -6,00% Hon Hai Precision Industry Ltd Technology LSE 1,24% 0 6,50723E+11 36,80% Imagination Technologies Group Plc Technology LSE 46,62% 0 950248200 82,28% IQE Plc Technology LSE 0,34% 0 752662600 55,43% Laird Plc Technology LSE 6,54% 0 6175953800 57,19% Lite-On Technology Corporation Technology LSE 2,20% 0 50521839600 34,84% MTI Wireless Edge Ltd Technology LSE 8,45% 0 102007800 79,76% Nanoco Group Plc Technology LSE 64,65% 0 23216400 87,98% Northamber Plc* Technology LSE n.a. 0 1547411000 60,19% Pace Plc Technology LSE 6,68% 0 13387579000 30,76% PeerTV Plc Technology LSE 31,87% 0 25218200 -23,22% Plasmon Plc* Technology LSE n.a. 0 n.a. n.a.

50
Promethean World Plc Technology LSE 3,29% 0 2151988000 78,44%
Pure Wafer Plc* Technology LSE n.a. 0 222664200 50,22% Quixant Plc* Technology LSE n.a. 0 79536333,33 37,93%
Samsung Electronic Co Ltd Technology LSE 4,75% 0 9,44889E+11 60,48% Seeing Machines Ltd Technology LSE 19,35% 0 37663200 60,27%
Sepura Plc Technology LSE 4,32% 0 810751200 56,21% Software Radio Technology Plc Technology LSE 9,53% 0 65357200 77,17% Spirent Communications Plc Technology LSE 17,00% 0 3241722400 72,74% Sunplus Technology Co Ltd Technology LSE 27,84% 0 2986416000 64,38%
Tatung Co Ltd Technology LSE 4,01% 0 33597454600 13,76% Telefonaktiebolaget LM Ericsson Technology LSE 15,17% 0 2,16231E+11 50,69%
Telit Communications Plc Technology LSE 11,58% 0 951418600 33,43%
Toumaz Ltd Technology LSE 70,66% 0 43875000 91,32%
TRAK8 Holdings Plc Technology LSE 0,07% 0 48185200 55,97% UK Oil and Gas Investments Plc Technology LSE 48,87% 0 28041600 63,60%
Vislink Plc Technology LSE 9,42% 0 754505400 69,01% Wolfson Microelectronics Plc Technology LSE 28,94% 0 1145950600 81,02% Acando AB* Technology SSE n.a. 1 1519497200 68,56% Addnode Group AB Technology SSE 0,87% 1 1151983800 62,30%
Anoto Group AB Technology SSE 31,48% 1 214893200 74,63%
Aspiro AB* Technology SSE n.a. 1 327653200 62,99% Avega Group AB* Technology SSE n.a. 1 283660000 31,90%
Axis AB Technology SSE 13,60% 1 2993920000 49,51% Connecta AB Technology SSE 0,00% 1 783666200 45,71%
Cybercom Group AB Technology SSE 0,00% 1 1576382400 56,08%
Doro AB* Technology SSE n.a. 1 614160000 33,01%
Enea AB Technology SSE 14,39% 1 734490000 75,33% Ericsson AB Technology SSE 28,89% 1 1,1076E+11 58,70%
Formpipe Software AB* Technology SSE n.a. 1 130660800 57,21% HIQ International AB Technology SSE 0,00% 1 1204495200 70,67% HMS Networks AB Technology SSE 9,08% 1 338898400 71,35% I.A.R. Systems AB* Technology SSE n.a. 1 125292600 49,83% Industrial and Financial Systems AB Technology SSE 3,33% 1 2605600000 50,71%
Knowit AB Technology SSE 0,00% 1 1650196600 47,32%
Micro Systemation AB* Technology SSE n.a. 1 107049400 63,58%
MSC Konsult AB* Technology SSE n.a. 1 41482200 55,86%
Multiq International AB Technology SSE 4,58% 1 117948000 59,70%
Net Insight AB Technology SSE 8,42% 1 274688200 83,40%
Novotek AB* Technology SSE n.a. 1 231622800 53,98% Phonera AB (Availo)* Technology SSE n.a. 1 360337600 43,88%
Prevas AB Technology SSE 0,00% 1 581819400 51,34%
Proact It Group AB Technology SSE 0,00% 1 1669780400 19,56%
Readsoft AB Technology SSE 14,38% 1 653229400 44,31%
Seamless Distribution AB* Technology SSE n.a. 1 134305000 76,57%
Softronic AB* Technology SSE n.a. 1 451124000 68,06%

51
Stockwik Forvaltning AB* Technology SSE n.a. 1 170026800 62,54%
Tieto Oyj*6 Technology SSE 2,59% 1 17133065000 43,53%
Transmode AB Technology SSE 12,30% 1 877491000 72,91%
Vitec Software Group AB Technology SSE 0,00% 1 277619000 35,39%
Belgacom SA Telecommunications BSE 0,00% 0 49531182842 34,66%
Mobistar SA/NV Telecommunications BSE 0,00% 0 15711932200 32,82%
TDC A/S Telecommunications CSE 0,27% 0 40342967200 29,42%
3U Holding AG Telecommunications FSE 0,63% 1 891260200 62,79%
Drillisch AG Telecommunications FSE 0,00% 1 3347820800 36,39% DT Telekom AG* Telecommunications FSE n.a. 1 796000 4,31%
Ecotel Communication AG Telecommunications FSE 0,05% 1 928456800 40,49%
Freenet AG Telecommunications FSE 0,00% 1 31783178800 39,69% Telefonica Deutschland Holding AG Telecommunications FSE 0,00% 1 44738407000 70,88%
Telegate AG Telecommunications FSE 0,00% 1 1431806200 58,38% YOC AG Telecommunications FSE 2,76% 1 281806400 36,70%
Elisa Oyj Telecommunications HSE 0,39% 1 14217293000 42,99% TeliaSonera Finland Oyj* Telecommunications HSE n.a. 1 14959543400 92,40%
2 Ergo Group Telecommunications LSE 1,33% 0 235500200 67,57% Adept Telecom Plc* Telecommunications LSE n.a. 0 259506400 41,31% Alternative Networks* Telecommunications LSE n.a. 0 1132056400 50,93% Armstrong Ventures Plc Telecommunications LSE 39,67% 0 6421250 50,29% Avanti Communications Group Telecommunications LSE 0,14% 0 103498600 54,23% BT Group Plc Telecommunications LSE 3,62% 0 2,16182E+11 0,76% Cable and Wireless Communications Plc Telecommunications LSE 0,00% 0 16837076600 9,64% Cityfibre Infrastructures Holdings Plc* Telecommunications LSE n.a. 0 17531000 25,68%
Colt Group SA* Telecommunications LSE n.a. 0 15317637400 66,37% Daisy Group Plc Telecommunications LSE 0,00% 0 2315796200 52,84% Global Telecom Holding SAE* Telecommunications LSE n.a. 0 30036843200 17,62% Hellenic Telecommunications Organization SA* Telecommunications LSE n.a. 0 53140122800 19,54%
Hrvatski Telekom DD* Telecommunications LSE n.a. 0 231298800 77,39%
Inmarsat Plc Telecommunications LSE 0,60% 0 8287388800 32,31%
Kcell JSC* Telecommunications LSE n.a. 0 n.a. n.a. Kcom Group Plc Telecommunications LSE 0,00% 0 4372527400 17,14%
Koninklijke KPN NV Telecommunications LSE 0,46% 0 1,27691E+11 14,05%
KT Corporation Telecommunications LSE 1,09% 0 1,27972E+11 36,54%
Messaging International Plc Telecommunications LSE 18,49% 0 30863200 83,01%
Mobile Streams Plc* Telecommunications LSE n.a. 0 139466400 28,92% Mobile Tornado Group Plc* Telecommunications LSE 42,03% 0 16805000 n.a. Monitise Plc Telecommunications LSE 50,88% 0 131351800 67,70% Nippon Telegraph and Telephone Corporation Telecommunications LSE 2,60% 0 8,05567E+11 40,54%
6Tieto Oyj is listed on both HSE and SSE. The company is excluded from SSE and counted to HSE, since it is mainly listed on HSE.

52
NTT Docomo Inc Telecommunications LSE 2,49% 0 3,34994E+11 70,98% OJSC Megafon Telecommunications LSE 0,00% 0 50146398000 63,49% Oordeoo QSC* Telecommunications LSE n.a. 0 52936293200 20,94%
Orange Polska SA Telecommunications LSE 0,38% 0 38058432600 53,34% Sistema JFSC* Telecommunications LSE n.a. 0 1,85125E+11 20,34% SK Telecom Co Ltd Telecommunications LSE 1,72% 0 92095287000 47,93% Syqic Plc* Telecommunications LSE n.a. 0 n.a. n.a. Talk Talk Telecom Group Plc Telecommunications LSE 0,00% 0 17391461200 35,27% Telecom Egypt SAE* Telecommunications LSE n.a. 0 n.a. n.a. Telecom Plus Plc Telecommunications LSE 0,00% 0 4500115000 42,26% Telefonica Czech Republic AS* Telecommunications LSE n.a. 0 21098128000 77,61% Telefonica SA Telecommunications LSE 1,34% 0 5,92008E+11 18,84% Telekomunikasi Indonesia PT (Persero)* Telecommunications LSE n.a. 0 560794800 50,96% Tricor Plc* Telecommunications LSE n.a. 0 3941000 -27,64% Verizon Communications Inc* Telecommunications LSE n.a. 0 7,51971E+11 17,34% Vodafone Group Plc Telecommunications LSE 0,65% 0 4,87945E+11 55,42% Zamano Plc Telecommunications LSE 4,85% 0 229509000 36,49% Alltele Allmanna Svenska Telefon AB Telecommunications SSE 0,00% 1 429462400 32,52% DGC One AB Telecommunications SSE 0,00% 1 320246200 51,69% Millicom International Cellular SA Telecommunications SSE 0,00% 1 27574360400 32,21%
Tele2 AB Telecommunications SSE 0,00% 1 40909400000 57,85%
TeliaSonera AB Telecommunications SSE 0,70% 1 1,06847E+11 47,71%

53
Appendix 4: Test for Heteroscedasticity
This thesis conducts a graphic scatterplot, a Breusch-Pagan/Cook-Weisberg test and a White’s general test (obtained together with Cameron and Trivedi’s decomposition of the IM-test) to test for homoscedasticity. As the graphic scatterplot and the Breusch-Pagan/Cook-Weisberg test observe the presence of heteroscedasticity, this thesis applies a robust multiple regression analysis with robust standard errors (see method and data 3.5.3.3. for more information).
4.1. Graphic Scatterplot
The graphic scatterplot below shows possible plots of the residuals (error terms, εi) against the independent variables. An observed pattern indicates that the error variances are non-constant (i.e. not homogenous) (Newbold, Carlson & Thorne, 2010). Therefore, the pattern observed in the scatterplot below indicates the presence of heteroscedasticity.
Graphic Scatterplot
The graphic scatterplot plots the residuals (error terms) against the fitted (predicted) values.
4.2. Breusch-Pagan/Cook-Weisberg Test
As stated in the table below, the null hypothesis in the Breusch-Pagan/Cook-Weisberg test assumes a constant variance of the residuals. If the chi-square value shows a large number at a significant level, the null hypothesis is rejected (Newbold, Carlson & Thorne, 2010). The result stated below leads to rejection of the null hypothesis, and thus, indicates a presence of linear heteroscedasticity. Breusch-Pagan / Cook-Weisberg Test for Heteroscedasticity
H: Constant Variance Variables: fitted values of RND chi2(1) = 18.29 Prob > chi2 = 0.0000
The Breusch-Pagan/Cook-Weisberg test tests the null hypothesis that the variance of the residuals is constant (homogenous). Chi2(1) denotes the chi-square value and Prob>chi2 denotes the p-value. A high number of chi-square obtained with a low p-value leads to rejection of the null hypothesis.
-.20
.2.4
.6.8
Res
idua
ls
-.1 0 .1 .2 .3Fitted values

54
4.3. White’s General Test
White’s general test, obtained together with Cameron and Trivedi’s decomposition of the IM-test, tests the hypothesis that there is a presence of homoscedasticity. A high chi-square value obtained together with a very low p-value leads to rejection of the null hypothesis (Newbold, Carlson & Thorne, 2010). White’s general test serves as a complement to the Breusch/Pagan-Cook/Weisberg test as it can detect non-linear forms of heteroscedasticity. Also, it is not sensitive to the OLS-assumption of normality of the residuals (White, 1980). The result obtained below shows a high value of chi-square, but the p-value is not low enough to lead to rejection of the null hypothesis. Hence, it cannot be established that the data set suffers from non-linear heteroscedasticity. The result of Cameron and Trivedi’s decomposition of the IM-test shows that the sample is highly positively skewed and it also shows a high positive kurtosis. Consequently, this test rejects the hypotheses that the residuals are symmetrically and normally distributed (Chen et al. 2003).
White's General Test
H0: Homoscedasticity Ha: Unrestricted Heteroscedasticity
chi2(8) = 14.49 Prob>chi2 = 0.0698
Cameron and Trivedi's Decomposition of the IM-Test
Source
chi2 df p Heteroscedasticity 14.49 8 0.0698
Skewness
26.08 3 0.0000
Kurtosis
12.94 1 0.0003
Total 53.51 12 0.0000
White’s general test tests the hypothesis that the variance of the residuals is constant (homoscedasticity is present). Cameron and Trivedi’s decomposition of the IM-test additionally tests the hypothesis that the error terms are symmetric and the hypothesis that the error terms are normally distributed. Chi2(1) denotes the chi-square value and Prob>chi2 denotes the p-value. A high number of chi-square obtained with a low p-value leads to rejection of the null hypothesis.

55
Appendix 5: Test for Linearity
To detect for non-linearity, this thesis observes a graphic scatterplot matrix as well as Kernel density estimates.
Graphic Scatterplot Matrix
The graphic scatterplot matrix plots the observations for each independent variable against the dependent variable RND for the sample period 2008-2012. RND is defined as R&D investments divided by the operating revenue. FREQ is a dummy and stands for the regulated reporting frequency, where a required semi-annual reporting is denoted 0 and a mandated quarterly reporting is denoted 1. SIZE is defined in terms of operating revenues. SOLV is defined as total equity divided by the book value of total assets. The sample constitutes of all firms listed on BSE, CSE, FSE (the prime standard segment), HSE, LSE and SSE within the sectors: automobile and parts, chemicals, healthcare (including pharmaceuticals and biotechnology), technology and telecommunications (see appendix 2 for stock exchange information and appendix 3 for list of sample firms). As can be seen in the graphic scatterplot matrix, the regression line between FREQ and RND is non-linear. However, this is merely a consequence of FREQ being a dummy variable that only can take on the value of 0 or 1. A non-linear relation can also be detected between RND and SIZE whereas a relatively linear relation can be detected between RND and SOLV. This is further revealed by the Kernel density estimates below (see Chen et al. 2003). The large deviation at the left tail for the size curve is presumably a consequence of the large numbers of revenues.
The Kernel density estimate plots the actual density lines of SIZE and SOLV against the normal density line to detect for deviations. A large deviation between the two indicates that the curve is highly skewed.
RND
FREQ
SIZE
SOLV
0.00 0.50 1.00
0
.5
1
0 .5 1
0
5.000e+11
1.000e+12
1.500e+12
0 5.000e+111.000e+121.500e+12-1.00
0.00
1.00
0
2.00
0e-1
14.00
0e-1
16.00
0e-1
18.00
0e-1
1D
ensi
ty
0 5.000e+11 1.000e+12 1.500e+12SIZE
Kernel density estimateNormal density
kernel = epanechnikov, bandwidth = 1.5e+09
Kernel density estimate
0.5
11.
52
Den
sity
-1 -.5 0 .5 1SOLV
Kernel density estimateNormal density
kernel = epanechnikov, bandwidth = 0.0660
Kernel density estimate

56
Appendix 6: Test for Omitted Variables
The link test and the ovtest stated below tests the assumption that the regression equation is free from model specification errors, such as omitted variables.
6.1. Link Test
The link test presented below shows a P>|t| value of 0.00 for _hatsq, indicating that the regression equation suffers from model specification errors (Chen et al. 2003). More explicitly, this indicates that there most likely are variables omitted from the regression equation that would also have a significant influence on R&D investments, and not only by coincidence. Link Test
Number of Observations = 320
Source SS df MS
F(2, 317) =
21.77
Model 1.60404527 2 0.0802022637
Prob > F =
0.0000
Residual 11.6775599 317 0.036837728
R-squared =
0.1208
Total 13.2816052 319 0.041635126
Adj. R-squared = 0.1152
Root MSE =
0.19193
RND Coefficient Standard Error t P>|t| [95 % Confidence Interval]
_hat -0.7705367 0.4930489 -1.56 0.119 -1.740598 0.199525 _hatsq 7.904811 2.036058 3.88 0.000 3.898917 11.9107
_cons 0.0717384 0.0318112 2.26 0.025 0.0091507 0.1343262
The Link Test tests the hypothesis that the regression model is correctly specified. The link test creates two new variables; the prediction variable _ hat and the squared predicted value _hatsq. A value of P>|t| below 0.05 for _hatsq leads to rejection of the hypothesis.
6.2. Ovtest
The ovtest presented below supports the findings obtained from the link test by rejecting the hypothesis that there are no omitted variables in the regression equation (see Chen et al. 2003). Thus, indicating that there are in fact omitted variables (i.e. not included in the regression equation) that would have a significant influence on R&D investments. Ovtest
Ramsey RESET test using powers of the fitted values of RND
H0: model has no omitted variables
F(3, 313) = 6.05 Prob > F = 0.0005
The Ovtest tests the null hypothesis that the regression model has no omitted variables. F denotes the f-value and Prob>F denotes the p-value. A high number of F obtained together with a low p-value leads to rejection of the null hypothesis.

57
Appendix 7: Sector Individual Regression Statistics Table (a), (b), (c), (d) and (e) below present the number of observations, OLS estimates and robust standard errors for each individual sector for the sample period 2008-2012. The coefficients capture the effect of each independent variable on RND. The constants show the value of RND when FREQ, SIZE and SOLV equal 0. RND is defined as R&D investments divided by the operating revenue. FREQ is a dummy and stands for the regulated reporting frequency, where a required semi-annual reporting is denoted 0 and a mandated quarterly reporting is denoted 1. SIZE is measured in terms of operating revenues. SOLV is defined as total equity divided by the book value of total assets. The adjusted R2 denotes the explanatory power of the regression model. The sample constitutes of all firms listed on BSE, CSE, FSE (the prime standard segment), HSE, LSE and SSE within each examined sector (see appendix 2 for stock exchange information and appendix 3 for list of sample firms). Significant results are marked with asterisks, as follows: * p < 0.05, ** p < 0.01, *** p < 0.001. Table (a) Robust Multiple Regression Statistics, Automobile & Parts Variable Coefficient Robust Standard Error t-value
Constant 0.0293952 0.04266 0.69 FREQ -0.1718363 0.0987528 -1.74 SIZE -1.92E-15 5.06E-14 -0.04 SOLV 0.4214834 0.2270692 1.86 Adjusted R
0.3026
Number of Observations
28
Table (b) Robust Multiple Regression Statistics, Chemicals Variable Coefficient Robust Standard Error t-value
Constant 0.0393841 0.0709096 0.56 FREQ -0.0322497 0.0259722 -1.24 SIZE -1.18E-14 5.66E-14 -0.21 SOLV 0.0411537 0.1394578 0.30 Adjusted R
-0.0425
Number of Observations
49
Table (c) Robust Multiple Regression Statistics, Healthcare (Pharmaceuticals & Biotechnology) Variable Coefficient Robust Standard Error t-value
Constant 0.2153826 0.0605953 3.55*** FREQ -0.0605751 0.0510788 -1.19 SIZE -4.58E-13 1.89E-13 -2.43* SOLV 0.0658068 0.0881768 0.75 Adjusted R
-0.0033
Number of Observations
110

58
Table (d) Robust Multiple Regression Statistics, Technology Variable Coefficient Robust Standard Error t-value
Constant 0.0286151 0.0494516 0.58 FREQ -0.0567527 0.026635 -2.13* SIZE -8.15E-14 5.28E-14 -1.54 SOLV 0.2035868 0.0877411 2.32* Adjusted R
0.1411
Number of Observations
95
Table (e) Robust Multiple Regression Statistics, Telecommunications Variable Coefficient Robust Standard Error t-value
Constant -0.0145567 0.0263535 -0.55 FREQ -0.0660825 0.0345981 -1.91 SIZE -8.06E-14 6.70E-14 -1.20 SOLV 0.1828267 0.1023445 1.79 Adjusted R
0.0996
Number of Observations
38

59
Stockholm University
SE-106 91 Stockholm
Tel: 08 – 16 20 00
www.sbs.su.se