activated carbon from the graphite with increased rate
TRANSCRIPT

University of WollongongResearch Online
Australian Institute for Innovative Materials - Papers Australian Institute for Innovative Materials
2017
Activated carbon from the graphite with increasedrate capability for the potassium ion batteryZhixin TaiUniversity of Wollongong, [email protected]
Qing ZhangUniversity of Wollongong, [email protected]
Yajie LiuUniversity of Wollongong, [email protected]
Hua-Kun LiuUniversity of Wollongong, [email protected]
Shi Xue DouUniversity of Wollongong, [email protected]
Research Online is the open access institutional repository for the University of Wollongong. For further information contact the UOW Library:[email protected]
Publication DetailsTai, Z., Zhang, Q., Liu, Y., Liu, H. & Dou, S. (2017). Activated carbon from the graphite with increased rate capability for thepotassium ion battery. Carbon, 123 54-61.

Activated carbon from the graphite with increased rate capability for thepotassium ion battery
AbstractActivated carbon has been synthesized by a high-temperature annealing route using graphite as carbon sourceand potassium hydroxide as the etching agent. Many nanosized carbon sheets formed on the particles couldbe of benefit for rapid intercalation/de-intercalation of potassium ions. Moreover, the d-spacing in the (100)crystal planes of the as-prepared active carbon is enlarged to 0.335 nm, even some formed carbon nanosheetscan reach 0.358 nm, and the diffusion coefficient of K ion is also improved by 7 times as well. The as-preparedactivated carbon electrode can deliver a high reversible capacity of 100 mAh g ¿1 after 100 cycles (at a highcurrent density of 0.2 A g ¿1 ), and exhibits increased rate performance. The results demonstrate that the as-prepared active carbon is a promising anode material for the potassium ion battery, with high capacity,excellent rate performance, and great cycling stability.
DisciplinesEngineering | Physical Sciences and Mathematics
Publication DetailsTai, Z., Zhang, Q., Liu, Y., Liu, H. & Dou, S. (2017). Activated carbon from the graphite with increased ratecapability for the potassium ion battery. Carbon, 123 54-61.
This journal article is available at Research Online: http://ro.uow.edu.au/aiimpapers/2660

1
Activated carbon from the graphite with increased rate
capability for the potassium ion battery
Zhixin Tai,1 Qing Zhang,1 Yajie Liu, Huakun Liu1 and Shixue Dou
Institute for Superconducting and Electronic Materials, Australian Institute for Innovative Materials, University of
Wollongong, Innovation Campus, North Wollongong, New South Wales 2500, Australia
1 These authors contributed equally to this work.
Abstract
Activated carbon has been synthesized by a high-temperature annealing route using
graphite as carbon source and potassium hydroxide as the etching agent. Many
nanosized carbon sheets formed on the particles could be of benefit for rapid
intercalation/de-intercalation of potassium ions. Moreover, the d-spacing in the (100)
crystal planes of the as-prepared active carbon is enlarged to 0.335 nm, even some
formed carbon nanosheets can reach 0.358 nm, and the diffusion coefficient of K ion
is also improved by 7 times as well. The as-prepared activated carbon electrode can
deliver a high reversible capacity of 100 mAh g-1 after 100 cycles (at a high current
density of 0.2 A g-1), and exhibits increased rate performance. The results demonstrate
that the as-prepared active carbon is a promising anode material for the potassium ion
battery, with high capacity, excellent rate performance, and great cycling stability.
1 *Corresponding author. Institute for Superconducting and Electronic Materials, Australian
Institute for Innovative Materials, University of Wollongong, Innovation Campus,North
Wollongong, New South Wales 2500, Australia. Tel:+61242214547 E-mail: [email protected]

2
1. Introduction
The great challenge of electrochemical energy storage (EES) for not only electric
vehicles, but also portable electronic devices (e.g., mobile phones, laptop computers)
has driven researchers to endlessly look for more promising candidates for new
energy storage systems. Among them, the alkali metals, particularly lithium (Li), have
been brought into industrial utilization, and graphite has also been developed as the
standard anode for the Li+ battery due to its high reversible capacity, flat voltage, and
low cost. Concerns about future shortages of lithium resources have shifted primary
attention to the more abundant resources, such as sodium (Na) and potassium (K). As
reported, graphite anode exhibits a higher theoretical capacity (~ 270 mAh g-1) in
potassium ion batteries (KIBs) than in sodium ion batteries (NIBs) (~ 35 mAh g-1),
indicating the KIBs may be a better candidate than SIBs for commercial graphite
anode.[1]. Meanwhile, the potassium ion battery has attracted more and more
attention recently due to the wide distribution of potassium and the higher redox
potential of K/K+ (-2.92 V vs. standard hydrogen electrode (SHE)) compared to that
of Na/Na+ (-2.71 V vs. SHE), which makes the potassium ion battery a potential
alternative to lithium ion batteries.
Recently, several carbon-based materials have been introduced as anode electrodes for
KIBs. After demonstrating a three-stage process for K+ intercalation into graphite (C
→KC24→KC16→KC8), Ji and his co-workers found out that the high rate performance
of graphite anode is suboptimal in a nonaqueous electrolyte, so they proposed a soft
carbon as a high rate anode material in KIBs with a theoretical capacity of 273 mAh
g-1 [2]. And potassium shuttlecock mechanism between two insertion materials as
potassium ions battery is advantageous for higher-voltage/-power rechargeable
batteries due to the lowest potential and weakest solvation among Li+, Na+, K+, Mg2+,
and Ca2+ ion carriers.[3] Furthermore, Ji et al. also reported hard carbon microspheres
(HCS) that showed a high initial capacity of 262 mAh g-1, with 83% capacity
retention over 100 cycles in KIBs. HCS presented a much better high rate
performance in KIBs, compared to their behavior in NIBs, which can be ascribed to a
higher diffusion coefficient of K-ions in the particular structure compared to Na-ions
3
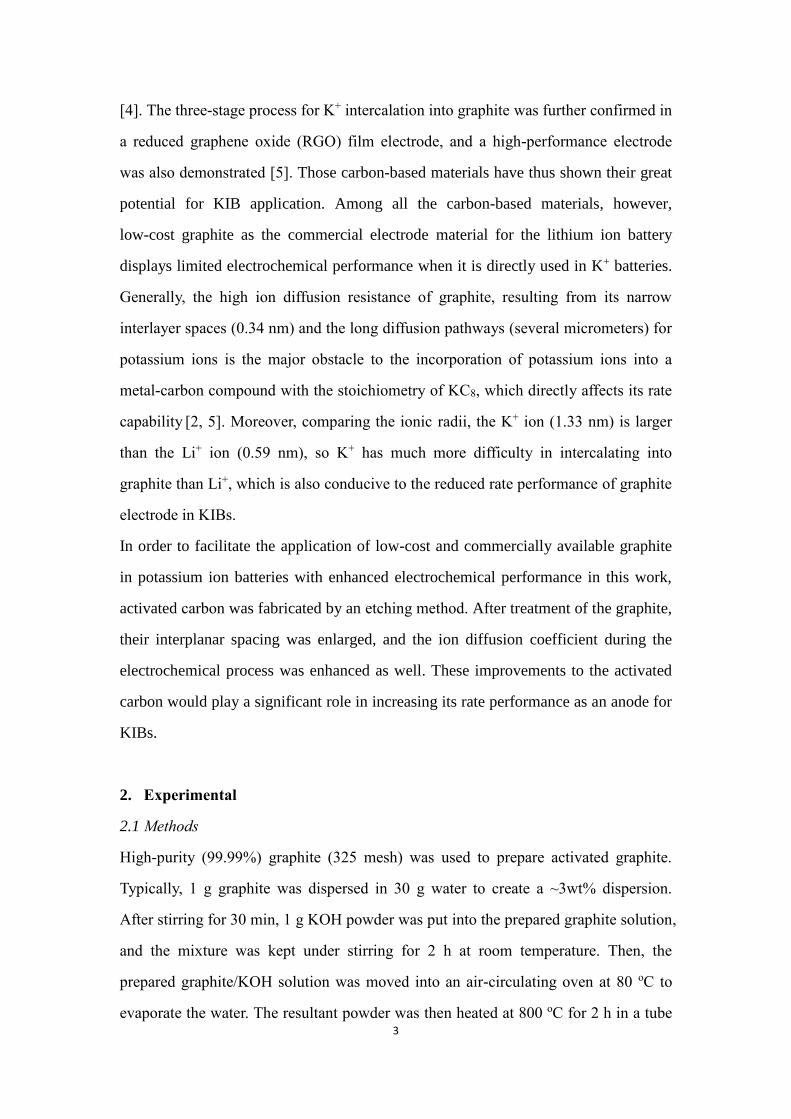
[4]. The three-stage process for K+ intercalation into graphite was further confirmed in
a reduced graphene oxide (RGO) film electrode, and a high-performance electrode
was also demonstrated [5]. Those carbon-based materials have thus shown their great
potential for KIB application. Among all the carbon-based materials, however,
low-cost graphite as the commercial electrode material for the lithium ion battery
displays limited electrochemical performance when it is directly used in K+ batteries.
Generally, the high ion diffusion resistance of graphite, resulting from its narrow
interlayer spaces (0.34 nm) and the long diffusion pathways (several micrometers) for
potassium ions is the major obstacle to the incorporation of potassium ions into a
metal-carbon compound with the stoichiometry of KC8, which directly affects its rate
capability [2, 5]. Moreover, comparing the ionic radii, the K+ ion (1.33 nm) is larger
than the Li+ ion (0.59 nm), so K+ has much more difficulty in intercalating into
graphite than Li+, which is also conducive to the reduced rate performance of graphite
electrode in KIBs.
In order to facilitate the application of low-cost and commercially available graphite
in potassium ion batteries with enhanced electrochemical performance in this work,
activated carbon was fabricated by an etching method. After treatment of the graphite,
their interplanar spacing was enlarged, and the ion diffusion coefficient during the
electrochemical process was enhanced as well. These improvements to the activated
carbon would play a significant role in increasing its rate performance as an anode for
KIBs.
2. Experimental
2.1 Methods
High-purity (99.99%) graphite (325 mesh) was used to prepare activated graphite.
Typically, 1 g graphite was dispersed in 30 g water to create a ~3wt% dispersion.
After stirring for 30 min, 1 g KOH powder was put into the prepared graphite solution,
and the mixture was kept under stirring for 2 h at room temperature. Then, the
prepared graphite/KOH solution was moved into an air-circulating oven at 80 oC to
evaporate the water. The resultant powder was then heated at 800 oC for 2 h in a tube

4
furnace under flowing argon gas. Afterward, the synthesized powder was washed with
1 M HCl and distilled water several times to remove the residual KOH. Then, the
final product (denoted as AC-1 for its ratio of KOH to graphite, 1:1) was collected by
vacuum filtration and dried in a vacuum oven. Also, we made samples with 2:1 and
3:1 ratios of KOH to graphite, which are denoted as AC-2 and AC-3, respectively. The
commercial graphite was denoted as AC-0.
2.2 Characterization
The microstructure of the activated graphite was investigated with a Raman system
(Thermo Nicolet Almega XR Raman Microscope, with an excitation wavelength of
532 nm). X-ray diffraction (XRD) patterns were collected with a Rigaku D/MAZX
2500V/PC with Cu Kα radiation (35 kV, 20 mA, λ = 1.5418 Å). Scanning electron
microscope (SEM) images were obtained with a JEOL JSM-7500 scanning electron
microscope. High-resolution transmission electron microscope (HRTEM) images
were obtained using a JEOL 2010 operating at 200kV. Nitrogen adsorption isotherm
measurements were performed on a Nova 1000 volumetric adsorption analyzer at 77K.
The Brunauer-Emmett-Teller (BET) method was utilized to calculate the specific
surface area of each sample.
2.3 Electrochemical Tests
The electrodes were composed of the activated graphite, carbon additive (Super-P),
and polyvinylidene fluoride (PVDF) binder, with a mass ratio of 8:1:1. Here, 10% of
super-P was absolutely not the indispensable for preparation of the electrode due to
the good conductivity of the graphite. Because 8:1:1 of the Active
materials/Binder/Super-P is a classical ratio for the electrode, the addition of the 10%
super-P will benefit the comparison with other results from other researchers. The
slurry was cast onto Cu foil and dried at 120 °C under vacuum for 12 h. Coin cells
(CR2032) were assembled with potassium foil as the counter/reference electrode, a
glass fiber separator, and 0.8 M KPF6 in ethylene carbonate/diethyl carbonate
(EC/DEC, 1:1 v/v) as the electrolyte in an argon-filled glove box. Charge/discharge
measurements were carried out on a Neware battery test system
(BTS-XWJ-6.44S-00052, Neware, Shenzhen, China) at different current densities

5
between 0.01 and 2.00 V vs. K/K+ or Na/Na+ at room temperature. Electrochemical
impedance spectroscopy (EIS) was conducted using a Biologic VPM3
electrochemical workstation.
3. Results and discussion
The morphologies of the commercial graphite and the synthesized activated carbon
were characterized by SEM, as shown in Fig. 1. AC-0 possessed sheet-like particles
and had a smooth surface, whereas, the morphology of samples from AC-1 to AC-3
shows a rough surface, and the particle size decreases from several micrometers to
several nanometers with increasing KOH, as shown in Fig. 1b and c. On comparing
the details of AC-2 and AC-3, the surface of AC-3, as shown in Fig. 1d, appeared less
rough than in the case of the AC-2 because of the over-etching effect of KOH [6, 7].
The evolution of this process is illustrated in Fig. 1e. The results indicated that many
large carbon sheets on the surface of the particles had been smashed into many small
pieces by the activation. Meanwhile, more interface surface for potassium ion
transmission was generated on the carbon layer.

6
Fig.1 Morphology of the surfaces of the as-prepared samples: (a) AC-0, (b) AC-1, (c) AC-2, and (d)
AC-3; scale bars: 100 nm. (e) Schematic illustration of the evolution of the surface on the graphite.
As the adsorption of K+ ions on the graphite proceeded, the etching reaction was triggered by the
following heat-treatment. Finally, the smooth surface was broken and the rough morphology
formed on the surfaces of the resultant carbon particles.
The XRD patterns of the as-prepared carbon samples are shown in Fig. 2a. The 2θ
diffraction peaks at 26.6 o and 55 o, corresponds to the characteristic peaks of graphite
for the (002) and (004) graphite lattice planes, respectively [8]. As shown in Fig. 2b
and c, for samples from AC-0 to AC-3, it can be observed that the position of the (002)
peak experiences a slight shift to lower diffraction angles, indicating a small change in

7
the d-spacing. The refined d-spacing values are presented in Fig. 2d and indicate that
the d-spacing experiences an expansion from 0.334 nm (AC-0) to around 0.335 nm
(AC-2 and 3), which is close to the d-spacing values of reported soft carbon.[9].
Moreover, Fig. 2e shows the d-spacing values of the part formed carbon nanosheets
can reach around 0.358 nm. The transmission electron microscope (TEM) images in
Fig. 2f and g further demonstrate that the activated edges of the graphite flakes have
split level or inflated layers. These will benefit the intercalation/deintercaltion of the
sodium ions or potassium ions.

8
Fig. 2 Structure of the as-prepared samples: (a) XRD patterns, and enlargements of (b) the (002)
peak and (c) the (004) peak, respectively. (d) The calculated spacing of the graphite layers in the
as-prepared samples. After activation, TEM (e) shows the d-spacing values of the formed carbon
nanosheets can reach ~0.358 nm. And TEM images (f) and (g) of AC-2 under different
magnifications shows split level or inflated layers.

9
To reveal the structural evolution of the graphite samples with increasing amounts of
KOH in the activation process, Raman spectra were collected. In Fig. 3, the G and D
bands appear around 1580 and 1350 cm-1, respectively [10]. The G band corresponds
to the E2g phonon at the Brillouin zone center, and Fig. 3a shows a doubly-degenerate
in-plane sp2 C-C stretching mode [11]. The D band, which originates from a
defect-activated one-phonon double resonance process between the K-Kʹ symmetry
points, reflects the breathing modes of six-atom rings and requires a defect for its
activation, as shown in Fig. 3b [12]. Therefore, the D band is also attributed to an A1g
zone-boundary mode of the graphite. Fig. 3c reveals that all the samples have a strong
G band and a relatively weak D band. During the activation process, however, the
shift in the G band shows a high dependence on the amount of KOH, and the
upshifting trend agrees with a previous report on graphene, where it is demonstrated
to be a function of doping [13]. The disorder-induced Raman frequencies can be
related to the six dispersive phonon energy branches induced by the activation of the
etching process in graphite, which results in the disorder-induced one-phonon peak
(Dʹ band) in the Raman spectra [14]. Since the Raman intensity is proportional to the
corresponding vibrational mode, the intensity ratio of the bands, ID/IG, as shown in
Table 1, could be used to evaluate the degree of disorder of the graphite materials.
Here, ID/IG of AC-2 is around 0.43, which is higher than for previously published
samples [15]. Meanwhile, AC-2 also shows a higher specific surface area than the
other samples as the amount of KOH increases.

10
Fig. 3 Illustration of (a) the E2g vibrational mode of carbon atoms in one graphite layer and (b) an
A1g zone-boundary mode at the edge of the graphite layer. (c) Raman spectra of the samples
obtained at the 532 nm wavelength, and (d) enlargement of the G band and Dʹ band region, with
the Dʹ band indicated by the arrows.
Table 1 The characteristics of the as-prepared powders. BET is
Brunauer-Emmett-Teller.
Sample ID/IG BET surface area/m2/g
AC-0 0.28 3.19
AC-1 0.32 3.77
AC-2
AC-3
0.43 6.17
0.35 5.00

11
Fig. 4 Electrochemical performance of activated graphite and commercial graphite electrodes: (a)
Rate performance and (b) cycling performance of the sample electrodes at 0.2 A g-1. (c) 1st cycle
discharge/charge curves in the sodium ions battery at a current density of 0.2 A g-1 for AC-0 and
AC-2 electrodes. (d) 1st cycle discharge/charge curves in the potassium ions battery at a current
density of 0.05 A g-1 for activated graphite and commercial graphite electrodes.
The activated carbon electrode exhibits greatly enhanced rate capability. Fig. 4a
presents successive sequence tests at various current densities from 0.05 Ag-1 to 1.5
Ag-1 in NIBs and KIBs. Due to the thermodynamic instability of binary
Na-intercalated graphite, graphite has not been considered suitable for the Na+ ion
battery. The treated graphite of AC-2, however, could exhibit improved capacity
compared with the AC-0 untreated graphite, suggesting that activated carbon
electrodes could be used for improving the rate capability of the Na+ ions battery. The
insignificant decay in capacity from the 2nd to the 100th cycle of AC-2 in NIBs
0 20 40 60 80 100
0
40
80
120
160
200
240
280
320
AC-0 in NIBs
AC-2 in NIBs
AC-0 in KIBs
AC-1 in KIBs
AC-2 in KIBs
AC-3 in KIBs
Cap
aci
ty/m
Ah
/g
Cycles
0 10 20 30 40 50 60 70 80 90
0
100
200
300
400
500
0.05A/g
1.5A/g1.2A/g1.0 A/g
0.8A/g
0.4A/g
0.2A/g
0.1A/g
Ca
pa
city
/mA
h/g
Cycles
AC-0 in NIBs
AC-2 in NIBs
AC-0 in KIBs
AC-1 in KIBs
AC-2 in KIBs
AC-3 in KIBs
0.05A/g
0 10 20 30 40 50 60 70 80 90 100 110 120 130 140
0.0
0.5
1.0
1.5
2.0
2.5
Po
ten
tia
l/V
vs
Na
+/N
a
Capacity/mAh/g
AC-0 in KIBs
AC-2 in KIBs
0 50 100 150 200 250 300 350 400 450
0.0
0.2
0.4
0.6
0.8
1.0
1.2
1.4
1.6
1.8
2.0
2.2
2.4
Pote
nti
al/
V v
s K
+/K
Capacity/mAh/g
AC-0 in KIBs
AC-1 in KIBs
AC-2 in KIBs
AC-3 in KIBs
(d)
(a)
(b)
(c)

12
demonstrates its good stable cycling performance. The galvanostatic discharge/charge
curves in Fig. 4c reveal thatAC-2 has a raised dimple and lower-voltage plateau at the
beginning of discharge, compared with AC-0. As the dimple and the lower-voltage
plateau suggest that the Na+ ions need to go through a barrier, which is related to
desolvation or solvation shell distortion, it is suggested that the activated graphite in
AC-2 has a relatively low barrier for Na ion intercalation. [14]. In the case of KIBs, as
the current density is set higher, the capacity of AC-2 in Fig. 4a overtakes those of
AC-0, 1, and 3 in KIBs, where the AC-2 shows 209, 159, 114, 72, and 30 mAh g-1 at
0.1, 0.2, 0.4, 0.8, and 1 A g-1, respectively, while AC-0 exhibits 162, 56, 33, 16, and 8
mAh/g at the same current densities. The better rate performance of AC-2 may be due
to its architecture, consisting of nanosized carbon sheets with larger d-spacing in the
(100) crystal planes as a result of the etching treatment.
At the relatively high current density of 0.2 A g-1, AC-2 demonstrates a reversible
specific capacity of 100.3 mAh g-1 after 100 cycles, which is higher than for the other
activated carbon samples. In Fig. 4d, it is shown that the treated electrodes exhibit
almost the same high initial discharge capacity and relatively low charge capacity at a
current density of 0.05 A g-1, and, in particular, that the value of the charge capacity is
around 260 mAh g-1, which is close to the theoretical capacity of 279 mAh g–1 for
fully intercalated KC8. The higher irreversible capacity is partially attributed to the
initial solid electrolyte interphase (SEI) formation and electrolyte decomposition. The
reversible discharge plateau ranges from 0.4 to 0.2 V, which is also consistent with the
direct formation of KC8 [2,3].
Here, the different values of the discharge plateau of AC-0, AC-1, AC-2 and AC-3 can
be attributed to the residual oxygen-containing groups in the samples (as shown in Fig.
S1, S2 and Table S1), which would lead to the sloping profile.[16,17] Moreover, there
is a huge difference for sodium and potassium electrochemical process after
comparing the discharge-charge curves of the AC-0 and AC-2. Graphite electrode has
a low capacity for Na but a high capacity for K. The reasons are still not clearly,
however, the possible and reasonable explanation is the formation energy (Ef) of
M-graphite (M=Li, Na, K, Rb, and Cs.) compounds follows the order:

13
Na>Li>K>Rb>Cs, where all Ms except the Na have negative Ef with graphite. This
means the Na-graphite compounds with high Na contents are not thermodynamically
stable, comparing with other four M-graphite compounds, in agreement with the
experimentally observed low Na capacity.[18]
Fig. 5 CV curves at different scan rates of activated graphite and graphite electrodes: (a) AC-2 and
(b) AC-0. (c) Peak current versus mV0.5 s-0.5 and the corresponding linear fits.
The markedly improved electrochemical performance of the activated graphite
electrode, compared with the non-activated graphite electrode, was found to be
closely associated with K ion transport in the graphite-based electrode. Cyclic
voltammetry (CV) analysis of AC-0 and AC-2 was carried out to evaluate their K ion
diffusion coefficients (D) based on the Randles-Sevcik equation [19]:
𝐼𝑝 = 0.4463𝑛𝐹𝐴𝐶√𝑛𝑣𝐹𝐷
𝑅𝑇
Where Ip is the peak current, n is the number of electrons, F is the Faraday constant, R
0.0 0.5 1.0 1.5 2.0
-0.04
-0.02
0.00
0.02
0.1 mV s-1
0.2 mV s-1
0.3 mV s-1
0.5 mV s-1
0.8 mV s-1
Cu
rren
t(m
A)
Potential(V)
0.0 0.5 1.0 1.5 2.0
-0.08
-0.06
-0.04
-0.02
0.00
0.02
0.04
Cu
rren
t(m
A)
Potential(V)
0.1 mV s-1
0.2 mV s-1
0.3 mV s-1
0.5 mV s-1
0.8 mV s-1
0.3 0.4 0.5 0.6 0.7 0.8 0.9
0.00
0.01
0.02
0.03
0.04
slopeAC-0
= 0.00412
I p(m
A)
v0.5
(mV0.5
s-0.5
)
AC-2
AC-0
slopeAC-2
= 0.03014
(a) (b)
(c)

14
is the gas constant, T is the temperature, A is the surface area of the electrode, D is the
diffusion coefficient, C represents the concentration of potassium ions in the
electrolyte, and v stands for the voltage scanning rate. The K+ diffusion coefficients in
activated graphite and graphite electrodes are calculated from the slope of the plot of
Ip versus V0.5, as shown in Fig. 5c. From the linear relationship between Ip and V0.5,
DAC-0 (hereafter C0, cathodic peak at ~0.52 V) and DAC-2 (hereafter C0, cathodic peak
at ~0.51V) were obtained, and the other parameters were determined: n = 0.125, F =
96485.3 C mol−1, R = 8.314 J mol−1 K−1, T = 298 K, A = 0.49 cm2, and C = 0.8 mol
L-1. Among the K+ diffusion coefficients, the one for activated carbon (DAC-2) was up
to ~7 times larger than for the unactivated graphite (DAC-0). This suggests that the
surface carbon particles of AC-2 had been smashed into interconnected small porous
pieces by the activation treatment, which could not only realize fast electron transfer,
but also could facilitate the penetration and diffusion of the electrolyte.
4. Conclusion
In conclusion, activated carbon electrodes were developed for the potassium ion
battery and fabricated via high-temperature annealing with KOH as the etching agent.
The as-prepared activated carbon with a larger d-spacing in the (100) crystal planes
allows rapid intercalation/de-intercalation of potassium ions into/from the carbon, and
its K+ ion diffusion coefficient was also improved by around 7 times compared with
the unactivated graphite during the discharge/charge process, contributing to the
enhanced electrochemical performance. In particular, the AC-2 electrode showed a
rate retention of 54% as the current density increased from 0.05 A g-1 to 1.0 A g-1. The
results suggest that activated carbon could be a promising anode for the potassium ion
battery.
Acknowledgements
The authors are grateful for financial support from the Auto CRC 2020 project, an
ARC Discovery Project (DP170102406), and the China Scholarship Council (CSC).
This research used equipment funded by an Australian Research Council (ARC)
Linkage, Infrastructure, Equipment and Facilities (LIEF) grant (LE0237478), with the

15
facilities located at the UOW Electron Microscopy Centre. The authors greatly
appreciate the insightful comments and suggestions provided by Prof. Zaiping Guo.
Many thanks are owed to Dr. Tania Silver for critical reading of the manuscript.
References
[1] Y. Wen, K. He, Y. Zhu, F. Han, Y. Xu, I. Matsuda, Y. Ishii, J. Cumings, C. Wang, Expanded graphite
as superior anode for sodium-ion batteries, Nature Communications 5 (2014) 4033.
[2] Z. Jian, W. Luo, X. Ji, Carbon Electrodes for K-Ion Batteries, Journal of the American Chemical
Society 137(36) (2015) 11566-9.
[3] S. Komala, T. Hasegawa, M. Dahbi, K. Kubota, Potassiumintercalation into graphite to realize
high-voltage/high-power potassium-ion batteries and potassium-ion capacitors, Electrochemistry
Communications, 60 (2015) 172-175.
[4] Z. Jian, Z. Xing, C. Bommier, Z. Li, X. Ji, Hard Carbon Microspheres: Potassium-Ion Anode Versus
Sodium-Ion Anode, Advanced Energy Materials 6(3) (2016) 1501874.
[5] W. Luo, J. Wan, B. Ozdemir, W. Bao, Y. Chen, J. Dai, H. Lin, Y. Xu, F. Gu, V. Barone, L. Hu,
Potassium Ion Batteries with Graphitic Materials, Nano Letters 15(11) (2015) 7671-7.
[6] M.Y. Han, B. Ozyilmaz, Y. Zhang, P. Kim, Energy band-gap engineering of graphene nanoribbons,
Physical Review Letters 98(20) (2007) 206805.
[7] X. Wang, H. Dai, Etching and narrowing of graphene from the edges, Nature Chemistry 2(8) (2010)
661-5.
[8] M.S Sevilla, A.B. Fuertes, Direct Synthesis of Highly Porous Interconnected Carbon Nanosheets
and Their Application as High-Performance Supercapacitors, ACS Nano 8(5) (2014) 5060-78.
[9] S. Qiu, Y. Cao, X. Ai, H. Yang. Disscussion on the mechanism of sodium storage of different
structure types of cabon materials. Sci Sin Chim, 2017, 47, doi:10.1360/N32016-00236.
[10] P.H.T. Weijie Zhao, Jian Liu, Andrea C. Ferrari, Intercalation of Few-Layer Graphite Flakes with
FeCl3: Raman Determination of Fermi Level, Layer by Layer Decoupling, and Stability, Journal of the
American Chemical Society 133 (2011) 6.
[11] F. Tuinstra,.J.L. Koenig, Raman spectrum of graphite, The Journal of Chemical Physics 53 (1970)
1126.
[12] C. Thomsen,.S. Reich, Double Resonant Raman Scattering in Graphite, Physical Review Letter 85
(2000) 5214.

16
[13] Z. Ju, S. Zhang, Z. Xing, Q. Zhuang, Y. Qiang, Y. Qian, Direct Synthesis of Few-Layer F-Doped
Graphene Foam and Its Lithium/Potassium Storage Properties, ACS Appl Mater Interfaces 8(32) (2016)
20682-90.
[14] M.S. Dresselhaus, A. Jorio, A.G. Souza Filho, R. Saito, Defect characterization in graphene and
carbon nanotubes using Raman spectroscopy, Philosophical Transactions. Series A, Mathematical,
Physical, and Engineering sciences 368(1932) (2010) 5355-77.
[15] A.C. Ferrari, J. Robertson, Interpretation of Raman spectra of disordered and amorphous carbon,
Physical Review B 61 (2000) 14095.
[16] S. Wei, S. Xu, A. Agrawral, S. Choudhury, Y. Lu, Z. Tu, L. Ma, L.A. Archer, A stable
room-temperature sodium-sulfur battery, Nature Communications 7 (2016) 11722.
[17] Y.Y. Shao, J. Xiao, W. Wang, M. Engelhard, X.L. Chen, Z.M. Nie, M. Gu, L.V. Saraf, G. Exarhos,
J.G. Zhang, J. Liu, Surface-driven sodium ion energy storage in nanocellular carbon foams. Nano Lett.
13 (2013) 3909–3914.
[18] Y.Y. Liu, B.V. Merinov, W.A. Goddard, Origin of low sodium capacity in graphite and generally
weak substrate binding of Na and Mg among alkali and alkaline earth metals, Proceedings of the
National Academy of Sciences, 113(14) (2016) 3735-3739.
[19] H. Wang, W. Zhang, H. Liu, Z. Guo, A Strategy for Configuration of an Integrated Flexible Sulfur
Cathode for High-Performance Lithium-Sulfur Batteries, Angewandte Chemie 55(12) (2016) 3992-6.
Supporting Information
Activated carbon from the graphite with increased rate
capability for the potassium ion battery

17
Zhixin Tai,1 Qing Zhang,1 Yajie Liu, Huakun Liu2 and Shixue Dou
Institute for Superconducting and Electronic Materials, Australian Institute for Innovative Materials, University of
Wollongong, Innovation Campus, North Wollongong, New South Wales 2500, Australia
1 These authors contributed equally to this work.
2 *Corresponding author. Institute for Superconducting and Electronic Materials, Australian
Institute for Innovative Materials, University of Wollongong, Innovation Campus,North
Wollongong, New South Wales 2500, Australia. Tel:+61242214547 E-mail: [email protected]
18
50 100 150 200 250 300 350 400 450 500 550 600 650 700 750 800 850 900
0
20
40
60
80
100
Weig
ht/
%
Temperature/oC
AC-0
AC-1
AC-2
AC-3
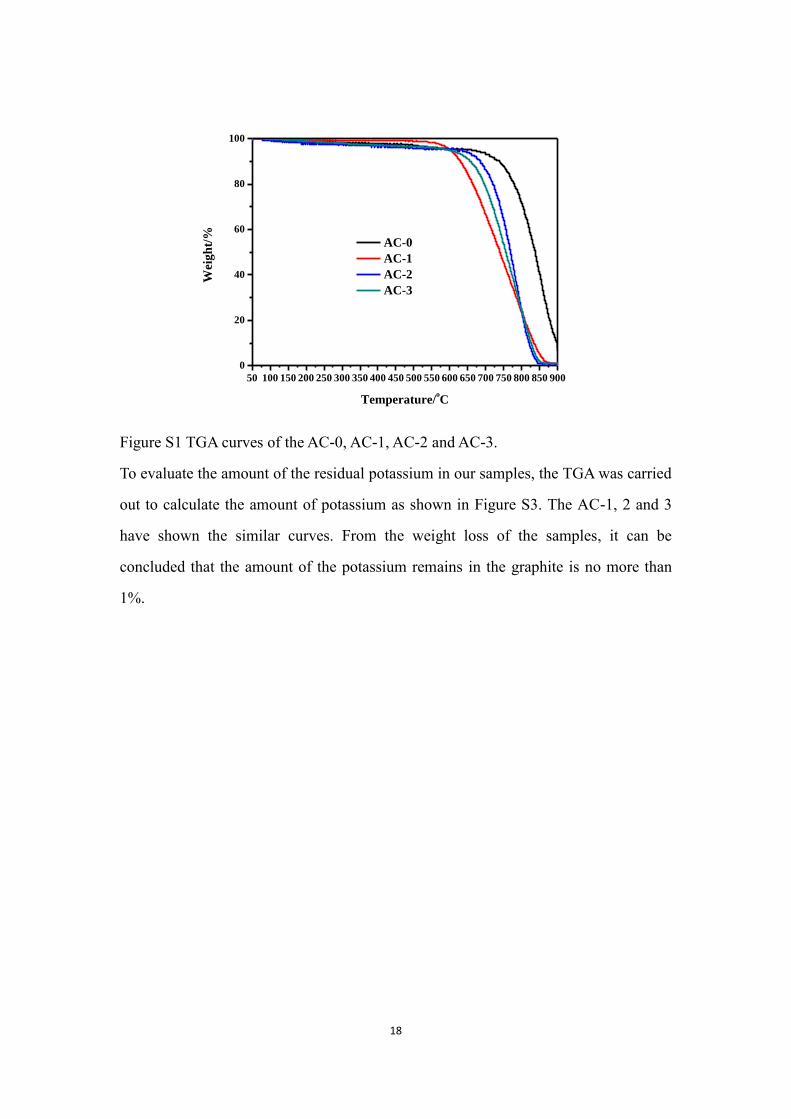
Figure S1 TGA curves of the AC-0, AC-1, AC-2 and AC-3.
To evaluate the amount of the residual potassium in our samples, the TGA was carried
out to calculate the amount of potassium as shown in Figure S3. The AC-1, 2 and 3
have shown the similar curves. From the weight loss of the samples, it can be
concluded that the amount of the potassium remains in the graphite is no more than
1%.

19
Table S1 The percentage of the elements in samples.
Items C1s/wt% O1s/wt% N1s/wt%
AC-0 94.23 5.77 0.01
AC-1 93.29 4.44 2.26
AC-2 93.68 6.29 0.04
AC-3 93.72 4.18 2.10
Figure S2 XPS investigation of the carbon, oxygen and nitrogen.(a) AC-0, (b) AC-1,
(c) AC-2 and (d) AC-3.
To further confirm whether there are some potassium remains in our samples, XPS
was used to confirm the percentage of the elements in the samples. As shown in Table
S1 and Figure S2, the samples do not have K but some C, O and N.
600 500 400 300 200
Inte
nsi
ty (
c.p
.s.)
Binding energy (eV)
600 500 400 300 200
Inte
nsi
ty (
c.p
.s.)
Binding energy (eV)
600 500 400 300 200
Inte
nsi
ty (
c.p
.s.)
Binding energy (eV)
600 500 400 300 200
Inte
nsi
ty (
c.p
.s.)
Binding energy (eV)
O1s
C1s
O1sO1s
O1s
C1s
C1s
C1s
(a)
(d)(c)
(b)
N1s
N1s
N1s
N1s
20
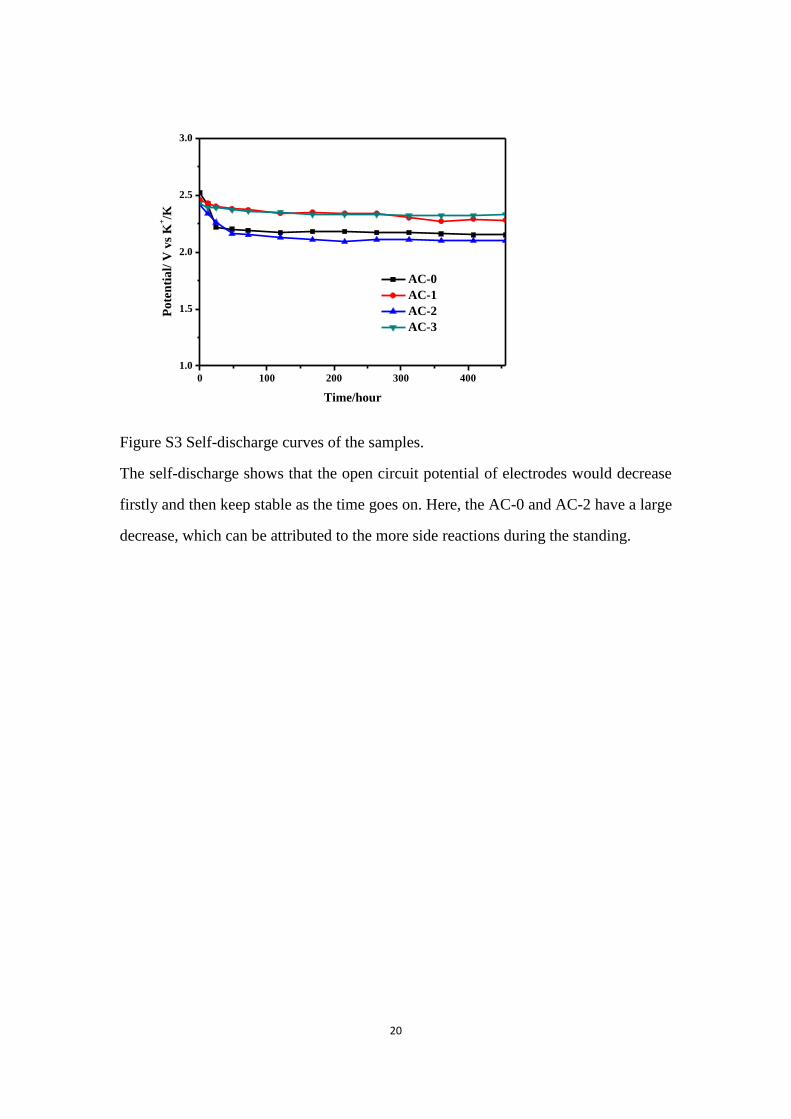
Figure S3 Self-discharge curves of the samples.
The self-discharge shows that the open circuit potential of electrodes would decrease
firstly and then keep stable as the time goes on. Here, the AC-0 and AC-2 have a large
decrease, which can be attributed to the more side reactions during the standing.
0 100 200 300 400
1.0
1.5
2.0
2.5
3.0
Po
ten
tia
l/ V
vs
K+/K
Time/hour
AC-0
AC-1
AC-2
AC-3