active and passive computed tomography mixed waste …/67531/metadc666941/m2/1/high... · active...
TRANSCRIPT
UCRL-ID-131695
Active and Passive Computed Tomography Mixed Waste Focus Area Final Report
Harry E. Martz G. Patrick Roberson
David C. Camp Daniel J. Decman Greg K. Becker
August 19,199s
This is an informal report intended primarily forinternal or limited external distribution. The opinions and conclusions stated are those of the author and may or may not be those of the Laboratory. Workperformed under the auspices ofthe US. DepartmentofEnergy by the LawrenceLivermore National Laboratory under Contract W-7405ENG-48.
DISCLAIMER
This document was prepared as an account of work sponsored by an agency of the United States Government. Neitherthe United States Government nor the University of California nor any of their employees, makes any warranty, expressor implied, or assumes any legal liability or responsibility for the accuracy, completeness, or usefulness of anyinformation, apparatus, product, or process disclosed, or represents that its use would not infringe privately ownedrights. Reference herein to any specific commercial product, process, or service by trade name, trademark,manufacturer, or otherwise, does not necessarily constitute or imply its endorsement, recommendation, or favoring bythe United States Government or the University of California. The views and opinions of authors expressed herein donot necessarily state or reflect those of the United States Government or the University of California, and shall not beused for advertising or product endorsement purposes.
This report has been reproduceddirectly from the best available copy.
Available to DOE and DOE contractors from theOffice of Scientific and Technical Information
P.O. Box 62, Oak Ridge, TN 37831Prices available from (615) 576-8401, FTS 626-8401
Available to the public from theNational Technical Information Service
U.S. Department of Commerce5285 Port Royal Rd.,
Springfield, VA 22161
Active and Passive Computed Tomography Mixed Waste Focus’ Area Final Report
Harry E. Martz, G. Patrick Roberson, David C. Camp, and Daniel J. Decman Lawrence Livermore National Laboratory
7000 East Avenue, Mail Stop L-333 Livermore, CA 94550 USA
and
Greg K. Becker Lockheed Martin Idaho Technologies Company
Idaho National Engineering and Environmental Laboratory Idaho Falls, ID, 83415 USA
August 19,1998 Version 9.0
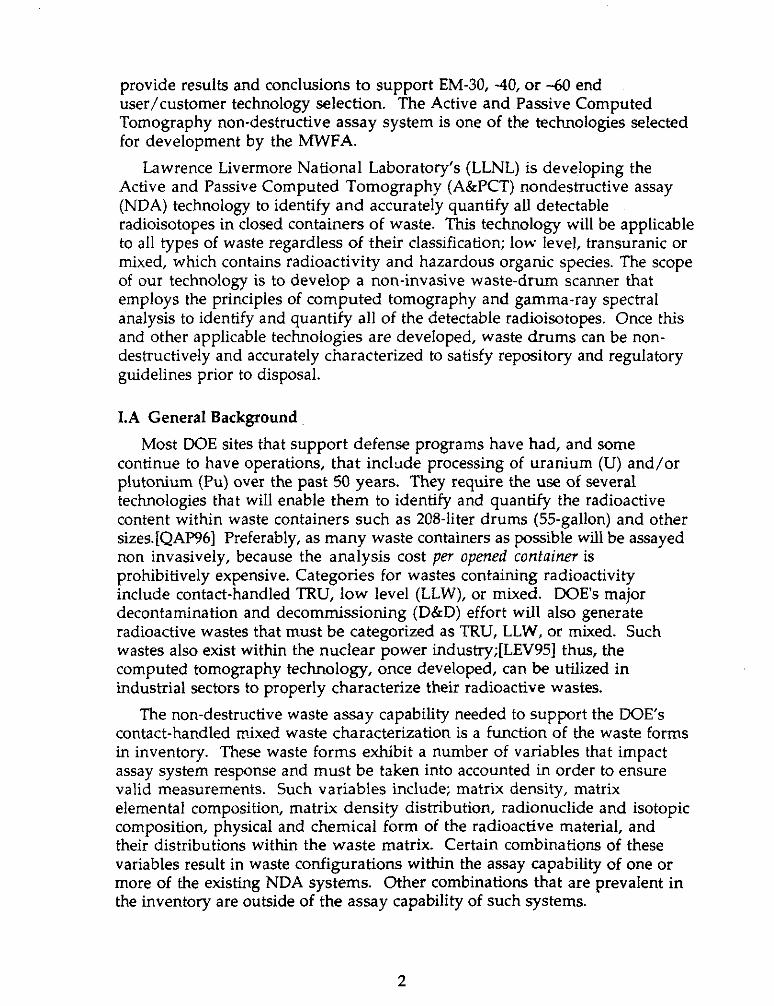
I. Introduction The Mixed Waste Focus Area (MWFA) Characterization Development
Strategy delineates an approach to resolve technology deficiencies associated with the characterization of mixed wastes. The intent of this strategy is to ensure the availability of technologies to support the Department of Energy’s (DOE) mixed waste low-level or transuranic (TRU) contaminated waste characterization management needs. To this end the MWFA has defined and coordinated characterization development programs to ensure that data and test results necessary to evaluate the utility of non-destructive assay technologies are available to meet site contact handled waste management schedules.
Requirements used as technology development project benchmarks are based in the National TRU Program Quality Assurance Program Plan. These requirements include the ability to determine total bias and total measurement uncertainty. These parameters must be completely evaluated for waste types to be processed through a given nondestructive waste assay system constituting the foundation of activities undertaken in technology development projects. Once development and testing activities have been completed, Innovative Technology Summary Reports are generated to
provide results and conclusions to support EM-30, -40, or -60 end user/customer technology selection. The Active and Passive Computed Tomography non-destructive assay system is one of the technologies selected for development by the MWFA.
Lawrence Livermore National Laboratory’s (LLNL) is developing the Active and Passive Computed Tomography (A&PCT) nondestructive assay (NDA) technology to identify and accurately quantify all detectable radioisotopes in closed containers of waste. This technology will be applicable to all types of waste regardless of .their classification; low level, transuranic or mixed, which contains radioactivity and hazardous organic species. The scope of our technology is to develop a non-invasive waste-drum scanner that employs the principles of computed tomography and gamma-ray spectral analysis to identify and quantify all of the detectable radioisotopes. Once this and other applicable technologies are developed, waste drums can be non- destructively and accurately characterized to satisfy repository and regulatory guidelines prior to disposal.
LA General Background Most DOE sites that support defense programs have had, and some
continue to have operations, that include processing of uranium (U) and/or plutonium (Pu) over the past 50 years. They require the use of several technologies that will enable them to identify and quantify the radioactive content within waste containers such as 208~liter drums (55-gallon) and other sizes.[QAP96] Preferably, as many waste containers as possible will be assayed non invasively, because the analysis cost per opened confainer is prohibitively expensive. Categories for wastes containing radioactivity include contact-handled TEU, low level (LLW), or mixed. DOE’s major decontamination and decommissioning (D&D) effort will also generate radioactive wastes that must be categorized as TRU, LLW, or mixed. Such wastes also exist within the nuclear power industry;[LEV95] thus, the computed tomography technology, once developed, can be utilized in industrial sectors to properly characterize their radioactive wastes.
The non-destructive waste assay capability needed to support the DOE’s contact-handled mixed waste characterization is a function of the waste forms in inventory. These waste forms exhibit a number of variables that impact assay system response and must be taken into accounted in order to ensure valid measurements. Such variables include; matrix density, matrix elemental composition, matrix density distribution, radionuclide and isotopic composition, physical and chemical form of the radioactive material, and their distributions within the waste matrix. Certain combinations of these variables result in waste configurations within the assay capability of one or more of the existing NDA systems. Other combinations that are prevalent in the inventory are outside of the assay capability of such systems.
2
Tom a certain extent commonly employed NDA techniques rely on the assum+on that the sample matrix and the activity are in a uniform config,-ation. In fact, waste drums are often heterogeneous in matrix and radiotr;clide material distribution, and span a wide range of composition and matrix rype. Thus, NDA system errors are related to non-uniform meas:zement responses associated with unknown radioactive source spatial distrtiztions and matrix heterogeneities. These errors can be reduced by ima&ng techniques that better measure the spatial locations of sources and matrix attenuations.[LEV95a, DUN97, & EST941 It is the intent of the A&PCT development and testing project to enhance the overall utility of waste assay throng? the implementation of techniques which can accommodate known measurement complications, e.g., waste matrix and radioactive material distribution heterogeneities, and span a wide range of composition and matrix type.
In addition to our work, there are several development efforts under way for the NDA of waste.’ In the U.S. they include neutron interrogation [HEK97, HOG97, HOL97], gamma-ray interrogation [EST97, PRE95 & GRE97], or a combination of these two [BEC97, PIC98]. In addition, other efforts at laboratories outside the U. S. include: [GOT91, RE192, RAW90 LEV95a, LETI work]. Of these two in the U.S. [PRE95, GRE971 and four outside [REI92, KAW90, LEV95a, COUSS] are using a CT approach. The efforts in Germany, Hungary and France are behind ours, while the effort at Hitachi Energy Research has been completed. The LANL tomographic gamma-ray scanner (TGS) effort is at about the same stage as LLNL’s development effort. The commercialization of LLNL’s A&PCT technology has been transferred to BioImaging Research, Inc. (BIR)[BER95, MAR95, ROB981
1.B Introduction to A&PCT Technology Gamma-ray spectroscopy with high-energy resolution germanium
detectors has been successfully used as a quantitative radioactive assay method for many years. The excellent energy resolution associated with the use of high purity germanium (HPGe) detectors allows for accurate radionuclide identification. This resolution also increases the signal to noise for the measurement thereby enabling very accurate peak areas (or counts) to be extracted from very complicated spectra. For point sources there are several methods available to relate these peak areas to absolute assay values.
However, for many sample-detector geometries the point source assumption is not valid and it is difficult to relate peak areas to absolute intensities without calibration sources of the same energy and geometry. This problem arises because of the difficulty in calculating the detector solid angle for extended sources; this is made even more complicated when sample self-
’ A gocd reference for contempory research and development, application, and implementation of NDA systems is given in the Proceedings of the MI, 5th and 6th NDA/NDE Waste Characterization Conference.[NDA]
3
absorption is important. For sources that are roughly the same size as the detector there are methods that can relate the extended source efficiency to point source calibration data. However, these methods become less reliable as the source dimensions become much larger than the detector. This is the case for the problem we discuss here, i.e., the assay of 208-L drums using a 0.2L detector. Moreover, these conventional gamma ray spectroscopy methods are most applicable when the source is uniformly distributed in a homogeneous attenuating matrix. Real waste drums do not have homogeneous configurations.
Gamma-ray spectroscopy techniques have been implemented to address the waste drum assay problem. One commonly applied technique is the LANL developed segmented gamma-ray spectrometry (SGS) technique. The SGS technique is DOE’s current state-of-practice in measuring gamma-rays from contained radioactive wastes. The SGS technique measures spatially averaged gamma-ray intensities in 8 to 10 segments, i.e., vertical slices of the drum. The average matrix attenuation value for each slice is measured by the transmission of an external source. These attenuation values are used to correct each section’s average passive gamma-ray emitted intensity. The A&PCT technology we are developing is a more refined technique that improves the imaging from 10 large segments to many small volume elements-voxels.
The A&PCT method allows the gamma-ray spectroscopy portion of the absolute assay problem to be broicen down into a simpler analysis. The A&PCT technology uses two separate measurements. The first is an active (or transmission) interrogation of a waste container such as a 208-liter drum’ by one or more external radioactive source(s); and the second is a passive (or emission) measurement of the radioactive source(s) within the drum. The results of these two measurements are combined to produce an attenuation corrected assay of the gamma-ray radioactivities in the drum. The passive measurement localizes the radioactivity of interest into small size voxels (5 cm on a side). The absolute detector efficiency can be directly related to calibration measurements of point sources. The solid angle is accounted for in the image reconstruction algorithm. The active transmission source measurement provides the data for an attenuation correction for each voxel. The absolute assay can then be obtained by adding the counts in each of the voxel of the reconstructed passive CT image. Also, since some radionuclides of interest emit gamma-rays of more than one energy, one can obtain additional checks on the image reconstruction and the absolute assay results.
2 Throughout the text we will refer to a drum instead of a container since the A&PCT scanner was optimized for drums of about 200 liters volume. This does not imply that the A&F’CT technology cannot assay other containers, e.g., we have assayed containers from 4 (1 gallon)to 300 (83 gallons) liters in volume.
4
II. Technology Description
1I.A Theory Conventional active or transmission CT scanners measure the effects of
an object on an incident beam or “ray” that travels in a straight path. For example, in x-ray or gamma-ray CT, the data measured are the photon intensities of the incident beam, I,[S(E),L], and the transmitted beam, flS(.E),L.l, that was attenuated by the object along each ray path, L, for a photon energy spectrum S(E). (This is true to first order, ignoring the effects of x-ray scattering.)
The quantity that is reconstructed in CT is the value f[S(E),z] for some volume element, or voxel, at location x = (n,y,z) within the object. The reconstruction algorithms require line integrals, also called ray sums, for many ray paths L, which are defined as
where du is the incremental distance along L. For x- and gamma-ray CT, these ray paths are determined from the intensity measurements using the Beer’s law relationship:
g[S(E),L] = In [ .I ;s”:n”;1 (LA-E2)
These ray sums over many paths are needed to reconstruct f[,S(E))r].
II.A.l Active Computed Tomography Conventionally, industrial and medical CT use an x-ray machine source
with a wide energy spectrum and a current-integrating detector that integrates the energy deposited by photons over all energies. The resultant attenuation image is given by
ftS(E),xl= j- &dx),Z~x),EI dE SW
(polyenergelic),
(ILA-E3) where ,u is the linear attenuation coefficient, which is a function of volume density, p ,and the atomic number Z. Note that the resultant attenuation is integrated over the entire energy spectrum. The A&PCT nuclear- spectroscopy-based drum scanner differs from the conventional scanners in that it discriminates between photons of different energies. In this case, the resultant image is given by
fEN = ~bNx)ZxMl (monoenergetic). @.A-E4)
5
The results are thus a discrete quantitative measurement of the linear attenuation coefficient at one energy E; i.e., there is no integration over the energy spectrum S(E).
The ray path L is simplified if we consider a single x-y plane fixed along the longitudinal axis, z, of a waste drum. We can treat a single discrete x- or gamma-ray beam in that plane as a line or ray path defined by s, the distance between the ray path and the (x-y) origin, and 8, the angle of the s axis from the x axis. The transmitted (or active) beam intensity Z(E,s,B) for this ray path at a fixed energy, E , is
Z(E, s, 8) = z,(E, s, 8) exp[-JJ p(E, x, y@(x cos o + y sin 8 - skl~iy] , @ .A-E5)
where p(E,x,y) is the spatial distribution of the linear attenuation coefficients at energy E, I, is the intensity of the incident beam, and 6 is the Dirac delta function. The equation for the ray path is xcose + ysine - s = 0. As mentioned earlier the argument of the exponential is known as a ray sum, g(E,s,B), in this case is equal to
g(E, s, 0) = In t,W, s, @
[ 1 ICE, s, 0) =JJ p(E, x, y)&x cos e + y sin e - s)&fy , @ .A-E6)
It is useful to note that the CT ray sum is analogous to a simple gamma-ray transmission gauge experiment.
The set of ray sums at all values of s for a fixed E and 8 is called a “projection,” and a complete set of parallel-beam projections at all 9 (from 0 to 180’ or 360”) for a fixed E is called a “sinogram.” From measurements of I and Ia, a complete ACT sinogram can be determined, and various methods have been devised to reconstruct u, the linear attenuation coefficient, with filtered backprojection (FBP) being the most common.[BUD79] Therefore, u is the parameter determined by image reconstruction of the ACT measurements at a selected energy value and voxel. For a waste drum, the attenuation due to the drum’s contents, whether heterogeneous or homogeneous, is accurately measured in the third dimension by measuring sinograms at different z planes (or elevations) of the drum. Note that ACT does not measure the presence or identity of any radioisotope, source strength or activity within a waste drum.
II.A.2 Passive Computed Tomography On the other hand, passive CT can be used to measure and determine
both. The ray sum for passive or single-photon-emitted CT (sometimes called SPECT) imaging, gl(E,s,B), is defined by [BUD791
g,(E,s,e) = z,(e,e) = JJp(E,x,y)a(E,x,y,s,e)6(xc0se+ysine-~)d~dy ,(B.A-~7)
6
where I, are the counts measured at each ray sum position and
[
‘IeucyIr u(E,x,Y,s,~) = exp - JJ ~(~,x',y36(x'cose+y'~ine-s)dr'dv' ,
I (ILA-E8)
XY is the half-line attenuation integral from the (x,y) position to the detector position defined by (s/3); and p(E,x,y) are the photons of energy E emitted in each voxel per unit volume per unit time for a radioactive source within the wa,ste drum.
A single-photon-emitted ray sum is the integrated radioisotope activity, modified by one or a multiple of exponential attenuations, along the path from the source position within the drum to the detector. The influence of the term a(E,x,y,sB) depends on the magnitude and distribution of the attenuations within a waste drum, which are typically large and nonhomogeneous for most energies emitted. To obtain the most accurate results from the PCT measurements, the energy-dependent attenuations must be determined from ACT measurements. The commonly used assumption of a constant attenuation coefficient (e.g., the SGS method) is inadequate for accurate measurements of inhomogeneous waste matrices.
II.A.2 Coupling Active and Passive Computed Tomography Coupling the ACT and PCT modes allows accurate and quantitative
attenuation corrections to be determined specific to the location of any radioactivity detected. That is, once the attenuation caused by the waste matrix and geometry of the CT scanner is accounted for, an accurate measurement of the emitted photons, p, from a radioisotope is determined. The radioisotopic activity from a particular radioisotope, j, is determined as follows:
C,(E) = &,@ I, (ILA-E9) I
where C,(E) is the total photons per unit time obtained from the sum of the voxels at energy E for the reconstruction of the passive CT data corrected by the ACT attenuation map. Once the total photons are obtained, the activity, A.i is obtained from
A’(mCi) = C,(E) WX’jk ’
where f is the ray sum time, E(E) is the HPGe effiden$ at the particular energy E of the emitted gamma ray measured, ,5 is the branching ratio for this particular gamma ray, and k is the constant 3.7~10~ disintegrations per second per millicurie. Finally, the measured activity is converted to a specific gram value mass, m, using
3 This does not include the &id angle since it is accounted for in the image rec~lstTucti~n and assay algorithm as discussed in Section II.B.3.
7
mj(g)2-, 4p @.A-Eli)
where mj is the mass in grams of radioisotope j, that has a specific activity given by A$
1I.B A&PCT Technology In order to assay an unknown waste drum using gamma-ray active and
passive CT three techniques are required. These techniques are: (1) Gamma- ray spectroscopy data acquisition in both the active (A) and passive (I’) CT modes; (2) Analysis of the gamma-ray spectra acquired in both the A and P modes; and (3) Reconstruction of both the A and P images. It is useful to describe briefly the principles and issues associated with each of these techniques to better understand the challenge of NDA of waste drums.
II.B.l A&PCT Data Acquisition Our active and passive computed tomography technology employs a
scanner that uses high purity germanium (HPGe) detectors and their associated electronics.[DEBB& MAR91, ROB91 & ROB941 It differs from conventional transmission CT scanners in that it discriminates between photons of different energies. The quantity that is reconstructed in active CT is the linear attenuation coefficient (u) value for some volume element, or voxel, at location x, y, and z within a drum (see Eq. ILA-E4). The voxel size and clarity are defined by scan and image reconstruction parameters. For a waste drum, the attenuation due to its contents is accurately measured in three dimensions and displayed as a sequence of two dimensional images at different z planes (or elevations) of the drum. Note that active CT does not identify any isotope or measure the source strengths or any radioactivities within a waste drum.
Passive CT is used to measure and determine both the identity and the strength of radioisotope sources within a drum. The ray sum for passive or single-photon-emitted CT (sometimes called SPECT) imaging is the counts (see Eq. II.A-E7) measured in disintegrations (d) per unit volume per unit time of a source within a waste drum. Therefore, a single-photon-emitted ray sum is the integrated radioisotope activity, modified by one or a multiple of exponential attenuations, along the path from a source position within, a drum to the detector. The function that is imaged for passive CT is the counts corrected for matrix attenuation at one or more energies for all detectable radioisotopes within a drum. The gamma-ray spectrometry detection equipment collects the entire energy spectrum for each integration point and the radioisotopes are identified by their characteristic peaks within the energy spectrum (see Section II.B.2).
8
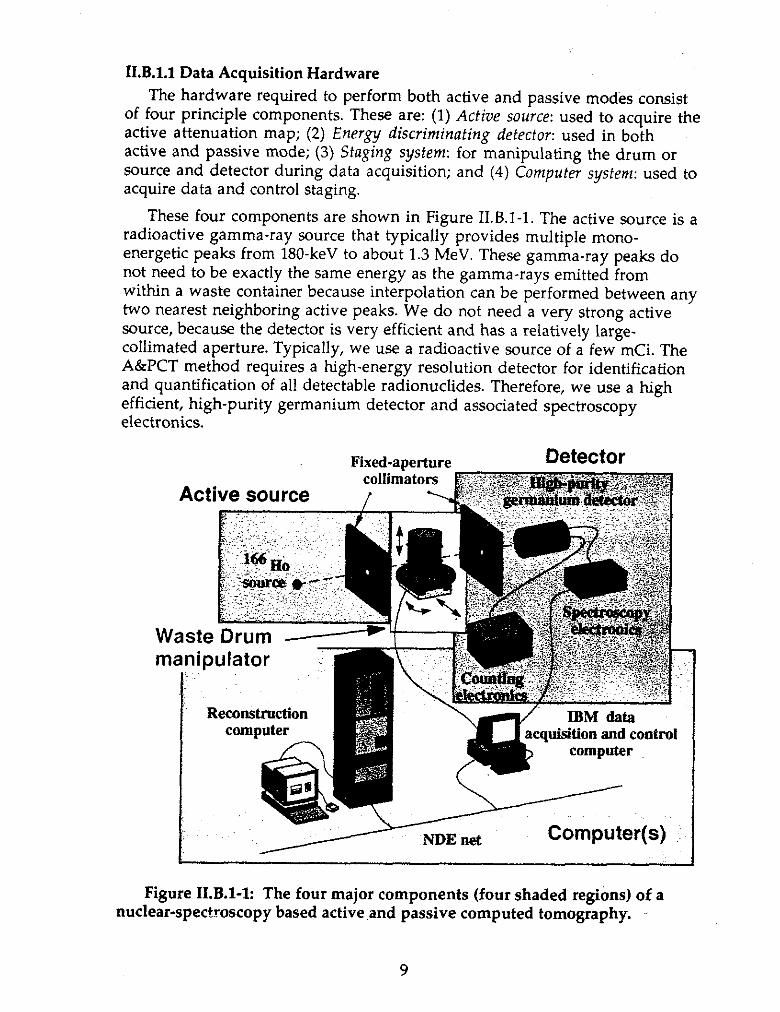
fI.B.l.l Data Acquisition Hardware The hardware required to perform both active and passive modes consist
of four principle components. These are: (1) Acfive source: used to acquire the active attenuation map; (2) Energy discriminating defector: used in both active and passive mode; (3) Staging system: for manipulating the drum or source and detector during data acquisition; and (4) Computer sysfem: used to acquire data and control staging.
These four components are shown in Figure II.B.l-1. The active source is a radioactive gamma-ray source that typically provides multiple mono- energetic peaks from 180-keV to about 1.3 MeV. These gamma-ray peaks do not need to be exactly the same energy as the gamma-rays emitted from within a waste container because interpolation can be performed between any two nearest neighboring active peaks. We do not need a very strong active source, because the detector is very efficient and has a relatively large- collimated aperture. Typically, we use a radioactive source of a few mCi. The A&PCT method requires a high-energy resolution detector for identification and quantification of all detectable radionuclides. Therefore, we use a high efficient, high-purity germanium detector and associated spectroscopy electronics.
Active source
Fixed-aperture
Waste Drum manitxdator 7
Detector
\ mdata acquisition and control
computer
Computer(s) :; t
Figure II.B.l-1: The four major components (four shaded regi&s) of a nuclear-spectroscopy based active .and passive computed tomography.
9
f
Two other important components of the A&PCT scanner are the collimators for both the active source and detector. The apertures in these collimators are square. The detector-collimator aperture defines the spatial resolution (voxel size) of the active-attenuation CT image and the corrected- passive CT image. The source collimator is used to minimize scattered radiation. This ensures better data and provides a safer operating~ environment, and elliminates any cross transmissions when multiple active transmission sources are used.
Through simulation we studied the trade-off between spatial resolution and signal-to-noise.[KET95] Further, an optimum system design is dependent on expected emission source distribution and activity. Results of our simulation work revealed that AWCT systems with collimated square apertures from 2.5 to 7.5 cm on a side will perform best. In order to ensure that the detector fills the entire aperture area we need a large diameter detector. The largest diameter detectors with high counting efficiency are about 8.2 cm diameter. A large detector aperture reduces the assay time in two ways. First, a larger aperture utilizes more detector surface area providing a larger solid angle; second, it yields the advantage of fewer measurement positions (less sampling). Finally, we found that the aspect ratio (aperture length divided by aperture width) performs best if it is in the range of 5:l to lO:l).[KET95] The smaller the aperture aspect ratio, the closer the detector will be to the waste drum; hence, the higher the counting rate because of the larger solid angle subtended.
Data are acquired by either manipulating the drum, or manipulating the drum and source/detector pair. If only the drum is manipulated, the staging system must be capable of translating, elevating, and rotating the drum. For other cases, the source/detector pair may translate and/or elevate instead of the drum. Typically, for a single detector A&PCT system, either the waste drum or the source/detector pair is discretely translated by a distance equal to the detector collimato<s horizontal aperture dimension. The translation is performed for all ray sums required. If the A&PCT scanner uses multiple detectors, it is possible to reduce or even eliminate the requirement to translate the drum. If there were a sufficient number of detectors to cover a full transverse section of the drum, there would be no need to translate the drum. Thus, only drum rotation and elevation are required for an assay.
The computer systems shown in Figure II.B.l-1 are used to control the staging system, acquire data from the spectroscopy electronics, perform pre- processing functions, and reconstruct data. The reconstruction process is discussed in Section II.B.3. The A&PCT systems typically use PC computers to acquire data. After data acquisition, the pre-processing and reconstruction processes can be performed on SUN or SGI computers’; however, they are also performed on the PC.
“Ihis dces not imply that LLNL endorses either product or vendor.
10
1I.B.l.Z Data Acquisition Software The CT data acquisition software is written in C-code and consists of: (1)
Input/output interface; (2) Stage control; (3) Data acquisition and digitization; and (4) Data preprocessing. The following paragraphs discuss each of these considerations in turn.
The input/output interface provides a window for entering the required scan parameters and other pertinent information about each CT scan. This information is stored on the disk in a CT parameter file in text format. This CT parameter file accompanies the data through the acquisition, reconstruction and assay reporting processes. All of the software programs associated with these processes must accept the CT parameter file’s format. One CT parameter file is generated for each energy region of interest for both the projection data set and the reconstruction data set. The CT parameters are divided into several categories within the file and include information on: each scan, projection, active radiation source, detector and source geometry and collimators, HPGe detector specifications, scan-time parameters, reporting parameters, simulation (if applicable), and reconstruction. Some parameters are specific to the individual scanner that produced the data.
Stage control requires communication between the acquisition computer and the motor controller. Communication is usually accomplished through an RS232 port on the acquisition computer. The staging control subroutines in the data acquisition program typically vary depending on the manufacturer of the staging system being used and the CT scan geometry.
Data acquisition and digitizing subroutines depend on the detector system being used in the CT scanner. We acquire data from a single high-purity germanium detector where each photon interaction with the detector is digitized. The magnitude of the digitized signal is related to the energy of the photon detected.
Each individual CT scanner dictates specific preprocessing methods and the number of preprocessing stepsrequired as a result of the differing physical characteristics (i.e., source and detector systems used). The main preprocessing procedure consists of calculating the ray sums from the raw gamma-ray counts. Incident and transmitted counts are used to calculate ACT ray sums (see Eq. IIA-E6). These ray sums are used as input to the ACT image reconstruction codes. For PCT the emitted counts for all ray sums are combined with the attenuation images (see Eq. and ILA-E7) to produce attenuation corrected PCT images of photons per unit time per voxel. These images are used to obtain a specific isotopic activity and mass using Eq. ILA-E9 through Eli.
There are three important properties in acquiring both active and passive ray sums. First, the geometry of the ray paths (i.e., the source and detector positions in the object coordinate system) must be completely known; second, at any given geometric position, for ACT the incident and transmitted counts,
11
and for passive CT the emitted counts or the entire spectrum must be accurately measured and recorded; and third, for multiple-detector scanners, all preprocessed detector responses to a given energy and intensity must be identical; therefore, the responses of individual detectors need to be balanced.
II.B.l.3 Data Acquisition Modes and Protocol We have two main protocols or modes of operation. These are collimated
gamma-ray scanning (CGS) and A&PCT. The CGS mode is used to quickly determine the location of radioactivity with respect to height within a drum and to determine the data acquisition scan parameters (e.g., number of slices, and scan time) required. The A&PCT protocol is used to accurately assay the radioactivity within a waste drum. both CGS and A&PCT employ active and passive protocols.
For the CGS active and passive protocols the gamma-ray data is integrated while the drum is continuously rotated for each slice. A full drum requires 18 slices. In the active protocol the transmission source is opened and data for specific energy regions of interest (EROI) are obtained. In the passive protocol, the transmission source is shuttered and selected EROI or the entire gamma- ray spectrum is recorded.
For A&PCT a set of transverse ray sums at one angle (a projection) are acquired when the full drum has been traversed. After each projection is acquired, the drum is rotated slightly for the next projection acquisition. For active mode, projections are acquired over 180 degrees, and for passive mode they are acquired over 360 degrees. Once a full set of ~projections are acquired, the drum or the source/detector pair is elevated by a distance equal to the vertical dimension of the detector’s collimator aperture. The projections are used to reconstruct the waste drum. For a full drum, 18 slices are acquired for both active and passive modes. The slice thickness is defined by the vertical dimension of the detector’s collimator aperture.
During ACT data acquisition protocol, EROIs are set for each of the major peaks of the transmission source. Data are collected from each EROI simultaneously for each ray sum acquired. The active data that are saved and used in the reconstruction process are the net counts, which are the gross energy peak at each EROI minus the background.
In passive protocol, the entire energy spectrum is acquired for each ray sum. This differs from the active mode because the energy peaks emitted from within the waste drum are unknown. All of the emission spectra are used to evaluate the isotopic content.
II.B.2 Gamma-ray Spectroscopy Analysis Software The A&PCT data sets consist of hundreds of high-energy resolution
gamma-ray spectra, one for each ray sum acquired. Generally, the statistics in each individual ray sum spectra are poor, but they can be summed to produce
12
better quality spectra that can be analysed by traditional gamma-ray spectroscopic analysis codes. Such an analysis can determine most of the radioactive isotopes present. This includes isotopes important to transuranic waste characterization, and isotopes that may be of interest to neutron-based NDA technologies or gamma rays that might interfere with the analysis.
The analysis of the passive CT gamma-ray spectra also yield the mass ratios of the important plutonium ~isotopes. The A&PCT method could, in principle, determine a mass (see Eq II.A-Eli) for each of these isotopes by reconstructing the sinograms of their characteristic gamma-rays in the spectrum. However, that is rarely possible due to their poor statistics. Instead the A&PCT assay only needs to determine the mass~of one isotope, usually upPu. Analysis of the spectra can be used to determine other radioisotopic ratios. This information is used to calculate the thermal power, the total alpha activity, and the fissile gram equivalent necessary for the characterization of the waste.
The A&PCT data acquisition code creates spectra in a binary format similar to the one used by ORTEC’s Maestro’. We have developed a computer code that processes each of the ray sum spectra. The code is written in standard FORTRAN and currently is implemented to run in MS Windows-NT on personal computers. Our gamma-ray analysis code reads these spectra and builds a summed binary spectrum as well as an ASCII spectrum data file. The actual spectral analysis is performed on this ASCII file which is saved for future analysis. In addition to forming the summed spectrum the code also analyzes each ray sum for all of the EROIs from a user-defined table. The results of this analysis provide gross and background counts from each EROI for each ray-sum. The resulting sinograms are then stored in a binary format used by the image reconstruction and assay code.
II.B.2.1 Gamma-ray Spectral Analysis The gamma-ray spectroscopy analysis of the summed spectral data begins
by fitting a universal background to the entire spectrum. The background for each channel in the spectrum is determined by a “peak erosion” technique; and this background is subtracted from the spectrum. Then, a standard peak- search algorithm is used to find peaks. All peaks determined are analyzed for centroid and area, and subsequently their energies are compared to a user- defined look-up table of known gamma-ray lines, primarily Pu, Am and U. Obviously, the spectrum’s gain and zero (specified in a setup file) have to be well known for this comparison to be valid. In this first step, only individual peaks are checked against the known list. No detailed analysis is performed on peak multiplets. The peak search criteria are intentionally set loose so that some “peaks” detected are only statistical anomalies. This assures finding nearly all the easily determined peaks. Background radiation isotopes (e.g., @K, Th-U daughter products) are found in this step, in addition to those
5 ‘Ihis does not imply that LLNL endorses this product or vendor.
13
isotopes of interest. From the preliminary analysis, data are flagged for further analysis if there are U, Pu or Am gamma-ray peaks detected. At the present time, if no peaks from these three isotopes are detected, then the spectra is either a calibration spectrum or a spectrum that requires special analysis and is so flagged.
To determine accurate peak areas the full energy peaks must be separated from the background and Compton continuum. One must have a mathematical description of both x-ray and gamma-ray peak shapes as a function of energy and appropriate fitting algorithms, which can vary selected peak shape parameters in order to obtain the best fit (defined as the minimum least square difference between the data points and their calculated values). One must also have a list of known peak energies and their respective branching ratios for all gamma rays of interest.
Currently, we examine each summed gamma-ray spectrum for the following TRU isotopic mass ratios ?38Pu/239Pu , 2’oPu/239pu, “‘Pu/ugPu, 235U/u9Pu, and 24’Am/UgPu. These ratio pairs are determined by analyzing closely spaced multiplets of gamma-ray lines from these isotopes. In each case we use the known energies and branching ratios to fix as many parameters as possible in the least squares fit. The goal in the calculation is to generate a mathematical spectrum section from a set of peak shape parameters and intensities that mathematically most closely approximate the measured net signal. This best fit gives a minimum reduced Chi squared difference between the calculated signal and the measured data.
To find the best fit, the equations describing the various peaks are approximated by using a first order Taylor’s series expansion about the trial values of the free parameters, which are adjusted to minimize differences between the equations and data. These ,adjustments are found by performing non-linear least-square iterations on the equations. This procedure is also known as the Gauss-Seidel or Newton-Raphson method. For rapid convergence the closer the initial choices are to the real values, the quicker the fitting process converges. One output of the fitting process is the best peak height of the isotopic peak(s). These are used to find the best measurement of the isotopic composition of an emission source. We also correct the extracted peak areas for efficiency and a general attenuation correction. These corrections can be important when the energy range of the analysis is more that 10 keV.
Presently, we analyze data in seven regions of the gamma-ray spectrum:
l The area between 120 and 135 keV is analyzed to determine the “‘Am/U9Pu ratio. This region contains six peaks, but the analysis is determined by the ratio of the usPu peak at 129.3 keV and the peak at 125 keV in “‘Am. However, all peaks in this region must be included in the fit to obtain a good analysis. This region gives a good indication of any excess americium in a drum as has been
14

demonstrated by data ) analyzed by our code from SWEPP at Idaho National Engineering and Environmental Laboratory (INEEL.
l The region from 135 to 155 keV can determine the 24’Pu/u9Pu ratio by comparing the 148.5 keV (24’Pu) to the 144.2 keV transition of 239Pu. Similarly, the 152 keV peak of u8Pu can also be analyzed; however, weapons grade Pu this is a rather weak transition which greatly limits the accuracy of the derived ‘38Pu/239Pu ratio. Also this analysis can be complicated by the presence of 235U and its transition at 143 keV.
l The analysis of the 160 keV region should give the best information about the 240Pu/u9Pu ratio. The doublet of strong transitions from these two isotopes at 160 keV can be a clear indication of the degree of “burn-up” in the plutonium. Unfortunately, this region is frequently contaminated by high Compton background in typical waste drum spectra, which limits the accuracy achievable.
l The 208 keV transition is a very prominent feature in the gamma-ray data in the A&PCT systems. This transition is produced by both 241Am and 241Pu with similar branching ratios. However, because of its higher specific activity, 24’Pu dominates in most cases. This peak can be compared to the 203 keV peak of 239Pu for another determination of the mass ratios. Also the 203 keV peak can be compared to the 205 keV peak of 235U to determine uranium content.
* The regions near 340 keV and at 375 keV give additional measurements of the 21’Pu/?u and 24’Am/UgPu ratios.
l The 414 keV transition is usually used for the A&PCT analysis, and this region is also analyzed to look for possible contamination by “‘Np.
l The region above 600 keV contains peaks from u9Pu, *%I, and “‘Am and can be very useful in some cases. The high energies of these transitions allow them to escape from highly attenuating waste matrices. However, branching ratios for these peaks are less than those for the lower energy regions so that the statistical quality of data for low waste-drum gram loadings is a problem.
The results of the analysis of these regions is then combined into a report of the massratios. Subsequently, the data are combined with the assay data for usPu (or “U) to calculate the desired waste characterization parameters. This report lists the energies and intensities of the gamma rays found in a
15
spectrum along with their identification when possible. Those peaks not found to agree with any listed in the table are flagged as unknowns. In the future, we intend to implement an option that if no isotopes from these three major elements are found, the program will continue to search for other TRU isotopes that are identified as important to the neutron-based NDA techniques and to the WIPP WAC (e.g., “‘Cs and see Appendix A).
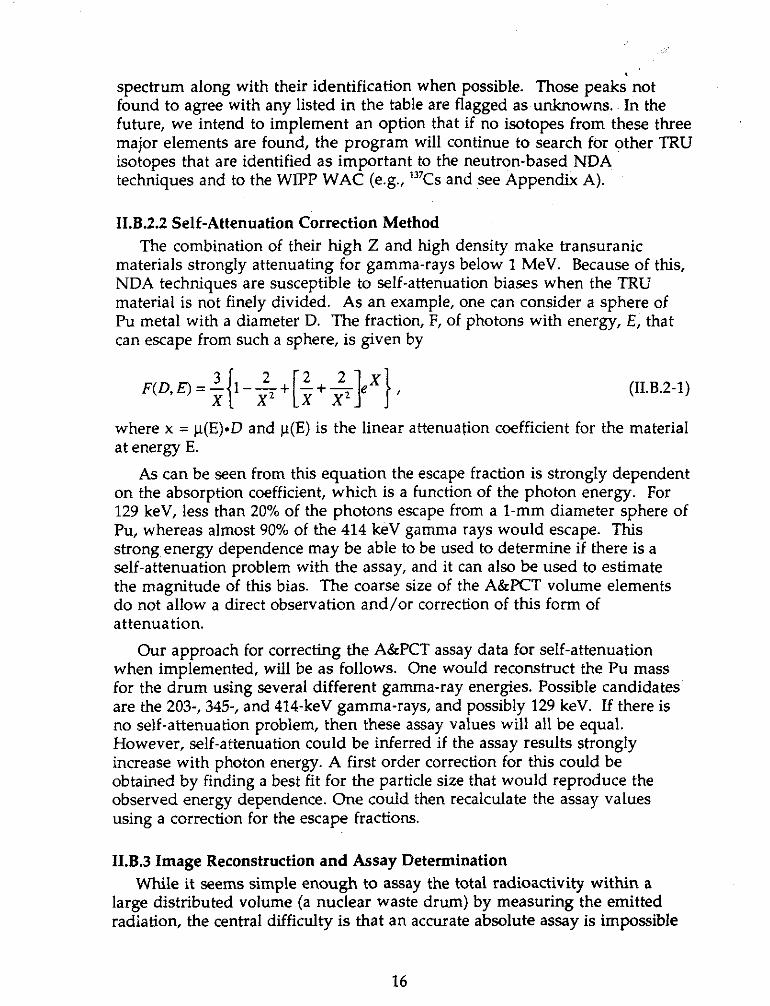
II.B.2.2 Self-Attenuation Correction Method The combination of their high Z and high density make transuranic
materials strongly attenuating for gamma-rays below 1 MeV. Because of this, NDA techniques are susceptible to self-attenuation biases when the TRU material is not finely divided. As an example, one can consider a sphere of Pu metal with a diameter D. The fraction, F, of photons with energy, E, that can escape from such a sphere, is given by
(II.B.2-1)
where x = p(E)*D and p(E) is the linear attenuation coefficient for the material at energy E.
As can be seen from this equation the escape fraction is strongly dependent on the absorption coefficient, which is a function of the photon energy. For 129 keV, less than 20% of the photons escape from a l-mm diameter sphere of Pu, whereas almost 90% of the 414 keV gamma rays would escape. This strong, energy dependence may be able to be used to determine if there is a self-attenuation problem with the assay, and it can also be used to estimate the magnitude of this bias. The coarse size of the A&PCT volume elements do not allow a direct observation and/or correction of this form of attenuation.
Our approach for correcting the A&PCT assay data for self-attenuation when implemented, will be as follows. One would reconstruct the Pu mass for the drum using several different gamma-ray energies. Possible candidates are the 203-, 345-, and 414-keV gamma-rays, and possibly 129 keV. If there is no self-attenuation problem, then these assay values will all be equal. However, self-attenuation could be inferred if the assay results strongly increase with photon energy. A first order correction for this could be obtained by finding a best fit for the particle size that would reproduce the observed energy dependence. One could then recalculate the assay values using a correction for the escape fractions.
II.B.3 Image Reconstruction and Assay Determination While it seems simple enough to assay the total radioactivity within a
large distributed volume (a nuclear waste drum) by measuring the emitted radiation, the central difficulty is that an accurate absolute assay is impossible
16
unless the emerging measured radiation can be corrected for the matrix attenuation it suffers. This correction requires knowledge of the spatial distribution and density of both emitters and absorbers throughout the volume. An accurate assay will necessarily involve a complete determination of the three dimensional (3-D) structure of all radioisotopes present even though the original problem posed by the regulations requires only one number, the total radioactivity quoted as Pu-effective grams, contained within a waste drum.
The active CT data is acquired and reconstructed using the robust 2D filtered backprojection method described elsewhere.[BUD79] The resultant 2D CT slice data at a particular energy is merged into a 3D array before it issubmitted with the passive count data to the passive CT image reconstruction and assay algorithm.
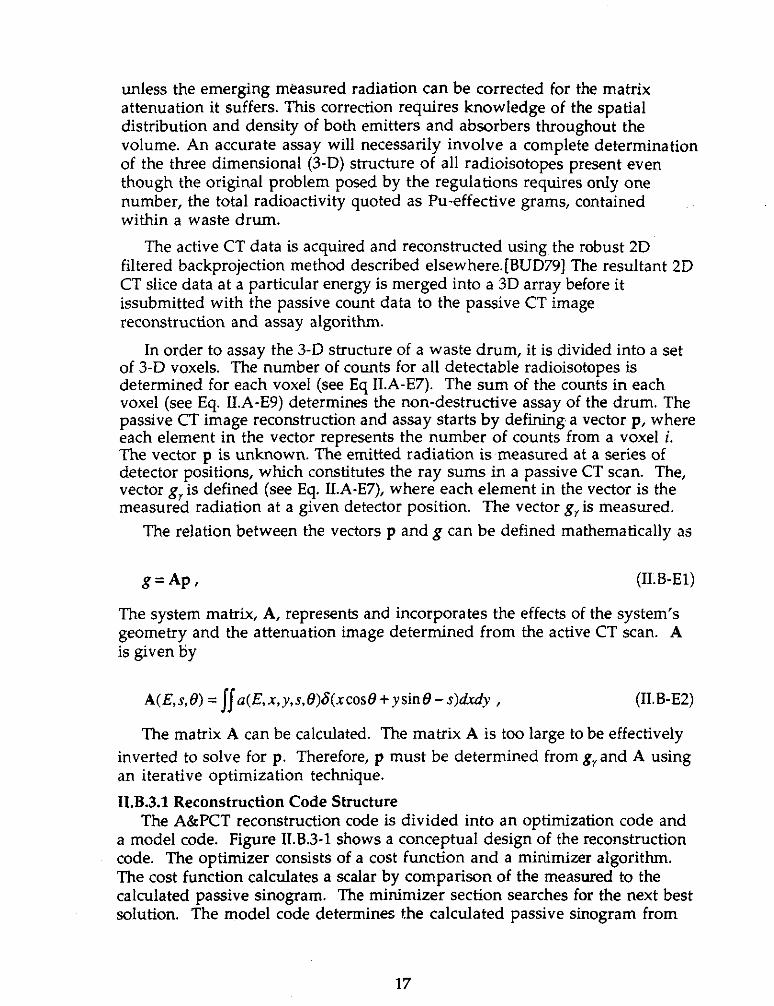
In order to assay the 3-D structure of a waste drum, it is divided into a set of 3-D voxels. The number of counts for all detectable radioisotopes is determined for each voxel (see Eq ILA-E7). The sum of the counts in each voxel (see Eq. KA-E9) determines the non-destructive assay of the drum. The passive CT image reconstruction and assay starts by defining a vector p, where each element in the vector represents the number of counts from a voxel i. The vector p is unknown. The emitted radiation is .measured at a series of detector positions, which constitutes the ray sums in a passive CT scan. The, vector gr is defined (see Eq. KA-E7), where each element in the vector is the measured radiation at a given detector position. The vector g, is measured.
The relation between the vectors p and g can be defined mathematically as
g=Ap, (Kg-El)
The system matrix, A, represents and incorporates the effects of the system’s geometry and the attenuation image determined from the active CT scan. A is given by
A(E,s,8)=IIa(E,n,y,s,8)6(xcose+ysinB-s)dxdy , (ILB-E2)
The matrix A can be calculated. The matrix A is too large to be effectively inverted to solve for p. Therefore, p must be determined from grand A using an iterative optimization technique. II.B.3.1 Reconstruction Code Structure
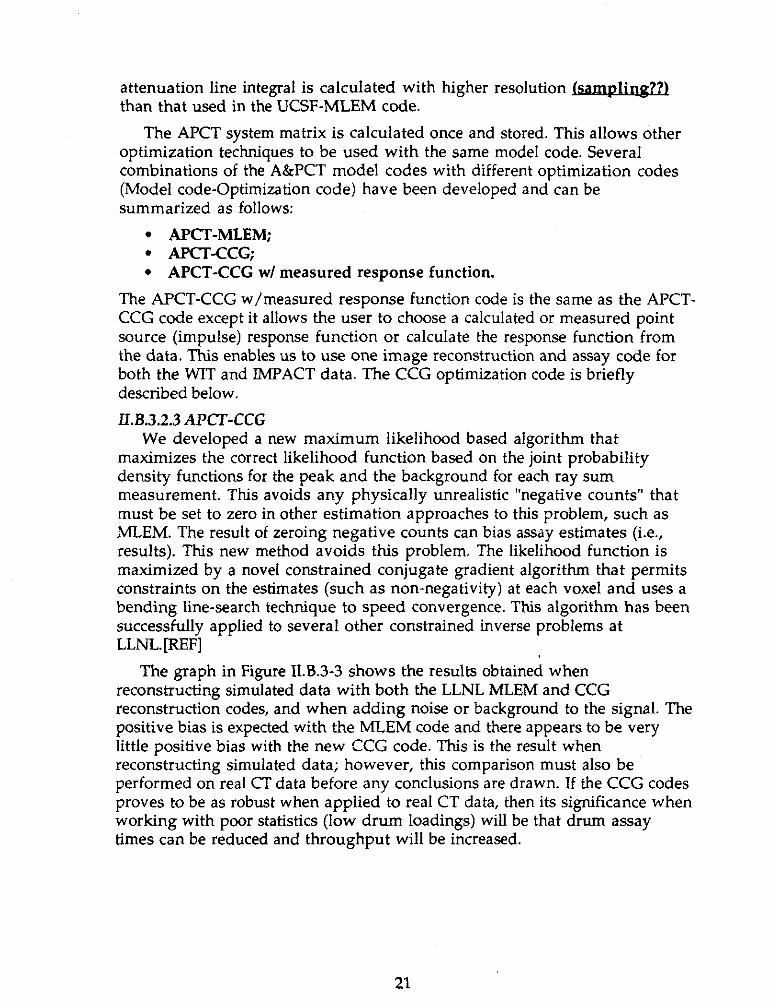
The A&PCT reconstruction code is divided into an optimization code and a mode1 code. Figure II.B3-1 shows a conceptual design of the reconstruction code. The optimizer consists of a cost function and a minimizer algorithm. The cost function calculates a scalar by comparison of the measured to the calculated passive sinogram. The minimizer section searches for the next best solution. The mode1 code determines the calculated passive sinogram from
17
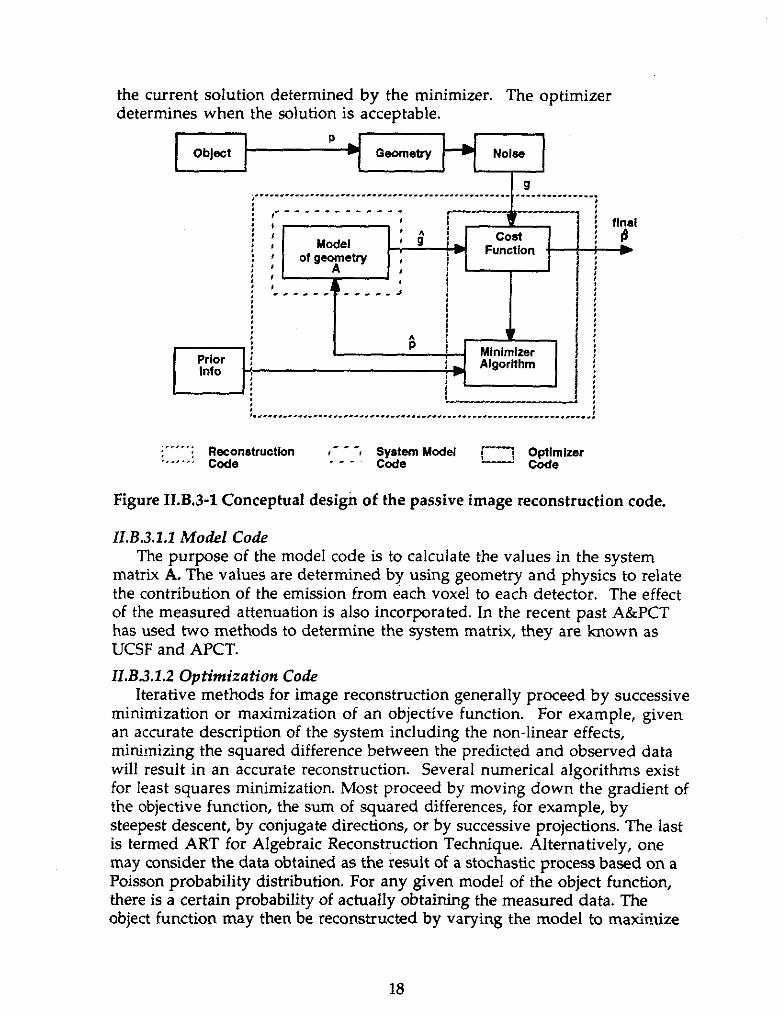
the current solution determined by the minimizer. The optimizer determines when the solution is acceptable.
~~~~~~-----; -7
-y-
v-.
fIrmi -4
i”‘-‘i Reconstruction I- - -I system Model ‘.-‘a” code
f-7 Optimizer _ - - Code IL--! cede
Figure II.B.3-1 Conceptual design of the passive image reconstruction code.
II.B.3.1.1 Model Code The purpose of the model code is to calculate the values in the system
matrix A. The values are determined by using geometry and physics to relate the contribution of the emission from each voxel to each detector. The effect of the measured attenuation is also incorporated. In the recent past A&PCT has used two methods to determine the system matrix, they are known as UCSF and APCT. II.B.3.1.2 Optimization Code
Iterative methods for image reconstruction generally proceed by successive minimization or maximization of an objective function. For example, given an accurate description of the system including the non-linear effects, minimizing the squared difference between the predicted and observed data will result in an accurate reconstruction. Several numerical algorithms exist for least squares minimization. Most proceed by moving down the gradient of the objective function, the sum of squared differences, for example, by steepest descent, by conjugate directions, or by successive projections. The last is termed ART for Algebraic Reconstruction Technique. Alternatively, one may consider the data obtained as the result of a stochastic process based on a Poisson probability distribution. For any given model of the object function, there is a certain probability of actually obtaining the measured data. The object function may then be reconstructed by varying the model to maximize
18
the probability of obtaining the measured data. Such algorithms go by the name of Maximum Likelihood-Expectation Maximization (MLEM).
Typically from each EROI, two regions (gross and background) are extracted from the passive energy spectrum for each ray sum. The reconstruction goal is to find the image that creates the net signal from the gross peak and background data. The MLEM method does not allow this to be done correctly. The best that can be done is to subtract the background from the gross peak signal and then search for the solution. This leads to the possibility of negative counts, which is a physical impossibility. The larger problem is that this method is statistically incorrect, since both signals are Poisson variables and they cannot be simply subtracted.
Another optimization technique, Constrained Conjugate Gradient (CCG), allows us to include both the peak and background and thus a better solution can be achieved.[GOO97] CCG allows for a maximum likelihood function to be created that correctly relates the background and peak signals. CCG is also not a pure steepest descent algorithm; therefore it converges to a solution faster. II.B.3.2 Code Development History
We have progressed from parallel-beam through fan-beam to a cone-beam geometric methods to reconstruct the passive CT data. The parallel-beam geometry method used an iterative, steepest-descent weighted, least-squares technique [HUE771 to reconstruct PCT images with attenuation corrections from the ACT image.[MARSla] The fan-beam work is described in [R.OB94]. Here, we only describe our development efforts for the 3-D methods. In order to determine the optimal method of image reconstruction and assay, our A&PCT codes have undergone a series of improvements. A schematic diagram of the 3D development is summarized in Figure II.B.3-2, and each method is described below. Il.B.3.2 .I UCSF-MLEM
The first 3D model code used by A&Pff was developed in collaboration with UCSF. This code referred to as UCSF-MLEM or ucsf3d, was adapted from a code specifically designed for medical imaging geometries. The line integral used to determine the attenuation is calculated on a voxel by voxel basis. The system matrix is essentially recalculated each time through the optimizer, in this case MLEM. It can also only use the MLEM optimization technique. that it was originally built with. Details of this code are provided by Brown, et al.[BR092] II.B.3.2.2 APCT-MLEM
There were several assumptions in the UCSF code which were valid for the medical imaging case, but not for the drum imaging problem. A detector collimated to receive radiation from a fine line through a source does not measure a simple projected density, but rather the photon counts decreased as the square of the distance between the emitter and the detector, l/R’, and decreased exponentially by absorption along the line of sight. In addition, the
19
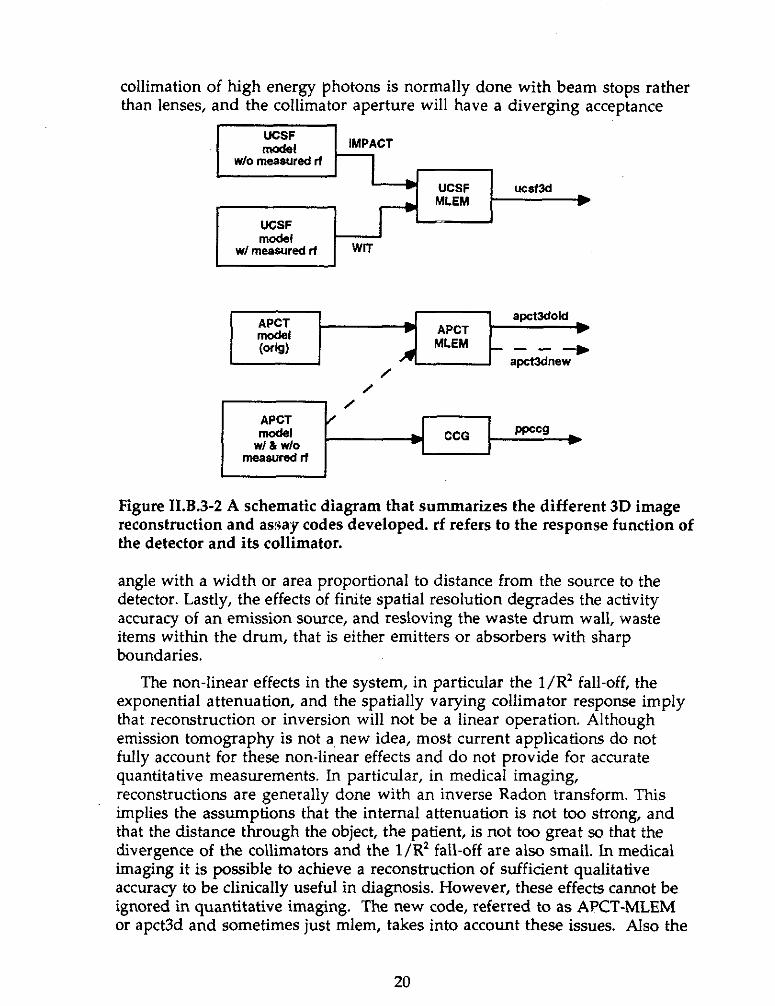
collimation of high energy photons is normally done with beam stops rather than lenses, and the collimator aperture will have a diverging acceptance
I UCSF model I IMPACT
APCT mcdel Wig)
apctzdoki w APCT l
MLEM - - _ --) apctadnew
/
Figure II.B.3-2 A schematic diagram that summarizes the different 3D image reconstruction and assay codes developed. rf refers to the response function of the detector and its collimator.
angle with a width or area proportional to distance from the source to the detector. Lastly, the effects of finite spatial resolution degrades the activity accuracy of an emission source, and resloving the waste drum wall, waste items within the drum, that is either emitters or absorbers with sharp boundaries.
The non-linear effects in the system, in particular the l/R* fall-off, the exponential attenuation, and the spatially varying collimator response imply that reconstruction or inversion will not be a linear operation. Although emission tomography is not a, new idea, most current applications do not fully account for these non-linear effects and do not provide for accurate quantitative measurements. In particular, in medical imaging, reconstructions are generally done with an inverse Radon transform. This implies the assumptions that the internal attenuation is not too strong, and that the distance through the object, the patient, is not too great so that the divergence of the collimators and the l/R’ fall-off are also small. In medical imaging it is possible to achieve a reconstruction of sufficient qualitative accuracy to be clinically useful in diagnosis. However, these effects cannot be ignored in quantitative imaging. The new code, referred to as APCT-MLEM or apct3d and sometimes just mlem, takes into account these issues. Also the
20
attenuation line integral is calculated with higher resolution w than that used in the UCSF-MLEM code.
The APCT system matrix is calculated once and stored. This allows other optimization techniques to be used with the same model code. Several combinations of the A&PCT model codes with different optimization codes (Model code-Optimization code) have been developed and can be summarized as follows:
l APCT-MLEM; l APCT-CCG;
l APCT-CCG w/ measured response function. The APCT-CCG w/measured response function code is the same as the APCT- CCG code except it allows the user to choose a calculated or measured point source (impulse) response function or calculate the response function from the data. This enables us to use one image reconstruction and assay code for both the WIT and IMPACT data. The CCG optimization code is briefly described below. II.B.3.2.3 APCT-CCG
We developed a new maximum likelihood based algorithm that maximizes the correct likelihood function based on the joint probability density functions for the peak and the background for each ray sum measurement. This avoids any physically unrealistic “negative counts” that must be set to zero in other estimation approaches to this problem, such as MLEM. The result of zeroing negative counts can bias assay estimates (i.e., results). This new method avoids this problem. The likelihood function is maximized by a novel constrained conjugate gradient algorithm that permits constraints on the estimates (such as non-negativity) at each voxel and uses a bending line-search technique to speed convergence. This algorithm has been successfully applied to several other constrained inverse problems at LLNLJREF]
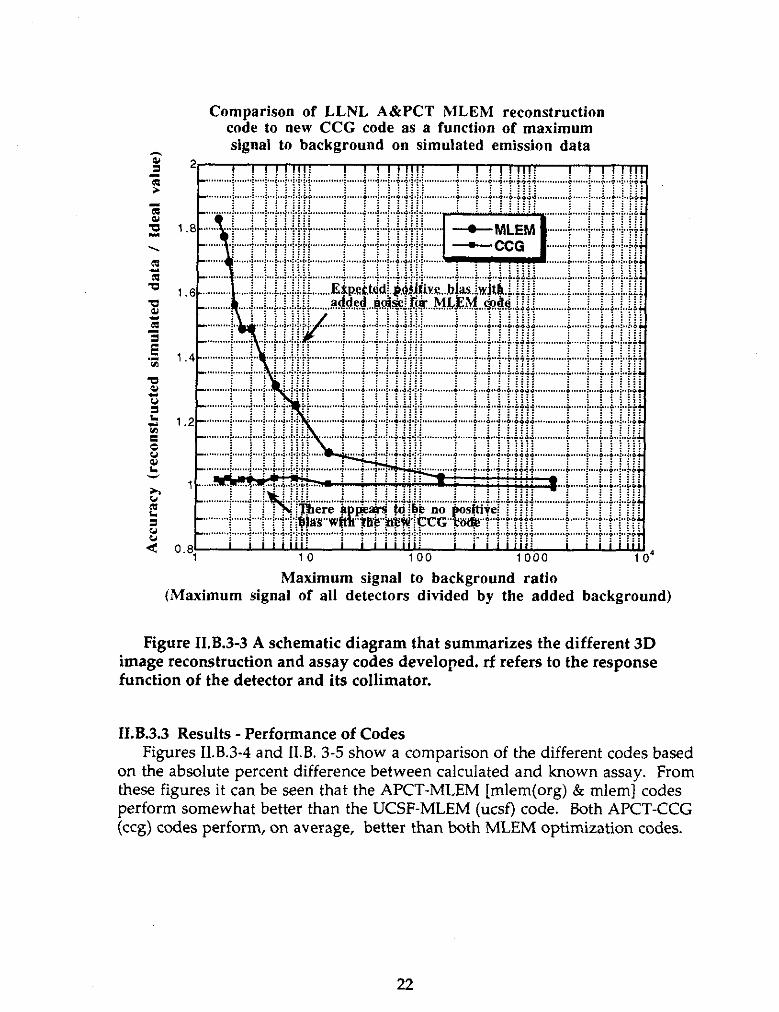
The graph in Figure 11.8.3-3 shows the results obtained when reconstructing simulated data with both the LLNL MLEM and CCG reconstruction codes, and when adding noise or background to the signal. The positive bias is expected with the MLEM code and there appears to be very little positive bias with the new CCG code. This is the result when reconstructing simulated data; however, this comparison must also be performed on real CT data before any conclusions are drawn. If the CCG codes proves to be as robust when applied to real CT data, then its significance when working with poor statistics (low drum loadings) will be that drum assay times can be reduced and throughput will be increased.
21
Comparison of LLNL A&PCT MLEM reconstruction code to new CCG code as a function of maximum signal to background on simulated emission data
Maximum signal to background ratio (Maximum signal of all detectors divided by the added background)
Figure II.B.3~3 A schematic diagram that summarizes the different 3D image reconstruction and assay codes developed. rf refers to the response function of the detector and its collimator.
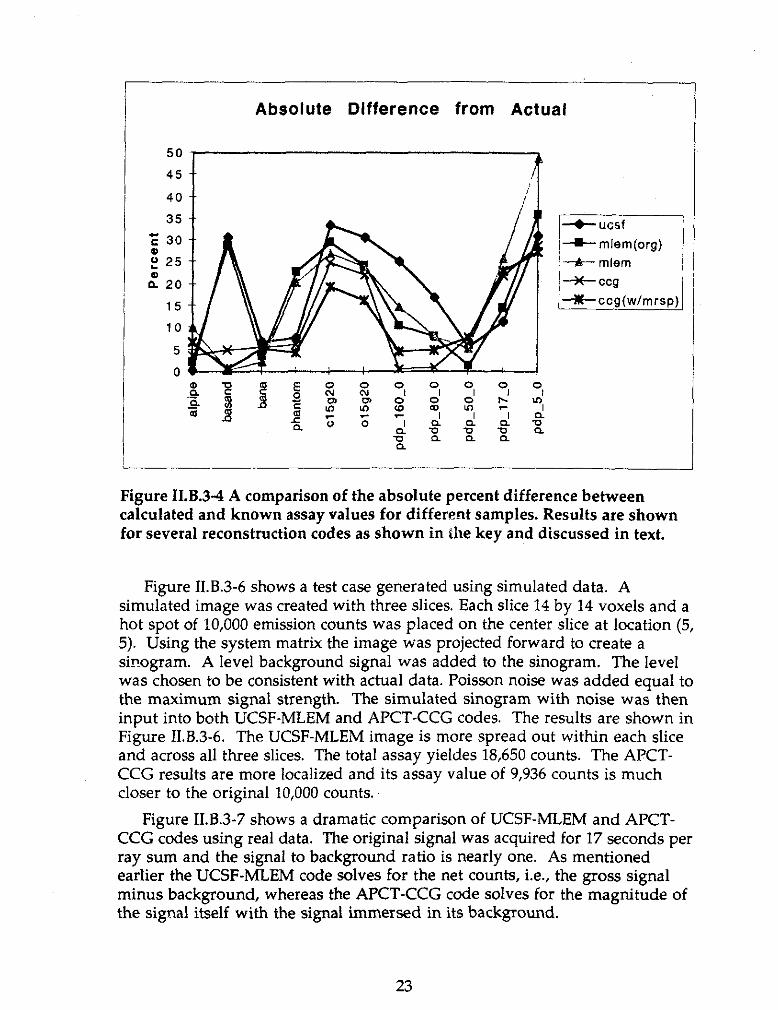
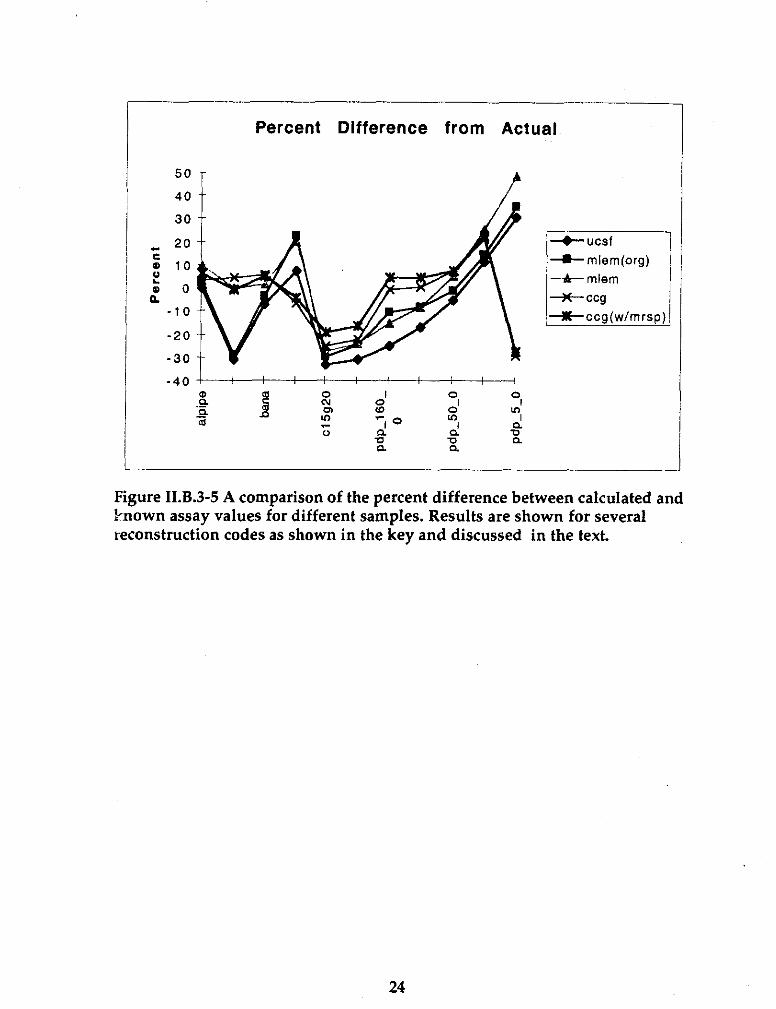
ILB.3.3 Results - Performance of Codes Figures ILB.3-4 and 1I.B. 3-5 show a comparison of the different codes based
on the absolute percent difference between calculated and known assay. From these figures it can be seen that the APCT-MLEM [mlem(org) & mlem] codes perform somewhat better than the UCSF-MLEM (ucsf) code. Both APCT-CCG (ccg) codes perform, on average, better than both MLEM optimization codes.
22
r
I
Absolute Difference from Actual
F I-+- mlem /*WJ I-N-ccg(w/mrsp)
Figure II.B.3-4 A comparison of the absolute percent difference between calculated and known assay values for different samples. Results are shown for several reconstruction codes as shown in the key and discussed in text.
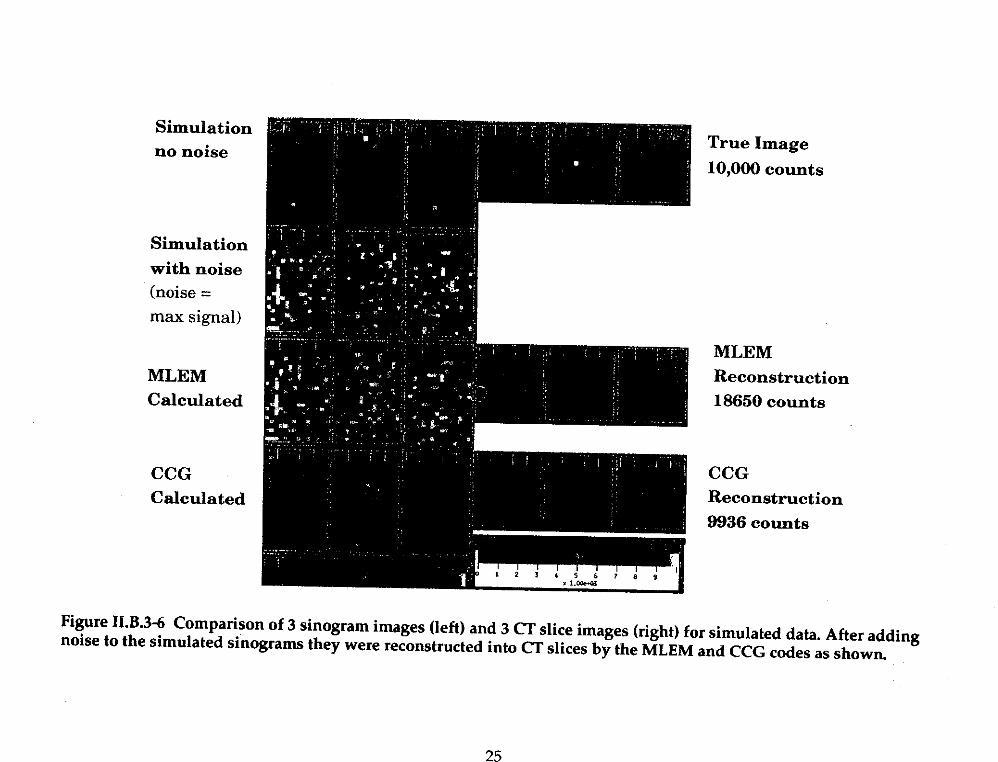
Figure II.B.3-6 shows a test case generated using simulated data. A simulated image was created with three slices. Each slice 14 by 14 voxels and a hot spot of 10,000 emission counts was placed on the center slice at location (5, 5). Using the system matrix the image was projected forward to create a sinogram. A level background signal was added to the sinogram. The level was chosen to be consistent with actual data. Poisson noise was added equal to the maximum signal strength. The simulated sinogram with noise was then input into both UCSF-MLEM and APCT-CCG codes. The results are shown in Figure 11.8.3-6. The ,UCSF-MLEM image is more spread out within each slice and across all three slices. The total assay yieldes 18,650 counts. The APCT- CCG results are more localized and its assay value of 9,936 counts is much closer to the original 10,000 counts..
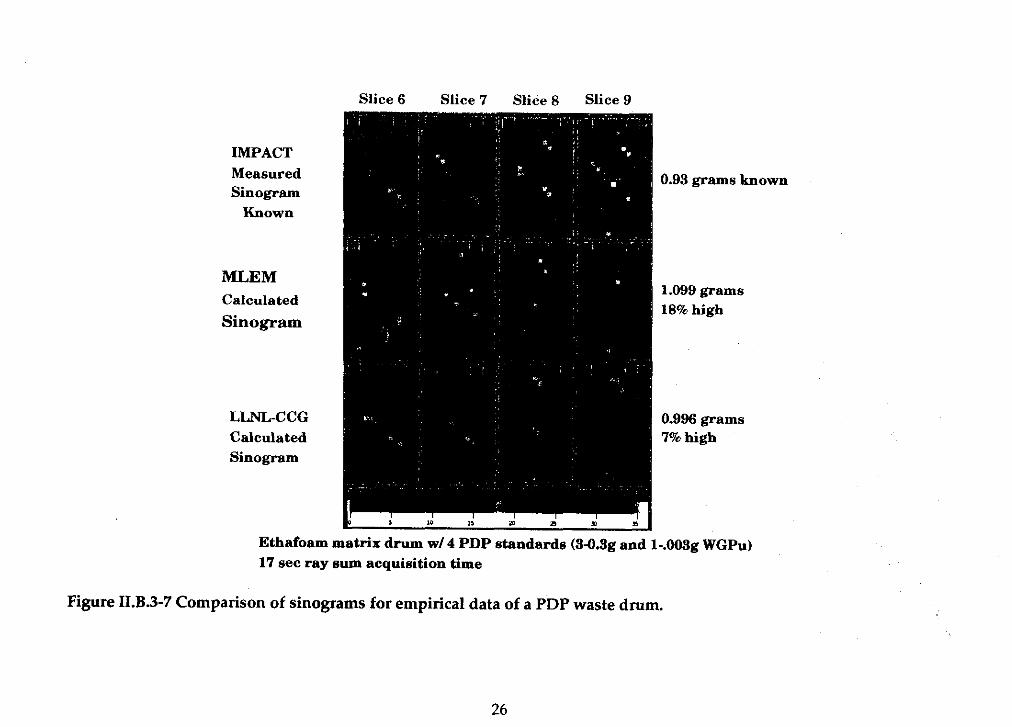
Figure 11.8.3-7 shows a dramatic comparison of UCSF-MLEM and APCT- CCG codes using real data. The original signal was acquired for 17 seconds per ray sum and the signal to background ratio is nearly one. As mentioned earlier the UCSF-MLEM code solves for the net counts, i.e., the gross signal minus background, whereas the APCT-CCG code solves for the magnitude of the signal itself with the signal immersed in its background.
23
40
30
20 +ucsf ; a 10 +mlem(org) f -* mlem
&tl 0 *ccg
-10 -X-ccg(w/mrsp) -20
-30
Percent Difference from Actual
5o T b
i
Figure II.B.3-5 A comparison of the percent difference between calculated and known assay values for different samples. Results are shown for several reconstruction codes as shown in the key and discussed in the text.
24
IMPACT Measured Sinogram
Known
MLEM Calculated Sinogram
LLNL-CCG Calculated Sinogram
Slice 6 Slice 7 Slice 8 Slice 9
0.93 grams
1.999 gram 18% high
0.996 gram 1% high
known
.S
IS
Ethafoam matrix drum WI 4 PDP standards (3-9.3g and l-.093g WGPu) 17 set ray sum acquisition time
Figure II.B.3-7 Comparison of sinograms for empirical data of a PDP waste drum.
26
I1.C Operational Configuration Over the past decade, LLNL has developed four A&PCT systems to
research and develop this technology. The first was a one-sixth scale system using a large aspect ratio (6O:l). This earlier system demonstrated clearly that one can use mono-energetic ACT to image the matrix attenuation and that this properly corrects the passive emission CT data to yield an accurate measure of the internal emission sources.[MAR92] The second system was a full-scale 208-liter scanner constructed at LLNL’s Site 300. This system was instrumental in the development of a protocol for the calibration, validation, simulation, testing and demonstration of the A&PCT technology.[ROB94]
Over the past five years we have developed two additional A&PCT systems to demonstrate this technology on real waste drums. These are LLNL’s IMPACT (Isotope Measurements by Passive and Active Computed Tomography); and BIR’s WIT/A&PCT (Waste inspection Tomography/Active and Passive Computed Tomography).
The IMPACT system is located at LLNL and its primary purpose is to further research and develop the A&PCT technology and to demonstrate and verify its concepts. It was not developed to assay real waste on a production basis; however, we have assayed a few real waste drums for demonstration purposes. Also, IMPACT officially participated in the third cycle of the National TRU Progam sponsored Performance Demonstaration, Program (PDP).
The WIT project is a collaborative effort between LLNL and Bio-Imaging Research (BIR), Inc., to integrate the A&PCT technology into a mobile trailer. The WIT system was developed to perform demonstrations of the A&XT technology and to become a certified production-mode assay system. The system has traveled to several different DOE facilities to perform demon- strations on known and real waste drums. The WIT system has participated in three formal DOE tests: (1) The fourth cycle of the PDF’; (2) A Rapid Commercialization Initiative (RCI); and (3) The Capability Evaluation Project (CEP). All of these test were conducted at INEEL.
XC.1 IMPACT Configuration A photograph and schematic of the IMPACT scanner is shown in Figure
II.C.l-1. It consists of two towers of interlocking space-frame aluminum tubing. One tower supports a 2.8-mCi Itim Ho (X200-yr half-life) radioactive gamma-ray source that is used for the active CT mode.[ROB94] The lernHo source produces gamma rays at l&t-, 280-, 365-, 411-, 530-, 712-, and 810-keV, and provides crucial, energy-specific, attenuation information for a range of items that reside within the waste matrix. We have found that the emitted peaks do not need to be exactly the same energy as any gamma-rays emitted from within the waste container because interpolation can be performed
27

between any two nearest neighboring active peaks that sandwich any emission peak of interest.
The other tower supports a sing]e well-collimated 90%~efficient (relative to a 3” x 3” NaI(TI) detector at 1.33 MeV) high purity germanium (HPGe) detector. The detector has a collimator with an aperture size of 50.8 mm in the horizontal and vertical dimension. The collimator also has an aspect ratio of 5:l. We have verified through experiments that this aspect ratio provides an accurate assay.[DEC96]
i : : !dnrmi j !
Ii 1
HPGe collimated detector
Figure II.C.l-1: A photograph and schematic of the IMPACT scanner.
The towers are designed to be versatile so that additional sources and detectors could be added to the scanner in the future. Between the two supporting towers is a three-axis staging system for drum manipulation. The staging system is capable of translating and elevating a 1000 pound waste drum 50 inches. In addition, the stage is capable of continuous or step wise rotating the drum through 360°. The drum manipulator was designed to be robust with safety features necessary for handling TRU waste in a seismically active area. Engineering safety notes were developed to cover all operations of scanning for quality and saftey controls.
A one-ton jib crane is located at one end of the scanner and provides easy and safe loading of the heavy drums. The crane is interlocked in a home position away from the drum manipulator to assure that the waste drum cannot be driven into the jib crane during system operation.
IMPACT uses a PC forsystem control and data acquisition. During both active and passive operations, the PC discretely positions the drum for data
28
acquisition. After positioning, it communicates with a multi-channel analyzer (MCA) that acquires data from the HPGe energy-discriminating detector. The detector integration time is a preset variable and depends on the amount of activity within the drum and the attenuating waste matrix. When the counting integration time is completed for each ray sum, the control computer downloads the MCA’s data and stores selected energy regions of interest and/or the entire spectrum onto a system disk. After data storage, the drum is moved to the next ray sum and another ray sum integration is obtained.
For the active mode, IMPACT translates the drum in 50.Smm increments for each ray sum after the specified count integration. A 55-gallon (208-L) drum is translated 14 times over a distance of 711.2 mm and then rotated approximately 8.5’ (21 rotations over 180”). Each set of 14 ray sums make up a projection. After each rotation, the next projection is acquired. After completion of all 21 projections the drum is elevated 50.8 mm and 21 new projections are measured for the next slice plane. The drum is elevated 18 times to completely assay a 208-liter drum.
For passive mode data collection, the drum is translated to obtain only 7 ray sums over a distance of 711.2 mm. Next the drum is rotated 36’ since there are only 10 projections required over 360’ for each slice. The drum is correctly sampled in the passive mode with fewer ray sums and projections because of the large acceptance angle of the detector’s collimator aperture. The acceptance angle of the aperture is larger in the passive mode than in the active mode. Once again IMPACT requires 18 slice planes to image a completely full 208-liter drum.
The data acquired from IMPACT is processed, reconstructed, and analyzed on a UNIX based work station. A UNIX file system is mounted by the PC and data are transferred over an ethernet cable. Roth the energy regions of interest (EROI’s) and/or spectra that represents each individual ray sum are transferred.
The EROI data is simply the integrated photon counts within an energy peak of interest minus the background to produce a net value of activity for some specified integration time. The EROI is set prior to the assay on the known energy peaks of the active or emission sources. The EROI data is processed and reconstructed without any need for further isotopic analysis, since we mainly focused on weapons grade Pu during the development phases of this work. The disadvantage of using the EROI data for the A&PCT reconstruction is that the type of emission sources that are being evaluated within the drum must be known prior to the assay. This may not be the caSe for all waste drums being assayed; therefore, there is an additional option to save the spectra acquired for each ray sum. As previously mentioned, this option has been used to determine the isotopics ratios of the waste drum prior to image reconstruction and final assay. II.C.l.1 Calibration of IMPAa
29
0~ paal has3s been to design a gamma-ray waste drum nondestructive assay ~s=nolo~ that does not require special calibration as a function of the type g wiaste rzznatri x, the type of gamma-ray radioactive sources within the drum.. -m, distrjbution of the waste matrix, or the distribution of the radicaXxi% SOUZZ ces. ~ov,%v;es of.
Livermore’s A&PCT technology does not require prior ..3nd calibration for, the waste stream that~ is being assayed. For
t& FT’P: ‘+e% we could calibrate the A&PCT scanners using drum matrices and murccce strtzctures that are similar to the PDP drums and attain assay res& m;at are ~- much more accurate; however, something as simple as remm:mg the trouble steel container used to seal the reference sources (this may be- htg cm in a real waste drum) could make a difference in the final assa:- -ronults. Xnat is why we consider it important to assay waste matrices and sour= srructurrs of all kinds and remove the dependency on calibration pr-~nr~. It .-nas been our conviction that the A&PCT technology is required for w-~ strear=ms that are unknown or are suspected of containing something othm &zm whzz is documented on the manifests. The A&PCT technology on& i-e*- =. total understanding of the physics of the measurement process and the &soluzze efficiency of the HPGe detector provide an absolute nodmctive assay measurement of waste drums.
To at;ain .ZIY absolute assay measurement, the A&PCT systems are cat&r& oncr+ on an absolute detector-efficiency scale by simple mesurrmen& of a calibrated radioactive point source. We do not need ad&noral catiations for different Pu gram-loadings or matrices. We can do w be-se the+ computed tomography method takes into account the gmmetrgi- of the source and detector and their collimators.
Parr ti?e IMF~CT scanner at LLNL our large-volume HpCe detector has a &am&er of 7.6 ZIJ (3-m.); the collimator aperture is a 5.08 (Z-in.) by 5.08 (Z-in.) square and is 3.4 cm (10-h) long. This means that any unscattered gamma rays tfaat are accepted by the collimator aperture will strike a reasonable votunte of gerznanium, i.e., all unscattered gamma-rays strike the detector. Furthermore, hcause the collimator is lo-inches long the incident angles of the photons =e dose to being normal to the detector surface. This makes the probabilik ?or the detection of a gamma-ray by the detector approximately propornonal tc the collimator acceptance.
The reconscJction code accounts for the collimator acceptance during image reconstr;;ction and assay. The simple geometry of our system makes this rather straightforward. The proportionality factor can be determined by measuring a &ibrated radioactive point source on the axis of the collimator at various distances. For this geometry we can calculate the solid angle of the collimator and compare it to the measured efficiency. For gamma rays at 400 kev this calibration factor is about 0.5 and since we use a multi-energy source we can calibrate for all the gamma-ray energies of interest. This calibration procedure is performed once prior to system operation and only takes a few hours to cnmplete.
30
In either system the calibration only needs to be done once since it only changes if the collimator is changed or if the detector develops problems. (The detector performance is easily verified by examination of the active data in each run.) II.C.l.2 Validation of IMPACT
In order to validate the system we perform measurements on several known test cases. These cases range from simple tests such as point sources without attenuators, within uniform attenuators to more difficult studies such as using very dense mock “sludge” drums. Validation of the single- detector A&PCT scanner was accomplished through an analysis of experiments on mock-waste drums containing well-calibrated radioactive sources. The validation process also included characterization of WIPP Performance Demonstration Program (PDP) drums and sources when they became available.
We performed a series of experiments to demonstrate the performance of the A&PCT method for characterizing radioactive waste drums. Our first experiments focused on the ability to correct passively measured data with an ACT (active) attenuation map. These experiments include a reference PCT scan acquired with only a passive CT source, i.e. no drum or waste items were present; hence, there was no attenuation of the source. Then, passive CT measurements were taken using a 208-L drum filled with one or more mock- waste matrices and their results were compared to the bare-source PCT reference scans. Thus, the success of our preliminary measurements was not the agreement of an absolute assay with the known activity of the source(s); but rather, how well we were able to correct for attenuation by the drum and the various mock-waste matrices. This was determined by comparing the corrected PCT images to the reference scans.
Additional sets of measurements were obtained to study the A&PCT reconstruction algorithm(s) and their ability to perform an absolute measurement. These measurements were performed with calibrated passive sources (e.g. 133Ba) and no waste matrix (corrected with null matrix); simple uniform attenuators (e.g. aluminum cylinders); or mock-waste drums with complicated waste matrices. Measurements acquired using the PDP drums provide a final validation of the A&PCT technique
The validation/baseline includes the following measurements: - Empty drum-used to determine background; - Point source with no attenuators-simple assay check; - Point source with a uniform Al attenuator-assay
check with uniform, low attenuation; - Point source with a uniform sand matrix-assay check
with uniform, high attenuation. - Point source with a heterogeneous attenuator-
rotational verification and assay check with non- uniform attenuation.
31
All of these measurements were used to check/verify the data acquisition hardware and software, the gamma-ray spectral analysis, and the image reconstruction for nondestructive assay determinations. Once these were shown to be correct, we investigated A&PCT assays of mock-waste drums. In general our approach was to use these simpler mock-waste drums with known radioactive sources to carry out initial A&PCT scans, then move to the use of “calibration” drums used to calibrate LLNL’s SGS system, and finally, use PDP drums when they became available.
Once completed, none of the above experiments have to be performed on a continuous basis unless the IMPACT system hardware or software goes through a major change, or unless a different data acquisition protocol is chosen or required. Changes to the gamma-ray spectral analysis software or image reconstruction software does not require that any data from the above experiments be re-acquired. The existing data is simply rerun through any new software developed. Once these experiments were shown to be successful, and we had run a sufficient number of experiments to approach the WlPP WAC criteria, then we were ready to assay real-waste drums.
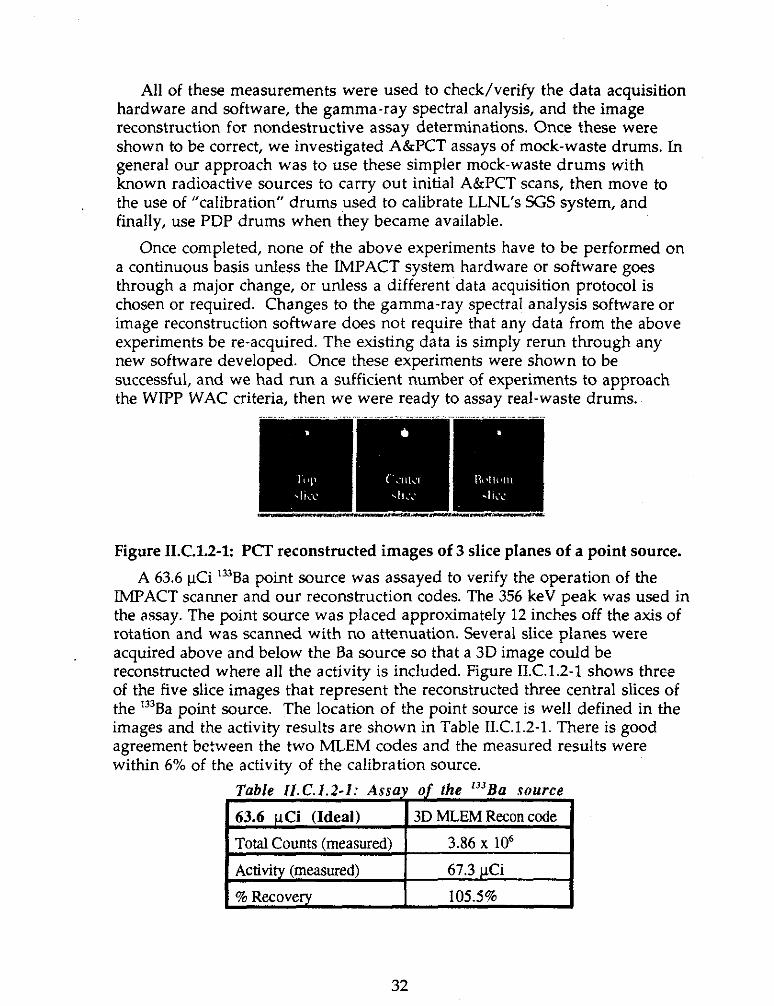
Figure II.C.l.Z-1: PCT reconstructed images of 3 slice planes of a point source. A 63.6 uCi ‘=Ba point source was assayed to verify the operation of the
IMPACT scanner and our reconstruction codes. The 356 keV peak was used in the assay. The point source was placed approximately 12 inches off the axis of rotation and was scanned with no attenuation. Several slice planes were acquired above and below the Ba source so that a 3D image could be reconstructed where all the activity is included. Figure II.C.l.Z-1 shows three of the five slice images that represent the reconstructed three central slices of the 13aBa point source. The location of the point source is well defined in the images and the activity results are shown in Table II.C.l.Z-1. There is good agreement between the two MLEM codes and the measured results were within 6% of the activity of the calibration source.
Table Il.C.1.2-1: Assay of the 13’Ba source ,
63.6 FCi (Ideal) 3D MLEM Recon code Total Counts (measured) 3.86 x lo6 Activity (measured) 61.3 uCi % Recovery 105.5%
32
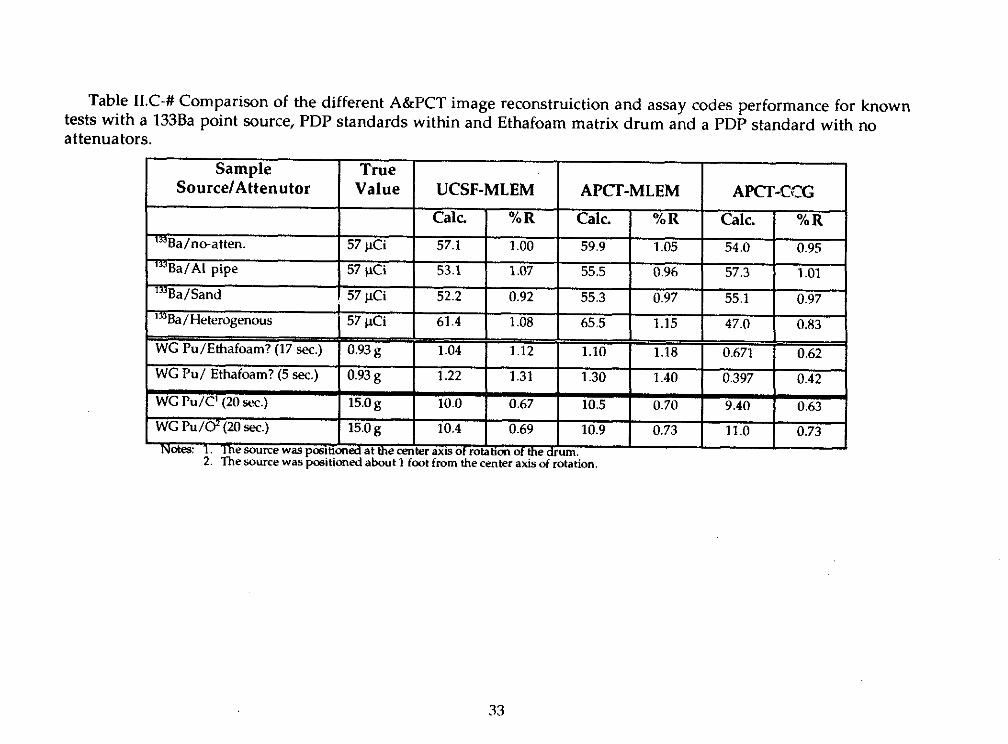
Table KC-# Comparison of the different A&KIT image reconstruiction and assay codes performance for known tests with a 133Ba point source, PDF’ standards within and Ethafoam matrix drum and a PDP standard with no attenuators.
APO’-MLEM
33
II.C.2 WIT/A&PCT Configuration We have performed work as a subcontractor to Bio-Imaging Research Inc.,
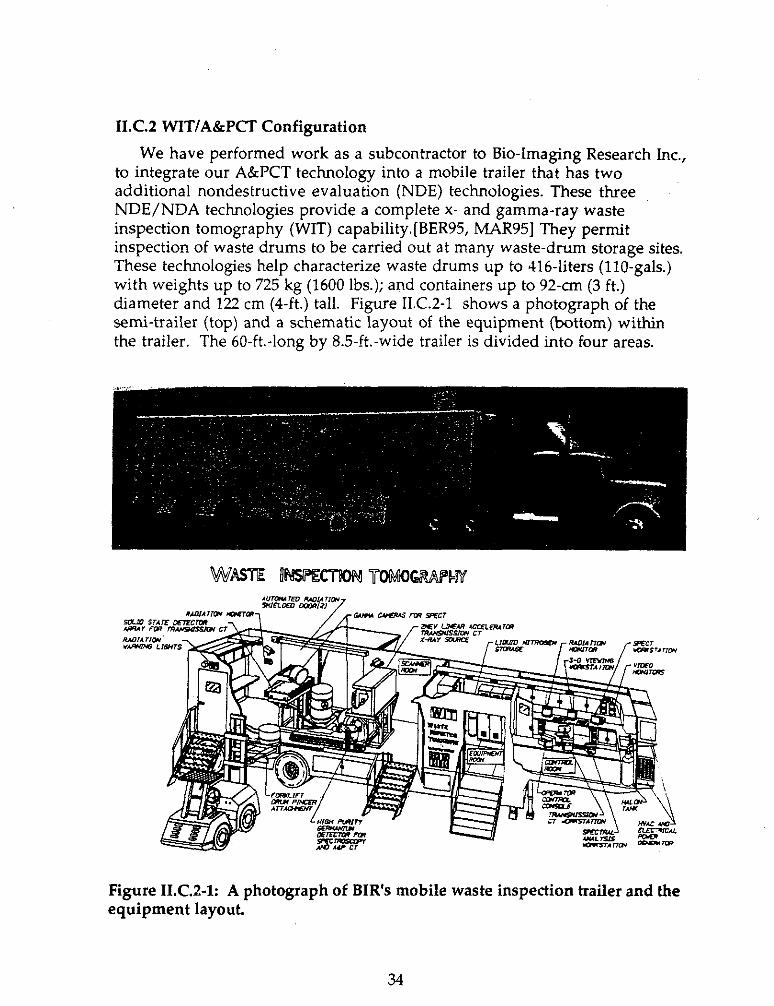
to integrate our A&PCT technology into a mobile trailer that has two additional nondestructive evaluation (NDE) technologies. These three NDE/NDA technologies provide a complete x- and gamma-ray waste inspection tomography (WIT) capability.[BER95, MAR951 They permit inspection of waste drums to be carried out at many waste-drum storage sites. These technologies help characterize waste drums up to 416-liters (IlO-gals.) with weights up to 725 kg (1600 lbs.); and containers up to 92-an (3 ft.) diameter and 122 cm (4-ft.) tall. Figure II.C.2-1 shows a photograph of the semi-trailer (top) and a schematic layout of the equipment (bottom) within the trailer. The 60-ft.-long by 8.5ft.-wide trailer is divided into four areas.
r
I
Figure II.C.2-1: A photograph of BIR’s mobile waste inspection trailer and the equipment layout.
34
.
The rear area prtovides space for two 160-L liquid nitrogen containers, calibration and phantom drums, a 60k BTU heating and air-conditioning unit, and storage lockers. The next area is dedicated to drum inspection and contains a 2-Mew linear accelerator for transmission computed tomography (TCT) and/or d@tal radiography (DR). This accelerator is supported by 896 cadmium-tungstzate, solid-state detectors mounted in an array on individual photodiodes witth septa between each detector to minimize cross talk, in- plane scatter and blooming. To measure emitted gamma-rays, there are two large, collimated., sodium-iodide [NaI(Tl)] detectors similar to Anger cameras used in nuclear -medicine for single photon emission CT or SPECT. To identify gamma-+ay isotopics there is a highly collimated high-purity germanium @LPGe) detector. A collimated 1.4-mCi l@jmHo radioactive source is also available to obtain energy specific attenuation data in the active mode. The third area is an equipment room and entry/exit to the trailer. The mqst forward area contains all of the supporting electronics and a control room where waste insipection personnel use several computer terminals to operate the NDE/NDA measurement technologies.
The WIT/A&F’CT system is similar to LLNL’s IMPACT system with some minor variatiom. The staging system of lMPACT manipulates the drum only during data acquisition. The WIT/A&PCT staging rotates and elevates the drum. For ACT tie source and detector are pair wise translated instead of the drum. For PCT omly the detector is translated. There is no difference in the data that is stor& when translating the source/detector pair instead of the drum.
Due to spatial limitations within the WIT trailer it was not possible to use a detector collimator with an aspect ratio of 1O:l (5.2 cm x 5.2 cm square aperture and 10 cm length). A detector collimator with an aspect ratio of 5:l was designed with the provision of using septa to increase the aspect ratio to obtain the required collimator aspect ratio of 5:l. Septa are highly attenuating, dividing-plates that run the length of the collimator. These plates help collimate the gamma-ray beam, and provide an effective aspect ratio that is better than that provided by the aperture size alone. All other parameters of the WIT scanner are the same as those used for the IMPACT scanner.
II.C.2.1 Calibration of WITIA&PCT For the BIR/WIT system a similar calibration method to that used for
IMPACT is employed; however it is slightly complicated by the use of septa in the shorter collimator. For this system we measure detector response functions from a calibrated source of multiple energy gamma-rays. The response functions are obtained from a series of measurements with the source on the center axis of rotation and displaced from this axis by various amounts. Typically, we measure three response functions - near center and far with a Eu-152 source at approximately 30,50 and 70 cm from the detector colimator front face. The reconstruction code then folds the appropriate geometric response function (for generally the 344-keV peak from Eu-152)
35
into the calculation of the probability for detecting a gamma-ray emitted from any voxel in the field of view. II.C.2.2 Validation of WIT/A&PCT
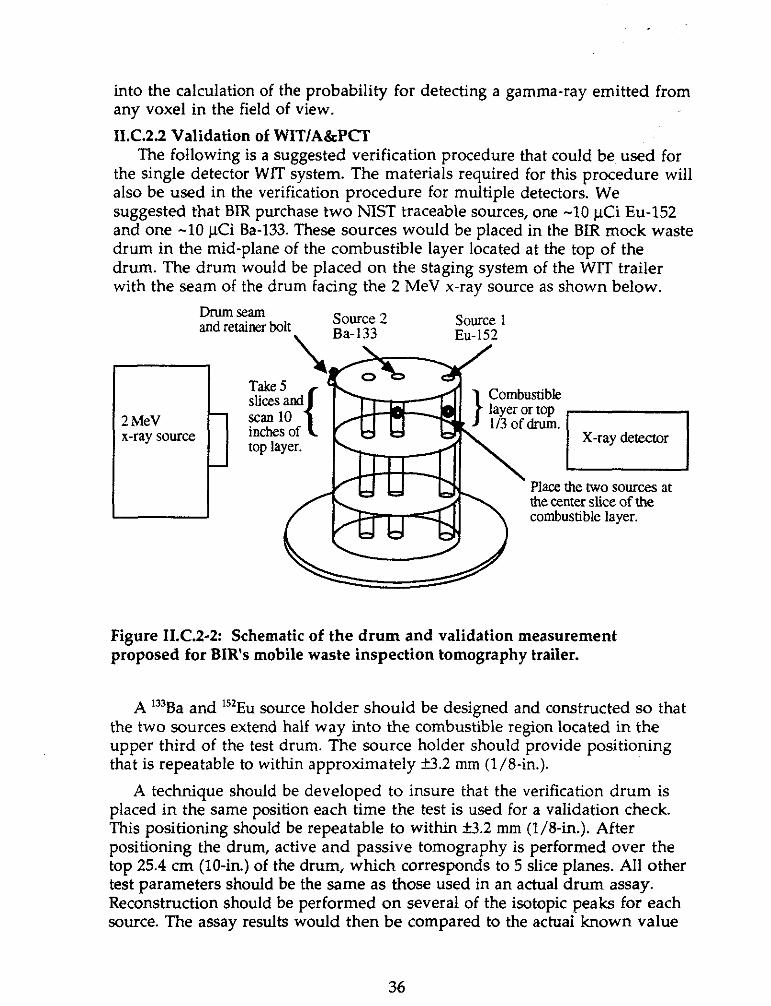
The following is a suggested verification procedure that could be used for the single detector WIT system. The materials required for this procedure will also be used in the verification procedure for multiple detectors. We suggested that BIR purchase two NIST traceable sources, one -10 pCi Eu-152 and one -10 uCi Ba-133. These sources would be placed in the BIR mock waste drum in the mid-plane of the combustible layer located at the top of the drum. The drum would be placed on the staging system of the WIT trailer with the seam of the drum facing the 2 MeV x-ray source as shown below.
Dnunseam and retainer bolt Source 2 source 1
\ Ba-133 Eu-152
Kh”’ / Xeray demr 1
’ Place the two sources at the center slice of the combustible layer.
Figure II.C.2-2: Schematic of the drum and validation measurement proposed for BIR’s mobile waste inspection tomography trailer.
A ‘33Ba and 15’Eu source holder should be designed and constructed so that the two sources extend half way into the combustible region located in the upper third of the test drum. The source holder should provide positioning that is repeatable to within approximately fl.2 mm (l/8-in.).
A technique should be developed to insure that the verification drum is placed in the same position each time the test is used for a validation check. This positioning should be repeatable to within f3.2 mm (1/8-m.). After positioning the drum, active and passive tomography is performed over the top 25.4 cm (lo-in.) of the drum, which corresponds to 5 slice planes. All other test parameters should be the same as those used in an actual drum assay. Reconstruction should be performed on several of the isotopic peaks for each source. The assay results would then be compared to the actual known value
36

of the two sources (compensating for the half-life) and compared to previous measurements. A visual inspection of the reconstructed emission image would also identify any problems with the assay equipment and software. The reconstructed images should look the same for each verification assay if the sources and drum are placed in the same positions prior to the examination and all positioning are reporduced as designed. An example of what the reconstructed emission images should look like are shown below.
Reconstruction of Reconstruction of Ba-133 356-keV peak. Eu- 152 41 I-kev peak.
Figure II.C.2-3: Schematic of the expected CT slice results for the proposed BIR validation drum procedure shown in figure 11X.2-2.
A combination of comparing the measured reconstructed assay values to known and previously measured values and verifying visually the placement of the two sources should reveal any significant problem that might exist in the A&PCT system.
III. A&PCT Performance We have carried out numerous tests of the A&PCT technology on
surrogate and real-TRU waste drums. Both the IMPACT and the WIT/A&PCT systems were calibrated, validated and used to measure real wastes at the LLNL. WIT/A&PCT was demonstrated, tested and evaluated at three sites: (1) The Rocky Flats Environmental Technology Site (RFETS); (2) Two separate occasions at the INEEL; and (3) Most recently at the Nevada Test Site.
At LLNL, many of the drums contained multiple 4 and 20-liter (1 and 5- gallon) containers of solidified chemical radioactive wastes. The RFETS wastes were all low-density combustible matrices. At INEL the wastes included both lead-lined and normal drums containing waste matrices of graphite, glass, metals, wet and dry combustibles and sludge. In almost all cases plutonium loading of these drums ranged from 1 to 100 grams of 239Pu.
37
r
For this report, it is most useful to specify the A&PCT performance as a function of known waste configurations and emission sources assayed using both the IMPACT and WIT scanners. It is important to note that these two scanners do not use exactly the same configuration6 over all testing campaigns; however, they do not differ in any significant ways that would invalidate intercomparison. Requirements and performance criteria used to evaluate IMPACT and BIR WIT/A&PCT are presented in the next section.
1II.A Requirements and Performance Criteria An NDA waste assay system’s utility is defined in terms of its ability to
comply with the requirements and quality assurance objectives for nondestructive assay as delineated in the National TRU Program (NTP) Quality Assurance Program Plan (QAPP).[QAP96] The QAPP identifies the quality of data necessary to meet the specific data quality objectives associated with the Department of Energy’s (DOE) Waste Isolation Pilot Plant (WIPP) transuranic (TRU) waste characterization program. Two parameters describing the waste must be determined; the total alpha activity and the activity of the individual isotopes present. The quality assurance objectives (QAOs) for precision (“7 relative standard deviation), accuracy (% recovery), minimum detectable concentration (MDC), completeness, and total bias are stated in the QAPP. These parameters must be demonstrated over the spectrum of waste form configurations the assay system is intended to characterize.
The QAPP also requires that facilities intending to use NDA methods to generate data for the National TRU program participate in a performance demonstration program (PDP). The PDF program is designed as an independent quality assurance test to provide data that supports the overall QAPP compliance assessment process. The PDP program parameters, criteria and scoring formalism is used in the following sections to document the IMPACT and WIT/A&PCT performance where applicable. Additionally, the RCI and CEP performance tests utilized criteria and scoring formalism found in the PDP criteria, but are slightly different as described below.
Utility is further evaluated relative to the spectrum of waste form configurations that the different assay system techniques can accommodate. The performance of IMPACT and WIT/A&PCT are derived from the data acquired during their blind tests. The performance evaluation tests are identical to, or derivatives from, the primary QAPP compliance requirements and support a direct interpretation of IMPACT and WIT/A&PCT performance results. Thus, the IMPACT and WIT/A&PCT performance measures can be readily interpreted relative to the QAPP requirements. The criteria of these various programs are listed next.
6 Since the work presented here has mainly been an R&D effort the scanner configuration including hardware and software has evolved over time and it would be very difficult to describe all of the exact configurations used throughout all of the test data sets shown.
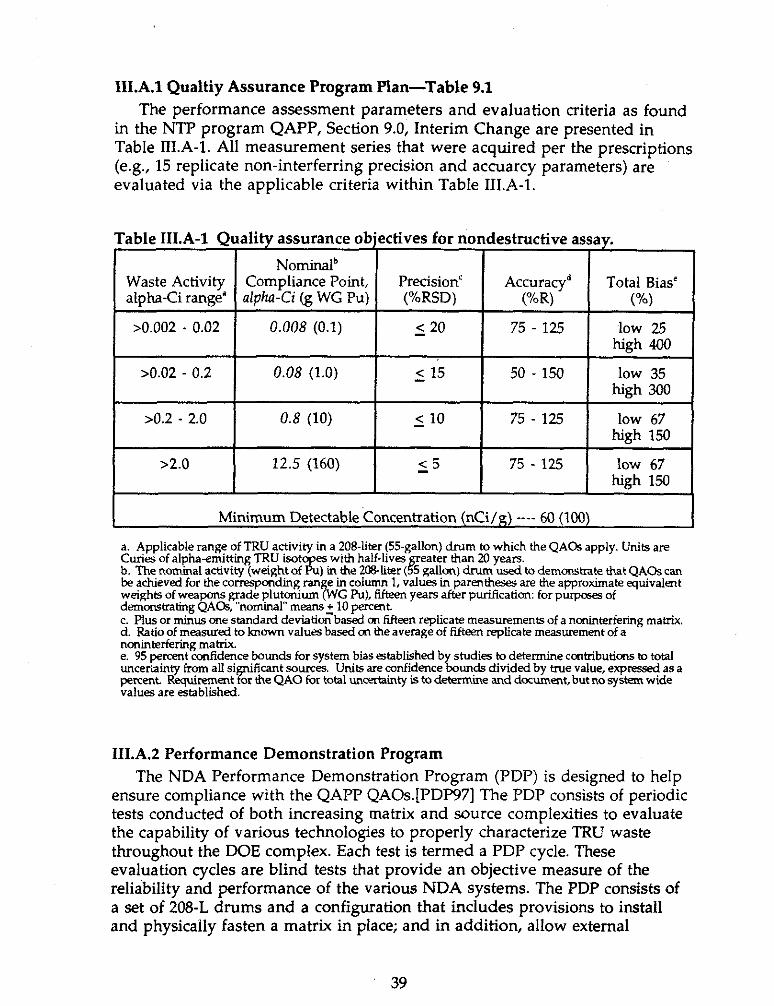
III.A.l Qualtiy Assurance Program Plan-Table 9.1 The performance assessment parameters and evaluation criteria as found
in the NTP program QAPP, Section 9.0, Interim Change are presented in Table IILA-1. All measurement series that were acquired per the prescriptions (e.g., IS replicate non-interferring precision and accuarcy parameters) are evaluated via the applicable criteria within Table IILA-1.
Table IILA-1 Oualitv assurance obiectives for nondestructive assav. Nomird
Waste Activity Compliance Point, Precision’ I
Accura$ Total Bias’ alphaCi range” alpha-Ci (R WG Pu) (%RSD) (%R) (“4 I
1 >0.002 - 0.02 1 0.008 (0.1) 1 (20 1 75 - 12.5 I I >0.02 - 0.2
>0.2 _ 2.0
>2.0
0.08 (1.0) ( 15 50 - 150 low 35 high 300
0.8 (10) ( 10 75-125 low 67 high 150
22.5 (160) (5 75 -125 low 67 high 150
Minimum Detectable Concentration (nCi/g) ---- 60 (100)
a. Applicable range ?f TRU a$vity in a ?084ter (55.gallon) drum to which the QACk apply. Units are znietie dafal~av~~~~h~~~wth half-lives~eater than 20 yeas
) in the 2CMiter ( 5 wllon) drum used to demcmseate that QACB can be achieved for the cormspending range in column 1, values in parentheses are the approximate quivalent weights of weapons grade plutonium (WC Pu), fifteen years after purification: for purpcsg of demoratiating QAaS, “nominal” means 2 10 percent. c. Plus or minus one standard deviaticn based cm tifteen replicate measurements of a noninterfering matrix. d. Ratio of measurexl to known values based on the averaee of tifteen reolicate measurement of a
e. 95 percent mntidence bounds for system bias established b studies to determine contributions m total uncenainty from all si ‘ticant sources. Units are confidence
T K.3 unds
percent Requirement oc dw QAO for total uncvtainty is to d etermine divided by true value, expressed as a
values are established. and document, but no system wide
III.A.2 Performance Demonstration Program The NDA Performance Demonstration Program (PDP) is designed to help
ensure compliance with the QAPP QAOs.[PDP97] The PDF consists of periodic tests conducted of both increasing matrix and source complexities to evaluate the capability of various technologies to properly characterize TRU waste throughout the DOE complex. Each test is termed a PDF cycle. These evaluation cycles are blind tests that provide an objective measure of the reliability and performance of the various NDA systems. The PDP consists of a set of 208-L drums and a configuration that includes provisions to install and physically fasten a matrix in place; and in addition, allow external
39
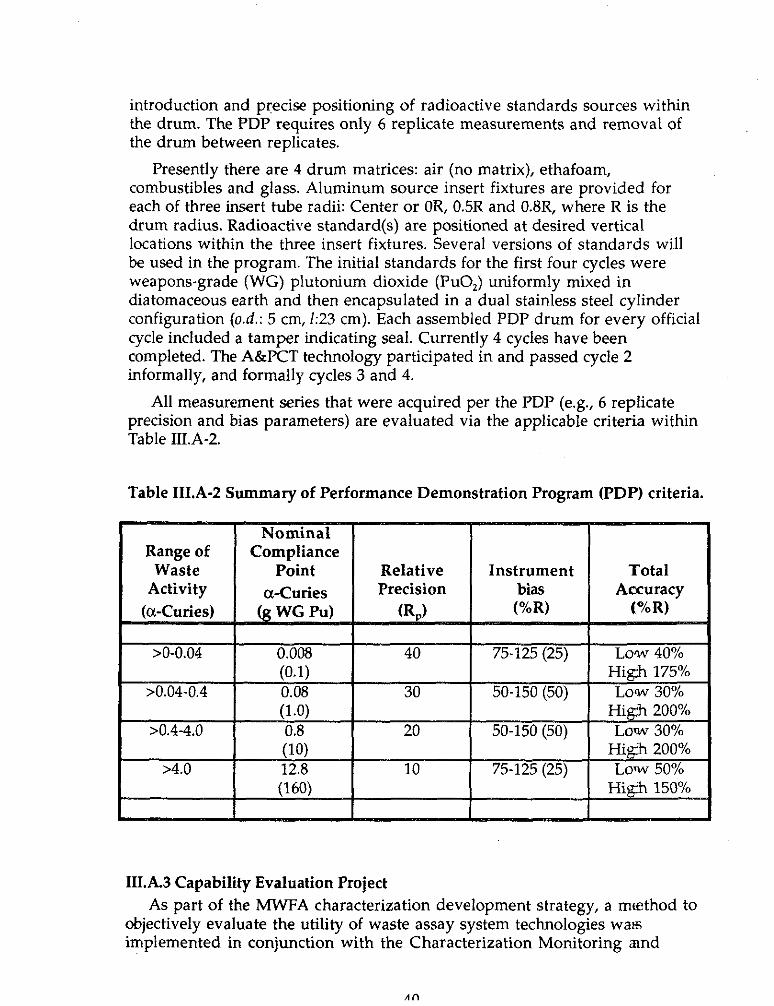
introduction and precise positioning of radioactive standards sources within the drum. The PDP requires only 6 replicate measurements and removal of the drum between replicates.
Presently there are 4 drum matrices: air (no matrix), ethafoam, combustibles and glass. Aluminum source insert fixtures are provided for each of three insert tube radii: Center or OR, 0.5R and 0.8R, where R is the drum radius. Radioactive standard(s) are positioned at desired vertical locations within the three insert fixtures. Several versions of standards will be used in the program. The initial standards for the first four cycles were weapons-grade (WG) plutonium dioxide (PuO,) uniformly mixed in diatomaceous earth and then encapsulated in a dual stainless steel cylinder configuration (o.d.: 5 cm, 123 cm). Each assembled PDP drum for every official cycle included a tamper indicating seal. Currently 4 cycles have been completed. The A&PCT technology participated in and passed cycle 2 informally, and formally cycles 3 and 4.
All measurement series that were acquired per the PDP (e.g., 6 replicate precision and bias parameters) are evaluated via the applicable criteria within Table IILA-2.
Table MA-2 Summary of Performance Demonstration Program (PDP) criteria.
III.A.3 Capability Evaluation Project As part of the MWPA characterization development strategy, a m&hod to
objectively evaluate the utility of waste assay system technologies wars implemented in conjunction with the Characterization Monitoring amd
nn
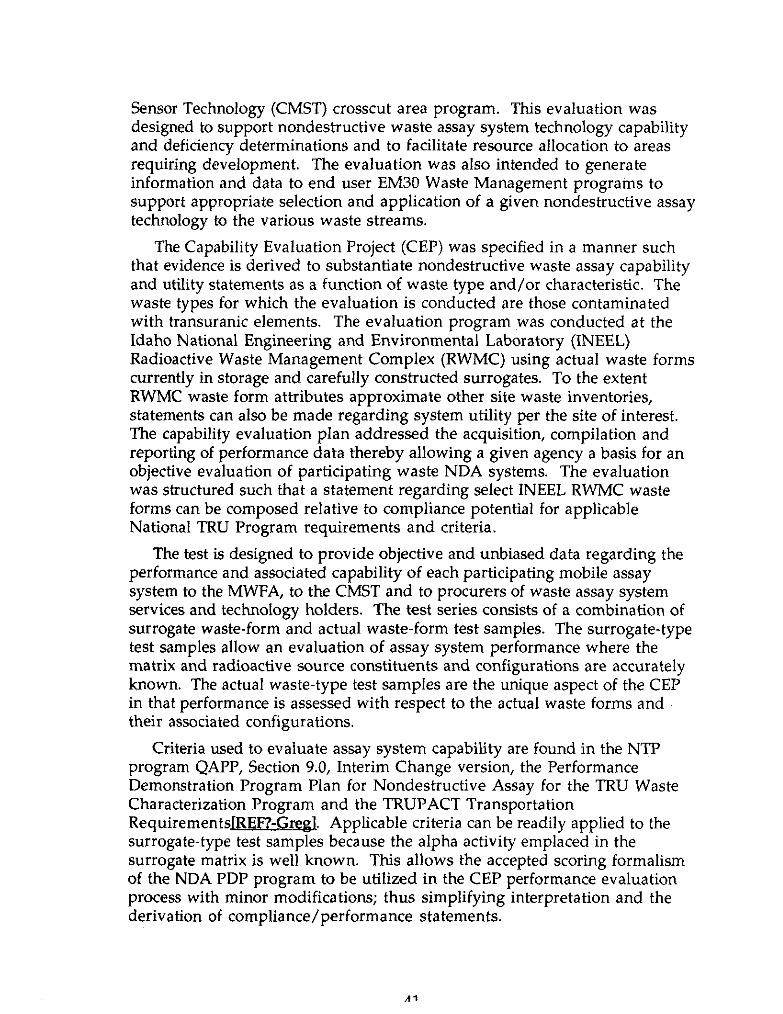
Sensor Technology (CMST) crosscut area program. This evaluation was designed to support nondestructive waste assay system technology capability and deficiency determinations and to facilitate resource allocation to areas requiring development. The evaluation was also intended to generate information and data to end user EM30 Waste Management programs to support appropriate selection and application of a given nondestructive assay technology to the various waste streams.
The Capability Evaluation Project (CEP) was specified in a manner such that evidence is derived to substantiate nondestructive waste assay capability and utility statements as a function of waste type and/or characteristic. The waste types for which the evaluation is conducted are those contaminated with transuranic elements. The evaluation program was conducted at the Idaho National Engineering and Environmental Laboratory (INEEL) Radioactive Waste Management Complex (RWMC) using actual waste forms currently in storage and carefully constructed surrogates. To the extent RWMC waste form attributes approximate other site waste inventories, statements can also be made regarding system utility per the site of interest. The capability evaluation plan addressed the acquisition, compilation and reporting of performance data thereby allowing a given agency a basis for an objective evaluation of participating waste NDA systems. The evaluation was structured such that a statement regarding select INEEL RWMC waste forms can be composed relative to compliance potential for applicable National TRU Program requirements and criteria.
The test is designed to provide objective and unbiased data regarding the performance and associated capability of each participating mobile assay system to the MWFA, to the CMST and to procurers of waste assay system services and technology holders. The test series consists of a combination of surrogate waste-form and actual waste-form test samples. The surrogate-type test samples allow an evaluation of assay system performance where the matrix and radioactive source constituents and configurations are accurately known. The actual waste-type test samples are the unique aspect of the CEP in that performance is assessed with respect to the actual waste forms and their associated configurations.
Criteria used to evaluate assay system capability are found in the NTP program QAPP, Section 9.0, Interim Change version, the Performance Demonstration Program Plan for Nondestructive Assay for the TRU Waste Characterization Program and the TRUPACT Transportation RequirementslREF?-Greel. Applicable criteria can be readily applied to the surrogate-type test samples because the alpha activity emplaced in the surrogate matrix is well known, This allows the accepted~ scoring formalism of the NDA PDP program to be utilized in the CEP performance evaluation process with minor modifications; thus simplifying interpretation and the derivation of compliance/performance statements.
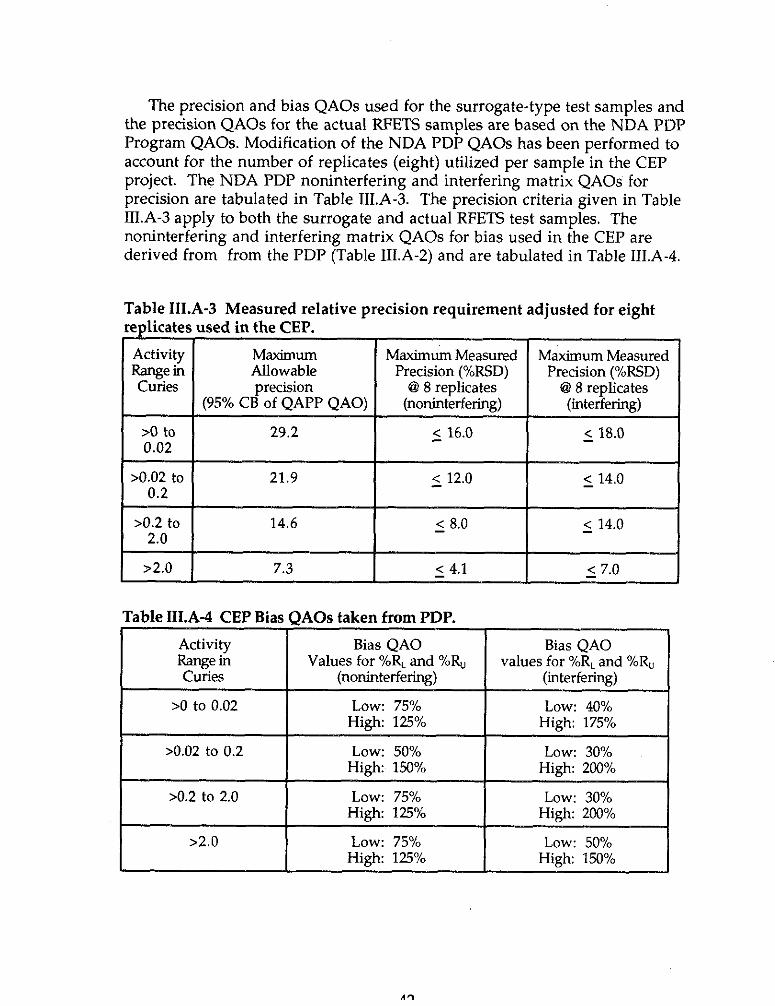
The precision and bias QAOs used for the surrogate-type test samples and the precision QAOs for the actual RFETS samples are based on the NDA PDP Program QAOs. Modification of the NDA PDP QAOs has been performed to account for the number of replicates (eight) utilized per sample in the CEP project. The NDA PDP noninterfering and interfering matrix QAOs for precision are tabulated in Table III.A-3. The precision criteria given in Table IILA-3 apply to both the surrogate and actual RFETS test samples. The noninterfering and interfering matrix QAOs for bias used in the CEP are derived from from the PDP (Table III.A-2) and are tabulated in Table IILA-4.
Table IILA-3 Measured relative precision requirement adjusted for eight reulicates used in the CEP.
Activity
%2
I I >0.02 to 21.9 0.2
5 14.0
14.6 ( 8.0 I
( 14.0
>2.0 7.3 I ( 4.1 ( 7.0
Table III.A-4 CEP Bias QAOs taken from PDP.
>0.2 to 2.0 Low: 75% High 125%
Bias QAO values for %R, and %R,
(interfering)
Low: 40% High: 175%
Low: 30% High: 200%
Low: 30% High: 200%
I >2.0 I Low: 75% Low: 50% High: 125% High: 150%
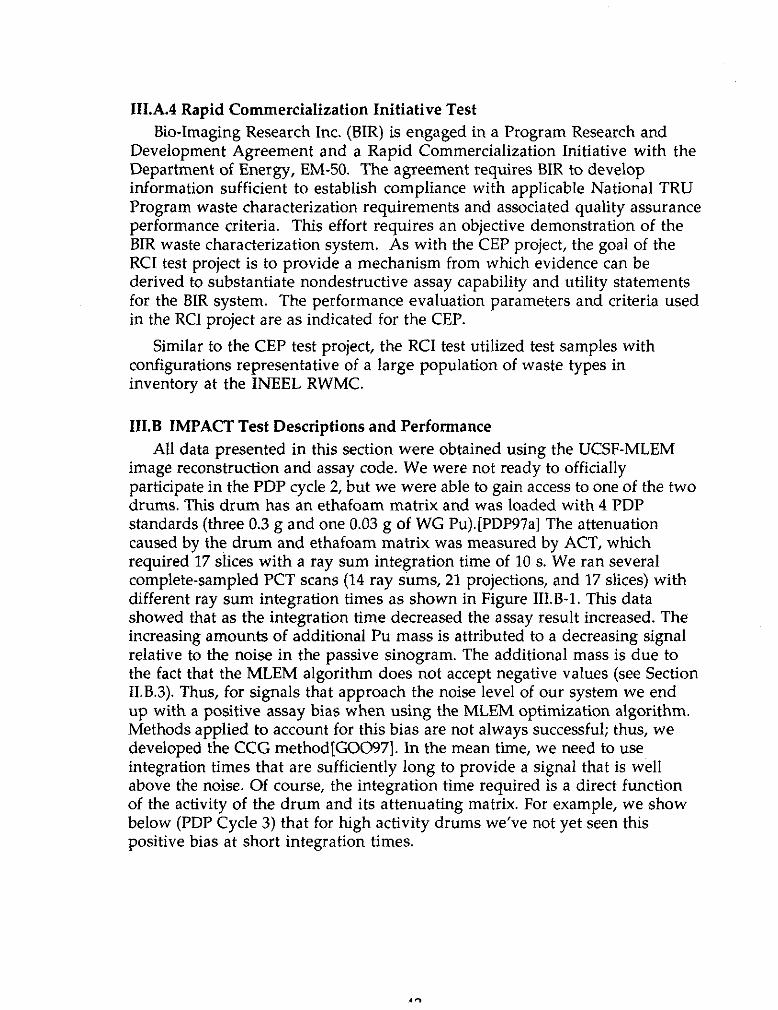
III.A.4 Rapid Commercialization Initiative Test Bio-Imaging Research Inc. (BIR) is engaged in a Program Research and
Development Agreement and a Rapid Commercialization Initiative with the Department of Energy, EM-50. The agreement requires BIR to develop information sufficient to establish compliance with applicable National TRU Program waste characterization requirements and associated quality assurance performance criteria. This effort requires an objective demonstration of the BIR waste characterization system. As with the CEP project, the goal of the RCI test project is to provide a mechanism from which evidence can be derived to substantiate nondestructive assay capability and utility statements for the BIR system. The performance evaluation parameters and criteria used in the RCI project are as indicated for the CEP.
Similar to the CEP test project, the RCI test utilized test samples with configurations representative of a large population of waste types in inventory at the INEEL RWMC.
IILB IMPACT Test Descriptions and Performance All data presented in this section were obtained using the UCSF-MLEM
image reconstruction and assay code. We were not ready to officially participate in the PDP cycle 2, but we were able to gain access to one of the two drums. This drum has an ethafoam matrix and was loaded with 4 PDF standards (three 0.3 g and one 0.03 g of WG Pu).[PDP97a] The attenuation caused by the drum and ethafoam matrix was measured by ACT, which required 17 slices with a ray sum integration time of 10 s. We ran several complete-sampled PCT scans (14 ray sums, 21 projections, and 17 slices) with different ray sum integration times as shown in Figure III.B-1. This data showed that as the integration time decreased the assay result increased. The increasing amounts of additional Pu mass is attributed to a decreasing signal relative to the noise in the passive sinogram. The additional mass is due to the fact that the MLEM algorithm does not accept negative values (see Section II.B.3). Thus, for signals that approach the noise level of our system we end up with a positive assay bias when using the MLEM optimization algorithm. Methods applied to account for this bias are not always successful; thus, we developed the CCG method[GOO97]. In the mean time, we need to use integration times that are sufficiently long to provide a signal that is well above the noise. Of course, the integration time required is a direct function of the activity of the drum and its attenuating matrix. For example, we show below (PDP Cycle 3) that for high activity drums we’ve not yet seen this positive bias at short integration times.
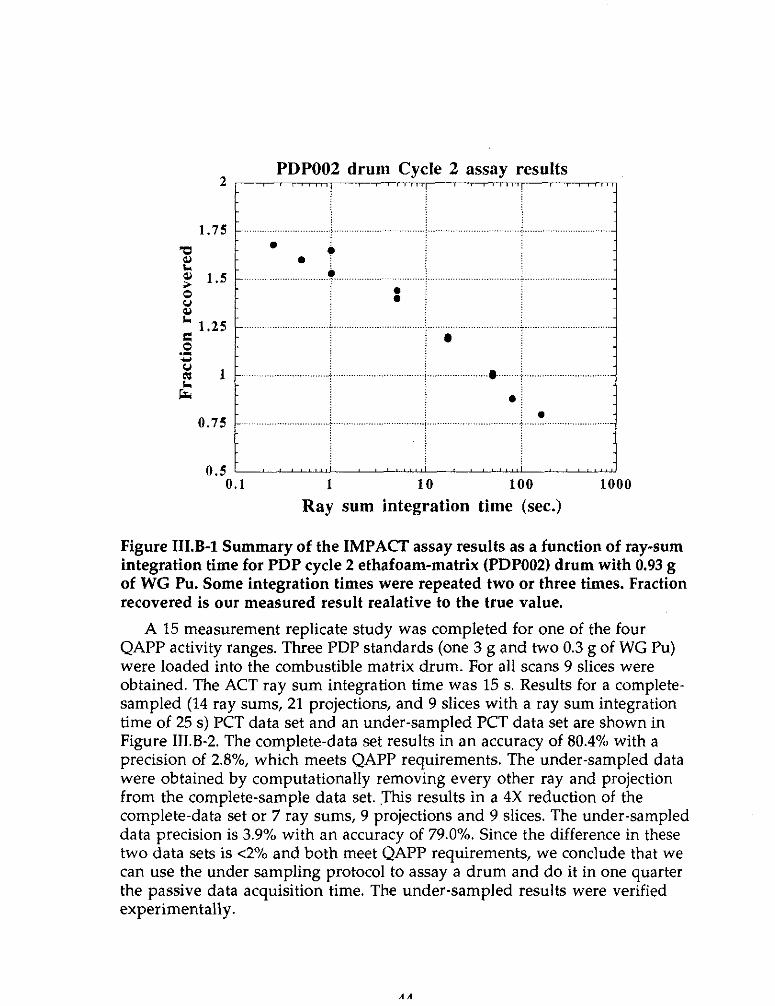
PDP002 drum Cvcle 2 assav results ”
t
l
*
.
1 . Ray sum integration time (sec.)
Figure IILB-1 Summary of the IMPACT assay results as a function of ray-sum integration time for PDP cycle 2 ethafoam-matrix (PDP002) drum with 0.93 g of WG Pu. Some integration times were repeated two or three times. Fraction recovered is our measured result realative to the true value.
A 15 measurement replicate study was completed for one of the four QAPP activity ranges. Three PDP standards (one 3 g and two 0.3 g of WG Pu) were loaded into the combustible matrix drum. For all scans 9 slices were obtained. The ACT ray sum integration time was 15 s. Results for a complete- sampled (14 ray sums, 21 projections, and 9 slices with a ray sum integration time of 25 s) PCT data set and an under-sampled PCT data set are shown in Figure III.B-2. The complete-data set results in an accuracy of 80.4% with a precision of 2.8%, which meets QAPP requirements. The under-sampled data were obtained by computationally removing every other ray and projection from the complete-sample data set. .This results in a 4X reduction of the complete-data set or 7 ray sums, 9 projections and 9 slices. The under-sampled data precision is 3.9% with an accuracy of 79.0%. Since the difference in these two data sets is ~2% and both meet QAPP requirements, we conclude that we can use the under sampling protocol to assay a drum and do it in one quarter the passive data acquisition time. The under-sampled results were verified experimentally.
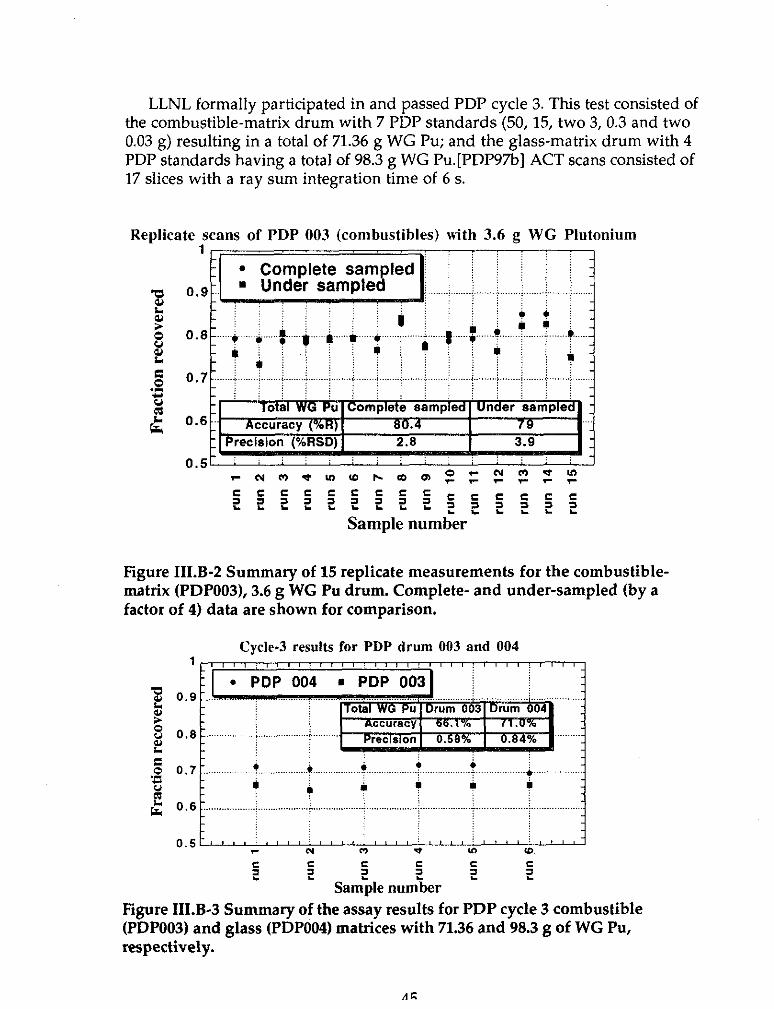
r I
LLNL formally participated in and passed PDP cycle 3. This test consisted of the combustible-matrix drum with 7 PDP standards (50, 15, two 3, 0.3 and two 0.03 g) resulting in a total of 71.36 g WG Pu; and the glass-matrix drum with 4 PDP standards having a total of 98.3 g WG Pu.[P!XYb] ACT scans consisted of 17 slices with a ray sum integration time of 6 s.
Replicate scans of PDP 003 (combustibles) with 3.6 g WG Plutonium
Figure IILB-2 Summary of 15 replicate measurements for the combustible- matrix (PDPOO3), 3.6 g WG Pu drum. Complete- and under-sampled (by a factor of 4) data are shown for comparison.
Cycle-3 results for PDP drum 003 and 004
Figure III.B-3 Summary of the assay results for PDP cycle 3 combustible (PDPOO3) and glass (PDP004) matrices with 71.36 and 98.3 g of WG Pu, respectively.

The PCT data consisted of 7 ray sums, 9 projections and 17 slices with a 20 s ray sum integration time. Our assay results are summarized in Figure IILB-3. For the drum with the combustible matrix and 71.36 g WG Pu, the measured mean is 47.1 g. The accuracy is 66.0% with a precision of 0.58%. For the drum with the glass matrix and 98.3 g WG Pu, the measured mean is 69.9 g, an accuracy of 71.1% with a precision of 0.84%. The average of the two accuracies and precisions is 68.5% and 0.7%, respectively. Therefore, the bias of IMPACT seems to be about 30% low. A representative three-dimensional surface rendered PCT image of the 239Pu source distributions in the glass-matrix drum is shown in Figure III.B-4.
Two additional measurements were made on the glass matrix drum to better understand the system bias at shorter integration times. PCT measurements at 10 and 5 s ray-sum integration times resulted in 69.4 and 69.1 g, respectively. These results agree with the 20 s PCT assay to within 1%; Thus, for signals well above the system noise our assay results are independent of ray-sum integration times.
Figure IILB-4 Representative three-dimensional surface rendered PCT image of the =‘Pu source distribution in the PDP cycle 3 glass-matrix drum. The standards for the glass-matrix drum consisted of WG Pu: 65 g at OR, 30 g at 0.5R, 3 g at OAR, and 0.3 g at OR at a height from the bottom of the drum of
46
40.6,17&O, and 12.7 cm, respectively. Note that 3 of the 4 standards were recovered; however, the smallest mass standard was not recovered.
IILC WIT/A&PCT Test Descriptions and Performance All data presented in this section were obtained using the UCSF-MLEM
image reconstruction and assay code. The WIT scanner has formally participated in and passed the CEP, RCI, and PDP Cycle-4 performance measures. For all tests it was important to assay as many drums as possible in a limited amount of time. Thus it was decided that the A&XT data needed be acquired and analysed within -22 hours. This allowed BIR to acquire both NDE and NDA data for each drum within a 24 hour period. This was imposed by field and test conditions. Occasionally we were able to run a drum over the weekend. We used this longer assay time to acquire data on high- attenuating and/or low-activity waste drums. This data was acquired only by BIR personnel (a technician). BIR allowed LLNL to look at all A&PCT data acquired and analyzed on the WIT trailer. For the RCI test we analyzed the PCT spectroscopy data to provide isotopic analysis for the fional assay report. The CEP and PDP data assumed that the waste forms assayed were weapons grade Pu only.
The CEP performance measures consisted of drums with metals, moltent salt extraction (MSE) salts, Raschig rings, and sludge loaded with 3.23,67.4, 0.91, and 4.39 g of w9Pu, respectively. The performance results for the WIT/A&&CT technology as determined by the CEP evaluation are shown in Table lIl.C.-1. The average of the CEP accuracies and precisions is 109% and 4.8%, respectively. Therefore, the bias of WlT/A&PCT seems to be about 10% high.
The RCI surrogate drums contained glass, combustible, and metal matrices with 2.3, 1.0, and 0.8 g of ?+I, respectively. The RCI RFETS drums contained graphite, combustible, Raschig rings, filters and sludge matrices with #, #, #, #, and # g of 259Pu, respectively. The performance results for the WIT/A&PCT technology via the RCI test project are tabulated in Table lll.C-2. The average of the RCI accuracies and precisions is 119% and 3.8%, respectively. Therefore, the bias of WIT/A&PCT seems to be about 20% high.
The PDP Cycle 4 performance measure used the drums containing combustible and zero (or empty) waste matrices loaded with 6.66 (two 3 g, two 0.3 g and two 0.03 g of WG Pu) and 98.3 g (one 50 g, one 30 g, one 15 g, one 3 g and one 0.3 g of WG Pu) of WG Pu, respectively. The test results are summarized in the PDP report for Cycle 4.[PDP97c ] The PDP results are presented in tabular form in Section 1II.D. The average of the PDP accuracies and precisions is 104% and 2.2%, respectively. Therefore, the bias of WIT/A&PCT is only 4% high. The weigted average of the three tests accuracies and precisions is 114% and 3.9%, respectively.
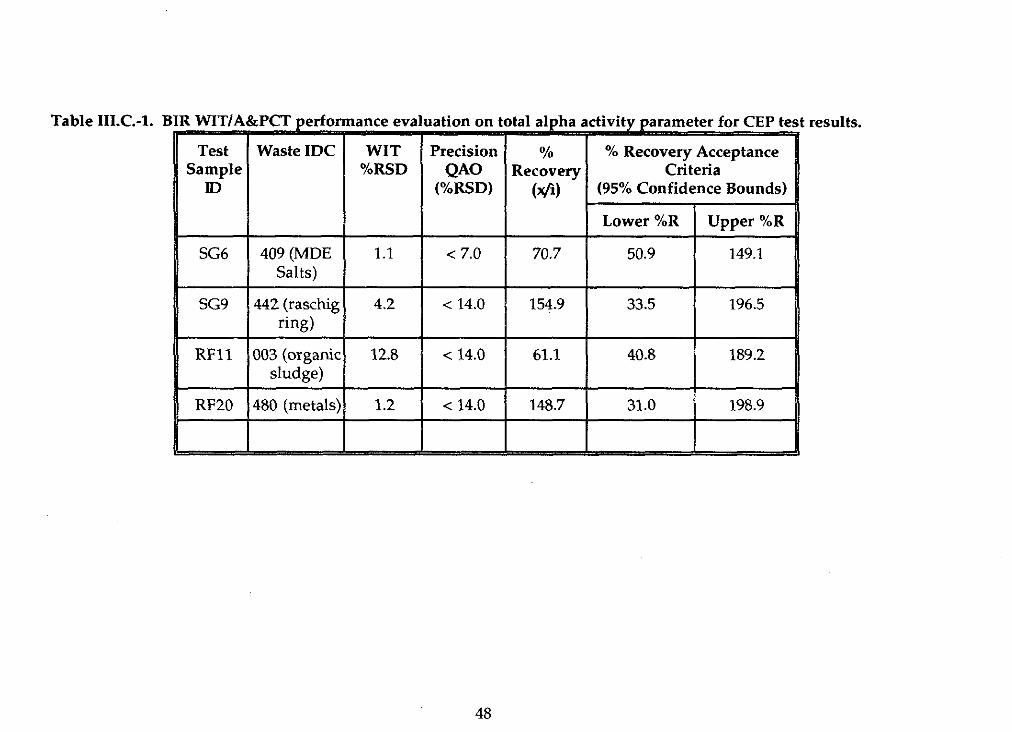
Table III.C.-1. B
(95% Confidence Bounds)
t results.
11 SG9 / 442:;;~~1 4.2 1 < 14.0 1 154.9 ) 33.5 1 196.5 11
11 RF11 )003(o(o;i~I 12.8 / < 14.0 / 61.1 1 40.8 1 189.2 #
RF20 480 (metals) 1.2 < 14.0 148.7 31.0 198.9
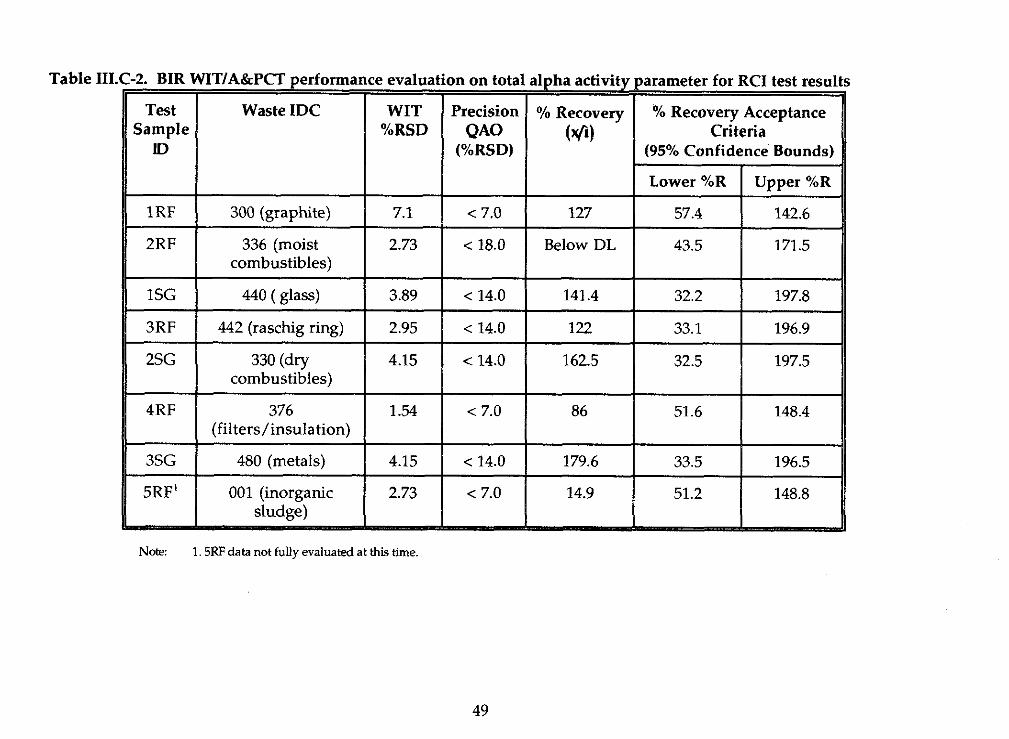
Table III
IRF
2RF
300 (graphite)
336 (moist combustibles)
7.1 < 7.0 127 57.4 142.6
2.73 < 18.0 Below DL 43.5 171.5
49
I I 5RF’ 001 (inorganic 2.73 < 7.0 sludge)
Note: 1.5RF data not fully evaluated at this time.
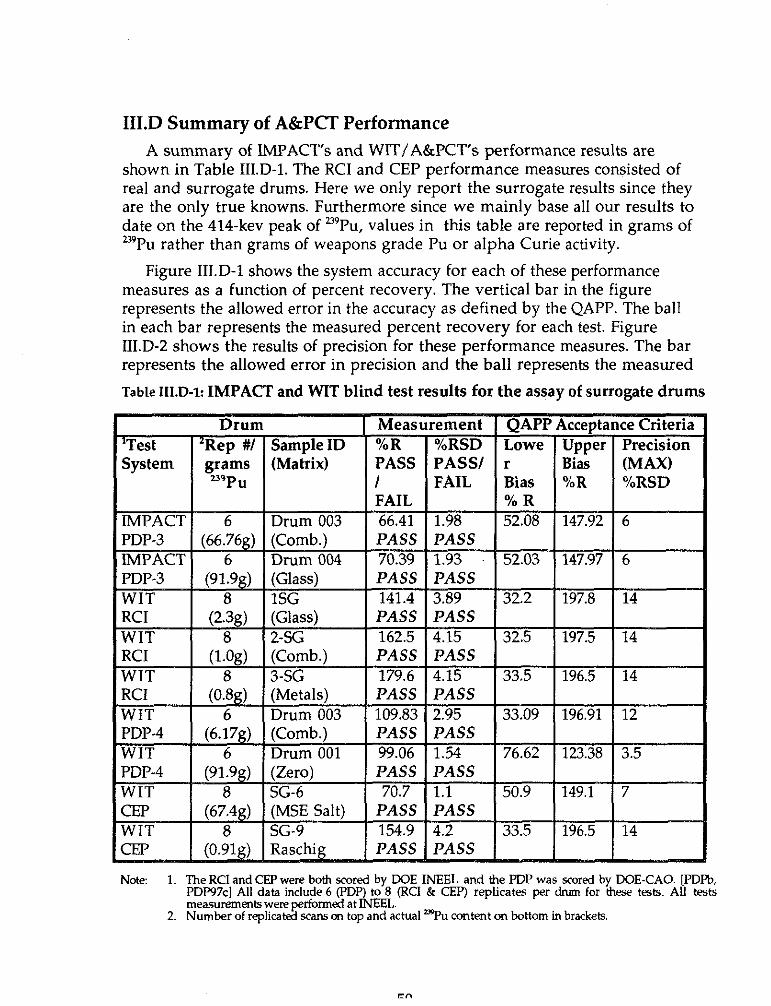
I1I.D Summary of A&PCT Performance A summary of IMPACT’s and WIT/A&PCT’s performance results are
shown in Table IILD-1. The RCI and CEP performance measures consisted of real and surrogate drums. Here we only report the surrogate results since they are the only true knowns. Furthermore since we mainly base all our results to date on the 414-kev peak of ?‘u, values in this table are reported in grams of u9Pu rather than grams of weapons grade Pu or alpha Curie activity.
Figure III.D-1 shows the system accuracy for each of these performance measures as a function of percent recovery. The vertical bar in the figure represents the allowed error in the accuracy as defined by the QAI’P. The ball in each bar represents the measured percent recovery for each test. Figure III.D-2 shows the results of precision for these performance measures. The bar represents the allowed error in precision and the ball represents the measured Table IILD-1: IMPACT and WIT blind test results for the assay of surrogate drums
Drum Measurement %R I %RSD PASS PASS/ I I FAIL
QAPP Acceptance Criteria Lowe I UuDer I Precision r BG
I I (MAX)
Bias %R %RSD %R 1 52.08 ( 147.92 1 6
33.5 196.5 14
Note: 1. The RU and CEP were both scored by DOE INEEL and the PDP was scored by DOE-CAO. [PDpb, PDF974 All data include 6 (PDP) to 8 (RU & CEP) replicates per dnm for these tests. All tests
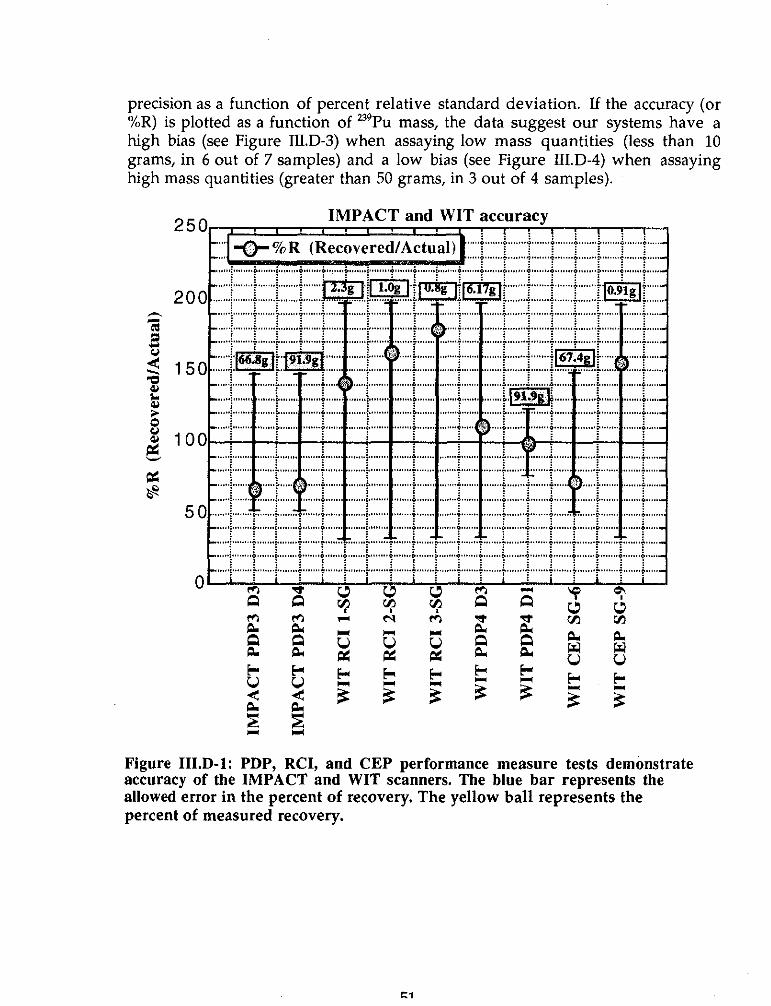
precision as a function of percent relative standard deviation. If the accuracy (or %R) is plotted as a function of 239Pu mass the data suggest our systems have a high bias (see Figure IILD-3) when assaying low mass quantities (less than 10 grams, in 6 out of 7 samples) and a low bias (see Figure IILD-4) when assaying high mass quantities (greater than 50 grams, in 3 out of 4 samples).
IMPACT and WIT accuracy
r
Figure III.D-1: PDP, RCI, and CEP performance measure tests demonstrate accuracy of the IMPACT and WIT scanners. The blue bar represents the allowed error in the percent of recovery. The yellow ball represents the percent of measured recovery.
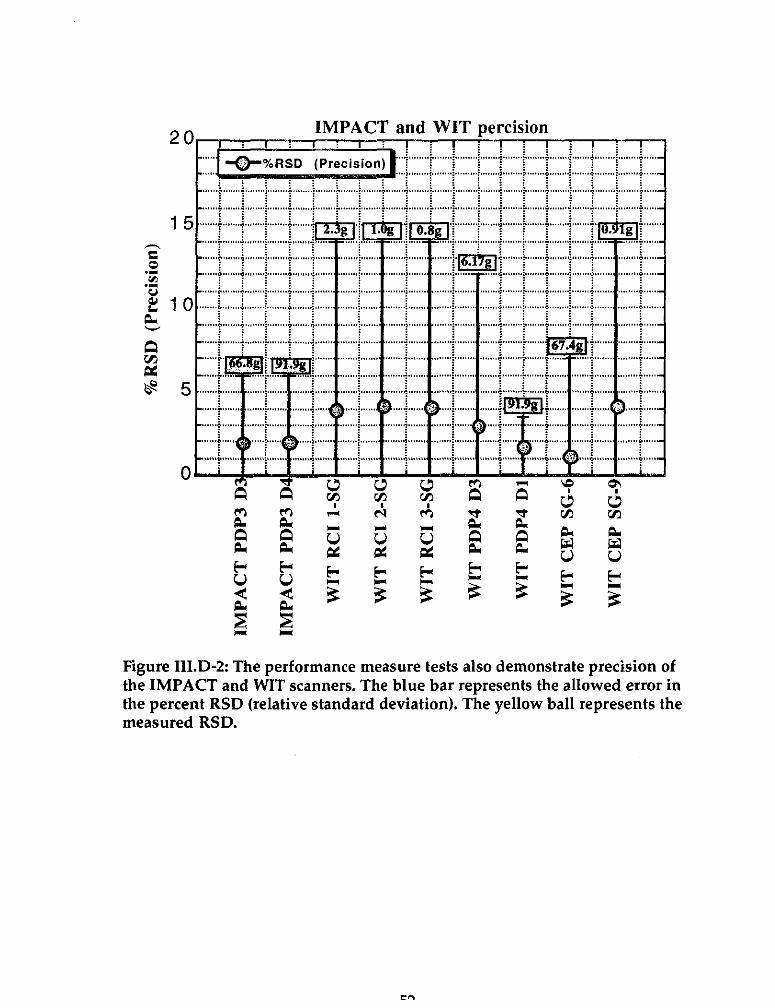
Ah IMPACT and W IT Dercision
Figure IlI.D-2: The perform ance m easure tests also dem onstrate precision of the IMPACT and W IT scanners. The blue bar represents the allowed error in the percent RSD (relative standard deviation). The yellow ball represents the m easured RSD.
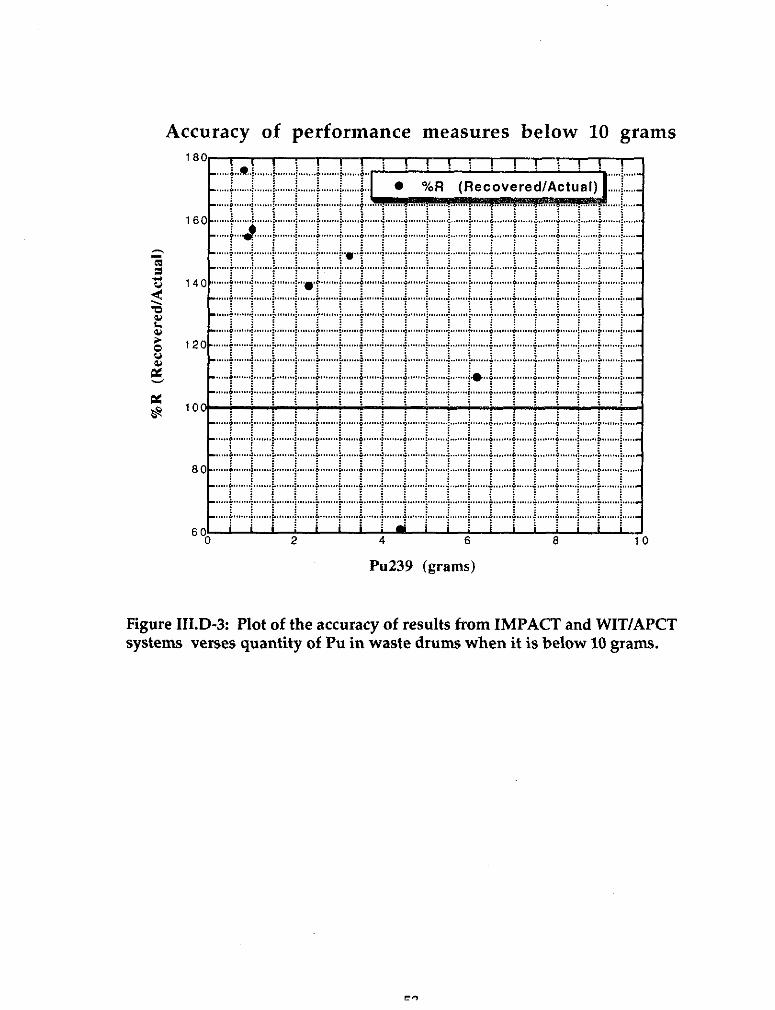
Accuracy of performance measures below 10 grams
0 2 4 6 a 10
Pu239 (grams)
Figure IILD-2 Plot of the accuracy of results from IMPACT and WIT/APCT systems verses quantity of Pu in waste drums when it is below 10 grams.
r
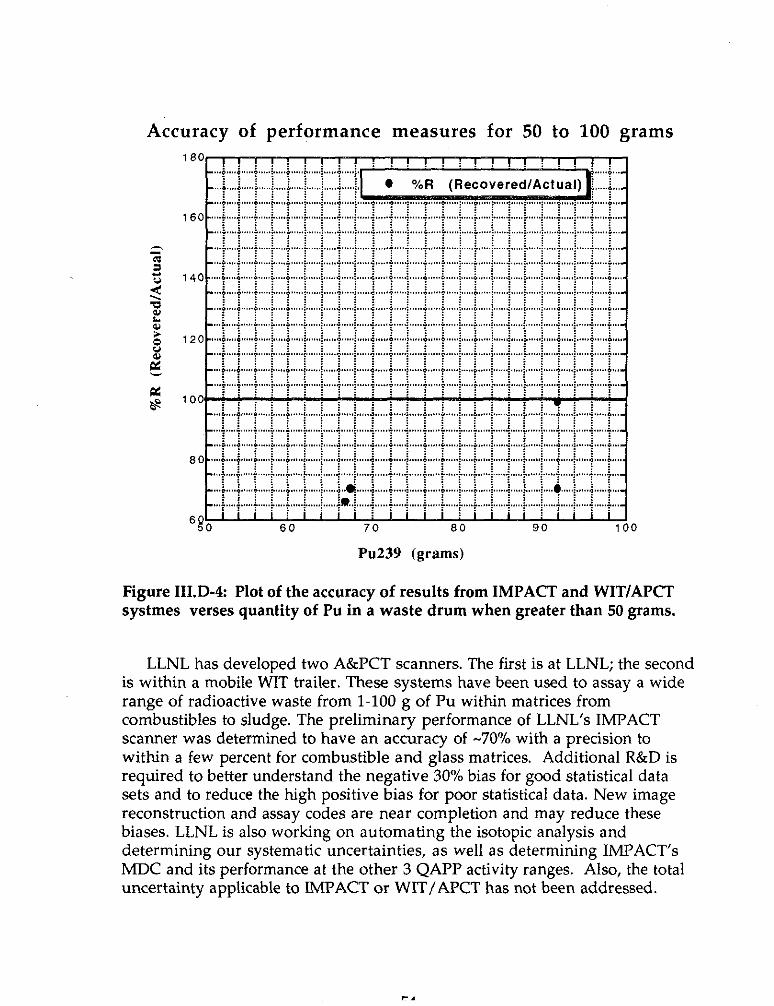
Accuracy of performance measures for 50 to 100 grams
Pu239 (grams)
Figure IILD-4: Plot of the accuracy of results from IMPACT and WlT/APCT systmes verses quantity of Pu in a waste drum when greater than 50 grams.
LLNL has developed two A&PCT scanners. The first is at LLNL; the second is within a mobile WIT trailer. These systems have been used to assay a wide range of radioactive waste from l-100 g of Pu within matrices from combustibles to sludge. The preliminary performance of LLNL’s IMPACT scanner was determined to have an accuracy of -70% with a precision to within a few percent for combustible and glass matrices. Additional R&D is required to better understand the negative 30% bias for good statistical data sets and to reduce the high positive bias for poor statistical data. New image reconstruction and assay codes are near completion and may reduce these biases. LLNL is also working on automating the isotopic analysis and determining our systematic uncertainties, as well as determining IMPACT’s MDC and its performance at the other 3 QAPP activity ranges. Also, the total uncertainty applicable to IMPACT or WIT/APCT has not been addressed.
r
IV. Implementation/Deployment Status (The current state of both systems? O.K. where are we ; is it ready to
go??)
IV. A Demonstrated Capabilities We believe that the A&PCT technology has demonstrated that it can
localize, quantify and identify TRU isotopes; and that this quantification can be done independent of the type of waste matrix. Further, we have demonstrated that this technology has been successfully transfered from the R&D realm to an industrial partner. They have begun the commercialization of this technology and have demonstrated that this technology can be incorporated into a mobile laboratory. Furthermore, the three NDE and the two NDA technologies incorporated into this mobile laboratory are fully automated and are operated by trained technicians. Both the laboratory-based A&PCT system (IMPACT) and the mobile-based A&XT system (WIT/A&PCT) participated and passed all of the performancedtests enteredto date.
The A&PCT technology provides measurement times that can be scaled to the amount of activity and to the drum-fill height found within a drum by the fast survey CGS mode. Thus, A&PCT scan times can be customized to acquire sufficient statistics to ensure that accurate measurements are made and time is not wasted scanning a portion of the drum with no radioactivity.
1V.B Limitations Each specific NDE and NDA technology has intrinsic limitations that
derive from the physical basis of their measurement process. The A&PCT technology is a gamma-ray based tomographic technique, hence it cannot quantify isotopes that do not emit gamma-rays. The CA0 requirement to report ‘%r, a pure beta emitter, cannot be measured by this technology. Similarly, the A&PCT technology is not designed to measure either spontaneous or induced neutron emissions from within a waste drum. Thus, the neutron-based NDA technologies can provide vital information that supplements an assay performed by the A&PCT technology.
Another unfortunate limitation arises from the very low branching ratios characteristic of many gamma-ray transitions found in transuranic isotopes of interest to NTP. As an example, the isotope of most interest to NTP, 239Pu, has a brancing ratio of 1~10’~ for its 414-keV gamma-ray transition. Although the lOO-keV gamma-ray transisions found in many transuranic isotopes of interest do have larger branching ratios, they do not have sufficient energy to escape from a waste matrix and be detected. Long transuranic half lives and low gamma-ray transition branching ratios are the primary reasons that the A&PCT technology is stated to be “physics limited.” We cannot make a long
rr
half life ttnansuranic isotope decay faster nor increase its branching ratio to gives us a counting rate higher than nature allows.
Another intrinsic limitation and advantage is that the A&PCT technology is a tomographic measurement, which means that the PCT mode locates radioactive sources to within one or more specific small voxels in a waste drum. A single voxel corresponds to a partial drum volume of only six-ten thousandths of a 2084iter drum. Unfortunately, this means that many of the passive tomographic ray sum measurements measure nothing, i.e. no source emissions.
The physics limited aspects of long-half lives and small branching ratios coupled with the required tomographic measurement protocol serve to limit waste drum throughput. This limitation has the geatest impact on those drums having the lowest transuranic loadings (0.002 - 0.02 aCi) and those near the MDC limit. Therefore, for these drums measurement times must necessarily be longer to obtain better counting statistics, which will resultin more accurate assays. The best we can do to solve the physics limited and throughput limitations is to increase the number of detectors and thereby increase our sensitivity while still preserving the principles of tomographic imaging and assay. Future work planned will clarify what can be achieved as described below.
Another limitation maybe the A&PCT technology’s ability to correct for very large transuranic lumps (or clumps) of material from 1 cm to 3 cm in diameter. Even small l-mm diameter-sized spheres of a TRU isotope are self absorbing of their own emitted gamma-radiations. A 2.54 cm lump may not be properly imaged by the ACT transmission method since it occupies less than 7% of its voxel volume. Thus, the proper quantification of such a sphere of TRU material would derive by combining results from NDE digital radiogrpahy and/or tomography with the NDA A&PCT results and perhaps even with NDA neutron based results. This is an excellent example where the fusion of results from one or several NDE modes with results from neutron- and gamma-ray based NDA systems may provide more accurate waste drum characterizations.
1V.C Future Development Activities There are five areas associated with the A&PCT technology that are
currently being developed or should be further developed. They include multiple detectors, “smart” scan techniques to shorten drum scan times, further optimization of the automated isotopic analysis program, continued testing of lump correction techniques, and the fusion of other NDE and NDA modalities that could lead to more accurate assay values and imore complete waste characterizations. IV.C.l Multiple detector development
As mentioned in the previous section, one limiting restriction to the A&PCT technology is the relatively long scan time required to assay a drum..
56
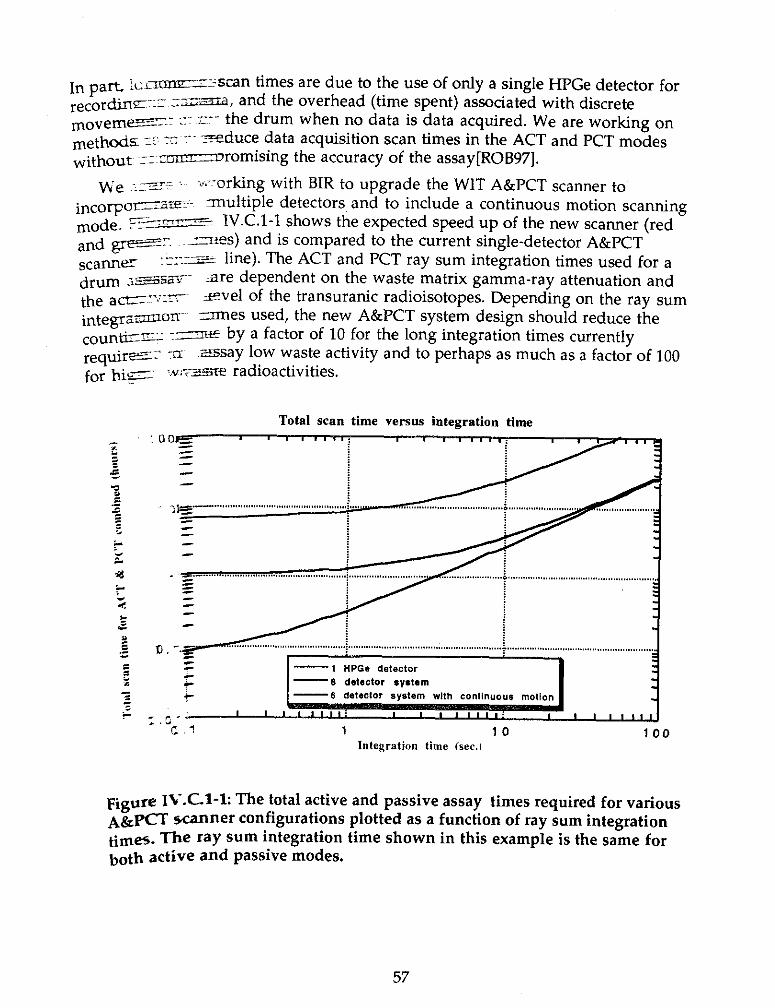
l,, part iclcrw::scan times are due to the use of only a single HPGe detector for recor~E:z zzzzra, and the overhead (time spent) associated with discrete movern~: L::~z-- the drum when no data is data acquired. We are working on methe& Z: :z:-- zeduce data acquisition scan times in the ACT and PCT modes without _X I- -nmmzrnromising the accuracy of the assay[ROB97].
we cz_z?? ..~ u‘;-orking with BIR to upgrade the WIT A&PCT scanner to incorpdazie:- multiple detectors~ and to include a continuous motion scanning modee ~==,,T--= -~~ N.C.l-1 shows the expected speed up of the new scanner (red and ~7. ~zzrm) and is compared to the current single-detector A&PCT scanner :?:-zE line). The ACT and PCT ray sum integration times used for a drum z=SZ:~~ zre dependent on the waste matrix gamma-ray attenuation and the a~‘.~lT eveI of the transuranic radioisotopes. Depending on the ray sum integraz;non~~’ lmes used, the new A&PCT system design should reduce the county: zzm+e by a factor of 10 for the long integration times currently req,nrpz: IZ zssay low waste activity and to perhaps as much as a factor of 100 for mF: ~-;zsre radioactivities.
Total scan time YWSUS integration time
* .w r, ,? 1 10 100
Integration time Csec.l
Prgure 11-K-1-1: The total active and passive assay times required for various A&&XT Scanner COnfigUratiOn. plotted as a function of ray sum integration time. The ray sum integration time shown in this example is the same for both active and passive modes.
57

IV.C.2 Smart Scan techniques There are methods that will increase the throughput of the A&PCT
technology. In certain circumstances, there may be a large increase in throughput gained by implementing a scan geometry that differs from traditional computed tomography. For example, sludge drums are a challenge to gamma-ray-based assay systems, particularly in the active mode. In the passive mode, the internal isotopic sources only need to penetrate half the diameter of the drum to be detected; however, in the active mode, the transmission gamma rays need to penetrate the entire diameter of the drum before they are detected. Acquiring active data on sludge drums can be a time consuming effort because each ray sum requires a long integration time to collect the necessary statistics for image reconstruction. Increasing the active source strength is one method to improve this situation; however, there are problems associated with license thresholds, safety of personnel, size and weight of the required shielding, and saturation of the detectors when the sludge is not in the field of view (i.e., the drum may not be filled all the way to the top with sludge).
One solution may be to develop a “smart” scan scenario for sludge waste drums. If they are found to be relatively homogeneous when evaluated by an NDE radiographic or transmission CT system, then a single active projection of the drum is all that is required to reconstruct the active volume image. If the drum is homogeneous, all projections will be identical throughout the drum. The single projection would be duplicated the required amount of times to produce the entireactive volume image. This smart scan method would decrease the active scan counting time by a factor of up to 350. There may be other smart scan scenarios that may be waste matrix dependent. These could be investigated and increase waste drum throughput. IV.C.3 Automated isotopic analysis
We have developed an automated isotopic analysis program for TRU waste. This program designed to be flexible so that it can be tailored to expected waste streams. Our experience in analyzing TRU waste &topics will increase over time and reveal additiens that could improve the isotopic code. These enhancements may include the addition of isotopes that were not initially expected in the TRU waste streams, and optimization for isotopes that occur more than originally expected. Incorporating these and other future experiences will lead to a more robust operation of the code. IV.C.4 Lump Corrections
Lump correction is required when the size of the material lump being assayed is massive enough to self-absorbed its own gamma ray emissions. Although we have developed a method to correct for the self-attenuation expected from certain size lumps of Pu, it may be possible to improve this technique by other methods. Just recently (August 1998) the PDP sources that exhibit problems associated with self-absorption have become available. These PDF sources are well characterized and should reveal what methods show the most promise for solving this problem. However, these sources
58
r
I
should aisem be used to evaluate and optimize current methods that show prom&e :onr solving the lump problem. Further work may be necessary in this area to. de~velop new methods or improve existing methods for lump correctiorms.
One pn3ssible solution to this problem is to use a high-spatial resolution transrr+siilon computed tomography volume image fused with the A&PCT image to .2entify where TRU lumps are located. If the TRU lumps can be identi&ci within the transmission CT image, a segmentation process can be perform= on the volume to extract the objects. Segmentation is a process that is use~ti to remove an object of interest from a CT volume image based on pixel x-aiua=s and connectivity. Once the TRU lump is computationally remov-ed. the volume can be determined from the dimensionally correct pixel nummer that represents the object. If this method is feasible, it could be implemmd on a system like the WIT trailer because it contains a transmis~n CT scanner that has adequate spatial resolution.
IV.C.5 Dara Fusion Data &ion is the process of integrating the results from both NDE and
NDA cmcterization techniques to aChieve a more accurate assay or to increase t% confidence of an assay. This effort is in its infantcy and a lot of effort rem;ains to be developed. The integration of A&PCT quantitative data and NDE tigh spatial resolution data may solve problems related to lump correctiors as mentioned above. Also, NDE radiographs or CT images can be used to d&ermine information about the homogeneity of a drum that in turn can be ed to determine the optimum A&PCT scan geometry that should be used to otiain maximum throughput. The integration of other NDA assay data with A&PCT data sets will provide increased accuracy and confidence.
V. Conchsions (summarize performance and indicate present demonstrated capabilities)
VI. Acknowledgments We would like to thank Steve Azevedo, Erik Johansson, Eric Keto, Dennis
Goodman, Jessie Jackson, Sailes Sengupta, DeLynn Clark, and Gene Ford at LLNL for their many contributions at various stages of the developemm of the A&PCT technology. We also want to thank Richard Bernardi and his staff at BIR for their support of our R&D effort, technolgy transfer of A&PCT to BIR and the use of the WIT test data. This work was funded by the Mixed Waste Focus Area and Federal Energy Technology Center, Office of Science and Technology in DOE’s Environmental Restoration and Waste Management Program, and performed under the auspices of the U.S. Department of Energy by the Lawrence Livermore National Laboratory under Contract W-7405-Eng-48.
59
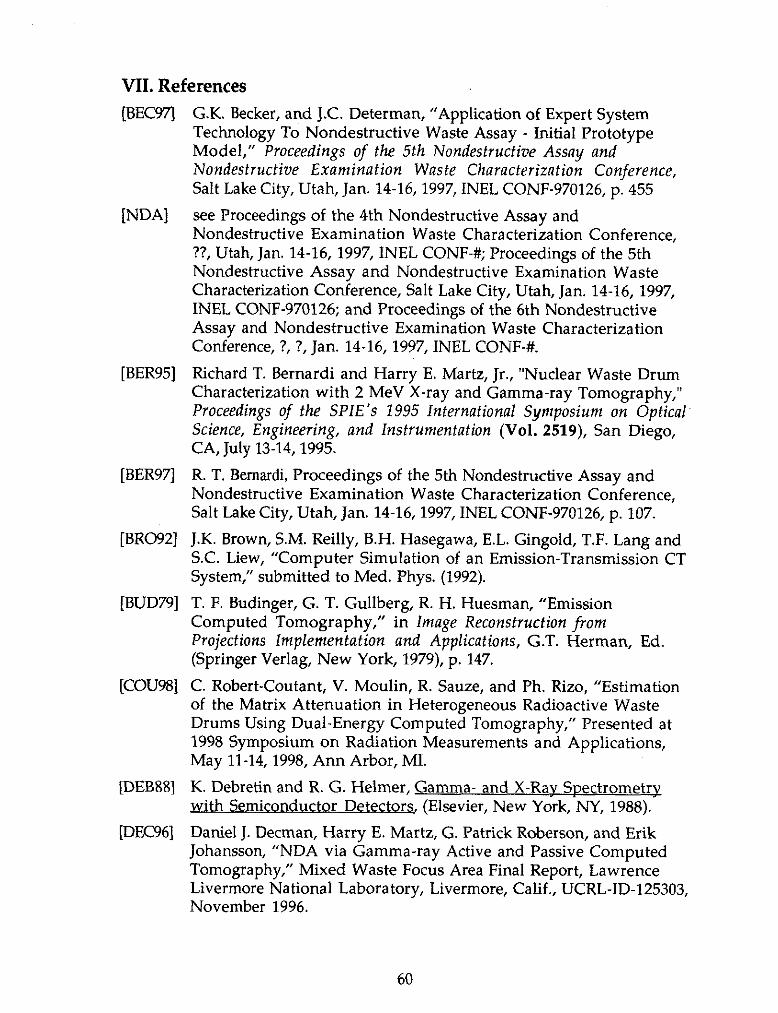
VII. References [BEC97J G.K. Becker, and J.C. Determan, “Application of Expert System
Technology To Nondestructive Waste Assay - Initial Prototype Model,” Proceedings of the 5th Nondestructive Assay and Nondestructive Examination Waste Characterizntion Conference, Salt Lake City, Utah, Jan. 14-16,1997, INEL CONF-970126, p. 455
WA1 see Proceedings of the 4th Nondestructive Assay and Nondestructive Examination Waste Characterization Conference, ??, Utah, Jan. 14-16, 1997, INEL CONF-#; Proceedings of the 5th Nondestructive Assay and Nondestructive Examination Waste Characterization Conference, Salt Lake City, Utah, Jan. 14-16, 1997, INEL CONF-970126; and Proceedings of the 6th Nondestructive Assay and Nondestructive Examination Waste Characterization Conference, ?, ?, Jan. 14-16, 1997, INEL CONF-#.
[BER95] Richard T. Bernardi and Harry E. Martz, Jr., “Nuclear Waste Drum Characterization with 2 MeV X-ray and Gamma-ray Tomography,” Proceedings of the SPlE’s 1995 International Symposium on Optical Science, Engineering, and Instrumentation (Vol. 2519), San Diego, CA, July 13-14,1995.
[BER97] R. T. Bernardi, Proceedings of the 5th Nondestructive Assay and Nondestructive Examination Waste Characterization Conference, Salt Lake City, Utah, Jan. 14-16,1997, INEL CONF-970126, p. 107.
[BRO92] J.K. Brown, S.M. Reilly, B.H. Hasegawa, E.L. Gingold, T.F. Lang and S.C. Liew, “Computer Simulation of an Emission-Transmission CT System,” submitted to Med. Phys. (1992).
[BUD791 T. F. Budinger, G. T. Gullberg, R. H. Huesman, “Emission Computed Tomography,” in Image Reconstruction from Projections Implementation and Applications, G.T. Herman, Ed. (Springer Verlag, New York, 1979), p. 147.
[COU98] C. Robert-Coutant, V. Moulin, R. Sauze, and Ph. Rizo, “Estimation of the Matrix Attenuation in Heterogeneous Radioactive Waste Drums Using Dual-Energy Computed Tomography,” Presented at 1998 Symposium on Radiation Measurements and Applications, May 11-14, 1998, Ann Arbor, MI.
JDEB88] K. Debretin and R. G. Helmer, Gamma- and X-Rav Soectrometrv th Semiconductor Detectors, (Elsevier, New York, NY, 1988). wi
JDEC96] Daniel J. Decman, Harry E. Martz, G. Patrick Roberson, and Erik Johansson, “NDA via Gamma-ray Active and Passive Computed Tomography,” Mixed Waste Focus Area Final Report, Lawrence Livermore National Laboratory, Livermore, Calif., UCRL-ID-125303, November 1996.
60
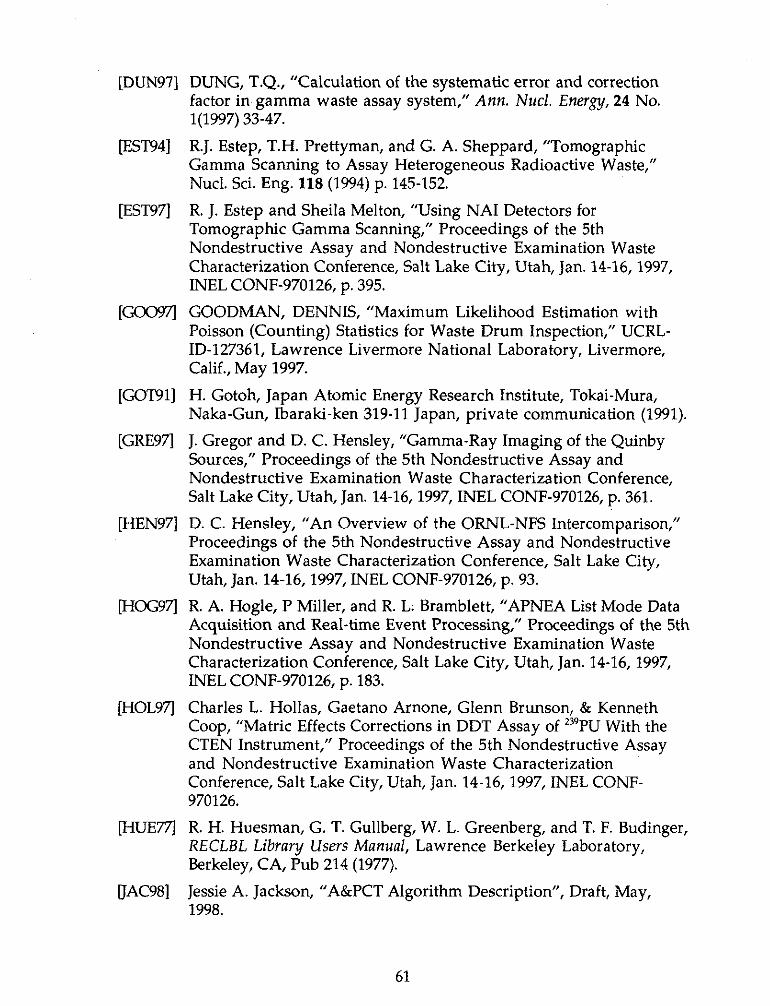
[DUN971 DUNG, T.Q., “Calculation of the systematic error and correction factor in gamma waste assay system,” Ann. Nucl. Energy, 24 No. l(1997) 33-47.
[EST941 R.J. Estep, T.H. Prettyman, and G. A. Sheppard, “Tomographic Gamma Scanning to Assay Heterogeneous Radioactive Waste,” Nucl. Sci. Eng. 118 (1994) p. 145-152.
[EST971 R. J. Estep and Sheila Melton, “Using NAI Detectors for Tomographic Gamma Scanning,” Proceedings of the 5th Nondestructive Assay and Nondestructive Examination Waste Characterization Conference, Salt Lake City, Utah, Jan. 14-16,1997, INEL CONF-970126, p. 395.
[GOO97j GOODMAN, DENNIS, “Maximum Likelihood Estimation with Poisson (Counting) Statistics for Waste Drum Inspection,” UCRL- ID-127361, Lawrence Livermore National Laboratory, Livermore, Calif., May 1997.
[GOT%] H. Gotoh, Japan Atomic Energy Research Institute, Tokai-Mura, Naka-Gun, Ibaraki-ken 319-11 Japan, private communication (1991).
[GRE97] J. Gregor and D. C. Hensley, “Gamma-Ray Imaging of the Quinby Sources,” Proceedings of the 5th Nondestructive Assay and Nondestructive Examination Waste Characterization Conference, Salt Lake City, Utah, Jan. 14-16, 1997, INEL CONF-970126, p. 361.
[HEN971 D. C. Hensley, “An Overview of the ORNL-NFS Intercomparison,” Proceedings of the 5th Nondestructive Assay and Nondestructive Examination Waste Characterization Conference, Salt Lake City, Utah, Jan. 14-16,1997, INEL CONF-970126, p. 93.
[HOG971 R. A. Hogle, P Miller, and R. L. Bramblett, “APNEA List Mode Data Acquisition and Real-time Event Processing,” Proceedings of the 5th Nondestructive Assay and Nondestructive Examination Waste Characterization Conference, Salt Lake City, Utah, Jan. 14-16, 1997, INEL CONF-970126, p. 183.
JHOL971 Charles L. Hollas, Gaetano Arnone, Glenn Brunson, & Kenneth Coop, “Matric Effects Corrections in DDT Assay of w9PU With the CTEN Instrument,” Proceedings of the 5th Nondestructive Assay and Nondestructive Examination Waste Characterization Conference, Salt Lake City, Utah, Jan. 14-16, 1997, INEL CONF- 970126.
[HuEn] R. H. Huesman, G. T. Gullberg, W. L. Greenberg, and T. F. Budinger, RECLBL Library Users Manual, Lawrence Berkeley Laboratory, Berkeley, CA, Pub 214 (1977).
[JAC98] Jessie A. Jackson, “A&PCT Algorithm Description”, Draft, May, 1998.
61
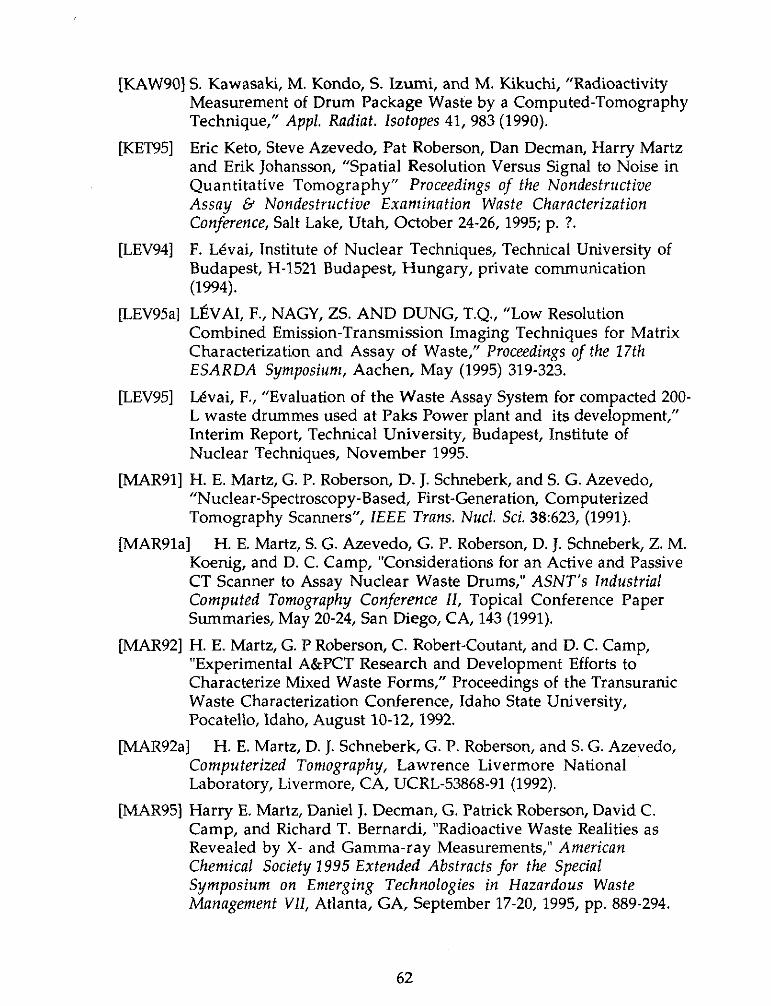
[KAW90] S. Kawasaki, M. Kondo, S. Izumi, and M. Kikuchi, “Radioactivity Measurement of Drum Package Waste by a Computed-Tomography Technique,” Appl. Radiat. Zsofopes 41, 983 (1990).
JKE’I95] Eric Keto, Steve Azevedo, Pat Roberson, Dan Decman, Harry Martz and Erik Johansson, “Spatial Resolution Versus Signal to Noise in Quantitative Tomography” Proceedings of the Nondestructive Assay & Nondestructive Exnmination Waste Characterization Conference, Salt Lake, Utah, October 24-26, 1995; p. ?.
JLEV94] F. Levai, Institute of Nuclear Techniques, Technical University of Budapest, H-1521 Budapest, Hungary, private communication (1994).
JLEV95a] L&AI, F., NAGY, ZS. AND DUNG, T.Q., “Low Resolution Combined Emission-Transmission Imaging Techniques for Matrix Characterization and Assay of Waste,” Proceedings of the 27th ESARDA Symposium, Aachen, May (1995) 319-323.
JLEV95] Levai, F., “Evaluation of the Waste Assay System for compacted 200- L waste drummes used at Paks Power plant and its development,” Interim Report, Technical University, Budapest, Institute of Nuclear Techniques, November 1995.
JMAR91] H. E. Martz, G. P. Roberson, D. J. Schneberk, and S. G. Azevedo, “Nuclear-Spectroscopy-Based, First-Generation, Computerized Tomography Scanners”, IEEE Trans. Nucl. Sci. 38:623, (1991).
JMAR9la] H. E. Martz, S. G. Azevedo, G. P. Roberson, D. J. Schneberk, Z. M. Koenig, and D. C. Camp, “Considerations for an Active and Passive CT Scanner to Assay Nuclear Waste Drums,” ASNT’s Industrial Computed Tomography Conference II, Topical Conference Paper Summaries, May 20-24, San Diego, CA, 143 (1991).
JMAR92] H. E. Martz, G. P Roberson, C. Robert-Coutant, and D. C. Camp, “Experimental A&PCT Research and Development Efforts to Characterize Mixed Waste Forms,” Proceedings of the Transuranic Waste Characterization Conference, Idaho State University, Pocatello, Idaho, August 10-12, 1992.
JMAR92a] H. E. Martz, D. J. Schneberk, G. P. Roberson, and S. G. Azevedo, Computerized Tomography, Lawrence Livermore National Laboratory, Livermore, CA, UCRL-5386891 (1992).
[MAR951 Harry E. Martz, Daniel J. Decman, G. Patrick Roberson, David C. Camp, and Richard T. Bernardi, “Radioactive Waste Realities as Revealed by X- and Gamma-ray Measurements,” American Chemical Society 1995 Extended Abstracts for the Special Symposium on Emerging Technologies in Hazardous Waste Management VII, Atlanta, GA, September 17-20, 1995, pp. 889-294.
62
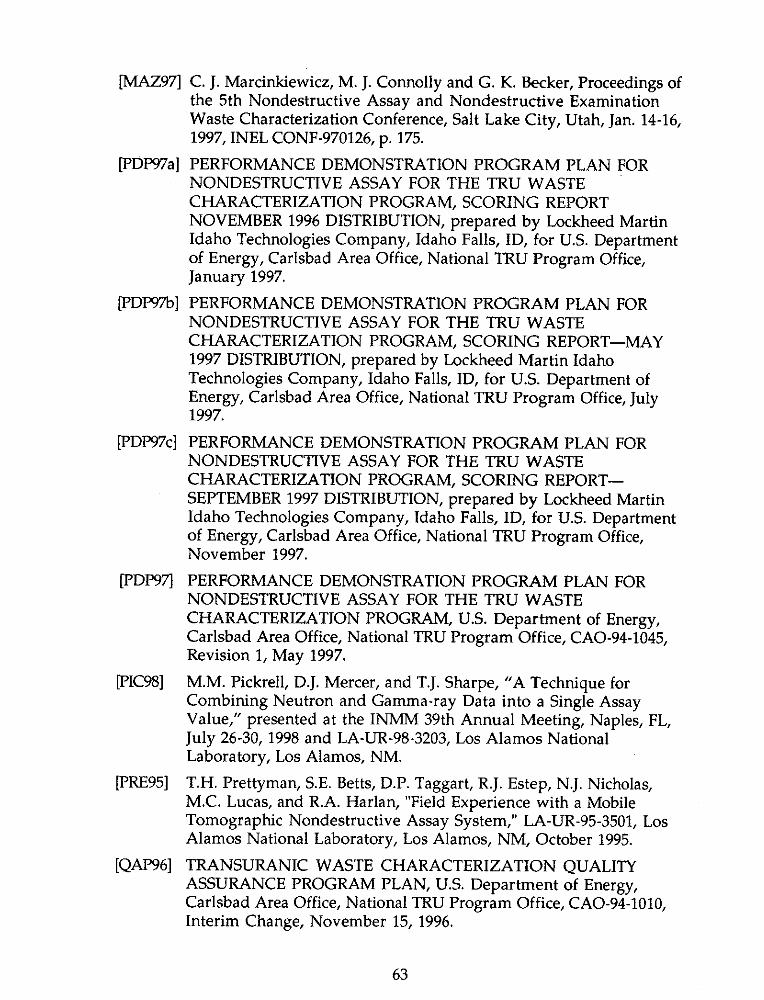
JMAZ97] C. J. Marcinkiewicz, M. J. Connolly and G. K. Becker, Proceedings of the 5th Nondestructive Assay and Nondestructive Examination Waste Characterization Conference, Salt Lake City, Utah, Jan. 14-16, 1997, INEL CONF-970126, p. 175.
JPDI%‘a] PERFORMANCE DEMONSTRATION PROGRAM PLAN FOR NONDESTRUCTIVE ASSAY FOR THE TRU WASTE CHARACTERIZATION PROGRAM, SCORING REPORT NOVEMBER 1996 DISTRIBUTION, prepared by Lockheed Martin Idaho Technologies Company, Idaho Falls, ID, for U.S. Department of Energy, Carlsbad Area Office, National TRU Program Office, January 1997.
JPDP97b] PERFORMANCE DEMONSTRATION PROGRAM PLAN FOR NONDESTRUCTIVE ASSAY FOR THE TRU WASTE CHARACTERIZATION PROGRAM, SCORING REPORT-MAY 1997 DISTRIBUTION, prepared by Lockheed Martin Idaho Technologies Company, Idaho Falls, ID, for U.S. Department of Energy, Carlsbad Area Office, National TRU Program Office, July 1997.
JPDl=97c] PERFORMANCE DEMONSTRATION PROGRAM PLAN FOR NONDESTRUCTIVE ASSAY FOR THE TRU WASTE CHARACTERIZATION PROGRAM, SCORING REPORT- SEPTEMBER 1997 DISTRIBUTION, prepared by Lockheed Martin Idaho Technologies Company, Idaho Falls, ID, for U.S. Department of Energy, Carlsbad Area Office, National TRU Program Office, November 1997.
JPDP97j PERFORMANCE DEMONSTRATION PROGRAM PLAN FOR NONDESTRUCTIVE ASSAY FOR THE TRU WASTE CHARACTERIZATION PROGRAM, U.S. Department of Energy, Carlsbad Area Office, National TRU Program Office, CAO-94-1045, Revision 1, May 1997.
JPIC98] M.M. Pickrell, D.J. Mercer, and T.J. Sharpe, “A Technique for Combining Neutron and Gamma-ray Data into a Single Assay Value,” presented at the INMM 39th Annual Meeting, Naples, FL, July 26-30, 1998 and LA-UR-98-3203, Los Alamos National Laboratory, Los Alamos, NM.
pRE95] T.H. Prettyman, S.E. Betts, D.P. Taggart, R.J. Estep, N.J. Nicholas, MC. Lucas, and R.A. Harlan, “Field Experience with a Mobile Tomographic Nondestructive Assay System,” LA-UR-95-3501, Los Alamos National Laboratory, Los Alamos, NM, October 1995.
[QAP96] TRANSURANIC WASTE CHARACTERIZATION QUALITY ASSURANCE PROGRAM PLAN, U.S. Department of Energy, Carlsbad Area Office, National TRU Program Office, CAO-94-1010, Interim Change, November 15, 1996.
63
IRE1921 P. Reimers, “Quality Assurance of Radioactive Waste Packages by Computerized Tomography, Task 3, Characterization of Radioactive Waste Forms; A Series of Final Reports (1985-89) - No. 37,” Nuclear Science and Technology, EUR 13879 EN, Commission of the European Communities, Luxembourg, 1992.
JROB91] G.P. Roberson, H.E. Martz, D.J. Schneberk, and C.L. Logan, “Nuclear- Spectroscopy Computerized Tomography Scanners,” 1991 ASNT Spring Conference, March 18-22, Oakland, California, 107, (1991).
[ROB941 G. P. Roberson, H. E. Martz, D. J. Deckman, D. C. Camp, S. G. Azevedo and E. R. Keto, “Characterization of Waste Drums Using Nonintrusive Active and Passive Computed Tomography,” Proceedings of the Nondestructive Assay f? Nondestructive ’ Examination Waste Characterization Conference, Idaho State University, Pocatello, Idaho, February 14-16,1994 pp. 261-294.
[ROB951 ROBERSON, G. PATRICK, et al., “Nondestructive Assay of TRU Waste Using Gamma-ray Active and Passive Computed Tomography,” Proceedings of the Nondestructive Assay and Nondestructive Examination Waste Characterization Conference, Salt Lake City, Utah, October 24-26, (1995) 73-84.
[ROB97 ROBERSON, G. PATRICK, et al., “Preliminary A&PCT Multiple Detector Design, Upgrade of a Single HPGe detector A&PCT System to Multiple Detectors,” Lawrence Livermore National Laboratory, Livermore, Calif., UCRL-ID-128052, June 1997.
[ROB981 G. Patrick Roberson, Harry E. Martz, Daniel J. Decman, Jessie A. Jackson, Richard T. Bernardi, and David C. Camp, “Nondestructive Assay Using Active and Passive Computed Tomography,” presented at the INMM 39th Annual Meeting, Naples, FL, July 26- 30,1998.
64