active microwave imaging for breast …progress in electromagnetics research, pier 58, 149–169,...
TRANSCRIPT

Progress In Electromagnetics Research, PIER 58, 149–169, 2006
ACTIVE MICROWAVE IMAGING FOR BREASTCANCER DETECTION
G. Bindu, A. Lonappan, V. Thomas, C. K. Aanandan, andK. T. Mathew
Department of ElectronicsMicrowave Tomography and Materials Research LaboratoryCochin University of Science and TechnologyKochi-682 022, India
S. J. Abraham
Department of SurgeryLourde HospitalKochi, India
Abstract—Active microwave imaging is explored as an imagingmodality for early detection of breast cancer. When exposed tomicrowaves, breast tumor exhibits electrical properties that aresignificantly different from that of healthy breast tissues. Thetwo approaches of active microwave imaging — confocal microwavetechnique with measured reflected signals and microwave tomographicimaging with measured scattered signals are addressed here. Normaland malignant breast tissue samples of same person are subjected tostudy within 30 minutes of mastectomy. Corn syrup is used as couplingmedium, as its dielectric parameters show good match with that ofthe normal breast tissue samples. As bandwidth of the transmitter isan important aspect in the time domain confocal microwave imagingapproach, wideband bowtie antenna having 2:1 VSWR bandwidthof 46% is designed for the transmission and reception of microwavesignals. Same antenna is used for microwave tomographic imaging tooat the frequency of 3000 MHz. Experimentally obtained time domainresults are substantiated by finite difference time domain (FDTD)analysis. 2-D tomographic images are reconstructed with the collectedscattered data using distorted Born iterative method. Variations ofdielectric permittivity in breast samples are distinguishable from theobtained permittivity profiles.

150 Bindu et al.
1. INTRODUCTION
Breast cancer affects many women and early detection aids infast and effective treatment. X-ray mammography is currentlythe most effective imaging method for detecting clinically occultbreast cancer. However, despite significant progress in improvingmammographic techniques for detecting and characterizing breastlesions, mammography reported high false-negative rates [1] and highfalse-positive rates [2]. These difficulties are attributed to the intrinsiccontrast between normal and malignant tissues at X-ray frequencies. InX-ray tomography a tissue is differentiated based on density. Howeverin most cases, tissue density does not depend on tissue physiologicalstate. Important tissue characteristics such as temperature, bloodcontent, blood oxygenation and ischemia cannot be differentiated byX-ray tomography. For soft tissues like human breast, X-ray cannotimage the breast anomalies at an early stage, as there is no significantvariation in density between normal and malignant breast tissues [3].
Microwave imaging is a new technology which has potentialapplications in the field of diagnostic medicine [4, 5]. The basicmotivation for this is improved physiologic and pathophysiologiccorrelation, especially in soft tissue. This expectation is based on themolecular (dielectric) rather than atomic (density) based interactionsof the microwave radiation with the target when compared with X-ray imagery. When exposed to microwaves, the high water content ofmalignant breast tissues cause significant microwave scattering thannormal fatty breast tissues that have low water content. It is reportedthat dielectric permittivity and conductivity increase for cancerousbreast tissue is three or more times greater than the host tissue [6].Due to the improved dielectric contrast, better tissue characterizationtoo is possible.
Microwaves can be used effectively for the detection of biologicalanomalies like tumor at an early curable stage itself. At microwavefrequencies the sensitivity, specificity and the ability to detect smalltumors is the dielectric contrast between normal and malignant breasttissues [7]. Malignant breast tissues exhibit considerable increase inbound water content compared to the normal tissues and hence ahigh value of permittivity. When exposed to microwaves, the highwater content of malignant breast tissues cause significant microwavescattering than normal fatty breast tissues that have low water content.
Some benign tumors too respond to microwaves similar to thatof malignant tumors [8]. However, characterizing and analyzing suchbenign tumors is not considered in this paper.
Many prototypes of active microwave imaging has been reported

Progress In Electromagnetics Research, PIER 58, 2006 151
[7, 9]. The need for using suitable coupling medium to enhancethe coupling of electromagnetic energy to the object as well asto increase the resolution is emphasized [10]. A suitable couplingmedium accomplishes wavelength contraction without propagation losspenalty associated with increased frequency. In near field microwavemedical imaging environment, resolution is determined by the aperturedimensions of the antenna, which can be generalized to far field byusing a suitable coupling medium. Also bandwidth enhancement intime domain confocal microwave imaging applications is made possibleby its usage. A contrast in the dielectric properties of the object andthe coupling medium decreases the measurement accuracy, increasesthe attenuation, creates temperature drifts and unpredictable localtemperature gradients [11].
This paper analyzes the two approaches of active microwaveimaging — confocal microwave technique with measured reflectedsignals and microwave tomographic imaging with measured scatteredsignals.
2. MODELS
2.1. System Configuration
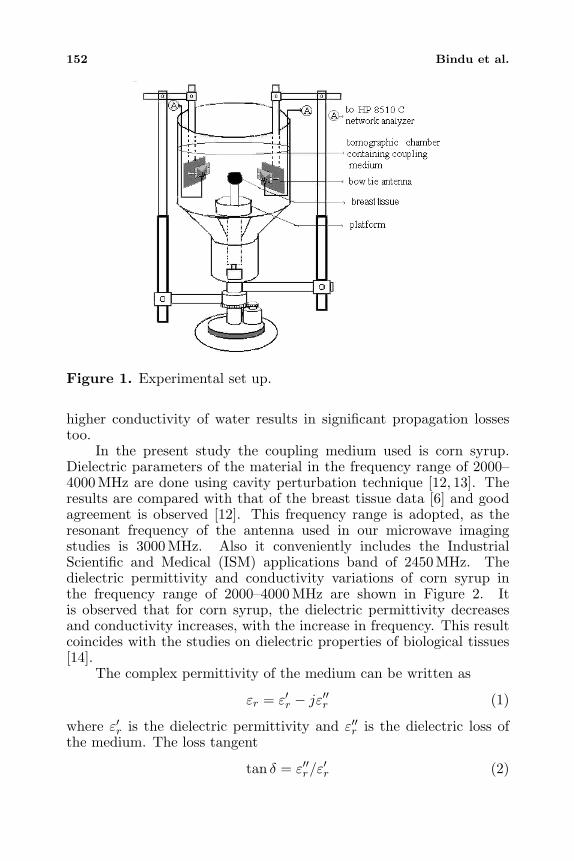
The designed prototype of 2-D microwave imaging is shown in Figure 1.The breast sample supported on a PVC holder is mounted on a circularplatform capable of circular motion in the horizontal plane. Theplatform along with samples is kept inside a tomographic chamber ofradius 12 cm and height 30 cm, coated inside with suitable absorbingmaterial. The chamber is filled with coupling medium. Suspendedbowtie antennas are used for both transmission and reception ofmicrowave energy. All measurements are done using HP 8510 Cnetwork analyzer; interfaced with Compaq work station SP 750 usingGPIB bus.
2.2. Coupling Medium
Proper selection of coupling medium is essential for better resolutionof the reconstructed images. In [9] conventional coupling medium likewater was used for microwave breast imaging. The variations of thetissue contents in the breast, like fat versus normal tissue were sensedhere. A cancerous growth was not considered for the study; also, theobtained permittivity values were significantly greater than that ofbreast tissues reported in [6]. This may be due to the poor couplingof electromagnetic energy in to the breast volume, as water exhibitsconsiderable permittivity contrast with that of the breast tissues. The
152 Bindu et al.
Figure 1. Experimental set up.
higher conductivity of water results in significant propagation lossestoo.
In the present study the coupling medium used is corn syrup.Dielectric parameters of the material in the frequency range of 2000–4000 MHz are done using cavity perturbation technique [12, 13]. Theresults are compared with that of the breast tissue data [6] and goodagreement is observed [12]. This frequency range is adopted, as theresonant frequency of the antenna used in our microwave imagingstudies is 3000 MHz. Also it conveniently includes the IndustrialScientific and Medical (ISM) applications band of 2450 MHz. Thedielectric permittivity and conductivity variations of corn syrup inthe frequency range of 2000–4000 MHz are shown in Figure 2. Itis observed that for corn syrup, the dielectric permittivity decreasesand conductivity increases, with the increase in frequency. This resultcoincides with the studies on dielectric properties of biological tissues[14].
The complex permittivity of the medium can be written as
εr = ε′r − jε′′r (1)
where ε′r is the dielectric permittivity and ε′′r is the dielectric loss ofthe medium. The loss tangent
tan δ = ε′′r/ε′r (2)

Progress In Electromagnetics Research, PIER 58, 2006 153
Frequency MHz
2200 2400 2600 2800 300 0 3200 340 0 3600 3800 4000 4200
Die
lect
ric
para
me t
er
0
5
10
15
20
25
Dielectr ic permittivityConductivity S/m
Figure 2. Variation of dielectric permittivity and conductivity forcorn syrup.
The propagation constant
γ =√jωµ0(σ + jωε) = α + jβ (3)
where α represents the attenuation factor and β the phase factor. Theconductivity σ is given by
σ = ωε0ε′′r (4)
Substituting Equations (1), (2) and (4) in (3) and simplifying, we get
α = 2πf√µ0ε0ε′r
[√1 + tan2 δ − 1
](5)
and
β = 2πf√µ0ε0ε′r
[√1 + tan2 δ + 1
](6)
If the wave is considered traveling in the +z direction, e−αz representsthe decaying envelope of the wave and e−βz represents the sinusoidalnature of the wave whose phase is βz. The total loss encountered bythe wave over a distance z consists of dissipation loss Ldiss due toconduction currents being excited in the medium and diffusion lossLdiff due to the spherical spreading of energy [11].

154 Bindu et al.
They are given by,
Ldiss = 20 log10 eαz (7)
Ldiff = 20 log10(βz) − 29.14(dB) (8)
Hence the total lossLtotal = Ldiss + Ldiff (9)
Frequency MHz
1500 2000 2500 300 0 3500 4000 450 0
Prop
aga
tion
Lo
ss d
B
0
2
4
6
8
10
12
14
16
18
20
Dissipation LossDiffusion LossTotal Loss
Figure 3. Propagation loss characteristics of corn syrup.
Figure 3 shows the propagation loss characteristics of corn syrup.It is seen that losses increase with frequency, which is due to theincrease of conductivity. Table 1 compares the loss parameters ofdistilled water and saline [11] with corn syrup at 3000 MHz, ata distance of 12 cm. from the transmitter. The loss values areacceptable when compared to the loss parameters of conventionalcoupling medium like distilled water and saline [11]. It is reportedthat in water the rate of increase of loss vs. distance is much higherdue to the dominant dissipation loss.
2.3. Antenna Design
Coplanar strip line fed bowtie antennas generating TM01 mode aredesigned for both transmission and reception of microwave signals.

Progress In Electromagnetics Research, PIER 58, 2006 155
Table 1. Propagation loss parameters of water, corn syrup and salineat 3000 MHz at a distance of 12 cm. from the transmitter.
SampleTotal loss dB
Dissipation Loss + Diffusion Loss
Corn syrup 10.7
Water 180
Saline (0.5% NaCl) 165
As confocal microwave technique (CMT) is a time domain approach,bandwidth is the major deciding factor in the antenna design. Theexperimental investigation [15, 16] shows that the designed antenna,in air, exhibits enhanced 2:1 VSWR bandwidth of ∼46% in theoperational band of 1850–3425 MHz with a return loss of −53 dB.In corn syrup, the bandwidth is enhanced to 91% in the range of1215 MHz–3810 MHz with resonant frequency of 2855 MHz and returnloss of −41 dB. Figure 4 shows the radiation characteristics of theantenna. This enhanced bandwidth is beneficial to transmit shorttransient pulses in CMT. The same antenna is used for microwavetomographic imaging too at the frequency of 3000 MHz.
Frequency GHz
1 2 3 4 5
S11
dB
-60
-50
-40
-30
-20
-10
0
In airIn corn syrup
Figure 4. Radiation characteristics of bowtie antenna.

156 Bindu et al.
2.4. Samples
Samples of breast tissues of four patients are collected fromDepartment of Surgery, Lourde Hospital, Kochi and are subjected tostudy within 30 minutes of mastectomy. Cancerous tissue of ∼ radius0.5 cm inserted in normal tissue of ∼ radius 1 cm, of patient 1, is takenas sample 1. Samples 2 and 3 consists of four tumorous inclusionsof ∼ radius 0.25 cm each inserted in normal tissue of ∼ radius 1 cm,of patients 2 and 3. Scattered inclusions of cancerous tissue of ∼radius 0.1 cm each inserted in normal tissue, of patient 4 is treatedas sample 4. The samples are supported on a cylindrical PVC holder(tan δ = 0.0018 and εr = 2.4 at 3000 MHz) of height 15 cm at thecenter of the measurement set up as shown in Figure 1.
3. METHODS
3.1. Confocal Microwave Technique
Versions of video pulse radars were first introduced for medicalapplications as a means to detect malignancy in internal biologicaltissues by Hagness et al. [17, 18]. Fear et al. [5, 19, 20] demonstratedthe feasibility of detecting and localizing small tumors in threedimensions. In contrast to X-ray mammography, the non-ionizingCMT exploits the translucent nature of the breast and obtains alarge dielectric contrast of the tissues according to their water content.Moreover CMT avoids complex image reconstruction algorithms. Asthe illuminating signal is wide band, a simple time shifting andsumming the signals are enough to detect the malignant tissues.
3.1.1. Data Acquisition
In CMT, same antenna is used for both transmission and reception ofmicrowave energy. To acquire data, the tissue sample is illuminatedby the wide band bowtie antenna and the same antenna collects theback-scattered waves. The antenna is rotated around the sample ata radius of 6 cm and measurements are taken for every 10◦ positionof the antenna. A time-shift-and-add algorithm is applied to the setof recorded pulses to enhance the returns from high contrast regionsand reduce clutter. This involves computing the time delay for theroundtrip between each antenna position to a point in the domain ofinterest, then adding the corresponding portions of the time signalsrecorded at each antenna position.

Progress In Electromagnetics Research, PIER 58, 2006 157
3.1.2. FDTD Analysis
To validate the experimental investigation, the theoretical analysisis done using finite difference time domain (FDTD) method. Thedispersive nature of the dielectric medium is incorporated in theconstitutive FDTD equations using first order Debye dispersionrelation [21, 22]. The geometry under consideration consists of aninfinitely long multilayered cylinder of dispersive dielectric nature withits axis in the z direction. In the z direction the scatterer geometry isassumed to be uniform, and hence the field variations are zero. Whenthis assumption is incorporated in the Maxwell’s curl equations, thevariations of the electric and magnetic fields exist only with respectto the x and y spatial coordinate variables and with respect to thetime parameter variable. For the source excitation a constant currentsource confined in the xz plane polarized in the negative z directionis considered. So the x and y components of the electric currentdensity do not exist. Hence the problem is treated as 2-D with onlyEz, Hx, and Hy fields present. The electric and magnetic fields in anon magnetic medium is given by,
Hx(i, j, t+1) = Hx(i, j, t) − dt
µ0dy(Ez(i, j, t) − Ez(i, j − 1, t)) (10)
Hy(i, j, t+1) = Hy(i, j, t) −dt
µ0dx(Ez(i, j, t) − Ez(i− 1, j, t)) (11)
Ez(i, j, t+1) =ε∞
ε∞ + χ0(i, j)Ez(i, j, t)
+1
ε∞ + χ0(i, j)
t−1∑m=0
Ez(i, j, t−m)∆χm(i, j)
+dt
ε∞ + χ0(i, j)ε0dx(Hy(i + 1, j, t) −Hy(i, j, t))
− dt
ε∞ + χ0(i, j)ε0dy(Hx(i, j + 1, t) −Hx(i, j, t))
(12)
whereχ0(i, j) = (εs − ε∞)(1 − exp(−dt/t0)) (13)
is the susceptibility function.
∆χm(i, j) = (εs − ε∞)(exp(−mdt/t0)(1 − exp(−dt/t0))2 (14)
where εs is the static permittivity, ε∞ is optical permittivity and t0 isthe dielectric relaxation time. A Gaussian pulse of half width T as 18 ps

158 Bindu et al.
with time delay of 54 ps is selected as the source of excitation. Thecomputational domain is discretized as 120×120 Yee cells. Space stepof 1 mm and time step of 6.05 ps are chosen to ensure propagation of thewaves in the entire domain. Mur’s second order absorbing boundaryconditions are applied to terminate the FDTD grid.
3.2. 2-D Microwave Tomographic Imaging
The problem of microwave tomographic imaging has been a topic oftheoretical and experimental study for many years. Several researchgroups are investigating microwave tomography for breast cancerdetection [23–26].
3.2.1. Data Acquisition
For data acquisition, the breast sample is illuminated by bow-tieantenna at a frequency of 3000 MHz. As shown in Figure 1, thetransmitting antenna is fixed at a radius of 6 cm. on the circularrail, while the receiving antenna is rotated around the object at 6 cm.radius. The platform upon which the sample is mounted is rotatedfrom 0◦ to 360◦ in steps of 10◦ and the receiving antenna is rotatedfrom 30◦ to 330◦ in steps of 10◦. For every 10◦ rotation of the platformwith the sample, the receiving antenna makes the measurement in stepsof 10◦.
3.2.2. Reconstruction Algorithm
The contrast in the dielectric properties of the object creates multiplescattering of the wave inside the object. This poses a non linearinverse scattering problem which is formulated in terms of Fredholmintegral equation of the second kind [27]. The object is consideredinhomogeneous in the xy plane but homogeneous in the z direction.For an incident TM wave, the total electric field at the receiver [28] isgiven by,
φ(r) = φinc,b(r) + ω2µ
∫SdSgb(r, r′)δε(r′)φ(r′) (15)
where r stands for a point in the measurement domain and r′ for theobject domain. φinc, b(r) is the incident field in the presence of thebackground inhomogeneity and the integral term is the scattered fielddue to the dielectric contrast between the scatterer and the backgroundmedium.
δε(r′) = ε(r′) − εb(r′) (16)

Progress In Electromagnetics Research, PIER 58, 2006 159
is called as the object function, the Green’s function and gb(r, r′) thetotal electric field inside the scatterer. Equation (15) is used for boththe forward and inverse solutions. In the forward problem, both themedium properties and the domain of inhomogeneity are known andthe equation is solved to obtain the total electric field. In the inverseproblem, scattered fields are measured at discrete points and themedium properties are the unknowns to be determined. The problemis linearized using distorted Born approximation [28] by replacingφ(r′) with φinc, b(r). As the background medium is inhomogeneous,Green’s function is solved numerically [29]. Discretization of theintegral equation in the inverse problem yields vector representationsof the scattered field and the object profile. As the inverse problemis ill posed, a regularization procedure [27, 28] is employed where anoptimization technique is adopted to minimize the error by minimizinga cost functional. The non-uniqueness and instability of the problemis thus circumvented and an adequate solution is provided. Theobtained δε is used to improve εb(r) which in turn is used to updatethe parameters in Equation (15). The iteration is continued untilconvergence is reached. The imaging area is restricted to 16 × 16pixels due to computational complexity. The sampling rate consideredis 0.1λ.
4. RESULTS AND DISCUSSIONS
Corn syrup sample of dielectric permittivity and conductivity as 18.7and 0.64 S/m at 3000 MHz is used as the coupling medium in thisstudy. In order to check the compatibility of corn syrup with breasttissue samples, dielectric properties of the breast tissue samples aremeasured using cavity perturbation technique and are compared withthat of the corn syrup at a frequency of 3000 MHz. Table 2 showsthe comparison. The measured dielectric parameters of breast tissuesmatch with the literature data too [6, 30]. When corn syrup is usedas coupling medium for imaging normal breast tissue with cancerousinclusion, good resolution is achieved as the dielectric permittivity ofcorn syrup matches with that of the normal breast tissue as seen inTable 2. As the conductivity of the medium is less than that of theactual tissue sample, loss tangent decreases and hence the propagationloss.
Figures 5–8 show the time domain response of the breast tissuesamples 1–4. In all the figures, the first and the last peaks in theencircled region, represent reflections from the corn syrup — normaltissue interface. As the dielectric contrast is less here, the reflectionsare less compared to the reflections produced by the cancerous

160 Bindu et al.
Table 2. Dielectric parameters of breast tissue samples and corn syrupmeasured using cavity perturbation technique at 3000 MHz.
Sample Dielectric permittivity Conductivity S/m
Breast Normal 24.82 1.21tissue,
Patient 1 Cancerous 32.31 1.95
Breast Normal 18.85 0.72tissue,
Patient 2 Cancerous 38.73 2.25
Breast Normal 19.98 0.92tissue,
Patient 3 Cancerous 39.5 2.33
Breast Normal 23.7 1.15tissue,
Patient 4 Cancerous 29.2 1.37
Corn syrup 18.7 0.64
Figure 5. Time domain responses of sample 1 (of patient 1) — singlecancerous tissue of ∼ radius 0.5 cm inserted in normal tissue of ∼ radius1 cm.

Progress In Electromagnetics Research, PIER 58, 2006 161
Figure 6. Time domain responses of sample 2 (of patient 2) — fourtumorous inclusions of ∼ radius 0.25 cm each, inserted in normal tissueof ∼ radius 1 cm.
tissues. Other tall peaks correspond to the reflections from the tumorinclusions. In Figure 5, experimental and FDTD results show goodagreement as there is only a single tumour inclusion in sample 1. TheFDTD and experimental results do not agree well in Figures 6–8,due to the presence of multiple inclusions. Reflections from nearbycontrast points overlap and get represented as a single point. Thetime shift and add algorithm applied to the experimental data makesthe reflected signals from tumors located opposite to each other tooverlap. Even though exact tumor locations are difficult to figurize,regions of dielectric contrast are satisfactorily detected using this timedomain confocal microwave technique. Approximate tumor locationswith respect to the tallest peak in the figures are calculated from theequation for velocity of propagation.
The velocity of propagation depends on the dielectric permittivityof the medium given by,
ν =2dt
(17)
whereν =
c√εr
(18)
d is the distance, t is the time taken for propagation, εr is thedielectric constant of the medium/normal tissue measured using cavity

162 Bindu et al.
Figure 7. Time domain responses of sample 3 (of patient 3) — fourtumorous inclusions of ∼ radius 0.25 cm each, inserted in normal tissueof ∼ radius 1 cm.
perturbation technique and c is the velocity of light in free space. Theresults are tabulated in Table 3.
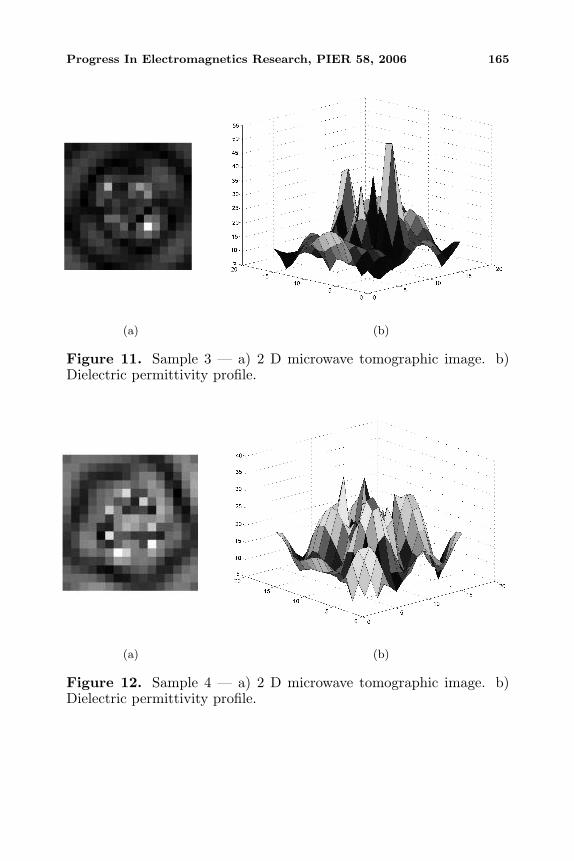
The reconstructed 2-D tomographic images for the breast samples1–4 are shown in Figures 9–12. The dielectric contrast of the samples isclearly distinguishable from the images as well as from the permittivityprofiles. Samples 1–3 are having ∼ circular cross section withoutany cover, where as sample 4 is covered in a thin conical polythenepaper. This is done to check whether the shape of the sample too is
Table 3. Approximate tumor locations with respect to the firsttumorous inclusion (i.e., with respect to the tallest peak in time domaingraphs).
Sample Actual distance of tumor Approximate distance calculated
from the antenna from experimental
(cm) time domain data (cm)
1 7 6.38
2 6.5 6.16
3 6.5 6.06
4 6.5 6.1

Progress In Electromagnetics Research, PIER 58, 2006 163
Figure 8. Time domain responses of sample 4 (of patient 4) —scattered tumorous inclusions of ∼ radii 0.1 cm. each inserted innormal tissue.
reconstructed properly. As the dielectric permittivity of the couplingmedium and the normal breast tissue samples are in good match, thetumor inclusions are clearly visible in Figures 9–11. In Figure 12,the shape of the sample too is reconstructed and is seen with a blackborder. This is due to the fact that polythene paper exhibits a verylow permittivity of εr 2.2 at 3000 MHz. Scattered tumor inclusions areclearly distinguishable in the image. A resolution of 2 mm is achievedin this reconstruction with the use of corn syrup as the couplingmedium. A comparison of the obtained permittivity values of thebreast samples from Figures 9–12 with that measured using cavityperturbation technique reported in Table 2 shows good agreement.
5. SOURCES OF ERROR AND ACCURACYCONDITIONS
Early stage tumor detection is the attractive feature of the proposedmicrowave medical imaging. So care is taken to eliminate all possibletypes of errors. In the present study HP 8510 network analyzer is used.Accuracy of this instrument is 0.001 dB for power measurement, 1 Hzfor frequency measurement and 0.01 ns for time domain measurement[31]. Main sources of experimental errors are 1) Edge reflections from

164 Bindu et al.
(a) (b)
Figure 9. Sample 1 — a) 2 D microwave tomographic image. b)Dielectric permittivity profile.
(a) (b)
Figure 10. Sample 2 — a) 2 D microwave tomographic image. b)Dielectric permittivity profile.
Progress In Electromagnetics Research, PIER 58, 2006 165
(a) (b)
Figure 11. Sample 3 — a) 2 D microwave tomographic image. b)Dielectric permittivity profile.
(a) (b)
Figure 12. Sample 4 — a) 2 D microwave tomographic image. b)Dielectric permittivity profile.

166 Bindu et al.
the antenna: The FDTD computed end-reflections observed at the feedpoint of the bowtie antenna relative to the exciting pulse is −24 dB. Forthe CMT a time gating of 9.07 ns is provided from the network analyzerto remove these reflections. More over calibration of the systemwas performed in the coupling medium in the absence of the breastsamples. 2) Reflections from the sample holder: The tissue samplesare supported on a low loss PVC pipe having loss tangent (tan δ) 0.002.Hence reflections are negligible. 3) Medium reflections: As the tumorunder study is immersed in a matching coupling medium, reflectionsare minimized and good resolution of the reconstructed image isensured. 4) Validity of distorted Born approximation to linearize theinverse scattering problem: This method is adopted to reduce thecomputational complexity. Acceptable values of permittivity profilesare obtained with in vitro breast studies. The matter has to befurther investigated with strong scatterers and fast forward iterativesolvers. 5) Convergence: To ensure that global convergence is achieved,we performed five iterations and the same profile as with the fourthiteration was obtained.
6. CONCLUSION
Active microwave imaging is explored as an imaging modality for earlydetection of breast cancer. In vitro studies on normal and malignantbreast tissues suggest that microwave tomographic imaging couldsatisfactorily image the tissues showing clear discrimination in termsof dielectric permittivity. Using confocal microwave technique, thelocation of the tumor could be satisfactorily detected as the strengthof the reflected signals in the time domain varies with dielectric contrastwhich in turn depend on the bound water content of the tissues. Hencemicrowave imaging can be considered for early stage breast cancerdetection.
ACKNOWLEDGMENT
Authors G. Bindu and Anil Lonappan thankfully acknowledge Councilof Scientific and Industrial research, Govt. of India for providing SeniorResearch Fellowships.
REFERENCES
1. Huynh, P. T., A. M. Jarolimek, and S. Dayee, “The false-negativemammogram,” Radiographics, Vol. 18, 1137–1154, 1998.

Progress In Electromagnetics Research, PIER 58, 2006 167
2. Elmore, J. G., M. B. Barton, V. M. Moceri, S. Polk, P. J. Arena,and S. W. Fletcher, “Ten year risk of false positive screeningmammography and clinical breast examinations,” New EnglandJournal of Medicine, Vol. 338, 1089–1096, 1998.
3. Fear, E. C. and M. A. Stuchly, “Microwave detection ofbreast cancer,” IEEE Transactions on Microwave Theory andTechniques, Vol. 48, 1854–1863, 2000.
4. Fear, E. C., S. C. Hagness, P. M. Meaney, M. Okoniewski, andM. A. Stuchly, “Enhancing breast tumor detection with near fieldimaging,” IEEE Microwave magazine, Vol. 3, 48–56, 2002.
5. Fear, E. C., X. Lii, S. C. Hagness, and M. A. Stuchly, “Confocalmicrowave imaging for breast cancer detection: localization oftumors in three dimensions,” IEEE Transactions on BiomedicalEngineering, Vol. 49, 812–821, 2002.
6. Chaudhary, S. S., R. K. Mishra, A. Swarup, and J. M. Thomas,“Dielectric properties of normal and malignant human breasttissues at radiowave and microwave frequencies,” Indian Journalof Biochemistry and Biophysics, Vol. 21, 76–79, 1981.
7. Semenov, S. Y. et al., “Microwave tomography: Two-dimensionalsystem for biological imaging,” IEEE Transactions on BiomedicalEngineering, Vol. 43, 869–877, 1996.
8. Rangayyan, R. M., N. M. El-Faramawy, J. E. L. Desautels, andO. A. Alim, “Measures of acutance and shape for classification ofbreast tumor,” IEEE Transactions on Medical Imaging, Vol. 16,799- 810, 1997.
9. Meaney, P. M., M. W. Fanning, D. Li, S. P. Poplack, andK. D. Paulsen, “A clinical prototype of active microwave imagingof the breast,” IEEE Transactions on Microwave Theory andTechniques, Vol. 48, 1841–1853, 2000.
10. Meaney, P. M., S. A. Pendergrass, M. W. Fanning, D. Li,and K. D. Paulsen, “Importance of using reduced contrastcoupling medium in 2D microwave breast imaging,” Journal ofElectromagnetic Waves and Application, Vol. 17, 333–355, 2003.
11. Foti, S. J., R. P. Flam, J. F. Aubin, L. E. Larsen, andJ. H. Jacobi, “A water immersed microwave phased array systemfor interrogation of biological targets,” Medical Applications ofMicrowave Imaging, 148–166, IEEE Press, New York, 1986.
12. Bindu, G., A. Lonappan, V. Thomas, V. Hamsakutty,C. K. Aanandan, and K. T. Mathew, “Microwave characterizationof breast phantom materials,” Microwave and Optical TechnologyLetters, Vol. 43, 506–508, 2004.

168 Bindu et al.
13. Mathew, K. T. and U. Raveendranath, Sensors Update, 185–210,Wiley–VCH, Germany, 1999.
14. Gabriel, S., R. W. Lau, and C. Gabriel, “Dielectric properties ofbiological tissues: II. Measurements in the frequency range 10 Hzto 20 GHz,” Physics in Medicine and Biology, Vol. 41, 2251–2269,1996.
15. Bindu, G. et al., “Wideband bowtie antenna with coplanarstripline feed,” Microwave and Optical Technology Letters, Vol. 42,222–224, 2004.
16. Bindu, G., A. Lonappan, C. K. Aanandan, and K. T. Mathew,“Wideband bowtie antenna for confocal microwave imaging,”Asia Pacific Microwave Conference 2004, APMC 04/C/449, NewDelhi, India, 2004.
17. Hagness, S. C., A. Taflove, and J. E. Brdiges, “Two-dimensionalFDTD analysis of a pulsed microwave confocal system for breastcancer detection: fixed focus and antenna array sensors,” IEEETransactions of Biomedical Engineering, Vol. 45, 1470–1479, 1998.
18. Hagness, S. C., A. Taflove, and J. E. Brdiges, “Three-dimensionalFDTD analysis of a pulsed microwave confocal system for breastcancer detection: Design of an antenna array element,” IEEETransactions of Antennas and Propagation, Vol. 47, 783–791,1999.
19. Fear, E. C., J. Sill, and M. A. Stuchly, “Experimental feasibilityof breast tumor detection and localization,” IEEE MTT-S Digest,383–386, 2003.
20. Fear, E. C., J. Sill, and M. A. Stuchly, “Experimental feasibilitystudy of confocal microwave imaging for breast tumor detection,”IEEE Transactions on Microwave Theory and Techniques, Vol. 51,887–892, 2003.
21. Kosmas, P., C. M. Rappaport, and E. Bishop, “Modeling withthe FDTD method for microwave breast cancer detection,” IEEETransactions on Microwave Theory and Techniques, Vol. 52, 1890–1897, 2004.
22. Luebbers, R., F. P. Hunsberger, K. S. Kunz, R. B. Standler,and M. Schneider, “A frequency dependent finite-difference timedomain formulation for dispersive materials,” IEEE Transactionson Electromagnetic Compatibility, Vol. 32, 222–227, 1990.
23. Meaney, P. M., K. D. Paulsen, A. Hartov, and R. K. Crane,“Microwave imaging of tissue assessment: Initial evaluation inmultitarget tissue equivalent phantoms,” IEEE Transactions onBiomedical Engineering, Vol. 43, 878–890, 1996.

Progress In Electromagnetics Research, PIER 58, 2006 169
24. Li, D., P. M. Meaney, T. Raynolds, S. Pendergrass, M. Fanning,and K. D. Paulsen, “A parallel-detection microwave spectroscopysystem for breast imaging,” Review of Scientific Instruments,Vol. 75, 2305–2313, 2004.
25. Meaney, P. M., K. D. Paulsen, and J. T. Chang, “Near-field microwave imaging of biologically based materials using amonopole transceiver system,” IEEE Transactions on MicrowaveTheory and Techniques, Vol. 46, 31–44, 1998.
26. Bulyshev, A. E. et al., “Computational modeling of three-dimensional microwave tomography of breast cancer,” IEEETransactions on Biomedical Engineering, Vol. 48, 1053–1056,2001.
27. Taflove, A., Advances in Computational Electrodynamics: TheFinite Difference Time Domain Method, Artech House. Inc.,Norwood, MA, 1998.
28. Chew, W. C. and Y. M. Wang, “Reconstruction of two-dimensional permittivity distribution using the distorted borniterative method,” IEEE Transactions on Medical Imaging, Vol. 9,218–225, 1990.
29. Richmond, J. H., “Scattering by a dielectric cylinder of arbitrarycross section shape,” IEEE Transactions on Antennas andPropagation, Vol. 13, 334–341, 1965.
30. Campbell, A. M. and D. V. Land, “Dielectric properties of femalehuman breast tissue measured in vitro at 3.2 GHz,” Physics inMedicine and Biology, Vol. 37, 193–210, 1992.
31. HP8510C Network Analyzer Operating and Programming Man-ual, Hewlett-Packard, 1988.