active sitting in office work - karolinska...
TRANSCRIPT

Active Sitting in Office Work
The influence of an activated center-tilt mechanism on human activity, posture, comfort and office performance in office workers during a simulated keyboard task in a laboratory environment and at
the work site.
Official report
Karolinska Institutet
Department of Neurobiology, Care Sciences and Society, Division of Physiotherapy
Wim Grooten Registered physical therapist, associate professor

PREFACE
The present report presents the results from two studies performed by the Karolinska Institutet in a project on behalf by the chair company Scandinavian Business Seating. The project leader, Wim Grooten, is responsible for the results published in this report. The report is based on collaboration between several senior researchers, and several students on doctoral and bachelor levels have been involved in this project. Based on this report, the project group aims to publish the present data in scientific journals. This means that some of the present data needs to be recalculated, e.g. taken into account the large number of statistical tests or gender differences, and that means that the results in this report could possible somewhat differ from the forthcoming publications. We want to send our special thanks to all the subjects in the laboratory and field study, all the students, and to the ergonomists that were involved in the field study. Finally, we would like to thank Erlend Weinholdt from Scandinavian Business Seating for the nice corporation during this whole project.
Wim Grooten, registered physical therapist, associate professor and
Erika Franzén, registered physical therapist, associate professor Björn Äng, registered physical therapist, associate professor
Maria Hagströmer, registered physical therapist, associate professor David Conradsson, registered physical therapist, doctoral student

Content
PREFACE .......................................................................................................................................................... 2 SUMMARY ........................................................................................................................................................ 1 LIST of ABBREVATIONS ............................................................................................................................. 2 1. INTRODUCTION ................................................................................................................................... 3
1.1 Ergonomics ........................................................................................................................................ 3 1.2 Prolonged sitting ............................................................................................................................... 3
1.2.1 Sitting as independent risk factor................................................................................................ 3 1.2.2 Review of the literature ................................................................................................................ 4
1.3 Chair design ........................................................................................................................................ 7 1.3.1 Previous studies ............................................................................................................................. 7 1.3.2 Scandinavian Business Seating .................................................................................................... 8
2. PURPOSE AND RESEARCH QUESTIONS .................................................................................... 9 2.1 Primary research questions .............................................................................................................. 9 2.2 Secondary research questions .......................................................................................................... 9 2.3 Hypotheses ......................................................................................................................................... 9 2.4 Importance ....................................................................................................................................... 10 2.5 Ethics ................................................................................................................................................ 10
3. METHODS LABORATORY STUDY ............................................................................................... 11 3.1 Design ............................................................................................................................................... 11 3.2 Subjects ............................................................................................................................................. 11 3.3 Setup .................................................................................................................................................. 12
3.3.1 Kinematics .................................................................................................................................... 12 3.3.2 Kinetics ......................................................................................................................................... 12 3.3.3 Accelerometry .............................................................................................................................. 12
3.1 Simulated office work ..................................................................................................................... 14 3.1.1 Desk Task ..................................................................................................................................... 14 3.1.2 Keyboard Task ............................................................................................................................ 14 3.1.3 Mouse Task .................................................................................................................................. 14
3.2 Conditions ........................................................................................................................................ 15 3.3 Procedure ......................................................................................................................................... 16 3.4 Outcome variables .......................................................................................................................... 17
3.4.1 Kinematics .................................................................................................................................... 17 3.4.2 Kinetics ......................................................................................................................................... 17 3.4.3 Accelerometer data ..................................................................................................................... 18 3.4.4 Posture .......................................................................................................................................... 19 3.4.5 Comfort ........................................................................................................................................ 20 3.4.6 Performance ................................................................................................................................. 20
3.5 Data Treatment and Statistics ....................................................................................................... 20 3.5.1 Main outcome “human activity” measured by kinematics, kinetics and accelerometry. .. 21 3.5.2 Secondary outcomes: posture, comfort, performance........................................................... 21
4. METHODS FIELD STUDY ................................................................................................................ 22 4.1 Design and procedure ..................................................................................................................... 22 4.2 Subjects ............................................................................................................................................. 22 4.3 Measurements .................................................................................................................................. 23

4.4 Outcome measures.......................................................................................................................... 23 4.4.1 Total sitting time ......................................................................................................................... 23 4.4.2 Accelerometry .............................................................................................................................. 23 4.4.3 Comfort ........................................................................................................................................ 24 4.4.4 Data treatment and statistics ..................................................................................................... 24
5. RESULTS AND DISCUSSION - LABORATORY STUDY ......................................................... 25 5.1 Primary outcome “human activity” .............................................................................................. 25
5.1.1 Kinematic parameters ................................................................................................................. 25 5.1.2 Kinetics ......................................................................................................................................... 33 5.1.3 Accelerometry .............................................................................................................................. 41
5.2 Secondary outcomes: posture, performance and comfort. ....................................................... 53 5.2.1 Posture .......................................................................................................................................... 53 5.2.2 Performance ................................................................................................................................. 57 5.2.3 Comfort ........................................................................................................................................ 61
5.3 Summary of findings in the laboratory study .............................................................................. 63 6. RESULTS AND DISCUSSION FIELD STUDY............................................................................. 69
6.1 Time sitting ...................................................................................................................................... 69 6.2 Accelerometry .................................................................................................................................. 70
6.2.1 Mean cpm ..................................................................................................................................... 70 6.2.2 Accelerometry: proportion of subjects with “light physical activity” Mean cpm > 100 counts 71
6.3 Comfort ............................................................................................................................................ 77 6.4 Summary of findings in the field study ........................................................................................ 80
7. OVERALL DISCUSSION AND CONCLUSIONS ........................................................................ 81 REFERENCES................................................................................................................................................ 82 APPENDIX A. Etical approvement ............................................................................................................ 83 APPENDIX B Comfort scale ....................................................................................................................... 84
1
SUMMARY
Introduction: About 70% of all employees work in Sweden every day at a computer-based workstation and 15% exclusively perform computer work during their working day, and these numbers increase each year. Although the scientific evidence needs to be established furthermore, sedentary behavior has recently been identified as an alone-standing risk factor for ill-health and efforts are made to increase human activity levels of office workers. One way to mitigate this is to put efforts on active chairs or standing desks. Different chair companies have been working in this area and recently the HÅG SoFi chair was designed for active sitting. The idea is that by the use of a center-tilt mechanism, the office worker becomes more mobile while still sitting. However, the effects of activating this mechanism on human activity levels during office work are currently not known.
Aim: The aim of this study was therefore to evaluate the HÅG (hereafter centre tilt) chair’s activated center-tilt mechanism in respect to human activity, posture, comfort and office performance. Comparisons were made during simulated office work in the laboratory, with an inactivated center-tilt mechanism, a conventional dynamic chair and standing. Another aim of this study was to compare the centre tilt chair’s activated tilt-mechanism to an inactivated tilt mechanism and the chair they normally use in office workers, with respect to human activity and comfort during three days of registration at the office.
Methods: Using a 3D-motion capture system, force platforms and high frequency digital videocameras, 15 healthy subjects with long computer experience were studied during randomized dynamic and static simulated office work, each recorded during four minutes time sequences. Moreover, five ActiGraph high sensor accelerometers, attached to different body parts and the chair, were used to study human activity levels, which was the primary outcome variable on human activity and operationalized by a large range of parameters on kinematic and kinematic data as well as mean accelerometer counts per minute. Secondary outcomes were posture, performance and comfort ratings. In addition, empirical data on 13 office workers were measured to study the effects during three days of registration at an ordinary office using long-term accelerometer data and comfort ratings as outcomes.
Results: The results showed some positive effects of the center-tilt mechanism on human activity during office work, when studying human activity with kinematic, the kinetic and accelerometer measures in the laboratory study and accelerometer measures of human activity in the field study. The most important positive effect of the center-tilt mechanism was seen using the cpm>100 cut off for the accelerometer of the waist during the laboratory study, in which the activation of the center-tilt mechanism resulted that a larger proportion of the subjects could be classified as performing light physical activity during dynamic office work compared to performing dynamic office work while seated on a conventional chair or standing. Secondary outcomes show neither any positive nor any negative effects on posture, performance or comfort of activating the center-tilt mechanism. Discussion/Conclusion: In general the results confirmed that during most conditions office work can be classified as sedentary. The task performed was a more important contributor to human activity than the sitting or standing conditions. Still, standing and the chair with open center-tilt mechanism was confirmed to promote some positive results, especially in the active desk task where 73 % of the subjects reached the level of light human activity when seated on a center-tilt chair with open mechanism. These results indicate that there is a difference between seating solutions capacity to unconsciously promote human activity without changing behavior. The results of this study also challenges standing as a solution to increase human activity and performance. In several parameters standing was associated with increased human activity, however, not in all parameters and sometimes even associated with lower human activity, thus in contradiction with the primary hypothesis. This indicates that we need to deepen our knowledge of the disadvantages of conventional sitting and advances of light activity during office work to be able to establish better guidance for sedentary office work.
2
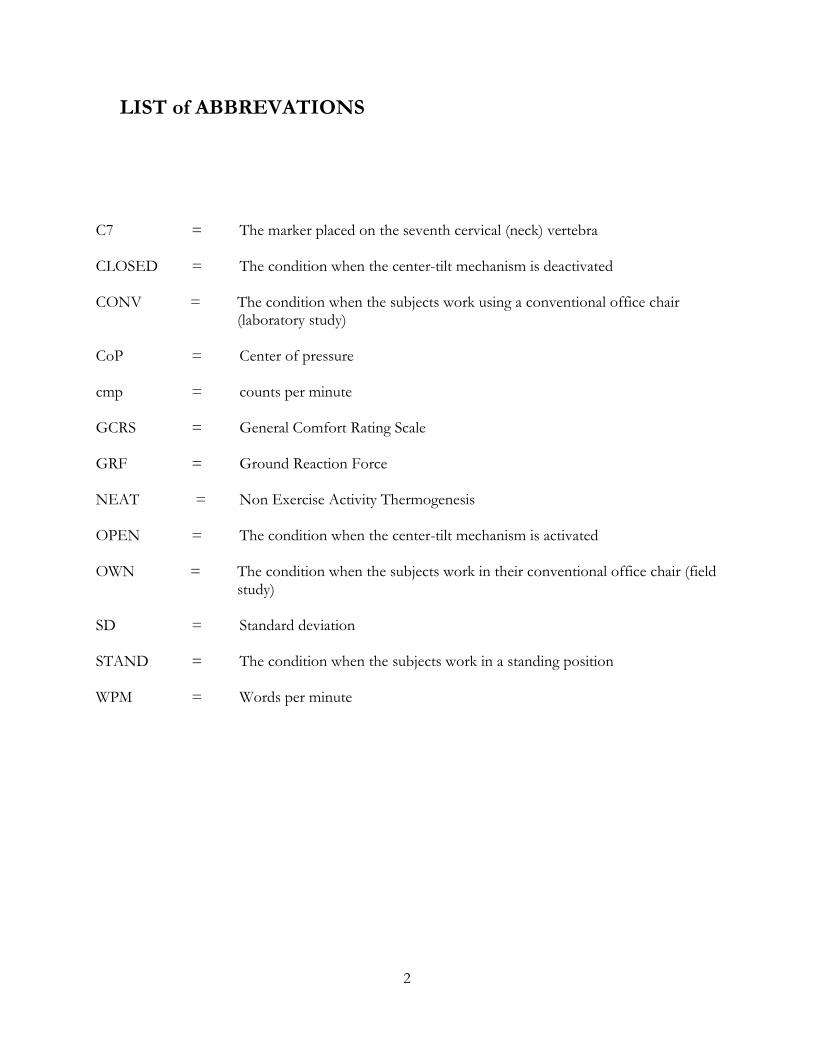
LIST of ABBREVATIONS
C7 = The marker placed on the seventh cervical (neck) vertebra CLOSED = The condition when the center-tilt mechanism is deactivated CONV = The condition when the subjects work using a conventional office chair
(laboratory study) CoP = Center of pressure cmp = counts per minute GCRS = General Comfort Rating Scale GRF = Ground Reaction Force NEAT = Non Exercise Activity Thermogenesis OPEN = The condition when the center-tilt mechanism is activated OWN = The condition when the subjects work in their conventional office chair (field
study) SD = Standard deviation STAND = The condition when the subjects work in a standing position WPM = Words per minute

3
1. INTRODUCTION
1.1 Ergonomics
Ergonomics comprises physical, cognitive and organizational ergonomics. In the earlier days of industrialization, ergonomics was the field to optimize the integration of “man and machine” (human factors) and the physical design of work tools or displays. A proposal to widen the field of ergonomics, both in research and practice has been put forward recently. Here, ergonomics is seen as the theoretical and fundamental understanding of human behavior and performance in the interaction with socio-technical systems, and the application of that understanding is to design technical equipment in the context of real settings (1). This new definition is justified in the financial, technical, legal, organizational, social, political and professional contexts in which ergonomists work. Ergonomics is one of the modern sciences, working as much in the field as in the laboratory. Justification for the new definition is provided by examining the interacting systems which are prevalent in the modern world and which are the domain best understood through the holistic approach of ergonomics (1). Many employers and employees associate “ergonomics” with an office-related environment (office chairs, desks, computers, etc.) and the majority of the ergonomists work with computer workers in that environment. This is not surprising, since about 70% of all employees work in Sweden every day at a computer-based workstation and 15% exclusively perform computer work during their working day, and these numbers increase each year (2). The vast majority of this work is performed seated on a conventional office chair with a backrest and here the ergonomist has an important task to instruct the office worker to work with a good sitting posture. Ergonomists strive to adjust the chair to the individual in order to lower biomechanical loading to back and shoulder joints and muscles in a position that feels comfortable for the individual office worker. Good comfort is an important feature of the chair and in Sweden there exist regulations about how the chair should be designed in relation to the table, keyboard, mouse and screen (AFS; 1998:5). On the other hand, ergonomists has also other goals to work on and these can be summarized into one word: health promotion. In this respect, it seems to be important increase the workers’ activity levels, and several researchers and public health workers have referred to studies that state that there exists a causal relationship between prolonged sitting and several negative health effects (3).
1.2 Prolonged sitting
1.2.1 Sitting as independent risk factor
Reduction in daily movement is one of the largest changes modern lifestyle has made. Machines rule our lives and makes sitting the most regular performed human activity (compared with running, walking, standing, and lying). Lack of exercise is well known as a risk factor for lifestyle diseases and in population studies, prolonged sitting has been found associated with several risks for health and obesity. Recently, scientists claim that a lack of daily movements has more dramatic effects on health than previously thought (3-5). These scientists argue that sitting itself is an independent risk factor, e.g. independent of the amount of weekly physical exercise. However, the physiological mechanisms are not totally understood. Perhaps lipoproteins play a role in the blood flow since they stop entering into muscles when seated more than an hour (4). When muscles are not used they don’t

4
need energy and lipoprotein goes elsewhere, e.g. get stored in fat cells. Interestingly, most of these scientists within the field of public health do not differentiate on sitting in an office chair, car, bus or sofa, but calculate only time spent sitting, using the concept "NEAT". NEAT stands for "Non-Exercise Activity Thermogenesis" and means all human activity except for sleep, exercise and eating (6). The hypothesis is that when NEAT is in balance, there will be a metabolism in balance and in the long run this will reduce the risk of lifestyle-related diseases. To increase NEAT, ergonomists recommend that the work should rise up from the chair, walk, walk fast, use the stairs, changing seating positions at least every 20 minutes and to activate the big muscles in the lower extremities many times during the day. However, not many RCT have studied the effect of these recommendations in practice, but the implementation of these concepts has already started.
1.2.2 Review of the literature
In order to study the relationship between sitting and health more deeply, we performed a short review of the literature. We wanted to study if recent published studies have come to the same conclusions (Table 1) and we also wanted to study the literature that had reviewed the associations between prolonged sitting and health (Table 2). Three of the four recent published studies included in the review concluded that there were negative effects of prolonged sitting (both in occupational settings and during leisure time) on health parameters such as obesity, mortality and diabetes (Table 1). However, the results are still conflicting. Interestingly, there were differences for men and women and these are difficult to explain if there was a strong causal relationship between hours of sedentary behavior and health. Moreover, two of these recent studies were cross-sectional and it was not clear if the authors had adjusted for total physical activity in their analyses in four standing.

5
Table 1: Recently published papers on the association between sitting and health-related outcomes.
Author Title Type of study Health-related
outcome
Exposure to
siting
Results
Gómez-Cabello
A et al. 2012
(7)
Sitting time increases the
overweight and obesity
risk independently of
walking time in elderly
people from Spain
Cross-sectional
study in a sample
of 3136 people
≥65 years of age
Obesity Sitting time
per day.
A higher prevalence of overweight-obesity, central obesity was found in those who
spent sitting more than 4 h per day and walk less than 1 h. In men, more than 4 h
sitting per day was associated with 1.7-fold higher odds of having central obesity
(95%CI 1.2-2.4). In women, this sedentary behavior increased the risk of overweight-
obesity and overfat by 1.5 (95%CI 1.1-1.9) and 1.4 (95%CI 1.2-1.8), respectively.
Age or time spent walking did not significantly change these results.
George S et al.
2011 (8)
A Prospective Analysis
of Prolonged Sitting
Time and Risk of Renal
Cell Carcinoma Among
300,000 Older Adults
Prospective study.
From 1996
through 2006,
1206 invasive
Renal Cell
Carcinoma (RCC)
cancer cases were
identified.
Renal Cell
Carcinoma
(RCC)
Time spent
watching
television or
videos and
total time
spent sitting
in a typical
24-hr period
No evidence of associations between RCC risk and time spent per day sitting while
watching television or videos (HR7+hrs: <1 hr = 0.96 (0.66, 1.38); p trend=0.707) or
total sitting time (HR9+hrs: <3hrs=1.11 (0.87, 1.41); p trend=0.765). Prolonged
sitting time was not associated with RCC risk among men and women in this large
cohort.
Stamatakis E,
Chau JY,
Pedisic Z,
Bauman A,
Macniven R,
Coombs N,
Hamer M. 2013
(9)
Are Sitting Occupations
Associated with
Increased All-Cause,
Cancer, and
Cardiovascular Disease
Mortality Risk A Pooled
Analysis of Seven British
Population Cohorts
Cohort.
5380 women and
5788 men in
employment
followed up over
12.9 years for
mortality.
Mortality risk
from all-
causes, cancer
or
cardiovascular
disease
Occupationa
l sitting
In men:
No differences in mortality risk from all-causes, cancer or cardiovascular disease
after adjusting for multiple covariates when comparing those in standing/walking
occupations with those in sitting occupations.
In women:
Standing/walking occupations had lower risk of dying from all-causes and cancer (by
32% and 40%, respectively), but not from cardiovascular disease, relative to women
with sitting occupations, after adjusting for multiple covariates.
Aravindalochan
an V, Kumpatla
S, Rengarajan
M, Rajan R,
Viswanathan V.
2014 (10)
Risk of Diabetes in
Subjects with Sedentary
Profession and the
Synergistic Effect of
Positive Family History
of Diabetes
Cross sectional
data of age-
matched 514
subjects
previously
undiagnosed
-Diabetes
-Obesity
Occupationa
l sitting
Higher risk of diabetes was found for subjects with two risk factors: “positive family
history of diabetes” and “spending more than 3 h in sitting per day in the workplace”.
Bank employees performed a more sedentary job compared with schoolteachers. A
significant difference was observed among the bank employees in the prevalence of
central obesity (80.7%) compared with the schoolteachers (73.4%), with a significant
difference in the mean waist circumference between men, but not in women.

6
Table 2: reviews on the relation between sitting and health-related outcomes
Author Title Type of article Health-related outcome
Occupational sitting? Results
Marshall S, Gyi D. 2010 (11)
Evidence of Health Risks from Occupational Sitting - Where Do We Stand?
Review - comment -Cancer -Diabetes
Occupational sitting Cancer was used as health outcome in most of the studies (17 studies; 36% of total studies), with fıve of the 17 studies reporting significant positive associations. The health outcome that has been studied the least was diabetes (9% of the total studies), but the majority of these (75%) reported positive associations.
Proper KI, Singh AS, van Mechelen W, Chinapaw MJ. 2011 (12)
Sedentary behaviors and health outcomes among adults: a systematic review of prospective studies.
Systematic review of prospective studies. 19 studies were included, of which 14 were of high methodologic quality.
-Type 2 Diabetes -Mortality -Endometrial cancer -CVD
Sedentary behavior Insufficient evidence was concluded for body weight–related measures, CVD risk, and endometrial cancer. Moderate evidence (consistent findings in one high quality study and at least one low-quality study, or consistent findings in multiple low-quality studies) for a positive relationship between the time spent sitting and the risk for Type-2 diabetes was concluded. There was no evidence for a relationship between sedentary behavior and mortality from cancer, but strong evidence (>=2 high-quality studies) for all-cause and CVD mortality.
Thorp, A. A., Owen, N., Neuhaus, M., Dunstan, D. W. (13)
Sedentary behaviors and subsequent health outcomes in adults a systematic review of longitudinal studies, 1996-2011
Review 48 papers published between 1996 and January 2011
Disease incidence, weight gain during adulthood, and cardiometabolic risk
Self-reported measures including total sitting time;TV-viewing time only; TV-viewing time and other screen-time behaviors; and TV viewing time plus other sedentary behaviors.
Findings indicate a consistent relationship of self-reported sedentary behavior with mortality and with weight gain from childhood to the adult years. However, fındings were mixed for associations with disease incidence, weight gain during adulthood, and cardiometabolic risk. Of the three studies that used device-based measures of sedentary time, one showed that markers of obesity predicted sedentary time, whereas inconclusive fındings have been observed for markers of insulin resistance.
van Uffelen, J.G., et al. 2010 (14)
Occupational Sitting and Health Risks A Systematic Review
Systematic Review 43 papers: 21% cross-sectional, 14% case–control, 65% prospective
-BMI(n_12) -Cancer(n_17) -Cardiovascular disease (n_8) -Diabetes mellitus (n_4) -Mortality (n_6)
Occupational sitting Prospective studies could not confirm the causal relationship between occupational sitting and BMI, but the majority of them found an association with a higher risk of Diabetes Mellitus and mortality. They conclude that evidence is limited to support a positive relationship between occupational sitting and health risks.

7
Table 2 shows the overview of the reviews on the relationship between prolonged sitting and diabetes, mortality and other health outcomes and also here, the associations were weak and conflicting. More research on this highly actual topic is thus warranted. It is important that studies can differentiate between the directions of causality, i.e. that sedentary behavior (adjusted for total physical activity) leads to ill-health and not the other way around, i.e. that ill-health lead to a sedentary behavior. Until we have this understanding, health promotion should still be directed to the increase of the workers’ activity levels, because of the vast amount of evidence of the positive effects of physical activity. However, the effects of changing sedentary behavior of workers into light physical activity, e.g. by working in a standing position or using dynamic chairs, has not yet been studied with long-term longitudinal studies. Also in this area, there is great need for performing new studies. For ergonomists working practically, it is difficult to know what to do. On one hand, the worker needs to have a comfortable work station, with a chair that gives good support and comfort. However, this might decrease activity levels of the office worker as the worker might prefer a sitting posture before a posture with more activity (standing, walking). On the other hand, ergonomists strives to increase individual’s activity levels, based on the above-mentioned relationship between sedentary time and ill-health. To increase work comfort and at the same time increase the individual’s activity levels is a new dilemma and one of the challenges for ergonomists to handle in the future. Perhaps new ways to sit more dynamically (active sitting) or work in an upright position (standing) could be one of the solutions.
1.3 Chair design
The phrase “ergonomic office chair” is used by many manufacturers worldwide. However, despite years of research on the topic on sitting ergonomics, it is still not known what precisely defines a good ergonomic chair. There are many companies that manufacture ergonomic chairs and in this competitive branch, many companies have ideas what defines a good ergonomic chair. Chair companies want to construct new concepts that differ from the others, in order to stand out. Although these companies claim many positive features of their chairs, not many have tested their concepts on their effect on posture, (muscle) activity levels, biomechanical features, usefulness, comfort, etc. To increase human activity has turned out to become more and more important for chair designers perhaps because of national campaigns like “sitting is the new smoking”. Therefore, sitting on active chairs or exercise balls, or working in a standing position at high desks is now and everywhere introduced.
1.3.1 Previous studies
One recent study on a chair that was designed to increase human activity levels and muscle activity by introducing instability during sitting showed that the muscle activity levels and individual body motion, as measured by center of pressure (CoP) displacement and velocity, were lower in this instable chair compared to a normal stable chair (15). This shows the need to continue evaluating new concepts of chair designs, because even when the concept seems to be promising theoretically, the results could in practice be reversed to the basic ideas. Not many studies have been found that have evaluated the influence of active chairs (designed for dynamic sitting) on muscle and whole body activity levels during office

8
work. However, a recent study compared four specific dynamic office chairs with a conventional office chair on erector spinae and trapezius muscle activity levels, postures and joint angles, as well as physical activity intensity (PAI) levels measured with accelerometry during experimental office work in a movement laboratory and during real work (16). They found that muscle activation revealed no significant differences between the specific dynamic chairs and the reference chair, neither in the laboratory or the field study. Moreover, the analysis of postures and joint angles and PAI levels revealed only a few differences between the chairs, whereas the tasks performed strongly affected the measured muscle activation, postures and kinematics. Thus, the study could not show that dynamic office chairs were related to increased human activity levels. In this study, the conventional dynamic chair used in study was the “Yeah” chair produced by a company named SEDUS (16).
1.3.2 Scandinavian Business Seating
Scandinavian Business Seating develop, manufacture and resell office and canteen/conference chairs. Scandinavian Business Seating AS owns three brands within the same field: HÅG, RH and RBM. HÅG is the largest and leading brand. This company has developed a unique system that creates an “active” chair” by introducing a center-tilt mechanism with an assisted balance point that makes it possible for the office worker to move him/her selves as well as the total chair when seated. The mechanism is designed to balance the center further so that the user don’t experience a stop feeling in the center, but more close to a flow and smooth motion both ways. The effect of this tilting-mechanism has recently been studied by the Scandinavian Business Seating AS in a pilot study on two subjects and showed that the individual activity increased while sitting with this center-tilt mechanism activated (open), compared to the sitting with the center-tilt mechanism not-activated (closed). However, this pilot-study needs to be enlarged in order to be able to study the effects of the center-tilt mechanisms in office workers on individual movements, hereafter further referred to as “human activity”.
9
2. PURPOSE AND RESEARCH QUESTIONS
The aim of this study was to evaluate the HÅG chair’s activated center-tilt mechanism in respect to human activity, posture, comfort and performance. Comparisons were made during simulated office work in the laboratory, with an inactivated center-tilt mechanism, a conventional dynamic chair and standing. Another aim of this study was to compare the HÅG chair’s activated tilt-mechanism compared to an inactivated center-tilt mechanism and the chair they normally use in office workers, with respect to human activity and comfort during three days of registration at the office.
2.1 Primary research questions
Are there any differences in human activity between the chairs with centre-tilt mechanism in the open and closed mode and compared to a conventional dynamic chair and standing? Human activity is studied in three different ways during simulated dynamic and static office work in the laboratory?
What is the contribution of the chair’s open tilt-mechanism to the individual’s total activity level when compared to the centre tilt chair in the closed mode in sedentary computer workers and compared to the subjects’ normally used chair, during three days of registration at the worksite?
2.2 Secondary research questions
Are there any differences in posture, comfort and performance between the chairs center-tilt mechanism in the open and closed mode and compared to a conventional dynamic chair and standing during simulated office work in the laboratory?
Are there any differences in comfort and changes in comfort between the two conditions (centre tilt in open respectively closed mode) and compared to the subjects’ normally used chair, during the three days of registration of sedentary computer workers at the worksite?
2.3 Hypotheses
The main hypothesis was that the chair with an activated centre tilt mechanism has a substantial impact on human activity. It is believed that higher activity levels, as defined by an increased amount of movements and/or larger/faster movements, as well as a higher number of accelerometer counts per minute, are seen when the tilt mechanism is activated compared to when the tilt mechanism is deactivated, and to the conventional dynamic chair in the laboratory study, as well as compared to the subjects’ normally used chairs in the field study. Moreover, it is expected that office work during standing has the highest activity levels. Concerning the secondary outcomes, it was expected that the subjects’ posture or performance is not negatively influenced by the center-tilt mechanism. Concerning the subjects’ subjective assessments of comfort, it was expected that the individuals should rate somewhat higher scores on comfort when the center-tilt mechanism activated.

10
2.4 Importance
This study may lead to a better understanding of dynamic office seating in terms of the effect of office chairs on individual human activity and the relation with comfort/discomfort.
2.5 Ethics
An application to the ethical committee was send before starting the experiments/field study and was approved directly. In the approval of the committee (DNR 2014/1:6, Regionala Etikprövningsnämnden Stockholm, 2014-06-18 (Appendix A)), it is stated that the research will be conducted according to governmental laws and the Helsinki declaration. The research group has good experience from similar studies; both in the laboratory and in the field. The methods used were not complicated and previously no complications have been taken place, nor have any other ethical problems occurred. The Karolinska Institutet has obtained injury insurance for the day(s) the subjects were involved in the study, to cover potential harms to the subjects (Kammarkollegie avtal). The data was coded (taken away any possibility to identify individuals) and will be stored up to ten years after publication in locked computers and the code key is saved elsewhere. Also the video recordings will be stored in this way. The data is in this report and in further publications will be reported on group level and we have done everything that was possible to avoid that individuals that participated could be identified in the study.
11
3. METHODS LABORATORY STUDY
3.1 Design
An experimental design was used, including a repeated measurements in which all subjects performed randomly three simulated office work tasks in four conditions. Kinematic and kinetics were recorded using an opto-electronic system using 9 reflective markers, including two orthogonal digital video cameras, and two force plates. Moreover, five 3D-accelerometers placed on four body parts and the chair, were used to measure human activity. These quantitative measures were completed with measures of performance and subjective ratings of comfort/discomfort.
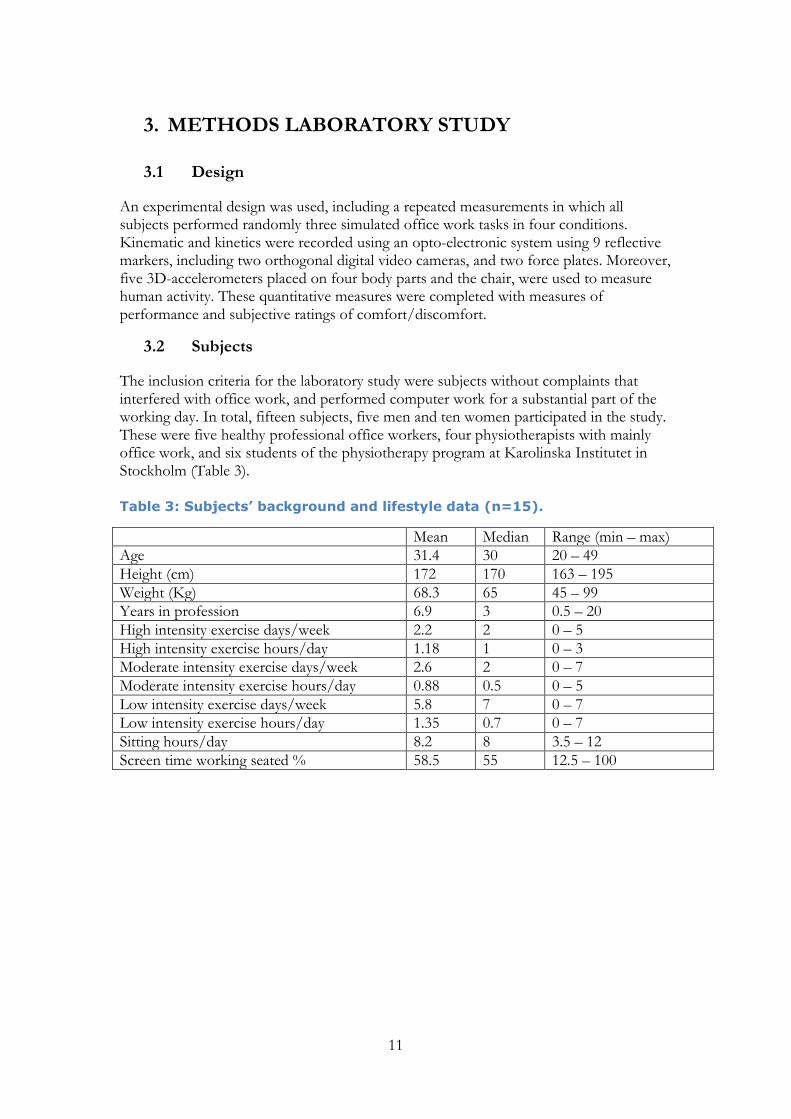
3.2 Subjects
The inclusion criteria for the laboratory study were subjects without complaints that interfered with office work, and performed computer work for a substantial part of the working day. In total, fifteen subjects, five men and ten women participated in the study. These were five healthy professional office workers, four physiotherapists with mainly office work, and six students of the physiotherapy program at Karolinska Institutet in Stockholm (Table 3). Table 3: Subjects’ background and lifestyle data (n=15).
Mean Median Range (min – max)
Age 31.4 30 20 – 49
Height (cm) 172 170 163 – 195
Weight (Kg) 68.3 65 45 – 99
Years in profession 6.9 3 0.5 – 20
High intensity exercise days/week 2.2 2 0 – 5
High intensity exercise hours/day 1.18 1 0 – 3
Moderate intensity exercise days/week 2.6 2 0 – 7
Moderate intensity exercise hours/day 0.88 0.5 0 – 5
Low intensity exercise days/week 5.8 7 0 – 7
Low intensity exercise hours/day 1.35 0.7 0 – 7
Sitting hours/day 8.2 8 3.5 – 12
Screen time working seated % 58.5 55 12.5 – 100
12
3.3 Setup
During this experiment, three different systems were used to simultaneously register human activity: accelerometry, kinematics and kinetics. These systems mirror all different ways of measuring human activity.
3.3.1 Kinematics
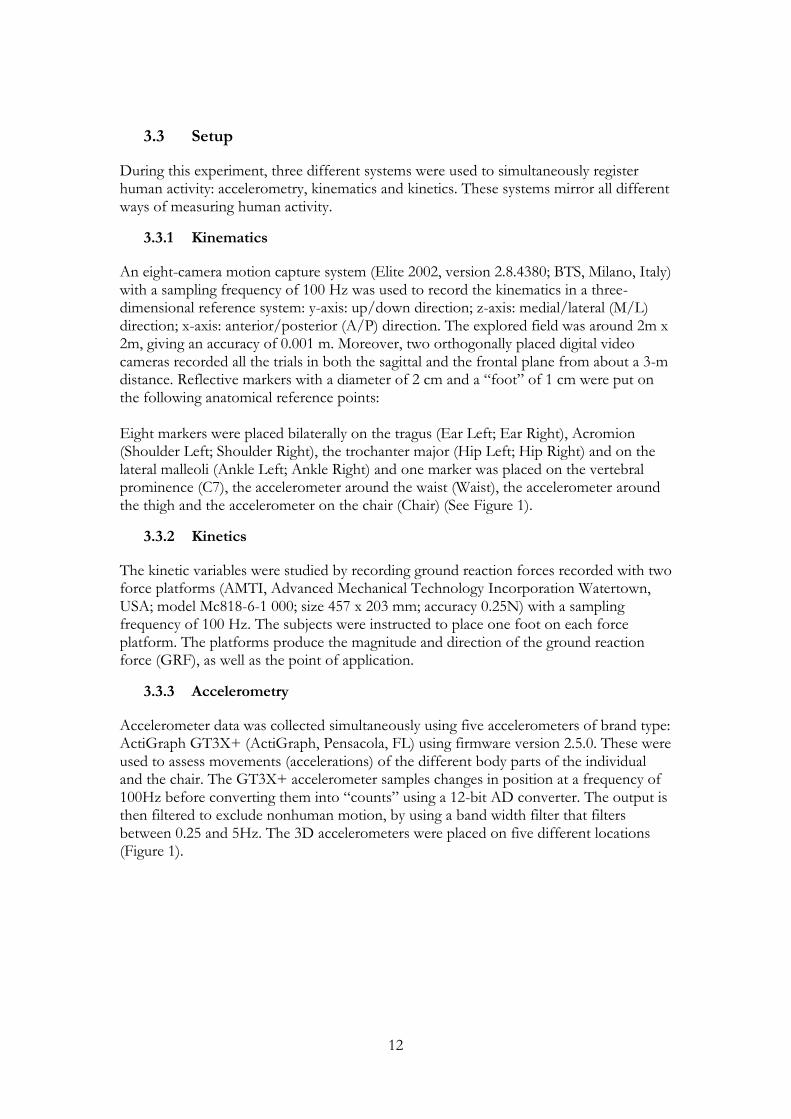
An eight-camera motion capture system (Elite 2002, version 2.8.4380; BTS, Milano, Italy) with a sampling frequency of 100 Hz was used to record the kinematics in a three-dimensional reference system: y-axis: up/down direction; z-axis: medial/lateral (M/L) direction; x-axis: anterior/posterior (A/P) direction. The explored field was around 2m x 2m, giving an accuracy of 0.001 m. Moreover, two orthogonally placed digital video cameras recorded all the trials in both the sagittal and the frontal plane from about a 3-m distance. Reflective markers with a diameter of 2 cm and a “foot” of 1 cm were put on the following anatomical reference points: Eight markers were placed bilaterally on the tragus (Ear Left; Ear Right), Acromion (Shoulder Left; Shoulder Right), the trochanter major (Hip Left; Hip Right) and on the lateral malleoli (Ankle Left; Ankle Right) and one marker was placed on the vertebral prominence (C7), the accelerometer around the waist (Waist), the accelerometer around the thigh and the accelerometer on the chair (Chair) (See Figure 1).
3.3.2 Kinetics
The kinetic variables were studied by recording ground reaction forces recorded with two force platforms (AMTI, Advanced Mechanical Technology Incorporation Watertown, USA; model Mc818-6-1 000; size 457 x 203 mm; accuracy 0.25N) with a sampling frequency of 100 Hz. The subjects were instructed to place one foot on each force platform. The platforms produce the magnitude and direction of the ground reaction force (GRF), as well as the point of application.
3.3.3 Accelerometry
Accelerometer data was collected simultaneously using five accelerometers of brand type: ActiGraph GT3X+ (ActiGraph, Pensacola, FL) using firmware version 2.5.0. These were used to assess movements (accelerations) of the different body parts of the individual and the chair. The GT3X+ accelerometer samples changes in position at a frequency of 100Hz before converting them into “counts” using a 12-bit AD converter. The output is then filtered to exclude nonhuman motion, by using a band width filter that filters between 0.25 and 5Hz. The 3D accelerometers were placed on five different locations (Figure 1).

13
Figure 1: Placement of the accelerometers and opto-electronic reflective
markers.
A. Right upper arm
B. Waist
C. Thigh
D. Right ankle
E. The top of the chair’s back rest
Accelerometers: A= Upper side of the arm B= Waist C= Thigh D= Ankle E= Upper side of the chair
Markers: -Chair -C7 -Tragus (Left and right) -Acromion (Left and right) -Arm -Waist -Trochanter major (Left and right) -Thigh -Ankle (Left and right)

14
3.1 Simulated office work
Office work contains of several different work tasks. In this experiment three different common occurring office tasks were used to represent different types of dynamic and static office work: working with folders, clicking a mouse and writing on the keyboard integrated (Desk task; dynamic), typing on a keyboard (Keyboard task; static) and using the mouse to point and to click (Mouse task; static) (Figure 2).
3.1.1 Desk Task
The desk task is a simulated work task for the imitation of office work with folders. Here, two folders (one green (G) and one yellow (Y)) were placed on each side of the keyboard and each folder contained 20 pages. On each page one English spelled word was written, and the subjects was asked to type this word into an excel file. On the bottom of that page, there was a Y or G, referring to green or yellow, as well as a number between 1 and 20. The subject was then asked to open the page in the corresponding folder and number and to type down the word on that page into the same excel file on the row below and to continue to the next word. This continued until the research leader ended the session at four minutes and the total number of rows completed was noted into the subjects file.
3.1.2 Keyboard Task
This keyboard task was used to simulate office work in which the keyboard is used. The KeyBlaze Typing Tutor – NHC Software was used, in which the subject was asked to write as fast as possible an English text that is specially created to use all the features of the keyboard. Here, the subject need to type exactly as presented on the screen and the keyboard is blocked until the right key is pressed. The software enabled the researcher to program a maximum of test time and automatically the test stopped. The gross Words Per Minute (WPM), the net WPM, the number of errors and corrections, and the accuracy were presented at the final screen. For this experiment, the gross WPM and the accuracy were registered in the subjects’ file.
3.1.3 Mouse Task
This task focused only on pointing and clicking the mouse. The subjects had to put the mouse pointer into a black circle (ball) and to click on the left side of the mouse. If correct, the ball disappeared and appeared directly again, however this time slightly smaller and on a different position of the screen. The subjects were instructed to perform this task repeatedly and as fast as possible. The first circle had a diameter of 52 mm, while the last (number 20) had a diameter of 2 mm. The total amount of seconds that was needed to finish all 20 balls was registered in the subjects’ file. The subject succeeded to perform between 8 and 15 times the test. The median time was calculated for each subject .The task can be downloaded from http://games144.com/game/8895-mouse-speed-n-skill-test-game.php#play

15
A. DESK TASK B. KEYBOARD TASK C. MOUSE TASK
Figure 2: The three tasks of simulated office work:
A. Desk task. One subject during the desk task during the standing
condition
B. Keyboard task. Screen shot when making a mistake (forgetting the
comma).
C. Mouse task. The size and position of the ball to be clicked varies
randomly after every click.
3.2 Conditions
Subjects performed the different office work tasks during four conditions:
OPEN: The centre-tilt office chair with an activated tilt mechanism. The tilt mechanism was activated maximally.
STAND: all tasks were also performed standing and the desk was raised to around elbow height.
CLOSED: The centre tilt office chair with a de-activated tilt mechanism.
CONV: a conventional dynamic chair. In this experiment, the Sedus ”Yeah” was used.
These positions were chosen because of the first two representing the “active” conditions, while the last two were the “stable” conditions. For each condition, the chair position was adjusted to the individual according the instructions available from the chair companies or standard ergonomic recommendations. For the OPEN condition, “the balance point”, i.e. the depth of the seat, was found after adjustment of chair height. The height and width of the arm supports in OPEN, CLOSED and CONV condition were adjusted to the individual by asking the subject to let their arms hang down loosely and close to their body with 90 degrees in elbow flexion. The table and computer screen heights were adjusted to the sitting (standing) position and the position of the mouse and keyboard were placed according the subjects’ own preferences. If the subjects did not have preferences, the top of the screen was adjusted to eye-height of the subject.
16
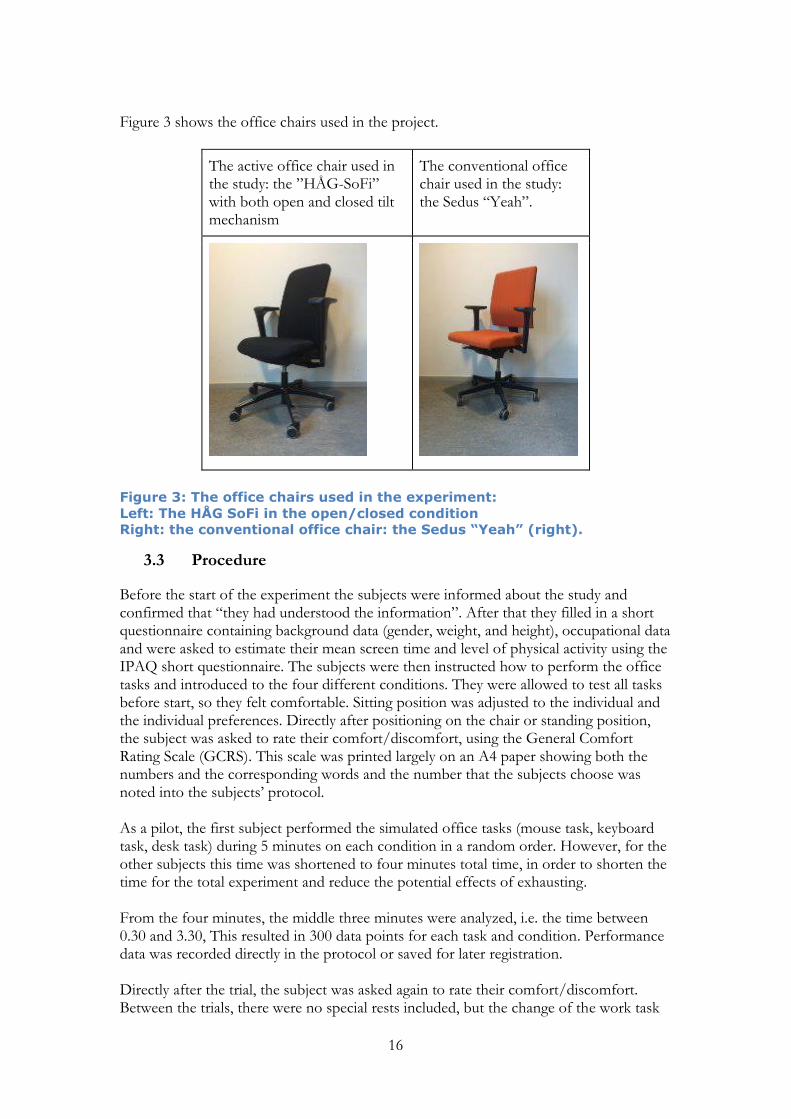
Figure 3 shows the office chairs used in the project.
The active office chair used in the study: the ”HÅG-SoFi” with both open and closed tilt mechanism
The conventional office chair used in the study: the Sedus “Yeah”.
Figure 3: The office chairs used in the experiment:
Left: The HÅG SoFi in the open/closed condition
Right: the conventional office chair: the Sedus “Yeah” (right).
3.3 Procedure
Before the start of the experiment the subjects were informed about the study and confirmed that “they had understood the information”. After that they filled in a short questionnaire containing background data (gender, weight, and height), occupational data and were asked to estimate their mean screen time and level of physical activity using the IPAQ short questionnaire. The subjects were then instructed how to perform the office tasks and introduced to the four different conditions. They were allowed to test all tasks before start, so they felt comfortable. Sitting position was adjusted to the individual and the individual preferences. Directly after positioning on the chair or standing position, the subject was asked to rate their comfort/discomfort, using the General Comfort Rating Scale (GCRS). This scale was printed largely on an A4 paper showing both the numbers and the corresponding words and the number that the subjects choose was noted into the subjects’ protocol. As a pilot, the first subject performed the simulated office tasks (mouse task, keyboard task, desk task) during 5 minutes on each condition in a random order. However, for the other subjects this time was shortened to four minutes total time, in order to shorten the time for the total experiment and reduce the potential effects of exhausting. From the four minutes, the middle three minutes were analyzed, i.e. the time between 0.30 and 3.30, This resulted in 300 data points for each task and condition. Performance data was recorded directly in the protocol or saved for later registration. Directly after the trial, the subject was asked again to rate their comfort/discomfort. Between the trials, there were no special rests included, but the change of the work task

17
and positioning of the next condition took around 1-2 minutes each time. The time for the total experiment was around 1 hour and 20 minutes.
3.4 Outcome variables
The main outcome variable was “human activity”, as registered in three different ways: kinematics, kinetics and accelerometry, and as secondary outcomes we used posture, performance and comfort.
3.4.1 Kinematics
Movements of trunk and chair markers were recorded at 100 Hz. For the trunk, the displacement in x (forward/backward), y (up/down), and z (right/left) directions as well as the SDs of the displacement of trunk were measured by the changes in position of marker on C7 during the experiments. Moreover, these parameters were also obtained during the experiments for the marker on the chair. The following parameters were calculated for both the trunk and chair:
Mean displacement in x, y and z direction. It was calculated by dividing the sum of displacement with the number of observations (mm) for each separate direction.
SD of displacement in x, y and z direction for both the trunk and the chair was calculated and expressed as percentage of the mean (%CV). This parameter mirrors the variation in displacement during the total experiment.
The distance between C7 and the chair in anterior/posterior direction was calculated. This parameter shows the movement of the body in relation to the chair.
For all parameters it was assumed that high numbers reflect high levels of human activity or variation.
3.4.2 Kinetics
The second way of registering “human activity” was the study of the amplitude and movements of the Ground Reaction Forces (GRF) and the Center of Pressure (CoP) during the experiment. The GRF reflects the amplitude of the forces, whereas CoP mirrors the position of the application point on the force platforms. The GRF is created on one hand by the position of the total body mass and on the other hand the (muscle) forces applied to the floor. These were measured by two separate force plates (left and right foot, respectively). The force plates used were two free-lying and calibrated AMTI platforms. The following parameters were calculated for right and left foot, respectively: GRF
The mean of the ground reaction force (GRF) in all directions. The unit of the GRF is Newton (N). High values indicate higher forces. Note, it is not possible to compare the sitting conditions (OPEN, CLOSED, CONV) with STANDING, since in standing all body weight is measured by the force
18
platforms, compared to during the sitting trials, in which only the weight of the legs and muscle forces is registrered.
The standard deviation (SD) of GRF for left and right foot. As the SD is dependent also on the mean level, it is difficult to compare the sitting conditions with standing The SD was therefore divided by the mean (CV%). The unit for GRF is newton (N). High values indicate more variation in force, and is a sign of human activity (movement or muscle activity).
We calculated also the Range GRF (max minus min), expressed in newton (N) and a large values indicate large variation in forces. To enable comparisons between conditions, the range was divided by the mean and multiplied with 100 (Range%).
CoP
The total displacement of CoP (sum) was calculated for each foot and divided by the number of observations, resulting in a mean displacement CoP. The unit is mm.
The standard deviation (SD) of the displacement of CoP was calculated for the left and right foot. High values indicate more variation, and is a sign of human activity (movements or muscle activity).
As the SD could depend on the mean level of CoP, it could be difficult to compare the sitting conditions with standing and the CoP-SD was therefore divided by the mean (CV%). High values indicate more variation, and is a sign of human activity (movements or muscle activity).
The mean velocity of CoP for left and right foot was calculated and expressed in mm/sec. The mean CoP velocity was calculated by taken the difference of the displacement between two consecutive observations, multiplied by 100 and then averaged over the total number of observations.
For all CoP variables it was assumed that high numbers reflect high levels of human activity.
3.4.3 Accelerometer data
For the accelerometer data, the total vector magnitude for each accelerometer was provided in 1 sec epochs and the total number of counts was divided by the total number of observations, resulting in a mean counts per second what was recalculated to the mean counts per minute (cpm) parameter, which was provided for each condition and each task. For this parameter it was regarded that high numbers reflect high levels of human activity. A cut point of 100 cpm is usually used as a cut-off for sedentary work/light physical activity (17, 18). This is the main cut point used in the epidemiological studies in which the health effects of sedentary work have been studied. Note that this cut-off is used for accelerometers at the waist/hip.

19
Three parameters were studied for all the tasks separately,
Total accelerometer counts
mean counts per minutes (cpm) and the percentage of observations that exceeded 100 cpm, i.e. behavior that can be classified as light physical activity.
Logged cpm data
3.4.4 Posture
In the present study, in total three angles were analyzed: the trunk angle in relation to the vertical, the neck angle in relation to the vertical, and the neck angle in relation to the trunk, see Figure 4.
TRUNK. The trunk angle in relation to the vertical was calculated by taking the angle between the vertical axis (y axis) and a line between the acromion and trochanter major on both the left and right side, respectively, and these angles were averaged.
NECK. The neck angle in relation to the vertical was calculated by taking the angle between the vertical axis (y axis) and the segment between C7 and the left and right ear, respectively, and these angles were averaged.
NECK FLEXION. The neck angle in relation to the trunk was calculated by taking the angle between the segment between C7 and anterior to the ear and the segment between the acromion and the trochanter for both the left side and right side, and an average between these angles was calculated.
Lower values for the trunk and neck angle correspond to a more vertical position, which in this study was regarded as “good posture”. However, for the last parameter, “neck flexion”, higher values correspond to a position in which the neck is less flexed, which in this study was regarded as “good posture”.
Figure 4: Schematic drawing of the three angles that define posture:
trunk angle: the angle between the trunk segment and the vertical line
(dotted red line), neck angle: the angle between the neck segment and
the vertical line, and neck flexion: the angle between the neck and trunk
segments.

20
3.4.5 Comfort
The General Comfort Rating Scale (GCRS) was rated two times during each experiment (Appendix B) (19).
START. The subject rated their comfort directly when he/she was ready to start the trial.
END. Directly after the four minutes of simulated office work, the subject rated their comfort again.
Based on these two parameters the difference was calculated by subtracking the end ratings from the start ratings. Values lower than zero indicates a lowering of the comfort during the experiment. Values higher than zero, indicate an increase of comfort during the experiment.
This scale ranks from ”I feel completely relaxed” (10) to ”I feel unbearable pain” (0), with high numbers (7-10) reflecting comfort and low numbers (6 or lower) discomfort (19).
3.4.6 Performance
For all tasks, performance was operationalized as the achievements made during the total experimental time.
For the desk task, the number of words typed in the excel file during the four minutes were counted.
For the keyboard task, the gross words per minute (WPM) was recorded
For the keyboard task, the accuracy percentage (%acc) was recorded.
For the mouse tracking task, the subject reported the time that they needed to complete the series of 20 bolls.
The aforementioned four ranks were summed together to create an overall performance parameter to calculate an “overall performance” for each condition.
For all variables, higher numbers reflect better (more) performance (e.g. higher number of words or better accuracy), with exception of the mouse task, in which a lower number (sec.) reflect a better (faster) movement.
3.5 Data Treatment and Statistics
Kinematic and kinetic data was exported from the BTE Elite system to text files and analyzed by special written scripts in Mathlab (e.g. CoP sum, CoP SD). The processed data was then exported into textfiles. Accelerometer data was processed using the special software ACTIGRAF version 6.11.4, using 1sec epoch and also exported into text files. Then the data was exported to MS Excel for Windows, was sorted and processed (e.g. mean and CV% calculations) and finally imported in SPSS for Windows, version 22 for final statistical analyzes and figures were made in this program as well. Also Statistica STATSOFT was used for the analyses.

21
For the kinematics and kinetics data, we decided that at least 2/3 part of the data should be available to be analyzed, i.e. at least 200 data points should be available. All data was checked for outliers or miscalculations by two different researchers (data cleaning). No such limit was needed for accelerometer data or secondary outcomes. Background data (age, time in profession, screen time, IPAQ data, etc.) was described with mean, standard deviation or median and range. For comparing the different conditions and task, different statistical methods were used depending on the outcome of interest.
3.5.1 Main outcome “human activity” measured by kinematics, kinetics and accelerometry.
Repeated measures ANOVA (task x chair) and Tukey’s test as post-hoc test were used for data with normal distribution. If data was not normal distributed, non-parametric tests were used. Overall effects were tested with related-samples Friedmans’ two-way analyzes of ranks for repeated measures and the Wilcoxon rank sum tests was used as post-hoc test. The data was logged using the natural log and a constant was imputed and then repeated measures ANOVA was used. In these analyzes, differences between the tasks (Desk, Mouse and Keyboard) were not the main interest, so only comparisons between the conditions (OPEN, STAND, CLOSED, CONV) were performed. Post-hoc tests were performed on significant results between the conditions (p < 0.05). When using human activity as defined by percentage of cpm>100, Chi2 tests were used to detect differences between the proportions (p<0.05).
3.5.2 Secondary outcomes: posture, comfort, performance
Posture, comfort and performance were analyzed with non-parametric tests, Related-samples Friedmans’ two-way analyzes of ranks were used to test for overall differences between the conditions and in case p < 0.05, we used the Wilcoxon paired test as post-hoc test,. A significant difference was defined when the p-value was < 0.05. The outcome performance was also analyzed in a different way. For each subject and each task the four conditions were ranked from 1-4 with the best results ranked 1 and the slowest/less results 4. The total results for each cell in the 3 x 4 table were summed (three tasks x four conditions). Thus if one condition was best or worst in one task for all subjects, the total score was 14 (14 x 1) or 56 (14 x 4). Then parametric tests were used to test if there were differences between the mean scores for each condition.

22
4. METHODS FIELD STUDY
4.1 Design and procedure
The field study was designed as a controlled observational study, in which all subjects were their own controls. Thirteen office workers were followed during three whole working days. The subjects were selected by two ergonomists working at the company. These ergonomists were informed about the study protocol and the in- and excluding criteria. Three sessions were performed at three different areas of the large company, to reach a variation of different kind of office workers: secretaries (using foot pedals), engineers and designers. After selecting the subjects, each one was introduced to the study, e.g. informed about the aim, how to write the diary, how to put on the accelerometers, and how to rate comfort. The chair was thoroughly adapted to the individual, i.e. the balance points was adjusted to the center-tilt mechanism. After the information and adjustment of the chair, the subjects signed the letter of “informed content” and they were asked to use, in a random order, the following three conditions.
OPEN: activated center-tilt mechanism
CLOSED: deactivated center-tilt mechanism
OWN: the subjects’ normal office chair The first subject tossed a coin (OPEN or CLOSED) and the other subjects’ start condition was based on this randomization.
4.2 Subjects
Inclusion criteria:
Healthy office workers, i.e. workers without complaints that interfere with office work.
Performing office work (computer work) for a substantial part of the working day.
Working at least 6 hours each day.
Having comparable working days
Able to wear the accelerometers during the whole day Exclusion criteria:
Working in a standing position for more than 30% of the working time. In total six women and seven men participated in the study. Mean age was 39 years (SD 11), with 9 years (SD 8) in the same profession. They had in mean 7 hours screen time per day (SD = 2), which correspond to mean 84% (SD 12) of the working day (Table 4).

23
Table 4: Background data on the subjects in the field study (n=13).
4.3 Measurements
Tri-axial accelerometers, ActiGraph GT3X+ (ActiGraph, Pensacola, FL) using firmware version 2.5.0, were used to assess physical activity of the subject and the chair similar to the laboratory study. The GT3X+ accelerometer samples changes in forces at a frequency of 100Hz before converting them into digital counts using a 12-bit AD converter. The output is then filtered to exclude nonhuman motion; band width 0.25-5Hz. The accelerometers were placed on the same five different body parts (Figure 1)
A. Right shoulder (for measuring trunk movements) B. Waist (for measuring percent of time seated) C. Thigh D. Right ankle (for measuring feet movement) E. Chair’s back rest (for measuring the degree of active sitting)
4.4 Outcome measures
Three outcome measures were used: Total sitting time, whole day measurement of human activity measured by accelerometry counts of five accelerometers and comfort.
4.4.1 Total sitting time
The diaries were used to exclude the times that the subjects were using other chairs (meetings) or in activities not related to work (eg. lunch, coffee breaks). Accelerometer C (thigh) was used to determine if the subject was sitting or not. The inclinometer “sitting” data was used for this purpose. For subjects that were analyzed with 15 sec epochs, if the inclinometer value was 12 or more, the data for the accelerometers were included, if less than 12, the data was excluded. That means that we have chosen a cut-off for sitting at 80% of the time. For subjects that were analyzed with 60s epoch, data was analyzed if the value was 48 or more, otherwise this data was interpreted as “non-sedentary” and excluded from the analyzes (80%).
4.4.2 Accelerometry
Total vector data was analyzed, summing all counts and dividing by the total number of valid data rows, resulting in a mean counts per minute (cmp). Two outcome measures for each accelerometer was calculated:
Mean total cmp for each accelerometer were calculated for the time that the subjects were sitting on the chair of interest.
Subject Gender Age Weight Length Profession Years_profession Screen_time_h Screen_time_perc Pain_Last_Week Pain right now
1 Female 28 77 166 medicine secretary 0,5 8 100 - -
2 Female 62 69 165 medicine secretary 15 6 85 - -
3 Female 55 66 171 adminstrator 20 8 89 - neck/shoulder/back
4 Female 48 73 170 controlller 28 6 85 - -
5 Female 29 48 157 digital modeller 5 9 100 - -
6 Male 49 92 181 digital modeller 15 10 100 neck/shoulder neck/shoulder
7 Male 34 63 169 digital sculpture 7 9 100 - -
8 Male 30 78 190 industrial designer 5 6 75 - -
9 Female 26 70 172 ergonomist 1 6 75 neck/shoulder -
10 Male 35 90 192 engineer 8 6 75 shoulder shoulder
11 Male 45 80 182 industrial designer 15 6 75 arm arm
12 Male 30 86 194 industrial designer 2 5 63 hip hip
13 Male 32 64 172 ergonomist 1,5 6 75 back -
Mean 6F/7M 39 74 175 9 7 84 n=6 n=5
SD 11 12 11 8 2 12

24
Percentage of observations that exceeded 100 cpm, classified as light human activity.
4.4.3 Comfort
Comfort and Discomfort was assessed by the General Comfort Rating Scale (GCRS) (Appendix B). The GCRS evaluates chair discomfort with an 11-point scale and 10 intervals. Each point scale had a comfort and discomfort statement printed along 10 cm vertical line (20). The number 10 on the scale describes being most comfortable and the last point on the scale (1) describes being most uncomfortable. Subjects looked at the words, assessed their (dis)comfort and wrote down the corresponding number in the diary at three times during the day: just after adjustment of the chair (start), at lunch time (lunch) and just before leaving the workplace (finish).
4.4.4 Data treatment and statistics
Total sitting time was found normally distributed and Repeated measures ANOVA was used to detect potential differences between the three conditions. Accelerometer data was also tested if it was normal distributed and, because of it turned out to be skewed, the data was logged using the natural log as in the laboratory study. Then Repeated measures ANOVA was used to detect potential differences between the three conditions. Analyzing “human activity” as defined by percentage of cpm>100, Chi2 tests were used to detect differences between the proportions (p<0.05). Secondary outcome comfort ratings were analyzed similar to the laboratory study for each time period: start, lunch, finish. Here, non-parametric tests were used. Overall effects were tested with related-samples Friedmans’ two-way analyzes of ranks for repeated measures and the Wilcoxon rank sum tests was used as post-hoc test. .
25
5. RESULTS AND DISCUSSION - LABORATORY
STUDY
In this section, the results from both the laboratory experiments are presented using text, graphs and tables or both. In bold style, the main conclusion is given, based on the actual outcome parameter. On the end of this chapter, there is a summary table on all the findings for each outcome measure.
5.1 Primary outcome “human activity”
The primary outcome measures were human activity levels, as measured with different kinematic and kinetic parameters, as well as accelerometry.
5.1.1 Kinematic parameters
5.1.1.1 Chair movements
To see if there were any effects of the activation of the center-tilt mechanism, the displacement in forward (x), upward (y) and sideway (z) directions of the marker that was placed on the highest point of the back rest of the chair was studied. The mean displacement was calculated for each task and condition by dividing the total sum of the displacement with the total number of observations (Table 5). The results showed that when the tilt-mechanism was activated the displacement was higher compared to the conventional chair in four out of nine situations. In all three directions during the desk task, the OPEN condition had higher displacement than the CONV condition. Moreover, this was also the case during the mouse task, in X-direction. The activation of the tilt-mechanism (OPEN) resulted also in higher displacement compared to the situation when de-activated (CLOSED) in two situations: in X-direction during the mouse task and in Z-direction during the keyboard task. The CLOSED condition had higher displacement values compared to the CONV condition during the desk task in Z-direction. These results show that the activated tilt-mechanism increase the movements of the chair in all directions, but mainly during dynamic office work. The standard deviation of the displacement mirrors the amount of change in movements, i.e. human activity (Table 6). Also here, in four out of nine situations the OPEN condition had significantly higher values compared to the CONV condition. The SD was higher, especially in forward/backward (X-) direction, regardless of the task. However, during the desk task, there was also a difference found in Z-direction. It is unclear to what extent these differences were due to the activation of the tilt-mechanism or due to the design of the chair; in only one situation (mouse task, X-direction) there was a significant difference between the OPEN and CLOSED conditions. The CLOSED condition differed from the CONV condition in one situation (desk task Z-direction) (Figure 5). These results show that the activated tilt-mechanism increase the movements of the chair in all directions, but mainly during dynamic office work.

26
CHAIR DISPLACEMENT DESK TASK
X OPEN CLOSED CONV p -value post hoc
n 15 15 15 Open>Conv
MEDIAN 0,27 0,23 0,21 0.014 0.001
MIN 0,20 0,17 0,14
MAX 0,55 0,54 0,47
X
OPEN CLOSED CONV p -value
n 15 15 15
MEDIAN 0,25 0,23 0,21 0.247
MIN 0,14 0,09 0,02
MAX 0,68 0,68 0,31
X MOUSE TASK
OPEN CLOSED CONV p -value post hoc
n 15 15 15 Open>closed Open>Conv
MEDIAN 0,256 0,208 0,220 0.031 0.004 0.027
MIN 0,142 0,108 0,134
MAX 0,786 0,327 0,533
CHAIR DISPLACEMENT
DESK TASK
Y OPEN CLOSED CONV p -value post hoc
n 15 15 15 Open>Conv
MEDIAN 0,138 0,117 0,115 0.004 0.001
MIN 0,117 0,083 0,078
MAX 0,212 0,215 0,200
Y
OPEN CLOSED CONV p -value
n 15 15 15
MEDIAN 0,117 0,097 0,104
MIN 0,076 0,066 0,013 0.549
MAX 0,195 0,238 0,175
Y MOUSE TASK
OPEN CLOSED CONV p -value
n 15 15 15
MEDIAN 0,116 0,109 0,106 0.344
MIN 0,061 0,058 0,077
MAX 0,233 0,166 0,164
CHAIR DISPLACEMENT CHAIR DISPLACEMENT
DESK TASK
Z OPEN CLOSED CONV p -value post hoc
n 15 15 15 Open>Conv Closed>Conv
MEDIAN 0,313 0,316 0,253 0.001 0.001 0.006
MIN 0,233 0,222 0,207
MAX 0,497 0,457 0,508
Z
OPEN CLOSED CONV p -value post hoc
n 15 15 15 Open>closed
MEDIAN 0,232 0,200 0,213 0.038 0.009
MIN 0,147 0,134 0,027
MAX 0,354 0,310 0,344
Z MOUSE TASK
OPEN CLOSED CONV p -value
n 15 15 15
MEDIAN 0,231 0,219 0,243 0.936
MIN 0,170 0,152 0,136
MAX 0,559 0,426 0,902
KEYBOARD TASK
KEYBOARD TASK
KEYBOARD TASK
Table 5: Chair activity measured by mean displacement (mm) of the
marker on the chair during the three tasks and three conditions. Median,
min and max for 15 subjects. The p-values were calculated with
Friedman repeated measures and post-hoc tests using Wilcoxon rank
sum test. Movements in X: forward/backward, Y: up/down, Z: left/right.

27
Figure 5: Chair activity measured by mean displacement (mm) of the
marker on the chair during the three tasks and three conditions. Median
values (n= 15). Significant differences marked with *. Movements in X:
forward/backward, Y: up/down, Z: left/right direction.
28
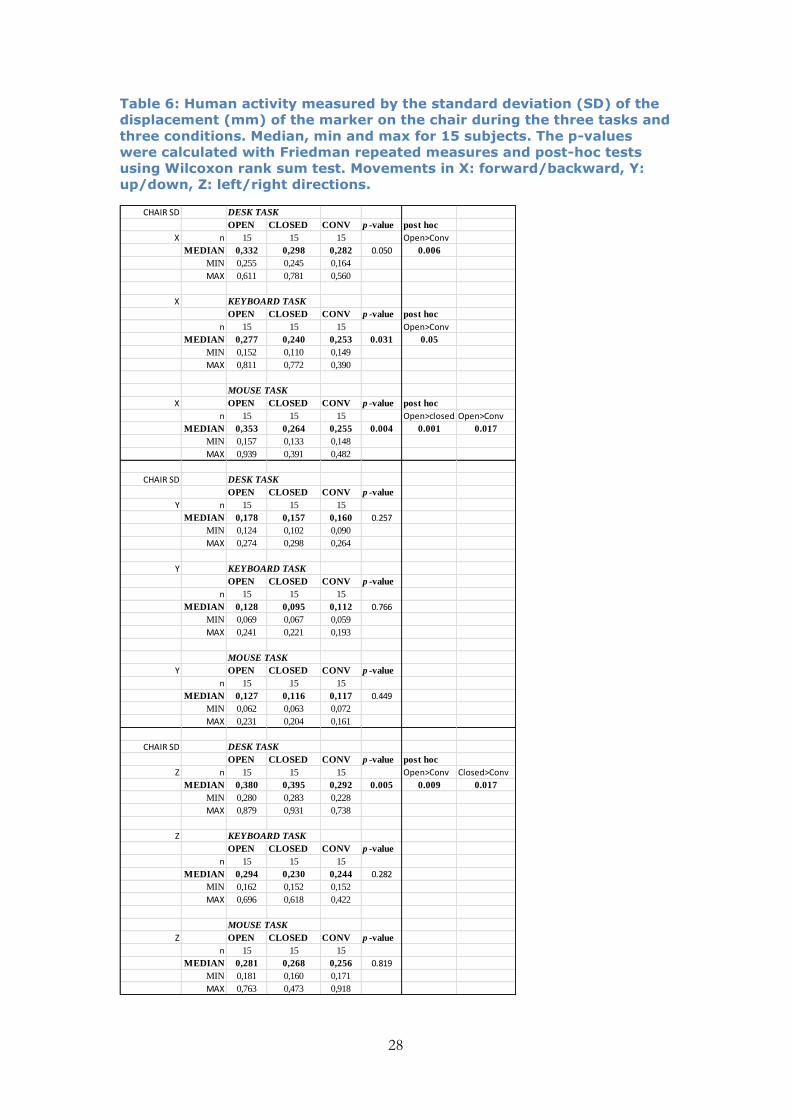
Table 6: Human activity measured by the standard deviation (SD) of the
displacement (mm) of the marker on the chair during the three tasks and
three conditions. Median, min and max for 15 subjects. The p-values
were calculated with Friedman repeated measures and post-hoc tests
using Wilcoxon rank sum test. Movements in X: forward/backward, Y:
up/down, Z: left/right directions.
CHAIR SD DESK TASK
OPEN CLOSED CONV p -value post hoc
X n 15 15 15 Open>Conv
MEDIAN 0,332 0,298 0,282 0.050 0.006
MIN 0,255 0,245 0,164
MAX 0,611 0,781 0,560
X KEYBOARD TASK
OPEN CLOSED CONV p -value post hoc
n 15 15 15 Open>Conv
MEDIAN 0,277 0,240 0,253 0.031 0.05
MIN 0,152 0,110 0,149
MAX 0,811 0,772 0,390
MOUSE TASK
X OPEN CLOSED CONV p -value post hoc
n 15 15 15 Open>closed Open>Conv
MEDIAN 0,353 0,264 0,255 0.004 0.001 0.017
MIN 0,157 0,133 0,148
MAX 0,939 0,391 0,482
CHAIR SD DESK TASK
OPEN CLOSED CONV p -value
Y n 15 15 15
MEDIAN 0,178 0,157 0,160 0.257
MIN 0,124 0,102 0,090
MAX 0,274 0,298 0,264
Y KEYBOARD TASK
OPEN CLOSED CONV p -value
n 15 15 15
MEDIAN 0,128 0,095 0,112 0.766
MIN 0,069 0,067 0,059
MAX 0,241 0,221 0,193
MOUSE TASK
Y OPEN CLOSED CONV p -value
n 15 15 15
MEDIAN 0,127 0,116 0,117 0.449
MIN 0,062 0,063 0,072
MAX 0,231 0,204 0,161
CHAIR SD DESK TASK
OPEN CLOSED CONV p -value post hoc
Z n 15 15 15 Open>Conv Closed>Conv
MEDIAN 0,380 0,395 0,292 0.005 0.009 0.017
MIN 0,280 0,283 0,228
MAX 0,879 0,931 0,738
Z KEYBOARD TASK
OPEN CLOSED CONV p -value
n 15 15 15
MEDIAN 0,294 0,230 0,244 0.282
MIN 0,162 0,152 0,152
MAX 0,696 0,618 0,422
MOUSE TASK
Z OPEN CLOSED CONV p -value
n 15 15 15
MEDIAN 0,281 0,268 0,256 0.819
MIN 0,181 0,160 0,171
MAX 0,763 0,473 0,918

29
5.1.1.2 Trunk movements (C7)
To see if there were any effects of the activation of the center-tilt mechanism, the displacement in forward (x), upward (y) and sideway (z) directions of the marker that was placed on the lowest vertebra of the neck (C7) was studied. The mean displacement was calculated for each task and condition by dividing the total sum of the displacement with the total number of observations (Table 7). Due to the dynamic nature of the desk task, the marker disappeared for several subjects during the experiment. If less than 2/3 part of the data was available, the data was classified as missing data. Data loss could have occurred due to camera settings or hair. In one subject, we forgot to put on the marker on C7. The results showed that the five out of nine situations in which the subjects were working in a standing position had the highest human activity levels compared to the CONV and CLOSED conditions. Due to the low number of observation with at least 2/3 part of the possible data points available, there were no significant differences between the conditions found for the desk task. However, the point estimates during STAND condition was doubled or tripled compared to these sitting conditions. Significant differences were found in five out of six of the remaining tasks (i.e. mouse or keyboard tasks). The STAND condition showed more human activity compared to the OPEN condition in four situations. The effects of the activation of the center-tilt mechanism were present in three out of six static tasks, but not in the dynamic task. Higher levels were found compared to the CONV condition; in X-direction for both keyboard and mouse tasks and in Y-direction during the mouse task. In one situation, we found significant higher levels for the OPEN compared to the CLOSED; keyboard task, X-direction. These results indicate that especially during static office tasks, human activity levels are increased during standing, but also when the center-tilt mechanism is activated. The standard deviation of the displacement of the trunk mirrors the amount of change in movements, i.e. human activity (Table 8). No differences were found for the dynamic office task (desk task), however, during five of the six static tasks (keyboard and mouse tasks), the SD of the displacement of the trunk was higher during standing compared to the CLOSED and CONV condition. Also here, the loss of data during the dynamic task (desk task) could be the reason for not finding significant differences between STAND condition and the other conditions. Moreover, STAND condition was significantly higher than the OPEN condition only in two situations; mouse task in X and Z-direction and the OPEN condition was in four situations more active than the CONV condition (Figure 6). These results indicate that especially during static office tasks, human activity levels are increased during standing, but also when the center-tilt mechanism is activated.

30
Table 7: Trunk activity measured by mean displacement of the marker on
the lowest neck vertebra (C7) during the three tasks and three
conditions. Median, min and max for 15 subjects. The p-values were
calculated with Friedman repeated measures and post-hoc tests using
Wilcoxon rank sum test. Movements in X: forward/backward, Y:
up/down, Z: left/right.
C7 displacement
OPEN STAND CLOSED CONV p -value
X n 10 5 8 9
MEDIAN 0,589 1,021 0,559 0,514 0.395
MIN 0,385 0,766 0,406 0,370
MAX 0,793 1,960 0,757 0,645
X
OPEN STAND CLOSED CONV p -value post hoc
n 13 9 14 13 Stand>Open Stand>Closed Stand>Conv Open>Closed Open>Conv
MEDIAN 0,337 0,898 0,225 0,254 0.001 0.028 0.008 0.012 0.028 0.012
MIN 0,203 0,385 0,172 0,021
MAX 1,160 1,565 0,627 0,333
X OPEN STAND CLOSED CONV p -value post hoc
n 12 9 13 13 Stand>Open Stand>Closed Stand>Conv Open>Conv
MEDIAN 0,314 0,726 0,259 0,256 0.000 0.008 0.008 0.008 0.015
MIN 0,204 0,302 0,196 0,176
MAX 0,465 3,212 0,522 1,359
C7 displacement
OPEN STAND CLOSED CONV p -value
Y n 10 5 8 9
MEDIAN 0,206 0,278 0,197 0,188 0.392
MIN 0,174 0,178 0,161 0,145
MAX 0,300 0,336 0,261 0,248
Y
OPEN STAND CLOSED CONV p -value
n 14 9 14 13
MEDIAN 0,147 0,191 0,110 0,129 0.070
MIN 0,083 0,129 0,095 0,009
MAX 0,375 0,267 0,218 0,182
Y OPEN STAND CLOSED CONV p -value post hoc
n 12 9 13 13 Stand>Open Stand>Closed Stand>Conv Open>Conv
MEDIAN 0,135 0,225 0,119 0,117 0.001 0.008 0.008 0.008 0.023
MIN 0,096 0,127 0,095 0,057
MAX 0,178 0,509 0,196 0,665
C7 displacement
OPEN STAND CLOSED CONV p -value
Z n 10 5 8 9
MEDIAN 0,582 0,962 0,559 0,535 0.392
MIN 0,457 0,652 0,358 0,367
MAX 0,749 1,196 0,767 0,730
Z
OPEN STAND CLOSED CONV p -value post hoc
n 14 9 14 13 Stand>Closed Stand>Conv
MEDIAN 0,303 0,356 0,243 0,278 0.003 0.008 0.012
MIN 0,198 0,257 0,188 0,020
MAX 0,483 0,578 0,450 0,340
Z OPEN STAND CLOSED CONV p -value post hoc
n 12 9 13 13 Stand>Open Stand>Closed Stand>Conv
MEDIAN 0,283 0,465 0,248 0,232 0.003 0.012 0.008 0.011
MIN 0,215 0,264 0,177 0,152
MAX 0,333 0,851 0,371 0,621
MOUSE TASK
DESK TASK
DESK TASK
KEYBOARD TASK
MOUSE TASK
DESK TASK
KEYBOARD TASK
KEYBOARD TASK
MOUSE TASK

31
Figure 6: Trunk activity measured by the mean displacement of the
marker on the lowest vertebra in the neck (C7) during the three tasks
and three conditions. Median, (n=15). Significant differences with *
(Wilcoxon rank sum tests). Movements in X: forward/backward, Y:
up/down, Z: left/right directions.
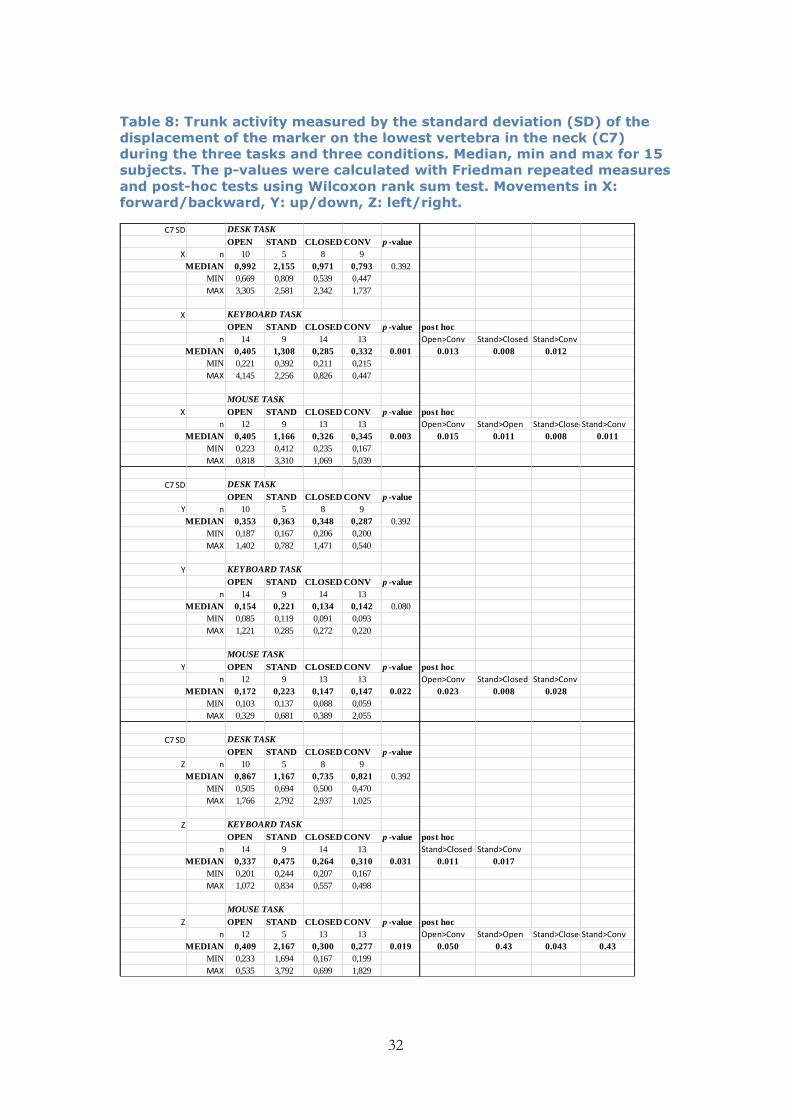
32
Table 8: Trunk activity measured by the standard deviation (SD) of the
displacement of the marker on the lowest vertebra in the neck (C7)
during the three tasks and three conditions. Median, min and max for 15
subjects. The p-values were calculated with Friedman repeated measures
and post-hoc tests using Wilcoxon rank sum test. Movements in X:
forward/backward, Y: up/down, Z: left/right.
C7 SD
OPEN STAND CLOSED CONV p -value
X n 10 5 8 9
MEDIAN 0,992 2,155 0,971 0,793 0.392
MIN 0,669 0,809 0,539 0,447
MAX 3,305 2,581 2,342 1,737
X
OPEN STAND CLOSED CONV p -value post hoc
n 14 9 14 13 Open>Conv Stand>Closed Stand>Conv
MEDIAN 0,405 1,308 0,285 0,332 0.001 0.013 0.008 0.012
MIN 0,221 0,392 0,211 0,215
MAX 4,145 2,256 0,826 0,447
X OPEN STAND CLOSED CONV p -value post hoc
n 12 9 13 13 Open>Conv Stand>Open Stand>ClosedStand>Conv
MEDIAN 0,405 1,166 0,326 0,345 0.003 0.015 0.011 0.008 0.011
MIN 0,223 0,412 0,235 0,167
MAX 0,818 3,310 1,069 5,039
C7 SD
OPEN STAND CLOSED CONV p -value
Y n 10 5 8 9
MEDIAN 0,353 0,363 0,348 0,287 0.392
MIN 0,187 0,167 0,206 0,200
MAX 1,402 0,782 1,471 0,540
Y
OPEN STAND CLOSED CONV p -value
n 14 9 14 13
MEDIAN 0,154 0,221 0,134 0,142 0.080
MIN 0,085 0,119 0,091 0,093
MAX 1,221 0,285 0,272 0,220
Y OPEN STAND CLOSED CONV p -value post hoc
n 12 9 13 13 Open>Conv Stand>Closed Stand>Conv
MEDIAN 0,172 0,223 0,147 0,147 0.022 0.023 0.008 0.028
MIN 0,103 0,137 0,088 0,059
MAX 0,329 0,681 0,389 2,055
C7 SD
OPEN STAND CLOSED CONV p -value
Z n 10 5 8 9
MEDIAN 0,867 1,167 0,735 0,821 0.392
MIN 0,505 0,694 0,500 0,470
MAX 1,766 2,792 2,937 1,025
Z
OPEN STAND CLOSED CONV p -value post hoc
n 14 9 14 13 Stand>Closed Stand>Conv
MEDIAN 0,337 0,475 0,264 0,310 0.031 0.011 0.017
MIN 0,201 0,244 0,207 0,167
MAX 1,072 0,834 0,557 0,498
Z OPEN STAND CLOSED CONV p -value post hoc
n 12 5 13 13 Open>Conv Stand>Open Stand>ClosedStand>Conv
MEDIAN 0,409 2,167 0,300 0,277 0.019 0.050 0.43 0.043 0.43
MIN 0,233 1,694 0,167 0,199
MAX 0,535 3,792 0,699 1,829
MOUSE TASK
DESK TASK
KEYBOARD TASK
MOUSE TASK
DESK TASK
KEYBOARD TASK
MOUSE TASK
DESK TASK
KEYBOARD TASK

33
5.1.2 Kinetics
During the experiments, the subjects changed their position only slightly, and this reflects in low CV%. As the criteria that the GRF was calculated if there was valid data available of at least 2/3 part of the total experiment, there was a substantial loss of data. Perhaps the subjects were lifting one or both feet from the platforms during the trials in which they were sitting, since there was no loss of data from the standing trials. The forces were analyzed on base of the ground reaction forces amplitudes (GRF amplitudes) and the changes of position of the GRF application point (CoP parameters).
5.1.2.1 Ground reaction forces amplitude
Two parameters were tested for both left and right foot if there were any differences between the conditions:
GRF CV%, i.e. the SD/mean x 100, reflects the variation of the GRF during the experiment.
GRF Range%, i.e. the difference between the minimum and maximum values divided by the mean x 100, reflects human activity in a different way.
GRF – CV% For the left foot during the desk task, there was an overall difference (p=0.011) found between the conditions (Table 9). The post-hoc tests showed that the STAND condition had larger variation compared to all sitting conditions. The GRF CV% was 4-5 times larger during standing. A larger variation of the forces, reflecting more human activity, in the OPEN condition compared to the CONV condition was also found (p=0.043). Performing the desk task in standing, activity levels of the left foot were higher compared to sitting, but activating the center-tilt mechanism has also a positive influence compared to conventional sitting. Table 9: GRF CV% for the left foot during the three tasks and four
conditions, median, min and max. P-values calculated by the related-
samples Friedmans’ two-way analyzes of ranks and post-hoc tests using
Wilcoxon rank sum tests.
Moreover, although the p-value for the overall effect did not reach the level of 0.05, activity levels were higher in the STAND condition during the keyboard task compared to the OPEN and CONV conditions (Table 9). For the left foot, no differences were found between the conditions during the mouse task, but the OPEN condition showed far the highest activity levels.
CV% Left foot DESK TASK
OPEN STAND CLOSED CONV p -value post hoc
n 6 15 8 12 open>conv stand>open stand>closed stand>conv
MEDIAN 14,0 55,3 12,9 9,3 0.011 0.043 0.028 0.012 0.002
MIN 10,2 15,7 6,7 4,5
MAX 17,6 85,1 29,8 14,3
OPEN STAND CLOSED CONV p -value
n 8 15 10 13 stand>open stand>conv
MEDIAN 3,3 7,3 2,1 2,0 0.060 0.036 0.009
MIN 0,7 1,5 0,9 0,8
MAX 6,7 35,1 8,4 7,6
MOUSE TASK
OPEN STAND CLOSED CONV p -value
n 4 14 9 13
MEDIAN 6,2 2,6 3,0 2,1 0.060
MIN 4,7 1,2 0,7 0,5
MAX 9,7 28,8 7,5 6,5
KEYBOARD TASK

34
Activity levels of the left foot in standing are higher compared to sitting during the keyboard task, but not during the mouse task. Activating the center-tilt mechanism did not have an influence on human activity during the keyboard or mouse task, but the lack of significant differences could depend on low power in the statistical analyzes. During the desk task, similar results as the left foot GRF CV% were seen for for the right foot, however, only a difference between standing and the CONV condition were found (p=0.012). Due to the low number of data in the OPEN condition, it was not possible to show any effect of the center-tilt mechanism, although the point estimates were higher in the OPEN condition, compared to all other conditions during static office work. This indicates performing dynamic office work in a standing position increases human activity compared to conventional sitting, but activating the center-tilt mechanism could also have an positive influence on human activity during the static office work. Table 10: GRF CV% for the right foot during the three tasks and four
conditions, median, min and max. P-values calculated by the related-
samples Friedmans’ two-way analyzes of ranks and post-hoc tests using
Wilcoxon rank sum tests.
CV% Right foot
DESK TASK
OPEN STAND CLOSED CONV p -value post hoc
n 3 15 4 8 stand>conv
MEDIAN 11,4 31,4 15,7 7,4 0.145 0.012
MIN 10,8 10,8 7,3 5,5
MAX 17,3 60,7 25,2 11,1
OPEN STAND CLOSED CONV p -value
n 4 15 6 10
MEDIAN 5,1 4,3 2,0 2,6 0.060
MIN 3,0 1,0 1,3 0,6
MAX 17,8 17,7 4,1 7,3
MOUSE TASK
OPEN STAND CLOSED CONV p -value
n 4 14 7 11
MEDIAN 3,7 2,6 2,2 2,5 0.145
MIN 2,4 1,1 0,7 0,5
MAX 6,3 19,4 9,7 5,7
KEYBOARD TASK
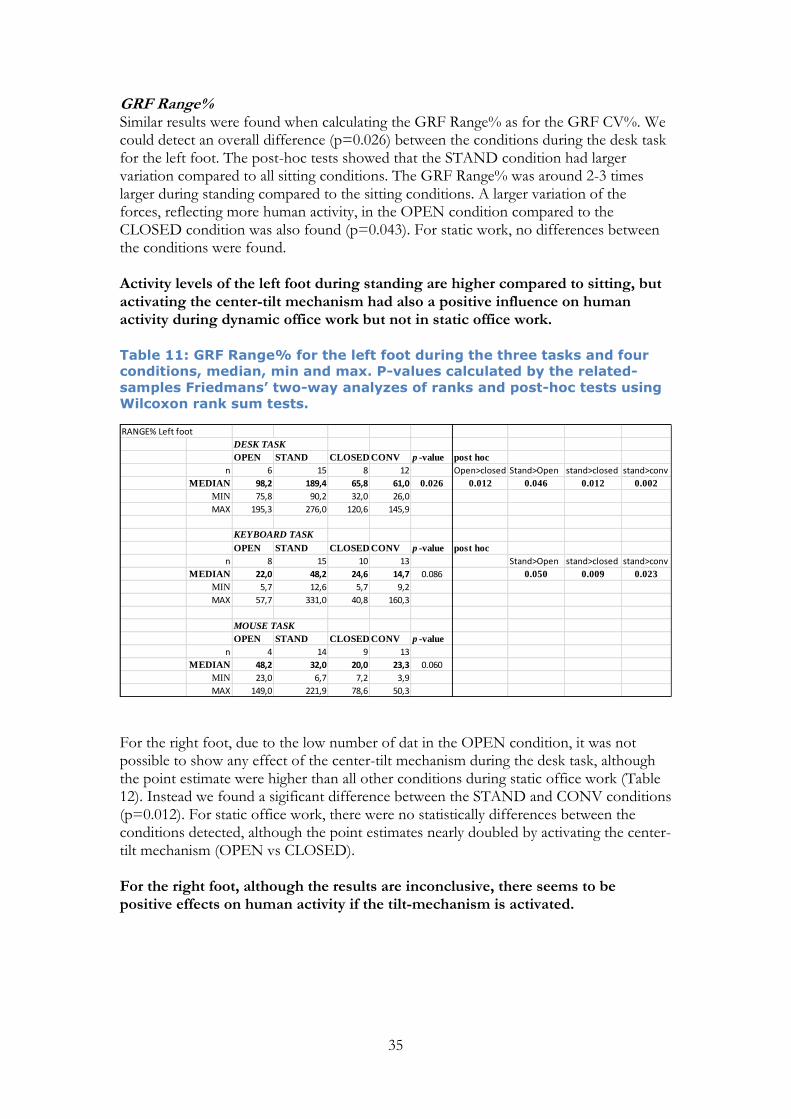
35
GRF Range% Similar results were found when calculating the GRF Range% as for the GRF CV%. We could detect an overall difference (p=0.026) between the conditions during the desk task for the left foot. The post-hoc tests showed that the STAND condition had larger variation compared to all sitting conditions. The GRF Range% was around 2-3 times larger during standing compared to the sitting conditions. A larger variation of the forces, reflecting more human activity, in the OPEN condition compared to the CLOSED condition was also found (p=0.043). For static work, no differences between the conditions were found. Activity levels of the left foot during standing are higher compared to sitting, but activating the center-tilt mechanism had also a positive influence on human activity during dynamic office work but not in static office work. Table 11: GRF Range% for the left foot during the three tasks and four
conditions, median, min and max. P-values calculated by the related-
samples Friedmans’ two-way analyzes of ranks and post-hoc tests using
Wilcoxon rank sum tests.
For the right foot, due to the low number of dat in the OPEN condition, it was not possible to show any effect of the center-tilt mechanism during the desk task, although the point estimate were higher than all other conditions during static office work (Table 12). Instead we found a sigificant difference between the STAND and CONV conditions (p=0.012). For static office work, there were no statistically differences between the conditions detected, although the point estimates nearly doubled by activating the center-tilt mechanism (OPEN vs CLOSED). For the right foot, although the results are inconclusive, there seems to be positive effects on human activity if the tilt-mechanism is activated.
RANGE% Left foot
DESK TASK
OPEN STAND CLOSED CONV p -value post hoc
n 6 15 8 12 Open>closed Stand>Open stand>closed stand>conv
MEDIAN 98,2 189,4 65,8 61,0 0.026 0.012 0.046 0.012 0.002
MIN 75,8 90,2 32,0 26,0
MAX 195,3 276,0 120,6 145,9
OPEN STAND CLOSED CONV p -value post hoc
n 8 15 10 13 Stand>Open stand>closed stand>conv
MEDIAN 22,0 48,2 24,6 14,7 0.086 0.050 0.009 0.023
MIN 5,7 12,6 5,7 9,2
MAX 57,7 331,0 40,8 160,3
MOUSE TASK
OPEN STAND CLOSED CONV p -value
n 4 14 9 13
MEDIAN 48,2 32,0 20,0 23,3 0.060
MIN 23,0 6,7 7,2 3,9
MAX 149,0 221,9 78,6 50,3
KEYBOARD TASK
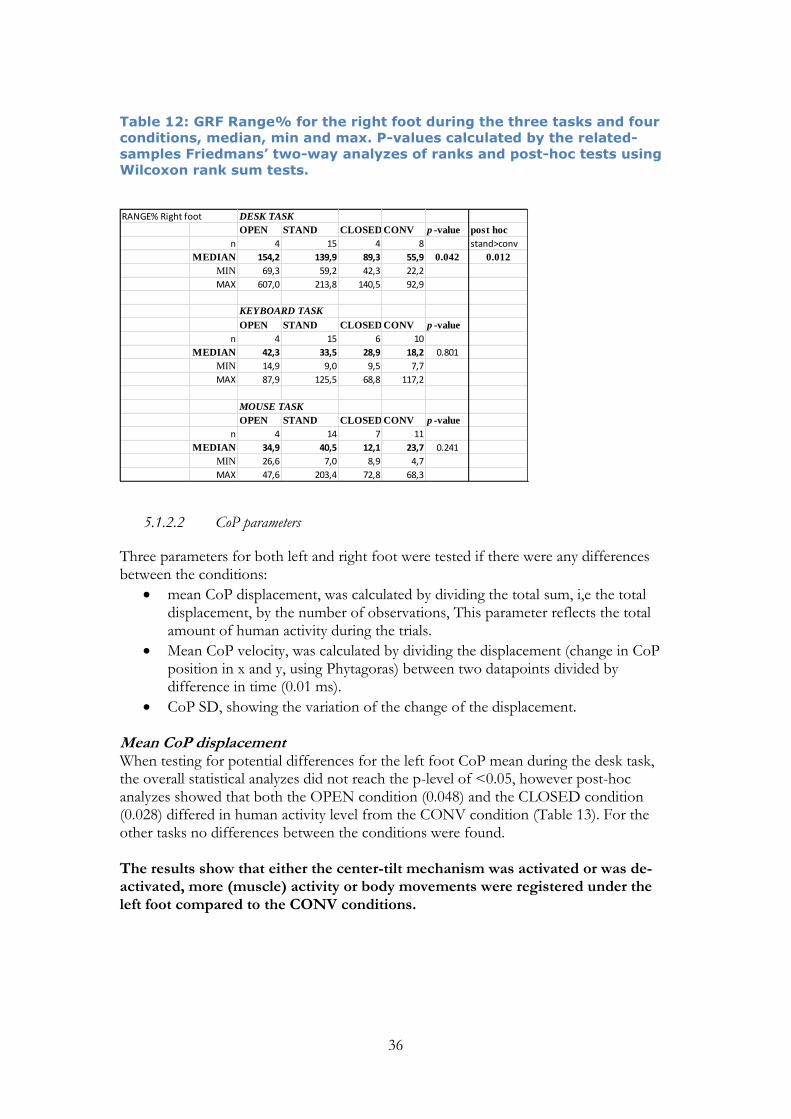
36
Table 12: GRF Range% for the right foot during the three tasks and four
conditions, median, min and max. P-values calculated by the related-
samples Friedmans’ two-way analyzes of ranks and post-hoc tests using
Wilcoxon rank sum tests.
5.1.2.2 CoP parameters
Three parameters for both left and right foot were tested if there were any differences between the conditions:
mean CoP displacement, was calculated by dividing the total sum, i,e the total displacement, by the number of observations, This parameter reflects the total amount of human activity during the trials.
Mean CoP velocity, was calculated by dividing the displacement (change in CoP position in x and y, using Phytagoras) between two datapoints divided by difference in time (0.01 ms).
CoP SD, showing the variation of the change of the displacement. Mean CoP displacement When testing for potential differences for the left foot CoP mean during the desk task, the overall statistical analyzes did not reach the p-level of <0.05, however post-hoc analyzes showed that both the OPEN condition (0.048) and the CLOSED condition (0.028) differed in human activity level from the CONV condition (Table 13). For the other tasks no differences between the conditions were found. The results show that either the center-tilt mechanism was activated or was de-activated, more (muscle) activity or body movements were registered under the left foot compared to the CONV conditions.
RANGE% Right foot DESK TASK
OPEN STAND CLOSED CONV p -value post hoc
n 4 15 4 8 stand>conv
MEDIAN 154,2 139,9 89,3 55,9 0.042 0.012
MIN 69,3 59,2 42,3 22,2
MAX 607,0 213,8 140,5 92,9
OPEN STAND CLOSED CONV p -value
n 4 15 6 10
MEDIAN 42,3 33,5 28,9 18,2 0.801
MIN 14,9 9,0 9,5 7,7
MAX 87,9 125,5 68,8 117,2
MOUSE TASK
OPEN STAND CLOSED CONV p -value
n 4 14 7 11
MEDIAN 34,9 40,5 12,1 23,7 0.241
MIN 26,6 7,0 8,9 4,7
MAX 47,6 203,4 72,8 68,3
KEYBOARD TASK
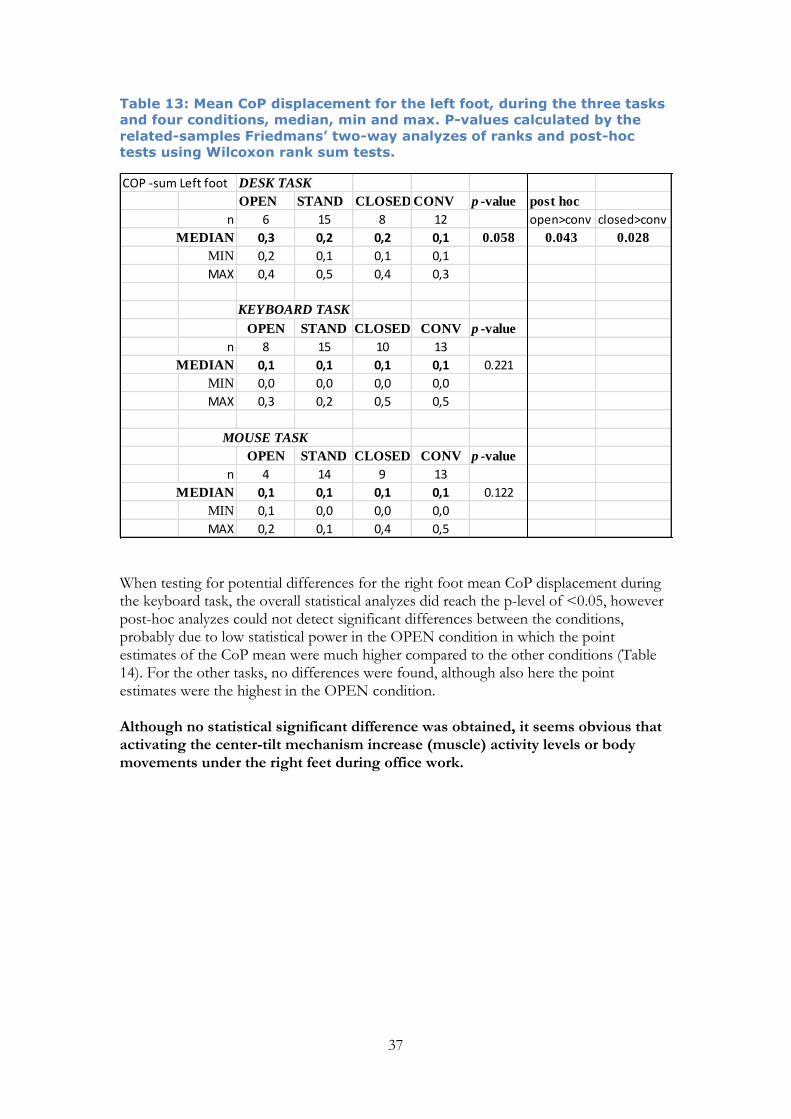
37
Table 13: Mean CoP displacement for the left foot, during the three tasks
and four conditions, median, min and max. P-values calculated by the
related-samples Friedmans’ two-way analyzes of ranks and post-hoc
tests using Wilcoxon rank sum tests.
When testing for potential differences for the right foot mean CoP displacement during the keyboard task, the overall statistical analyzes did reach the p-level of <0.05, however post-hoc analyzes could not detect significant differences between the conditions, probably due to low statistical power in the OPEN condition in which the point estimates of the CoP mean were much higher compared to the other conditions (Table 14). For the other tasks, no differences were found, although also here the point estimates were the highest in the OPEN condition. Although no statistical significant difference was obtained, it seems obvious that activating the center-tilt mechanism increase (muscle) activity levels or body movements under the right feet during office work.
COP -sum Left foot DESK TASK
OPEN STAND CLOSED CONV p -value post hoc
n 6 15 8 12 open>conv closed>conv
MEDIAN 0,3 0,2 0,2 0,1 0.058 0.043 0.028
MIN 0,2 0,1 0,1 0,1
MAX 0,4 0,5 0,4 0,3
OPEN STAND CLOSED CONV p -value
n 8 15 10 13
MEDIAN 0,1 0,1 0,1 0,1 0.221
MIN 0,0 0,0 0,0 0,0
MAX 0,3 0,2 0,5 0,5
MOUSE TASK
OPEN STAND CLOSED CONV p -value
n 4 14 9 13
MEDIAN 0,1 0,1 0,1 0,1 0.122
MIN 0,1 0,0 0,0 0,0
MAX 0,2 0,1 0,4 0,5
KEYBOARD TASK

38
Table 14: Mean CoP displacement for the right foot, during the three
tasks and four conditions, median, min and max. P-values calculated by
the related-samples Friedmans’ two-way analyzes of ranks and post-hoc
tests using Wilcoxon rank sum tests.
CoP velocity For the left foot, there was a significant overall difference for the desk task (p=0.026), but not for the other tasks. Here, the CONV condition had lower activity compared to all other conditions (Table 15A). For the right foot, no differences between the conditions were found for any of the tasks (Table 15B). This means that during dynamic and static office work, no effect of the center-tilt mechanism was seen using CoP velocity as outcome measure.
COP sum Right foot DESK TASK
OPEN STAND CLOSED CONV p -value
n 4 15 4 8
MEDIAN 0,23 0,18 0,20 0,14 0.532
MIN 0,16 0,09 0,15 0,11
MAX 0,40 0,39 0,60 0,42
KEYBOARD TASK
OPEN STAND CLOSED CONV p -value
n 4 15 15 10
MEDIAN 0,20 0,05 0,00 0,09 0.042
MIN 0,11 0,03 0,00 0,00
MAX 0,29 0,18 0,51 0,70
MOUSE TASK
OPEN STAND CLOSED CONV p -value
n 4 14 7 11
MEDIAN 0,14 0,06 0,08 0,11 0.145
MIN 0,10 0,02 0,05 0,04
MAX 0,17 0,16 0,60 0,40

39
Table 15: Mean CoP velocity for the left (A) and right foot (B), during the
three tasks and four conditions, median, min and max. P-values
calculated by the related-samples Friedmans’ two-way analyzes of ranks
and post-hoc tests using Wilcoxon rank sum tests.
A
B)
COP -VEL Left foot DESK TASK
OPEN STAND CLOSED CONV p -value post hoc
n 6 15 8 12 Open>Conv Closed>conv Stand>conv
MEDIAN 27,55 22,25 21,71 13,74 0.026 0.043 0.028 0.023
MIN 15,74 10,81 11,13 8,66
MAX 38,27 44,01 39,57 31,56
KEYBOARD TASK
OPEN STAND CLOSED CONV p -value
n 8 15 10 13
MEDIAN 10,71 9,02 7,08 7,81 0.221
MIN 3,63 3,52 4,72 4,72
MAX 26,56 21,45 44,91 54,56
MOUSE TASK
OPEN STAND CLOSED CONV p -value
n 4 14 9 13
MEDIAN 12,34 5,63 8,88 11,35 0.241
MIN 10,23 2,04 4,92 3,66
MAX 21,92 14,28 40,93 45,14
COP -VEL Right foot DESK TASK
OPEN STAND CLOSED CONV p -value
n 4 4 8 15
MEDIAN 22,47 19,58 12,41 16,53 0.522
MIN 15,01 15,33 10,28 8,80
MAX 39,68 60,40 41,95 34,92
KEYBOARD TASK
OPEN STAND CLOSED CONV p -value
n 4 15 6 10
MEDIAN 20,03 5,22 10,91 8,53 0.122
MIN 10,93 3,15 5,10 4,36
MAX 28,93 18,09 51,09 68,39
MOUSE TASK
OPEN STAND CLOSED CONV p -value
n 4 14 7 11
MEDIAN 13,75 5,57 8,19 10,77 0.145
MIN 10,02 2,04 5,26 3,54
MAX 16,61 15,37 60,17 40,29

40
CoP SD For the left foot, there was a significant overall difference for the mouse task (p=0.042), but not for the other tasks. However, post-hoc test could not reveal any differences, probably due to low statistical power in the OPEN condition. The point estimate of the CoP SD in the OPEN condition was twice as the point estimates of the STAND and CLOSED conditions. (Table 15Table 16). For the right foot, no differences between the conditions were found for any of the tasks (Table 17). This means that for the left foot during mouse task, there could be seen an effect of the center-tilt mechanism, however for all other tasks and the right foot no such effects were found. Table 16: Mean CoP SD for the left foot, during the three tasks and four
conditions, median, min and max. P-values calculated by the related-
samples Friedmans’ two-way analyzes of ranks and post-hoc tests using
Wilcoxon rank sum tests.
COP -SD Left foot DESK TASK
OPEN STAND CLOSED CONV p -value
n 5 15 8 12
MEDIAN 0,331 0,236 0,289 0,212 0.212
MIN 0,257 0,093 0,130 0,092
MAX 0,607 0,854 0,669 0,345
KEYBOARD TASK
OPEN STAND CLOSED CONV p -value
n 8 15 9 13
MEDIAN 0,079 0,083 0,102 0,067 0.849
MIN 0,024 0,027 0,047 0,029
MAX 0,543 0,365 0,418 0,455
MOUSE TASK
OPEN STAND CLOSED CONV p -value
n 4 14 8 13
MEDIAN 0,254 0,102 0,132 0,245 0.042
MIN 0,220 0,019 0,034 0,027
MAX 0,399 0,396 0,378 0,393

41
Table 17: Mean CoP velocity for the right foot, during the three tasks and
four conditions, median, min and max. P-values calculated by the
related-samples Friedmans’ two-way analyzes of ranks and post-hoc
tests using Wilcoxon rank sum tests.
5.1.3 Accelerometry
5.1.3.1 Total accelerometry counts analyzed with related-samples Friedmans’ two-way analyzes of ranks
Since the data of the total accelerometer counts were not normal distributed, nonparametric tests were used to detect potential differences between the conditions. All tasks were analyzed separately (Table 18). No differences between the conditions were found for the keyboard task, however for the desk task, overall differences were found for accelerometer B (waist) and C (thigh), and for the mouse task for accelerometer E (chair). For the desk task and accelerometer B, post-hoc tests revealed that the condition STAND (162 counts) had a significantly lower total number of counts compared to the OPEN (981 counts; p=0.004) and CLOSED (617 counts; p=0.039) conditions, but not compared to the CONV (295 counts). Moreover, the OPEN condition had a higher total counts than the CONV condition (p<0.023) (Figure 7). This indicates that the center-tilt mechanism when activated has a positive influence on human activity levels measured by the accelerometer placed on the waist during dynamic office work.
COP -SD Right foot DESK TASK
OPEN STAND CLOSED CONV p -value
n 4 15 4 8
MEDIAN 0,392 0,299 0,230 0,168 0.122
MIN 0,214 0,076 0,126 0,112
MAX 0,541 0,690 0,499 0,457
KEYBOARD TASK
OPEN STAND CLOSED CONV p -value
n 4 15 6 10
MEDIAN 0,167 0,078 0,125 0,117 0.457
MIN 0,079 0,023 0,038 0,027
MAX 0,531 0,267 0,414 0,565
MOUSE TASK
OPEN STAND CLOSED CONV p -value
n 4 14 7 11
MEDIAN 0,308 0,100 0,090 0,171 0.145
MIN 0,093 0,021 0,037 0,026
MAX 0,372 0,423 0,493 0,416

42
For the mouse task and accelerometer E, post-hoc tests revealed that for both the OPEN (p=0.018) and CONV (p=0.012) conditions chair movements were increased compared to the CLOSED condition (Table 18). This indicates that the center-tilt mechanism, when activated, increase chair movements during mouse work. Table 18: Total accelerometer counts during the experiment for
accelerometers A-E for all four conditions (three minutes). Median, range
and p-value on the related-samples Friedmans’ two-way analyzes of
ranks.
Acc
Median Range OPEN STAND CLOSED CONV. P-value
DESK TASK A Median 4104 3390 3504 3623 NS
Range 1680-6151 1703-7306 1381-4848 1119-6476
B Median 981 162 617 295 0.005
Range 95-2496 4-1203 6-2234 48-1763
C Median 290 650 319 197 0.011
Range 5-1095 30-1377 0-877 2-766
D Median 162 177 47 4 NS
Range 0-2896 0-944 0-1019 0-1498
E Median 114 - 12 78 NS
Range 0-1154 - 0-1597 0-437
KEYBOARD A Median 191 165 138 167 NS
TASK
Range 3-357 4-833 0-762 0-503
B Median 0 4 8 12 NS
Range 0-105 0-98 0-116 0-173
C Median 0 18 1 0 NS
Range 0-195 0-361 0-125 0-46
D Median 0 0 7 0 NS
Range 0-109 0-131 0-17 0-351
E Median 16 - 29 27 NS
Range 0-70 0-349 0-167
MOUSE TASK A Median 272 179 30 137 NS
Range 0-2100 0-681 0-548 0-1336
B Median 17 6 0 26 NS
Range 0-684 0-91 0-121 0-352
C Median 6 2 0 13 NS
Range 0-105 0-299 0-215 0-155
D Median 27 2 0 8 NS
Range 0-114 0-228 0-164 0-85
E Median 60 - 1 53 0.010
Range 0-521 - 0-11 0-206

43
Figure 7: Total number of counts measured by accelerometer B (waist)
during the desk task in all four conditions. Post-hoc test using Wilcoxon
rank sum test.
For accelerometer C, post-hoc tests revealed that the condition STAND (650 counts) during the desk task had a significantly higher total number of counts compared to the CLOSED (319 counts; p=0.012) and CONV (197; p=0.002) conditions, but not compared to the OPEN (290) (Figure 8). This could indicate that the lower levels found for the accelerometer round the waist during STAND condition could be compensated by movements of the thigh. The activated center-tilt mechanism could have influenced the activity levels of the thigh since no significant differences were found between the STAND and OPEN condition, while there were differences between STAND and CLOSED, and between STAND and CONV.
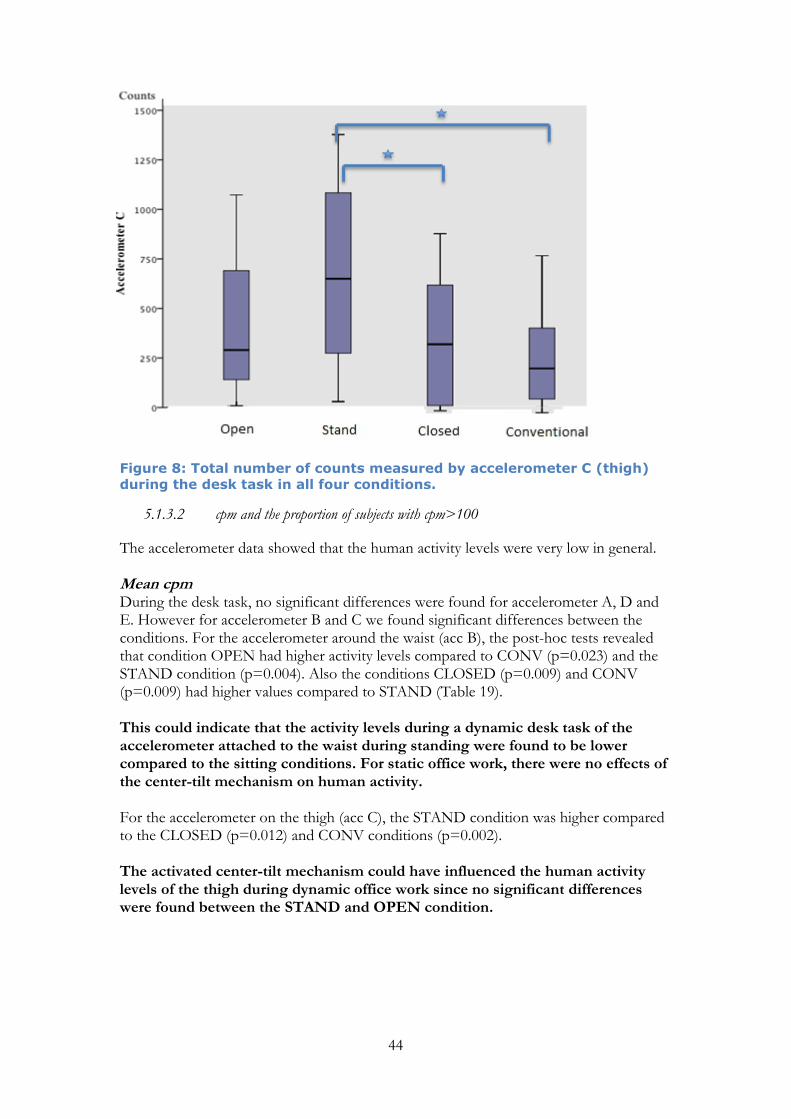
44
Figure 8: Total number of counts measured by accelerometer C (thigh)
during the desk task in all four conditions.
5.1.3.2 cpm and the proportion of subjects with cpm>100
The accelerometer data showed that the human activity levels were very low in general. Mean cpm During the desk task, no significant differences were found for accelerometer A, D and E. However for accelerometer B and C we found significant differences between the conditions. For the accelerometer around the waist (acc B), the post-hoc tests revealed that condition OPEN had higher activity levels compared to CONV (p=0.023) and the STAND condition (p=0.004). Also the conditions CLOSED (p=0.009) and CONV (p=0.009) had higher values compared to STAND (Table 19). This could indicate that the activity levels during a dynamic desk task of the accelerometer attached to the waist during standing were found to be lower compared to the sitting conditions. For static office work, there were no effects of the center-tilt mechanism on human activity. For the accelerometer on the thigh (acc C), the STAND condition was higher compared to the CLOSED (p=0.012) and CONV conditions (p=0.002). The activated center-tilt mechanism could have influenced the human activity levels of the thigh during dynamic office work since no significant differences were found between the STAND and OPEN condition.
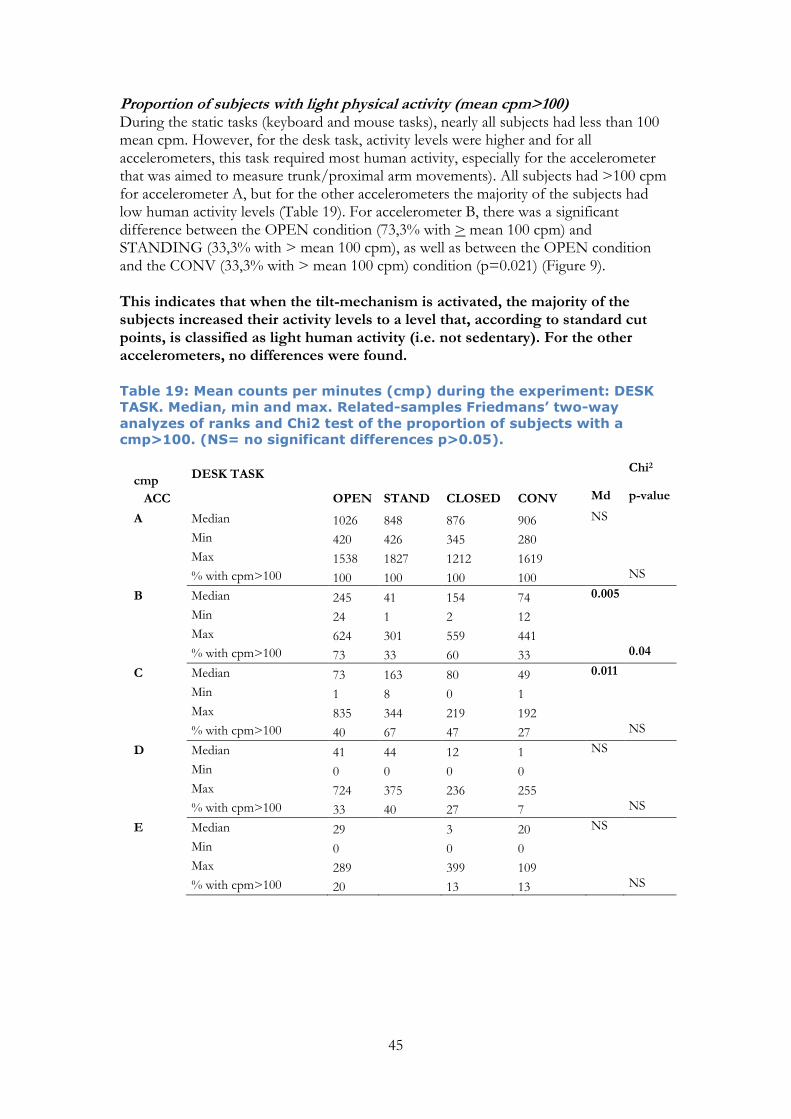
45
Proportion of subjects with light physical activity (mean cpm>100) During the static tasks (keyboard and mouse tasks), nearly all subjects had less than 100 mean cpm. However, for the desk task, activity levels were higher and for all accelerometers, this task required most human activity, especially for the accelerometer that was aimed to measure trunk/proximal arm movements). All subjects had >100 cpm for accelerometer A, but for the other accelerometers the majority of the subjects had low human activity levels (Table 19). For accelerometer B, there was a significant difference between the OPEN condition (73,3% with > mean 100 cpm) and STANDING (33,3% with > mean 100 cpm), as well as between the OPEN condition and the CONV (33,3% with > mean 100 cpm) condition (p=0.021) (Figure 9). This indicates that when the tilt-mechanism is activated, the majority of the subjects increased their activity levels to a level that, according to standard cut points, is classified as light human activity (i.e. not sedentary). For the other accelerometers, no differences were found. Table 19: Mean counts per minutes (cmp) during the experiment: DESK
TASK. Median, min and max. Related-samples Friedmans’ two-way
analyzes of ranks and Chi2 test of the proportion of subjects with a
cmp>100. (NS= no significant differences p>0.05).
cmp DESK TASK
Chi2
ACC
OPEN STAND CLOSED CONV Md p-value
A Median 1026 848 876 906 NS
Min 420 426 345 280
Max 1538 1827 1212 1619
% with cpm>100 100 100 100 100 NS
B Median 245 41 154 74 0.005
Min 24 1 2 12
Max 624 301 559 441
% with cpm>100 73 33 60 33 0.04
C Median 73 163 80 49 0.011
Min 1 8 0 1
Max 835 344 219 192
% with cpm>100 40 67 47 27 NS
D Median 41 44 12 1 NS
Min 0 0 0 0
Max 724 375 236 255
% with cpm>100 33 40 27 7 NS
E Median 29
3 20 NS
Min 0
0 0
Max 289
399 109
% with cpm>100 20 13 13 NS

46
Figure 9: Proportion of subjects with “light physical activity” (mean >
100 cpm) in accelerometer B (waist), i.e. not sedentary activity.
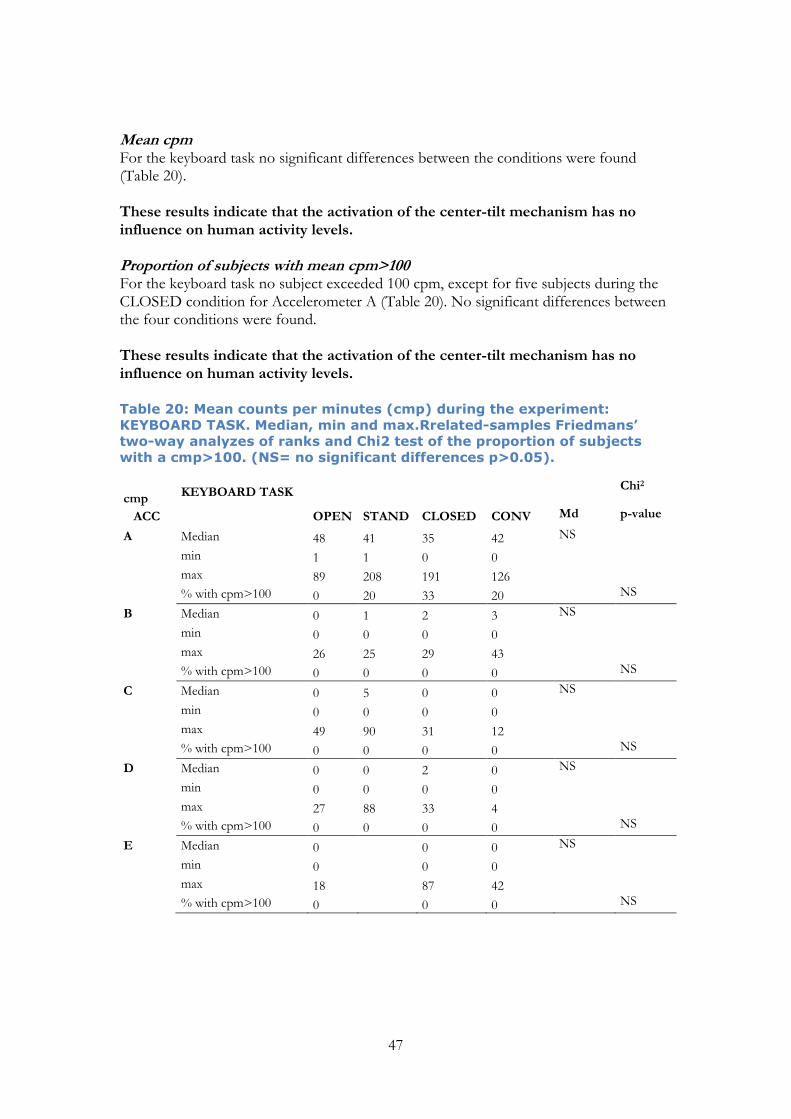
47
Mean cpm For the keyboard task no significant differences between the conditions were found (Table 20). These results indicate that the activation of the center-tilt mechanism has no influence on human activity levels. Proportion of subjects with mean cpm>100 For the keyboard task no subject exceeded 100 cpm, except for five subjects during the CLOSED condition for Accelerometer A (Table 20). No significant differences between the four conditions were found. These results indicate that the activation of the center-tilt mechanism has no influence on human activity levels. Table 20: Mean counts per minutes (cmp) during the experiment:
KEYBOARD TASK. Median, min and max.Rrelated-samples Friedmans’
two-way analyzes of ranks and Chi2 test of the proportion of subjects
with a cmp>100. (NS= no significant differences p>0.05).
cmp KEYBOARD TASK
Chi2
ACC
OPEN STAND CLOSED CONV Md p-value
A Median 48 41 35 42 NS
min 1 1 0 0
max 89 208 191 126
% with cpm>100 0 20 33 20 NS
B Median 0 1 2 3 NS
min 0 0 0 0
max 26 25 29 43
% with cpm>100 0 0 0 0 NS
C Median 0 5 0 0 NS
min 0 0 0 0
max 49 90 31 12
% with cpm>100 0 0 0 0 NS
D Median 0 0 2 0 NS
min 0 0 0 0
max 27 88 33 4
% with cpm>100 0 0 0 0 NS
E Median 0
0 0 NS
min 0
0 0
max 18
87 42
% with cpm>100 0 0 0 NS

48
Mean cpm For the mouse task, no significant differences between the conditions were found (Table 21), except for the accelerometer E (chair). Here, the CLOSED condition had lower activity compared to the OPEN (p=0.018) and the CONV condition (p=0.012). This could indicate that activating the center-tilt mechanism increased the chair movements, compared to the condition where the center-tilt mechanism was de-activated. Proportion of subjects with mean cpm>100 For the mouse task, no differences between the conditions were found (Table 21), except for the comparison between the OPEN and CLOSED conditions concerning accelerometer A (p=0.01). Here, the OPEN condition had a higher proportion subjects with light physical activity (cpm>100) compared to the CLOSED condition. The interpretation of this significant difference is difficult, as the cut point of 100 cpm is set for accelerometer on the waist (B). However, it seems reasonable to conclude that an activated tilt-mechanism increase human activity levels of the trunk/arm during the mouse task. Table 21: Mean counts per minutes (cmp) during the experiment: MOUSE
TASK. Median, min and max. Related-samples Friedmans’ two-way
analyzes of ranks and Chi2 test of the proportion of subjects with a
cmp>100. (NS= no significant differences p>0.05).
cmp MOUSE TASK
Chi2
ACC
OPEN STAND CLOSED CONV MD P-value
A Median 68 45 8 34 NS
Min 0 0 0 0
Max 525 170 137 334
% with cpm>100 47 27 7 40 0.01
B Median 4 2 0 7 NS
Min 0 0 0 0
Max 171 23 30 88
% with cpm>100 7 0 0 0 NS
C Median 2 1 0 3 NS
Min 0 0 0 0
Max 26 75 54 39
% with cpm>100 0 0 0 0 NS
D Median 7 1 0 2 NS
Min 0 0 0 0
Max 29 57 41 21
% with cpm>100 0 0 0 0 NS
E Median 0
0 2 0.010
Min 0
0 0
Max 130
3 52
% with cpm>100 7 0 0 NS

49
5.1.3.3 Repeated-measures ANOVA
After testing for normality, the data was logged and the repeated-measures analyzes of variance (ANOVA) was based on the logged values for all conditions and all tasks, but separately for each accelerometer. Table 22 shows the results from this repeated- measures ANOVA for cpm. TASK For all variables there was a main effect on task. For the dynamic desk task, all accelerometers had higher values than for the two static tasks. This indicates that the tasks used in the study were dissimilar. CONDITION For accelerometers A and E, there were neither any effects for condition nor for the interaction between task and condition. For accelerometer B, the waist, the condition STAND had significantly lower values compared to all other conditions. Moreover, the OPEN condition had higher values compared to the CLOSED condition. Concerning the interaction between condition and task, for the desk task it turned out that both the OPEN and CLOSED condition had higher activity levels compared to STAND (Figure 10). This indicates that the activity levels during a dynamic desk task of the accelerometer attached to the waist during standing were found to be lower compared to the sitting conditions, especially when using the centre-tilt chair. For static office work, there seems not to be any effects of the center-tilt mechanism on human activity levels. For the accelerometer C, however, the activity levels of the accelerometer attached to the thigh were higher during the STAND condition, compared to CLOSED and the CONV. conditions, both with and without taking into account the interaction effects of the tasks (Figure 11). This indicates that the lower activity of the waist while standing is compensated by increased levels of activity of the thigh. The lack of significant differences between the higher activity levels of the thigh during the STAND condition compared to the OPEN condition could indicate that activating the center-tilt mechanism is effective in increasing human activity levels. Concerning the activity of the feet, accelerometer D, it turned out that the CONV had the lowest values compared to the STAND condition, and when taking the interaction of the tasks in account CONV also turned out to be lower than the OPEN condition. However the effect size was considered small. It is possible to conclude that active sitting and standing has some positive effects on activity levels of the feet.

50
Table 22: Results from repeated-measures analysis of variance of each
accelerometer on data from the different tasks (desk, keyboard and
mouse) throughout the trial (n = 13).
ES: effect size. 0.20 is a minimal solution; 0.50 is a medium effect; and
anything equal to or greater than 0.80 is a large effect size. OPEN:
activated center-tilt mechanism, STAND: standing, CLOSED: de-activated
center-tilt mechanism, CONV: conventional office chair.
Main effect Post-hoc effect
Dependent variable F P ES Comparison p
A
Condition 1.117 0.353 0.074
Task x Condition 1.157 0.353 0.076
B
Condition 10.154 <0.001 0.420 OPEN/CLOSED/CONV > STAND OPEN > CLOSED
< 0.045 < 0.045
Condition x Task (desk)
4.361 <0.001 0.237 OPEN > STAND CLOSED > STAND
< 0.001 0.006
C
Condition 6.592 0.001 0.320 STAND > CLOSED/CONV
< 0.005
Condition x Task (desk)
2.240 0.047 0.138 STAND > CLOSED/CONV
< 0.010
D
Condition 3.784 0.172 0.212 STAND > CONV
< 0.013
Condition x Task (desk)
1.18 0.35 0.190 OPEN/STAND > CONV < 0.003
E
Condition 2.475 0.102 0.152
Condition x Task (desk)
1.18 0.844 0.057

51
Figure 10 shows the results for accelerometer B for all conditions and all tasks graphically using the raw (unlogged data); i.e. mean counts per minute (cpm).
Figure 10: Accelerometer B, mean counts per minute for each task and
condition. Significant interaction effects between conditions OPEN and
STANDING and between CLOSED and STANDING for the desk task. For all
other comparisons there were no significant differences between the
conditions.
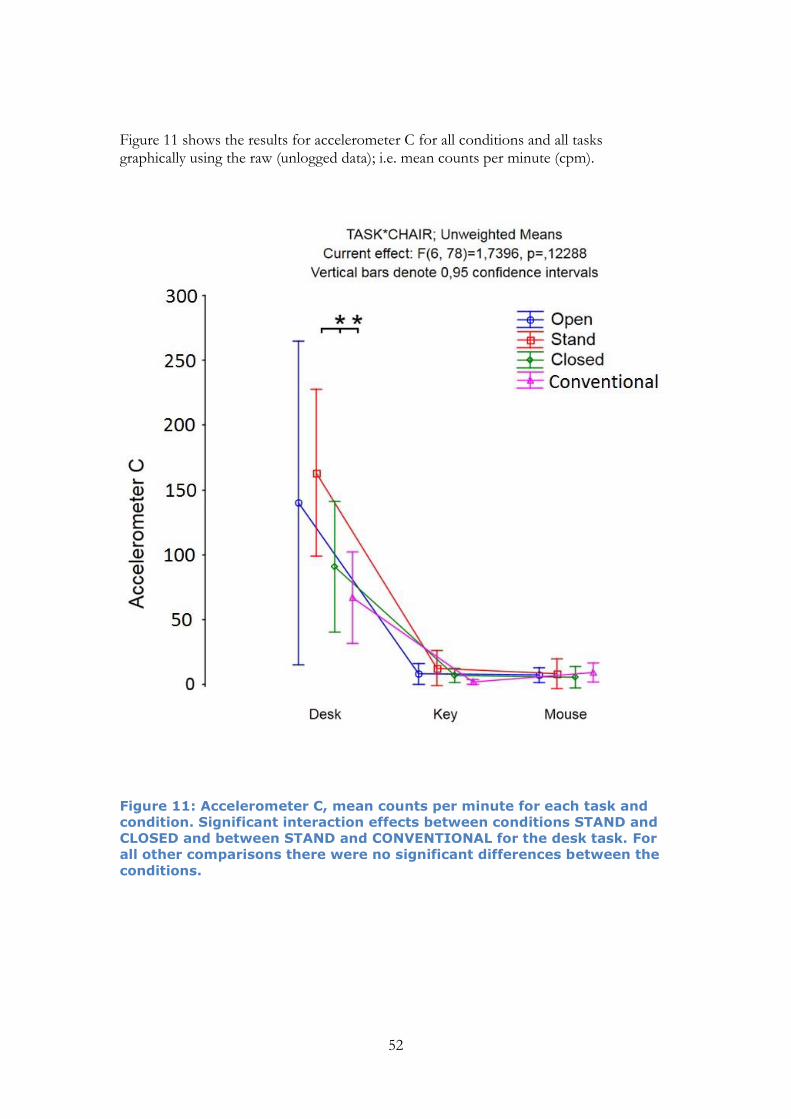
52
Figure 11 shows the results for accelerometer C for all conditions and all tasks graphically using the raw (unlogged data); i.e. mean counts per minute (cpm).
Figure 11: Accelerometer C, mean counts per minute for each task and
condition. Significant interaction effects between conditions STAND and
CLOSED and between STAND and CONVENTIONAL for the desk task. For
all other comparisons there were no significant differences between the
conditions.
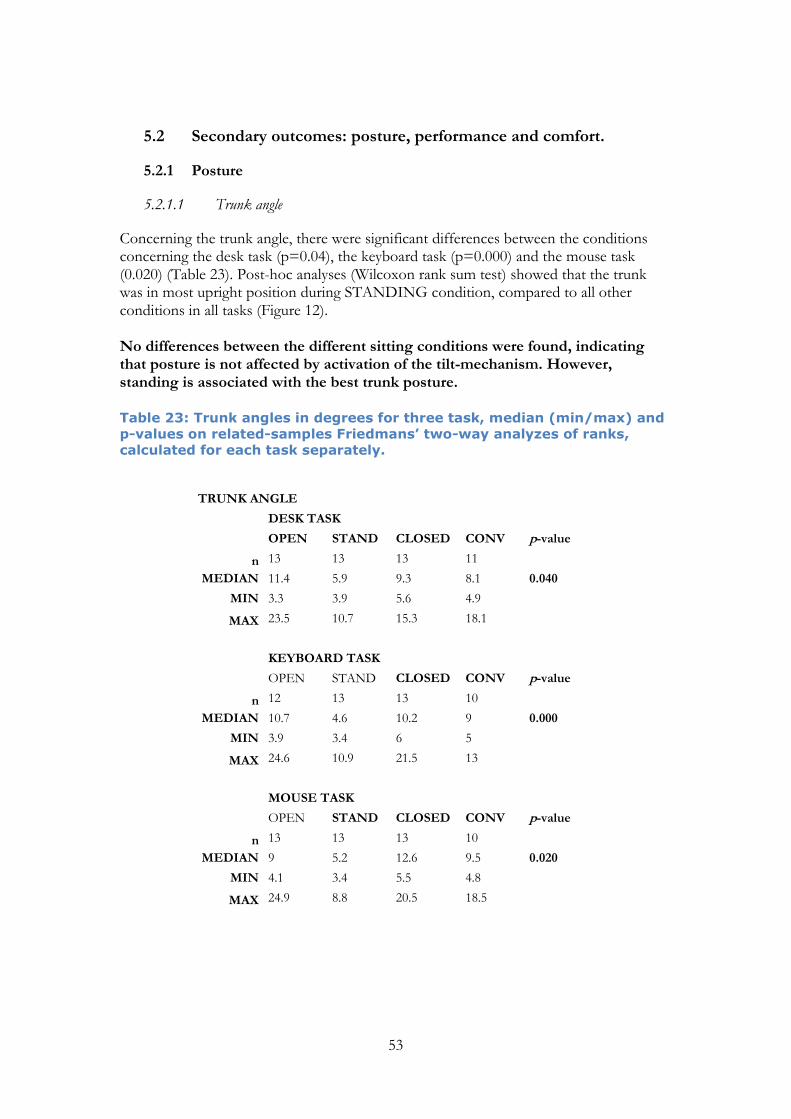
53
5.2 Secondary outcomes: posture, performance and comfort.
5.2.1 Posture
5.2.1.1 Trunk angle
Concerning the trunk angle, there were significant differences between the conditions concerning the desk task (p=0.04), the keyboard task (p=0.000) and the mouse task (0.020) (Table 23). Post-hoc analyses (Wilcoxon rank sum test) showed that the trunk was in most upright position during STANDING condition, compared to all other conditions in all tasks (Figure 12). No differences between the different sitting conditions were found, indicating that posture is not affected by activation of the tilt-mechanism. However, standing is associated with the best trunk posture. Table 23: Trunk angles in degrees for three task, median (min/max) and
p-values on related-samples Friedmans’ two-way analyzes of ranks,
calculated for each task separately.
TRUNK ANGLE
DESK TASK
OPEN STAND CLOSED CONV p-value
n 13 13 13 11
MEDIAN 11.4 5.9 9.3 8.1 0.040
MIN 3.3 3.9 5.6 4.9
MAX 23.5 10.7 15.3 18.1
KEYBOARD TASK
OPEN STAND CLOSED CONV p-value
n 12 13 13 10
MEDIAN 10.7 4.6 10.2 9 0.000
MIN 3.9 3.4 6 5
MAX 24.6 10.9 21.5 13
MOUSE TASK
OPEN STAND CLOSED CONV p-value
n 13 13 13 10
MEDIAN 9 5.2 12.6 9.5 0.020
MIN 4.1 3.4 5.5 4.8
MAX 24.9 8.8 20.5 18.5

54
Figure 12: Graph over trunk angles (degrees) and post hoc tests for
differences between the conditions.
5.2.1.2 Neck angle
Concerning the neck angle, there was a significant difference between the conditions concerning the desk task (p=0.042). However, for the other tasks no differences were found (Table 24). Post-hoc analyses for the desk task showed that the neck was in most upright position in the standing condition compared to the conventional office chair condition. However, the difference was rather small (4.1 degrees) (Figure 13). The results show that activating the center-tilt mechanism did not influence neck angles, and that standing has the most optimal posture.

55
Table 24: Neck angles in degrees for three task, median (min/max) and
p-values on related-samples Friedmans’ two-way analyzes of ranks,
calculated for each task separately.
NECK ANGLE
DESK TASK
OPEN STAND CLOSED CONV p-value
n 10 8 12 10
MEDIAN 71.6 74.1 74 70 0.042
MIN 56.7 68.5 56.4 66.3
MAX 88.1 80 85.7 81.4
KEYBOARD TASK
OPEN STAND CLOSED CONV p-value
n 12 11 12 13
MEDIAN 65.6 68.6 70.2 67.1 0.356
MIN 50.1 54.2 52.8 53.2
MAX 85.6 84.8 86.4 84.6
MOUSE TASK
OPEN STAND CLOSED CONV p-value
n 12 10 13 11
MEDIAN 65.9 65.2 63.9 61.3 0.117
MIN 53.7 48 49.6 48.8
MAX 78 75.2 83.7 76.5
Figure 13: Graph over neck angles (degrees) and post hoc tests for
differences between the conditions.

56
5.2.1.3 Neck flexion angle
Concerning the neck flexion angle, there was a significant difference between the conditions during the desk task (p=0.020) and the mouse task (p=0.027). However, for the keyboard task no differences were found (Table 25). Post-hoc analyses revealed that, for the desk task, the neck flexion was in most upright position in the standing condition compared to the open and closed conditions, while for the mouse task the neck flexion was in most upright position in the standing condition compared to all other (sitting) conditions (Figure 14). Again, these results show that activating the center-tilt mechanism did not influence neck angles, and that standing has the most optimal posture. Table 25: Neck flexion angles in degrees for three task, median
(min/max) and p-values on related-samples Friedmans’ two-way
analyzes of ranks, calculated for each task separately.
NECK FLEXION
DESK TASK
OPEN STAND CLOSED CONV p-value
n 10 9 11 10
MEDIAN 94.4 99.1 93.2 94.8 0.020
MIN 84.4 87.4 81.4 87.8
MAX 98.7 103.1 98.9 101.9
KEYBOARD TASK
OPEN STAND CLOSED CONV p-value
n 11 11 12 9
MEDIAN 90.3 96.3 91.5 89 0.100
MIN 83.1 84.3 84.7 85.4
MAX 99.8 110.5 97.5 96.6
MOUSE TASK
OPEN STAND CLOSED CONV p-value
n 12 9 13 10
MEDIAN 91.9 101.7 95.3 90.7 0.027
MIN 84.8 92.2 80.7 66.1
MAX 102.2 107.4 102.5 99.7
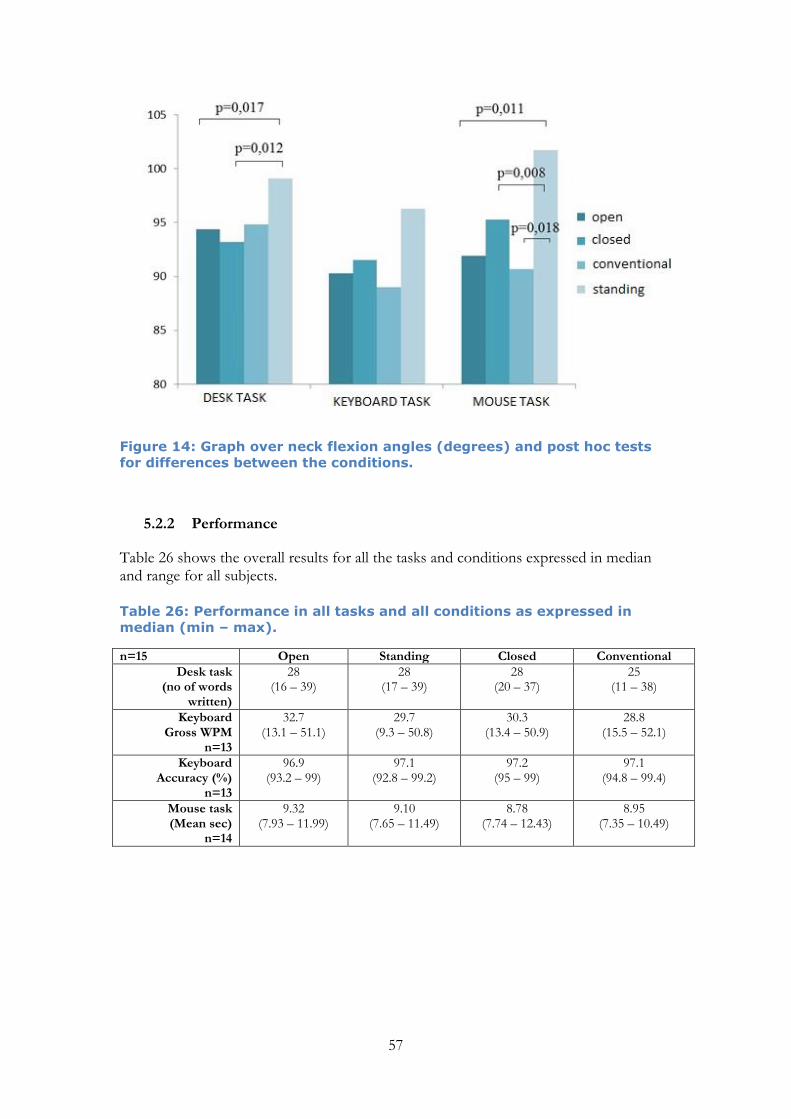
57
Figure 14: Graph over neck flexion angles (degrees) and post hoc tests
for differences between the conditions.
5.2.2 Performance
Table 26 shows the overall results for all the tasks and conditions expressed in median and range for all subjects. Table 26: Performance in all tasks and all conditions as expressed in
median (min – max).
n=15 Open Standing Closed Conventional
Desk task (no of words
written)
28 (16 – 39)
28 (17 – 39)
28 (20 – 37)
25 (11 – 38)
Keyboard Gross WPM
n=13
32.7 (13.1 – 51.1)
29.7 (9.3 – 50.8)
30.3 (13.4 – 50.9)
28.8 (15.5 – 52.1)
Keyboard Accuracy (%)
n=13
96.9 (93.2 – 99)
97.1 (92.8 – 99.2)
97.2 (95 – 99)
97.1 (94.8 – 99.4)
Mouse task (Mean sec)
n=14
9.32 (7.93 – 11.99)
9.10 (7.65 – 11.49)
8.78 (7.74 – 12.43)
8.95 (7.35 – 10.49)

58
5.2.2.1 Desk task
Concerning the desk task, the median number of words that the subjects produced during the total experiment time was high (md = 28), except for the conventional office chair condition, where the subjects typed md 25 words. However, this difference did not reach the level of statistical difference (p=0.16). In conclusion, no difference in desk task performance between the conditions was found.
5.2.2.2 Keyboard task
For the keyboard task, high WPM scores and high accuracy percentages were found, indicating that the subjects included in the study were used to keyboard tasks. The statistical test revealed p-values of 0.89 and 0.415 respectively for the WPM scores and accuracy %, which implied that there were no statistical differences between the conditions. Interestingly, again the lowest performance results, however not statistically different from the other conditions, were found for the conventional office chair concerning the Gross WPM (Table 26). In conclusion, no difference in keyboard task performance between the conditions was found.
5.2.2.3 Mouse task
There was a significant difference between the CLOSED and the OPEN, STAND and CONV. Conditions, where the CLOSED condition had the lowest values (=best). This indicates that for the mouse task, the CLOSED condition had the best results (Figure 15).

59
Figure 15: Graph over median time (s) to perform the mouse task and
results from the post-hoc analyses * p<0.05 between closed condition
and all other conditions.
5.2.2.4 Overall performance
Concerning “overall performance” (in which all ranks of each task were taken into account); the median of the total ranks was 2 for all sitting conditions. Standing, in which the median rank was 3, turned out to be the condition with lowest performance compared to these other three, p=0.000 (Table 27). Table 27: Performance in ranks for every condition in all tasks, median
(min – max), mean (SD).
Median (min – max) Mean (SD)
Open 2.00 (1 – 4) 2.34 (1.169)
Stand 3.00 (1 – 4) 2.86 (1.042)
Closed 2.00 (1 – 4) 1.98 (1.017)
Conventional office chair 2.00 (1 – 4) 2.44 (1.167)
These results show that during the standing condition, the overall performance based on four performance measures has the lowest performance.
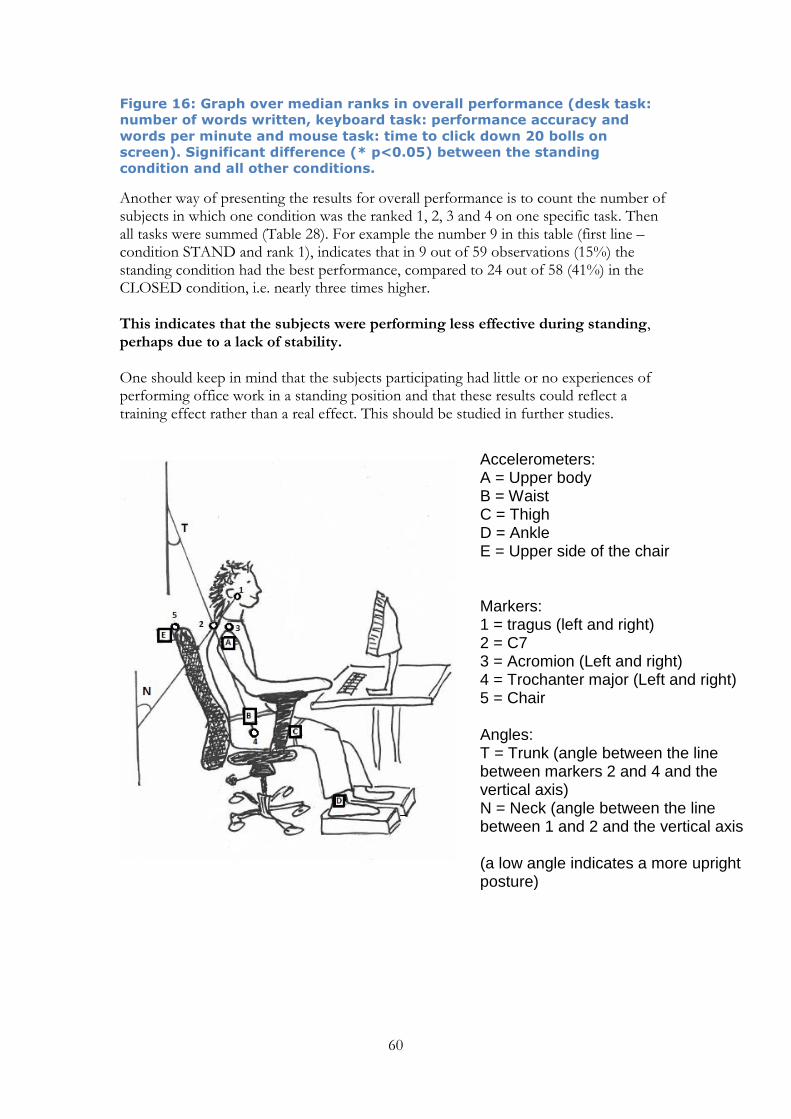
60
Figure 16: Graph over median ranks in overall performance (desk task:
number of words written, keyboard task: performance accuracy and
words per minute and mouse task: time to click down 20 bolls on
screen). Significant difference (* p<0.05) between the standing
condition and all other conditions.
Another way of presenting the results for overall performance is to count the number of subjects in which one condition was the ranked 1, 2, 3 and 4 on one specific task. Then all tasks were summed (Table 28). For example the number 9 in this table (first line – condition STAND and rank 1), indicates that in 9 out of 59 observations (15%) the standing condition had the best performance, compared to 24 out of 58 (41%) in the CLOSED condition, i.e. nearly three times higher. This indicates that the subjects were performing less effective during standing, perhaps due to a lack of stability. One should keep in mind that the subjects participating had little or no experiences of performing office work in a standing position and that these results could reflect a training effect rather than a real effect. This should be studied in further studies.
Accelerometers: A = Upper body B = Waist C = Thigh D = Ankle E = Upper side of the chair Markers: 1 = tragus (left and right) 2 = C7 3 = Acromion (Left and right) 4 = Trochanter major (Left and right) 5 = Chair Angles: T = Trunk (angle between the line between markers 2 and 4 and the vertical axis) N = Neck (angle between the line between 1 and 2 and the vertical axis (a low angle indicates a more upright posture)

61
Table 28: Ranking of all tasks and sum of ranks for each condition.
Condition Total
Rank OPEN STAND CLOSED CONVENTIONAL
CHAIR
1 19 9 24 16 68
2 15 9 17 13 54
3 11 22 11 12 56
4 14 19 6 14 53
5.2.3 Comfort
5.2.3.1 Comfort at start and finish
Comfort was assessed at the start and at the end of each experiment. Nearly all subjects rated their conditions between 7 and 9, indicating that they perceived good to high comfort. Interestingly, only in the open condition the maximal possible rating (10) was seen in five out of 180 experiments. For each task on group level, the subjects rated their comfort similar for all the conditions; the median comfort was 8 both before and after each task for each condition (Figure 17). There were no statistical differences found between the conditions or within each condition. However, when analyzing all tasks at the same time, there was a tendency (p<0.1) that the comfort was rated lower in the “closed” condition before the tasks (75% of the subjects rated 8 or lower) compared to the other conditions in which 75% of the subjects rated 8 or higher. For the ratings after the experiments, there was no such tendency found. These results indicate that comfort is not affected by the activation of the center-tilt mechanism.
Figure 17: Comfort (md, 25-75% and min max) before and after the
experiment for the four conditions.

62
5.2.3.2 Difference between start and finish
When calculating differences before and after performing each task in comfort, only small differences were found. The median for all conditions was zero, although 75% of the observations were zero or below, indicating a decrease in comfort after performing the tasks. There were no significant differences in comfort between conditions (Figure 18).
Figure 18: Difference in ratings of comfort at start and after the
experiment for the four conditions in all tasks. Boxplott: md, 25-75%
percentiles and min/max. positive values indicate an increase in comfort,
negative a decrease in comfort after the experiment

63
5.3 Summary of findings in the laboratory study
§ Outcome Measures Method Findings Conclusion about the center-tilt mechanism
Primary outcomes
5.1.1.1 Human activity kinematics
Movement of chair –desk task
Displacement chair marker
In five out of nine situations, the OPEN condition had significantly higher values compared to CONV condition.
These results show that the activated tilt-mechanism increase the movements of the chair in all directions, but mainly during dynamic office work.
5.1.1.1 Human activity kinematics
Movement of chair – desk task
SD of displacement of chair marker
In four out of nine situations, the OPEN condition had significantly higher values compared to CONV condition.
These results show that the activated tilt-mechanism increase the movements of the chair in all directions, but mainly during dynamic office work.
5.1.1.2 Human activity kinematics
Movement of C7 – mouse and keyboard tasks
Displacement of C7 marker
The STAND condition showed more activity compared to the OPEN condition in four situations. The effects of the activation of the center-tilt mechanism were present in three out of six static tasks.
These results indicate that especially during static office tasks, activity levels are increased during standing, but also when the center-tilt mechanism is activated.
5.1.1.2 Human activity kinematics
Movement of C7– mouse and keyboard tasks
SD of displacement of C7 marker
In five of the six static tasks, higher human activity levels were found during STAND compared to the CLOSED and CONV conditions. The OPEN condition was in four situations more active than the CONV condition.
These results indicate that especially during static office tasks, human activity levels are increased during standing, but also when the center-tilt mechanism is activated.
5.1.2.1 Human activity kinetics
GRF left foot during dynamic office work
CV% The STAND condition had larger variation compared to all sitting conditions. The variation coefficient was 4-5 times larger during standing. More human activity was also found in the OPEN condition compared to the CONV condition.
Performing the desk task in standing, activity levels of the left foot were higher compared to sitting, but activating the center-tilt mechanism has also a positive influence compared to conventional sitting.
5.1.2.1 Human activity kinetics
GRF left foot during static office work
CV% Human activity levels were higher in the STAND condition during the keyboard task compared to the OPEN and CONV conditions and the OPEN condition
Activity levels of the left foot in standing are higher compared to sitting during the keyboard task, but not during the mouse task. Activating the center-tilt mechanism did not have an influence on human activity during the keyboard or mouse task, but the lack of
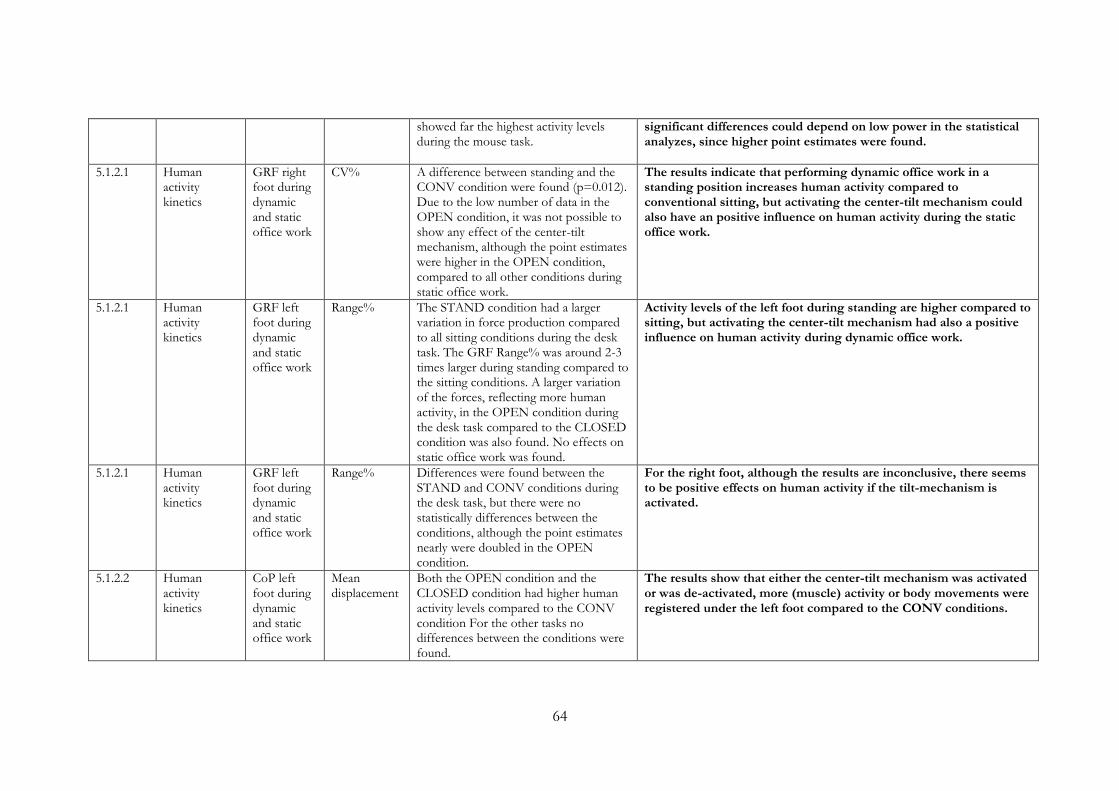
64
showed far the highest activity levels during the mouse task.
significant differences could depend on low power in the statistical analyzes, since higher point estimates were found.
5.1.2.1 Human activity kinetics
GRF right foot during dynamic and static office work
CV% A difference between standing and the CONV condition were found (p=0.012). Due to the low number of data in the OPEN condition, it was not possible to show any effect of the center-tilt mechanism, although the point estimates were higher in the OPEN condition, compared to all other conditions during static office work.
The results indicate that performing dynamic office work in a standing position increases human activity compared to conventional sitting, but activating the center-tilt mechanism could also have an positive influence on human activity during the static office work.
5.1.2.1 Human activity kinetics
GRF left foot during dynamic and static office work
Range% The STAND condition had a larger variation in force production compared to all sitting conditions during the desk task. The GRF Range% was around 2-3 times larger during standing compared to the sitting conditions. A larger variation of the forces, reflecting more human activity, in the OPEN condition during the desk task compared to the CLOSED condition was also found. No effects on static office work was found.
Activity levels of the left foot during standing are higher compared to sitting, but activating the center-tilt mechanism had also a positive influence on human activity during dynamic office work.
5.1.2.1 Human activity kinetics
GRF left foot during dynamic and static office work
Range% Differences were found between the STAND and CONV conditions during the desk task, but there were no statistically differences between the conditions, although the point estimates nearly were doubled in the OPEN condition.
For the right foot, although the results are inconclusive, there seems to be positive effects on human activity if the tilt-mechanism is activated.
5.1.2.2 Human activity kinetics
CoP left foot during dynamic and static office work
Mean displacement
Both the OPEN condition and the CLOSED condition had higher human activity levels compared to the CONV condition For the other tasks no differences between the conditions were found.
The results show that either the center-tilt mechanism was activated or was de-activated, more (muscle) activity or body movements were registered under the left foot compared to the CONV conditions.

65
5.1.2.2 Human activity kinetics
CoP right foot during dynamic and static office work
Mean displacement
The overall statistical analyzes reached the p-level of <0.05, however post-hoc analyzes could not detect significant differences between the conditions during the keyboard task, probably due to low statistical power in the OPEN condition in which the point estimates of the CoP mean were much higher compared to the other conditions. For the other tasks, no differences were found, although also here the point estimates were the highest in the OPEN condition.
Although no statistical significant differences were obtained, it seems obvious that activating the center-tilt mechanism increase (muscle) activity levels or body movements under the right foot during office work
5.1.2.2 Human activity kinetics
CoP left foot and right foot. All tasks
CoP Velocity The CONV condition had lower activity compared to all other conditions for the left foot during the desk task. For the right foot, no differences between the conditions were found for any of the tasks.
This means that during dynamic and static office work, no effect of the center-tilt mechanism was seen on CoP velocity.
5.1.2.2 Human activity kinetics
CoP SD left foot and right foot. All tasks
Although not reaching statistical difference in the post-hoc tests, the point estimate of the CoP SD in the OPEN condition was twice as the point estimates of the STAND and CLOSED conditions.
This means that for the left foot during mouse task, there could be seen an effect of the center-tilt mechanism, however for all other tasks and the right foot no such effects were found.
5.1.3.1 Human activity Accelerometry
Waist movements – desk task
Acc B total counts
STAND had a lower human activity levels compared to the OPEN and CLOSED conditions. Moreover, the OPEN condition had higher human activity levels compared to the CONV condition.
This indicates that the center-tilt mechanism when activated has a positive influence on human activity levels measured by the accelerometer placed on the waist during dynamic office work.
5.1.3.1 Human activity Accelerometry
Chair movement – mouse task
Acc E total counts
For both the OPEN and CONV conditions chair movements were increased compared to the CLOSED condition.
This indicates that the center-tilt mechanism, when activated, increase chair movements during mouse work.
5.1.3.1 Human Thigh Acc C total STAND had higher human activity levels The activated center-tilt mechanism could have influenced the

66
activity Accelerometry
movements – desk task
counts compared to the CLOSED and CONV conditions, but not compared to the OPEN condition.
human activity levels of the thigh during dynamic office work since no significant differences were found between the STAND and OPEN condition.
5.1.3.2 Human activity Accelerometry
Waist movements – desk task
Acc B cmp
OPEN had higher human activity levels compared to CONV and STAND conditions. Also the conditions CLOSED and CONV had higher values compared to STAND condition.
This could indicate that the human activity levels during a dynamic desk task of the accelerometer attached to the waist during standing were found to be lower compared to the sitting conditions. For static office work, there were no effects of the center-tilt mechanism on human activity.
5.1.3.2 Human activity Accelerometry
Thigh movements – desk task
Acc C cmp
STAND had higher human activity levels compared to the CLOSED and CONV conditions, but not compared to the OPEN condition.
The activated center-tilt mechanism could have influenced the human activity levels of the thigh during dynamic office work since no significant differences were found between the STAND and OPEN condition.
5.1.3.2 Human activity Accelerometry
Waist movements – desk task
Acc B proportion with cpm>100
The OPEN condition had higher human activity levels compared to STANDING and the CONV conditions.
This indicates that when the tilt-mechanism is activated, the majority of the subjects increased their human activity levels to a level that, according to standard cut points, is classified as light human activity (i.e. not sedentary). For the other accelerometers, no differences were found.
5.1.3.2 Human activity Accelerometry
All movements – keyboard task
All acc cmp and proportion with cpm>100
For the keyboard task no significant differences between the conditions were found.
These results indicate that the activation of the center-tilt mechanism has no influence on human activity levels.
5.1.3.2 Human activity Accelerometry
Chair movements- mouse task
Acc E cpm
CLOSED condition had lower human activity compared to the OPEN and the CONV conditions.
This could indicate that activating the center-tilt mechanism increased the chair movements, compared to the condition where the center-tilt mechanism was de-activated.
5.1.3.2 Human activity Accelerometry
Arm/trunk movements – mouse task
Acc A proportion with cpm>100
The OPEN condition had a higher proportion subjects with cpm>100 compared to the CLOSED condition.
It seems reasonable to conclude that an activated tilt-mechanism increase human activity levels of the trunk/arm.
5.1.3.3 Human activity Accelerometry
All movements
Acc A-E, ANOVA on task
There was a main effect on task. This indicates that the tasks used in the study were dissimilar.
5.1.3.3 Human activity Accelerometry
Waist movements – desk task
Acc B, ANOVA
The condition STAND had significantly lower values compared to all other conditions. Moreover, the OPEN condition had higher values compared to
This indicates that the activity levels during a dynamic desk task of the accelerometer attached to the waist during standing were found to be lower compared to the sitting conditions, especially when using the centre-tilt chair. For static office work, there seems not to
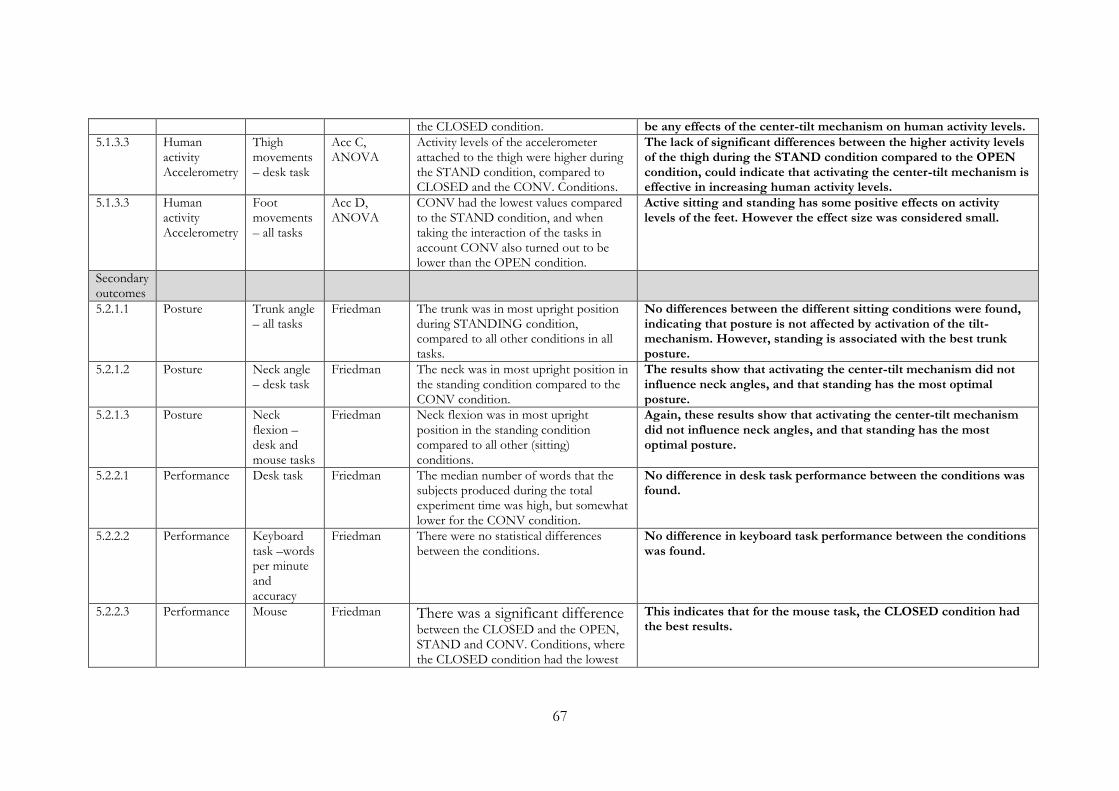
67
the CLOSED condition. be any effects of the center-tilt mechanism on human activity levels.
5.1.3.3 Human activity Accelerometry
Thigh movements – desk task
Acc C, ANOVA
Activity levels of the accelerometer attached to the thigh were higher during the STAND condition, compared to CLOSED and the CONV. Conditions.
The lack of significant differences between the higher activity levels of the thigh during the STAND condition compared to the OPEN condition, could indicate that activating the center-tilt mechanism is effective in increasing human activity levels.
5.1.3.3 Human activity Accelerometry
Foot movements – all tasks
Acc D, ANOVA
CONV had the lowest values compared to the STAND condition, and when taking the interaction of the tasks in account CONV also turned out to be lower than the OPEN condition.
Active sitting and standing has some positive effects on activity levels of the feet. However the effect size was considered small.
Secondary outcomes
5.2.1.1 Posture Trunk angle – all tasks
-
Friedman The trunk was in most upright position during STANDING condition, compared to all other conditions in all tasks.
No differences between the different sitting conditions were found, indicating that posture is not affected by activation of the tilt-mechanism. However, standing is associated with the best trunk posture.
5.2.1.2 Posture Neck angle – desk task
Friedman The neck was in most upright position in the standing condition compared to the CONV condition.
The results show that activating the center-tilt mechanism did not influence neck angles, and that standing has the most optimal posture.
5.2.1.3 Posture Neck flexion – desk and mouse tasks
Friedman Neck flexion was in most upright position in the standing condition compared to all other (sitting) conditions.
Again, these results show that activating the center-tilt mechanism did not influence neck angles, and that standing has the most optimal posture.
5.2.2.1 Performance Desk task Friedman The median number of words that the subjects produced during the total experiment time was high, but somewhat lower for the CONV condition.
No difference in desk task performance between the conditions was found.
5.2.2.2 Performance Keyboard task –words per minute and accuracy
Friedman There were no statistical differences between the conditions.
No difference in keyboard task performance between the conditions was found.
5.2.2.3 Performance Mouse Friedman There was a significant difference between the CLOSED and the OPEN, STAND and CONV. Conditions, where the CLOSED condition had the lowest
This indicates that for the mouse task, the CLOSED condition had the best results.

68
values (=best).
5.2.2.4 Performance Overall –all tasks
Friedman Standing turned out to be the condition with lowest performance compared to the other three
These results show that during the standing condition, the overall performance based on four performance measures has the lowest performance.
5.2.3.1 Comfort Comfort scale
Before and after
Comfort was md 8 for all tasks and all conditions, before and after the experiment
These results indicate that the comfort is good and not affected by the activation of the center-tilt mechanism.
5.2.3.2 Comfort Comfort scale
Difference between start and end
The median difference was zero, however, most values were zero or below zero, indicating a lowering of comfort after the experiment
These results indicate that comfort is not affected by the activation of the center-tilt mechanism.
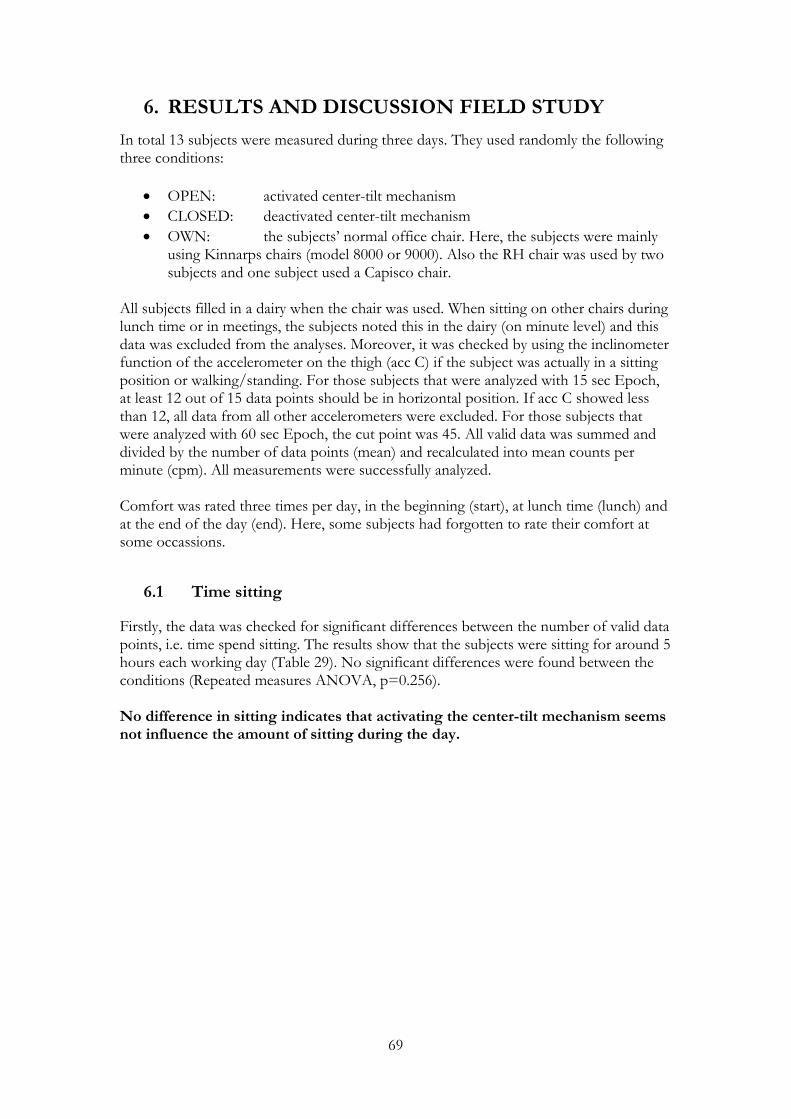
69
6. RESULTS AND DISCUSSION FIELD STUDY
In total 13 subjects were measured during three days. They used randomly the following three conditions:
OPEN: activated center-tilt mechanism
CLOSED: deactivated center-tilt mechanism
OWN: the subjects’ normal office chair. Here, the subjects were mainly using Kinnarps chairs (model 8000 or 9000). Also the RH chair was used by two subjects and one subject used a Capisco chair.
All subjects filled in a dairy when the chair was used. When sitting on other chairs during lunch time or in meetings, the subjects noted this in the dairy (on minute level) and this data was excluded from the analyses. Moreover, it was checked by using the inclinometer function of the accelerometer on the thigh (acc C) if the subject was actually in a sitting position or walking/standing. For those subjects that were analyzed with 15 sec Epoch, at least 12 out of 15 data points should be in horizontal position. If acc C showed less than 12, all data from all other accelerometers were excluded. For those subjects that were analyzed with 60 sec Epoch, the cut point was 45. All valid data was summed and divided by the number of data points (mean) and recalculated into mean counts per minute (cpm). All measurements were successfully analyzed. Comfort was rated three times per day, in the beginning (start), at lunch time (lunch) and at the end of the day (end). Here, some subjects had forgotten to rate their comfort at some occassions.
6.1 Time sitting
Firstly, the data was checked for significant differences between the number of valid data points, i.e. time spend sitting. The results show that the subjects were sitting for around 5 hours each working day (Table 29). No significant differences were found between the conditions (Repeated measures ANOVA, p=0.256). No difference in sitting indicates that activating the center-tilt mechanism seems not influence the amount of sitting during the day.

70
Table 29: Total time spent sitting during the measurement day (min).
TOTAL TIME SPENT SITTING DURING THE
MEASUREMENT DAY
subject OPEN CLOSED OWN
1 294 261 295
2 301 342 253
3 279 230 164
4 302 389 455
5 412 311 350
6 290 254 316
7 340 359 387
8 407 300 254
9 427 294 240
10 237 357 285
11 385 177 182
12 268 349 235
13 363 262 205
N 13 13 13
MEAN 331 299 279
SD 62 61 83
6.2 Accelerometry
Two variables were calculated: the mean cpm for each subject and condition, as well as the proportion of subjects with a mean cpm >100 counts. The cut point of 100 is based on the accelerometer attached to the waist, however, in this study also applied to the other accelerometers attached on other body parts and the chair.
6.2.1 Mean cpm
The data was not normally distributed and were therefore transformed using the ln log. Repeated measures ANOVA were used at first hand, but complemented by paired student t-tests in order to detect potential differences between the conditions. Table 30 shows the mean cpm for each subject (non-logged data) for each accelerometer. Here, it is clear that accelerometer A (trunk/arm) had the highest mean cpm, followed by accelerometer D (feet), the hip (acc B), and the thigh (acc C). The accelerometer on the chair (acc E) had the lowest numbers of counts. The ANOVA repeated measures could detect a difference between the conditions for accelerometer A (p<0.000), however for the other accelerometers no significant overall effect were found (Table 31). Post-hoc tests revealed significant differences between the OPEN and the CLOSED conditions (p<0.000) and between the OWN and CLOSED conditions (p<0.000), where the CLOSED condition had lowest activity (Figure 19). For accelerometer B and E, tendencies for significant differences (p<0.1) were found (Figure 20) and (Figure 21).

71
These results indicate that the center-tilt mechanism could have a positive influence on human activity levels since higher levels of human activity were found in the OPEN compared to the CLOSED condition. However, no differences between the OPEN and OWN conditions were seen in any of the accelerometers.
6.2.2 Accelerometry: proportion of subjects with “light physical activity” Mean cpm > 100 counts
As in the laboratory study, the proportion of subjects with a mean cpm> 100 counts was calculated for each condition in each task. No overall effects (Chi 2 test) were found between the conditions, however a tendency for a significant difference (p=0.062) was found for the accelerometer around the feet (acc D), between the CLOSED condition in which 12 out of 13 reached this cut point (note that the only subject that did not reach this cut point had 96 cpm), compared to 8 out of 13 in the OPEN condition (Table 30). This could mean that activating the center-tilt mechanism does not increase the activity in the feet.
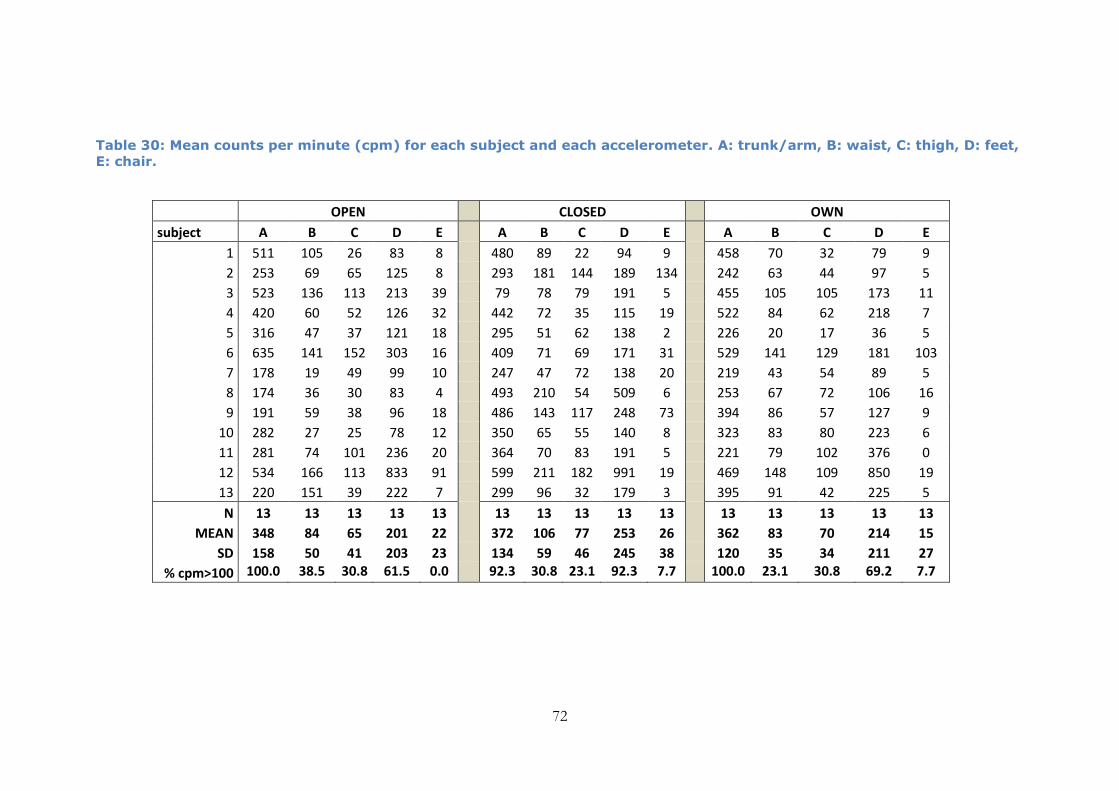
72
Table 30: Mean counts per minute (cpm) for each subject and each accelerometer. A: trunk/arm, B: waist, C: thigh, D: feet,
E: chair.
OPEN CLOSED OWN
subject A B C D E
A B C D E
A B C D E
1 511 105 26 83 8
480 89 22 94 9
458 70 32 79 9
2 253 69 65 125 8
293 181 144 189 134
242 63 44 97 5
3 523 136 113 213 39
79 78 79 191 5
455 105 105 173 11
4 420 60 52 126 32
442 72 35 115 19
522 84 62 218 7
5 316 47 37 121 18
295 51 62 138 2
226 20 17 36 5
6 635 141 152 303 16
409 71 69 171 31
529 141 129 181 103
7 178 19 49 99 10
247 47 72 138 20
219 43 54 89 5
8 174 36 30 83 4
493 210 54 509 6
253 67 72 106 16
9 191 59 38 96 18
486 143 117 248 73
394 86 57 127 9
10 282 27 25 78 12
350 65 55 140 8
323 83 80 223 6
11 281 74 101 236 20
364 70 83 191 5
221 79 102 376 0
12 534 166 113 833 91
599 211 182 991 19
469 148 109 850 19
13 220 151 39 222 7
299 96 32 179 3
395 91 42 225 5
N 13 13 13 13 13
13 13 13 13 13
13 13 13 13 13
MEAN 348 84 65 201 22
372 106 77 253 26
362 83 70 214 15
SD 158 50 41 203 23
134 59 46 245 38
120 35 34 211 27
% cpm>100 100.0 38.5 30.8 61.5 0.0 92.3 30.8 23.1 92.3 7.7 100.0 23.1 30.8 69.2 7.7
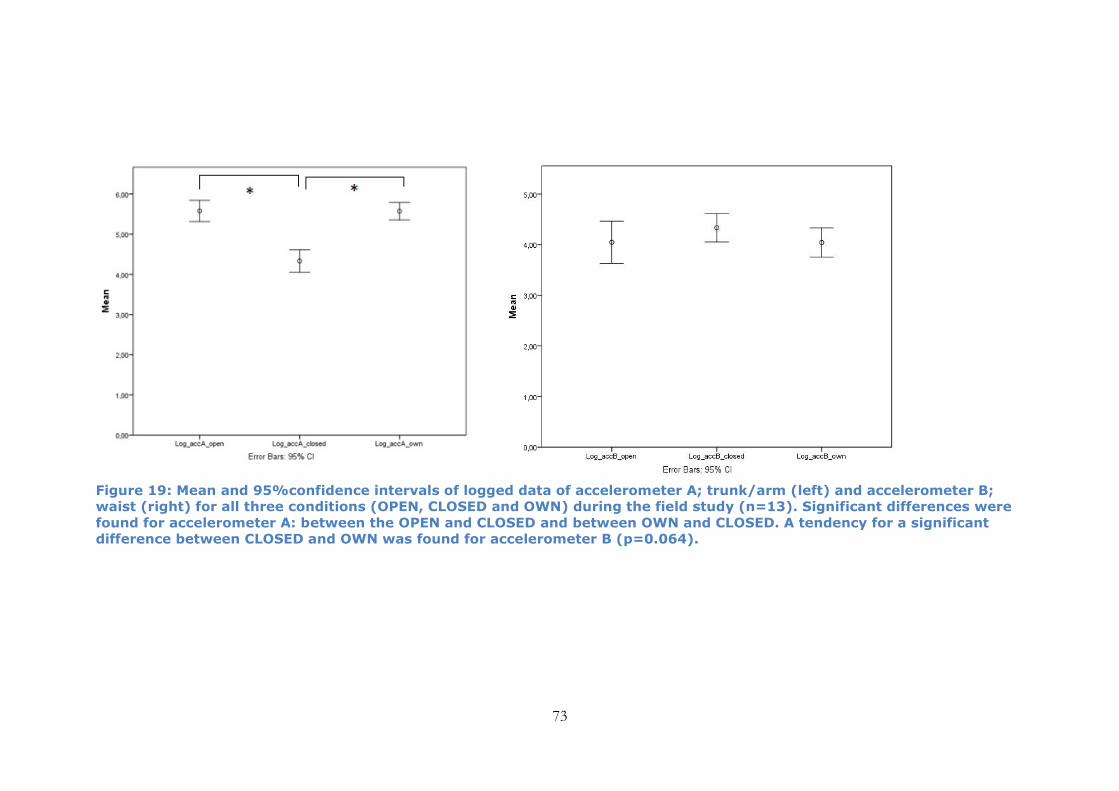
73
Figure 19: Mean and 95%confidence intervals of logged data of accelerometer A; trunk/arm (left) and accelerometer B;
waist (right) for all three conditions (OPEN, CLOSED and OWN) during the field study (n=13). Significant differences were
found for accelerometer A: between the OPEN and CLOSED and between OWN and CLOSED. A tendency for a significant
difference between CLOSED and OWN was found for accelerometer B (p=0.064).

74
Figure 20: Mean and 95%confidence intervals of logged data of accelerometer C; thigh (left) and accelerometer D; feet
(right) for all three conditions (OPEN, CLOSED and OWN) during the field study (n=13). No significant differences nor
tendencies for differences were found for accelerometers C or D.

75
Figure 21: Mean and 95%confidence intervals of logged data of accelerometer E (chair) for all three conditions (OPEN,
CLOSED and OWN) during the field study (n=13). No significant differences were found, however a tendency (p<0.10)
between condition OPEN and OWN.

76
Table 31: Results from repeated-measures analysis of variance (ANOVA)
of each accelerometer on data from the different conditions; OPEN vs.
CLOSED vs. OWN (n = 13).
Main effect Post-hoc effect
Dependent variable F P ES Comparison p
A
Chair 41.87 <0.000 0.777 OPEN/OWN > CLOSED
<0.001
B
Chair 1.897 0.172 0.137
C
Chair 1.036 0.370 0.079
D
Chair 1.786 0.190 0.130
E
Chair 2.201 0.132 0.155
ES: effect size (partial eta-squared). 0.20 is a minimal solution; 0.50 is a medium effect; and anything equal to or greater than 0.80 is a large effect size. OPE: open chair, OWN: own chair used at the time of measurements, CLO: closed chair.

77
6.3 Comfort
The subjects rated their comfort high (seven or higher on a 1-10 scale) most of the time. There were no overall differences between the conditions, neither at start, at lunch time nor at the end of the day (Table 32). However, there were overall differences found within each condition, where it was clear that during the day, the comfort ratings decreased significantly for all conditions with between 1,5-2 comfort points. Table 32: Individual comfort ratings in the field study, at the beginning
of the day, at lunch time and at the end of the day. Numbers of
observations (n), mean and SD, as well as p-values from the FRIEDMAN’s
analyses of ranks for differences within each condition and between the
conditions, as well as for the post-hoc tests (Wilcoxon rank sum test).
OPEN CLOSED OWN
subject START LUNCH FINISH START LUNCH FINISH START LUNCH FINISH
1 10 8 3 10 6 8 10 9 6
2 6 6 5 9
8 10 10 9
3 8,5 7 5 9 8 7 7,5 6 5
4 8 6 5 8 8 6 8 7 5
5 8 7 5 6 5 2 9 8 8
6 9 9 9 8 8 8 7 7
7 9 8 7 9 8 8 9 9 9
8 8 8 3 3 3
9 9 9 8 9 5 7 9 9 7
10 9 8 8 9 9 9 8 8 8
11 8
8 7
7 8
8
12 9 8 8 9 8 7 7 8 4
13 8 8 6 8 8 8 8 8 7
n 13 12 12 13 11 13 11 11 12
MEAN 8,4 7,7 6,4 8,0 6,9 6,8 8,5 8,1 6,9
SD 1,0 1,0 1,9 1,9 1,9 2,1 1,0 1,2 1,7
Overall effect
WITHIN conditions
open 0.000 closed 0.006 own 0.002
start-lunch 0.016 0.023
0.157
start-finish 0.016
0.010
0.011
lunch-finish 0.010 0.595 0.017
Overall effect
BETWEEN conditions
start 0.953 lunch 0.902 finish 0.614

78
For the OPEN condition, comfort decreased significantly between each point of measurement (Figure 22), while for the CLOSED condition, there was no difference found between the ratings at lunch time and at the end of the day (Figure 23). For the OWN condition, there was no difference between the ratings at the start and at lunch time, however a significant difference was found between lunch time and the end of the day (Figure 24).
Figure 22: Mean and 95% Confidence Intervals of Comfort ratings at the
start at the day, at lunch time and on the end of the day in the OPEN
condition during the field study.

79
Figure 23: Mean and 95% Confidence Intervals of Comfort ratings at the
start at the day, at lunch time and on the end of the day in the CLOSED
condition during the field study.
Figure 24: Mean and 95% Confidence Intervals of Comfort ratings at the
start at the day, at lunch time and on the end of the day in the OWN
condition during the field study.
These results give us important information about comfort during working days. Independent on which chair is used, comfort levels decrease after the end of the working day. Activating the tilt-mechanism has no influence on comfort levels.
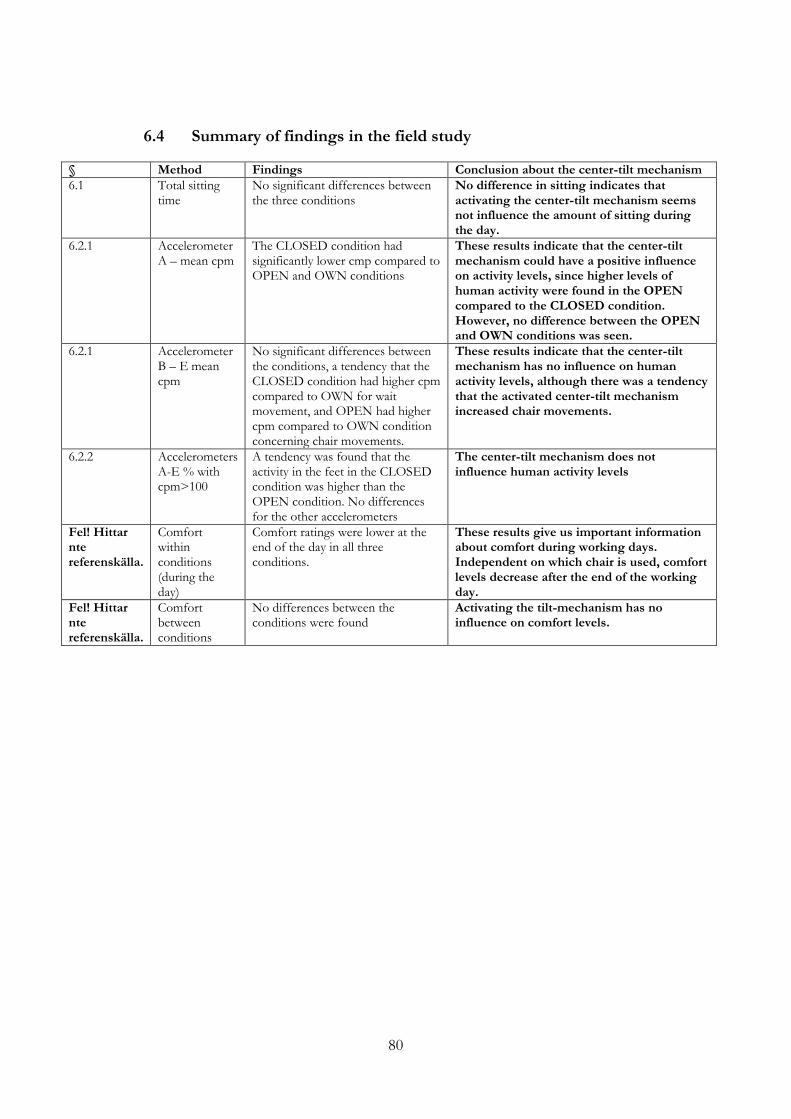
80
6.4 Summary of findings in the field study
§ Method Findings Conclusion about the center-tilt mechanism
6.1 Total sitting time
No significant differences between the three conditions
No difference in sitting indicates that activating the center-tilt mechanism seems not influence the amount of sitting during the day.
6.2.1 Accelerometer A – mean cpm
The CLOSED condition had significantly lower cmp compared to OPEN and OWN conditions
These results indicate that the center-tilt mechanism could have a positive influence on activity levels, since higher levels of human activity were found in the OPEN compared to the CLOSED condition. However, no difference between the OPEN and OWN conditions was seen.
6.2.1 Accelerometer B – E mean cpm
No significant differences between the conditions, a tendency that the CLOSED condition had higher cpm compared to OWN for wait movement, and OPEN had higher cpm compared to OWN condition concerning chair movements.
These results indicate that the center-tilt mechanism has no influence on human activity levels, although there was a tendency that the activated center-tilt mechanism increased chair movements.
6.2.2 Accelerometers A-E % with cpm>100
A tendency was found that the activity in the feet in the CLOSED condition was higher than the OPEN condition. No differences for the other accelerometers
The center-tilt mechanism does not influence human activity levels
Fel! Hittar nte referenskälla.
Comfort within conditions (during the day)
Comfort ratings were lower at the end of the day in all three conditions.
These results give us important information about comfort during working days. Independent on which chair is used, comfort levels decrease after the end of the working day.
Fel! Hittar nte referenskälla.
Comfort between conditions
No differences between the conditions were found
Activating the tilt-mechanism has no influence on comfort levels.

81
7. OVERALL DISCUSSION AND CONCLUSIONS
The aim of this report was to study the effect of center-tilt mechanism on human activity during dynamic and static office work in a laboratory environment, as well as during regular office work in an empiric setting. The results show effects of the center-tilt mechanism on human activity, when studying the kinematics, the kinetics and accelerometers in the laboratory study and accelerometers in the field study. The most important positive effect of the center-tilt mechanism was seen using the cpm>100 cut off for the accelerometer of the waist during the laboratory study, in which positive effects of the center-tilt mechanism were found during dynamic office work, and not during standing. Secondary outcomes show neither any positive nor any negative effects on posture, performance or comfort of activating the center-tilt mechanism. These results could have been influenced by some of the shortcomings of the methods we have used. Perhaps, including a larger number of subjects should have altered the results somewhat, since in some of the calculations, the p-value was lower than 0.10 but not reaching the level of 0.05, which could be an underestimation of the effects. The subjects in the laboratory study were a mixture of office workers and students, and they were all trained computer users, however, perhaps not very trained in performing simulated office work in a standing position. In this respect, it should be interesting to study if there is a learning effect of working in a standing position. More advanced statistics are needed, in which effects of task and conditions are taken into account at the same time (repeated ANOVA). For example, Bonferroni corrections or corrections in p-value cut points should be made to compensate for the large amount of statistical tests that were performed. The results in the study could thus to some extent have overestimated the effects. However, for the main outcomes (accelerometry in the laboratory and field study), these advanced statistics were used and they differed not from the non-parametric analyzes, i.e. there seems to be a stability in the results. Also the large amount of different outcome measures used; kinematics, kinetics and accelerometry, is one of the strength in these studies. The possibility to study secondary outcomes, posture, performance and comfort to gain a more holistic view, is an additional strength of the present study.
Conclusion The aim of the study was to determine if chairs with open center-tilt mechanism have effect on human activity levels and how it relates to the same chair with locked center-tilt mechanism, conventional sitting and standing in a normal office work setting. In general the results confirmed that during most conditions office work can be classified as sedentary. The task performed was a more important contributor to human activity than the sitting or standing conditions. Still, standing and the chair with open center-tilt mechanism was confirmed to promote some positive results, especially in the active desk task where 73 % of the subjects reached the level of light human activity when seated on a center-tilt chair with open mechanism. These results indicate that there is a difference between seating solutions capacity to unconsciously promote human activity without changing behavior. The results of this study also challenges standing as a solution to increase human activity and performance. In several parameters standing was associated with increased human activity, however, not in all parameters and sometimes even associated with lower human activity, thus in contradiction with the primary hypothesis. This indicates that we need to deeper our knowledge of the disadvantages of conventional sitting and advances of light activity during office work to be able to establish better guidance for sedentary office work.

82
REFERENCES
1. Wilson JR. Fundamentals of ergonomics in theory and practice. Appl Ergon. 2000;31(6):557-67. 2. Wigeaus Tornqvist E, Hagberg M, Hagman M, Risberg EH, Toomingas A. The influence of working conditions and individual factors on the incidence of neck and upper limb symptoms among professional computer users. International archives of occupational and environmental health. 2009;82(6):689-702. 3. Hamilton MT, Hamilton DG, Zderic TW. Role of low energy expenditure and sitting in obesity, metabolic syndrome, type 2 diabetes, and cardiovascular disease. Diabetes. 2007;56(11):2655-67. 4. Ekblom-Bak E, Ekblom B. [Prolonged bouts of sitting is a metabolic risk factor]. Lakartidningen. 2012;109(34-35):1467-70. 5. Katzmarzyk PT, Craig CL. Musculoskeletal fitness and risk of mortality. Medicine and science in sports and exercise. 2002;34(5):740-4. 6. Levine JA. Non-exercise activity thermogenesis (NEAT). Best Pract Res Clin Endocrinol Metab. 2002;16(4):679-702. 7. Gomez-Cabello A, Pedrero-Chamizo R, Olivares PR, Hernandez-Perera R, Rodriguez-Marroyo JA, Mata E et al. Sitting time increases the overweight and obesity risk independently of walking time in elderly people from Spain. Maturitas. 2012;73(4):337-43. 8. George SM, Moore SC, Chow WH, Schatzkin A, Hollenbeck AR, Matthews CE. A prospective analysis of prolonged sitting time and risk of renal cell carcinoma among 300,000 older adults. Annals of epidemiology. 2011;21(10):787-90. 9. Stamatakis E, Chau JY, Pedisic Z, Bauman A, Macniven R, Coombs N et al. Are sitting occupations associated with increased all-cause, cancer, and cardiovascular disease mortality risk? A pooled analysis of seven British population cohorts. PloS one. 2013;8(9):e73753. 10. Aravindalochanan V, Kumpatla S, Rengarajan M, Rajan R, Viswanathan V. Risk of diabetes in subjects with sedentary profession and the synergistic effect of positive family history of diabetes. Diabetes technology & therapeutics. 2014;16(1):26-32. 11. Marshall S, Gyi D. Evidence of health risks from occupational sitting: where do we stand? American journal of preventive medicine. 2010;39(4):389-91. doi:10.1016/j.amepre.2010.07.001. 12. Proper KI, Singh AS, van Mechelen W, Chinapaw MJ. Sedentary behaviors and health outcomes among adults: a systematic review of prospective studies. American journal of preventive medicine. 2011;40(2):174-82. 13. Thorp AA, Owen N, Neuhaus M, Dunstan DW. Sedentary behaviors and subsequent health outcomes in adults a systematic review of longitudinal studies, 1996-2011. American journal of preventive medicine. 2011;41(2):207-15. 14. van Uffelen JG, Wong J, Chau JY, van der Ploeg HP, Riphagen I, Gilson ND et al. Occupational sitting and health risks: a systematic review. American journal of preventive medicine. 2010;39(4):379-88. 15. Grooten WJ, Conradsson D, Ang BO, Franzen E. Is active sitting as active as we think? Ergonomics. 2013;56(8):1304-14. 16. Ellegast RP, Kraft K, Groenesteijn L, Krause F, Berger H, Vink P. Comparison of four specific dynamic office chairs with a conventional office chair: impact upon muscle activation, physical activity and posture. Appl Ergon. 2012;43(2):296-307.
17. Matthew CE. Calibration of accelerometer output for adults. Medicine and science in sports and exercise. 2005;37(11 Suppl):S512-22. 18. Crouter SE, DellaValle DM, Haas JD, Frongillo EA, Bassett DR. Validity of ActiGraph 2-regression model, Matthews cut-points, and NHANES cut-points for assessing free-living physical activity. Journal of physical activity & health. 2013;10(4):504-14. 19. Shackel B, Chidsey KD, Shipley P. The assessment of chair comfort. Ergonomics. 1969;12(2):269-306. 20. Alnaser MZ, Wughalter EH. Effect of chair design on ratings of discomfort. Work. 2009;34(2):223-34.

83
APPENDIX A. Etical approvement

84
APPENDIX B Comfort scale
How do you feel?
10. I feel completely relaxed
9. I feel perfectly comfortable
8. I feel quite comfortable
7. I feel barely comfortable
6. I feel uncomfortable
5. I feel restless and fidgety
4. I feel cramped
3. I feel stiff
2. I feel numb (pins and needles)
1. I feel sore and tender
0. I feel unbearable pain