activities - shaw high studentsshawhighstudents.org/apes/files/2010/08/activities.pdf · activities...
TRANSCRIPT


Activities
Activities
The Scientific MethodThe Scientific MethodStory (from catdrop.com)
“As part of anti-malarial campaign in the northern states of the island of Borneo in the late 1950’s, the World Health Organization sprayed DDT and other insecticides to kill the mosquito vector for malaria. During this campaign, DDT was sprayed in large amounts on the inside walls and ceilings of the large “long houses” that housed an entire village in these areas. As a consequence of this effort, the incidence of malaria in the region fell dramatically. However, there were two unintended consequences of this action. There was an increase in the rate of decay of the thatched roofs covering the long houses because a moth caterpillar that ingests the thatch avoided the DDT but their parasite, the larvae of a small wasp, did not. Also, the domestic cats roaming through the houses were poisoned by the DDT as a consequence of rubbing against the walls and then licking the insecticide off their fur. In some villages, the loss of cats allowed rats to enter, which raised concerns of rodent-related diseases such as typhus and the plague. To rectify this problem in one remote village, several dozen cats were collected in coastal towns and parachuted by the Royal Air Force in a special container to replace those killed by the insecticides.”
BackgroundScientific research involves asking questions about nature and collecting data or evidence that may lead to the
answers. Investigators often frame their questions in the form of testable hypotheses, which are either accepted or rejected on the basis of the observational or experimental data compiled. This general process is termed the hypothetico-deductive method. The method consists of falsifying hypotheses. The process begins when initial observations or ideas are used as a basis to formulate a null hypothesis (H0).
The null hypothesis states that two or more data sets are no more different that one would expect by chance. The investigator then collects appropriate data and accepts or rejects the null hypothesis on the basis of that evidence. For example, initial observations may have led you to suspect that Shaw students are more likely to be found at the Sunoco station than at the Gas USA station. Your null hypothesis, then, could be framed as follows:
H0: Outside of Shaw, there is no significant difference between the number of students at the Sunoco station than at the Gas USA station.
Your next step would be to make observations about Shaw students and which stations they go to, by visiting the stations, giving surveys, or asking the owners. Naturally, the greater your sample size (the more observations you make), the better your chances are of determining the correct answer. At some point, though, you decide you have collected enough data to accept or reject the null hypothesis with a reasonable degree of certainty.
In this case, accepting the null hypothesis means either that there is no significant difference between the number of Shaw students at the two stations, or that your data were insufficient to determine a difference. Rejecting the null hypothesis means that a difference likely does exist. Rejection then leads to an alternate hypothesis:
H1: The difference between the number of students who go to the Sunoco station and the Gas USA station is too great to be ascribed to mere chance.
Having determined that a structural difference in form or pattern indeed does exist, the foundation is laid for a functional study to find the cause of that pattern. This functional phase begins with the phrasing of a second null hypothesis directed at cause-effect relationships. For example, you might say that there is no difference in the prices of snacks between the two stations and then test that hypothesis.
SituationTwo neighboring houses in East Cleveland are almost identical in appearance. Both are one-family homes, having
a square footage of less than 1200 square feet, and both are surrounded by identical vegetation. Investigators have found one house to be susceptible to flooding, while the other appears to be in no immediate flood damage; yet the only significant difference between the two homes is their elevation.
Home A is perched up above the water table. Also, the foundation of the house was recently waterproofed.Home B is on a lower elevation, with its basement sunk underneath the water table. The foundation of the house
has never been waterproofed. 1. Frame a null hypothesis and outline a hypothetical strategy to investigate precisely why Home A is less susceptible
to flooding than Home B. Include: a) A general statement about the observed physical differences between the two homes b) A null hypothesis formulated to test this difference c) A suggested testing procedure d) A statement rejecting the null hypothesis (we will assume your data suggest a difference) e) An alternate hypothesis f) An explanation of the possible cause of the difference g) A null hypothesis of this cause-effect relationship h) A suggested test strategy to evaluate this relationship
2010 - 2011 2
Ecological footprint
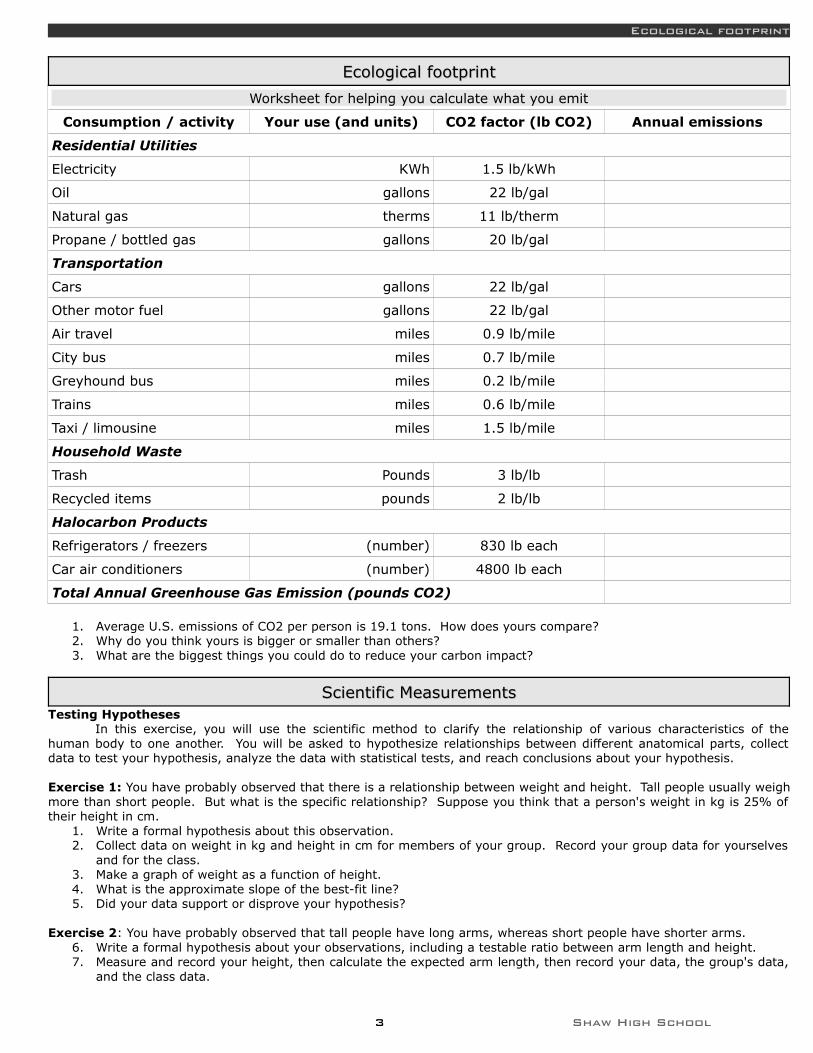
Ecological footprintEcological footprint
Worksheet for helping you calculate what you emit
Consumption / activity Your use (and units) CO2 factor (lb CO2) Annual emissions
Residential Utilities
Electricity KWh 1.5 lb/kWh
Oil gallons 22 lb/gal
Natural gas therms 11 lb/therm
Propane / bottled gas gallons 20 lb/gal
Transportation
Cars gallons 22 lb/gal
Other motor fuel gallons 22 lb/gal
Air travel miles 0.9 lb/mile
City bus miles 0.7 lb/mile
Greyhound bus miles 0.2 lb/mile
Trains miles 0.6 lb/mile
Taxi / limousine miles 1.5 lb/mile
Household Waste
Trash Pounds 3 lb/lb
Recycled items pounds 2 lb/lb
Halocarbon Products
Refrigerators / freezers (number) 830 lb each
Car air conditioners (number) 4800 lb each
Total Annual Greenhouse Gas Emission (pounds CO2)
1. Average U.S. emissions of CO2 per person is 19.1 tons. How does yours compare?2. Why do you think yours is bigger or smaller than others?3. What are the biggest things you could do to reduce your carbon impact?
Scientific MeasurementsScientific MeasurementsTesting Hypotheses
In this exercise, you will use the scientific method to clarify the relationship of various characteristics of the human body to one another. You will be asked to hypothesize relationships between different anatomical parts, collect data to test your hypothesis, analyze the data with statistical tests, and reach conclusions about your hypothesis.
Exercise 1: You have probably observed that there is a relationship between weight and height. Tall people usually weigh more than short people. But what is the specific relationship? Suppose you think that a person's weight in kg is 25% of their height in cm.
1. Write a formal hypothesis about this observation.2. Collect data on weight in kg and height in cm for members of your group. Record your group data for yourselves
and for the class.3. Make a graph of weight as a function of height.4. What is the approximate slope of the best-fit line?5. Did your data support or disprove your hypothesis?
Exercise 2: You have probably observed that tall people have long arms, whereas short people have shorter arms.6. Write a formal hypothesis about your observations, including a testable ratio between arm length and height.7. Measure and record your height, then calculate the expected arm length, then record your data, the group's data,
and the class data.
3 Shaw High School

Activities
8. What is the difference between the expected and observed arm length?9. Did your data support or disprove your hypothesis?
Exercise 3: Study the length of your index finger and the volume it takes up. What do you think the ratio between the length of your index finger and the volume will be?
10. Write a formal hypothesis.11. Design a method to test your hypothesis.12. Was your hypothesis support or disproven?13. What can you conclude about your hypothesis?
Experimental designExperimental designFrom Richard Feynman's commencement address to Cal Tech students in 1974
During the Middle Ages there were all kinds of crazy ideas, such as that a piece of rhinoceros horn would increase potency. Then a method was discovered for separating the ideas—which was to try one to see if it worked, and if it didn’t work, to eliminate it. This method became organized, of course, into science. And it developed very well, so that we are now in the scientific age. It is such a scientific age, in fact that we have difficulty in understanding how witch doctors could ever have existed, when nothing that they proposed ever really worked—or very little of it did.
But even today I meet lots of people who sooner or later get me into a conversation about UFOS, or astrology, or some form of mysticism, expanded consciousness, new types of awareness, ESP, and so forth. And I’ve concluded that it’s not a scientific world.
Most people believe so many wonderful things that I decided to investigate why they did. And what has been referred to as my curiosity for investigation has landed me in a difficulty where I found so much junk that I’m overwhelmed. First I started out by investigating various ideas of mysticism, and mystic experiences. I went into isolation tanks and got many hours of hallucinations, so I know something about that. Then I went to Esalen, which is a hotbed of this kind of thought (it’s a wonderful place; you should go
visit there). Then I became overwhelmed. I didn’t realize how much there was.At Esalen there are some large baths fed by hot springs situated on a
ledge about thirty feet above the ocean. One of my most pleasurable experiences has been to sit in one of those baths and watch the waves crashing onto the rocky shore below, to gaze into the clear blue sky above, and to study a beautiful nude as she quietly appears and settles into the bath with me.
One time I sat down in a bath where there was a beautiful girl sitting with a guy who didn’t seem to know her. Right away I began thinking, “Gee! How am I gonna get started talking to this beautiful nude babe?”
I’m trying to figure out what to say, when the guy says to her, I’m, uh, studying massage. Could I practice on you?”
“Sure,” she says. They get out of the bath and she lies down on a massage table nearby.I think to myself, “What a nifty line! I can never think of anything like that!” He starts to rub her big toe. “I think I
feel it,” he says. “I feel a kind of dent—is that the pituitary?”I blurt out, “You’re a helluva long way from the pituitary, man!”They looked at me, horrified—I had blown my cover—and said, “It’s reflexology!”
I quickly closed my eyes and appeared to be meditating.That’s just an example of the kind of things that overwhelm me. I also
looked into extrasensory perception and PSI phenomena, and the latest craze there was Uri Geller, a man who is supposed to be able to bend keys by rubbing them with his finger. So I went to his hotel room, on his invitation, to see a demonstration of both mindreading and bending keys. He didn’t do any mindreading that succeeded; nobody can read my mind, I guess. And my boy held a key and Geller rubbed it, and nothing happened. Then he told us it works better under water, and so you can picture all of us standing in the bathroom with the water turned on and the key under it, and him rubbing the key with his finger. Nothing happened. So I was unable to investigate that phenomenon.
But then I began to think, what else is there that we believe? (And I thought then about the witch doctors, and how easy it would have been to cheek on them by noticing that nothing really worked.) So I found things that even more people believe, such as that we have some knowledge of how to educate. There are big schools of reading methods and mathematics methods, and so forth, but if you notice, you’ll see the reading
2010 - 2011 4
Experimental design
scores keep going down—or hardly going up in spite of the fact that we continually use these same people to improve the methods. There’s a witch doctor remedy that doesn’t work. It ought to be looked into; how do they know that their method should work? Another example is how to treat criminals. We obviously have made no progress—lots of theory, but no progress— in decreasing the amount of crime by the method that we use to handle criminals.
Yet these things are said to be scientific. We study them. And I think ordinary people with commonsense ideas are intimidated by this pseudoscience. A teacher who has some good idea of how to teach her children to read is forced by the school system to do it some other way—or is even fooled by the school system into thinking that her method is not necessarily a good one. Or a parent of bad boys, after disciplining them in one way or another, feels guilty for the rest of her life because she didn’t do “the right thing,” according to the experts.
So we really ought to look into theories that don’t work, and science that isn’t science.
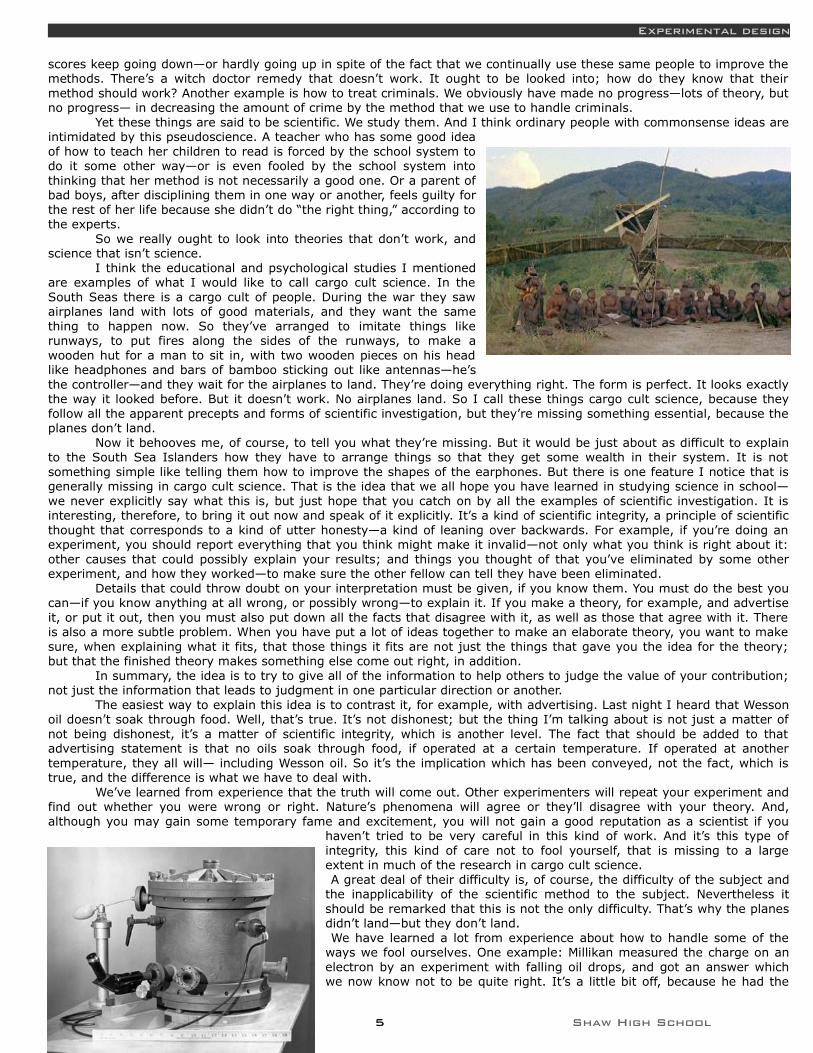
I think the educational and psychological studies I mentioned are examples of what I would like to call cargo cult science. In the South Seas there is a cargo cult of people. During the war they saw airplanes land with lots of good materials, and they want the same thing to happen now. So they’ve arranged to imitate things like runways, to put fires along the sides of the runways, to make a wooden hut for a man to sit in, with two wooden pieces on his head like headphones and bars of bamboo sticking out like antennas—he’s the controller—and they wait for the airplanes to land. They’re doing everything right. The form is perfect. It looks exactly the way it looked before. But it doesn’t work. No airplanes land. So I call these things cargo cult science, because they follow all the apparent precepts and forms of scientific investigation, but they’re missing something essential, because the planes don’t land.
Now it behooves me, of course, to tell you what they’re missing. But it would be just about as difficult to explain to the South Sea Islanders how they have to arrange things so that they get some wealth in their system. It is not something simple like telling them how to improve the shapes of the earphones. But there is one feature I notice that is generally missing in cargo cult science. That is the idea that we all hope you have learned in studying science in school—we never explicitly say what this is, but just hope that you catch on by all the examples of scientific investigation. It is interesting, therefore, to bring it out now and speak of it explicitly. It’s a kind of scientific integrity, a principle of scientific thought that corresponds to a kind of utter honesty—a kind of leaning over backwards. For example, if you’re doing an experiment, you should report everything that you think might make it invalid—not only what you think is right about it: other causes that could possibly explain your results; and things you thought of that you’ve eliminated by some other experiment, and how they worked—to make sure the other fellow can tell they have been eliminated.
Details that could throw doubt on your interpretation must be given, if you know them. You must do the best you can—if you know anything at all wrong, or possibly wrong—to explain it. If you make a theory, for example, and advertise it, or put it out, then you must also put down all the facts that disagree with it, as well as those that agree with it. There is also a more subtle problem. When you have put a lot of ideas together to make an elaborate theory, you want to make sure, when explaining what it fits, that those things it fits are not just the things that gave you the idea for the theory; but that the finished theory makes something else come out right, in addition.
In summary, the idea is to try to give all of the information to help others to judge the value of your contribution; not just the information that leads to judgment in one particular direction or another.
The easiest way to explain this idea is to contrast it, for example, with advertising. Last night I heard that Wesson oil doesn’t soak through food. Well, that’s true. It’s not dishonest; but the thing I’m talking about is not just a matter of not being dishonest, it’s a matter of scientific integrity, which is another level. The fact that should be added to that advertising statement is that no oils soak through food, if operated at a certain temperature. If operated at another temperature, they all will— including Wesson oil. So it’s the implication which has been conveyed, not the fact, which is true, and the difference is what we have to deal with.
We’ve learned from experience that the truth will come out. Other experimenters will repeat your experiment and find out whether you were wrong or right. Nature’s phenomena will agree or they’ll disagree with your theory. And, although you may gain some temporary fame and excitement, you will not gain a good reputation as a scientist if you
haven’t tried to be very careful in this kind of work. And it’s this type of integrity, this kind of care not to fool yourself, that is missing to a large extent in much of the research in cargo cult science.A great deal of their difficulty is, of course, the difficulty of the subject and
the inapplicability of the scientific method to the subject. Nevertheless it should be remarked that this is not the only difficulty. That’s why the planes didn’t land—but they don’t land.We have learned a lot from experience about how to handle some of the
ways we fool ourselves. One example: Millikan measured the charge on an electron by an experiment with falling oil drops, and got an answer which we now know not to be quite right. It’s a little bit off, because he had the
5 Shaw High School

Activities
incorrect value for the viscosity of air. It’s interesting to look at the history of measurements of the charge of the electron, after Millikan. If you plot them as a function of time, you find that one is a little bigger than Millikan’s, and the next one’s a little bit bigger than that, and the next one’s a little bit bigger than that, until finally they settle down to a number which is higher.
Why didn’t they discover that the new number was higher right away? It’s a thing that scientists are ashamed of—this history—because it’s apparent that people did things like this: When they got a number that was too high above Millikan’s, they thought something must be wrong—and they would look for and find a reason why something might be wrong. When they got a number closer to Millikan’s value they didn’t look so hard. And so they eliminated the numbers that were too far off, and did other things like that. We’ve learned those tricks nowadays, and now we don’t have that kind of a disease.
But this long history of learning how not to fool ourselves—of having utter scientific integrity—is, I’m sorry to say, something that we haven’t specifically included in any particular course that I know of. We just hope you’ve caught on by osmosis.
The first principle is that you must not fool yourself—and you are the easiest person to fool. So you have to be very careful about that. After you’ve not fooled yourself, it’s easy not to fool other scientists. You just have to be honest in a conventional way after that.
I would like to add something that’s not essential to the science, but something I kind of believe, which is that you should not fool the layman when you’re talking as a scientist. I am not trying to tell you what to do about cheating on your wife, or fooling your girlfriend, or something like that, when you’re not trying to be a scientist, but just trying to be an ordinary human being. We’ll leave those problems up to you and your rabbi. I’m talking about a specific, extra type of integrity that is not lying, but bending over backwards to show how you are maybe wrong, that you ought to have when acting as a scientist. And this is our responsibility as scientists, certainly to other scientists, and I think to laymen.
For example, I was a little surprised when I was talking to a friend who was going to go on the radio. He does work on cosmology and astronomy, and he wondered how he would explain what the applications of this work were. “Well,” I said, “there aren’t any.” He said, “Yes, but then we won’t get support for more research of this kind.” I think that’s kind of dishonest. If you’re representing yourself as a scientist, then you should explain to the layman what you’re doing—and if they don’t want to support you under those circumstances, then that’s their decision.
One example of the principle is this: If you’ve made up your mind to test a theory, or you want to explain some idea, you should always decide to publish it whichever way it comes out. If we only publish results of a certain kind, we can make the argument look good. We must publish both kinds of results.
I say that’s also important in giving certain types of government advice. Supposing a senator asked you for advice about whether drilling a hole should be done in his state; and you decide it would be better in some other state. If you don’t publish such a result, it seems to me you’re not giving scientific advice. You’re being used. If your answer happens to come out in the direction the government or the politicians like, they can use it as an argument in their favor; if it comes out the other way, they don’t publish it at all. That’s not giving scientific advice.
Other kinds of errors are more characteristic of poor science. When I was at Cornell, I often talked to the people in the psychology department. One of the students told me she wanted to do an experiment that went something like this—it had been found by others that under certain circumstances, X, rats did something, A. She was curious as to whether, if she changed the circumstances to Y, they would still do A. So her proposal was to do the experiment under circumstances Y and see if they still did A.
I explained to her that it was necessary first to repeat in her laboratory the experiment of the other person—to do it under condition X to see if she could also get result A, and then change to Y and see if A changed. Then she would know that the real difference was the thing she thought she had under control.
She was very delighted with this new idea, and went to her professor. And his reply was, no, you cannot do that, because the experiment has already been done and you would be wasting time. This was in about 1947 or so, and it seems to have been the general policy then to not try to repeat psychological experiments, but only to change the conditions and see what happens.
Nowadays there’s a certain danger of the same thing happening, even in the famous (?) field of physics. I was shocked to hear of an experiment done at the big accelerator at the National Accelerator Laboratory, where a person used deuterium [also known as “heavy hydrogen”]. In order to compare his heavy hydrogen results to what might happen with light hydrogen” he had to use data from someone else’s experiment on light hydrogen, which was done on different apparatus. When asked why, he said it was because he couldn’t get time on the program (because there’s so little time and it’s such expensive apparatus) to do the experiment with light hydrogen on this apparatus because there wouldn’t be any new result. And so the men in charge of programs at NAL are so anxious for new results, in order to get more money to keep the thing going for public relations purposes, they are destroying—possibly—the value of the experiments themselves, which is the whole purpose of the thing. It is often hard for the experimenters there to complete their work as their scientific integrity demands.
2010 - 2011 6

Experimental design
All experiments in psychology are not of this type, however. For example, there have been many experiments running rats through all kinds of mazes, and so on—with little clear result. But in 1937 a man named Young did a very interesting one. He had a long corridor with doors all along one side where the rats came in, and doors along the other side where the food was. He wanted to see if he could train the rats to go in at the third door down from wherever he started them off. No. The rats went immediately to the door where the food had been the time before.
The question was, how did the rats know, because the corridor was so beautifully built and so uniform, that this was the same door as before? Obviously there was something about the door that was different from the other doors. So he painted the doors very carefully, arranging the textures on the faces of the doors exactly the same. Still the rats could tell. Then he thought maybe the rats were smelling the food, so he used chemicals to change the smell after each run. Still the rats could tell. Then he realized the rats might be able to tell by seeing the lights and the arrangement in the laboratory like any commonsense person. So he covered the corridor, and still the rats could tell.
He finally found that they could tell by the way the floor sounded when they ran over it. And he could only fix that by putting his corridor in sand. So he covered one after another of all possible clues and finally was able to fool the rats so that they had to learn to go in the third door. If he relaxed any of his conditions, the rats could tell.
Now, from a scientific standpoint, that is an A-number-one experiment. That is the experiment that makes rat-running experiments sensible, because it uncovers the clues that the rat is really using—not what you think it’s using. And that is the experiment that tells exactly what conditions you have to use in order to be careful and control everything in an experiment with rat-running.
I looked into the subsequent history of this research. The next experiment, and the one after that, never referred to Mr. Young. They never used any of his criteria of putting the corridor on sand, or being very careful. They just went right on running rats in the same old way, and paid no attention to the great discoveries of Mr. Young, and his papers are not referred to, because he didn’t discover anything about the rats. In fact, he discovered all the things you have to do to discover something about rats. But not paying attention to experiments like that is a characteristic of cargo cult science.
Another example is the ESP experiments of Mr. Rhine, and other people. As various people have made criticisms—and they themselves have made criticisms of their own experiments—they improve the techniques so that the effects are smaller, and smaller, and smaller until they gradually disappear. All the parapsychologists are looking for some experiment that can be repeated—that you can do again and get the same effect—statistically, even. They run a million rats no, it’s people this time they do a lot of things and get a certain statistical effect. Next time they try it they don’t get it any more. And now you find a man saying that it is an irrelevant demand to expect a repeatable experiment. This is science?
This man also speaks about a new institution, in a talk in which he was resigning as Director of the Institute of Parapsychology. And, in telling people what to do next, he says that one of the things they have to do is be sure they only train students who have shown their ability to get PSI results to an acceptable extent— not to waste their time on those ambitious and interested students who get only chance results. It is very dangerous to have such a policy in teaching—to teach students only how to get certain results, rather than how to do an experiment with scientific integrity.
So I have just one wish for you—the good luck to be somewhere where you are free to maintain the kind of integrity I have described, and where you do not feel forced by a need to maintain your position in the organization, or financial support, or so on, to lose your integrity. May you have that freedom.
1. What is Cargo Cult Science?2. What makes for a bad experiment?3. What makes for a good experiment?4. What are the lessons that you should take with you when performing experiments?
Biogeochemical CyclesBiogeochemical CyclesAll living organisms need energy. This source of energy can be found in several types of organic compounds such
as carbohydrates, lipids, proteins, and nucleic acids. The building blocks of all of these compounds are elements. The elements nitrogen, oxygen, carbon, and hydrogen are the four major components of all of the organic compounds.
Lucky for us, these elements can be found in a variety of different forms. However, once we use these elements up for our own purposes what happens to them? Where do they go when we die? Are they lost forever? Of course not! Nature has found its own way to recycle these important building blocks so that once one organism is done with them they will return to the earth in some form so that others may use them. This is what ecologists call a biogeochemical cycle, or the cycle of materials between living things and the environment. It is due to this recycling that the amount of nitrogen, oxygen, carbon, and hydrogen in the world stays relatively constant.
Three important biogeochemical cycles are: 1) the nitrogen cycle, 2) the water cycle, and 3) the carbon cycle.
The Nitrogen Cycle1. Nitrogen is essential for living things. It is a basic component of ____________, which form proteins, and of
nucleotides, which form _______________. The atmosphere contains a huge reservoir of nitrogen; almost ________ of the atmosphere is _______________ (N2). However, most organisms cannot use N2 directly; N2 is just too stable to react with anything so nature has found a way to convert atmospheric N2 into several useable forms.
2. The nitrogen cycle has several different processes in which nitrogen is changed into the most useable forms; _______________ (NH4+) ions and _______________ (NO3-) ions.
7 Shaw High School
Activities
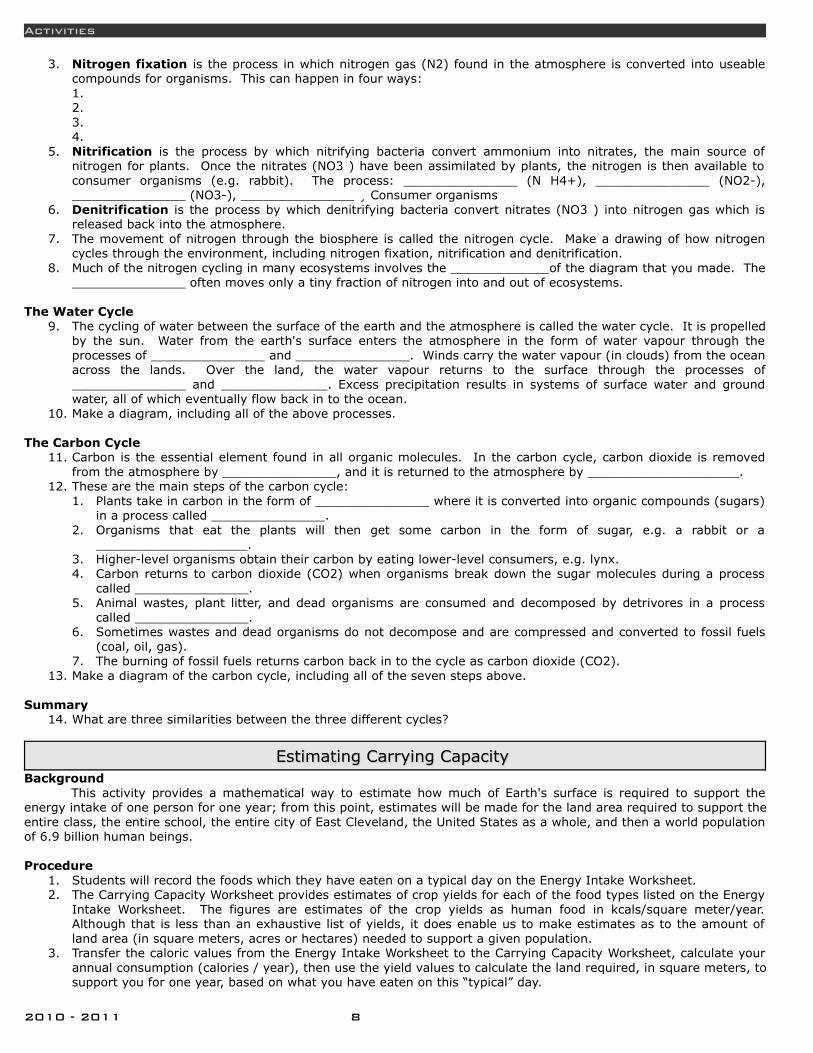
3. Nitrogen fixation is the process in which nitrogen gas (N2) found in the atmosphere is converted into useable compounds for organisms. This can happen in four ways:1. 2.3.4.
5. Nitrification is the process by which nitrifying bacteria convert ammonium into nitrates, the main source of nitrogen for plants. Once the nitrates (NO3 ) have been assimilated by plants, the nitrogen is then available to consumer organisms (e.g. rabbit). The process: _______________ (N H4+), _______________ (NO2-), _______________ (NO3-), _______________ ¸ Consumer organisms
6. Denitrification is the process by which denitrifying bacteria convert nitrates (NO3 ) into nitrogen gas which is released back into the atmosphere.
7. The movement of nitrogen through the biosphere is called the nitrogen cycle. Make a drawing of how nitrogen cycles through the environment, including nitrogen fixation, nitrification and denitrification.
8. Much of the nitrogen cycling in many ecosystems involves the _____________of the diagram that you made. The _______________ often moves only a tiny fraction of nitrogen into and out of ecosystems.
The Water Cycle9. The cycling of water between the surface of the earth and the atmosphere is called the water cycle. It is propelled
by the sun. Water from the earth's surface enters the atmosphere in the form of water vapour through the processes of _______________ and _______________. Winds carry the water vapour (in clouds) from the ocean across the lands. Over the land, the water vapour returns to the surface through the processes of _______________ and ______________. Excess precipitation results in systems of surface water and ground water, all of which eventually flow back in to the ocean.
10. Make a diagram, including all of the above processes.
The Carbon Cycle11. Carbon is the essential element found in all organic molecules. In the carbon cycle, carbon dioxide is removed
from the atmosphere by _______________, and it is returned to the atmosphere by ____________________.12. These are the main steps of the carbon cycle:
1. Plants take in carbon in the form of _______________ where it is converted into organic compounds (sugars) in a process called _______________.
2. Organisms that eat the plants will then get some carbon in the form of sugar, e.g. a rabbit or a ____________________.
3. Higher-level organisms obtain their carbon by eating lower-level consumers, e.g. lynx.4. Carbon returns to carbon dioxide (CO2) when organisms break down the sugar molecules during a process
called _______________.5. Animal wastes, plant litter, and dead organisms are consumed and decomposed by detrivores in a process
called _______________.6. Sometimes wastes and dead organisms do not decompose and are compressed and converted to fossil fuels
(coal, oil, gas). 7. The burning of fossil fuels returns carbon back in to the cycle as carbon dioxide (CO2).
13. Make a diagram of the carbon cycle, including all of the seven steps above.
Summary14. What are three similarities between the three different cycles?
Estimating Carrying Capacity Estimating Carrying Capacity Background
This activity provides a mathematical way to estimate how much of Earth's surface is required to support the energy intake of one person for one year; from this point, estimates will be made for the land area required to support the entire class, the entire school, the entire city of East Cleveland, the United States as a whole, and then a world population of 6.9 billion human beings.
Procedure1. Students will record the foods which they have eaten on a typical day on the Energy Intake Worksheet.2. The Carrying Capacity Worksheet provides estimates of crop yields for each of the food types listed on the Energy
Intake Worksheet. The figures are estimates of the crop yields as human food in kcals/square meter/year. Although that is less than an exhaustive list of yields, it does enable us to make estimates as to the amount of land area (in square meters, acres or hectares) needed to support a given population.
3. Transfer the caloric values from the Energy Intake Worksheet to the Carrying Capacity Worksheet, calculate your annual consumption (calories / year), then use the yield values to calculate the land required, in square meters, to support you for one year, based on what you have eaten on this “typical” day.
2010 - 2011 8
Estimating Carrying Capacity
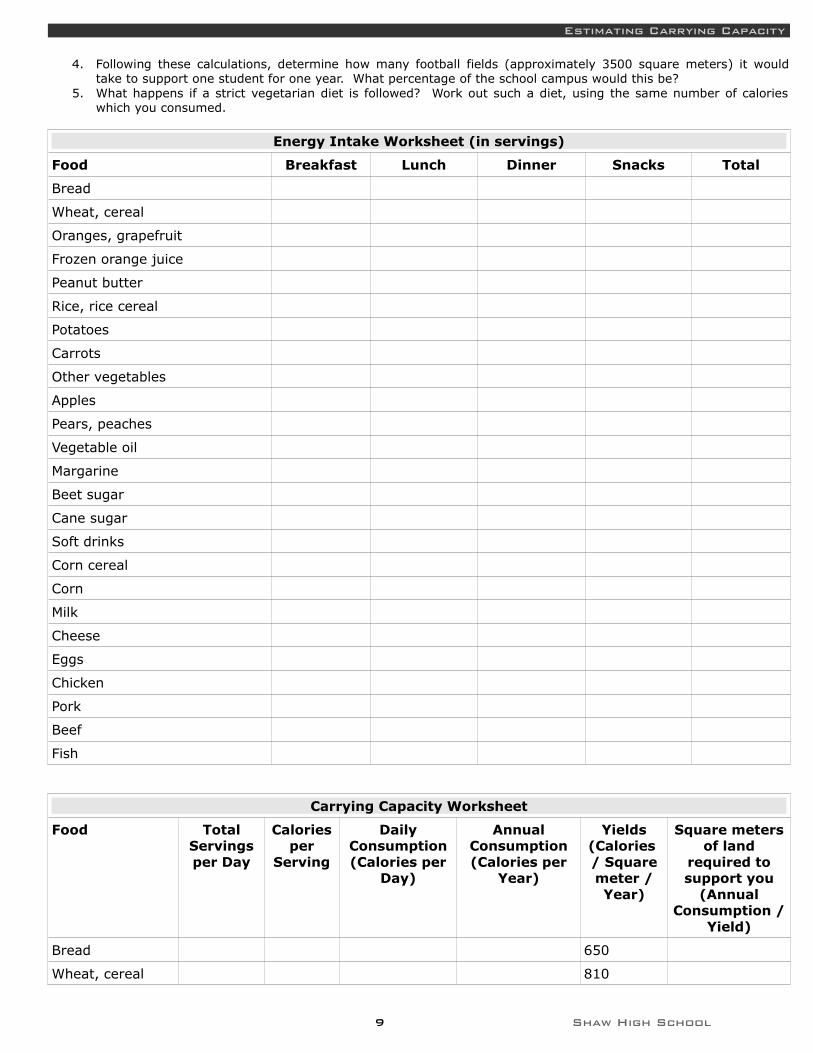
4. Following these calculations, determine how many football fields (approximately 3500 square meters) it would take to support one student for one year. What percentage of the school campus would this be?
5. What happens if a strict vegetarian diet is followed? Work out such a diet, using the same number of calories which you consumed.
Energy Intake Worksheet (in servings)
Food Breakfast Lunch Dinner Snacks Total
Bread
Wheat, cereal
Oranges, grapefruit
Frozen orange juice
Peanut butter
Rice, rice cereal
Potatoes
Carrots
Other vegetables
Apples
Pears, peaches
Vegetable oil
Margarine
Beet sugar
Cane sugar
Soft drinks
Corn cereal
Corn
Milk
Cheese
Eggs
Chicken
Pork
Beef
Fish
Carrying Capacity Worksheet
Food Total Servings per Day
Calories per
Serving
Daily Consumption (Calories per
Day)
Annual Consumption (Calories per
Year)
Yields (Calories / Square meter / Year)
Square meters of land
required to support you
(Annual Consumption /
Yield)
Bread 650
Wheat, cereal 810
9 Shaw High School

Activities
Oranges, grapefruit
1000
Frozen orange juice
410
Peanut butter 920
Rice, rice cereal 1250
Potatoes 1600
Carrots 810
Other vegetables 200
Apples 1500
Pears, peaches 900
Vegetable oil 300
Margarine 300
Beet sugar 1990
Cane sugar 3500
Soft drinks 3500
Corn cereal 1600
Corn 250
Milk 420
Cheese 40
Eggs 200
Chicken 190
Pork 190
Beef 130
Fish 2
Totals
Useful information1 km2 = 1,000,000 m21 ha = 10,000 m2100 ha = 1 km21 km2 = 0.386 mi21 ha = 2.477 acres1 acre = 43,560 ft2
Total Land Area Arable Land as a Percentage of Land Area
Arable Land (ha) Permanent Cropland (ha)
Global 9,750,000,000 14 1,365,000,000 131,223,000
U.S. 918,147,000 19 174,448,000 2,050,000
The LoraxThe LoraxFrom Environmental Science: A Global Concern
Watch “The Lorax” by Dr. Seuss, then answer the following questions: 1. What is the Lorax? What is his role in the book?
2010 - 2011 10

The Lorax
2. Teddy Roosevelt and Gifford Pinchot had policies, called utilitarian conservation, that stated that forests should be saved “not because they are beautiful or because they shelter wild creatures of the wilderness, but only to provide homes and jobs for people.” With this in mind, compare and contrast the Once-ler's way of business to Roosevelt and Pinchot's idea of forestry.
3. John Muir (MYEE-oor), a geologist, author, and first president of the Sierra Club, opposed Pinchot's ideas. His outlook, biocentric preservation, emphasizes the fundamental right of other organisms to exist and to pursue their own interests. Which character in the Lorax has similar views to Muir and why are these views so controversial today?
4. Rachel Carson, considered by many to be the “mother of environmentalism,” added a new set of concerns to the environmental agenda. She awakened the public to the threats of pollution and toxic chemicals. Discuss the different toxins that were produced in the production of the thneed.
5. Though the Once-ler polluted the area where he lived, environmentalists have now concluded that the new concern for our planet should be one of global environmentalism, because we are all interconnected and events that occur on the other side of the globe have profound and immediate effects on our lives. List three things that could have global effects in the production of the thneed.
6. Many environmental problems are interconnected and can have compounding effects. After watching “The Lorax,” look at the list below and discuss the implications of how any two or more of the items can cause a worsened environmental effect:
a) Energy consumption b) Human population explosion c) Loss of biodiversity d) Soil erosion e) Food shortages f) Waste disposal g) Deforestation h) Water pollution i) Global warming j) Political unrest
7. How would the thneed factory be different in a developing country versus a developed one? Discuss issues such as raw material use, waste disposal, energy consumption, and worker rights.
8. In the last part of the Lorax, the Lorax, uses the word “unless.” What does that mean and how can you, as an average citizen, make a difference in the environment?
9. Many economists argue that the solution to the Lorax's dilemma is found in properly defining property rights. What does this mean and how would this solve the problem?
Tagging animals in an environmentTagging animals in an environmentMaterials
• One bag each of two types of small objects that can be used as “fish.”• One goldfish bowl or similar holder. • A large scoop (such as one used for ice cream or flour). • Markers, paper, pencils, calculators (optional).
Procedures
To begin, how they might you figure out how many fish of a particular kind (i.e. windowpane flounder) live in a given area? You will participate in a fish tagging and recapture activity that simulates one method used by marine biologist and environmental managers to estimate fish populations.
To start activity, pour one bag of crackers or bingo chips/beans/etc. into the fishbowl. Guess how many crackers are in the bowl. Record all guesses. Discuss estimation strategies. Next, take out a scoop of crackers. Count them. This will be your total tagged sample.
“Tag” them by replacing them with the second variety of cracker or by marking them in some way, such as a dot from a magic marker. Then, throw the “tagged” fish back into the bowl. Mix them up. Take out another scoop. Count them. How many are “tagged?”
Set up a table like the one below (the numbers here are examples; yours will vary):
Trial 1 2 3 4 5
Tagged items found 2
Number of items pulled out 18
Total tagged items (remains constant) 24 24 24 24 24
Esimated total number of items (to be calculated)
11 Shaw High School
Activities
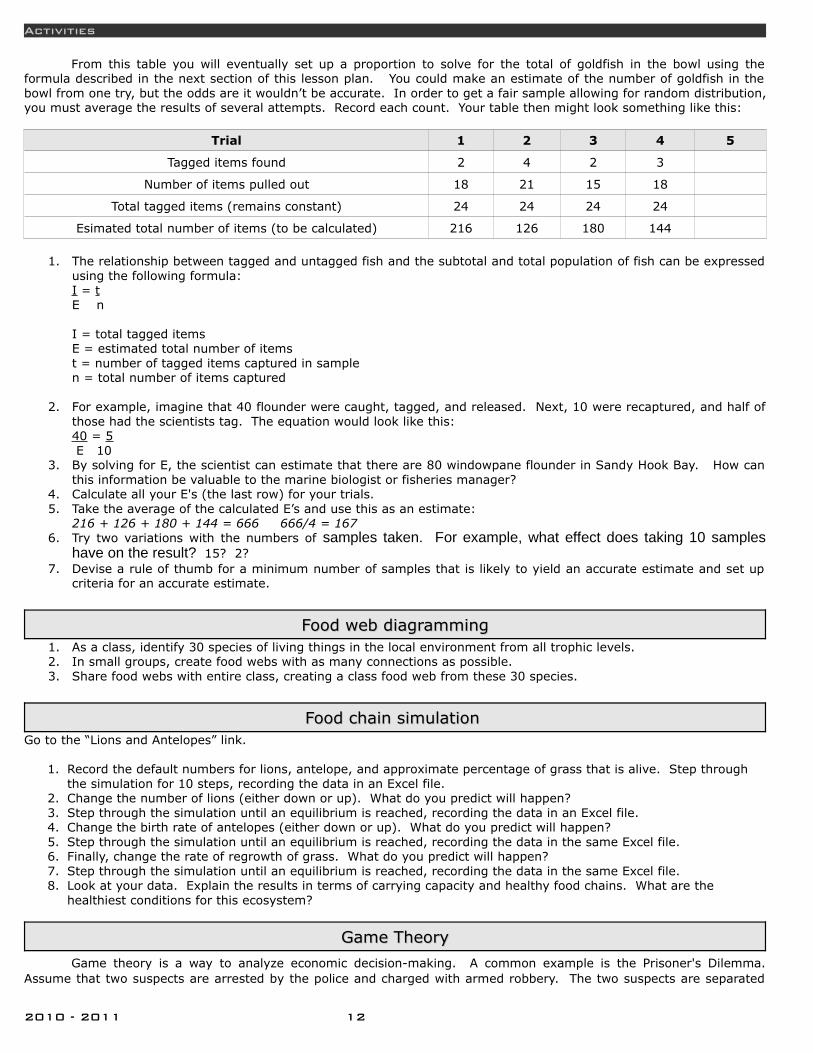
From this table you will eventually set up a proportion to solve for the total of goldfish in the bowl using the formula described in the next section of this lesson plan. You could make an estimate of the number of goldfish in the bowl from one try, but the odds are it wouldn’t be accurate. In order to get a fair sample allowing for random distribution, you must average the results of several attempts. Record each count. Your table then might look something like this:
Trial 1 2 3 4 5
Tagged items found 2 4 2 3
Number of items pulled out 18 21 15 18
Total tagged items (remains constant) 24 24 24 24
Esimated total number of items (to be calculated) 216 126 180 144
1. The relationship between tagged and untagged fish and the subtotal and total population of fish can be expressed using the following formula: I = t E n
I = total tagged items E = estimated total number of itemst = number of tagged items captured in sample n = total number of items captured
2. For example, imagine that 40 flounder were caught, tagged, and released. Next, 10 were recaptured, and half of those had the scientists tag. The equation would look like this: 40 = 5 E 10
3. By solving for E, the scientist can estimate that there are 80 windowpane flounder in Sandy Hook Bay. How can this information be valuable to the marine biologist or fisheries manager?
4. Calculate all your E's (the last row) for your trials.5. Take the average of the calculated E’s and use this as an estimate:
216 + 126 + 180 + 144 = 666 666/4 = 167 6. Try two variations with the numbers of samples taken. For example, what effect does taking 10 samples
have on the result? 15? 2? 7. Devise a rule of thumb for a minimum number of samples that is likely to yield an accurate estimate and set up
criteria for an accurate estimate.
Food web diagrammingFood web diagramming1. As a class, identify 30 species of living things in the local environment from all trophic levels.2. In small groups, create food webs with as many connections as possible.3. Share food webs with entire class, creating a class food web from these 30 species.
Food chain simulation Food chain simulation Go to the “Lions and Antelopes” link.
1. Record the default numbers for lions, antelope, and approximate percentage of grass that is alive. Step through the simulation for 10 steps, recording the data in an Excel file.
2. Change the number of lions (either down or up). What do you predict will happen? 3. Step through the simulation until an equilibrium is reached, recording the data in an Excel file. 4. Change the birth rate of antelopes (either down or up). What do you predict will happen? 5. Step through the simulation until an equilibrium is reached, recording the data in the same Excel file. 6. Finally, change the rate of regrowth of grass. What do you predict will happen? 7. Step through the simulation until an equilibrium is reached, recording the data in the same Excel file. 8. Look at your data. Explain the results in terms of carrying capacity and healthy food chains. What are the
healthiest conditions for this ecosystem?
Game TheoryGame Theory
Game theory is a way to analyze economic decision-making. A common example is the Prisoner's Dilemma. Assume that two suspects are arrested by the police and charged with armed robbery. The two suspects are separated
2010 - 2011 12
Game Theory
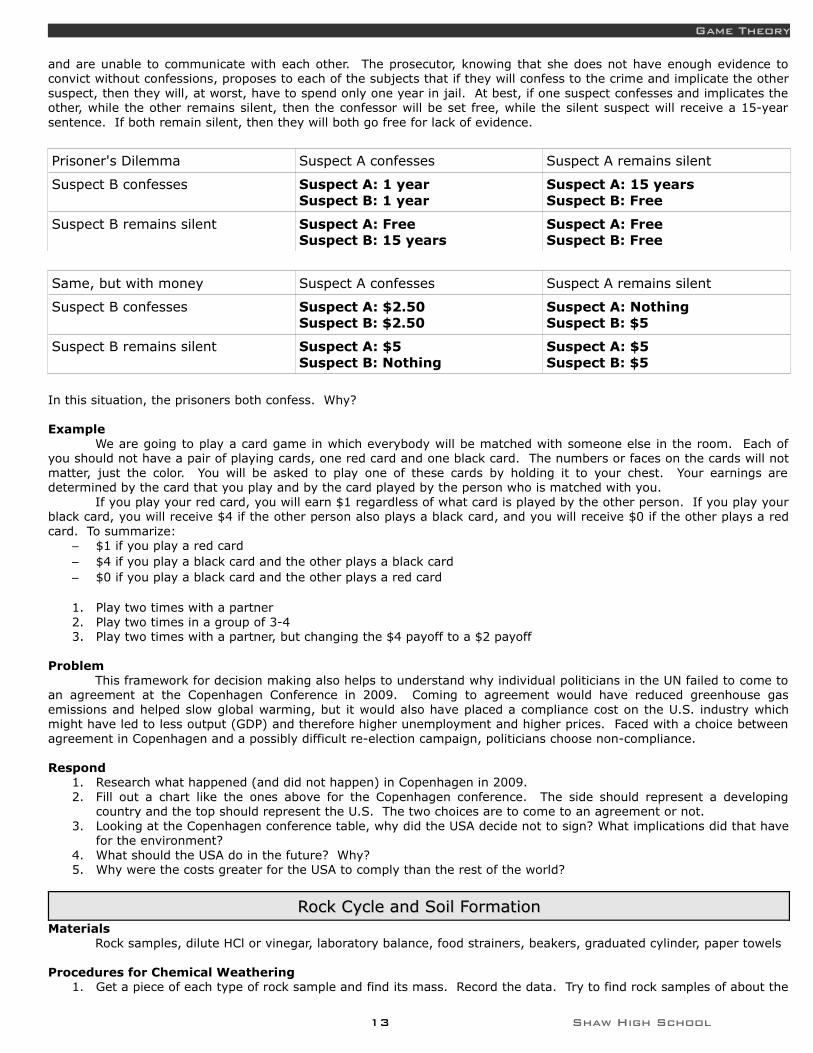
and are unable to communicate with each other. The prosecutor, knowing that she does not have enough evidence to convict without confessions, proposes to each of the subjects that if they will confess to the crime and implicate the other suspect, then they will, at worst, have to spend only one year in jail. At best, if one suspect confesses and implicates the other, while the other remains silent, then the confessor will be set free, while the silent suspect will receive a 15-year sentence. If both remain silent, then they will both go free for lack of evidence.
Prisoner's Dilemma Suspect A confesses Suspect A remains silent
Suspect B confesses Suspect A: 1 yearSuspect B: 1 year
Suspect A: 15 yearsSuspect B: Free
Suspect B remains silent Suspect A: FreeSuspect B: 15 years
Suspect A: FreeSuspect B: Free
Same, but with money Suspect A confesses Suspect A remains silent
Suspect B confesses Suspect A: $2.50Suspect B: $2.50
Suspect A: NothingSuspect B: $5
Suspect B remains silent Suspect A: $5Suspect B: Nothing
Suspect A: $5Suspect B: $5
In this situation, the prisoners both confess. Why?
ExampleWe are going to play a card game in which everybody will be matched with someone else in the room. Each of
you should not have a pair of playing cards, one red card and one black card. The numbers or faces on the cards will not matter, just the color. You will be asked to play one of these cards by holding it to your chest. Your earnings are determined by the card that you play and by the card played by the person who is matched with you.
If you play your red card, you will earn $1 regardless of what card is played by the other person. If you play your black card, you will receive $4 if the other person also plays a black card, and you will receive $0 if the other plays a red card. To summarize:
– $1 if you play a red card– $4 if you play a black card and the other plays a black card– $0 if you play a black card and the other plays a red card
1. Play two times with a partner2. Play two times in a group of 3-43. Play two times with a partner, but changing the $4 payoff to a $2 payoff
ProblemThis framework for decision making also helps to understand why individual politicians in the UN failed to come to
an agreement at the Copenhagen Conference in 2009. Coming to agreement would have reduced greenhouse gas emissions and helped slow global warming, but it would also have placed a compliance cost on the U.S. industry which might have led to less output (GDP) and therefore higher unemployment and higher prices. Faced with a choice between agreement in Copenhagen and a possibly difficult re-election campaign, politicians choose non-compliance.
Respond1. Research what happened (and did not happen) in Copenhagen in 2009.2. Fill out a chart like the ones above for the Copenhagen conference. The side should represent a developing
country and the top should represent the U.S. The two choices are to come to an agreement or not.3. Looking at the Copenhagen conference table, why did the USA decide not to sign? What implications did that have
for the environment?4. What should the USA do in the future? Why?5. Why were the costs greater for the USA to comply than the rest of the world?
Rock Cycle and Soil FormationRock Cycle and Soil FormationMaterials
Rock samples, dilute HCl or vinegar, laboratory balance, food strainers, beakers, graduated cylinder, paper towels
Procedures for Chemical Weathering1. Get a piece of each type of rock sample and find its mass. Record the data. Try to find rock samples of about the
13 Shaw High School
Activities
same size.2. Carefully pour about 100mL of dilute HCl (or vinegar) into 6 beakers.3. Place each rock into a beaker. Observe what happens and record your observations.4. Allow the samples to remain in the beaker for 5 minutes. Then pour the contents of the beaker through a strainer.
Rinse each rock sample with water.5. Dry each rock sample with a paper towel and allow the sample to air dry for several minutes.6. Find the mass of each sample of rock. Record the data. Calculate the percentage of rock that dissolved in each
beaker.
Procedures for the Surface Area on Chemical Weathering7. Repeat the activity, but limit your investigation to one type of rock sample.8. Get two pieces of rock. Mass both pieces and pour 100mL of dilute HCl (or vinegar) into two beakers.9. Break one of the samples into several smaller pieces.10. Repeat steps 3 through 6 of the above procedures.
11. Which rock sample reacted the most quickly with the acid?12. How did surface area affect the rate of chemical weathering?13. Which would weather more rapidly: a 100 kg limestone statue or ten 10 kg limestone statues?14. How does this relate to problems faced by many cities around the world?
Salinity ChallengeSalinity ChallengeTurkey’s GAP project is building a large number of big dams on the Euphrates and Tigris rivers. Its purpose is to
collect and store huge quantities of water and to use it to irrigate vast stretches of land in eastern Turkey. The project’s supporters want to turn an area that has been historically barren into “the bread basket of Turkey.”
Critics of the project say that GAP is disrupting the natural water cycle. They argue that irrigation causes a build-up of salt in water and soil which is harmful to plants. Although there might be short-term benefits to the project, they argue, in the end the irrigation will make the soil salty and will leave the region as barren as ever.
The GAP supporters say there is no connection between irrigation and salty soil. They point out that Turkey has more irrigated land than Syria or Iraq, but it has virtually no problems with severe salinity (salt build up). They agree that Syria and Iraq have problems with salty soil, but they say that’s it. Syria and Iraq have salty soil, Turkey doesn’t.
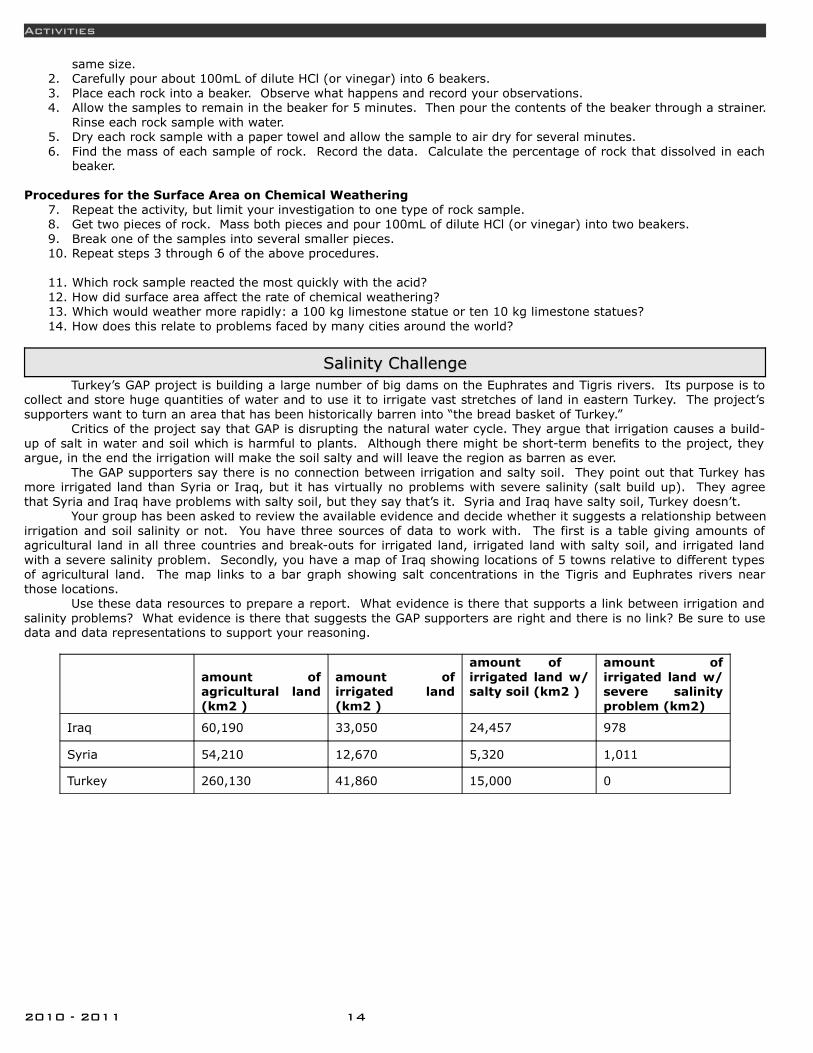
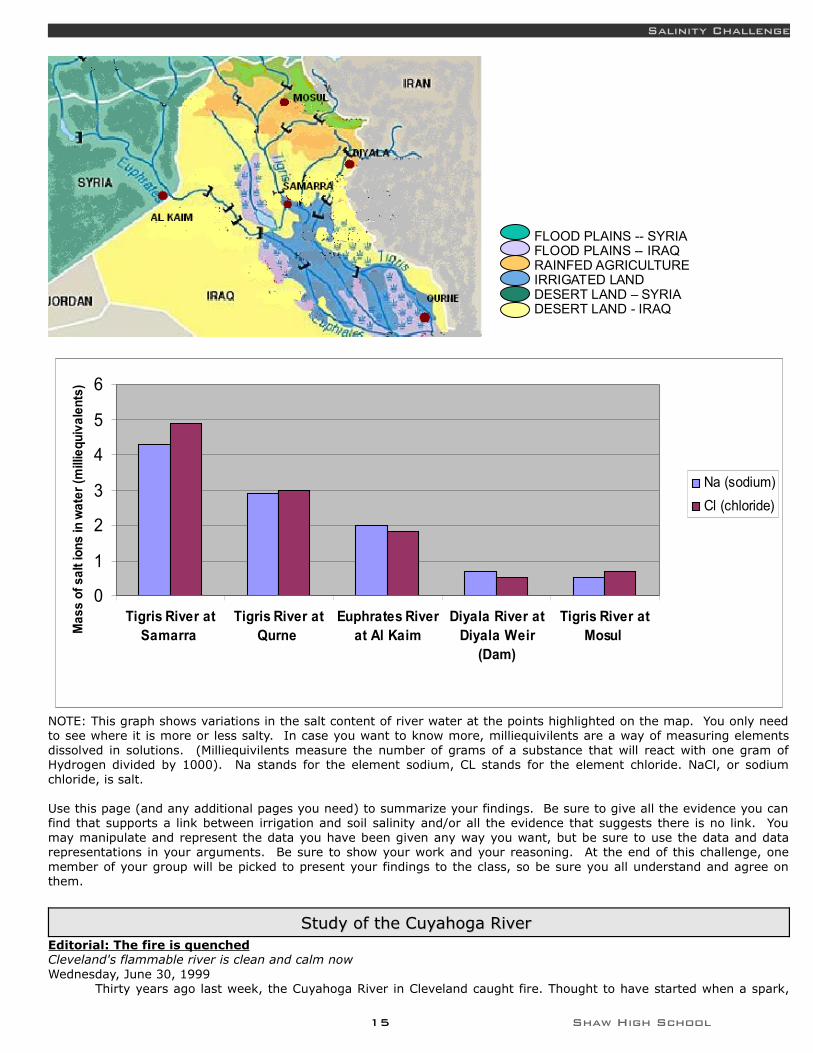
Your group has been asked to review the available evidence and decide whether it suggests a relationship between irrigation and soil salinity or not. You have three sources of data to work with. The first is a table giving amounts of agricultural land in all three countries and break-outs for irrigated land, irrigated land with salty soil, and irrigated land with a severe salinity problem. Secondly, you have a map of Iraq showing locations of 5 towns relative to different types of agricultural land. The map links to a bar graph showing salt concentrations in the Tigris and Euphrates rivers near those locations.
Use these data resources to prepare a report. What evidence is there that supports a link between irrigation and salinity problems? What evidence is there that suggests the GAP supporters are right and there is no link? Be sure to use data and data representations to support your reasoning.
amount of agricultural land (km2 )
amount of irrigated land (km2 )
amount of irrigated land w/salty soil (km2 )
amount of irrigated land w/ severe salinity problem (km2)
Iraq 60,190 33,050 24,457 978
Syria 54,210 12,670 5,320 1,011
Turkey 260,130 41,860 15,000 0
2010 - 2011 14
Salinity Challenge
NOTE: This graph shows variations in the salt content of river water at the points highlighted on the map. You only need to see where it is more or less salty. In case you want to know more, milliequivilents are a way of measuring elements dissolved in solutions. (Milliequivilents measure the number of grams of a substance that will react with one gram of Hydrogen divided by 1000). Na stands for the element sodium, CL stands for the element chloride. NaCl, or sodium chloride, is salt.
Use this page (and any additional pages you need) to summarize your findings. Be sure to give all the evidence you can find that supports a link between irrigation and soil salinity and/or all the evidence that suggests there is no link. You may manipulate and represent the data you have been given any way you want, but be sure to use the data and data representations in your arguments. Be sure to show your work and your reasoning. At the end of this challenge, one member of your group will be picked to present your findings to the class, so be sure you all understand and agree on them.
Study of the Cuyahoga River Study of the Cuyahoga River Editorial: The fire is quenchedCleveland's flammable river is clean and calm nowWednesday, June 30, 1999
Thirty years ago last week, the Cuyahoga River in Cleveland caught fire. Thought to have started when a spark,
15 Shaw High School
0
1
2
3
4
5
6
Tigris River atSamarra
Tigris River atQurne
Euphrates Riverat Al Kaim
Diyala River atDiyala Weir
(Dam)
Tigris River atMosul M
ass
of s
alt i
ons
in w
ater
(mill
iequ
ival
ents
)
Na (sodium)
Cl (chloride)
FLOOD PLAINS -- SYRIAFLOOD PLAINS -- IRAQRAINFED AGRICULTUREIRRIGATED LANDDESERT LAND – SYRIADESERT LAND - IRAQ
Activities
possibly from a train, ignited oil and debris on the surface, the blaze took 20 minutes to be controlled. But the aftermath lasted for decades.
The burning river became a symbol of industrial pollution and of the decay of Rust Belt cities. It was an embarrassment for Cleveland and Ohio. The river today is very different. Thanks in part to the federal Clean Water Act, waste water treatment and industrial decline that has seen a reduction in discharges, the Cuyahoga is cleaner. And not likely to burn any time soon.
The clean-up of the Cuyahoga reflects a growing recognition by Americans cities that industrial expansion cannot run roughshod over the natural environment and that the quality of our natural surroundings means as much as - and actually can contribute to - robust employment.
Cities try to balance environmental responsibility with economic development as they attempt to meet these dual obligations, but, as Pittsburghers well know, it is often an expensive proposition.
The Cuyahoga, the river that burned, exemplified everything that was wrong 30 years ago, when pollution and environmental degradation were unchecked. Its return to a condition described as clean, but not pristine, is a reflection of progress made - and of progress yet to be made.
Cuyahoga RiverGet to know the Cuyahoga! The entire 100-mile-long stretch of the V-shaped Cuyahoga River has been designated
under the American Heritage River Initiative. This "Crooked River" has a watershed that drains 813 square miles of Geauga, Portage, Summit, and Cuyahoga Counties, which is less than three percent of the land area in Ohio, but supports nearly fifteen percent of its population.
While traveling from the Cuyahoga River's headwaters in Geauga County to its mouth in Cleveland, a wide variety of landscapes and a multitude of land uses can be observed. Lands in the upper reaches are primarily forests, wetlands, pasture, and crop land. Several large reservoirs dot this area, serving as the drinking water source for the city of Akron and surrounding communities, and providing a myriad of recreational opportunities. A large stretch of the Cuyahoga's upper portion has State of Ohio Scenic River designation.
The Cuyahoga's lower river basin is one of the most densely populated and industrialized urban areas in North America. In 1999, the 30th anniversary of the famous "burning river" in the lower portion was observed. Also celebrated was how substantial clean-up efforts have progressed since the passage of the Clean Water Act (less than a year after the incident). A cleaner lower Cuyahoga has opened opportunities for riverbank parks and trails, protected natural areas, and entertainment districts.
A large tract of relatively undeveloped and scenic open space, the Cuyahoga Valley National Recreation Area is situated in the middle Cuyahoga, between Akron and Cleveland. Portions of the Cuyahoga River basin in the lower and middle reaches were included in two 1996 designations: the Ohio and Erie Canal Corridor was the nation's Seventh National Heritage Corridor and Ohio's first Scenic Byway.
Action PlanThe Cuyahoga River American Heritage Rivers Action Plan is currently a work-in-progress, but will focus on
integrating the river back into the everyday life of the communities through which it flows. Because of the unique natural, economic, and cultural characteristics of each of the upper, middle, and lower portions of the river, action items will likely be diverse in nature among the three areas. Much is happening independently in these areas already and the American Heritage Rivers designation has spawned a synergy among the partners to take action more holistically, ultimately benefiting the river and its adjacent communities.
Cuyahoga River AHR PartnersCurrent Cuyahoga AHR Partners include the Cuyahoga River Remedial Action Plan (RAP) Coordinating Committee
(CRCPO); The Ohio And Erie Canal National Heritage Corridor; the Upper Cuyahoga River Watershed Taskforce; and the two regional planning agencies: the Northeast Ohio Area-Wide Coordinating Agency and the North East Four County Planning and Development Organization.
Questions About the Cuyahoga1. How can water burn?2. How can some of the suggestions provided in the "Bon Voyage to Bad Boating Habits" article prevent incidents like
the Cuyahoga River burning?3. What happened when people found out about the burning river? Why did people react that way?4. How was this event important in starting the movement to control water pollution?5. What national law now protects waterways from this kind of disaster?
One in a MillionUsing Measurements in Real Life
Federal drinking water standards are real life examples of where parts per million measurements are used. You can find standards for some drinking water contaminants within EPA's Safe Drinking Water Web page.
Substances in water are often measured in parts per million (ppm), parts per billion (ppb), or even parts per trillion (ppt). This activity is adapted from Science Demonstration Projects in Drinking Water (U.S. EPA Water Resource Center, Washington, DC, "One in a Million" by Steve Vandas).
2010 - 2011 16
Study of the Cuyahoga River
Agencies like the U.S. Environmental Protection Agency determine what concentration of a contaminant in water could be considered dangerous. If a substance is highly toxic, it could be dangerous even if it is present only in parts per trillion; if the substance is less toxic, it could be dangerous if present in parts per million.
Materials• 1 eye dropper for each group• 6 small, clear plastic cups (the smaller the better) for each group• One 472 mL clear plastic cup filled ¾ full of water for each group• 1 bottle of food coloring for the teacher/presenter
Pre-Experiment Discussion• What is the largest number of things you can clearly visualize in your mind?• Can you visualize a group of 1,000 people? Are you able to differentiate between 800 or 1,200 people and 1,000?
Procedure
1. Food coloring is usually a 10 percent solution. Draw this on your calculations page. 2. Using the eye dropper, have one member from each group add nine drops of water to the small cup containing the
food coloring. Stir well. Draw this on your calculations page and figure out the concentration of the food coloring. Label the concentration of food coloring on the cup.
3. Use the eye dropper to transfer one drop of the 1-part-in-100 solution to a third small plastic cup. Add nine drops of water to this solution. Stir well. The concentration has again been changed by a factor of 10. Draw this concentration on your calculations page, figure out the concentration of food coloring, and label the concentration on the cup.
4. Transfer one drop to the 1-part-in-1,000 solution to the next small plastic cup. Add nine drops of water. Stir well. The new concentration is part in 10,000 parts of solution.
5. Continue to dilute one drop of each new solution with nine drops of water until you create a solution with a concentration of one part per million. Be sure to label the concentration of food coloring present in each cup.
MTBE MotivesThe Internet is a useful tool for gathering information. It is always important however to check the source.
Information is often written up and presented by companies, the government, or other organizations to convey particular messages. The same information might be presented in different ways depending on who is presenting it.
The excerpt below is from a Web site maintained by a New York State law firm. Compare the information presented in this article with that in two other methyl tertiary-butyl ether (MTBE) information sources that you find online. The MTBE Information chart below will help you compare information from different sources.
Methyl Tertiary Butyl Ether (MTBE)What Is MTBE?
MTBE (methyl tertiary butyl ether) is a synthetic chemical that is added to gasoline to improve air quality as part of the Clean Air Act (CAA). MTBE is usually added to Reformulated Gasoline (RFG), oxygenated fuel and premium grades of unleaded gasoline. MTBE improves air quality because it contains oxygen in each molecule. It is considered to be an oxygenate. When oxygenates are added to gasoline, they reduce the amount of carbon monoxide, which is the poisonous gas that cars produce.
The Environmental Protection Agency's (EPA) RFG program requires oxygenates to be used in gasoline in areas where there is severe ozone pollution. In approximately 84 percent of the RFG, MTBE is the oxygenate being used. Oxyfuel, which usually contains ethanol as the oxygenate, is supposed to be used in areas with severe carbon monoxide pollution. However, in some areas, MTBE is used as the oxygenate in oxyfuel.
The problem with MTBE is that it's contaminating the soil, air and drinking water, and may be causing health issues for people that are exposed to it. Since there is such a large amount of gasoline (much of it containing MTBE) being produced and distributed everyday, there are many ways for MTBE to be released into the soil, air and water. It can leak from underground storage tanks (USTs); accidental fuel spills; automobile and tanker accidents; motorized recreation on lakes and drinking water reservoirs; spills and drips when refueling automobiles, lawnmowers, tractors and other machines; and leaks from pipelines and aboveground storage tanks.
Studies are being conducted to find out how MTBE affects people who have been exposed to it. It has been found that when a person drinks water that has been contaminated by MTBE, which smells and tastes like turpentine, the person's liver will convert it into formaldehyde and tertiary butyl alcohol (TBA), which a person's body has a hard time eliminating from the body. When MTBE gets into the air it is converted into tertiary butyl formate (TBF), which causes problems in a person's respiratory system.
Many of the symptoms that people are experiencing due to MTBE exposure include a long-lasting cough, sinus problems, headaches, nervousness, dizziness, nausea, insomnia, watering eyes, irritated eyes and skin rash. If you're experiencing any of these symptoms, it doesn't necessarily mean that they're due to MTBE exposure. These symptoms are very similar to other diseases and illnesses, so you may want to consult a physician.
Extensive research is being done to figure out how to get MTBE out of the soil, air and drinking water. Some head way has been made in cleaning up the soil, but the major problem is getting it out of the drinking water. MTBE is very
17 Shaw High School

Activities
mobile, less degradable and more soluble in water than other gasoline toxins, which makes it nearly impossible to remove it. The only real solution to the MTBE problem seems to be to take it out of the gasoline. Some states such as California, Colorado, Connecticut, Maine, Michigan, Minnesota, New York and South Dakota don't use MTBE in the gasoline anymore. Many other states are moving towards banning MTBE as well. The EPA has placed MTBE on its list of contaminants, but the Agency is still studying the possible health affects associated with MTBE.
Information Source #1 Information Source #2 Information Source #3
What are the sources of MTBE?
What are the benefits of MTBE?
How much gasoline in the United States contains MTBE?
What are alternatives to MTBE?
What are the disadvantages of using MTBE?
How does MTBE affect humans?
What is unknown about MTBE?
What does the author recommend as a solution?
Is this article objective or subjective? Give reasons why. (Answer for all three sources you used.)
Contaminants in the water cycle Contaminants in the water cycle 1. In groups, describe the water cycle, including the processes of evaporation, condensation, and precipitation. 2. Go to the “EPA: Drinking Water Contaminants” link about drinking water standards. Define the contaminants:
a) microorganisms b) disinfectants (used to treat drinking water) c) disinfection byproducts d) inorganic chemicals e) organic chemicals f) radionuclides (radioactive materials)
3. Answer these questions as you look at the lists: a) If enteric viruses are found in drinking water, what are their likely source and what health effects might they
have? How do you think these viruses could get into the water supply? b) What chemicals are used to disinfect the water supply? What positive and negative effects can these chemicals
have? c) Is inorganic chemical pollution primarily the result of natural or human-made factors? Name two inorganic
chemicals and their potential impacts on human health. d) What role can agriculture play in water contamination? What are the primary causes of agricultural
contamination? e) What level of dioxin does the EPA currently allow in drinking water (MCL)? What is the goal for dioxin levels in
drinking water (MCLG)? 4. Sketch hypothetical towns that lie near bodies of water such as rivers, lakes, or the ocean. Diagrams should show
the following things: a) the water cycle; b) the names of at least four pollutants next to the places they come from (for example, a town might have a pulp
mill that leaks chromium into a river, which subsequently contaminates the ocean—students would draw the pulp mill and write "chromium" next to it);
c) the potential human impacts of these contaminants (students can list these impacts next to the names of the pollutants or at the bottom of their drawings)
2010 - 2011 18
Contaminants in the water cycle
Students should be creative with their drawings, but they must include at least four pollution sources and show the full water cycle.
5. Look at each other's drawings and describe them to each other. 6. Imagine that some residents of their hypothetical town have formed a group that aims to improve the area's water
quality. Write, suggesting where this group should focus its energies. Which pollution source should it tackle first? What should it attempt to do about this pollution problem? Be thoughtful and creative in your answers; you should consider the political as well as the scientific aspects of this question.
Experimental eutrophication Experimental eutrophication Links to Overview Essays and Resources Needed for Student Research: “NOAA: Ecological Forecasting”, “NOAA: Gulf of Mexico Factsheet”, “NOAA: Stressors”
What causes hypoxic (low oxygen) conditions that produce the “Dead Zone” in the Gulf of Mexico? Background Information
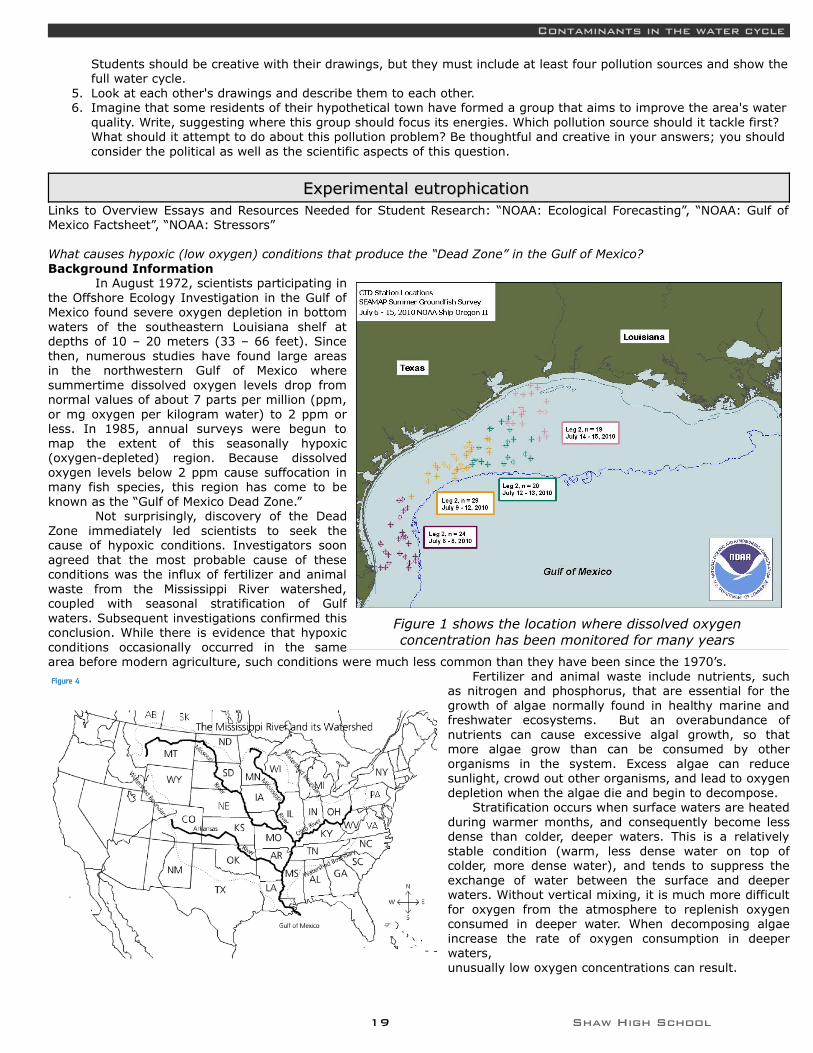
In August 1972, scientists participating in the Offshore Ecology Investigation in the Gulf of Mexico found severe oxygen depletion in bottom waters of the southeastern Louisiana shelf at depths of 10 – 20 meters (33 – 66 feet). Since then, numerous studies have found large areas in the northwestern Gulf of Mexico where summertime dissolved oxygen levels drop from normal values of about 7 parts per million (ppm, or mg oxygen per kilogram water) to 2 ppm or less. In 1985, annual surveys were begun to map the extent of this seasonally hypoxic (oxygen-depleted) region. Because dissolved oxygen levels below 2 ppm cause suffocation in many fish species, this region has come to be known as the “Gulf of Mexico Dead Zone.”
Not surprisingly, discovery of the Dead Zone immediately led scientists to seek the cause of hypoxic conditions. Investigators soon agreed that the most probable cause of these conditions was the influx of fertilizer and animal waste from the Mississippi River watershed, coupled with seasonal stratification of Gulf waters. Subsequent investigations confirmed this conclusion. While there is evidence that hypoxic conditions occasionally occurred in the same area before modern agriculture, such conditions were much less common than they have been since the 1970’s.
Fertilizer and animal waste include nutrients, such as nitrogen and phosphorus, that are essential for the growth of algae normally found in healthy marine and freshwater ecosystems. But an overabundance of nutrients can cause excessive algal growth, so that more algae grow than can be consumed by other organisms in the system. Excess algae can reduce sunlight, crowd out other organisms, and lead to oxygen depletion when the algae die and begin to decompose.
Stratification occurs when surface waters are heated during warmer months, and consequently become less dense than colder, deeper waters. This is a relatively stable condition (warm, less dense water on top of colder, more dense water), and tends to suppress the exchange of water between the surface and deeper waters. Without vertical mixing, it is much more difficult for oxygen from the atmosphere to replenish oxygen consumed in deeper water. When decomposing algae increase the rate of oxygen consumption in deeper waters, unusually low oxygen concentrations can result.
19 Shaw High School
Figure 1 shows the location where dissolved oxygen concentration has been monitored for many years
Activities
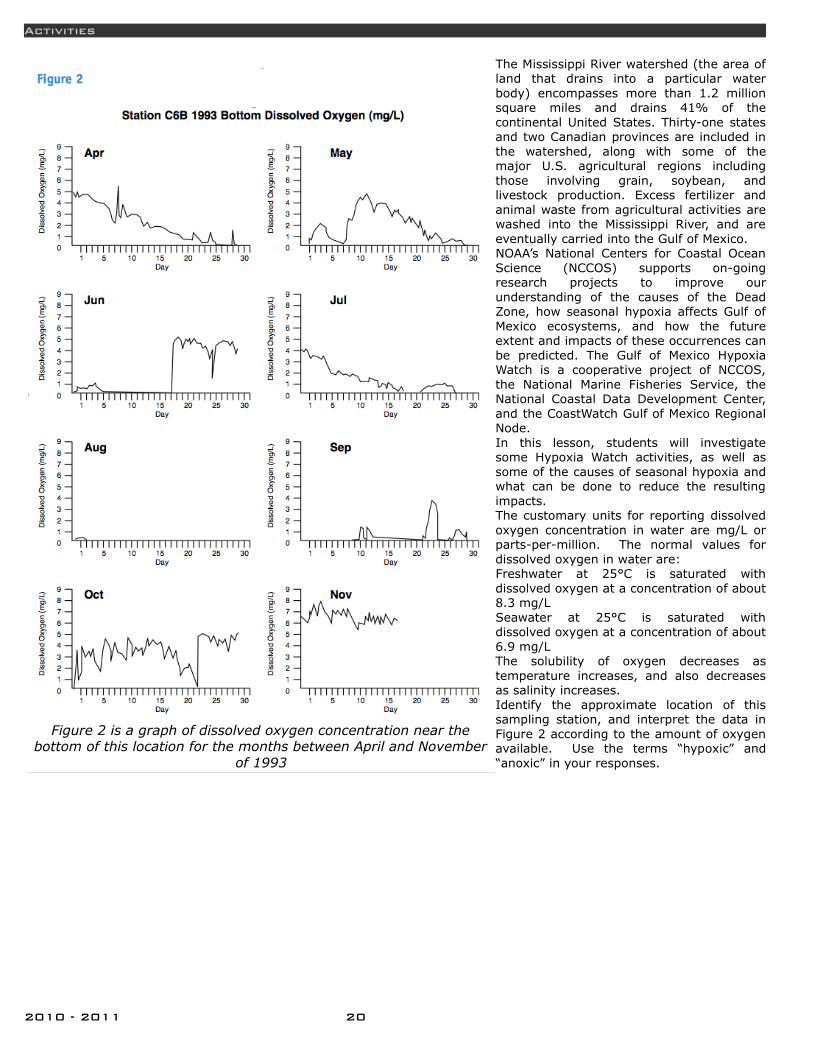
The Mississippi River watershed (the area of land that drains into a particular water body) encompasses more than 1.2 million square miles and drains 41% of the continental United States. Thirty-one states and two Canadian provinces are included in the watershed, along with some of the major U.S. agricultural regions including those involving grain, soybean, and livestock production. Excess fertilizer and animal waste from agricultural activities are washed into the Mississippi River, and are eventually carried into the Gulf of Mexico. NOAA’s National Centers for Coastal Ocean Science (NCCOS) supports on-going research projects to improve our understanding of the causes of the Dead Zone, how seasonal hypoxia affects Gulf of Mexico ecosystems, and how the future extent and impacts of these occurrences can be predicted. The Gulf of Mexico Hypoxia Watch is a cooperative project of NCCOS, the National Marine Fisheries Service, the National Coastal Data Development Center, and the CoastWatch Gulf of Mexico Regional Node. In this lesson, students will investigate some Hypoxia Watch activities, as well as some of the causes of seasonal hypoxia and what can be done to reduce the resulting impacts. The customary units for reporting dissolved oxygen concentration in water are mg/L or parts-per-million. The normal values for dissolved oxygen in water are:Freshwater at 25°C is saturated with dissolved oxygen at a concentration of about 8.3 mg/LSeawater at 25°C is saturated with dissolved oxygen at a concentration of about 6.9 mg/LThe solubility of oxygen decreases as temperature increases, and also decreases as salinity increases. Identify the approximate location of this sampling station, and interpret the data in Figure 2 according to the amount of oxygen available. Use the terms “hypoxic” and “anoxic” in your responses.
2010 - 2011 20
Figure 2 is a graph of dissolved oxygen concentration near the bottom of this location for the months between April and November
of 1993
Experimental eutrophication
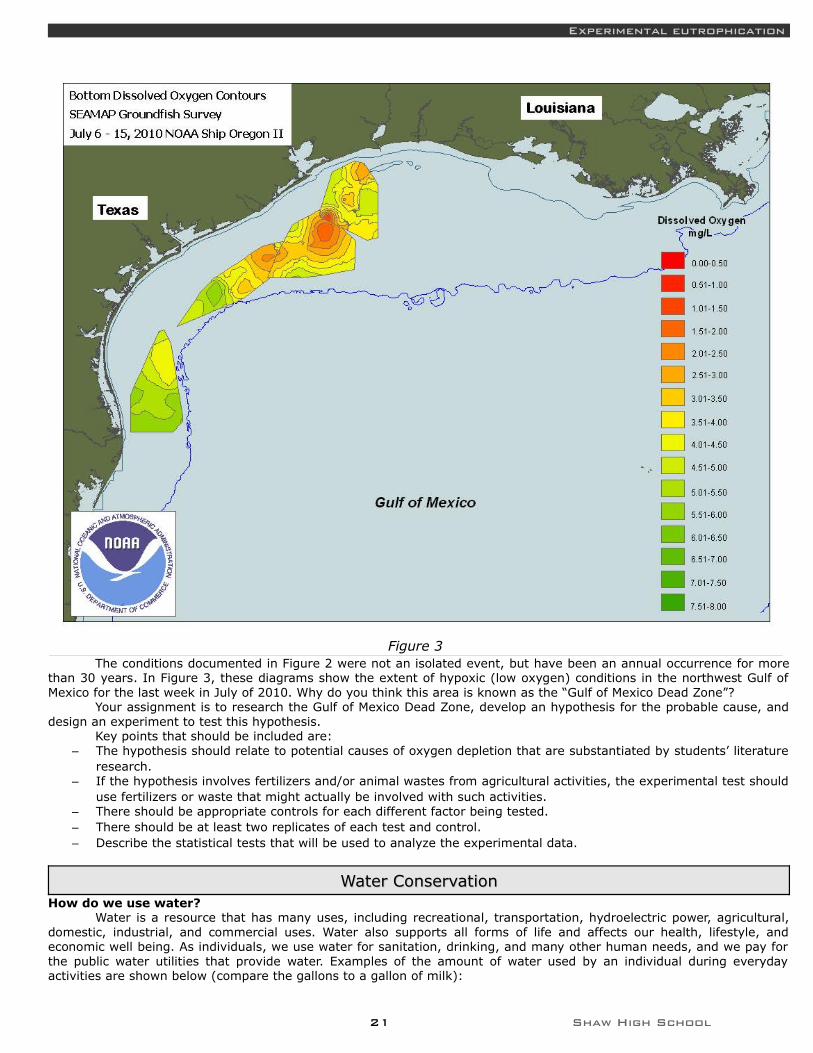
The conditions documented in Figure 2 were not an isolated event, but have been an annual occurrence for more than 30 years. In Figure 3, these diagrams show the extent of hypoxic (low oxygen) conditions in the northwest Gulf of Mexico for the last week in July of 2010. Why do you think this area is known as the “Gulf of Mexico Dead Zone”?
Your assignment is to research the Gulf of Mexico Dead Zone, develop an hypothesis for the probable cause, and design an experiment to test this hypothesis.
Key points that should be included are: – The hypothesis should relate to potential causes of oxygen depletion that are substantiated by students’ literature
research.– If the hypothesis involves fertilizers and/or animal wastes from agricultural activities, the experimental test should
use fertilizers or waste that might actually be involved with such activities. – There should be appropriate controls for each different factor being tested. – There should be at least two replicates of each test and control. – Describe the statistical tests that will be used to analyze the experimental data.
Water ConservationWater ConservationHow do we use water?
Water is a resource that has many uses, including recreational, transportation, hydroelectric power, agricultural, domestic, industrial, and commercial uses. Water also supports all forms of life and affects our health, lifestyle, and economic well being. As individuals, we use water for sanitation, drinking, and many other human needs, and we pay for the public water utilities that provide water. Examples of the amount of water used by an individual during everyday activities are shown below (compare the gallons to a gallon of milk):
21 Shaw High School
Figure 3

Activities
• To flush a toilet 5 to 7 gallons • To run a dishwasher 15 to 25 gallons • To wash dishes by hand 20 gallons • To water a small lawn 35 gallons • To take a shower 25 to 50 gallons • To take a bath 50 gallons • To wash a small load of clothes in a washing machine 35 gallons • To brush teeth (running water continuously) 2 to 5 gallons • The average American uses 140 to 160 gallons of water per day.
Although more than three quarters of the earth's surface is made up of water, only 2.8 percent of the Earth's water is available for human consumption. The other 97.2 percent is in the oceans; however, this water is too salty to use for most purposes, and the salt is very costly to remove. Most of the Earth's fresh water is frozen in polar ice caps, icebergs, and glaciers.
Why is water pollution prevention and conservation important?Although water flows from our faucets throughout the day, we often take the amount of fresh water available on
Earth for granted. As the world's population increases, water consumption increases. Preventing water pollution and conserving water are important to assure a continuing abundance of water that is safe to use for ourselves and future generations.
Water PollutionWater pollution is any human-caused contamination of water that reduces its usefulness to humans and other
organisms in nature. Pollutants such as herbicides, pesticides, fertilizers, and hazardous chemicals can make their way into our water supply. When our water supply is contaminated, it is a threat to human, animal, and plant health unless it goes through a costly purification procedure. Examples of pollution and its effects on water bodies such as Lake Michigan are listed below.
• Pollutants can come from a specific source such as a pipe that discharges used water or other material from a factory into a water body. Such discharges can harm the aquatic ecosystem.
• Pollutants can also come from large areas such as agricultural fields that have been covered with fertilizer or pesticides. Fertilizer and pesticide residues can run off or wash into streams and rivers or seep into soil, contaminating underlying groundwater.
• Pollutants can also come from parking lots, gardens, driveways, sidewalks, lawns, and roads. Rain water or melted snow can transfer materials such as oil, litter, fertilizers, and salt down storm sewer inlets found on the streets. In some areas, the storm sewer transports this polluted water to
• a water treatment facility. ln other areas, the storm sewer transports this polluted water to a nearby river, lake, stream, or wetland.
• Pollutants can contaminate our drinking water sources, reduce oxygen levels which can kill fish and other wildlife, accumulate in the tissue of fish we catch and eat from the lakes, and reduce the beauty of the water.
Water conservationAs the population increases, more water is used and wasted. In some areas of the country, especially in the
western states, water shortages can occur due to limited supply. However, even in Chicago, where there is an abundant supply of fresh water from Lake Michigan, shortages can occur during summer high-use periods when the amount of treated water available cannot meet the high demand for it.
How can pollution prevention help you?It is hard to imagine that one person can make a difference in protecting and conserving fresh water supplies on
this planet, but each individual can really help the environment. The following concepts can help you protect water from pollution, conserve water by reducing the amount of water you use, and save money: Changing What You Use
• Replace shower heads and faucet aerators with water efficient models. • Use a water-filled milk jug or plastic bottle in your toilet tank to displace water; this allows your toilet to operate
using less water. • Choose nonphosphate or low phosphate detergents. High phosphate levels in lakes and streams can kill fish and
other wildlife. • Use a broom instead of water to clean your driveway or garage . Do not sweep debris into the street or storm
sewer. • Put a spray nozzle on the end of your hose for car washing and plant watering to prevent the hose from
continually releasing water and to control the amount of water used. • Use native plants in your garden that require less water. • Use cat litter or sand instead of salt on icy walks. Salt pollutes water and kills plants.
2010 - 2011 22
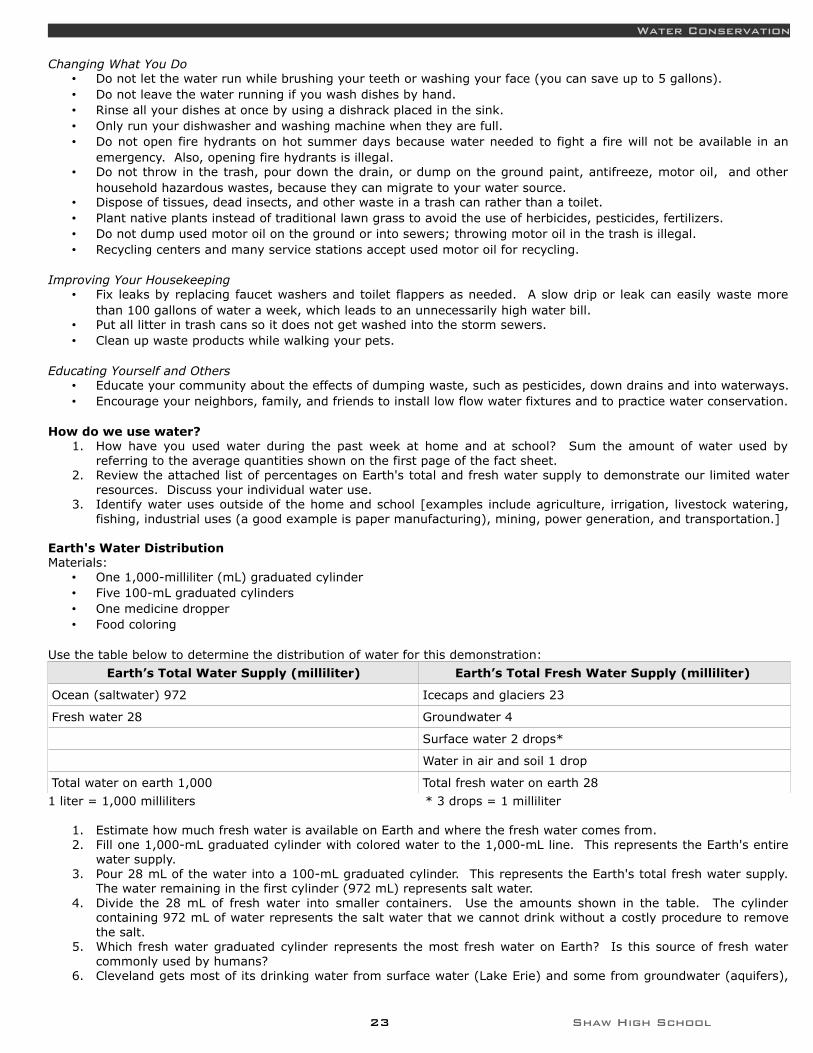
Water Conservation
Changing What You Do • Do not let the water run while brushing your teeth or washing your face (you can save up to 5 gallons). • Do not leave the water running if you wash dishes by hand. • Rinse all your dishes at once by using a dishrack placed in the sink. • Only run your dishwasher and washing machine when they are full.• Do not open fire hydrants on hot summer days because water needed to fight a fire will not be available in an
emergency. Also, opening fire hydrants is illegal. • Do not throw in the trash, pour down the drain, or dump on the ground paint, antifreeze, motor oil, and other
household hazardous wastes, because they can migrate to your water source. • Dispose of tissues, dead insects, and other waste in a trash can rather than a toilet. • Plant native plants instead of traditional lawn grass to avoid the use of herbicides, pesticides, fertilizers. • Do not dump used motor oil on the ground or into sewers; throwing motor oil in the trash is illegal. • Recycling centers and many service stations accept used motor oil for recycling.
Improving Your Housekeeping • Fix leaks by replacing faucet washers and toilet flappers as needed. A slow drip or leak can easily waste more
than 100 gallons of water a week, which leads to an unnecessarily high water bill. • Put all litter in trash cans so it does not get washed into the storm sewers. • Clean up waste products while walking your pets.
Educating Yourself and Others • Educate your community about the effects of dumping waste, such as pesticides, down drains and into waterways. • Encourage your neighbors, family, and friends to install low flow water fixtures and to practice water conservation.
How do we use water?1. How have you used water during the past week at home and at school? Sum the amount of water used by
referring to the average quantities shown on the first page of the fact sheet.2. Review the attached list of percentages on Earth's total and fresh water supply to demonstrate our limited water
resources. Discuss your individual water use.3. Identify water uses outside of the home and school [examples include agriculture, irrigation, livestock watering,
fishing, industrial uses (a good example is paper manufacturing), mining, power generation, and transportation.]
Earth's Water Distribution Materials:
• One 1,000-milliliter (mL) graduated cylinder• Five 100-mL graduated cylinders• One medicine dropper• Food coloring
Use the table below to determine the distribution of water for this demonstration:
Earth’s Total Water Supply (milliliter) Earth’s Total Fresh Water Supply (milliliter)
Ocean (saltwater) 972 Icecaps and glaciers 23
Fresh water 28 Groundwater 4
Surface water 2 drops*
Water in air and soil 1 drop
Total water on earth 1,000 Total fresh water on earth 28
1 liter = 1,000 milliliters * 3 drops = 1 milliliter
1. Estimate how much fresh water is available on Earth and where the fresh water comes from.2. Fill one 1,000-mL graduated cylinder with colored water to the 1,000-mL line. This represents the Earth's entire
water supply. 3. Pour 28 mL of the water into a 100-mL graduated cylinder. This represents the Earth's total fresh water supply.
The water remaining in the first cylinder (972 mL) represents salt water. 4. Divide the 28 mL of fresh water into smaller containers. Use the amounts shown in the table. The cylinder
containing 972 mL of water represents the salt water that we cannot drink without a costly procedure to remove the salt.
5. Which fresh water graduated cylinder represents the most fresh water on Earth? Is this source of fresh water commonly used by humans?
6. Cleveland gets most of its drinking water from surface water (Lake Erie) and some from groundwater (aquifers),
23 Shaw High School

Activities
which together comprise only 16.7 percent of the Earth's fresh water.
Water Watchers BLOGWater Watchers BLOGObserve water uses of family, friends, and neighbors. Record observations in your journals of all the water uses
and how long their family, friends, or neighbors used the water. For example, if a your neighbor is watering a lawn, record who used the water, how the water is used, and for how long. Other actions to observe include a family member using the washing machine or brushing his or her teeth. In groups, discuss your observations. Each group should come up with alternatives or conservation tips for each water use. Each group should create a poster that represents all of your ideas.
1. What water conservation tips were developed in class?2. Are you practicing the water conservation tips developed in class? 3. Are you dumping or throwing anything away that could potentially pollute our water? 4. If you are, what safer disposal methods could you use? 5. What water conservation tips can be used at school?
Packaging Analysis Exercise Packaging Analysis Exercise Examine the examples of packing arranged on the desks. These were all bought at local retail stores. For at least
one product, answer the following: 1. Source reduction: does the product need any packaging at all, or can it be sold with price tags attached directly
to the product? 2. Source reduction: If the product must have packaging, identify two ways the company could reduce the amount
of packaging used. 3. Volume reduction: Identify two ways the company could reduce the bulk of the packaging. 4. Reuse: Identify which parts of the package could be reused instead of being thrown away. 5. Recycled: Identify which parts of the package are recyclable. 6. What is your final repackaging recommendation? 7. For the next time that you go shopping, write at least two paragraphs on your observations of the packing that you
see and the above considerations.
Detecting Air PollutionDetecting Air Pollution1. Attach a 1-inch piece of masking tape to the narrow side of a 2.5” x 3” index card. Use a hole punch to make a
hole in the masking tape. Place some string through the hole.2. Use a pencil and write the following on the card: “Environmental experiment in progress. Please DO NOT
DISTURB! Thank you.” Write the location of the sampling site and your name.3. Draw a 2cm x 2cm square on the card and divide the square into 16 smaller squares (each should be .5cm x .
5cm).4. Place your pollution detectors throughout the community. At the sampling site, put a small amount of petroleum
jelly on the square.5. After a set amount of days, collect the samples and bring back to class. Use a magnifying glass to examine the
particulates collected.6. Draw a sketch of what the particulates looked like. Identify the amount collected as none, light, moderate or
heavy. Count the particles in each of the 20 small squares. Add and average them.7. As best as you can, try to identify the average particle size.8. Can you identify any of the particles?9. What are the major stationary sources of air pollution in your community?10. What is the major single source of air pollution in the U.S.?11. What is the second major source of air pollution in the U.S.?12. Were any of the particles you identified pollen?
Analyzing Vehicles for Particulate ExhaustAnalyzing Vehicles for Particulate ExhaustMaterials
Three pairs of new white tube socks, six cars or trucks with different size engines (gas, diesel), masking tape, marker
Procedures1. Identify the make, model, engine size, year made and mileage of each vehicle. Assign each vehicle a number and
write that number on a piece of masking tape. Put a number tape on each sock.2. Make a prediction of what each sock will look like at the end of the experiment.3. Do not touch a hot tail pipe! Put a sock over the tail pipe of each vehicle. Make sure the sock has been pulled
up all the way over the pipe. To minimize variability, run all tests when the vehicle has a cold engine. Make sure
2010 - 2011 24

Analyzing Vehicles for Particulate Exhaust
the sock is secure. Tape or wire the sock if necessary.4. Turn on each car and let it idle for three minutes. Turn the engine off and use insulated gloves to remove the sock
from the tailpipe.5. Examine each sock on the outside and carefully turn the sock inside out. Record your findings by ranking the
socks from lightest to darkest in color change. Also indicate how wet or dry each sock is.
Questions1. Rank your socks from cleanest to dirtiest.2. Rank your socks from driest to wettest.3. Did your results match your predictions?4. Can you determine a relationship between the amount of pollution a vehicle generates and its year?5. Is there a relationship between pollution and engine size, make, model, or the type of fuel?
Smart Growth CitySmart Growth CityFrom Environmental Science: A Global Concern
You will redesign East Cleveland to be a “smart growth” city (like Curitiba, Brazil). The goals for smart growth are: 1. Create a positive self-image for the community 2. Make the downtown vital and livable 3. Alleviate substandard housing 4. Solve problems with air, water, toxic waste, and noise pollution 5. Improve communication between groups 6. Improve community member access to the arts
You will use a poster board to display your new “smart city” and answer the following questions: 1. How will you protect environmental quality (conserving farmlands, wetlands, and open spaces)? 2. Will you restrict land use? 3. Where will you locate your landfill? 4. How will you ensure clean air and water? 5. What kinds of houses will you build and where will you locate them?
Air Pollution AllowancesAir Pollution AllowancesThis exercise introduces students to pollution abatement measures based on free market trading of pollution
allowances. The class is broken up into six groups, each representing an industry subject to a fictitious Air Pollution Allowance Trading System. They are given a set of facts and conditions and will be required to make a series of decisions in order to comply with environmental regulations, as well as determine the price of a pollution allowance, and whether to implement pollution control measures.
Background There are several different types of pollution control measures that the government imposes on polluters to
achieve compliance with environmental regulations. “Point source” controls impose standards on the emissions coming out of a facility (such as a factory) without regard to the cost of achieving the standard or the mixture of that discharge with other point source discharges in the local environment. Another method concentrates on the level of pollution in the local area (such as a river segment or air within a city’s boundaries), requiring some sort of pollution reduction measures when the area is out of compliance. This latter method is used under the Clean Air Act, but has been difficult to enforce given the large number of individual air pollution sources that exist (for example, automobiles). Under an allowance trading system, large stationary sources of air pollution, such as power plants, receive a certain number of “pollution allowances” for a specified period of time, based on local clean air standards and allocated to the sources according to their historic fuel consumption and a specified emissions rate for the source. Allowances are in units of pollutant emitted, so a polluter will use up its allowances as it pollutes. The key to the system is that these allowances may be traded between sources, or may be “banked.” At the end of the period, each source must have enough allowances to balance its emissions for that period, otherwise a penalty on each excess unit of pollution is imposed. The goal of this system is to use market incentives of rewards and penalties to reduce pollution, allowing polluters to make their own decisions as to how to expend their allocation of pollution allowances.
ExampleAn electric utility, Metropolis Power and Light (MP&L) wants to install a certain pollution reduction technology at
one of its electricity generation plants that will cost $100,000. Without an allowance system, MP&L may not be rewarded for doing the right thing, and has no other incentive to do so. However, under an allowance trading system, MP&L would save four allowances if it installs the clean air equipment and reduces its emissions of pollution. MP&L can sell the allowances in the pollution allowance market and recover part or all of the money it spent on the equipment, or even
25 Shaw High School
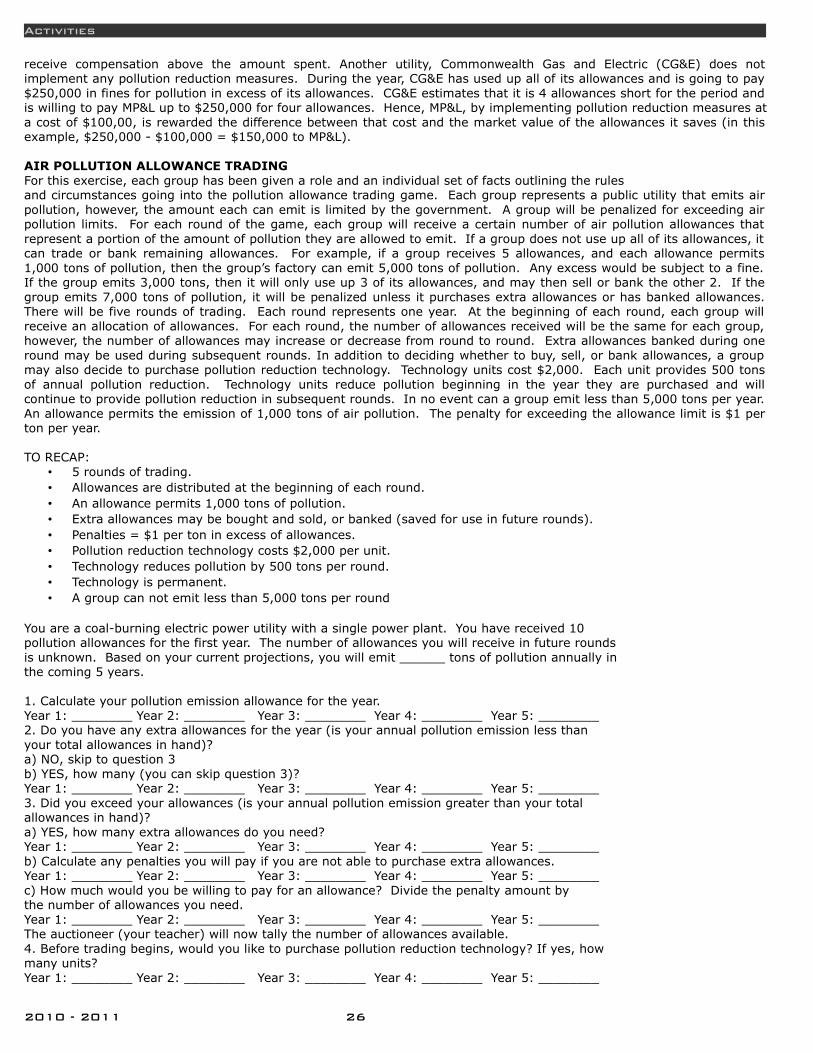
Activities
receive compensation above the amount spent. Another utility, Commonwealth Gas and Electric (CG&E) does not implement any pollution reduction measures. During the year, CG&E has used up all of its allowances and is going to pay $250,000 in fines for pollution in excess of its allowances. CG&E estimates that it is 4 allowances short for the period and is willing to pay MP&L up to $250,000 for four allowances. Hence, MP&L, by implementing pollution reduction measures at a cost of $100,00, is rewarded the difference between that cost and the market value of the allowances it saves (in this example, $250,000 - $100,000 = $150,000 to MP&L).
AIR POLLUTION ALLOWANCE TRADING For this exercise, each group has been given a role and an individual set of facts outlining the rulesand circumstances going into the pollution allowance trading game. Each group represents a public utility that emits air pollution, however, the amount each can emit is limited by the government. A group will be penalized for exceeding air pollution limits. For each round of the game, each group will receive a certain number of air pollution allowances that represent a portion of the amount of pollution they are allowed to emit. If a group does not use up all of its allowances, it can trade or bank remaining allowances. For example, if a group receives 5 allowances, and each allowance permits 1,000 tons of pollution, then the group’s factory can emit 5,000 tons of pollution. Any excess would be subject to a fine. If the group emits 3,000 tons, then it will only use up 3 of its allowances, and may then sell or bank the other 2. If the group emits 7,000 tons of pollution, it will be penalized unless it purchases extra allowances or has banked allowances. There will be five rounds of trading. Each round represents one year. At the beginning of each round, each group will receive an allocation of allowances. For each round, the number of allowances received will be the same for each group, however, the number of allowances may increase or decrease from round to round. Extra allowances banked during one round may be used during subsequent rounds. In addition to deciding whether to buy, sell, or bank allowances, a group may also decide to purchase pollution reduction technology. Technology units cost $2,000. Each unit provides 500 tons of annual pollution reduction. Technology units reduce pollution beginning in the year they are purchased and will continue to provide pollution reduction in subsequent rounds. In no event can a group emit less than 5,000 tons per year. An allowance permits the emission of 1,000 tons of air pollution. The penalty for exceeding the allowance limit is $1 per ton per year.
TO RECAP: • 5 rounds of trading. • Allowances are distributed at the beginning of each round. • An allowance permits 1,000 tons of pollution. • Extra allowances may be bought and sold, or banked (saved for use in future rounds). • Penalties = $1 per ton in excess of allowances. • Pollution reduction technology costs $2,000 per unit. • Technology reduces pollution by 500 tons per round. • Technology is permanent. • A group can not emit less than 5,000 tons per round
You are a coal-burning electric power utility with a single power plant. You have received 10 pollution allowances for the first year. The number of allowances you will receive in future rounds is unknown. Based on your current projections, you will emit ______ tons of pollution annually in the coming 5 years.
1. Calculate your pollution emission allowance for the year. Year 1: ________ Year 2: ________ Year 3: ________ Year 4: ________ Year 5: ________ 2. Do you have any extra allowances for the year (is your annual pollution emission less than your total allowances in hand)? a) NO, skip to question 3 b) YES, how many (you can skip question 3)? Year 1: ________ Year 2: ________ Year 3: ________ Year 4: ________ Year 5: ________ 3. Did you exceed your allowances (is your annual pollution emission greater than your total allowances in hand)? a) YES, how many extra allowances do you need? Year 1: ________ Year 2: ________ Year 3: ________ Year 4: ________ Year 5: ________ b) Calculate any penalties you will pay if you are not able to purchase extra allowances. Year 1: ________ Year 2: ________ Year 3: ________ Year 4: ________ Year 5: ________ c) How much would you be willing to pay for an allowance? Divide the penalty amount by the number of allowances you need. Year 1: ________ Year 2: ________ Year 3: ________ Year 4: ________ Year 5: ________ The auctioneer (your teacher) will now tally the number of allowances available. 4. Before trading begins, would you like to purchase pollution reduction technology? If yes, how many units? Year 1: ________ Year 2: ________ Year 3: ________ Year 4: ________ Year 5: ________
2010 - 2011 26
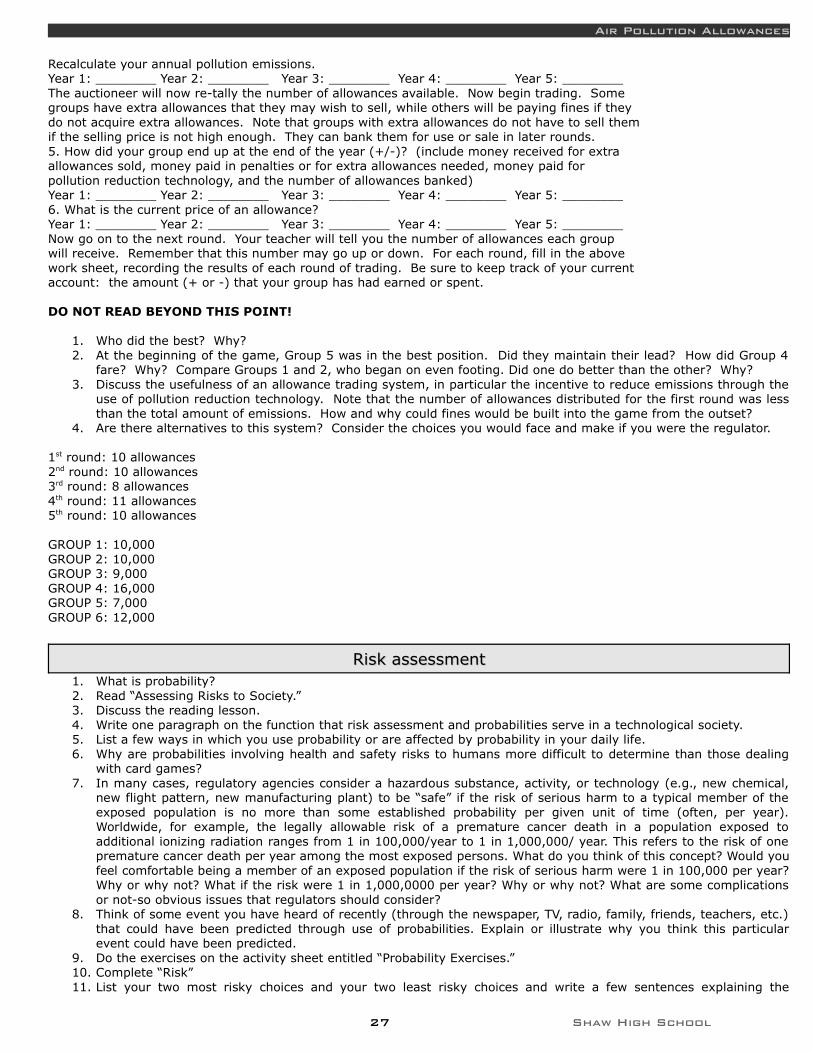
Air Pollution Allowances
Recalculate your annual pollution emissions. Year 1: ________ Year 2: ________ Year 3: ________ Year 4: ________ Year 5: ________ The auctioneer will now re-tally the number of allowances available. Now begin trading. Some groups have extra allowances that they may wish to sell, while others will be paying fines if they do not acquire extra allowances. Note that groups with extra allowances do not have to sell them if the selling price is not high enough. They can bank them for use or sale in later rounds.5. How did your group end up at the end of the year (+/-)? (include money received for extra allowances sold, money paid in penalties or for extra allowances needed, money paid for pollution reduction technology, and the number of allowances banked) Year 1: ________ Year 2: ________ Year 3: ________ Year 4: ________ Year 5: ________ 6. What is the current price of an allowance? Year 1: ________ Year 2: ________ Year 3: ________ Year 4: ________ Year 5: ________ Now go on to the next round. Your teacher will tell you the number of allowances each group will receive. Remember that this number may go up or down. For each round, fill in the above work sheet, recording the results of each round of trading. Be sure to keep track of your current account: the amount (+ or -) that your group has had earned or spent.
DO NOT READ BEYOND THIS POINT!
1. Who did the best? Why? 2. At the beginning of the game, Group 5 was in the best position. Did they maintain their lead? How did Group 4
fare? Why? Compare Groups 1 and 2, who began on even footing. Did one do better than the other? Why?3. Discuss the usefulness of an allowance trading system, in particular the incentive to reduce emissions through the
use of pollution reduction technology. Note that the number of allowances distributed for the first round was less than the total amount of emissions. How and why could fines would be built into the game from the outset?
4. Are there alternatives to this system? Consider the choices you would face and make if you were the regulator.
1st round: 10 allowances2nd round: 10 allowances3rd round: 8 allowances4th round: 11 allowances5th round: 10 allowances
GROUP 1: 10,000GROUP 2: 10,000GROUP 3: 9,000GROUP 4: 16,000GROUP 5: 7,000GROUP 6: 12,000
Risk assessmentRisk assessment1. What is probability?2. Read “Assessing Risks to Society.” 3. Discuss the reading lesson.4. Write one paragraph on the function that risk assessment and probabilities serve in a technological society.5. List a few ways in which you use probability or are affected by probability in your daily life.6. Why are probabilities involving health and safety risks to humans more difficult to determine than those dealing
with card games?7. In many cases, regulatory agencies consider a hazardous substance, activity, or technology (e.g., new chemical,
new flight pattern, new manufacturing plant) to be “safe” if the risk of serious harm to a typical member of the exposed population is no more than some established probability per given unit of time (often, per year). Worldwide, for example, the legally allowable risk of a premature cancer death in a population exposed to additional ionizing radiation ranges from 1 in 100,000/year to 1 in 1,000,000/ year. This refers to the risk of one premature cancer death per year among the most exposed persons. What do you think of this concept? Would you feel comfortable being a member of an exposed population if the risk of serious harm were 1 in 100,000 per year? Why or why not? What if the risk were 1 in 1,000,0000 per year? Why or why not? What are some complications or not-so obvious issues that regulators should consider?
8. Think of some event you have heard of recently (through the newspaper, TV, radio, family, friends, teachers, etc.) that could have been predicted through use of probabilities. Explain or illustrate why you think this particular event could have been predicted.
9. Do the exercises on the activity sheet entitled “Probability Exercises.”10. Complete “Risk”11. List your two most risky choices and your two least risky choices and write a few sentences explaining the
27 Shaw High School
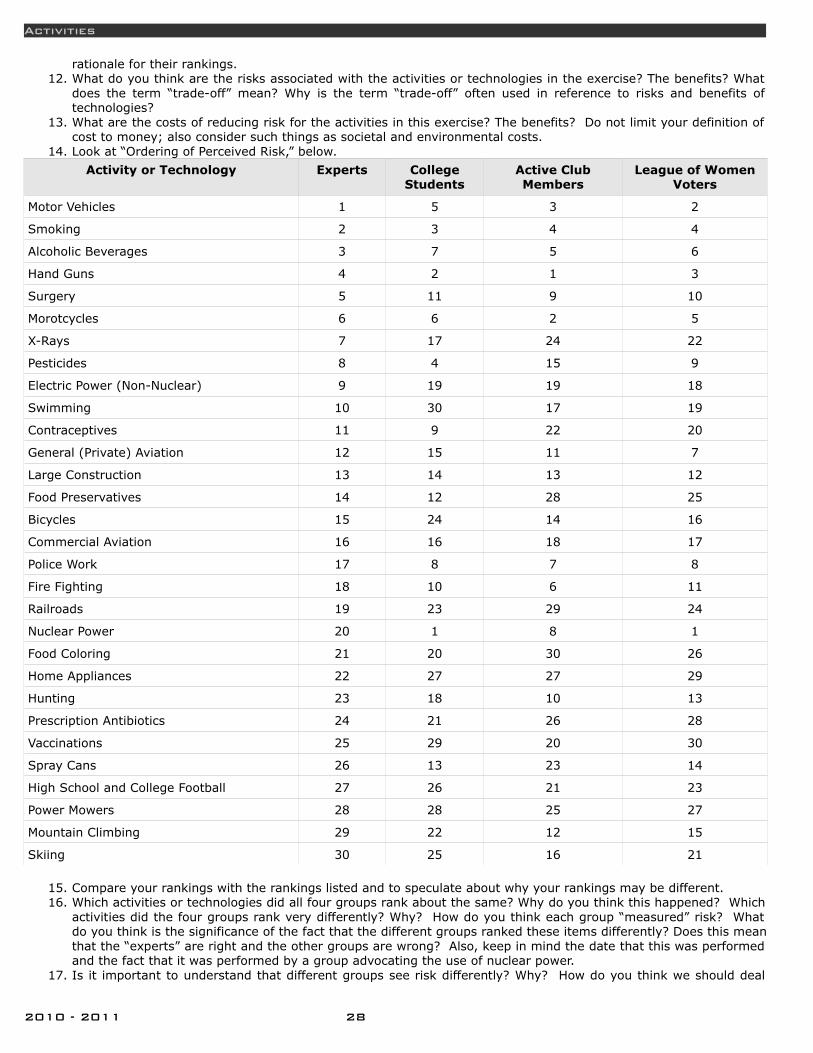
Activities
rationale for their rankings.12. What do you think are the risks associated with the activities or technologies in the exercise? The benefits? What
does the term “trade-off” mean? Why is the term “trade-off” often used in reference to risks and benefits of technologies?
13. What are the costs of reducing risk for the activities in this exercise? The benefits? Do not limit your definition of cost to money; also consider such things as societal and environmental costs.
14. Look at “Ordering of Perceived Risk,” below.
Activity or Technology Experts College Students
Active Club Members
League of Women Voters
Motor Vehicles 1 5 3 2
Smoking 2 3 4 4
Alcoholic Beverages 3 7 5 6
Hand Guns 4 2 1 3
Surgery 5 11 9 10
Morotcycles 6 6 2 5
X-Rays 7 17 24 22
Pesticides 8 4 15 9
Electric Power (Non-Nuclear) 9 19 19 18
Swimming 10 30 17 19
Contraceptives 11 9 22 20
General (Private) Aviation 12 15 11 7
Large Construction 13 14 13 12
Food Preservatives 14 12 28 25
Bicycles 15 24 14 16
Commercial Aviation 16 16 18 17
Police Work 17 8 7 8
Fire Fighting 18 10 6 11
Railroads 19 23 29 24
Nuclear Power 20 1 8 1
Food Coloring 21 20 30 26
Home Appliances 22 27 27 29
Hunting 23 18 10 13
Prescription Antibiotics 24 21 26 28
Vaccinations 25 29 20 30
Spray Cans 26 13 23 14
High School and College Football 27 26 21 23
Power Mowers 28 28 25 27
Mountain Climbing 29 22 12 15
Skiing 30 25 16 21
15. Compare your rankings with the rankings listed and to speculate about why your rankings may be different.16. Which activities or technologies did all four groups rank about the same? Why do you think this happened? Which
activities did the four groups rank very differently? Why? How do you think each group “measured” risk? What do you think is the significance of the fact that the different groups ranked these items differently? Does this mean that the “experts” are right and the other groups are wrong? Also, keep in mind the date that this was performed and the fact that it was performed by a group advocating the use of nuclear power.
17. Is it important to understand that different groups see risk differently? Why? How do you think we should deal
2010 - 2011 28
Risk assessment
with these differences in our democracy?18. For class discussion:
1. What are some of the risks you face in your life? What could you do to reduce risk in your own life?2. What should others do to reduce risk in our lives? Should all methods be used? What should the role of the
government be?3. Do you think some level of risk in our lives is acceptable? Why or why not?4. How should decisions to determine levels of acceptable risk be made? What should the role of the government
be?5. Should everyone be made to reduce his or her personal risk in activities? Should there be penalties if people
don’t? Are there examples in your life in which this occurs? Can you think of instances mentioned in the news? How do you feel about being forced to reduce particular risks in your life?
6. How has the development of technology affected risk?7. How can we manage risk?8. Explain the application of risk management to something you are familiar with, such as the automobile or
sports. Does risk management guarantee absolute safety?
Assessing Risks to Society and ProbabilityAssessing Risks to Society and ProbabilityTo protect public health and safety, it is very important that we determine the risks involved with different
activities and technologies. To be able to discuss and compare risks, a common language is needed. For this reason, scientists and decision-makers quantify relationships among risks by developing numerical values called mathematical probabilities.
Everyday Use of ProbabilityHow “likely” something is to occur is known as probability. Most people, including you, use probability in their
everyday lives. For example, a local weather forecaster (or meteorologist) may forecast rain. The forecast is made by comparing scientific knowledge gained from observing similar conditions in the past to the existing weather conditions. Through this comparison, the meteorologist can tell us what percent chance of rain there is. Then you can decide whether or not to carry an umbrella. If you are cautious, you may decide to carry an umbrella if there is only a 30 percent chance of rain. Or you may wait to do so until a 70 percent chance of rain is forecast. It all depends on your own tolerance of the risk and your own concern about the consequences of rain.
Percentages and probabilities are related, but not the same. Percentages are a mathematical statement of how many times out of 100 something happens. Probabilities refer to just one occurrence. For example, a 30 percent chance of rain at a particular weather station means that given these same weather conditions for 100 different days, it is expected to rain 30 of those days. The probability of rain for any one of those days is 30 divided by 100, which equals 30/ 100 or 0.30.
30 / 100 = 0.30
Repeated Observations and ExperimentsMost of the probabilities we use in every day life are determined from simply observing what happens every time
certain conditions arise or from repeating an experiment many times. The number of times that a specific outcome occurs, divided by the total number of times the experiment is repeated, is the probability that the specific outcome will occur. This is useful in making predictions about what will happen in the future.
Number of times outcome occurs = Probability
Total number of repetitions
Let’s use an example similar to the one above. The same weather conditions were observed and recorded for 100 days during the past two years, 40 of those 100 days were sunny and warm. This Tuesday, we expect the weather conditions to be very similar to those during the 100 days observed in the past two years. What is the probability that this Tuesday will be sunny and warm?
40 sunny days =
40 = 0.40
100 repetitions 100
Common SenseSome probabilities are common sense. For example, we know that when we flip a coin, there are only two possible
outcomes — heads or tails. So there is a 50 percent chance (a 0.50 probability) that the coin will land heads up. There is also a 50 percent (0.50 probability) chance that it will land tails up. If we want to know how many times a coin is expected to land heads up on a certain number of flips, we don’t have to actually flip the coin. We can simply multiply the probability of heads by the number of times we would flip the coin.
29 Shaw High School
Activities
10 flips? 10 x 0.50 = 5 heads2 flips? 2 x 0.50 = 1 head
Random events like the coin flip cannot be predicted with certainty. Every time the coin is flipped, there is a 0.50 probability of heads and a 0.50 probability of tails. If a lot of flips in a row land heads up, the probability that the next flip will be tails is still 0.50.
Figuring ProbabilityThe same principles apply to other events. Suppose there are a certain number of possible outcomes from an
event, and each event has an equal chance of happening. Then the probability of each outcome is one divided by the number of possible outcomes.
For example, the probability of drawing the ace of spades from an ordinary deck of cards is 1/52 — because there is only one ace of spades in a 52-card deck. Now, if we want to know the probability of drawing any ace on one draw, we add together the probabilities of getting each particular ace. There are four aces out of the 52 cards, or one ace per suit. Thus, the probability of drawing any of the four aces on a single draw is 1/13.
1+
1+
1+
1 =
4 =
1
52 52 52 52 52 13
Probabilities are usually not presented in fractions but are expressed as a number between zero and one. The example above is repeated to illustrate this. The probability of drawing the ace of spades from an ordinary deck of cards:
1 Ace of Spades = 0.02
52 possible cards
Suppose you are playing cards and you want to know the probability of drawing a particular hand — five cards of the same suit (a flush). Think of each draw as a separate event. Remember also that the number of favorable and possible outcomes will be reduced by one after each draw.
First draw: There are 13 favorable cards out of 52 total cards; 13/52Second draw: There are now only 12 favorable draws out of 51 cards; 12/51Third draw: There are 11 favorable cards remaining out of 50 cards; 11/50Fourth draw: There are 10 favorable cards remaining out of 49 cards; 10/49Fifth draw: There are nine favorable cards remaining out of 48 cards; 9/48
To determine the probability of independent events happening together, you must multiply the individual probabilities together. So for drawing a flush:
13x
12x
11x
10 x
9 =
154,440 = 0.000495 =
495
52 52 52 52 52 311,875,200 1,000,000
Multiply by four to account for all four suits and the chance of drawing a flush in any suit in five draws is 198 in 100,000. If you drew five cards 100,000 times, you would be likely to draw a flush 198 times.
Health and Safety RisksOther probabilities, including those for health and safety risks to humans, are harder to determine. A lot of
information may be needed to make a prediction. Or testing the whole system for which risks are being evaluated may not be possible. However, once the basic probability for each possible outcome is known, the same rules apply and can be used to make reasonable predictions.
For instance, suppose that, by law, a company cannot distribute a machine until certain safety standards are met. The company knows the machine will not operate safely if two particular parts break down at the same time. This situation could exist if one part is a backup for the other. The company couldn’t wait until after the machines were distributed to see how many times out of 100 the two parts would break down at the same time.
However, the company could conduct tests on each part to find the probability for each part breaking down. Then these probabilities could be multiplied to determine the probability of both parts failing at the same time.
For example, suppose tests determined that the probability of part A breaking down was 0.05 and the probability of part B breaking down was 0.02. Thus, the probability of both parts breaking down is 0.05 x 0.02. This equals 0.001 or 1/1,000 (one in a thousand). If that level of risk is acceptable to the company and meets industry regulations, then the company could distribute the machine.
ALARA
2010 - 2011 30

Assessing Risks to Society and Probability
Nuclear waste disposal is governed by a principle of minimizing risk to the public and environment to “as low as is reasonably achievable” — ALARA. Many steps are taken in nuclear waste disposal, as with other nuclear power activities, to reduce public risk from radiation to below acceptable risk levels determined by regulatory authorities (10-2 to 10-6 per year is the typical range of acceptable risk).
LimitationsOne problem is that to know if risk increases, we have to know what the pre-existing risk is before the “new risk”
is introduced. Often, increased risk is based on laboratory experiments using large numbers of animals. Large numbers of subjects are helpful, but because there are significant biological differences between the test population (often rats or mice) and humans, many uncertainties are introduced.
Probabilities do give us a way to determine a level of risk that is more or less objective. But it is important to understand that personal judgment is still involved. For example, choosing what to consider in an experiment requires some judgment.Picture of a laboratory rat
Consequences and ValuesDetermining the acceptability of risk involves both the consequence of the action in question and personal values.
If you decide not to carry an umbrella, the consequence may be that you get wet if it rains. How much risk you are willing to accept depends on whether you mind getting wet.
Of course, in many situations, decisions are much more complicated than whether to carry an umbrella. It is especially difficult to determine how much risk is acceptable when the consequences of an event, action, or technology could involve some risk to human health or safety.
For example, say a prescription drug that can help alleviate severe pain, may also increase a person’s risk of having a heart attack. Before taking the drug, it helps to have some way of quantifying that risk. Is there a .05 percent chance of having a heart attack or a 50 percent chance? What other factors increase the risk (such as family history, age, drinking alcohol, smoking, etc.)? Ultimately, the decision on whether or not to use the drug depends on someone’s judgement whether the benefit of the drug is worth the risks involved.
A value judgment is always required to determine the level of risk considered acceptable.
Making Societal DecisionsUsing probability as a tool for discussing risk is useful, but it is important to recognize that there are limitations in
using probability for making decisions about the acceptability of risk. For example, most societal issues in which risk is a factor are complex. A significant problem may be discounted or underestimated. Also, many probabilities are only estimated because it is not possible to perform controlled experiments to measure them. Furthermore, human behavior and human error are even less predictable than physical or biological events.
Other Aspects of RiskProbability is only one aspect of risk. Societal risk decisions also involve consequences and values. What is the
consequence of a failure — loss of money, illness, death? How large are the consequences? Do the risks and benefits fall on different people? Do the risks fall on the decision-makers or on others? How are decisions made? What are the alternatives?
Risk PerceptionWhen making decisions that affect society, we must also factor in people’s perception of risk, which, in some
cases, may be different from the quantified risk. For example, in many surveys, people have indicated that they feel safer traveling by car than on an airplane, yet mathematical assessments show the quantified risk to be just the opposite. According to the National Safety Council the lifetime odds for a person born in 2001 of dying in a car accident in the United States is 1 in 247, while their lifetime odds of dying in an airplane crash is 1 in 4,023.
Taken another way, according to the above statistics, people are over 16 times more likely to die in a car accident than in a plane crash in their lifetime. However, many people feel safer in a car because a car is more familiar; because it is not as technologically advanced as an airplane; because they have more control over a car; and because a car crash somehow doesn’t seem as catastrophic as a plane crash. On the other hand, most pilots feel safe flying because they fly all the time, making it more familiar to them; because they have a better understanding of the technology; and because they themselves are in control of the plane. People tend to evaluate risk with the following questions:
– Is the risk familiar, or is it out of the ordinary?– Is the risk complicated, or is it understandable?– Am I in control of the risk, or is someone else?– Is the risk my choice, or is someone forcing it on me?– Does the risk benefit me in some way, or is the risk for nothing?– Could the risk result in hurting a lot of people very badly (catastrophic), or would just a few be hurt and in a
minor way?The more a risk seems unfamiliar, complicated, out of control, forced, detrimental, and catastrophic, the more unlikely we are to assume the risk regardless of the mathematical odds.
In solving the problems associated with nuclear waste, we must make decisions based on the quantified risks to people and the environment. However, in a democratic society we must also deal with people’s perceived risks. To most
31 Shaw High School

Activities
people, any decision concerning nuclear waste will seem very risky because of the above factors.To deal with the perceived risks, we must do more than just quote statistics. We must work to reduce and
minimize the factors that lead to people’s fear and mistrust.
RiskDirections: Everything we do involves some risk, but some things are riskier than others. Below is an alphabetical list of 30 activities and technologies. Rank the risk of an individual (not necessarily you, but any average person) of dying in any year from these activities and technologies, with #1 as the most likely and #30 as the least likely.
alcoholic beverages bicycles commercial aviation contraceptives electric power (non-nuclear) firefighting food coloring food preservatives general (private) aviation hand guns
high school and college football home appliances hunting large construction motorcycles motor vehicles mountain climbing nuclear power pesticides police work
power mowers prescription antibiotics railroads skiing smoking spray cans surgery swimming vaccinations X-rays
1._________________________________16. _______________________________ 2._________________________________17. _______________________________ 3._________________________________18. _______________________________ 4._________________________________19. _______________________________ 5._________________________________20. _______________________________ 6._________________________________21. _______________________________ 7._________________________________22. _______________________________ 8._________________________________23. _______________________________ 9._________________________________24. _______________________________ 10.________________________________25. _______________________________ 11.________________________________26. _______________________________ 12.________________________________27. _______________________________ 13.________________________________28. _______________________________ 14.________________________________29. _______________________________ 15.________________________________30. _______________________________ Probability Exercises
1. A typical roulette wheel has 38 slots that are numbered 1, 2, 3,..., 34, 35, 36, 0, and 00. The 0 and 00 slots are green. Of the remaining slots, half are red and half are black. Also half of the integers from 1 to 36 are even and half are odd. 0 and 00 are defined as neither even or odd. A ball is rolled around the wheel and ends up in one of the slots. We assume that each slot has an equal chance.
a) What is the probability of the ball landing in each slot? b) What is the probability of the ball landing in a green slot? A red slot? A black slot? c) What is the probability of the ball landing on an even number? d) What is the probability of getting a 1, 12, 24, or 36?
2. For the following questions, to calculate the “expected” value of an event, multiply the consequence (profit or loss) under each outcome by the probability of the outcome and add them together. For example, if you bet $1.00 on the flip of a coin, there is a 0.50 probability that you win and a 0.50 probability that you lose. The expected value of this game is 0.50($1.00) + 0.50(0) = $.50 + $0 = $0.50
a) In a particular lottery, 2,000,000 tickets are sold each week for $0.50 each. Each week there are 12,009 tickets drawn and awarded prizes: 12,000 people receive $25; 6 people win $10,000; 2 people win $50,000; and 1 person wins $200,000. • Determine the probability of winning each prize. • If you play this game, what is your “expected” payoff?
b) Suppose you must choose between two products (A and B) to sell in your shop. Your choice depends on what the economy is going to do. If the economy goes up, you will make a profit of $100,000 on product A or $60,000 on product B. If the economy stays the same, you will earn a profit of $50,000 on product A and $40,000 on product B. And, if the economy goes down, you will lose $20,000 on product A, but can still earn $10,000 on product B. You don’t know for sure what the economy is going to do, but you might know the probabilities of these things happening. Suppose the probability of the economy going up is 0.4, the probability of it staying the same is 0.4, and the probability of it going down is 0.2. • Determine the expected profit for each product. Which product would you choose and why?
2010 - 2011 32
Assessing Risks to Society and Probability
Mercury in the EnvironmentMercury in the Environment 1. Read the following warnings:
FISH WARNINGState advisories say adults should limit consumption of bay sport fish to, at most, two meals per month, and eat
no striped bass longer than 35 inches. Pregnant women, or women who may become pregnant or are breast feeding, and children under 6 shouldn't eat
more than one meal per month of bay fish. These groups shouldn't eat any striped bass longer than 27 inches or shark longer than 24 inches.
There are no advisories on salmon, anchovies, herring or smelt caught in the bay. These species are not exposed to the same levels of contaminants because they spend much of their life outside the bay in the ocean.
San Francisco Bay and Delta RegionBecause of elevated levels of mercury, PCBs, and other chemicals, the following interim advisory has been issued.
A final advisory will be issued when the data have been completely evaluated: a) Adults should eat no more than two meals per month of San Francisco Bay sport fish, including sturgeon and
striped bass caught in the delta. (One meal for an adult is about eight ounces). b) Adults should not eat any striped bass over 35 inches. c) Women who are pregnant or may become pregnant, nursing mothers, and children under age six should not eat
more than one meal of fish per month. In addition, they should not eat any striped bass over 27 inches or any shark over 24 inches.
d) This advisory does not apply to salmon, anchovies, herring, and smelt caught in the bay; other sport fish caught in the delta or ocean; or commercial fish.
e) Richmond Harbor Channel area: In addition to the above advice, no one should eat any croakers, surfperches, bullheads, gobies or shellfish taken within the Richmond Harbor Channel area because of high levels of chemicals detected there.
2. What do these warnings mean? What do you know about this issue? What more information do you need in order to understand the issue more fully? Make a list!
3. Get in a group. In each group, one person is assigned to write down the relevant points to answer one of the questions you just came up with. Another person should be selected to present the information.
a) What is mercury?• Mercury is element number 80 and its symbol is Hg• Mercury is a metal.• Mercury is a liquid at room temperature.• Mercury is dense and thus very heavy.
b) What is mercury used for? • Dental Fillings• Electronic components such as switches.• Gold mining
c) How do we get mercury? How is it mined?• Mercury is found in very specific spots and is usually in the form of cinnabar.• Cinnabar is a combination of mercury and sulfur.• Cinnabar is ground up and then heated at high temperatures.• Mercury vapor is collected and then sent through tubes to cool and liquefy. The liquid is then collected and
put into flasks. d) Where did it come from? How did it get into the bay?
• One of the biggest mercury mines in North America is located at New Almaden.• Small particles of cinnabar are washed down the rivers and flows down Guadalupe Creek into the south part
of San Francisco Bay e) How does it get into fish?
• Bacteria in the bay turn mercury into methyl mercury. This form of mercury easily attaches to molecules in the bacteria and in algae.
• Fish then eat the bacteria and algae and thus consume mercury.• The process occurs only in anoxic or anaerobic (no oxygen) bacteria that are typically found beneath the
surface of mud. The process also requires sulfur. Seawater contains a fair amount of sulfur. You can tell when conditions are right by the rotten egg smell.
• The south bay has lots of shallow muddy areas where the conditions are right. f) Why are we concerned only with certain fish?
33 Shaw High School

Activities
• Most organisms are not very good at eliminating mercury from their system. So when they consume mercury, it builds up in their bodies. This process is called bioaccumulation.
• Big fish eat small fish and thus get the mercury that is in the small fish. The fish like striped bass and sturgeon live a very long time and thus eat a lot of little fish. Over this long life, lots of mercury accumulates. This process of mercury moving up the food chain and increasing in amount is called biomagnification.
g) Why is mercury bad for humans?• Mercury causes problems for the nervous systems of humans.• Mercury appears to bind to enzymes in the body that contain sulfur. This prevents these enzymes from
working normally. h) Why is it particularly bad for pregnant women, infants and small children?
• The developing nervous systems of fetuses and infants is especially sensitive to these changes.• That’s why women who are pregnant and those who will be pregnant are especially vulnerable.
i) How do they decide how much is OK to eat?• The EPA has established a safe level of mercury consumption per day.• Different types of fish have been tested to see how much mercury they contain per gram (or ounce) of meat.• If you divide the safe level by the amount per gram, you obtain the amount of fish that contains the safe
level.• If you don’t eat more than this you should be OK.• But fish contain many healthy things for you like omega-3 fatty acids. So, rather than not eating fish, it is
better to eat fish low in mercury.
4. Each group will present in a few minutes the answer to their group’s questions. 5. Watch the five minute movie on the Minamata disaster (“Minamata Video” link). Discuss how it happened and how
Japan dealt with it. Discuss issues of government regulation versus individual and corporate freedom. 6. Read “Summary of the Chemicals of Concern Found in Fish: San Francisco Bay Pilot Study.”
In 1994 the San Francisco Bay Regional Water Quality Control Board conducted a pilot study to find out what levels of chemicals are present in sport fish in San Francisco Bay. The study was done to guide pollution control activities by determining what types of chemicals are present and where high concentrations may be occurring. It will also identify what further studies are needed. The pilot study was expanded to provide enough information to perform a preliminary health risk assessment on consuming certain fish species caught in the bay. A health advisory for striped bass had already been in effect for many years based on elevated levels of methylmercury, an organic mercury compound frequently found in fish. The study was thus also intended to determine whether more health advisories should be issued for other fish species that might be contaminated. The fish in the pilot study were analyzed for about 100 chemicals. Methylmercury and five other chemicals or chemical groups were found to be at levels that were considered high enough to need more investigation. These chemicals include the chlorinated compounds PCBs, dioxins, chlordane, the DDT group, and dieldrin. They are generally associated with industrial activities or agriculture whereas mercury comes from natural and industrial sources. Once these chemicals are released into the environment, they stay there for many years and may be taken up by fish.
The Office of Environmental Health Hazard Assessment (OEHHA) evaluated the potential health hazard of eating fish containing these chemicals. We found that the levels of PCBs, methylmercury, and to a lesser extent dioxins pose a potential health hazard. Eating a few meals of bay sport fish will not make people sick. Our concern is for the potential long-term effects of eating chemically contaminated fish, and especially the potential for harm to sensitive groups such as children and developing young. We issued an interim advisory recommending that people limit the amount of sport fish they consume from the bay. We also recommended preparation and cooking methods to remove some of the chemicals in the fish.
Because some anglers and their families may be concerned about the potential health effects of the chemicals in this study, we prepared this summary of the six main chemicals named in the study. We report acute toxicity (effects after a single large dose) and chronic toxicity (effects from small exposures over a long time). It is important to understand, however, that the health effects described here often result from much greater exposures than what someone might get from eating sport fish from the bay. The effects described here often result from the high doses given to animals in laboratory tests, rather than exposures to these chemicals in fish. If you are exposed to hazardous chemicals, many factors or circumstances will determine whether harmful health effects will occur and what the type and severity of those health effects will be. These factors include the dose (how much), the duration (how long), the route or pathway by which you are exposed (breathing, eating, drinking, or skin contact), and the other chemicals to which you are exposed. Your individual characteristics such as age, sex, nutritional status, family traits, life style, and state of health are also important factors.
When we developed our interim health advisory for bay sport fish, we took into account as many of these factors as possible. Following the advisory's guidelines will reduce your exposure to harmful chemicals and protect you against harmful effects.
For more information about the health advisories on eating sport fish in California, contact OEHHA, as listed the end of this document. We have prepared other materials on PCBs and methylmercury in fish, which will help explain these
2010 - 2011 34
Mercury in the Environment
chemicals. A summary of the San Francisco Bay study and an illustrated brochure on ways to protect your health when you sport fish are also available.
PCBs (Polychlorinated Biphenyls) PCBs are mixtures of related chemicals that were sold under the trade name of Aroclor. They were used as
transformer fluids, lubricants, hydraulic fluids, and similar products. Their production and use have been banned since 1979. However, these chemicals are still common in the environment where they last a long time and build up in animal tissues. PCBs can be stored in body fat and secreted in milk. The forms with the most chlorine in them tend to last the longest in the environment and in the body. All PCB mixtures change over time. Thus, the PCB mixtures found in the environment are never the same as the products that were actually used. They also differ from the forms used in studies of health effects. These differences complicate evaluation of toxicity.
PCBs are not highly toxic with a single dose. However, there is concern that continued low levels of exposure may be harmful. Effects on the kidneys and the circulatory, digestive, nervous, and immune systems have been seen in animal tests. Effects were also found in children of mothers who ate fish from the Great Lakes. These fish had large amounts of PCBs. In these children, small head size, reduced visual recognition, and delayed muscle development were reported. Young children may be especially vulnerable to PCBs because of the greater sensitivity of their developing nervous systems. Some PCB mixtures have been shown to cause cancer in animal studies. It is not clear whether similar effects will occur from low levels of PCBs in people. The U.S. EPA rates PCBs as "probable human carcinogens" because they have been shown to cause cancer in animals and are, therefore, presumed to cause cancer in humans. They are also listed under California's Safe Drinking Water and Toxic Enforcement Act of 1986 (Proposition 65). This act regulates the discharge into waterways of chemicals that are known to cause cancer or reproductive harm in humans or animals.
Dioxins Dioxins are also mixtures of chemicals, somewhat similar to PCBs. Dioxins have never had an industrial use. They
come from chemical reactions in industrial processes and from incineration of chemicals containing chlorine. Forest fires can produce dioxins, but most of the environmental contamination is believed to be from human activities. The most hazardous form of dioxin is TCDD (2,3,7,8-tetrachlorodibenzo-p-dioxin), often called simply dioxin. It is a trace component of environmental dioxin mixtures. Dioxins, like PCBs, stay in the environment for a long time. They build up in the food chain, especially in fatty tissues.
Dioxins have been shown to be extremely toxic in laboratory animal studies. They affect multiple organ systems. Reproductive and developmental effects, cancer, and damage to the immune system have been seen in animal studies. TCDD has the highest cancer potency ever found in animal tests. In animal studies, its toxicity to the reproductive and immune systems also occurs at very low doses.
In humans, exposure to dioxin in the workplace has produced chloracne, a severe skin rash. Although no other human diseases have been clearly linked to dioxin exposure, there is concern that dioxins could produce adverse effects in humans similar to those seen in laboratory animal studies. TCDD is considered a probable human carcinogen by U.S. EPA and is listed under Proposition 65.
U.S. EPA is currently conducting a dioxin review. In the draft study released in 1994 for public review and comment, U.S. EPA suggested that total dioxin exposures may already be at a level of concern in some people. However, environmental dioxin levels appear to be decreasing. Improved controls and changes in manufacturing processes have been put in place. Therefore, the long-term situation is improving.
Chlordane This is another long-lasting organochlorine chemical. It was used as a pesticide, particularly for termite control in
homes. Most uses were banned in 1988. It is still found at significant levels in fish and in fatty tissues of animals and people. Significant levels are also often found in soil around the foundations of homes.
Acute exposure to chlordane affects the nervous system and, at very high doses, causes convulsions. Chronic exposures to chlordane can damage the liver and nervous systems. Such effects have been seen in people who were chlordane applicators. Similar effects were also seen in some people exposed to excessive levels of chlordane in the home.
Animal studies show that prenatal exposure can cause damage to the developing nervous and immune systems. Therefore, fetuses and children may be at greater risk than adults from chlordane exposure. Also, because chlordane accumulates in body tissues, and can be passed through breast milk, children and women with childbearing potential should be especially careful to reduce their exposure to chlordane.
Increased tumor rates were reported in several animal studies. In humans, brain tumors and leukemia have been associated with prenatal and early childhood exposures in several studies. Chlordane is rated as a probable human carcinogen by U.S. EPA and is listed under Proposition 65.
The DDT Family (DDT, DDD, and DDE) DDT (dichlorodiphenyltrichloroethane) was banned as a pesticide in the U.S. in 1972. Human exposure to DDT
from general food sources was about 100 times higher during peak use in the early 1970s than it is now. Due to its extreme persistence, however, DDT residues, including DDD and DDE, still remain in the environment and may be found in fish at potentially harmful levels.
DDT has moderate to low acute toxicity. DDD and DDE have similar effects and are usually combined with DDT for hazard estimates. Low-dose chronic exposure in animals can cause liver damage and disrupt the reproductive and
35 Shaw High School
Activities
immune systems. Some studies suggest that DDT exposure can result in chromosomal damage, leukemia, and lung cancer in humans. DDT is also suspected of causing spontaneous abortion and premature births in humans. Children may be at more risk than adults because of effects on the developing nervous system. Exposure levels that were thought to be safe may be reconsidered because of new findings on developmental, reproductive, and immune effects, according to a recent U.S. EPA review. DDT and DDE are considered to be probable human carcinogens by U.S. EPA and are listed under Proposition 65. However, their potential cancer potency is relatively low. Attention has recently focused more on their hormonal and reproductive effects.
Dieldrin This is another of the older organic pesticides. Its use was slowly phased out in the U.S. between 1974 and 1987.
However, dieldrin is still found in soils and sediments because it is a very stable chemical. It also remains for a long time in animal tissues where it builds up in fat. Dieldrin can potentially be very toxic to fish. Dieldrin also comes from the breakdown of aldrin, another banned pesticide.
In humans, acute exposure can cause excess excitability, tremors, convulsions, and liver changes. Liver damage also occurs from chronic exposure. Nervous system changes are also seen in people exposed over a long time. Defects in the developing fetus were reported in animals given very low doses. Dieldrin is considered a probable human carcinogen by U.S. EPA and is listed under Proposition 65. The cancer effect is potent. However, many scientists think it is secondary to dieldrin's strong effects on the liver.
Methylmercury This organic chemical forms in sediments and in animal tissues from metallic mercury or its salts. Mercury ores
are found naturally in several places in northern California. Much of the mercury in waterways is related to past mining activities. Methylmercury builds up in fish, other animals, and in humans. It reacts with proteins and stays in the tissues. Trimming fat from fish will not lower exposure to this chemical as it will for other chemicals.
Methylmercury concentrates in human kidneys. High levels may lead to kidney or circulatory failure. However, damage to the central nervous system can occur at much lower doses after long-term exposure. Tremors, incoordination, and weakness are prominent effects. Very low doses in humans can cause numbness or tingling in the hands or feet. The fetus, infants, and children may be especially sensitive to methylmercury's effects on the nervous system. Problems with mental development and coordination are seen in children of women exposed before and during pregnancy. Methylmercury is listed under Proposition 65 due to its reproductive toxicity.
7. From this article create a list of environmental toxins (besides mercury) that are of concern to the SF bay area. The list should include:
a) Dioxin b) PCB’s c) Clordane d) Dieldrin e) DDT
8. Each group will take a toxin from the above list. Each group should individually and as a group collect information from the internet to answer the following questions.
a) What is their toxin? b) What is it used for? c) How did it get into the bay? d) What are the health concerns to humans?
9. Each group should prepare a poster board explaining their findings and create a list of the Web sites from which they obtained their information.
10.Each group will present the information on their poster boards to the class. Each student should present part of the information.
Household Hazardous Wastes Household Hazardous Wastes Household Hazardous ProductsMarie SteinwachsOffice of Waste Management
A household hazardous product is one whose use or disposal poses a threat to human health or the environment. Hazardous products should not be put in the trash, down the drain, into storm drains or burned unless you are instructed to do so by local waste authorities.
This guide will help you learn to safely handle hazardous products or even find alternatives to hazardous products.
What makes a product hazardous?Products are considered hazardous if they have one or more of the following properties:
• Flammable/combustible
2010 - 2011 36
Household Hazardous Wastes
• Can be easily set on fire.• Explosive/reactive• Can detonate or explode through exposure to heat, sudden shock, pressure or incompatible substances.• Corrosive• Chemical action can burn and destroy living tissues or other materials when brought in contact.• Toxic• Capable of causing injury or death through ingestion, inhalation or skin absorption. Some toxic substances
cause cancer, genetic mutations and fetal harm.
Signal wordsLabels of hazardous products are required by federal law to list signal words. DANGER or POISON indicate that the
product is highly toxic, corrosive or extremely flammable. WARNING or CAUTION indicate that the product is moderately or slightly toxic.
General categories of hazardous productsThousands of consumer products are hazardous, but for ease of remembering, they can be broken into the
following general categories:• Automotive products
• Examples: gasoline, motor oil, antifreeze, windshield wiper fluid, car wax and cleaners, lead-acid batteries, brake fluid, transmission fluid.
• Home improvement products• Examples: paint, varnish, stain, paint thinner, paint stripper, caulk, adhesives.
• Pesticides• Examples: insecticide and insect repellent, weed killer, rat and mouse poison, pet spray and dip, flea
collars, mothballs, disinfectant, wood preservative.
• Household cleaners• Examples: furniture polish and wax, drain opener, oven cleaner, tub and tile cleaner, toilet bowl cleaner,
spot remover, bleach, ammonia.
• Other• Examples: household batteries, cosmetics, pool chemicals, shoe polish, lighter fluid, prescription
medicines, arts and crafts materials.
Think before you buy• Look for safer alternatives to hazardous products.• Buy the least hazardous product. Let the signal words serve as a guide.• Buy only as much of a hazardous product as you need to do the job at hand.• Do not entirely rely on the word "nontoxic" on a product's label. A product that qualifies as nontoxic can still
contain hazardous ingredients, but not in large enough amounts to cause an acute reaction. Chronic hazards often are not considered. Read the entire label for additional health warnings and use good judgment when choosing any product.
• Read the label carefully. Hazardous product labels often list the principal hazards from using the product, such as "flammable," "causes burns to skin and eyes," or "vapor harmful." Make sure it is the product you want to buy and that you are not uncomfortable with the ingredients or the instructions. If label directions instruct you to "avoid breathing vapors" or "avoid skin contact," are you able and willing to follow these safety precautions? If accidental ingestion of the product can cause injury or death, can you safely keep it away from small children?
• Buy hazardous products in childproof packaging.• Check to see if safety equipment is required when using this product. Make sure you have the proper
equipment on hand or that you purchase it for use with the product.• Avoid aerosol products. Aerosol cans disperse the product in tiny droplets that can be deeply inhaled into the
lungs and quickly absorbed into the bloodstream. In addition, aerosols can ignite easily and the cans may explode when subjected to high temperature or pressure.
Use it safely• Read all labels before using hazardous products, paying careful attention to proper use instructions and
dangers.• Twice as much does not mean improved results.• Do not mix products unless instructed by label directions. Mixing products can cause explosive or poisonous
37 Shaw High School

Activities
chemical reactions. Even different brands of the same product may contain incompatible ingredients that may react when mixed together.
• If pregnant, avoid toxic chemical exposure. Many toxic products have not been tested for their effects on unborn children.
• During use, keep hazardous products out of the reach of small children. If the phone rings or you are called out of the room, close the product and take it with you or take the child with you. Do not leave products unattended or unsealed.
• Avoid wearing soft contact lenses when working with solvents and pesticides. They can absorb vapors from the air and hold the chemical against your eyes.
• Do not eat, drink or smoke while using hazardous products. Traces of hazardous chemicals can be carried from hand to mouth. Smoking can start a fire if the product is flammable.
• Use products in well-ventilated areas to avoid inhaling fumes. Try to keep lids closed as much as possible while working with hazardous products to minimize the fumes. Work outdoors whenever possible. When working indoors, open windows and use an exhaust fan. Position the fan to draw air away from the work area to the outdoors. Take plenty of fresh air breaks. If you feel dizzy or nauseous, tightly seal the product, go outside, and take a break.
• Use protective gloves, goggles and respirators that are appropriate to the task if the product presents hazards to skin, eyes or lungs.
• Clean up after using hazardous products. Carefully seal products and properly refasten all caps.
Store it safely• Keep products out of the reach of children and animals. Store all hazardous products away from food items
in locked cabinets or in cabinets with childproof latches. Keep your poison control number posted by the phone in case of an emergency. In Missouri, that phone number is 800-366-8888.
• Make sure lids and caps are tightly sealed and childproof.• Make certain all products are clearly labeled before storing them.• Leave products in their original containers with the contents clearly identified on the labels. Never put
hazardous products in food or beverage containers.• Keep products away from sources of heat, spark, flame or ignition such as pilot lights, switches and motors.
This is especially important with flammable products and aerosol cans.• Store products containing volatile chemicals, or those that warn of vapors or fumes, in a well-ventilated
area.• Never store rags contaminated with flammable solvents (such as wood stain, paint stripper and paint
remover) because they can spontaneously start on fire. Follow the directions on the product label regarding the disposal of solvent-covered rags. If there are no directions, place the rags in an airtight, metal container and store the container outside your house away from other structures until it can be picked up with the trash. Another option is to allow the solvent to volatilize by hanging the contaminated rags outside, away from your home and sources of sparks. For additional information and directions, contact your local fire marshal.
• Store gasoline only in safety-approved containers in a well-ventilated area away from all sources of heat, flame, or spark.
• Store LP (liquid propane) gas tanks, such as those used with gas-fueled barbecue grills, outdoors and away from all sources of heat, flame, or spark.
• Know where flammable materials are located in your home and how to extinguish them. Keep a working ABC-rated, or Multi-Purpose Dry Chemical, fire extinguisher in your home.
• Keep containers dry to prevent corrosion. If a product container is beginning to corrode, place the entire container in a plastic bucket with a tight-fitting lid. Pack non-flammable absorbent, such as clay-based kitty litter, around the container. Clearly label the bucket with its contents and appropriate warnings.
Cleaning up spillsThese directions apply to liquid pesticides, paints, solvents and other household hazardous products.• Remove children and pets from the area where the spill occurred.• Ventilate the area.• Do not attempt to use cleaning products to clean up the spill.• At a minimum, wear the appropriate protective gloves for the product. Other safety equipment may be
required for volatile solvents, pesticides or corrosive products.• Contain the spill to a small area by soaking it up with a non-flammable absorbent, such as clay-based kitty
litter.• Put the contaminated absorbent into a non-corroding container. A plastic bucket with a tight-fitting lid is
recommended.• Seal the container and label it with the product name, approximate amount of product, absorbent material
used, date, and the word DANGER or POISON.
2010 - 2011 38
Household Hazardous Wastes
• Contact local solid waste authorities for information on how to dispose of the contaminated material or save for a household hazardous waste collection.
• After you have absorbed the spill, thoroughly rinse the area several times with water and rags. Then wash the area carefully to remove remaining traces of the product. Never use household brooms or mops to clean the spill since they will become contaminated and must be discarded.
A word on disposalIn most cases, the best thing to do with a leftover product is to use it all according to the label directions or find
someone who will use it. Note: Banned or restricted pesticides, old medicines and products whose safety instructions are no longer readable should not be used or shared.
Some household hazardous wastes, including old lead-acid batteries, button batteries, used motor oil and antifreeze can be recycled. For many household hazardous products there may be no safe disposal available. These products must be stored safely until your community holds a household hazardous waste collection.
Safer alternativesAll-purpose cleaner• Baking soda: Dissolve 4 tablespoons baking soda in 1 quart warm water for a cleaning solution or use baking
soda sprinkled on a damp sponge. Baking soda will clean all kitchen and bathroom surfaces.
Drain cleaner• Prevention: To avoid clogging drains, use a strainer to trap food particles and hair, collect grease in cans
rather than pouring it down the drain, and pour a kettle of boiling water down the drain weekly to melt fat that may be building up in the drain.
• Baking soda and vinegar: Put 1/2 cup baking soda and then 1/2 cup white vinegar down your drain and cover the drain. Let set for a few minutes, then pour a kettle of boiling water down the drain to flush it.
Furniture polish• Olive oil and lemon juice: Mix 2 parts oil and 1 part lemon juice. Apply and polish with a soft cloth.
Lime and mineral deposit remover• Vinegar: Hard lime deposits around faucets can be softened for easy removal by covering the deposits with
vinegar-soaked rags or paper towels. Leave rags or paper towels on for about 1 hour before cleaning. Cleans and shines chrome.
• To remove deposits that may be clogging metal shower heads, combine 1/2 cup white vinegar and 1 quart water. Completely submerge the shower head and boil for 15 minutes. If you have a plastic shower head, combine 1 pint white vinegar and 1 pint hot water. Completely submerge the shower head and soak for about 1 hour.
Metal cleaner/polish• Creme of tartar: To remove stains and discoloration from aluminum cookware, fill cookware with hot water
and add 2 tablespoons creme of tartar to each quart of water. Bring solution to a boil and simmer ten minutes. Wash as usual and dry.
• Worcestershire sauce: Clean and polish unlacquered brass to a shine with a soft cloth dampened with Worcestershire sauce.
• Toothpaste: To clean tarnish off gold and silver (not silver plate), use toothpaste and a soft toothbrush or cloth. Rinse with clean warm water and polish dry.
Pests• Boric acid: Boric acid will kill ants and roaches when spread liberally around the points of entry. Boric acid
has some toxicity and should not be applied to areas where small children and animals are likely to contact it.
Spot remover• Club soda: Rinse or sponge blood and chocolate stains immediately with club soda. Repeat as necessary.
Wash as usual.• Creme of tartar and lemon juice: To remove ink stains, put creme of tartar on the stain and squeeze a few
drops of lemon juice over it. Rub into the stain for a minute, brush off the powder, and sponge with warm water or launder.
1. Look at the list and predict which types of hazardous materials you have in your home. 2. Conduct a survey of the hazardous materials in your home. You can do this with the assistance of this Home
Hazardous Product Survey:
39 Shaw High School

Activities
Number of items Stored safely? (yes/no)
Paints and solvents
Living room
Furniture polish
Spot remover
Bathroom
Nail polish/remover
Workbench
Paint
Varnish
Paint thinner
Furniture stripper
Glue
Total number of paints and solvents:
Household cleaners
Kitchen/bathroom
Drain cleaner
Oven cleaner
Floor cleaner
Disinfectant
Ammonia
Scouring powder
Laundry room
Bleach
Laundry detergent
Total number of household cleaners
Pesticides
Lawn
Weed killers
Insecticides
Bug repellent
Flea spray/collars
Fertilizers
Total number of pesticides
Automotive products
Garage
Car wax
Motor oil
2010 - 2011 40

Household Hazardous Wastes
Number of items Stored safely? (yes/no)
Gasoline
Kerosene
Antifreeze
Total number of automotive products
Other products
Around the house
Air fresheners
Aerosol sprays
Household batteries
Button batteries
Pool chemicals
Other
Total number of other products
Total number of hazardous products in your home
Student's name:
Parent's signature:
Date:
3. Compile data into a class tally of the hazardous products found in homes: a) Record the class totals of household hazardous products for each category. b) Calculate the average number of products for each category and the total. c) Calculate the total number of household hazardous wastes in your community based on the information given in
class.
Number of households surveyed in your class = (hh)
Category Class total Class average
Paints and solvents /hh=
Pesticides /hh=
Household cleaners /hh=
Automotive products /hh=
Other products /hh=
Total /hh=Number of households in your community = (d)Total number of household hazardous products in your community (estimate) = (c x d)
4. Use the following Web sites to find out what happens to these toxic materials when they are not properly discarded and to learn about appropriate disposal techniques. As you go through the sites, write the answers to these questions:
a) What happens to household waste that's flushed down the toilet or poured into the drain? Where do these materials end up?
b) What are storm drains? What is their role in hazardous waste disposal? Do storm drains work the same all over the country, or are there variations?
c) What are the proper disposal methods for the top five toxic products that the class has found in its homes? d) What are the consequences of these hazardous materials being improperly disposed?
5. Is there a storm drain system here? If so, do the materials that end up in this system enter the sewage treatment system, or do they go directly into a river or other body of water? If not, what happens to the rainwater that falls
41 Shaw High School
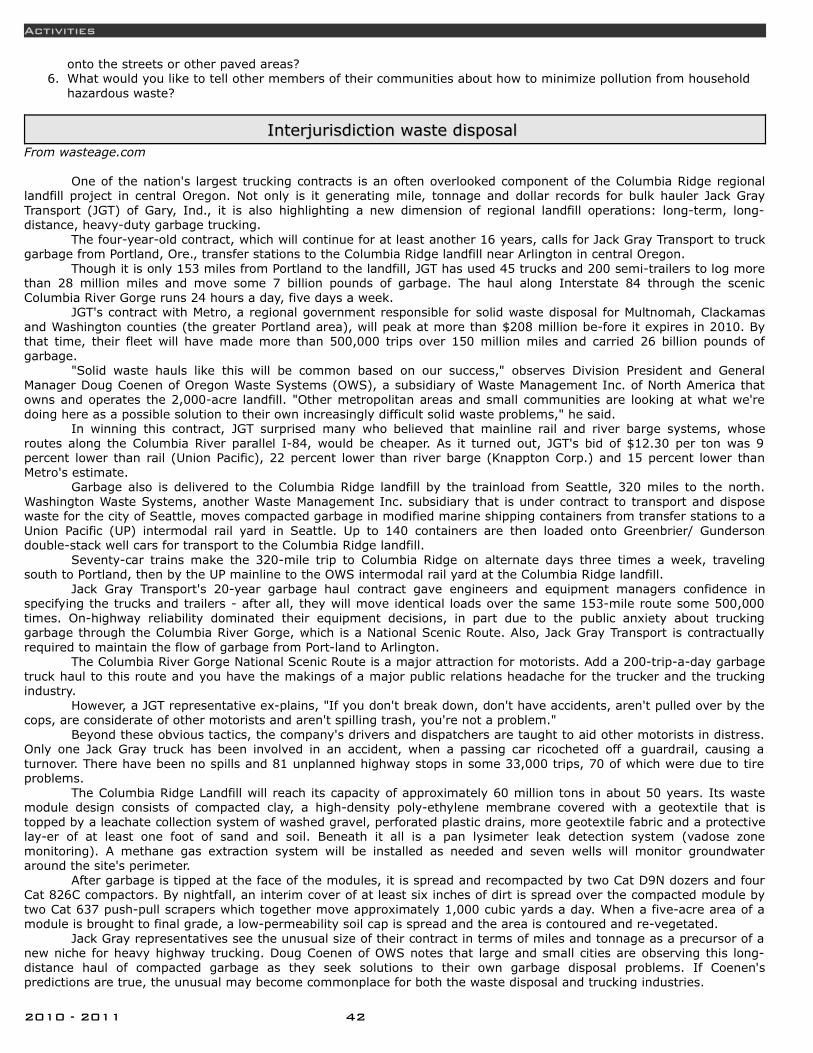
Activities
onto the streets or other paved areas? 6. What would you like to tell other members of their communities about how to minimize pollution from household
hazardous waste?
Interjurisdiction waste disposal Interjurisdiction waste disposal From wasteage.com
One of the nation's largest trucking contracts is an often overlooked component of the Columbia Ridge regional landfill project in central Oregon. Not only is it generating mile, tonnage and dollar records for bulk hauler Jack Gray Transport (JGT) of Gary, Ind., it is also highlighting a new dimension of regional landfill operations: long-term, long-distance, heavy-duty garbage trucking.
The four-year-old contract, which will continue for at least another 16 years, calls for Jack Gray Transport to truck garbage from Portland, Ore., transfer stations to the Columbia Ridge landfill near Arlington in central Oregon.
Though it is only 153 miles from Portland to the landfill, JGT has used 45 trucks and 200 semi-trailers to log more than 28 million miles and move some 7 billion pounds of garbage. The haul along Interstate 84 through the scenic Columbia River Gorge runs 24 hours a day, five days a week.
JGT's contract with Metro, a regional government responsible for solid waste disposal for Multnomah, Clackamas and Washington counties (the greater Portland area), will peak at more than $208 million be-fore it expires in 2010. By that time, their fleet will have made more than 500,000 trips over 150 million miles and carried 26 billion pounds of garbage.
"Solid waste hauls like this will be common based on our success," observes Division President and General Manager Doug Coenen of Oregon Waste Systems (OWS), a subsidiary of Waste Management Inc. of North America that owns and operates the 2,000-acre landfill. "Other metropolitan areas and small communities are looking at what we're doing here as a possible solution to their own increasingly difficult solid waste problems," he said.
In winning this contract, JGT surprised many who believed that mainline rail and river barge systems, whose routes along the Columbia River parallel I-84, would be cheaper. As it turned out, JGT's bid of $12.30 per ton was 9 percent lower than rail (Union Pacific), 22 percent lower than river barge (Knappton Corp.) and 15 percent lower than Metro's estimate.
Garbage also is delivered to the Columbia Ridge landfill by the trainload from Seattle, 320 miles to the north. Washington Waste Systems, another Waste Management Inc. subsidiary that is under contract to transport and dispose waste for the city of Seattle, moves compacted garbage in modified marine shipping containers from transfer stations to a Union Pacific (UP) intermodal rail yard in Seattle. Up to 140 containers are then loaded onto Greenbrier/ Gunderson double-stack well cars for transport to the Columbia Ridge landfill.
Seventy-car trains make the 320-mile trip to Columbia Ridge on alternate days three times a week, traveling south to Portland, then by the UP mainline to the OWS intermodal rail yard at the Columbia Ridge landfill.
Jack Gray Transport's 20-year garbage haul contract gave engineers and equipment managers confidence in specifying the trucks and trailers - after all, they will move identical loads over the same 153-mile route some 500,000 times. On-highway reliability dominated their equipment decisions, in part due to the public anxiety about trucking garbage through the Columbia River Gorge, which is a National Scenic Route. Also, Jack Gray Transport is contractually required to maintain the flow of garbage from Port-land to Arlington.
The Columbia River Gorge National Scenic Route is a major attraction for motorists. Add a 200-trip-a-day garbage truck haul to this route and you have the makings of a major public relations headache for the trucker and the trucking industry.
However, a JGT representative ex-plains, "If you don't break down, don't have accidents, aren't pulled over by the cops, are considerate of other motorists and aren't spilling trash, you're not a problem."
Beyond these obvious tactics, the company's drivers and dispatchers are taught to aid other motorists in distress. Only one Jack Gray truck has been involved in an accident, when a passing car ricocheted off a guardrail, causing a turnover. There have been no spills and 81 unplanned highway stops in some 33,000 trips, 70 of which were due to tire problems.
The Columbia Ridge Landfill will reach its capacity of approximately 60 million tons in about 50 years. Its waste module design consists of compacted clay, a high-density poly-ethylene membrane covered with a geotextile that is topped by a leachate collection system of washed gravel, perforated plastic drains, more geotextile fabric and a protective lay-er of at least one foot of sand and soil. Beneath it all is a pan lysimeter leak detection system (vadose zone monitoring). A methane gas extraction system will be installed as needed and seven wells will monitor groundwater around the site's perimeter.
After garbage is tipped at the face of the modules, it is spread and recompacted by two Cat D9N dozers and four Cat 826C compactors. By nightfall, an interim cover of at least six inches of dirt is spread over the compacted module by two Cat 637 push-pull scrapers which together move approximately 1,000 cubic yards a day. When a five-acre area of a module is brought to final grade, a low-permeability soil cap is spread and the area is contoured and re-vegetated.
Jack Gray representatives see the unusual size of their contract in terms of miles and tonnage as a precursor of a new niche for heavy highway trucking. Doug Coenen of OWS notes that large and small cities are observing this long-distance haul of compacted garbage as they seek solutions to their own garbage disposal problems. If Coenen's predictions are true, the unusual may become commonplace for both the waste disposal and trucking industries.
2010 - 2011 42
Interjurisdiction waste disposal
1. What is Jack Gray Trucking doing? 2. Why is there a need to do this? 3. Do you think this long-term contract is a good idea? Identify some pros and cons to the trucking of garbage in this
area. 4. Research the Mobro 4000 barge on the internet. What are some lessons that were learned from this event that
could be applied to the above?
U.S. Standard of LivingU.S. Standard of LivingWe will investigate what it might involve in order for developing countries to reach a U.S. Standard of living and
the impact on the world's oil supply. A country's standard of living may be estimated by dividing the total annual value (in dollars) of goods and services (the GDP) by a country's population, to derive the average per capita GDP. For example, take the 2009 GDP ($14260 billion) and divide it by the population (approximately 308 million).
1. What was the U.S. GDP for 2009?
Global product, the combined value of goods and services of all the world's nations, is harder to measure, but according to the International Monetary Fund it was approximately $57,938 billion in 2009.
2. Given a global population of approximately 6.7 billion in 2009, calculate the gross global per capita product (GGP) for 2009.
3. By what factor (2x, 4x, etc.) would the GDP have to be increased to equal the U.S. GDP?
According to the Energy Information Administration, the transportation sector consumes about 28% of all U.S. Domestic energy. In 2009, global oil production was about 85 million barrels per day, and the U.S. Alone consumed 20.7 million barrels per day.
4. What percentage of the world oil production for 2009 was consumed by the U.S.?
Oil is necessary for the American standard of living. For example, it's essential to American agriculture for fertilizers, pesticides, irrigation and for machines that take the place of human labor. However, quality of life is different that standard of living. Measuring quality of life consists largely of evaluating intangibles like clean drinking water, unpolluted air, quiet and solitude, having alternatives to automobiles and clogged roads, access to quality medical care, having good jobs, safe environments and a secure old age. We can still get some idea of what would be needed to allow the rest of the world to enjoy a U.S. Lifestyle by analyzing oil consumption, and coming up with per capita oil consumption.
5. Using the data on U.S. oil consumption and population, calculate the U.S. per capita oil consumption in 2009 (barrels per person per year). How many gallons is that, if there are 42 gallons per barrel?
6. To calculate world oil consumption at U.S. levels, multiply the U.S. per capita consumption figure by 2009 world population.
7. Let's assume that the U.S. consumption were to drop by a drastic and revolutionary 25% to roughly that of the European Union. In this new scenario, world oil production would have to increase by what factor to bring the world's countries to the level of Western Europe?
8. Given a world population growth rate of 1.17% per year, how long would it take the world's population to double? By what year would this doubling occur?
9. Multiply this new, doubled world population by the figure from #1. How much oil must be produced annually by the year that the doubling occurred in #8?
10. Known petroleum reserves are 1348 billion barrels. Ultimate reserves may exceed 2000 billion barrels. Compare the annual oil demand of a doubled world population consuming at U.S. levels to the 2009 proven oil reserves of 1348 billion barrels and to probable ultimate reserves of 2000 billion barrels.
11. Evaluate the impact on air pollution if that were to occur.12. Estimate how many more years of oil is left if consumed at current rates.
Environmental legislation Environmental legislation
From The College Board: Environmental Science
In an effort to make sense of the many laws that are associated with environmental issues, we are going to do a project that will result in a summary of important legislation. You will work with a partner and be responsible for researching an assigned regulation or act, and you will discover the answers to the following questions. Most of the information will be found in your textbook or on the internet (start at the “U.S. Environmental Protection Agency” link). Answer the following:
43 Shaw High School
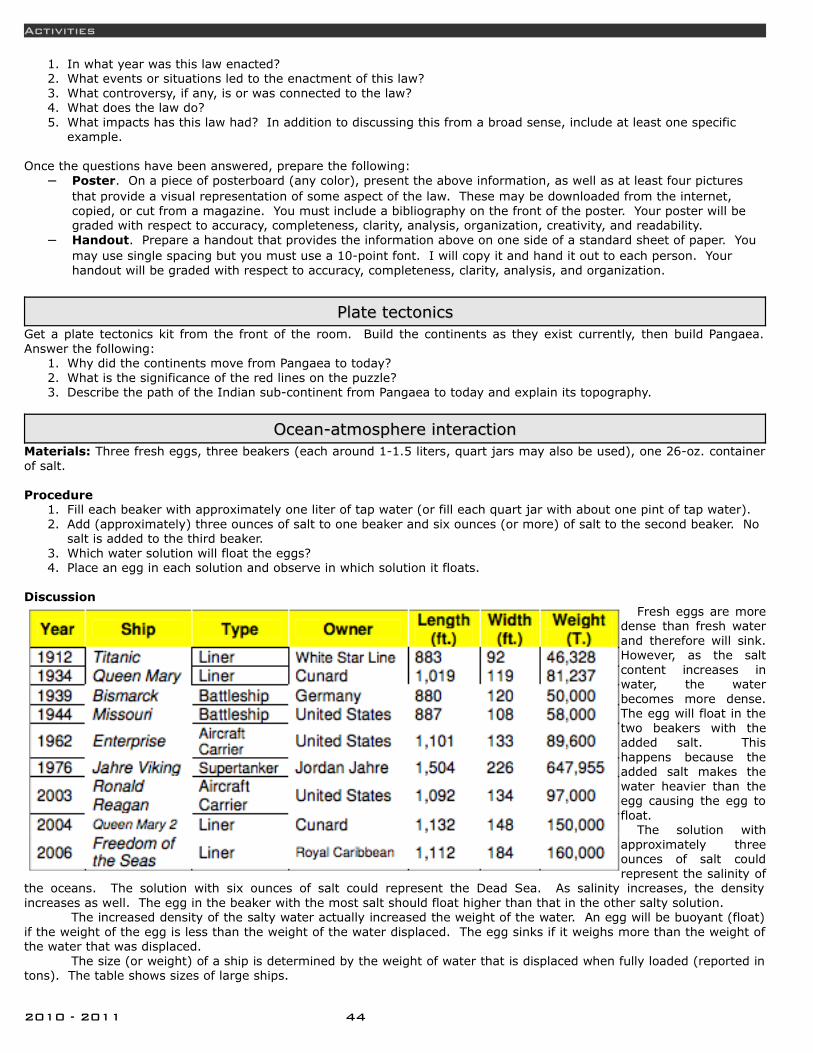
Activities
1. In what year was this law enacted? 2. What events or situations led to the enactment of this law? 3. What controversy, if any, is or was connected to the law? 4. What does the law do? 5. What impacts has this law had? In addition to discussing this from a broad sense, include at least one specific
example.
Once the questions have been answered, prepare the following:– Poster. On a piece of posterboard (any color), present the above information, as well as at least four pictures
that provide a visual representation of some aspect of the law. These may be downloaded from the internet, copied, or cut from a magazine. You must include a bibliography on the front of the poster. Your poster will be graded with respect to accuracy, completeness, clarity, analysis, organization, creativity, and readability.
– Handout. Prepare a handout that provides the information above on one side of a standard sheet of paper. You may use single spacing but you must use a 10-point font. I will copy it and hand it out to each person. Your handout will be graded with respect to accuracy, completeness, clarity, analysis, and organization.
Plate tectonicsPlate tectonicsGet a plate tectonics kit from the front of the room. Build the continents as they exist currently, then build Pangaea. Answer the following:
1. Why did the continents move from Pangaea to today? 2. What is the significance of the red lines on the puzzle? 3. Describe the path of the Indian sub-continent from Pangaea to today and explain its topography.
Ocean-atmosphere interactionOcean-atmosphere interactionMaterials: Three fresh eggs, three beakers (each around 1-1.5 liters, quart jars may also be used), one 26-oz. container of salt. Procedure
1. Fill each beaker with approximately one liter of tap water (or fill each quart jar with about one pint of tap water). 2. Add (approximately) three ounces of salt to one beaker and six ounces (or more) of salt to the second beaker. No
salt is added to the third beaker. 3. Which water solution will float the eggs? 4. Place an egg in each solution and observe in which solution it floats.
Discussion
Fresh eggs are more dense than fresh water and therefore will sink. However, as the salt content increases in water, the water becomes more dense. The egg will float in the two beakers with the added salt. This happens because the added salt makes the water heavier than the egg causing the egg to float.
The solution with approximately three ounces of salt could represent the salinity of
the oceans. The solution with six ounces of salt could represent the Dead Sea. As salinity increases, the density increases as well. The egg in the beaker with the most salt should float higher than that in the other salty solution.
The increased density of the salty water actually increased the weight of the water. An egg will be buoyant (float) if the weight of the egg is less than the weight of the water displaced. The egg sinks if it weighs more than the weight of the water that was displaced.
The size (or weight) of a ship is determined by the weight of water that is displaced when fully loaded (reported in tons). The table shows sizes of large ships.
2010 - 2011 44
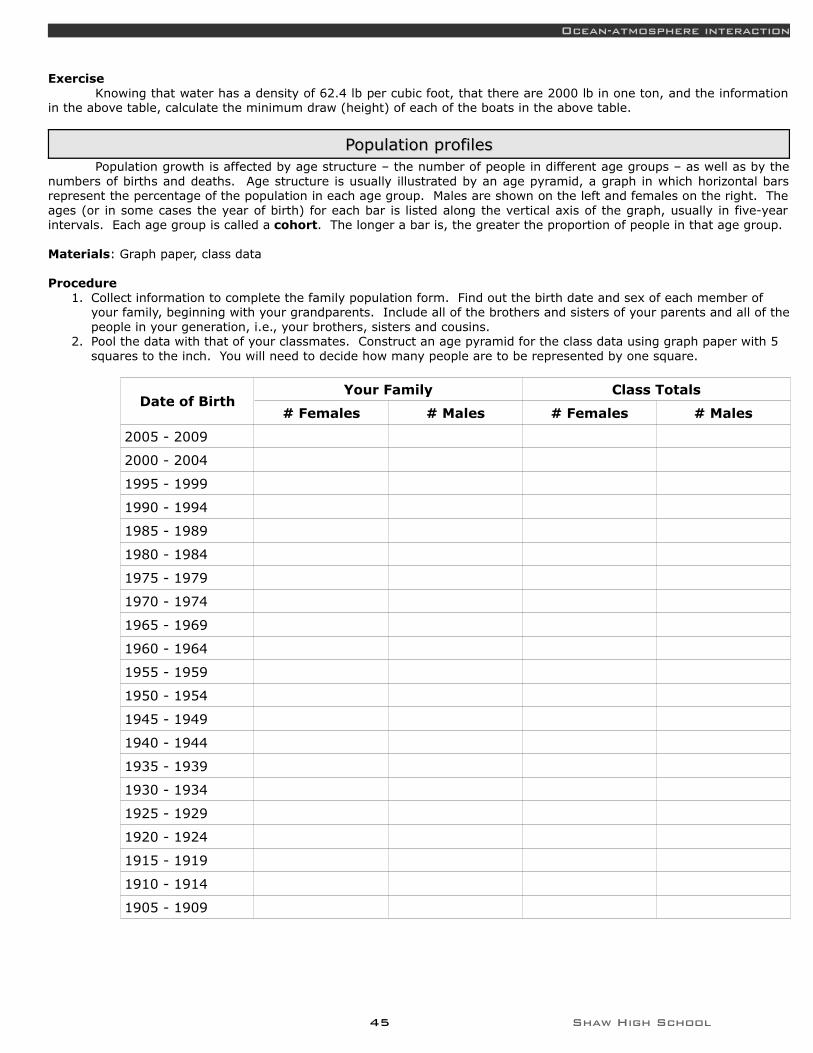
Ocean-atmosphere interaction
ExerciseKnowing that water has a density of 62.4 lb per cubic foot, that there are 2000 lb in one ton, and the information
in the above table, calculate the minimum draw (height) of each of the boats in the above table.
Population profilesPopulation profilesPopulation growth is affected by age structure – the number of people in different age groups – as well as by the
numbers of births and deaths. Age structure is usually illustrated by an age pyramid, a graph in which horizontal bars represent the percentage of the population in each age group. Males are shown on the left and females on the right. The ages (or in some cases the year of birth) for each bar is listed along the vertical axis of the graph, usually in five-year intervals. Each age group is called a cohort. The longer a bar is, the greater the proportion of people in that age group.
Materials: Graph paper, class data
Procedure 1. Collect information to complete the family population form. Find out the birth date and sex of each member of
your family, beginning with your grandparents. Include all of the brothers and sisters of your parents and all of the people in your generation, i.e., your brothers, sisters and cousins.
2. Pool the data with that of your classmates. Construct an age pyramid for the class data using graph paper with 5 squares to the inch. You will need to decide how many people are to be represented by one square.
Date of BirthYour Family Class Totals
# Females # Males # Females # Males
2005 - 2009
2000 - 2004
1995 - 1999
1990 - 1994
1985 - 1989
1980 - 1984
1975 - 1979
1970 - 1974
1965 - 1969
1960 - 1964
1955 - 1959
1950 - 1954
1945 - 1949
1940 - 1944
1935 - 1939
1930 - 1934
1925 - 1929
1920 - 1924
1915 - 1919
1910 - 1914
1905 - 1909
45 Shaw High School

Activities
Discussion 1. What is the percentage of people under 20? Over 60? Is the population a young, growing one; declining one, or a
stable one? 2. Is there evidence in the diagram of the baby boom that followed World War II (1946 – 1964)? If so, is there
evidence of the effect of this baby boom in more recent years? 3. From the class data, determine the average number of children per couple for each generation and compare the
averages to the replacement level of 2.1 children per couple. Describe any changes that have occurred in family size over generations.
4. How does the pyramid for the class compare to that for Ohio? If Ohio is now at, or slightly below, the replacement level, why is the population of the state still growing?
Calculating growth ratesCalculating growth ratesBackground
A simple model of population growth would add the individuals born and those that immigrated into the population during a given time period (such as a year) and subtract those who died and those who emigrated during the same time period to the numbers that were present for the population at the beginning of the time period (such as the beginning of the year). An equation to represent this model is: P2 = P1 + (B – D) + (I – E)
P2 = final populationP1 = initial populationB = number of births over time periodD = number of deaths over time periodI = number of immigrants over time periodE = number of emigrants over time period
Allowing ∆P to represent P2 – P1, ∆t to represent the time interval, and ignoring migration, we have: ∆P = (B-D) ∆t
Usually B – D is given the symbol r and is called the natural rate of increase. Often B and D are given as a percentage of the total population. The difference between B and D then becomes the percentage rate of increase. A
2010 - 2011 46
Age Pyramid for Ohio
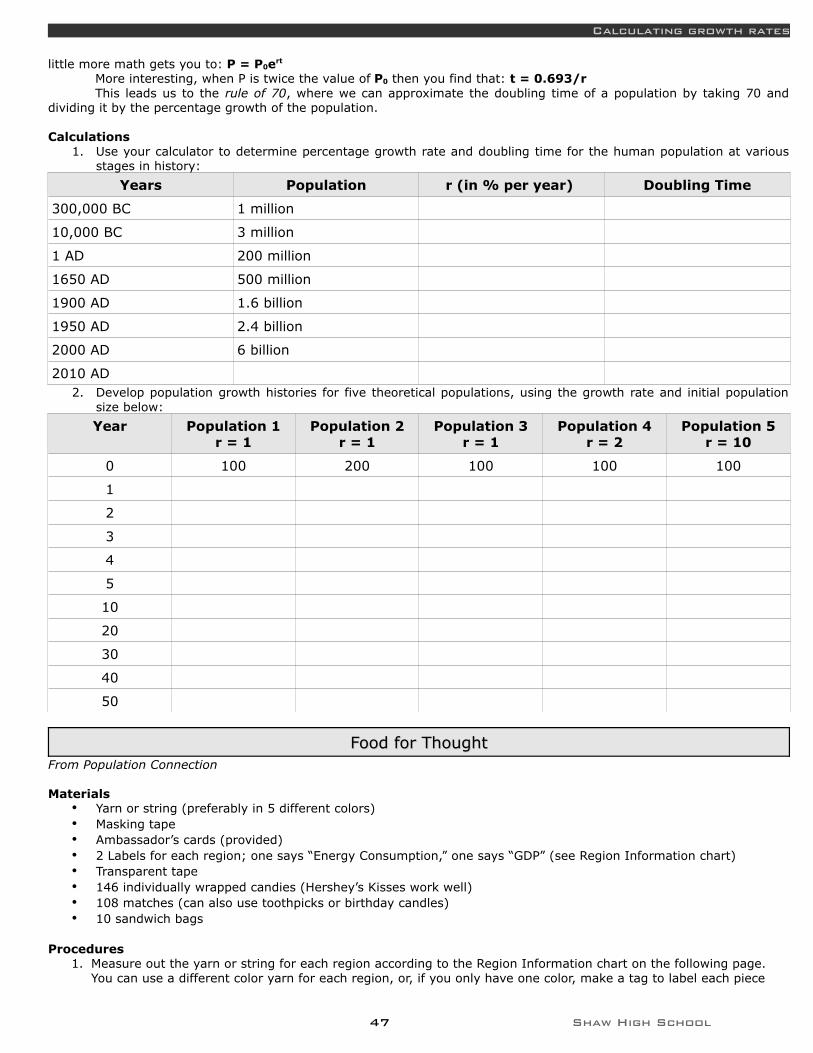
Calculating growth rates
little more math gets you to: P = P0ert
More interesting, when P is twice the value of P0 then you find that: t = 0.693/rThis leads us to the rule of 70, where we can approximate the doubling time of a population by taking 70 and
dividing it by the percentage growth of the population.
Calculations1. Use your calculator to determine percentage growth rate and doubling time for the human population at various
stages in history:
Years Population r (in % per year) Doubling Time
300,000 BC 1 million
10,000 BC 3 million
1 AD 200 million
1650 AD 500 million
1900 AD 1.6 billion
1950 AD 2.4 billion
2000 AD 6 billion
2010 AD2. Develop population growth histories for five theoretical populations, using the growth rate and initial population
size below:
Year Population 1r = 1
Population 2r = 1
Population 3r = 1
Population 4r = 2
Population 5r = 10
0 100 200 100 100 100
1
2
3
4
5
10
20
30
40
50
Food for ThoughtFood for ThoughtFrom Population Connection
Materials • Yarn or string (preferably in 5 different colors) • Masking tape • Ambassador’s cards (provided) • 2 Labels for each region; one says “Energy Consumption,” one says “GDP” (see Region Information chart) • Transparent tape • 146 individually wrapped candies (Hershey’s Kisses work well) • 108 matches (can also use toothpicks or birthday candles) • 10 sandwich bags
Procedures 1. Measure out the yarn or string for each region according to the Region Information chart on the following page.
You can use a different color yarn for each region, or, if you only have one color, make a tag to label each piece
47 Shaw High School
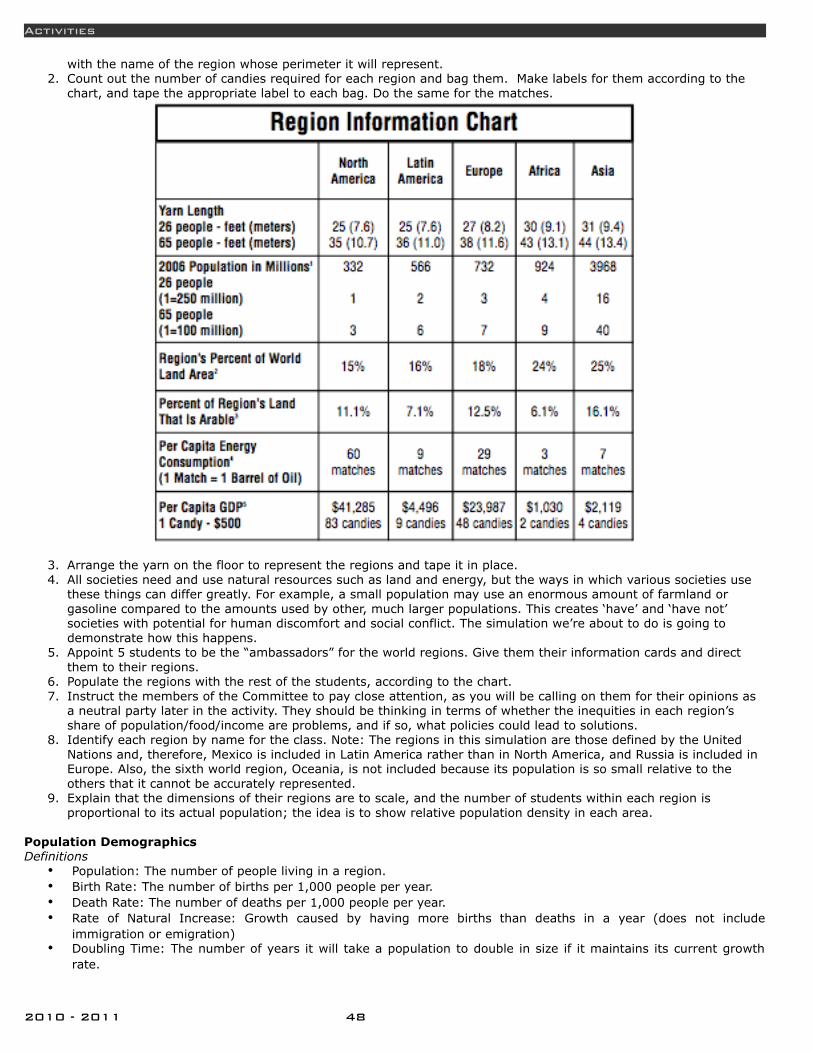
Activities
with the name of the region whose perimeter it will represent. 2. Count out the number of candies required for each region and bag them. Make labels for them according to the
chart, and tape the appropriate label to each bag. Do the same for the matches.
3. Arrange the yarn on the floor to represent the regions and tape it in place. 4. All societies need and use natural resources such as land and energy, but the ways in which various societies use
these things can differ greatly. For example, a small population may use an enormous amount of farmland or gasoline compared to the amounts used by other, much larger populations. This creates ‘have’ and ‘have not’ societies with potential for human discomfort and social conflict. The simulation we’re about to do is going to demonstrate how this happens.
5. Appoint 5 students to be the “ambassadors” for the world regions. Give them their information cards and direct them to their regions.
6. Populate the regions with the rest of the students, according to the chart. 7. Instruct the members of the Committee to pay close attention, as you will be calling on them for their opinions as
a neutral party later in the activity. They should be thinking in terms of whether the inequities in each region’s share of population/food/income are problems, and if so, what policies could lead to solutions.
8. Identify each region by name for the class. Note: The regions in this simulation are those defined by the United Nations and, therefore, Mexico is included in Latin America rather than in North America, and Russia is included in Europe. Also, the sixth world region, Oceania, is not included because its population is so small relative to the others that it cannot be accurately represented.
9. Explain that the dimensions of their regions are to scale, and the number of students within each region is proportional to its actual population; the idea is to show relative population density in each area.
Population Demographics Definitions
• Population: The number of people living in a region.• Birth Rate: The number of births per 1,000 people per year.• Death Rate: The number of deaths per 1,000 people per year.• Rate of Natural Increase: Growth caused by having more births than deaths in a year (does not include
immigration or emigration)• Doubling Time: The number of years it will take a population to double in size if it maintains its current growth
rate.
2010 - 2011 48
Food for Thought
World Population Demographics • The 2006 world population is 6.5 billion• The birth rate is 21 per 1,000.• The death rate is 9 per 1,000.• The world’s annual growth rate is 1.2%.• At this rate the world’s population will double to 13 billion in 58 years.
Supplemental Information Regarding population growth rates:
• A population grows whenever its birth rate is higher than its death rate. • The growth rate is determined by the size of the difference between the birth and death rates. The closer these
rates are, the lower the growth rate. • Where birth and death rates are equal, the population’s growth rate is zero. • The world’s current birth rate is almost two and a half times its death rate.
Ambassadors Read Statistics A-E from Their Cards
Discussion Questions 1. What will it mean to have our population double? What else will we need to have twice as much of to provide for all
those people? We’ll need twice as much of everything people need to live: a) food b) schools c) land to grow the food on d) hospitals e) clean water f) roads g) shelter h) energy to heat our homes i) cook our food
2. Asia’s doubling time is 58 years. If we returned in 58 years and did this exercise again, would we be able to fit twice as many people into Asia’s space?
Quality of Life Definitions
• Literacy Rate: The ability of an individual to read and write with understanding a simple short statement related to his/her everyday life.
• Total Fertility Rate: The average number of children a woman will have in her lifetime.• Infant Mortality Rate: The yearly number of children who die before reaching the age of one year per 1,000 live
births.• Life Expectancy: The average number of years a person born today could expect to live under current mortality
rates.• Access to Adequate Sanitation: Percentage of population with access to toilets or latrines.• Medical Doctors: The number of people per one medical doctor.
Worldwide Quality of Life • Of the world’s 12-17 year olds, 66% of boys and 63% of girls are enrolled in school.• The world’s women bear an average of 2.7 children.• The world infant mortality rate is 52 per 1,000.• The average human life expectancy at birth is 67 years.• Only 59% of the world’s population have access to adequate sanitation.• On average, there is one medical doctor per 709 people in the world.
Supplemental Information • Disease rates are also indicators of a region’s quality of life. Worldwide, 1.0% age 15-49 of the population lives
with HIV/AIDS. In sub-Saharan Africa, 6.1% of the 15-49 year old population is infected with HIV/AIDS. This significantly affects the labor force and child care in the region.
Ambassadors Read Statistics F-K from Their Cards
Discussion Questions 1. Can you see any connection between Africa’s unusually high infant mortality rate of 84 per 1,000 (almost 1 in 12),
and its high total fertility rate of 5.1 children per woman? When people know each of their children has almost a
49 Shaw High School
Activities
10% chance of not surviving to adulthood, they will have more children to increase the likelihood that some will survive. This is especially crucial for people living in societies w h e re there is no social security and no retirement plans, where the elderly are entirely dependent on their children for care and financial support.
2. Infant mortality rates are consistently lower when girls have access to higher education. Is there a correlation here? What abilities and/or knowledge do educated people have that might be useful to them as parents? Literacy (including reading and basic math): Parents with these abilities can:
a) read directions, such as those on over-the-counter medicines and infant formula. b) educate themselves about any subject, including child development and care. c) get better jobs and earn more money. d) Health/Biology: Exposure to these subjects makes people more aware of how to take good care of themselves
and their children. They understand the importance of: • good nutrition • medical care, especially perinatal care
3. What do indicators like a high infant mortality rate, limited access to decent sanitation facilities, and short life expectancy say about the quality of life in a region?
a) What are some possible causes? Possibilities include: • Food that’s insufficient in quantity or nutritional value • Lack of clean water • Low quality medical care or none at all • Exposure to high levels of pollution • War or political violence
Land Use Patterns Definitions
• Urban Population: Percentage of the total population living in areas termed urban by that country (typically towns of 2,000 or more or in national or provincial capitals).
• Arable Land: Farmland; land capable of growing crops.
Worldwide Land Use Patterns • 48% of the world’s population (about 2.9 billion people) now live in urban areas.• There are 0.6 acres of arable land per person on Earth.
Supplemental Information Regarding Urbanization:
• The rate of urbanization is changing rapidly, as more and more people move to cities worldwide. • In the developing world, about 41% of the population lives in urban areas. While urbanization has traditionally
meant more industrialization and job opportunities, many megacities in developing countries lack a strong economic foundation upon which to base growth. As the population grows, the economic, social, and environmental problems in these cities grow as well.
• In the developed world - especially North America - most of the current population shift involves people moving away from concentrated urban centers to sprawling suburban and metropolitan regions, or to small and intermediate-size cities.
Regarding Arable Land: • The lowest authoritative estimate of the minimum amount of arable land required to feed one person — without
intensive use of synthetic fertilizers — is 0.17 acres. (This doesn’t include crops for textiles or cash crops needed for income.)
Ambassadors Read Statistics L and M from Their Cards
Discussion Questions 1. How will population growth affect the amount of arable land available per person? When people share a limited
resource such as arable land, each person’s share of that resource becomes smaller in direct proportion to the number of additional people using it.
2. What would it mean for a country to have its amount of arable land per capita fall below the minimum required to grow enough food to sustain its population? Such a country would become dependent on imported foods, making it vulnerable to price hikes and shortages.
3. What do you think usually causes people to move to cities? The shift of jobs from agriculture to industry and services — leading to a concentration of economic opportunities in urban areas.
4. What are some possible positive and negative effects of having such large proportions of countries’ populations shifting to urban areas?
2010 - 2011 50

Food for Thought
Energy Consumption and Wealth Definitions
• Energy Consumption: The total amount of energy used by each region per year divided by the number of people living in that region — includes industrial use.
• Gross Domestic Product: A commonly used measure of a nation’s wealth, determined from the annual profits generated within a region by all goods and services exchanged that year.
Symbolism of Props Regarding the matches:
• While energy is generated in many ways, including wood, coal, natural gas and nuclear power, in this activity, all these sources have been combined and are expressed in terms of barrels of oil.
• These matches represent the average amount of energy consumed by each citizen of each region in the course of a year.
• Each match = the amount of energy generated from burning 1 barrel of oil. One barrel contains 42 gallons.
Regarding the candies: • The candies represent the amount each person would get per year if his/her region’s annual GDP were divided
equally among all its citizens, expressed here in U.S. currency. This is also considered to be an indicator of average annual income.
• Each Kiss = $500.
Distribute Bags to Ambassadors • Start with the country whose amount is the smallest and work up to the country whose share is largest. • Hold each bag up high so the whole class can see it. • From the labels, read aloud each region’s quantity.
Instruct Ambassadors to Distribute the Candy Among Their Citizens • Expect and allow students to migrate and ask for aid. • Assist them in making connections between their reactions to the simulation and real-world phenomena.
Discussion Questions 1. What would it be like in this room if we lit all these matches? 2. Who would have to breathe all that smoke? Would only the citizens of North America be breathing the pollution
generated by their 60 matches? 3. What do the people in our Asian and African regions think about the fact that the North Americans have a bag
bulging with wealth, when they have so little? 4. How could/do people from regions with less wealth and opportunity get access to those things? 5. What does the North American Ambassador think about the uneven distribution of wealth? What does he/she want
to do about it? 6. How will the wealthier regions decide to which countries they will offer foreign aid? What, if any, conditions will you
impose on nations receiving your help? Will you trust the countries receiving money from you to put it to good use, or will you attempt to control what is done with it?
7. How will the less densely populated regions decide from which countries they will accept immigrants? What, if any, conditions will you impose on people seeking permission to immigrate? Will you accept only very well-educated people, or will you base your decision on need — giving preference to those with the least opportunity in their home countries? Or those suffering political persecution? Or refugees from war-torn nations? Or would it be based solely on numbers, first-come, first-served?
8. In the process of eating the candies, which region generated the most empty wrappers? Do you think this is an accurate representation of how much garbage each country creates as a function of its wealth and consumption?
9. [Good for the United Nations Advisory Committee, if you have one.] What does the group think should be done about the inequitable distribution of wealth and consumption of resources? Do donor nations have the right or obligation to link aid to certain policies that might enable recipient countries to become self-sufficient in the future? What might those be? Should rich countries be required to reduce their consumption levels? How could this be encouraged or enforced? What should be done about environmental problems (acid rain, ozone depletion) caused by one region, but affecting others?
51 Shaw High School
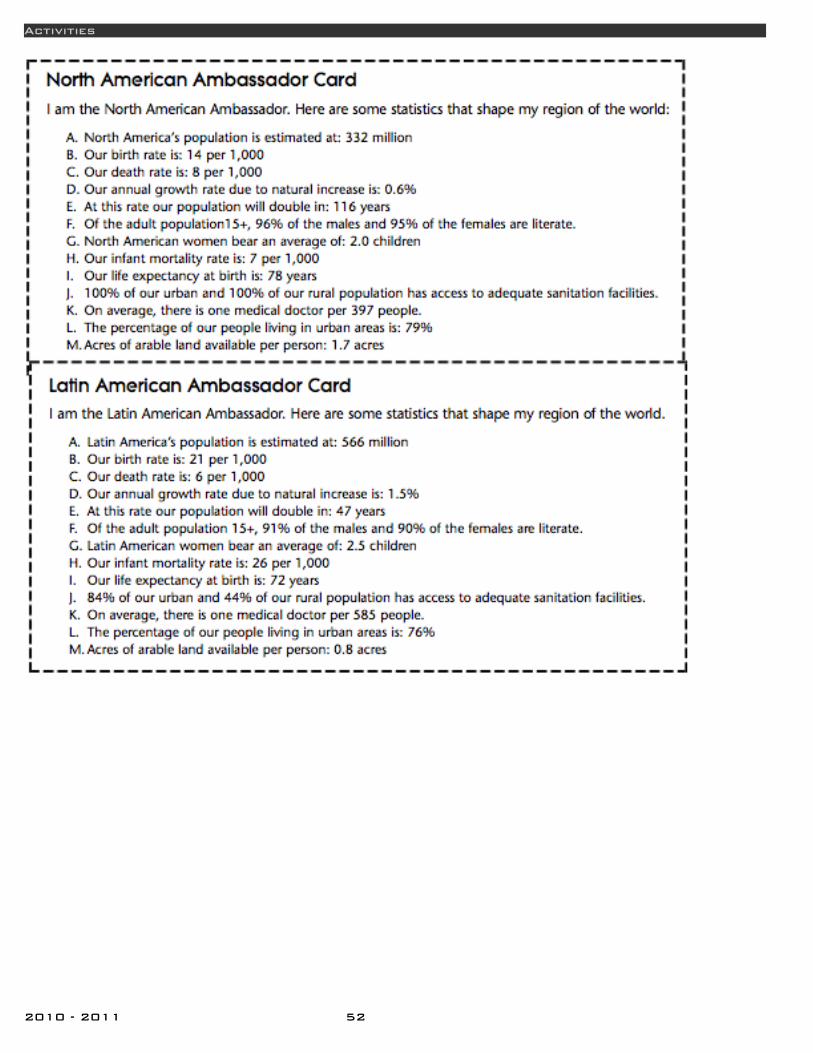
Activities
2010 - 2011 52
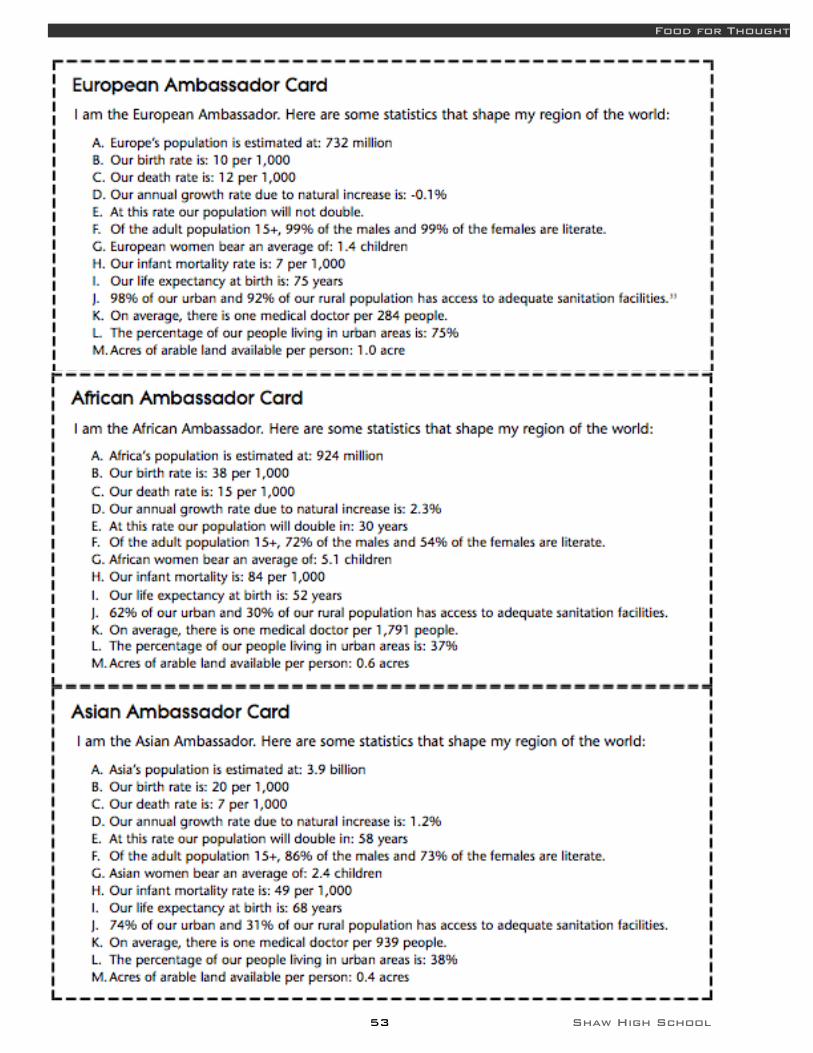
Food for Thought
53 Shaw High School
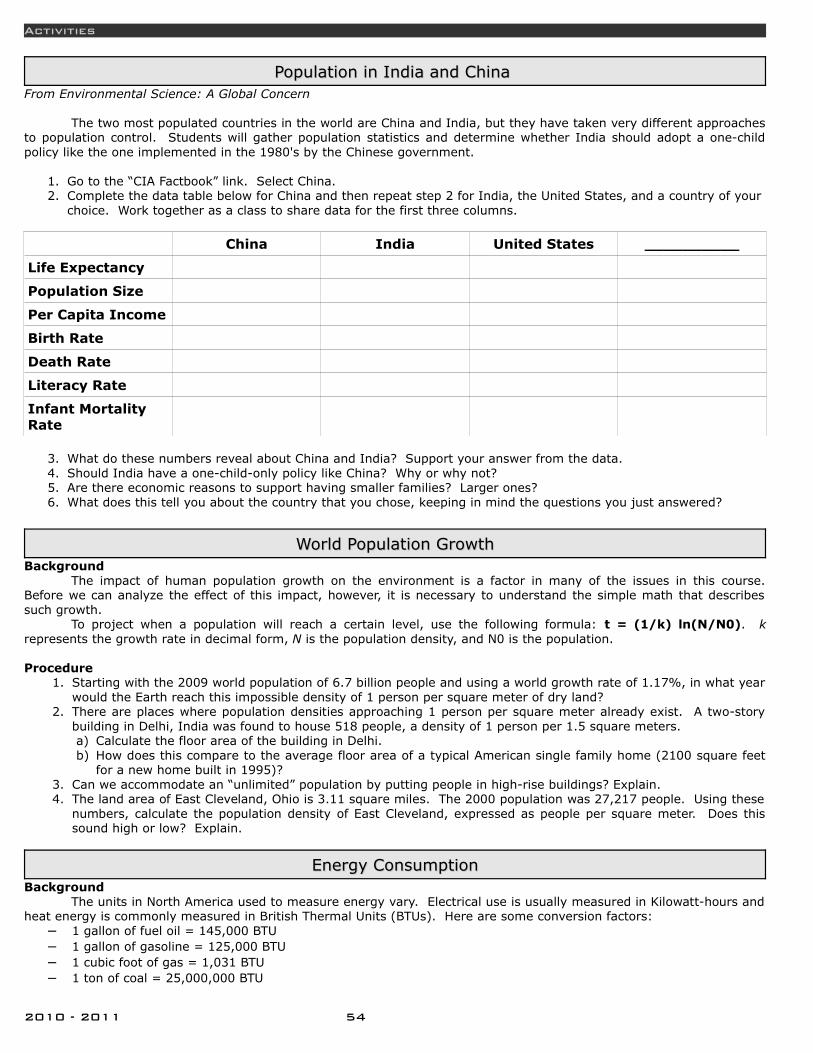
Activities
Population in India and China Population in India and China From Environmental Science: A Global Concern
The two most populated countries in the world are China and India, but they have taken very different approaches to population control. Students will gather population statistics and determine whether India should adopt a one-child policy like the one implemented in the 1980's by the Chinese government.
1. Go to the “CIA Factbook” link. Select China. 2. Complete the data table below for China and then repeat step 2 for India, the United States, and a country of your
choice. Work together as a class to share data for the first three columns.
China India United States __________
Life Expectancy
Population Size
Per Capita Income
Birth Rate
Death Rate
Literacy Rate
Infant Mortality Rate
3. What do these numbers reveal about China and India? Support your answer from the data. 4. Should India have a one-child-only policy like China? Why or why not? 5. Are there economic reasons to support having smaller families? Larger ones? 6. What does this tell you about the country that you chose, keeping in mind the questions you just answered?
World Population GrowthWorld Population GrowthBackground
The impact of human population growth on the environment is a factor in many of the issues in this course. Before we can analyze the effect of this impact, however, it is necessary to understand the simple math that describes such growth.
To project when a population will reach a certain level, use the following formula: t = (1/k) ln(N/N0). k represents the growth rate in decimal form, N is the population density, and N0 is the population.
Procedure 1. Starting with the 2009 world population of 6.7 billion people and using a world growth rate of 1.17%, in what year
would the Earth reach this impossible density of 1 person per square meter of dry land? 2. There are places where population densities approaching 1 person per square meter already exist. A two-story
building in Delhi, India was found to house 518 people, a density of 1 person per 1.5 square meters. a) Calculate the floor area of the building in Delhi. b) How does this compare to the average floor area of a typical American single family home (2100 square feet
for a new home built in 1995)? 3. Can we accommodate an “unlimited” population by putting people in high-rise buildings? Explain. 4. The land area of East Cleveland, Ohio is 3.11 square miles. The 2000 population was 27,217 people. Using these
numbers, calculate the population density of East Cleveland, expressed as people per square meter. Does this sound high or low? Explain.
Energy ConsumptionEnergy ConsumptionBackground
The units in North America used to measure energy vary. Electrical use is usually measured in Kilowatt-hours and heat energy is commonly measured in British Thermal Units (BTUs). Here are some conversion factors:
– 1 gallon of fuel oil = 145,000 BTU– 1 gallon of gasoline = 125,000 BTU– 1 cubic foot of gas = 1,031 BTU– 1 ton of coal = 25,000,000 BTU
2010 - 2011 54

Energy Consumption
– 1 kWh of electricity = 3412 BTU– 1 cord of wood = 20,000,000 BTU
Heating and Air ConditioningWindows are one of the major ways energy leaves or enters a building. A double pane window has an R-value of
1.85 (single pane is 0.9). The reciprocal of R is defined as the number of BTUs that would pass through a 1 square-foot surface in 1 hour if the difference in temperature on opposite sides of the surface is 1 degree F: Heat change in BTU per hour = (Area x Difference in Temperature F) / R
1. Select a double pane window in your classroom or home and measure its surface area. Record.2. Measure the difference in temperature between the inside and outside of the window and record.3. Calculate the rate of heat transfer through the window by using the above formula. Record.4. Assume the same temperature conditions existed for an entire year. Calculate the heat transfer and record.5. Calculate the effect that a 5 F decrease in the temperature on the inside of the window will have on the rate of the
transfer. Record.6. Calculate the rate of heat transfer if the size of the window were reduced by 50%. Record.7. Triple pane windows have an R-value of 2.8. Calculate the effect on the rate of heat transfer if the single pane
window were replaced with double or triple windows. Record.
Heating WaterWater has a high specific heat capacity. It requires 1 BTU of energy to raise the temperature of one pound of
water 1 degree F.1. Turn on a water faucet so that it is leaking at a rate of one drop per second and collect the water for 15 minutes.2. Weigh the amount of water collected. Convert to pounds.3. Calculate the amount of water lost in one year.4. Assume that the water entering the water heater enters at 40F and leaves at 120F.5. Calculate the number of BTUs of heat energy that would be lost in one year if the leak were not fixed.6. Calculate the number of kilowatt-hours of electricity it would take to produce this much heat.7. Calculate the cost associated with this water loss by multiplying the number of kWh by the cost of 1 kWh of
electricity. Record.
Electrical AppliancesElectrical appliances also influence our lifestyle. However, you might find it interesting to determine how much energy is consumed by the use of these appliances. You can find the wattage of the appliance on the label. Keep a log for one week of all of the electrical appliances you use. List the number of minutes you used each appliance and calculate total energy usage.
Calculation of Earth's oil reservesCalculation of Earth's oil reservesFrom Steve Dikkers, Guttenberg, IA
The numbers on these sheets are readily accessible. They are not secret. Anybody can find them. We can look at them in some ways that might shed some light on the urgency of the Global Energy Crisis. Follow along as you are lead through some problems. Then you will be asked to do some problems on your own. The numbers have been rounded off in order to be able to complete this activity without a calculator.
1. The United States used 20,000 thousand barrels per day in 2004. That is 20,000,000 barrels per day. Let us take a closer look at that number. How many barrels of oil per year is that?
2. The United States used about ____ billion barrels of oil a year. What can we do with that number? The United States has an estimated 21 billion barrels of oil left in the ground. Let us ask this question: If the United States were to quit importing oil today, how long would the oil in the United States last?
3. That works out to about __ years! How long would it take for the United States to use all of the oil that is estimated to remain in Saudi Arabia, which is about 270 billion barrels of oil? (Be sure to set up the proper equations, with the proper units, and go through all of the work to ensure that you arrive at the proper answer.)
4. The estimated population of the United States in 2007 was 300,000,000. We also know that the United States uses about 20,000,000 barrels of oil each day. There are about 40 gallons (actually, 42) in a barrel of oil. How many gallons of oil are used everyday by each American? That seems like a hard problem, but we can make it easy to do by breaking it down into parts and setting it up properly. First, convert the barrels of oil to gallons of oil. Then, calculate how much is used by each American.
5. CRUDE, an organization that tracks this data, gives us the number of 3 gallons per day. Are you close? 6. How many gallons of oil does each citizen of China use in a day? China has 1.2 billion people and uses 8,000,000
barrels per day. 7. Earth’s population is about 6.5 billion people. Calculate how many gallons of oil are used by each human every
day? Earth uses 85,000,000 barrels per day.
55 Shaw High School
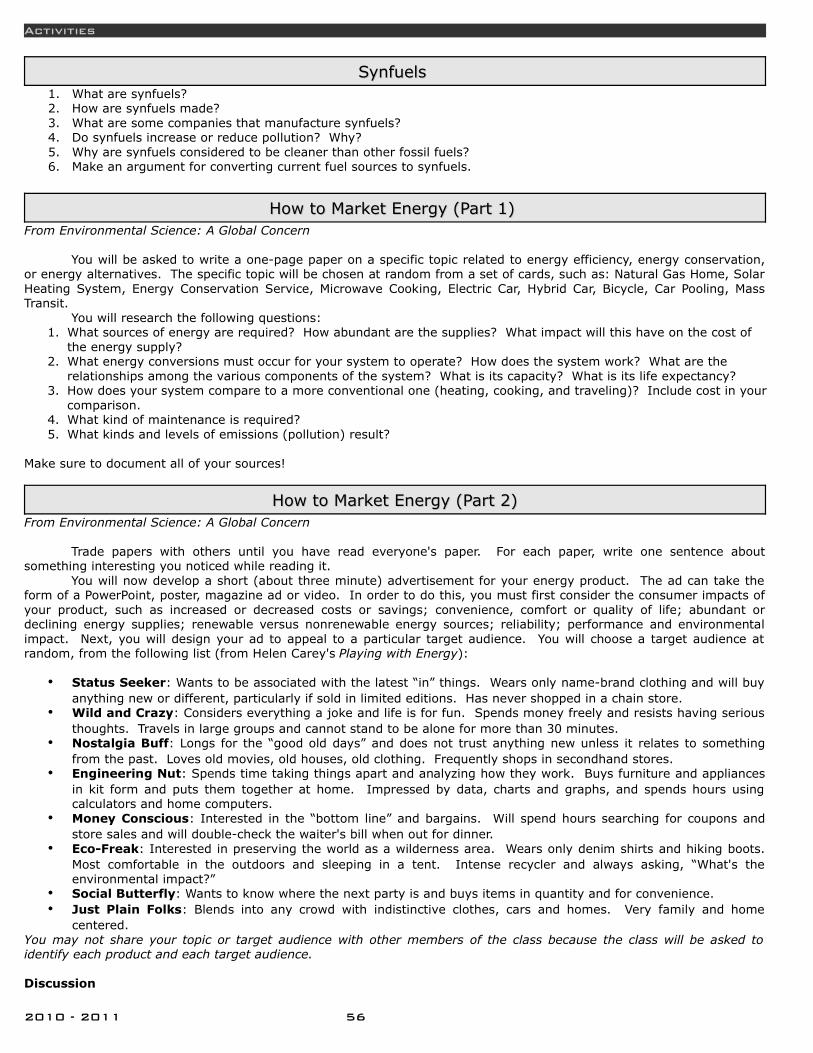
Activities
Synfuels Synfuels 1. What are synfuels?2. How are synfuels made?3. What are some companies that manufacture synfuels?4. Do synfuels increase or reduce pollution? Why?5. Why are synfuels considered to be cleaner than other fossil fuels?6. Make an argument for converting current fuel sources to synfuels.
How to Market Energy (Part 1) How to Market Energy (Part 1) From Environmental Science: A Global Concern
You will be asked to write a one-page paper on a specific topic related to energy efficiency, energy conservation, or energy alternatives. The specific topic will be chosen at random from a set of cards, such as: Natural Gas Home, Solar Heating System, Energy Conservation Service, Microwave Cooking, Electric Car, Hybrid Car, Bicycle, Car Pooling, Mass Transit.
You will research the following questions: 1. What sources of energy are required? How abundant are the supplies? What impact will this have on the cost of
the energy supply? 2. What energy conversions must occur for your system to operate? How does the system work? What are the
relationships among the various components of the system? What is its capacity? What is its life expectancy? 3. How does your system compare to a more conventional one (heating, cooking, and traveling)? Include cost in your
comparison. 4. What kind of maintenance is required? 5. What kinds and levels of emissions (pollution) result?
Make sure to document all of your sources!
How to Market Energy (Part 2)How to Market Energy (Part 2)From Environmental Science: A Global Concern
Trade papers with others until you have read everyone's paper. For each paper, write one sentence about something interesting you noticed while reading it.
You will now develop a short (about three minute) advertisement for your energy product. The ad can take the form of a PowerPoint, poster, magazine ad or video. In order to do this, you must first consider the consumer impacts of your product, such as increased or decreased costs or savings; convenience, comfort or quality of life; abundant or declining energy supplies; renewable versus nonrenewable energy sources; reliability; performance and environmental impact. Next, you will design your ad to appeal to a particular target audience. You will choose a target audience at random, from the following list (from Helen Carey's Playing with Energy):
• Status Seeker: Wants to be associated with the latest “in” things. Wears only name-brand clothing and will buy anything new or different, particularly if sold in limited editions. Has never shopped in a chain store.
• Wild and Crazy: Considers everything a joke and life is for fun. Spends money freely and resists having serious thoughts. Travels in large groups and cannot stand to be alone for more than 30 minutes.
• Nostalgia Buff: Longs for the “good old days” and does not trust anything new unless it relates to something from the past. Loves old movies, old houses, old clothing. Frequently shops in secondhand stores.
• Engineering Nut: Spends time taking things apart and analyzing how they work. Buys furniture and appliances in kit form and puts them together at home. Impressed by data, charts and graphs, and spends hours using calculators and home computers.
• Money Conscious: Interested in the “bottom line” and bargains. Will spend hours searching for coupons and store sales and will double-check the waiter's bill when out for dinner.
• Eco-Freak: Interested in preserving the world as a wilderness area. Wears only denim shirts and hiking boots. Most comfortable in the outdoors and sleeping in a tent. Intense recycler and always asking, “What's the environmental impact?”
• Social Butterfly: Wants to know where the next party is and buys items in quantity and for convenience.• Just Plain Folks: Blends into any crowd with indistinctive clothes, cars and homes. Very family and home
centered.You may not share your topic or target audience with other members of the class because the class will be asked to identify each product and each target audience.
Discussion
2010 - 2011 56

How to Market Energy (Part 2)
1. How did you recognize the target audience? Are you ever part of this audience? 2. What action does the ad require of the audience? 3. What are the advantages and disadvantages of this product? 4. What, if any, important information was left out of the ad? 5. Did you respond to the product or the “attitude” or “feeling” that was being promoted? 6. How can advertisements be used to promote environmentally friendly products and services?
Fishbanks, Ltd.Fishbanks, Ltd.Role Description and Opening Scenario
Congratulations! You have just been hired to manage one of the principal fishing companies in your country. Together with the others in your company—captain and crew members—you will operate your fishing fleet each year according to policies you design to maximize your assets. The rules and information required for your success are provided below.
CRITERION OF SUCCESSYour team's goal is to achieve the greatest possible assets by the end of the game. Your assets equal the sum of
your accumulated bank balance plus the salvage value of your ships at the end of the final year in the game.
RESOURCESYou begin the game with a fleet of ships, a bank account of ($200) x (number of ships), and access to two
offshore fishing areas.
DECISIONSEach round you must determine your fleet size by deciding whether to bid for ships at auction, make ship trades
with other teams, order new ships to be constructed by the shipyard, or maintain your fleet at its current size. Then you must decide how to divide your ships among the Coastal and Deep Sea fishing areas and the Harbor. You, will be most successful if your decisions are based on a long-term strategy for fleet size and allocation. You must also take into account the actions of the other teams and modify your strategy accordingly.
BANK BALANCEYour bank balance is increased by income from fish and ship sales, and decreased by expenditures for ship
purchases and operation. Additionally, your account is subject to interest earnings and charges. Your total assets equal the sum of your bank balance plus the salvage value of your ships, $250 per ship, at the
end of the game.
IncomeYou can earn income by:
1. selling your fish catch at a fixed price of $20 per fish 2. selling your ships to other companies at a negotiated price 3. earning 10% interest on your bank account during seasons when your minimum bank account remains positive
EXPENSESYou incur expenses by:
• buying ships at auction• buying ships from other companies at a negotiated price• ordering the construction of new ships at $300 per ship• operating and maintaining your ships in one or both of the two fishing areas or leaving them in the harbor• paying 15% interest on your loans during years when your minimum bank balance becomes negative
INTERESTInterest earnings and charges are based on your minimum bank balance during the year. To determine what your
minimum bank balance will be, you must keep in mind the precise sequence of credits and debits to your account
SHIPSYou may change the size of your fleet by buying ships at auction, negotiating to buy or sell ships from another
company, and ordering new ships from the shipyard.Ships cannot be lost or damaged, and used ships purchased in an auction or trade are as good as new ships
ordered from the factory.
AUCTIONSFrom time to time a fishing company in a neighboring country will go bankrupt. Its ships are then sold in one lot
to the highest bidder, and they may be used immediately. Only one company can win the ships, but two or more teams can agree ahead of time to divide the ships later
(during the trading session) at a negotiated price.
57 Shaw High School
Activities
TRADESDuring the trading session all companies are free to negotiate the purchase or sale of ships. Ships that are traded
are available to the purchaser for fishing immediately.Rentals can be arranged by a prior agreement to buy ships and sell them back for a lower price in a later year.
CONSTRUCTIONEvery year the shipyard accepts orders for new ships. These are available at a fixed price of $300 per ship. The
ships are picked up and paid for at the end of the year, so there is effectively a one-year construction delay before the ships may be used.
SALVAGEAt the end of the game your ships will be sold. Their salvage value may either be a constant, typically $250 per
ship, or a variable that depends on the average profit per ship earned in both fishing areas over recent years. The game facilitator will indicate at the beginning of the game precisely how salvage value will be determined. You may not sell your ships for salvage before the end of the game.
FISH AREASTwo fishing areas are available to you: a large Deep Sea fishery, and a smaller Coastal fishery. Biologists have
estimated that the Deep Sea could potentially support between 2000 and 4000 fish, while the Coastal area could support between 1000 and 2000 fish. Since there has been no sign of over harvesting in the past, you are probably safe to assume that the actual populations are somewhere near these upper limits.
The normal yearly catch in the Deep Sea, 25 fish per ship, is higher than that in the Coastal area, 15 fish per ship. However, it costs $250 per year to operate a ship in the Deep Sea, while in the Coastal area the cost is only $150 per year. Operating costs remain fixed, but the catch in each area may vary according to factors explained below.
HARVESTYour total fish catch is influenced by the number of ships you send to sea, the ship effectiveness, and the weather.
With good weather, catch can be as much as 20% above normal, while bad weather may reduce catch by up to 20%. Weather is the same in both areas and for all teams in any given year.
Ship effectiveness—the number of fish caught per ship each year—depends on the normal productivity of the area where the ship is operating, and on the density of fish in the area. The general relationship between fish density and ship effectiveness is shown at right.
The number of ships in an area does not affect ship effectiveness; in other words, ship crowding is not a factor. However, if there are many ships in one area, the fish population may be somewhat reduced, and the next year’s harvest will be affected.
POPULATION DYNAMICSThe fish population is increased by natural births; it is decreased by natural deaths and by harvesting. The fertility
of the fish and their lifetime are both influenced by the density of fish. The general shape of the relationship governing new fish, net additions to the fish stock each year (births to natural deaths), is shown at right.
TERMS ON THE DECISION SHEETANNUAL REPORT:
R:1 Deep Sea Fishery Catch: This is the total number of fish caught by the ships you sent to the Deep Sea fishery in the last year.
R:2 Coastal Fishery Catch: This is the total number of fish caught by the ships you sent to the Coastal fishery in the last year.
R:3 Price of Fish: The price of fish is fixed at $20 per fish sold.R:4 Total Fish Sales: This is the product of two factors—your total catch (the sum of the R:1 and R:2 above) and
the price for each fish sold (R:3).R:5 Interest: When your minimum bank balance during the year is negative, you are charged 15% interest. This
may happen even when fish sales at the end of the year leave you with a positive bank balance. If the figure for interest on your report is positive, that means your minimum bank balance during the year was positive and you earned 10% interest on the minimum balance. You can calculate your bank balance yourself by adding your credits and debits in the sequence shown in the Bank Balance section of this role description.
R:6 Initial Bank Balance: In the first year this is typically $200 per ship in your fleet. Thereafter the amount is calculated by the computer program.
R:7 Ship Fleet Before Auctions and Trades: This is the number of ships you start with at the beginning of the year. It will equal D:8 in the last year plus any new ships ordered in the last year (D:7).
AUCTION, TRADES, AND ORDERS DECISIONS:D:1 Ships Purchased in Auction: Normally this will be zero, since auctions are not always held, and only one firm
can make the highest bid. If you win the auction, record here how many ships you obtained.
2010 - 2011 58

Fishbanks, Ltd.
D:2 Money Spent on Auction Purchases: If the term above is zero, then this will also be zero. If your team did win the auction, record here the total amount of money you paid for all the ships.
D:3 Ships Purchased in Trades: If you bought ships from one or more of the other teams, record here the total number of ships you obtained from all other teams combined.
D:4 Money Spent on Trade Purchases: If you bought ships from one or more of the other teams, record here the total amount of money you paid to all other teams combined.
D:5 Ships Sold in Trade: If you sold some of your ships to one or more of the other teams, record here the total number of ships you transferred to all other teams combined.
D:6 Money Received from Trade Sales: If you sold some of your ships to one or more of the other was, record here the total amount of money you received from all other teams combined.
Note: You can effectively rent or lease ships from another team by agreeing to buy a ship this year for some price and then to sell it back in the next year for zero dollars. But be careful how you record these two transactions; the numbers of ships and amounts of money recorded by each team must be equal.
D:7 New Ships Ordered: Here you record your decision about the number of new ships you wish to have constructed for use in the next year. These cost $300 each, but you can borrow the money from the bank if your bank balance is inadequate to finance your desired purchases.
SHIP ALLOCATION DECISIONS:D:8 Ship Fleet After Auctions & Trades: This is the number of ships you have for use in fishing this year. It equals
R:7 + D:1 + D:3 – D:5. It is not influenced by your decision regarding D:7, New Ships Ordered. These ships only become available to you at the beginning of next year.
D:9 Ships Sent to Deep Sea Fishery: Each ship sent to the Deep Sea fishery costs you $250 in operating costs. This money may be borrowed from the bank, if the total operating costs exceed your bank balance. However, you will then have to pay interest on the loan.
D:10 Ships Sent to Coastal Fishery: Each ship sent to the coastal fishery costs you $150 in operating costs. This money may be borrowed from the bank, if the total operating costs exceed your bank balance. However, you will then have to pay interest on the loan.
D:11 Ships Remaining in Harbor: Each ship left in the harbor costs $50 in operating costs.
STEPS OF PLAY1. Receive computer printout and record on decision sheet under "Annual Report."2. Collect ships.3. Bid for auctioned ships.4. Buy or sell ships in trading sessions.5. Place orders for new ship construction.6. Calculate and record fleet size.7. Allocate ships among fishing areas & harbor and record decisions on Decision Sheet.8. Place ships on game board.9. Give Decision Sheet to game operator.
FISH BANKS QUICK REFERENCE SHEET
Fishing AreasDeep Sea (Area 1) Coastal (Area 2) Harbor
Operating Cost(per ship per year)
$250 $150 $50
Normal Yield(fish per ship per year)
25 15 0
Estimated maximum fish population 2000 – 4000 1000 – 2000 0
Ship PurchasesAvailability Cost
Purchase in auction Immediate Highest bidPurchase in trade session Immediate Negotiated priceOrder from shipyard One year delay $300
Other InformationPrice of fish $20
Interest rate on loans (minimum bank balance is negative during the year) 15%
Interest rate on savings (when minimum bank balance is positive I -during the year) 10%
59 Shaw High School

Activities
Sample SeasonTransaction Income Expenses Bank Balance
Initial bank balance $0 $0 $2,000Buy four ships at auction 0 1,200 800Sell two ships in trade 700 0 1,500Operate six ships in Deep Sea 0 1,500 0Operate two ships in Coast 0 300 -300Sell fish from Deep Sea 3,000 0 2,700Sell fish from Coast 600 0 3,300Pay interest on minimum bank balance (–$300) 0 50 3,250Pay for new ship ordered 0 300 2,950Final bank balance 0 0 2,950
FISH BANKS, LTD.Team Strategy Worksheet
Your goal is to maximize your assets (assets = bank balance + salvage value of ships) by the end of the game (approximately 10 rounds). With this in mind, plan your company strategy.
Company #: ______ Year #: ______ List the plan of action for how your company will achieve its goals.
Company #: ______ Year #: ______ List the plan of action for how your company will achieve its goals.
Company #: ______ Year #: ______ List the plan of action for how your company will achieve its goals.
2010 - 2011 60
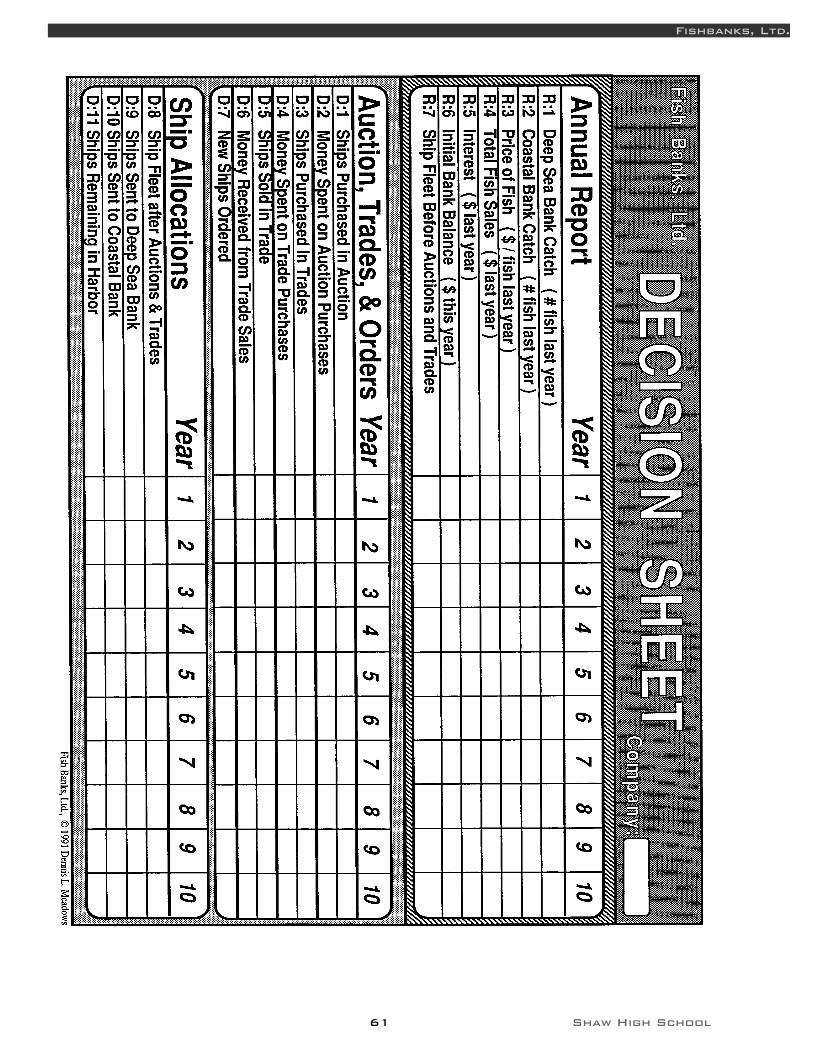
Fishbanks, Ltd.
61 Shaw High School
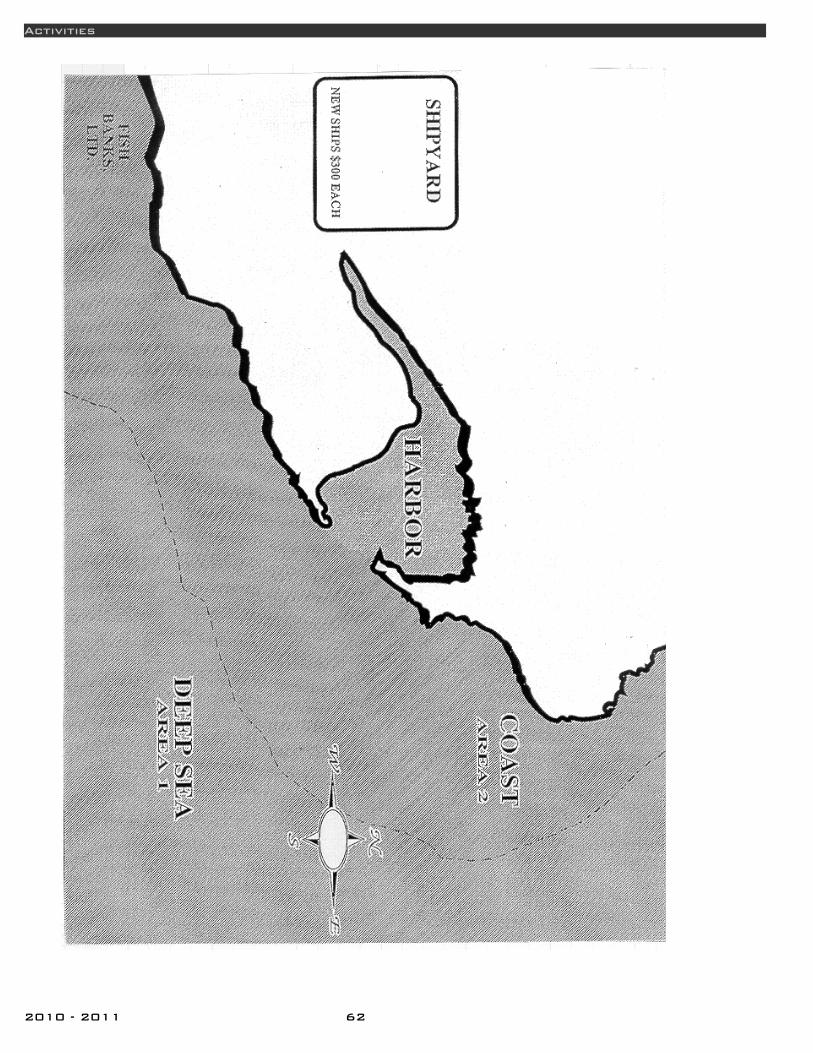
Activities
2010 - 2011 62
Design an environmentally friendly town
Design an environmentally friendly townDesign an environmentally friendly townBackground
This activity gives students the opportunity to plan a city-wide area with a population of 150,000 more or less like Cleveland. After reading about land-use planning and zoning, groups of students will design an environmentally friendly city that incorporates the best ideas of all of the group members. Each team will make a large color map of their township, then present their general plan to the teacher. The team best able to defend their decisions will receive extra credit. Projects will be graded based on whether good land-use planning design was used and if there was a good balance between development and preservation.
The map will be initiated by a different group according to the following instructions for 4 8.5 x 11 sheets of paper taped together (or one 17 x 22 poster) where 1 square kilometer is equal to 1 square cm on the map. Groups should develop icons or their own labeling system:
1. Desert should cover 100 total square cm. The desert should contain a 20 square cm lakebed that does not count against the 100 square cm of desert.
2. Chaparral should cover 100 total square cm.3. 2 sets of mountains should cover 50 square cm each and one set should contain a 25 square cm lake (doesn't
count against the total 50 square cm). The set of mountains without a lake should be surrounded by 25 square cm of foothills.
4. Coniferous forest should cover 350 total square cm.5. Deciduous forest should cover 300 total square cm.6. One river should flow from the lake in the mountains, another river from the other mountains, and both rivers
should meet in a 50 square cm lake roughly in the middle of the town. 7. Wetlands should cover an area of 25 square cm alongside the 50 square cm lake.8. Ocean should cover 50 square cm, as far away as possible from everything else, but must be along an edge or
corner of the map. Additionally, there should be a 25 square cm area of wetlands inland from the ocean.9. The 50 square cm lake's outflow should be a river that leads from the lake's wetlands to the ocean's wetlands.10. The remaining land is grassland, which should fill up about half of the map.11. Place three mineral deposits among the mountains, one in the grassland and one in the desert.12. Place fish in the lakes.13. Place endangered species in the larger lake, somewhere in the grassland, in the coniferous forest and in the
desert.14. Place a group of three oil deposits in the grassland, near the endangered species.
Procedures1. Transportation: You should include rail, major highway(s), roads and dirt roads.2. Water (blue): You should add aqueducts for farm irrigation and one dam3. Wilderness (brown): You should have 3 wilderness areas4. Parks (green): You should have 3 rural parks and 6 city parks5. Low density housing (yellow): 30,000 people will live in 81 square km6. Medium density housing (orange): 60,000 people will live in 64 square km7. High density housing (red): 60,000 people will live in 49 square km8. Commercial area (brown): Stores and malls will occupy 25 square km9. Industrial area (purple): Industry will occupy 36 square km10. Agriculture (green): Agricultural land will occupy 616 square km11. Ranching (grey): Ranching and forestry will occupy 616 square km12. Waste (red): You should add one toxic waste site and two municipal waste sites13. Services: You should have two hospitals, two high schools and 10 elementary schools14. Industry: Choose the location of 2 lumber mills, 2 power plants (choose the technologies), 2 commercial fishing
sites, 6 mining operation sites and one airport
Ecotourism BrochureEcotourism BrochureBackground
One of the biggest obstacles to protecting fragile environments is money. One of the most reliable and low-impact sources of money is tourism, but only if it is done well. “Ecotourism” is the term given to tourism of places with fragile environments that keeps in mind the end goal of preserving that environment. In this activity, you will be developing a brochure for people to come and “ecotour” your particular environment.
Procedure 1. Choose an area of the world that needs restoration, like a particular forest, prairie, wetland, stream or coral reef. 2. You will design an ecotourism brochure. The idea is to include information on how your company will restore the
ecosystem and why tourists would want to visit, hiring this company to take them on the trip. 3. Information that should be included:
a) Why is this environment important?
63 Shaw High School
Activities
b) What is being done to restore the habitat? c) Are noninvasive species a problem and, if so, how are these being addressed? d) What percentage of the natural environment is left? e) What caused the destruction of this habitat in the first place? f) A map of the area should be included. g) List some native species that inhabit this environment. h) What are some things that travelers can do to help? i) What are the unique characteristics of this area? j) From an environmental perspective, why should we care what happens to this environment? k) Be sure to include your company's name, phone number, price of the trip, and what all is included.
4. What if you are so successful that too many people want to visit your ecosystem? What might happen to the area? Can you think of examples of where this has happened in the real world?
5. When might ecotourism not be an ideal strategy for conservation?
Endangered SpeciesEndangered Species 1. Develop a code of ethics for a recreational activity that can injure or harass wildlife. Investigate the problems that
recreational activities cause for threatened and endangered species. For example, determine what problems boat traffic causes for endangered marine or freshwater species such as whales, manatees, giant otters, and corals.
2. Develop a Boating Code of Ethics that will help prevent or minimize harassment and injury to these species. Other activities to examine include birdwatching, wildlife photography, sport hunting, sport fishing, and SCUBA diving and snorkeling. Can you think of others?
3. Develop a Code of Ethics for any of the activities, send your proposed Code of Ethics to an organization involved with the activity, and ask for the group's comments.
4. Choose an endangered or extinct species and create a series of diagrams showing species relationships in that ecosystem and what happens when one species is removed.
a) Draw a diagram showing what the animal eats, what other animals compete for the same food, and what animals eat the animal, its young, or its eggs. Other relationships you can portray in your diagram include where the animal nests (in a certain kind of tree, for example), what other animals compete with it for nest sites, and what pollinators (e.g., bees, bats) are needed to pollinate its food plants. Can you think of other relationships that are important?
b) Remove one of the species in the diagram and analyze what is likely to happen to the entire web of relationships. Draw a new diagram representing the new relationships.
5. Write a children's story. Write a story for children about an endangered or extinct species. Go to the children's section of the and look at picture books to get ideas. Keep audience and purpose in mind as you write: at what age group is your story aimed? what is the main point or feeling you want to convey about this animal? Create a story board as you respond to the following questions:
a) From what point of view is the story written? (i.e., who is the narrator?) b) How will you use setting? c) How will you develop the theme, the plot, and the characters? d) How will you use external and internal conflict? e) How will you show rising action? f) What is the story's climax? g) Can you build in symbolism and irony? h) How will you illustrate the story?
The Nature ConservancyThe Nature ConservancyBackground
The following are two problems in land use choices that the Michigan Chapter of the Nature Conservancy uses to screen applicants to its staff. The problems are real. The Nature Conservancy does not lobby or sue to get what it wants. It buys land and sets it aside for preservation. It buys the land with the rarest ecotypes and species. It only has the amount of money it can raise from memberships and grants to use.
WetlandsWe've identified a wetland near Detroit Metropolitan Airport as a potential project site. The area is surrounded by development, and has been used by neighbors for their own recreational benefit for years. A landfill is adjacent to the project site. More than 20 different parcels (land owners) fall within the primary project boundaries. Yet most scientists recognize it as one-of-a-kind, that there is probably nothing like it in all of North America. Do we initiate the project? Why or why not?
Last Great PlacesAs part of the Conservancy's national Last Great Places campaign, we recognize the need to cultivate and develop partnerships with public agencies and fellow private organizations. In Michigan our first targeted area to be included in
2010 - 2011 64

The Nature Conservancy
the campaign will be a stretch of the Upper Peninsula from St. Ignace east to Drummond Island. During preliminary conversations with local residents, we've uncovered a great deal of hostility toward the Michigan Department of Natural Resources, a likely major partner in the project. We've also discovered a great deal of animosity toward a local (very effective) land trust, a fellow partner with us on previous projects. The scope of the project is such that we can't do this project alone. How do we respond to the antagonism without alienating our friends in conservation?
The Greenhouse EffectThe Greenhouse EffectMaterials
2-liter bottles, plastic wrap (or bags), string or rubber bands, masking tape, 2 thermometers per group, 2x2” pieces of cardboard, ruler, 2 rocks (2” in diameter, clean, dry and of the same type), utility knife
Procedure1. Cut one bottle 4” from the bottom. Cut another where it narrows for the neck.2. Using masking tape, attach the thermometers to the inside of the bottles.3. Tape the small cardboard pieces over the thermometers' bulbs so that it is not exposed directly to the rays of the
sun (or light bulb, if done inside). The bottom of the thermometer should be about 2” above the bottom of the bottle. Try to remove the label from the bottle so it will not interfere with incoming light.
4. A dry, clean rock should be place in the bottom of each bottle to prevent it from tipping over.5. The taller bottle should be covered with clear plastic held in place with a rubber band. This is the “greenhouse.”
The short bottle should remain uncovered. This is the control. Since we are testing the effect of both the sides and cover, both need to be absent in the control.
6. One group should put about 2” of water in the base of both; another group should place moist soil; one group should use dry soil; one group should use nothing.
7. Record the starting air temperature in each bottle.8. Place your thermometer in open sunlight, with the thermometers facing away from the sun.9. Record the temperature inside each bottle every 2 minutes for 20 – 30 minutes.10. Graph temperature versus time.
Questions1. How is this model like and unlike the real atmosphere and global warming?2. What was the purpose of the short bottle?3. Since not all scientists agree that we have evidence for global warming, should anything be done to reduce the
“greenhouse gases”?4. What can be done to reduce the production of greenhouse gases?
Laws and treaties protecting the ozone layer Laws and treaties protecting the ozone layer
This is part one of a two-part investigation of the laws and treaties that protect the environment. In this first part, you will be researching the protection of the ozone layer. You will be given a section of the United States or a country to research:
1. What is the section/country you have been assigned? 2. What is at least two relevant laws or treaties dealing with the ozone layer? 3. What is the voting record of the section (try and find congressional representatives) or the country (specifically
within the United Nations) on these issues concerning the ozone layer? 4. Is this voting record in the minority? Why or why not? 5. What political pressures have resulted in this pattern of voting? 6. Report your results to the class.
Laws and treaties regarding climate change Laws and treaties regarding climate change This is part two of a two-part investigation of the laws and treaties that protect the environment. In this second
part, you will be researching climate change legislation. You will be given a section of the United States or a country to research:
1. What is the section/country you have been assigned? 2. What is at least two relevant laws or treaties dealing with climate change? 3. What is the voting record of the section (try and find congressional representatives) or the country (specifically
within the United Nations) on these issues concerning climate change? 4. Is this voting record in the minority? Why or why not? 5. What political pressures have resulted in this pattern of voting? 6. Report your results to the class.
Quandary in PonderQuandary in Ponder
65 Shaw High School

Activities
Throughout this activity, you will play the role of a resident of the city of Ponder. At the conclusion of the activity, you will be an interested, concerned, and active participant in a lively city council debate over the use of a controversial pesticide, which has been proposed for use protecting the cropland surrounding the city in which you live.
About PonderThe city of Ponder is a rural community 60 miles outside of Megalopolis. In recent years, Ponder has been
undergoing a steady transformation into a distant, bedroom community of Megalopolis. Despite this transformation, much of the charm of old Ponder remains. Main Street attracts thousands of visitors from Megalopolis each weekend for a stroll along its authentic wood-plank boardwalk where the tourists may buy fresh produce at the farmer’s market or visit numerous antique, curio, and souvenir shops. Ponder is surrounded by orchards which grow a variety of stone fruit including peaches, nectarines, and apricots. The fruit of Ponder (especially its peaches) frequently wins prizes for taste and quality at the State Fair. The rolling hills covered with orchards provide a scenic and aesthetically pleasing buffer between the urban sprawl of Megalopolis and Ponder.
Year Population Year Population1960 10,000 1990 18,0001970 10,000 2000 32,0001980 12,000 Present 48,000
In the 1960s and 70s, over 80% of the population of Ponder was dependent on local agriculture for their income. Today, less than 20% of the population derives their income from local agriculture. In order to accommodate recent refugees from Megalopolis, there are many new housing developments and custom-built homes. Most of these new homes are built on the outskirts of town, adjacent to the orchards. For many residents the presence of the orchards was a major factor in their decision to move to Ponder, and in most cases the homes adjacent to the orchards have the highest property values. Most of the recent immigrants to Ponder are employed by one of the high tech or biotech companies that recently chose the city for their headquarters. As a result, there has been a boom in the housing market as the well-paid employees of these companies move their families to Ponder. Several new schools were built in the past five years to accommodate the resulting influx of school-age children.
The ProblemRecently, the orchards surrounding Ponder came under attack by a pest, the stone-fruit beetle, which is new to
the area. The beetle lays its eggs on the surface of a stone fruit; after hatching, the larvae burrow through the skin and consume the fruit. None of the conventional approved pesticides is effective at combating the beetle. Just recently, a new chemical, Safeion, was developed by the Remunerative Chemical Company to combat the stone-fruit beetle. Safeion was developed within the past year and its health effects on humans are not known. The chemical similarity between the Safeion molecule and several known carcinogens leads some experts to believe that Safeion should be considered a suspected carcinogen and dangerous to all life. Despite the lack of authoritative knowledge about Safeion, government regulators have given the farmers of Ponder approval to use Safeion on a temporary basis due to the fact that without its use their orchards will be ruined.
The City Council MeetingA local group of residents would like to stop the proposed spraying of Safeion, and they have presented the
following resolution for a vote by the city council: No chemical agent, which has not been proven completely safe to humans, will be applied to any fields within the city of Ponder.
Each of the following groups will send at least two representatives to speak before the council.
The United Residents Against SafeionThis is a group of Ponder residents who recently moved to Ponder and are raising families – many with small children. They are opposed to the application of Safeion, in anyway, under any circumstances. (5-6)
The FarmersThis group farms land that has been in their family for many generations. The farmers all agree that the only way to save their farms is to spray Safeion. The farmers will go bankrupt and lose their farms without producing a viable crop. (5)
The Ponder Heritage SocietyThis is a group of long-time Ponder residents who live in the same home in which several generations of their family were raised. Most of the Heritage Society members own the businesses along Main Street or the nearby Bed and Breakfast Inns that rely on tourism. They support the spraying of Safeion to preserve the farms, and therefore; their local business and way of life. The members of the Heritage Society are fairly belligerent towards the newcomers to Ponder who they believe are foolish for building or buying homes on the land adjacent to orchards. (5)
The Ponder Parent OrganizationThis is a group of Ponder parents with concerns about the safety of spraying around schools, especially two schools, which
2010 - 2011 66
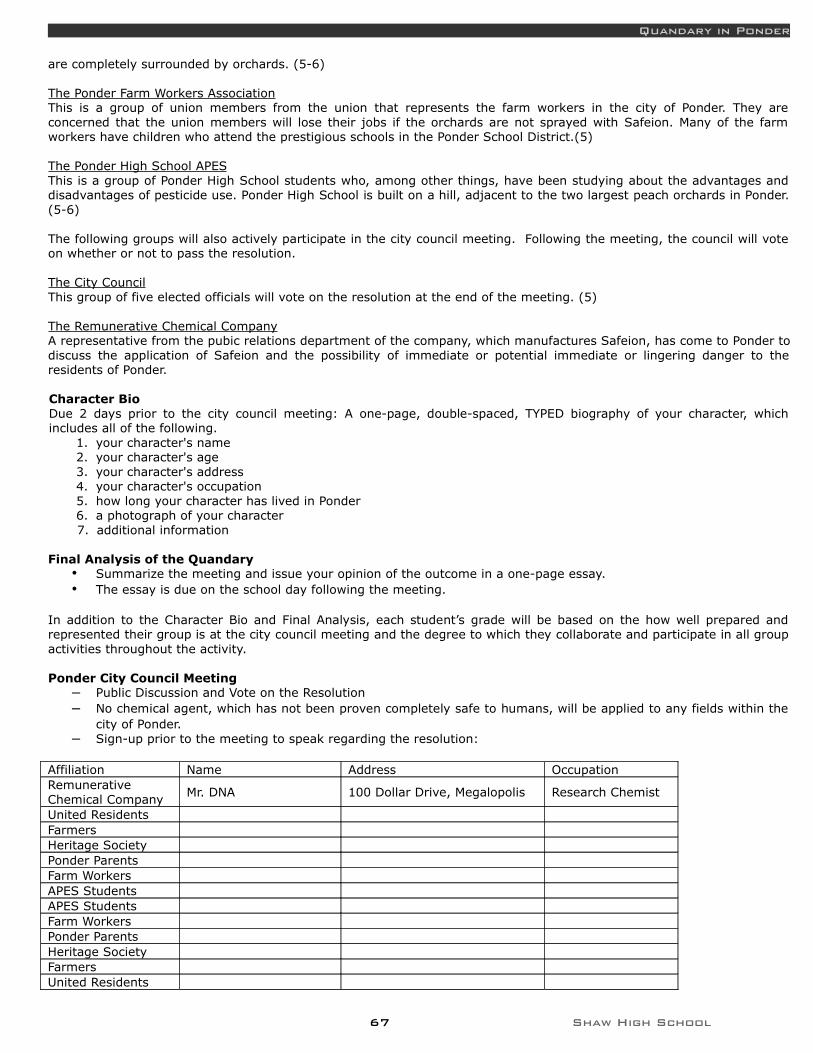
Quandary in Ponder
are completely surrounded by orchards. (5-6)
The Ponder Farm Workers AssociationThis is a group of union members from the union that represents the farm workers in the city of Ponder. They are concerned that the union members will lose their jobs if the orchards are not sprayed with Safeion. Many of the farm workers have children who attend the prestigious schools in the Ponder School District.(5)
The Ponder High School APESThis is a group of Ponder High School students who, among other things, have been studying about the advantages and disadvantages of pesticide use. Ponder High School is built on a hill, adjacent to the two largest peach orchards in Ponder.(5-6)
The following groups will also actively participate in the city council meeting. Following the meeting, the council will vote on whether or not to pass the resolution.
The City CouncilThis group of five elected officials will vote on the resolution at the end of the meeting. (5)
The Remunerative Chemical CompanyA representative from the pubic relations department of the company, which manufactures Safeion, has come to Ponder to discuss the application of Safeion and the possibility of immediate or potential immediate or lingering danger to the residents of Ponder.
Character Bio Due 2 days prior to the city council meeting: A one-page, double-spaced, TYPED biography of your character, which includes all of the following.
1. your character's name 2. your character's age 3. your character's address 4. your character's occupation 5. how long your character has lived in Ponder 6. a photograph of your character 7. additional information
Final Analysis of the Quandary• Summarize the meeting and issue your opinion of the outcome in a one-page essay. • The essay is due on the school day following the meeting.
In addition to the Character Bio and Final Analysis, each student’s grade will be based on the how well prepared and represented their group is at the city council meeting and the degree to which they collaborate and participate in all group activities throughout the activity.
Ponder City Council Meeting– Public Discussion and Vote on the Resolution– No chemical agent, which has not been proven completely safe to humans, will be applied to any fields within the
city of Ponder.– Sign-up prior to the meeting to speak regarding the resolution:
Affiliation Name Address OccupationRemunerative Chemical Company
Mr. DNA 100 Dollar Drive, Megalopolis Research Chemist
United ResidentsFarmersHeritage SocietyPonder ParentsFarm WorkersAPES StudentsAPES StudentsFarm WorkersPonder ParentsHeritage SocietyFarmersUnited Residents
67 Shaw High School

Activities
Land Conservation Options Land Conservation Options The Wildlife Habitat Council thanks Sally Paulson, teacher at West Nottingham Academy in Colora, Maryland for allowing us to incorporate her format for a persuasive paper. Assess Wildlife Habitat In Your Neighborhood
1. What are the components of quality wildlife habitat? 2. Do you live in a neighborhood that has quality wildlife habitat? 3. As a class, what should you look for in your neighborhood to assess the quality of wildlife habitat? Include looking
at native versus non-native or invasive species and diversity of animal life. 4. Take a walk through your yard or neighborhood, describing the landscape and the plants or animals that they see.
Try to take this walk at dawn to maximize the number of species sighted. Ask family and neighbors what kind of wildlife they have seen.
5. Compare the diversity between the neighborhood and an area of similar size restored for habitat. What do you find? Does your neighborhood have quality wildlife habitat. Why or why not?
Develop a Plan to Improve Wildlife Habitat in Your Neighborhood 6. Through your local conservation district or Natural Resources Conservation Service (NRCS) office, contact a farmer
who has implemented conservation practices on their farm. Ask if you can visit the farm and learn about the practices or have the farmer come to the class. During the visit, ask the farmer how homeowners can implement the same conservation practices. You can find contact information for the local conservation district or NRCS office on the Internet at http://www.wildlifehc.org/managementtools/backyard.cfm.
7. Study the Wildlife Habitat Council’s Backyard Conservation website http://www.wildlifehc.org/managementtools/backyard.cfm, which provides links to other sources. Define Backyard Conservation. How you would make your neighborhood more hospitable for wildlife?
Determine if Your Community Supports the Creation of Wildlife Habitat 8. For each of these laws, determine how they help or hinder Backyard Conservation efforts and list the pros and cons
of passing the law for your community. a) In the city of Marshall, population 100,000, homeowners can apply for a permit to burn an area that they are
restoring as native prairie. b) In Montgomery, homeowners can switch from mowed lawn to planting native species in the right-of-way. (The
right of way is the strip between the sidewalk and the street.) c) In Pesto, all grass must be kept shorter than 2 inches. d) In Red Rock, a fine of $1000 will be issued to anyone with any species classified as an invasive by the
Department of Environmental Protection on their property. e) In Victoria, every neighborhood shall provide food, water, shelter and space for wildlife. f) In Tiempo, homeowners planting native species on their property are eligible for a one-time tax credit of $500
to offset local property taxes. g) In spring, any landscaping changes must be regularly maintained to preserve the original appearance. This
original appearance was mowed lawn with two trees in the backyard and one tree in the front yard and ornamental shrubbery and ornamental flowers around the front of the house.
9. Which laws support Backyard Conservation efforts? Why? Which laws restrict Backyard Conservation efforts? Why?
10.Complete the case study that follows about a company that created a wildlife habitat:
KAL Products, Research and Engineering Facility In 1995, several KAL employees decided to work with the Wildlife Habitat Council to create habitat on the two
acres adjacent to their facility. They encouraged other interested employees to participate and asked a biologist from the Wildlife Habitat Council to assess the potential to create wildlife habitat at the site.
The biologist made several recommendations to start their Wildlife at Worksm program. The two significant recommendations were to create butterfly habitat in the areas around the entrance to the facility and to create a wildflower meadow on the two-acre parcel. The employees diligently began to create the wildflower meadow. They planted a variety of plants such as black-eyed susan, purple coneflower, columbine, milkweed and spicebush. Animals began inhabiting the site including butterflies, warblers and hummingbirds. They put up nest boxes for cavity nesters such as bluebirds. The employees even put a trail through the habitat so that the community could enjoy it. They applied for and met stringent criteria to achieve certification by the Wildlife Habitat Council for their efforts.
A few people began to appreciate the wildlife viewing opportunities at the habitat. The local bird club and scout troops not only studied the wildlife at the site but also helped the employees monitor the bluebird boxes. The couple that lived next door walked along the trail and regularly picked up the trash and other debris. The local elementary students visited the site in preparation for developing their own butterfly garden at the school. The employees decided to again work with WHC to start a Corporate Lands for Learning (CLL) program.
2010 - 2011 68
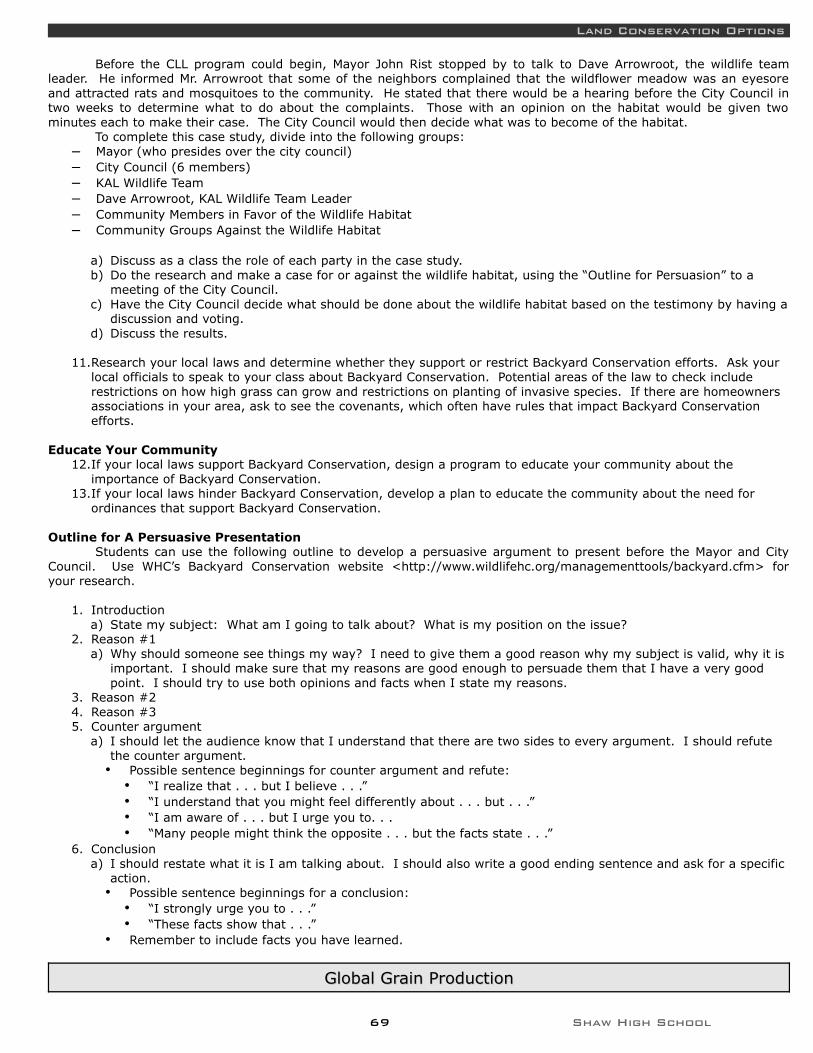
Land Conservation Options
Before the CLL program could begin, Mayor John Rist stopped by to talk to Dave Arrowroot, the wildlife team leader. He informed Mr. Arrowroot that some of the neighbors complained that the wildflower meadow was an eyesore and attracted rats and mosquitoes to the community. He stated that there would be a hearing before the City Council in two weeks to determine what to do about the complaints. Those with an opinion on the habitat would be given two minutes each to make their case. The City Council would then decide what was to become of the habitat.
To complete this case study, divide into the following groups:– Mayor (who presides over the city council)– City Council (6 members) – KAL Wildlife Team – Dave Arrowroot, KAL Wildlife Team Leader – Community Members in Favor of the Wildlife Habitat – Community Groups Against the Wildlife Habitat
a) Discuss as a class the role of each party in the case study. b) Do the research and make a case for or against the wildlife habitat, using the “Outline for Persuasion” to a
meeting of the City Council. c) Have the City Council decide what should be done about the wildlife habitat based on the testimony by having a
discussion and voting. d) Discuss the results.
11.Research your local laws and determine whether they support or restrict Backyard Conservation efforts. Ask your local officials to speak to your class about Backyard Conservation. Potential areas of the law to check include restrictions on how high grass can grow and restrictions on planting of invasive species. If there are homeowners associations in your area, ask to see the covenants, which often have rules that impact Backyard Conservation efforts.
Educate Your Community 12.If your local laws support Backyard Conservation, design a program to educate your community about the
importance of Backyard Conservation. 13.If your local laws hinder Backyard Conservation, develop a plan to educate the community about the need for
ordinances that support Backyard Conservation.
Outline for A Persuasive Presentation Students can use the following outline to develop a persuasive argument to present before the Mayor and City
Council. Use WHC’s Backyard Conservation website <http://www.wildlifehc.org/managementtools/backyard.cfm> for your research.
1. Introduction a) State my subject: What am I going to talk about? What is my position on the issue?
2. Reason #1 a) Why should someone see things my way? I need to give them a good reason why my subject is valid, why it is
important. I should make sure that my reasons are good enough to persuade them that I have a very good point. I should try to use both opinions and facts when I state my reasons.
3. Reason #2 4. Reason #3 5. Counter argument
a) I should let the audience know that I understand that there are two sides to every argument. I should refute the counter argument. • Possible sentence beginnings for counter argument and refute:
• “I realize that . . . but I believe . . .” • “I understand that you might feel differently about . . . but . . .” • “I am aware of . . . but I urge you to. . . • “Many people might think the opposite . . . but the facts state . . .”
6. Conclusion a) I should restate what it is I am talking about. I should also write a good ending sentence and ask for a specific
action.• Possible sentence beginnings for a conclusion:
• “I strongly urge you to . . .” • “These facts show that . . .”
• Remember to include facts you have learned.
Global Grain ProductionGlobal Grain Production
69 Shaw High School

Activities
BackgroundThe human body is an amazing machine, but it is subject to some fundamental laws of physics that affect all
matter. Among these is the second law of thermodynamics, which states that disorder in the universe is increasing (entropy), and that whenever energy is converted from one form to another, some of the input energy is lost in the process of conversion, resulting in less output energy. Practically speaking, complex systems tend to become simple and unorganized unless energy is added to the system to keep it organized and complex.
By eating a nutritionally and calorically complete diet, we compensate for the second law of thermodynamics until we die. A typical person needs about 1500 to 2500 Calories (kilocalories, or 1000 calories). In addition, we need vitamins, minerals and proteins. Inadequate nutrition leads to undernourishment or malnourishment. Globally, nearly 1 billion people are underfed.
Humans are able to eat from all the major food groups. Wheat, rice and corn are the three major cereal crops used by humans. Additionally, we eat potatoes, barley, oats, cassava, sweet potatoes, sugar cane and beets, legumes, sorghum, millet, vegetable oils, fruits and vegetables, meat, milk, and seafood.
QuestionsConsider the following statements:
– Per capita grain supplies have increased 24 percent since 1950 and food prices have plummeted by 57 percent since 1980. (Bailey)
– The increase in food production in poor countries has been more than double the population growth rate in recent years. (Bailey)
– Grain output that easily outpaced population growth for more than 30 years now lags well behind. (Brown)– World carryover stocks of grain for 1996 are projected to drop to 229 million tons, down from 296 million tons in
1995. (Brown)
1. List your conclusions, based on these statements.2. Are the two sets of statements consistent with each other? What additional information would you need in order
to choose which statement is/are accurate?
In the U.S. and elsewhere, many rural and suburban dwellers are used to seeing cropland converted into residential subdivisions with miles and miles of tract homes serviced by highways and power lines. Globally, in 1950, 587 million hectares of grainland area were harvested. In 2007, that was 687 million hectares.
3. What was the percentage increase in grainland area harvested between 1950 and 2007?4. Using the formula k = (1/t) ln (N/N0), calculate the annual percentage increase in grainland area harvested
from 1950 – 2007.5. Refer to the quotations. Which one does your calculation support? Explain your reasoning.6. By 1981, world grainland area had steadily increased from 1950 and reached a peak at 732 million hectares.
From 1982 to 2002, the area shrunk, but since 2002 it has started to grow again. Calculate the percentage increase in world grainland area between 1950 and 1982.
7. The world's population in 1950 was about 2.55 billion. In 2007 it was about 6.6 billion. Calculate the per capita area of grainland harvested for 1950 and 2007.
8. How do the last three calculations change your perception of which set of quotations is more accurate? Discuss your reasoning.
The per capita decrease in grainland area was made possible by the Green Revolution, a development of new strains of wheat and rice along with greater irrigation, use of fertilizers, pesticides, herbicides and fungicides. In 1950, world grain production was 632 million tons. In 2007, it was 2,316 million tons.
9. Calculate the percentage increase in grain production over the period 1950 – 2007.10. Calculate the annual percentage increase in grain production over the period 1950 – 2007.11. Determine the per capita grain production for 1950 and 2007.12. How do the three calculations change your perception of which set of quotations is more accurate?13. World meat production reached an all-time high in 2002. Economic growth in Southeast Asia has fueled this
increase. Globally, annual per capita meat consumption ranged from 125 kg in the U.S. to 3.0 kg in the Bhutan. Over 15 billion livestock (11 billion of which are poultry) exist at any one time to satisfy this demand. Does the increase in meat production necessarily mean a more equitable distribution of meat than previously? In other words, does the increase in meat production imply that global nutrition is improving? Explain.
14. In addition to grasses not suitable for human consumption, much of the world's grain harvest is fed to cattle and other livestock. In 1960, 294 out of 822 million tons of grain were used as animal feed. In 2006, 635 out of 1984 million tons of grain were used as animal feed. In the U.S. in 2006, of the 815 kg of grain produced per person (excluding exports), about 600 kg are used as animal feed. Calculate the percentage of global grain harvest fed to livestock for the years 1960 and 2006. Do the same for the U.S. in 2006.
15. What are competing uses for this grain?16. It's estimated that a switch to more grass-fed livestock in the U.S. would allow about 130 million tons of grain to
be diverted to human consumption, which could feed about 400 million people annually. Using these estimates, if
2010 - 2011 70
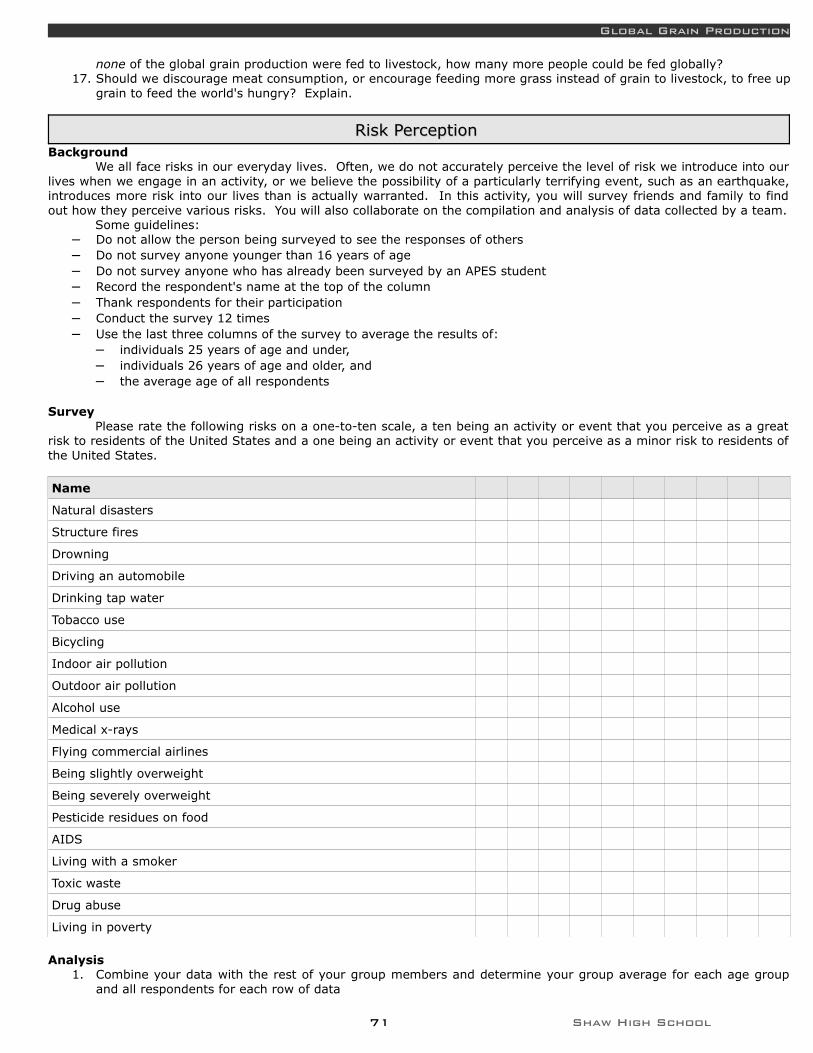
Global Grain Production
none of the global grain production were fed to livestock, how many more people could be fed globally?17. Should we discourage meat consumption, or encourage feeding more grass instead of grain to livestock, to free up
grain to feed the world's hungry? Explain.
Risk Perception Risk Perception Background
We all face risks in our everyday lives. Often, we do not accurately perceive the level of risk we introduce into our lives when we engage in an activity, or we believe the possibility of a particularly terrifying event, such as an earthquake, introduces more risk into our lives than is actually warranted. In this activity, you will survey friends and family to find out how they perceive various risks. You will also collaborate on the compilation and analysis of data collected by a team.
Some guidelines:– Do not allow the person being surveyed to see the responses of others– Do not survey anyone younger than 16 years of age– Do not survey anyone who has already been surveyed by an APES student– Record the respondent's name at the top of the column– Thank respondents for their participation– Conduct the survey 12 times– Use the last three columns of the survey to average the results of:
– individuals 25 years of age and under,– individuals 26 years of age and older, and– the average age of all respondents
SurveyPlease rate the following risks on a one-to-ten scale, a ten being an activity or event that you perceive as a great
risk to residents of the United States and a one being an activity or event that you perceive as a minor risk to residents of the United States.
Name
Natural disasters
Structure fires
Drowning
Driving an automobile
Drinking tap water
Tobacco use
Bicycling
Indoor air pollution
Outdoor air pollution
Alcohol use
Medical x-rays
Flying commercial airlines
Being slightly overweight
Being severely overweight
Pesticide residues on food
AIDS
Living with a smoker
Toxic waste
Drug abuse
Living in poverty
Analysis1. Combine your data with the rest of your group members and determine your group average for each age group
and all respondents for each row of data
71 Shaw High School

Activities
2. Plot all three averages for your survey on the same side of the same piece of graph paper. Plot the actual risk on the y-axis and the perceived risk on the x-axis. Label each graph and each point on each graph with the identity of the risk it represents.
3. Do #2 as a group.4. As a group, collaborate on a thoughtful, insightful, and logical discussion of your group's surveys. Include
explanations for large differences between actual and perceived risk as well as for relatively accurate perceptions of risk.
Understanding Pesticides: Which are Most and Least Harmful? Understanding Pesticides: Which are Most and Least Harmful? By Richard E. Thomas, Boyertown Area Senior High, Gilbertsville, PA
It is just as easy to make a case for the use of pesticides as against. Pesticides save human lives by keeping insect vectors of disease in control, allow us to feed the world's population at reasonable cost, and frequently work faster and thus are more effective than their alternatives. Because of their effectiveness, pesticides are sometimes an integral part of an integrated pest management program. On the other hand, some pesticides are toxic to humans, kill non-target species, including natural pest predators and parasites, become ineffective over time because of pest genetic resistance, and persist for long periods of time in the environment.
But not all pesticides are alike! Each must be considered on its own merits or demerits. There are so many chemical compounds and modes of action involved! How can you possibly know when pesticide use is justified or unjustified? Unless, maybe, you make an attempt to understand each one individually. After all, these are chemicals that you, or someone close to you, are likely to use or encounter more than once in your lifetime! Materials Needed
– Pesticide labels– Pesticide reference materials from online– Five by eight cards and data table for ranking – Ten chemical pesticides (DDT, 2,4-D, chlordane, chlorpyrifos, atrazine, glyphosate, malathion, dieldrin, methyl
parathion, aldicarb)
Procedures 1. Divide into groups of 3-4 individuals. 2. Discuss listed pesticides using reference materials provided and notes made from your review conducted outside of
class. 3. Refer to the weight ranges at the bottom of the table. 4. Assign weights to each pesticide for each of the categories provided. 5. Use lower numbers for "less harmful" and higher numbers for "more harmful." 6. Add assigned weights for each pesticide or row and rank from most to least harmful. 7. Arrange the cards provided to reflect these rankings. 8. Discuss rankings with your group and make any adjustments to the rankings from the data table. 9. You must be able to justify or provide reasons for any adjustments. 10.Present your group's findings to the rest of the class.
Pesticide LD50 Other effects, such as residues
on fruits vegetables
Persistence in the
environment (soil, water
systems, sediments)
Specificity, effect on
non-target species
Ability to bio-
magnify
Notes, Comments
Weight total
1
2
3
4
5
6
7
8
9
2010 - 2011 72

Understanding Pesticides: Which are Most and LeastHarmful?
10
Weight scale or range
1 – 6 1 – 6 1 – 4 1 – 4 1 – 4
Analysis and Discussion
1. Which of the pesticides did your group label as most harmful? Least harmful? Why? Were there any ties? 2. Do you think the weighting system and ranges provided were adequate? How would you (or did you) make
adjustments to this system? Why? 3. What categories (table columns) or criteria would you add to this activity? Why? 4. What pesticides would you add to the list provided for this activity? Why would you add these? 5. Examine your least harmful pesticide. Would you use this pesticide around your home, garden or farm?
BP Gulf of Mexico BP Gulf of Mexico Background
In April of 2010, an oil spill started in the Gulf of Mexico that will have environmental ramifications for years to come.
Respond1. What exactly happened in April of 2010 in the Gulf of Mexico?2. Why was it difficult to repair?3. How long did oil spill out into the Gulf of Mexico?4. Was that the only source of oil in the Gulf of Mexico? What else is there?5. What impact does the spill have on biogeochemical cycles in the region?6. What impact does the spill have on fishing? Be specific about the most recent findings!7. What is the estimated cost of total cleanup?8. What was the limit to the BP's liability for the total spill?9. In your opinion, what do you think should be done in the future in order to prevent disasters like these?
Asian carp and Great Lakes Asian carp and Great Lakes Background
Asian carp are an invasive species that are starting to take hold in the Great Lakes. For a variety of reasons, they could spell doom to the existing ecosystem in Lake Erie, among the other lakes.
Activity 1. What are Asian carp? Why are they considered harmful? 2. The following is called a “Design Brief.” It is a framework for developing a solution to an environmental problem.
You will complete it in groups by filling out the following sections as if you were working for the U.S. government in order to get rid of Asian carp in Lake Erie: a) Need/problem b) Client c) People affected d) Past, present, and future of the problem e) Attitudes that may need to be changed f) Behaviors that may need to be changed g) Laws and customs affecting situation h) Physical site issues i) Climatic/seasonal conditions affecting situation j) Other animals and plants connected to situation k) Energy (fossil, solar, geothermal, etc.) concerns l) Performance criteria – A successful solution must do the following (Rank statements in order of importance) m) Minimum acceptable performance criteria
Mountaintop removal in WV Mountaintop removal in WV Background
Go to http://shawhighstudents.org/mining.pdf . Also, visit http://mountainjusticesummer.org/ .
Activity 1. Read through the Mining for Kids PDF. Don't get caught up doing the games! Just read through enough to get an
idea for the information that is being presented.
73 Shaw High School
Activities
a) What is the tone of the PDF? b) Who is it produced by? c) What do they want you to know about mining? d) After reading this, what do you think about mining?
2. Read through the Mountain Justice site. Explore some of the more recent posts, including videos, pictures, statements, etc. a) What is the tone of the site? b) Who is it produced by? c) What do they want you to know about mining? d) After reading this, what do you think about mining?
3. The truth is usually somewhere between two extremes. Exactly where that is can usually be found by asking a few important questions about each position. a) What role does money have to play in both decisions? b) Does each position take into account the negative consequences of what they advocate? c) Is each position being self-critical?
4. What do you think the truth is about mountaintop removal in West Virginia?
Trash tracking Trash tracking Background
In 2009, the Massachusetts Institute of Technology (MIT) unveiled a project that they had been working on “Trash Track.” Visit the website http://senseable.mit.edu/trashtrack/ to answer the following questions.
Activity 1. What was the purpose of the project? 2. How was the project accomplished? 3. Click on “visualizations.” What is one observation you can make from the garbage that they tracked. 4. Click on “press” to get a closer view of two of the visualizations. For each one, respond:
a) How long did it take the trash to be processed? b) What do you observe about the trip that it took?
5. Click on “how it works” and read about how they accomplished the project. How did they keep the environment in mind even when they were designing the project?
Turnover Turnover From BGHS APES
BackgroundEach year, the water at some areas of the oceans and freshwater lakes “turns over.” That is, what from the deeper
areas rises near the surface, and water from the tops sinks to the bottom. This exchange brings fresh nutrients from the bottom to the organisms living near the water's surface. In many freshwater lakes, this occurs in both the fall and spring as the temperature of the water is changing at those times (water is at its maximum density at 4C). In the ocean, however, the water only turns over in certain areas. This activity will help you understand why.
Two important characteristics of ocean water are its temperature and its salinity. You will investigate how these factors help determine the density of seawater, and how water density controls the vertical movement and circulation of ocean waters.
Materials5 beakers (250mL), stirring rod, gloves, tweezers, plastic container, salt, hot plate, tap water, masking tape,
plastic wrap, blue and red food coloring, tablespoon, ice, watch/clock
Procedure1. Label the beakers from 1 to 5. Fill beakers 1 through 4 with tap water. Add a drop of blue food coloring to
beakers 1 and 2. Stir.2. Add a drop of red food coloring to beakers 3 and 4. Stir.3. Fill a plastic container with ice and water. Place beaker 1 in the ice bath for 10 minutes. Set beaker 3 on a hot
plate turned to a low setting for 10 minutes.4. Add one rounded teaspoon of salt to beaker 4. Stir to dissolve the salt completely.5. Pour half the blue water from beaker 1 to beaker 5. Return beaker one to the ice bath. Carefully place a sheet of
plastic wrap into beaker 5. The plastic should rest on the surface of the water and line the upper half of the beaker.
6. Put on your gloves and protective eyewear. Slowly pour half the warm, red water from beaker 3 into the lined upper half of beaker 5 to form two layers. Return beaker 3 to the hot plate. Remove your gloves.
7. Very carefully use tweezers to gently pull one edge of the plastic wrap and remove the plastic by sliding it parallel
2010 - 2011 74
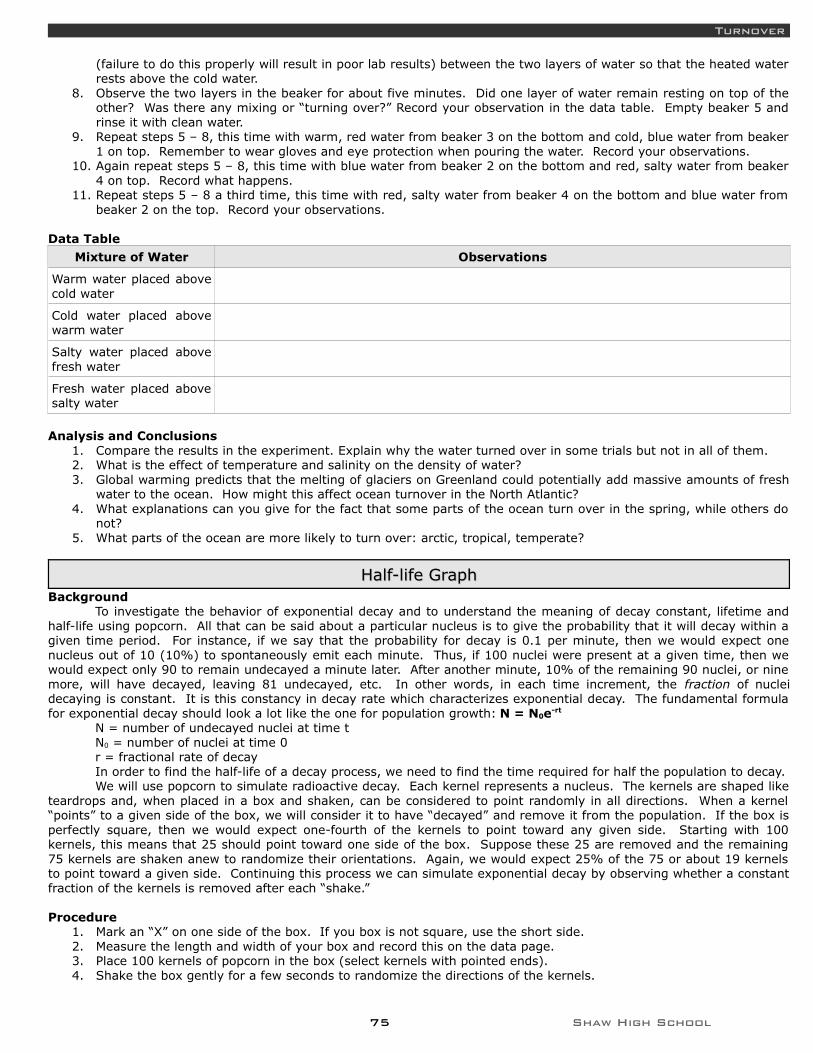
Turnover
(failure to do this properly will result in poor lab results) between the two layers of water so that the heated water rests above the cold water.
8. Observe the two layers in the beaker for about five minutes. Did one layer of water remain resting on top of the other? Was there any mixing or “turning over?” Record your observation in the data table. Empty beaker 5 and rinse it with clean water.
9. Repeat steps 5 – 8, this time with warm, red water from beaker 3 on the bottom and cold, blue water from beaker 1 on top. Remember to wear gloves and eye protection when pouring the water. Record your observations.
10. Again repeat steps 5 – 8, this time with blue water from beaker 2 on the bottom and red, salty water from beaker 4 on top. Record what happens.
11. Repeat steps 5 – 8 a third time, this time with red, salty water from beaker 4 on the bottom and blue water from beaker 2 on the top. Record your observations.
Data Table
Mixture of Water Observations
Warm water placed above cold water
Cold water placed above warm water
Salty water placed above fresh water
Fresh water placed above salty water
Analysis and Conclusions1. Compare the results in the experiment. Explain why the water turned over in some trials but not in all of them.2. What is the effect of temperature and salinity on the density of water?3. Global warming predicts that the melting of glaciers on Greenland could potentially add massive amounts of fresh
water to the ocean. How might this affect ocean turnover in the North Atlantic?4. What explanations can you give for the fact that some parts of the ocean turn over in the spring, while others do
not?5. What parts of the ocean are more likely to turn over: arctic, tropical, temperate?
Half-life GraphHalf-life GraphBackground
To investigate the behavior of exponential decay and to understand the meaning of decay constant, lifetime and half-life using popcorn. All that can be said about a particular nucleus is to give the probability that it will decay within a given time period. For instance, if we say that the probability for decay is 0.1 per minute, then we would expect one nucleus out of 10 (10%) to spontaneously emit each minute. Thus, if 100 nuclei were present at a given time, then we would expect only 90 to remain undecayed a minute later. After another minute, 10% of the remaining 90 nuclei, or nine more, will have decayed, leaving 81 undecayed, etc. In other words, in each time increment, the fraction of nuclei decaying is constant. It is this constancy in decay rate which characterizes exponential decay. The fundamental formula for exponential decay should look a lot like the one for population growth: N = N0e-rt
N = number of undecayed nuclei at time tN0 = number of nuclei at time 0r = fractional rate of decayIn order to find the half-life of a decay process, we need to find the time required for half the population to decay.We will use popcorn to simulate radioactive decay. Each kernel represents a nucleus. The kernels are shaped like
teardrops and, when placed in a box and shaken, can be considered to point randomly in all directions. When a kernel “points” to a given side of the box, we will consider it to have “decayed” and remove it from the population. If the box is perfectly square, then we would expect one-fourth of the kernels to point toward any given side. Starting with 100 kernels, this means that 25 should point toward one side of the box. Suppose these 25 are removed and the remaining 75 kernels are shaken anew to randomize their orientations. Again, we would expect 25% of the 75 or about 19 kernels to point toward a given side. Continuing this process we can simulate exponential decay by observing whether a constant fraction of the kernels is removed after each “shake.”
Procedure1. Mark an “X” on one side of the box. If you box is not square, use the short side.2. Measure the length and width of your box and record this on the data page.3. Place 100 kernels of popcorn in the box (select kernels with pointed ends). 4. Shake the box gently for a few seconds to randomize the directions of the kernels.
75 Shaw High School
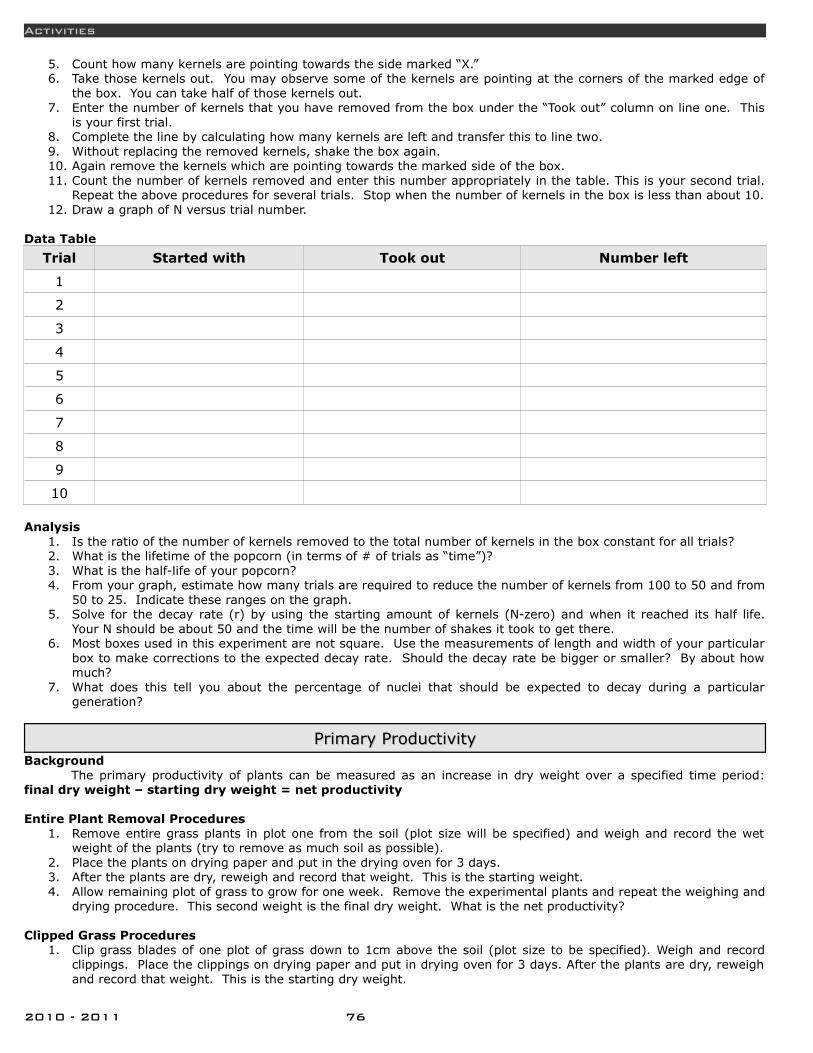
Activities
5. Count how many kernels are pointing towards the side marked “X.”6. Take those kernels out. You may observe some of the kernels are pointing at the corners of the marked edge of
the box. You can take half of those kernels out.7. Enter the number of kernels that you have removed from the box under the “Took out” column on line one. This
is your first trial.8. Complete the line by calculating how many kernels are left and transfer this to line two.9. Without replacing the removed kernels, shake the box again.10. Again remove the kernels which are pointing towards the marked side of the box.11. Count the number of kernels removed and enter this number appropriately in the table. This is your second trial.
Repeat the above procedures for several trials. Stop when the number of kernels in the box is less than about 10.12. Draw a graph of N versus trial number.
Data Table
Trial Started with Took out Number left
1
2
3
4
5
6
7
8
9
10
Analysis1. Is the ratio of the number of kernels removed to the total number of kernels in the box constant for all trials?2. What is the lifetime of the popcorn (in terms of # of trials as “time”)?3. What is the half-life of your popcorn?4. From your graph, estimate how many trials are required to reduce the number of kernels from 100 to 50 and from
50 to 25. Indicate these ranges on the graph.5. Solve for the decay rate (r) by using the starting amount of kernels (N-zero) and when it reached its half life.
Your N should be about 50 and the time will be the number of shakes it took to get there.6. Most boxes used in this experiment are not square. Use the measurements of length and width of your particular
box to make corrections to the expected decay rate. Should the decay rate be bigger or smaller? By about how much?
7. What does this tell you about the percentage of nuclei that should be expected to decay during a particular generation?
Primary ProductivityPrimary ProductivityBackground
The primary productivity of plants can be measured as an increase in dry weight over a specified time period: final dry weight – starting dry weight = net productivity
Entire Plant Removal Procedures1. Remove entire grass plants in plot one from the soil (plot size will be specified) and weigh and record the wet
weight of the plants (try to remove as much soil as possible).2. Place the plants on drying paper and put in the drying oven for 3 days. 3. After the plants are dry, reweigh and record that weight. This is the starting weight.4. Allow remaining plot of grass to grow for one week. Remove the experimental plants and repeat the weighing and
drying procedure. This second weight is the final dry weight. What is the net productivity?
Clipped Grass Procedures1. Clip grass blades of one plot of grass down to 1cm above the soil (plot size to be specified). Weigh and record
clippings. Place the clippings on drying paper and put in drying oven for 3 days. After the plants are dry, reweigh and record that weight. This is the starting dry weight.
2010 - 2011 76

Primary Productivity
2. Allow the grass blades of a second plot to continue growing for an additional week. Clip the grass of the second plot down to 1cm above the soil. Repeat the weighing and drying procedure. This second weight is the final dry weight. What is the net productivity?
Analysis1. Compare the net productivity figure of the ERP procedure to the clip procedure. Explain why the figures should be
similar and why they may be different.2. Which procedure appears to give the most reliable data? Why?3. Why are the results expressed as “net productivity” instead of “gross productivity”?4. Grass seed could have been replanted on the plot which had the grass removed in the ERP experiment and the
amount of growth could be recorded as productivity. Why would this not yield reliable data?5. If these grass plants continued to grow at the same rate over the 12-week summer period, what would be the net
productivity for a grassland which is one square kilometer?
Exposure!Exposure!Background
In this simulation, participants are “exposed” to various agents (confetti pieces) and then determine their exposure levels. A comparison between naturally occurring and synthetic pesticides is also made. This activity helps participants understand that chemicals may affect different people in different ways. Participants also realize that their perceptions of dangerous materials may not be realistic and that the news media may not provide all of the information needed to make healthy choices.
Materials Phenotype cards, different-colored confetti to represent various agents, purchased or made with colored paper and
a hole punch, different-shaped confetti to represent various agents, purchased or made with colored paper and scissors, masking tape or strips of contact paper, small disposable cups, broom and dust pan
Getting Ready In Part 1 of this activity, you will use different colors of confetti to find out what happens when people are exposed
to various synthetic chemicals. In Part 2, you will use different-shaped confetti to compare natural and synthetic chemicals for toxicity.
Because different colors of confetti will represent different agents in Part 1, if you purchase the confetti you’ll need to take a random sample and count the number of each color present. Assign the colors in greater quantities to represent agents that require a large exposure level in order to affect a person. (See the Part 1 Chemical Descriptions handout for exposure level information.) If you’re making your own confetti, the colors can be produced in appropriate relative quantities. For each participant in the class, fill a disposable paper cup about one-quarter or one-third full with a random mix of this confetti. You don’t need to count out the pieces, just make sure each cup contains roughly the same amount of confetti.
For Part 2, prepare the confetti by counting it into individual disposable cups (one cup for each participant) as follows: 20 multicolored stars, 15 multicolored hearts, and 9 black hexagons.
Procedure Notes and Outcomes Before beginning this activity, select an area with open floor space that can be easily cleaned. Give each
participant a 10-cm x 50-cm piece of wide masking tape or contact paper and have them write their name and the date on the non-sticky side of this strip. To simulate exposure to the agents, instruct the participants to hold the tape strip sticky side out and against their chest, and to walk toward you while you throw the different-colored confetti at the tape. Require that the participants hold their tape steadily at chest level. They should not be allowed to move the tape up and down to avoid the exposure.
Put three of the following class data tables on the board for Parts 1 and 2:
Class Data Table
Agent Number of people exposed Number of people affected
1
2
3
4
5
6
7
77 Shaw High School
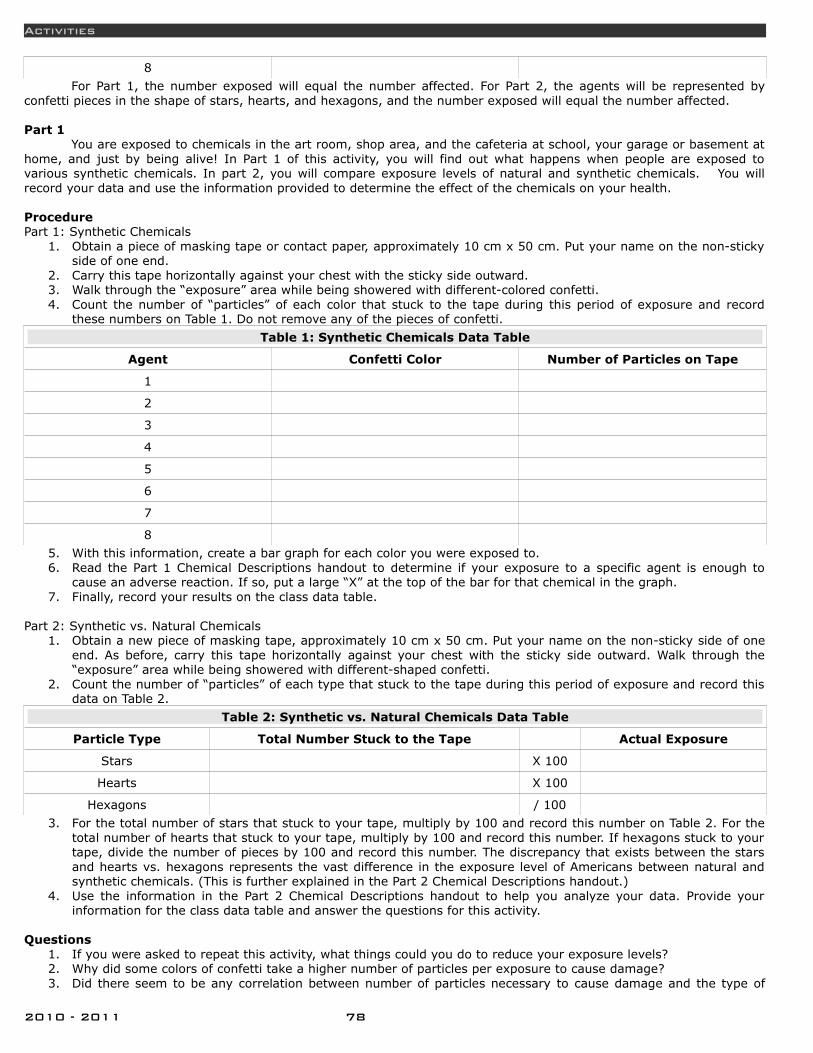
Activities
8
For Part 1, the number exposed will equal the number affected. For Part 2, the agents will be represented by confetti pieces in the shape of stars, hearts, and hexagons, and the number exposed will equal the number affected.
Part 1You are exposed to chemicals in the art room, shop area, and the cafeteria at school, your garage or basement at
home, and just by being alive! In Part 1 of this activity, you will find out what happens when people are exposed to various synthetic chemicals. In part 2, you will compare exposure levels of natural and synthetic chemicals. You will record your data and use the information provided to determine the effect of the chemicals on your health.
Procedure Part 1: Synthetic Chemicals
1. Obtain a piece of masking tape or contact paper, approximately 10 cm x 50 cm. Put your name on the non-sticky side of one end.
2. Carry this tape horizontally against your chest with the sticky side outward. 3. Walk through the “exposure” area while being showered with different-colored confetti. 4. Count the number of “particles” of each color that stuck to the tape during this period of exposure and record
these numbers on Table 1. Do not remove any of the pieces of confetti.
Table 1: Synthetic Chemicals Data Table
Agent Confetti Color Number of Particles on Tape
1
2
3
4
5
6
7
8
5. With this information, create a bar graph for each color you were exposed to.6. Read the Part 1 Chemical Descriptions handout to determine if your exposure to a specific agent is enough to
cause an adverse reaction. If so, put a large “X” at the top of the bar for that chemical in the graph. 7. Finally, record your results on the class data table.
Part 2: Synthetic vs. Natural Chemicals 1. Obtain a new piece of masking tape, approximately 10 cm x 50 cm. Put your name on the non-sticky side of one
end. As before, carry this tape horizontally against your chest with the sticky side outward. Walk through the “exposure” area while being showered with different-shaped confetti.
2. Count the number of “particles” of each type that stuck to the tape during this period of exposure and record this data on Table 2.
Table 2: Synthetic vs. Natural Chemicals Data Table
Particle Type Total Number Stuck to the Tape Actual Exposure
Stars X 100
Hearts X 100
Hexagons / 100
3. For the total number of stars that stuck to your tape, multiply by 100 and record this number on Table 2. For the total number of hearts that stuck to your tape, multiply by 100 and record this number. If hexagons stuck to your tape, divide the number of pieces by 100 and record this number. The discrepancy that exists between the stars and hearts vs. hexagons represents the vast difference in the exposure level of Americans between natural and synthetic chemicals. (This is further explained in the Part 2 Chemical Descriptions handout.)
4. Use the information in the Part 2 Chemical Descriptions handout to help you analyze your data. Provide your information for the class data table and answer the questions for this activity.
Questions 1. If you were asked to repeat this activity, what things could you do to reduce your exposure levels?2. Why did some colors of confetti take a higher number of particles per exposure to cause damage? 3. Did there seem to be any correlation between number of particles necessary to cause damage and the type of
2010 - 2011 78
Exposure!
damage that occurred? 4. In what situations or jobs might it be necessary to keep track of the chemicals and quantities you were exposed
to? 5. Although most employees do not keep data notebooks, there are laws that require employers to keep such
records. What types of chemicals might people be exposed to on the job? 6. What types of chemicals might people be exposed to in the home? 7. Why is it helpful to know a little bit about chemistry before using chemical agents such as the pesticide Roundup®
or bathroom cleaners? 8. Describe a situation in which you were exposed to toxic chemicals. 9. Why do people react differently to the same exposure level of the same chemical agent? 10. Why do you think so little attention is paid to the effects of natural pesticide exposure on the human population? 11. How do people obtain important health information? What are the benefits of these methods? What are the limits
to these methods? 12. How could you become better informed about what you could do to have a healthier lifestyle?
Parts 1 Chemical Descriptions The eight chemical agents represented by the different-colored confetti pieces in Parts 1 and 2 are discussed in the following paragraphs. Note that the exposure levels given are relative amounts.
– Agent 1 is a minor skin irritant at levels of three particles per exposure. It is excreted rapidly by the body within 24 hours of exposure.
– Agent 2 produces no immediate symptoms at exposure levels below eight particles per exposure. However, once Agent 2 enters the body, it is not eliminated. At a total body burden of eight or more particles, it is known to cause severe softening of the bones, making them break easily. Total recovery from this disorder is very rare, and those who suffer must restrict their lifelong activities to eliminate stress on the weakened bones.
– Agent 3 is a carcinogen. Any exposure increases a person’s likelihood of contracting nasal cancer by a factor of 30. The cancer may occur up to 20 years after exposure.
– Agent 4 causes irreversible lung damage at levels of 14 particles per exposure. However, if exposure is accompanied by any level of exposure to Agent 5, lung damage occurs at only three particles per exposure. (This is an example of synergy.)
– Exposure to Agent 5 alone does not cause any known disorder. – Agent 6 causes death at one particle of exposure. – Agent 7 is not currently suspected of being hazardous at any level. – Agent 8 is processed very slowly and not eliminated from the body. A total body burden of 26 particles is known to
cause severe liver damage and death within 2 years. If you have absorbed less than 26 particles you may still be in danger if you were previously exposed or if you are exposed to it in the future.
Part 2 Chemical Descriptions – Stars: These represent the estimated daily average American exposure to burned material in the diet. Studies
have shown that burned material (on toast, meat, cheese, roasted coffee, etc.) contains carcinogenic materials that are the by-products of burning.
– Hearts: These represent the daily average American exposure to natural pesticides (the chemicals that plants produce to defend themselves against fungi, insects, and animal predators). Studies have shown that the carcinogenicity of natural and synthetic chemicals is similar. Therefore, a diet free of chemicals that induce tumors in tests on rodents is virtually impossible. While we tend to fear the threat of synthetic pesticides, note that much of the exposure is actually coming from natural pesticides. Humans ingest roughly 5,000 to 10,000 different natural pesticides and their breakdown products.
– Hexagons: These represent the daily average American exposure to all synthetic pesticide residues combined. Note the large discrepancy between the amount of this exposure and the amount of exposure to naturally occurring pesticides. Despite this enormously greater exposure to natural chemicals, 78% of the chemicals tested by national health organizations for carcinogenicity are synthetic (do not occur naturally). Are we focusing on the right risks?
79 Shaw High School