activity 3.2: impacts of climate on forest succession
TRANSCRIPT

© Chicago Botanic Garden 1
Activity 3.2: Impacts of Climate on Forest Succession Grades 10 – 12 Description: Part 1: Tree Identification Activity – See the Forest for the Trees: Students will learn how to use a dichotomous key to identify native trees, and apply that knowledge to leaf identification in the classroom or on school grounds in preparation for Part 2. Part 2: Is the Environment Really Changing? A study of climate impacts on local forest preserve succession: Students describe and give examples of the progression of several stages for a local environment such as a forest preserve or an old field. Students collect data on the species distribution for an area and based on that data predict past and future species composition of a local environment. Students use basal area, relative density, relative dominance, and other importance values for each plant species to determine how the forest is changing and how natural succession may be impacted by a changing climate. Time: Total for all activities, one full field-trip day and two to four class periods
Materials: Part 1 Per group • Approximately 15 leaves (one per
pair of students as well as a few extra)
• One woodlands dichotomous key for your region per pair of students (see Teacher Notes part 1)
Per person • One handout per student Part 2 Per group • One roll of DBH tape • One roll of 30 meter tape
• One marking flag • Two rulers • One compass • Tree identification guide(s) Per person • One clipboard per person • Pencil
National Science Education Standards: C3.e Biological classifications are based on how organisms are related. Organisms are classified
into a hierarchy of groups and subgroups based on similarities that reflect their evolutionary relationships. Species is the most fundamental unit of classification.
C4.c Organisms both cooperate and compete in ecosystems. The interrelationships and interdependence of these organisms may generate ecosystems that are stable for hundreds or thousands of years.
AAAS Benchmarks: 5D/H1 Ecosystems can be reasonably stable over hundreds or thousands of years. As any
population grows, its size is limited by one or more environmental factors: availability of food, availability of nesting sites, or number of predators.
5D/H2 If a disturbance such as flood, fire, or the addition or loss of species occurs, the affected ecosystem may return to a system similar to the original one, or it may take a new direction, leading to a very different type of ecosystem. Changes in climate can produce very large changes in ecosystems.
5F/H10 The continuing operation of natural selection on new characteristics and in diverse and changing environments, over and over again for millions of years, has produced a succession of diverse new species.
© Chicago Botanic Garden 2
Guiding Questions: • How are trees identified? • What are the common tree species in the past, present, and future in my local forest? • How is the tree community in the forest changing?
Pre-Activity Preparation:
Part 1 • Collect leaf samples on branches or order a tree identification kit. Tree ID Kits can be
purchased at the following sites: - http://www.acornnaturalists.com/store/LEAF-IDENTIFICATION-KIT-
P701C212.aspx - http://www.carolina.com/preserved-plants/leaf-identification-kit/223500.pr - http://youngnaturalistcompany.com/classroomkits.html
Part 2 • If you plan on taking your class to a forest preserve for Part 2 of this activity,
schedule a field-trip day with your school, principal, and students. Teacher Notes: Part 1: This lesson must take place prior to the succession lesson in order for students to have the background knowledge that is required to identify forest tree species. Although various methods exist for identifying trees, this lesson utilizes the Tree Finder book series written by May Theilgaard Watts, published by Nature Study Guild Publishers (www.naturestudy.com). This publisher offers a number of excellent dichotomous keys for a variety of different woodland ecosystems, but any simple dichotomous key will work for this activity. Students do not need to have any prior experience with dichotomous keys. All of the required information can be taught within the body of the lesson. It is recommended that you collect samples of trees with which students are familiar to better facilitate instruction and help individual student groups during the activity. If you are not familiar with local trees, it is possible to order tree identification kits with answer keys. Part 2: Ideally, this lesson will occur at the end of an ecology unit during a season in which the trees in your area have leaves that can be identified by students; timing may differ depending on your location. In order to accomplish the goals of this lesson, students should be familiar with the concept of succession, as well as common terms used to identify trees such as opposite vs. alternate bud orientation, simple vs. compound leaves. They should be familiar with how to use a dichotomous key such as May Watts’s Tree Finder or some other tree identification tool. Ideally, students will be familiar with the sampling method that will be used during the field trip and will also know how to use both the measuring tape and the DBH tape. Although the analysis portion of the experiment looks to be intimidating, it really is not. There are many steps involved, but the math is simple. Students should be instructed to take each calculation one step at a time. Once completed, they will have an accurate and well-informed picture of forest community structure. As is, the lesson allows one class period for in-class analysis. This may need to be adjusted based on the ability level of students.
© Chicago Botanic Garden 3
You may also want to review the concepts of succession and seral stages with students before you being this lesson. Ecological succession is the observed process of change in the species structure of an ecological community over time. Given an empty tract of land, the community begins with relatively few pioneering plants and animals and develops through increasing complexity until it becomes stable or self-perpetuating as a climax community. Each intermediate stage in ecological succession of an ecosystem is called a seral stage. A seral community is the name given to each group of plants within the succession. In many cases more than one seral stage evolves before climax conditions are attained. Succession may be initiated either by formation of new, unoccupied habitat (e.g., a lava flow or a severe landslide) or by some form of disturbance (e.g. fire, logging) of an existing community. Succession that begins in new habitats, uninfluenced by pre-existing communities is called primary succession, whereas succession that follows disruption of a pre-existing community is called secondary succession. Forests succession evolves through a number of seral stages. Bare land is colonized by "opportunistic" or "pioneer" species that produce great quantities of seed that are disseminated by the wind, beginning with grasses and then perennials, and therefore can colonize big empty extensions. They are capable of germinating and growing in direct sunlight. Once they have produced a closed canopy, the lack of direct sunlight to the soil makes it difficult for their own seedlings to develop. Shade-tolerant species then become established under the protection of the pioneers. When the pioneers die, the shade-tolerant species replace them. These species are capable of growing beneath the canopy, and therefore, in the absence of catastrophe, will remain. For this reason it is then said the stand has reached its climax. When a catastrophe occurs, the opportunity for the pioneers opens up again, provided they are present or within a reasonable range.

© Chicago Botanic Garden 4
Lucas Frey, Louisiana State University, 2011
© Chicago Botanic Garden 5
Part 1: Tree Identification Activity – See the Forest for the Trees Time: This lesson can be completed in one class period depending on how many leaves students are asked to identify and the degree of specificity. Students should be able to identify 3-5 leaves during a standard class period. Homework questions can be briefly discussed the following day in class. Implementation notes: Depending on the ability level of students, you may wish to have students simply classify each tree to a more general level. For example, students could identify a sample as an oak, maple, or elm, rather than as a white oak, sugar maple, or slippery elm. The amount of specificity is entirely up to the teacher because students will still be able to analyze the past, present, and future status of a forest during the succession activity even if trees are simply classified as oak, maple, elm, etc. It should also be noted that if this activity is conducted indoors, you will either need leaves on branches, or you will need to tell students if the leaves are opposite or alternate since this cannot be determined by simply looking at a leaf that is not attached to a branch. Write which leaves are opposite and which are alternate on the board. There is a simple mnemonic device that can help when out in the field. The phrase, “MAD Horse Bucks Cat,” refers to all common deciduous trees with opposite leaf arrangement. The phrase can be broken down like this: M = maple, A = ash, D = dogwood, Horse = horse chestnut, Bucks = Ohio buckeye, and Cat = catalpa. All other trees have alternate leaf arrangement. Procedure: 1. Introduction: Begin the lesson by describing the upcoming forest preserve field trip (for the
forest succession lessons) and how students will need to be able to identify trees on their own in order to get accurate data. If you have already started Project BudBurst, you can remind students that they have already had some experience identifying plants using field guides, but that dichotomous keys are more specific, and focus in detail on the structure of the plant. Describe to students that although many scientists can simply identify trees and other plants by sight as they become more familiar with them. There are identification guides that are meant to help identify all types of organisms based on certain defining features.
2. Tell students that the guides they will use for this activity are called dichotomous keys. ‘Di’
means ‘two’, which means that students will be given a choice between two features and will have to decide which feature is present on their leaf. For example, is the edge of the leaf smooth or does it have teeth?
3. Before beginning the activity, explain the following terms to students: opposite vs. alternate,
simple vs. compound, margins, and lobes. Terms should be explained in words and also in pictures/drawings. Pass out the student handout “Tree Identification Activity – See the Forest for the Trees.” Explanations of the terms are below.
• Opposite – two leaves are found at the same point on a branch. One leaf is found on the left side and another is found on the right side.
• Alternate – leaves are found at different points on a branch. One leaf is found on the left side and then, further up the branch, another leaf is found on the right side.
© Chicago Botanic Garden 6
• Simple – simple leaves are those in which only one leaf is attached to the stalk that comes from the branch.
• Compound – compound leaves are those in which many leaves (called leaflets) are attached to the stalk that comes from the branch
• Margin – the margin is the edge of the leaf. It may be smooth, rough, toothed, wavy, etc.
• Lobes – when a leaf has many extensions and does not form a simple shape such as an oval or a spade it is said to be lobed. The teacher may wish to refer to earlobes as extensions of the pinna in order to help explain this concept. Drawings are also helpful.
4. Distribute one dichotomous key (Tree Finder) book to each pair of students. Before
beginning, walk through a practice identification problem with the whole class. Either distribute a leaf to all groups or display a picture.
5. Once the practice problem is finished, instruct the class to begin the activity. Each group of
two students will identify one leaf at a time. Circulate the room and answer questions as they arise. Correct any identification errors.
6. Depending on time, students should identify 3-5 leaves on their own. They should record
their progress on their individual work pages, and answer handout questions as appropriate.
7. Closure: Students should be instructed to return their leaves and Tree Finder books. The teacher should ask each student pair to share one leaf that they identified and describe some of its features. Students should also be encouraged to share the most interesting thing that they learned about leaves and tree identification during the activity.
Assessment: Student understanding of objectives and concepts will be assessed as the teacher circulates during the activity, and also by completion of questions on the student handout. Extension: Depending on the area surrounding the school, students could identify trees on school property. This may pose a challenge due to the wide variability that exists in cultivated varieties of certain tree species. Also, the Tree Finder is meant to be used to identify most naturally-occurring species. However, students should be able to classify each tree to a reasonable level. You may wish to follow this lesson with a presentation of the most common trees in your area woodlands so students know which trees to expect to find. This may help students realize when they have identified a tree improperly using their dichotomous key.
© Chicago Botanic Garden 7
Part 2: Is the Environment Really Changing? A Study of Local Forests and Succession Time: 1 full field-trip day and 2.5 class periods (one class period before the trip to discuss expectations, how to take data, and how to use equipment, one class period after the trip for data analysis and discussion, half of a period after the trip for further discussion and conclusions)
Teacher Notes: In order to accomplish the goals of this lesson, students should be familiar with the concept of succession, as well as common terms used to identify trees such as opposite vs. alternate bud orientation, and simple vs. leaves. They should be familiar with how to use a dichotomous key such as May Watts’s Tree Finder or some other tree identification tool. Ideally, students will be familiar with the sampling method that will be used during the field trip and will also know how to use both the measuring tape and the DBH tape. Although the analysis portion of the experiment looks intimidating, it really is not. There are many steps involved, but the math is simple. Students should be instructed to take each calculation one step at a time.
Materials: Part 2 • Historical forest succession
data for your region (see implementation notes)
Per group • One roll of DBH tape • One roll of 30 meter tape • One marking flag • Two rulers • One compass • Tree identification guide(s) Per person • One clipboard • One handout “Is the Environment
Really Changing? A Study of Local Forests”
• Pencil
Implementation Notes: Contact your local forest preserve district, a nearby state or national park, or your state Forest Association for historical data on the forest succession in your region. Students will compare this information with the data they collect in Day 3 activities and draw conclusions about how the forest has changed from the past and how it may change in the future. Approximately two trips to a forest preserve should be enough for students to accurately gather enough data. Depending on the area around the school, it is possible that students could study the changes in environments near school grounds. For example, students could compare the species composition of an old field with that of a restored prairie. If it is not possible to take students on a field trip, you may collect sample data from a forest preserve district for students to use for the class analysis. Class time can be used to analyze the data, draw conclusions, and generate predictions as described above. Another option could be to take students to forest preserves during double period or block classes.
© Chicago Botanic Garden 8
Procedure: DAY 1 1. Introduction: Pass out the student handout “Is the Environment Really Changing? A Study
of Local Forests.” Preface the field trip by asking students how local environments, specifically forests, are changing. What did our forests look like a long time ago? What do they look like now? What will they look like 100 years in the future? Do all environments change? Can we predict those changes? Students will record answers to these questions on their handout.
2. Upon arrival at a local forest preserve, students will separate into their groups (approximately four
students each). Each group should head off into the forest and choose a random spot from which they will begin collecting data. Data will be collected using the point-quarter method of random sampling as described below:
• A random point is chosen which will act as the “center point” of set of axes with four distinct quarters. A flag is used to mark this point.
• Quarter I (0-90 degrees from center point) is sampled first as described below: o The seedling (<2cm DBH), sapling (2-15 cm DBH), and canopy tree (>15 cm
DBH) nearest the center point are located. o For each tree, the following is recorded: identification, DBH, and distance from
center point. • Quarter II (90-180 degrees), Quarter III (180-270 degrees), and Quarter IV (270-360
degrees) are sampled according to the same directions. • At least one more randomly chosen site should be studied according to these
directions. If time permits, more sites could be studied. 3. Closure: At the end of the trip, the teacher could ask students questions regarding their
preliminary data. What are some of the tree species that were identified? Did they find the same species at each point? How does your data compare to other groups? If the species are different, what do you think caused the differences?
DAY 2 1. Introduction: Start the lesson by reviewing what was done the previous day. You may want
to mention how analysis of the data will allow the class to predict the past and future of the forest community based on its present status.
2. Students should join the group with which they worked during the field trip the previous day.
• Each group will calculate basal area, relative frequency, relative density, relative dominance, and importance value of each recorded species. Then, they will answer questions on their handout.
• The teacher will circulate throughout the room and answer any questions during this time period.
3. Closure: Now that each student has a more complete picture of the forest, the teacher can ask
students to draw preliminary conclusions. What was noticed from the mathematical data? What are some of the most important species in the forest? What did the forest look like in the past? What might it look like in the future?
• For homework, students should use class data to answer questions individually on their own handout.
© Chicago Botanic Garden 9
DAY 3 1. Introduction: Begin class by asking students to share what they discovered about the forest
by answering the analysis questions the previous night. How do the conclusions that were made within your individual group compare with those made from class data? What will the forest look like in the future?
2. Spend time answering any questions that students had regarding the homework assignment. 3. Discuss the different plant species that were observed and the natural history of each species
that would explain these findings. Perhaps more species were seen near the edge of the forest, but most were invasive, or low-lying areas in the forest were dominated by different species than upland areas.
4. The teacher should then display relative density, relative dominance, and importance value
data for the class. From this the class should generate an overall conclusion regarding the past and future composition of the forest.
• If possible, the conclusions that students reach about the past history of the forest should be compared to historical data of forest composition. Though as of the writing of this curriculum, there is no centralized location for such data, many local forest preserve districts and state and national parks have historical records of such data for their region, and are more than willing to share that information. State Forestry Associations can also be helpful in identifying local forest succession patterns.
Although specific data from the site that was visited during the field trip may not be available, it will be possible for students to see the species composition of certain forests in the area and make inferences as to what the forest they visited looked like many years ago. Also, if certain species that were mentioned in the historical data are no longer present in the area, you can use that opportunity to have students predict what may have happened that caused that species to disappear (change in temperature, soil nutrients, hydrology, or presence of invasive species, change in land usage, etc.)
4. Discuss possible errors or biases that could have affected the data. For example: • Did students actually choose a spot at random or did they choose an open spot that
was not crowded with plants? • Did they choose a spot with familiar plants? • When measuring the nearest sapling, seedling, and canopy tree did students actually
choose the appropriate tree or did they choose a tree that they could identify? • How could these behaviors have affected the data? • What are the natural and human factors that influence the species composition of the
forest? 5. A possible homework assignment could be to have students decide what should be done
about our local forests. Should our forests be left to change or should something be done to preserve their past species composition?

© Chicago Botanic Garden 10
Assessment: Student understanding of learning goals and concepts will be assessed via closure questions, individual consultation with each group, and student answers on handout questions. Extensions: If time permits, students may also record woody and herbaceous species present in quadrants placed randomly throughout the forest preserve to determine the floristic quality index of the environment. One group of students could study the forest edge while another could study the forest interior. The results could be compared so that students can understand the differences between each environment and explain their respective species compositions and overall quality. Useful Websites: To purchase forestry supplies - http://www.forestry-suppliers.com/ Tree Finder dichotomous keys - Nature Study Guild Publishers www.naturestudy.com/ Tree ID Kits -
• http://www.acornnaturalists.com/store/LEAF-IDENTIFICATION-KIT-P701C212.aspx • http://www.carolina.com/preserved-plants/leaf-identification-kit/223500.pr • http://youngnaturalistcompany.com/classroomkits.html
Student Handout: “Is the Environment Really Changing?”

© Chicago Botanic Garden 11
NAME DATE _____________ PERIOD ________ Part 1: Tree Identification Activity – See the Forest for the Trees There are many traits that can be used to identify a tree such as its bark, fruit, and shape. However, the easiest trait to use is the leaves. While walking in a forest, it can seem that most trees simply blend together, but a forest may contain dozens of different species. It is important for scientists to identify trees for research but it is also important for anyone to identify them too in order to learn about them and gain an appreciation for local plant diversity. During this activity you will use a dichotomous key in book form. Before you begin, you must know the difference between some common terms related to leaves. Fill in the spaces below as we go through them together. OPPOSITE/ALTERNATE: SIMPLE/COMPOUND: MARGIN: LOBE: Fill in the data table below as you identify leaves. Try to identify five different leaves. You may try to identify more if you have the time. Num. Common Name Scientific Name Important Features
© Chicago Botanic Garden 12
Analysis Questions 1. What are some of the main features that you used to identify leaves? List three features and
then describe the options for each feature.
2. Which two leaves that you identified were the most similar? Explain using specific traits.
3. Which two leaves that you identified were the most different? Explain using specific traits.
4. What is the difference between a simple leaf and a compound leaf? What is the difference between alternate leaves and opposite leaves?
5. Leaves can change size depending on the age of a tree and also the location of the leaves on the tree itself. For example, the leaves of a young tree are usually much bigger than the leaves of an adult tree. The leaves at the bottom of a tree are also usually much bigger than the leaves at the top of a tree. Use this information to explain why leaves are different sizes based on their age or location. What advantage does this give a tree?
© Chicago Botanic Garden 13
NAME ___________________________________ DATE ________ PERIOD ______
Part 2: Is the Environment Really Changing? A Study of Local Forests and Succession
One of the few constants in life is that it is always changing. The same can be said for natural areas as well. Change can occur at both small and large scales, internally and externally, and at different lengths of time. Ecologists have always studied how ecosystems change in an attempt to understand them. However, in recent years, our attention has shifted from simply trying to understand ecosystems to trying to preserve them in their current state or restore them to their previous state. The study of ecological succession will continue to be an important area of research as our natural areas continue to shrink and continue to be subject to the external pressures of humanity. During this experiment, you will study a portion of a local forest preserve. In order to determine how important a tree is to a forest, scientists look at the overall size of the tree and how often that specific tree occurs throughout the forest. You will determine the size of a tree by measuring its diameter and converting it into basal area, which refers to how much space the tree takes up. You will determine how often a tree occurs by counting and comparing the numbers of each species you find during your study. The combination of these factors will help you determine the importance of each tree species, which can be used to determine what the forest looked like in the past, which trees are vital to the present day forest, and make predictions regarding what the forest will look like in the future. Pre-lab Questions 1. What is ecological succession? Why is it an important area of ecological research? 2. What type of natural environments can you presently find in our region? How do these
environments compare to those that were here hundreds of years ago? 3. Are forests in our region currently changing? Please explain your answer and give specific
examples. Do not worry about being right or wrong. Just write down what you think is happening.

© Chicago Botanic Garden 14
NAME ___________________________________ DATE _______ PERIOD ________ Materials Your group should have the following equipment: One roll of DBH tape One roll of 30-meter tape One marking flag Two rulers One compass One clipboard per person Tree identification guide(s)
Methods 1. Walk into the forest at least 10 meters from the edge before choosing a random point as the
center of your plot. Place your marking flag into the ground at this point. This is point #1. 2. You will use the point-quarter method for sampling.
This means that you will study the forest in four quarters from the center point that was marked with the flag. Imagine that the flag represents the center point on a compass. Your study area can be divided into four quarters by lines that extend north (0 degrees), east (90 degrees), south (180 degrees), and west (270 degrees) from the center point. Refer to the diagram below for help. You may need to use two rulers to form a cross at the center point to help visualize each quarter
3. Begin your sampling of point #1, quarter I (0 degrees – 90
degrees). Find the seedling, sapling, and canopy tree that are nearest the center point of your study area. Tree categories are defined by their dbh (diameter at breast height in cm) according to the table. a. DBH is taken by wrapping the DBH tape around a tree at
the breast height of the scientist (about 4.5 feet). The tape should be snug against the bark of the tree prior to taking a measurement. Use the picture for help
4. Identify each seedling, sapling, and canopy tree to the best of
your ability using any identification guides that you have. Do not worry about identifying a specific species. For example, it is not necessary to distinguish between “green ash” and “white ash.” Simply saying “ash” will be adequate.
5. Use the 30m tape to measure the distance from the
center point to the center of each seedling, sapling, and canopy tree. Record all data in Data Table 1.
CATEGORY DBH (cm) Seedling ≤ 1.0 Sapling 1.1 – 15.0 Canopy Tree > 15.0
© Chicago Botanic Garden 15
6. Once you have finished collecting data in quarter I, move on to quarter II (90 degrees – 180 degrees). Repeat steps 3-5.
7. Repeat steps 3-6 for quarter III (180 degrees - 270 degrees) and quarter IV (270 degrees –
360 degrees).
a. Once you have finished sampling all four quarters of point #1, pick up your marking flag and move to your next point, time permitting.
b. Depending on time, you may have to sample point #2 on a different day. c. Walk at least 15 meters from point #1 to find point #2. Choose a random spot and place
the marking flag into the ground.
8. Repeat steps 3-7 to sample point #2. 9. You have successfully sampled your portion of the forest! Be sure to collect all materials
and return them to your teacher.
© Chicago Botanic Garden 16
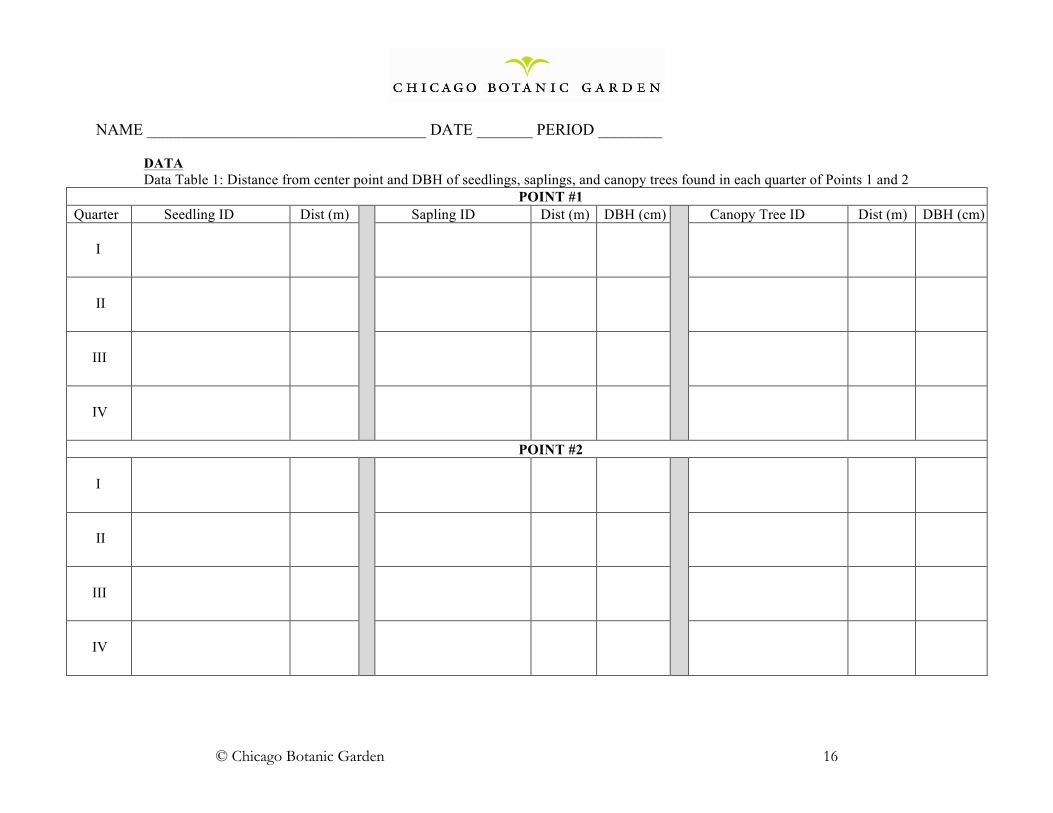
NAME ___________________________________ DATE _______ PERIOD ________ DATA Data Table 1: Distance from center point and DBH of seedlings, saplings, and canopy trees found in each quarter of Points 1 and 2
POINT #1 Quarter Seedling ID Dist (m) Sapling ID Dist (m) DBH (cm) Canopy Tree ID Dist (m) DBH (cm) I
II
III
IV
POINT #2 I
II
III
IV
© Chicago Botanic Garden 17
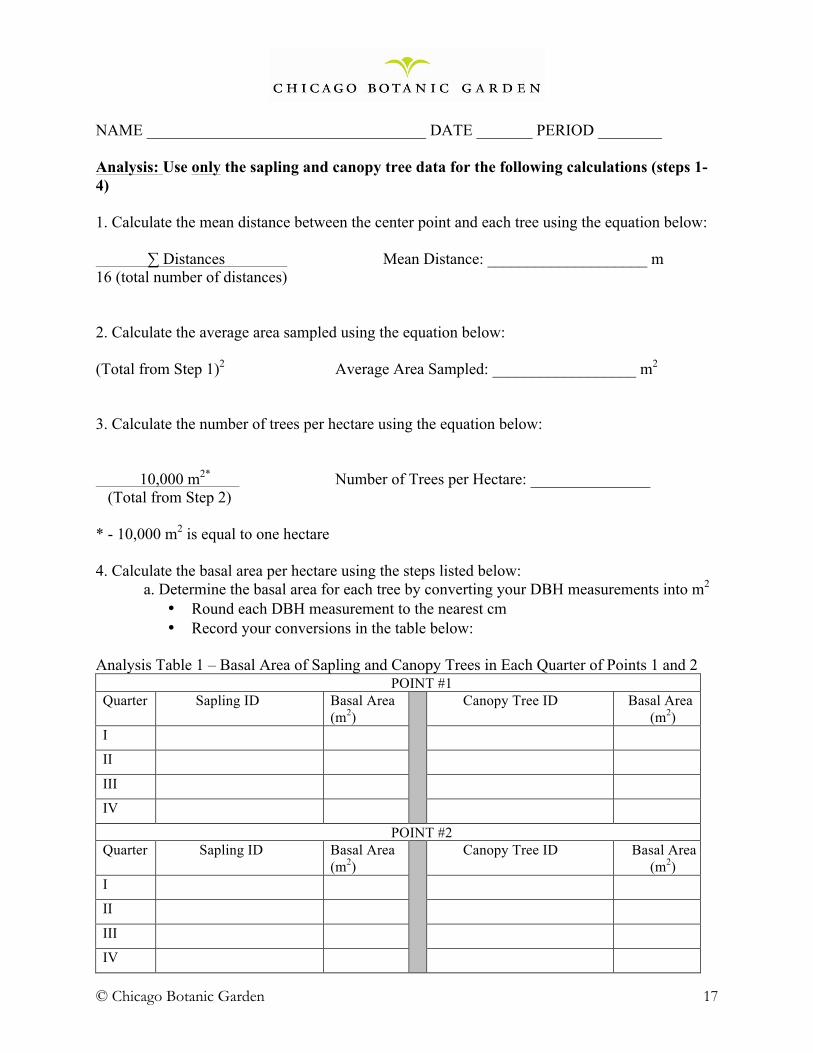
NAME ___________________________________ DATE _______ PERIOD ________ Analysis: Use only the sapling and canopy tree data for the following calculations (steps 1-4) 1. Calculate the mean distance between the center point and each tree using the equation below:
∑ Distances Mean Distance: ____________________ m 16 (total number of distances) 2. Calculate the average area sampled using the equation below: (Total from Step 1)2 Average Area Sampled: __________________ m2
3. Calculate the number of trees per hectare using the equation below:
10,000 m2* Number of Trees per Hectare: _______________
(Total from Step 2)
* - 10,000 m2 is equal to one hectare
4. Calculate the basal area per hectare using the steps listed below: a. Determine the basal area for each tree by converting your DBH measurements into m2
• Round each DBH measurement to the nearest cm • Record your conversions in the table below:
Analysis Table 1 – Basal Area of Sapling and Canopy Trees in Each Quarter of Points 1 and 2
POINT #1 Quarter Sapling ID Basal Area
(m2) Canopy Tree ID Basal Area
(m2) I
II
III
IV
POINT #2 Quarter Sapling ID Basal Area
(m2) Canopy Tree ID Basal Area
(m2) I
II
III
IV

© Chicago Botanic Garden 18
NAME ___________________________________ DATE _______ PERIOD ________
a. Add-up all basal areas and record that value below:
∑ Basal areas: ____________________ m2
c. Calculate basal area per tree using the equation below:
Total from Step 4b Basal area per tree: _____________ 16* * This is the total number of trees sampled. If more points were sampled, this number
must be adjusted accordingly d. Calculate basal area per hectare using the equation below: (Total Step 4c) x (Total Step 3)* Basal area per hectare: ___________ *( - Basal area / tree) x (Number of trees / hectare) Basal area per hectare is a measure of the total volume of wood sampled. These numbers will be used to calculate the dominance of a tree species.
_______________________________________________________________________ Use all sampled tree data (seedling, sapling, and canopy tree) for the following calculations (steps 5-9) 5. Calculate the frequency value for each tree species using the equation below:
• Record values in Analysis Table 2 on the next page:
Number of points at which a species occurred * Total number of points sampled **
* This number will be either 1 or 2 because a tree species will have occurred at either one point
or both points that were sampled. If more points were sampled, this number must be adjusted accordingly
** This number should be 2 since two points were sampled. If more points were sampled, this
number must be adjusted accordingly.
© Chicago Botanic Garden 19
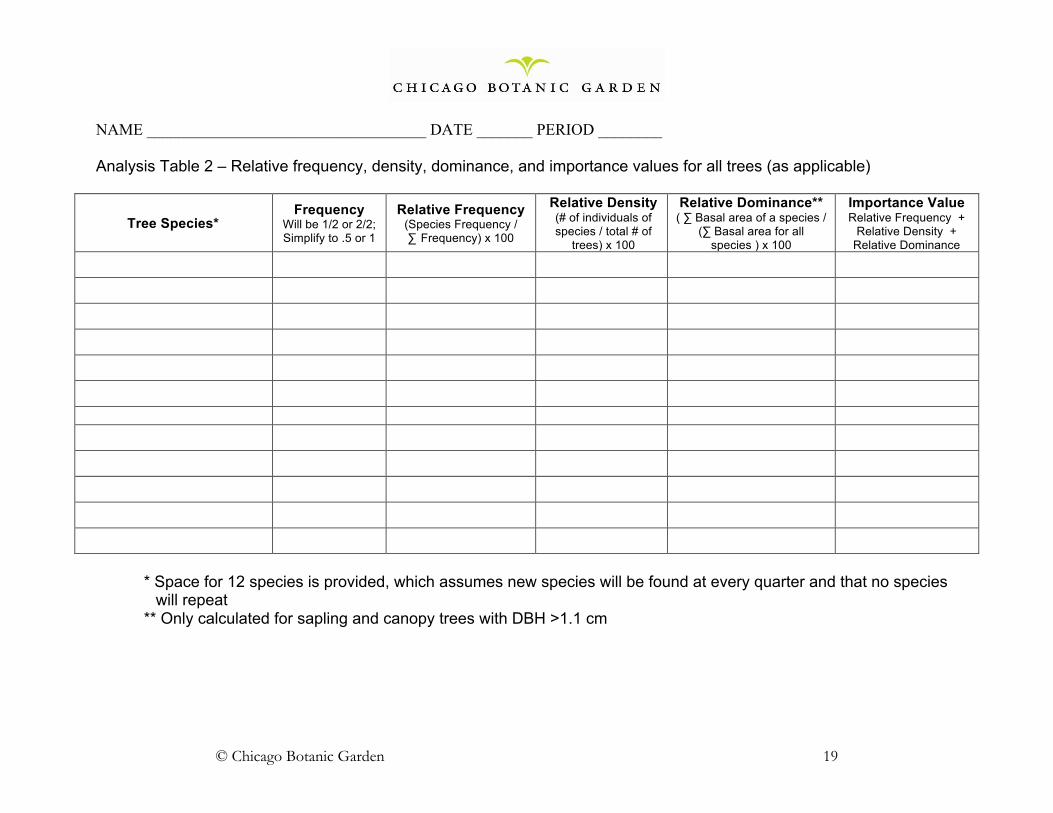
NAME ___________________________________ DATE _______ PERIOD ________ Analysis Table 2 – Relative frequency, density, dominance, and importance values for all trees (as applicable)
Tree Species* Frequency
Will be 1/2 or 2/2; Simplify to .5 or 1
Relative Frequency (Species Frequency / ∑ Frequency) x 100
Relative Density (# of individuals of species / total # of
trees) x 100
Relative Dominance** ( ∑ Basal area of a species /
(∑ Basal area for all species ) x 100
Importance Value Relative Frequency +
Relative Density + Relative Dominance
* Space for 12 species is provided, which assumes new species will be found at every quarter and that no species
will repeat ** Only calculated for sapling and canopy trees with DBH >1.1 cm
© Chicago Botanic Garden 20
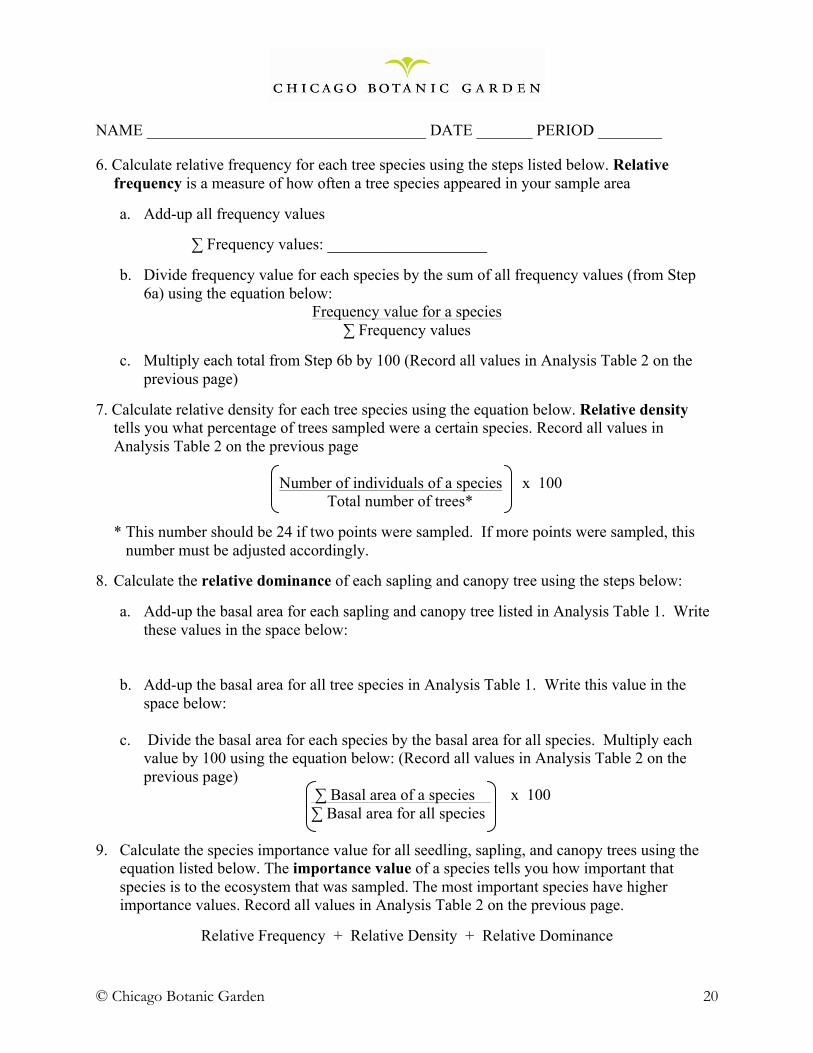
NAME ___________________________________ DATE _______ PERIOD ________ 6. Calculate relative frequency for each tree species using the steps listed below. Relative
frequency is a measure of how often a tree species appeared in your sample area
a. Add-up all frequency values ∑ Frequency values: ____________________
b. Divide frequency value for each species by the sum of all frequency values (from Step 6a) using the equation below:
Frequency value for a species ∑ Frequency values
c. Multiply each total from Step 6b by 100 (Record all values in Analysis Table 2 on the
previous page) 7. Calculate relative density for each tree species using the equation below. Relative density
tells you what percentage of trees sampled were a certain species. Record all values in Analysis Table 2 on the previous page
Number of individuals of a species x 100 Total number of trees*
* This number should be 24 if two points were sampled. If more points were sampled, this
number must be adjusted accordingly. 8. Calculate the relative dominance of each sapling and canopy tree using the steps below:
a. Add-up the basal area for each sapling and canopy tree listed in Analysis Table 1. Write these values in the space below:
b. Add-up the basal area for all tree species in Analysis Table 1. Write this value in the
space below: c. Divide the basal area for each species by the basal area for all species. Multiply each
value by 100 using the equation below: (Record all values in Analysis Table 2 on the previous page)
∑ Basal area of a species x 100 ∑ Basal area for all species 9. Calculate the species importance value for all seedling, sapling, and canopy trees using the
equation listed below. The importance value of a species tells you how important that species is to the ecosystem that was sampled. The most important species have higher importance values. Record all values in Analysis Table 2 on the previous page.
Relative Frequency + Relative Density + Relative Dominance
© Chicago Botanic Garden 21
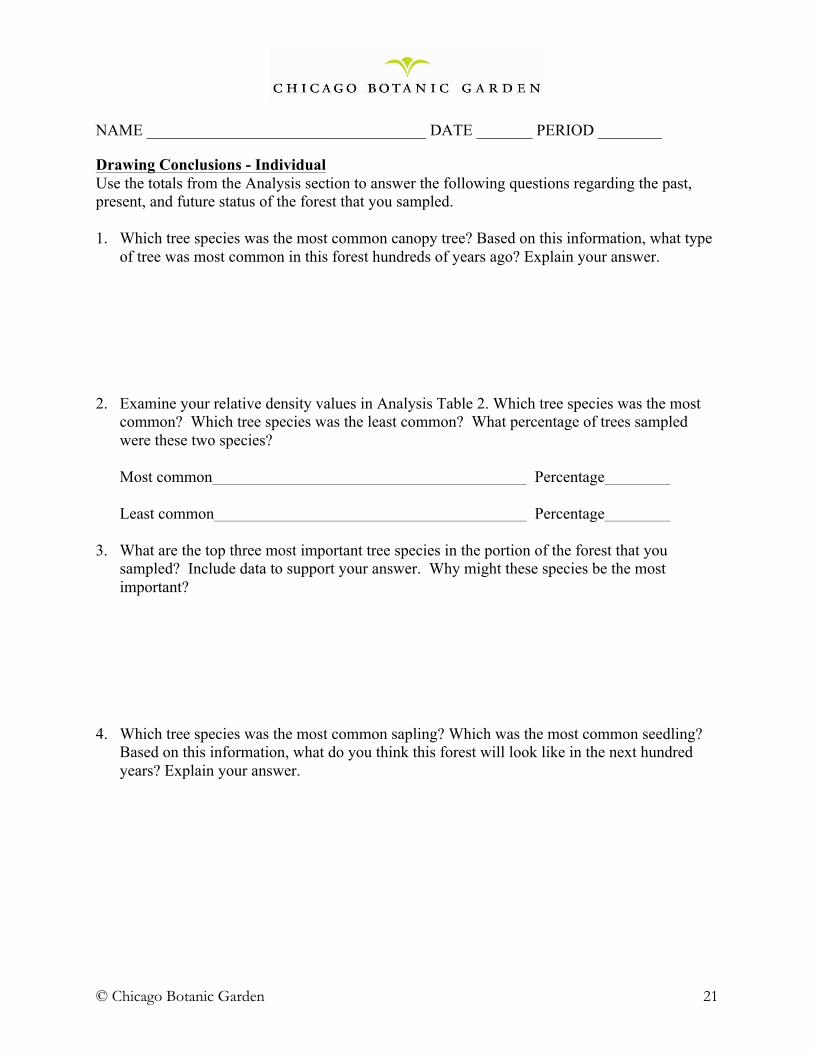
NAME ___________________________________ DATE _______ PERIOD ________ Drawing Conclusions - Individual Use the totals from the Analysis section to answer the following questions regarding the past, present, and future status of the forest that you sampled. 1. Which tree species was the most common canopy tree? Based on this information, what type
of tree was most common in this forest hundreds of years ago? Explain your answer. 2. Examine your relative density values in Analysis Table 2. Which tree species was the most
common? Which tree species was the least common? What percentage of trees sampled were these two species?
Most common Percentage Least common Percentage
3. What are the top three most important tree species in the portion of the forest that you
sampled? Include data to support your answer. Why might these species be the most important?
4. Which tree species was the most common sapling? Which was the most common seedling?
Based on this information, what do you think this forest will look like in the next hundred years? Explain your answer.

© Chicago Botanic Garden 22
NAME ___________________________________ DATE _______ PERIOD ________ 5. Was the most common canopy tree also the most common sapling or seedling? What does
this mean about the future of the most common canopy tree? Explain your answer. 6. Existing trees in the forest you surveyed have adapted to past local conditions. However, as
humans have moved closer to forests, they have introduced a variety of challenges in different regions – intensive logging, invasive species, forest fires, land use changes – that may impact normal forest succession. List some of the challenges in your region and explain how each might the impact forest succession?
7. The challenges you noted above may impact the survival of native trees and the animals that
depend on them. What are some suggestions that you can think of to help keep native trees dominant in our forests? How might ecologists and forest managers work to help native offspring survive in forests that have been changed by humans?

© Chicago Botanic Garden 23
Drawing Conclusions – Whole Class Use the space below to respond to class discussion questions as directed by your teacher.
© Chicago Botanic Garden 24
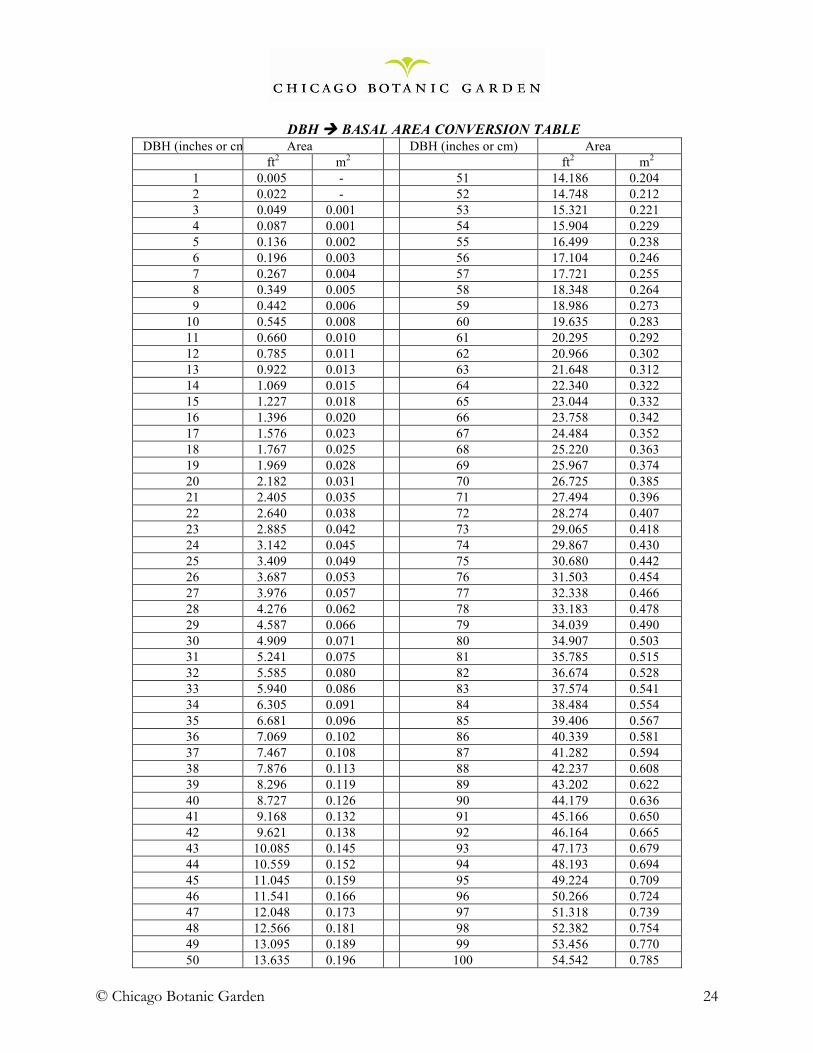
DBH ! BASAL AREA CONVERSION TABLE DBH (inches or cm) Area DBH (inches or cm) Area ft2 m2 ft2 m2 1 0.005 - 51 14.186 0.204 2 0.022 - 52 14.748 0.212 3 0.049 0.001 53 15.321 0.221 4 0.087 0.001 54 15.904 0.229 5 0.136 0.002 55 16.499 0.238 6 0.196 0.003 56 17.104 0.246 7 0.267 0.004 57 17.721 0.255 8 0.349 0.005 58 18.348 0.264 9 0.442 0.006 59 18.986 0.273 10 0.545 0.008 60 19.635 0.283 11 0.660 0.010 61 20.295 0.292 12 0.785 0.011 62 20.966 0.302 13 0.922 0.013 63 21.648 0.312 14 1.069 0.015 64 22.340 0.322 15 1.227 0.018 65 23.044 0.332 16 1.396 0.020 66 23.758 0.342 17 1.576 0.023 67 24.484 0.352 18 1.767 0.025 68 25.220 0.363 19 1.969 0.028 69 25.967 0.374 20 2.182 0.031 70 26.725 0.385 21 2.405 0.035 71 27.494 0.396 22 2.640 0.038 72 28.274 0.407 23 2.885 0.042 73 29.065 0.418 24 3.142 0.045 74 29.867 0.430 25 3.409 0.049 75 30.680 0.442 26 3.687 0.053 76 31.503 0.454 27 3.976 0.057 77 32.338 0.466 28 4.276 0.062 78 33.183 0.478 29 4.587 0.066 79 34.039 0.490 30 4.909 0.071 80 34.907 0.503 31 5.241 0.075 81 35.785 0.515 32 5.585 0.080 82 36.674 0.528 33 5.940 0.086 83 37.574 0.541 34 6.305 0.091 84 38.484 0.554 35 6.681 0.096 85 39.406 0.567 36 7.069 0.102 86 40.339 0.581 37 7.467 0.108 87 41.282 0.594 38 7.876 0.113 88 42.237 0.608 39 8.296 0.119 89 43.202 0.622 40 8.727 0.126 90 44.179 0.636 41 9.168 0.132 91 45.166 0.650 42 9.621 0.138 92 46.164 0.665 43 10.085 0.145 93 47.173 0.679 44 10.559 0.152 94 48.193 0.694 45 11.045 0.159 95 49.224 0.709 46 11.541 0.166 96 50.266 0.724 47 12.048 0.173 97 51.318 0.739 48 12.566 0.181 98 52.382 0.754 49 13.095 0.189 99 53.456 0.770 50 13.635 0.196 100 54.542 0.785

© Chicago Botanic Garden 25
NAME Teacher Answer Key
Tree Identification Activity – See the Forest for the Trees There are many traits that can be used to identify a tree such as its bark, fruit, and shape. However, the easiest trait to use is the leaves. While walking in a forest, it may seem that most trees simply blend together, but a forest may contain dozens of different species. It is important for scientists to identify trees for research but it is also important for anyone to identify them too in order to learn about them and gain an appreciation for local plant diversity. During this activity you will use a book called a Tree Finder that is basically a giant dichotomous key in book form. Before you use this book, you must know the difference between some common terms related to leaves. Fill in the spaces below as we go through them together. OPPOSITE/ALTERNATE: Opposite leaves occur when two leaves are found at the same point on a branch. One leaf is found on the left side and another is found on the right side. Alternate leaves occur when leaves are found at different points on a branch. One leaf is found on the left side and then, further up the branch, another leaf is found on the right side. SIMPLE/COMPOUND: Simple leaves are those in which only one leaf is attached to the stalk (petiole) that comes from the branch, while compound leaves are those in which many leaves (called leaflets) are attached to the stalk that comes from the branch. MARGIN: The margin is the edge of the leaf. It may be smooth, rough, toothed, wavy, etc. LOBE: A leaf is said to be lobed when it has many extensions and does not form a simple shape such as an oval or a spade. Fill in the data table below as you identify leaves. Try to identify five different leaves. You may try to identify more if you have the time. Num. Common Name Scientific Name Important Features Answers will vary
© Chicago Botanic Garden 26
Analysis Questions 1. What are some of the main features that you used to identify leaves? List three features and
then describe the options for each feature.
Some of the main features that I used to identify leaves were the placement of the leaves on the branch, the shape of the leaf, and the type of margin that the leaf had. Leaves may be placed on a branch in either opposite or alternate formations. There are many different shapes of leaves such as circular, ovular, heart-shaped, palm-shaped, and wave-shaped with many lobes. Leaves can have many different margins as well. Some leaves can have a smooth margin, while others can be wavy, toothed, or double-toothed.
2. Which two leaves that you identified were the most similar? Explain using specific traits.
Answers will vary 3. Which two leaves that you identified were the most different? Explain using specific traits.
Answers will vary 4. What is the difference between a simple leaf and a compound leaf? What is the difference
between alternate leaves and opposite leaves?
The difference between a simple and a compound leaf is that a simple leaf has fewer parts to it while a compound leaf is more complex. A simple leaf only has one leaf attached to a stalk while a compound leaf has more than one leaf attached to a stalk. The difference between alternate leaves and opposite leaves has to do with the placement of the leaf on the branch. Opposite leaves are located in the same spot on the branch. One leaf is on the left half, while the other leaf is on the right half. Alternate leaves are not located in the same spot. One leaf is located on the right side and the next leaf is located on the left side but further up the branch.
5. Leaves can change size depending on the age of a tree and also the location of the leaves on
the tree itself. For example, the leaves of a young tree are usually much bigger than the leaves of an adult tree. The leaves at the bottom of a tree are also usually much bigger than the leaves at the top of a tree. Use this information to explain why leaves are different sizes based on their age or location. What advantage does this give a tree? Look at the bottom of page 4 in your Tree Finder for an example.
The leaves at the top of the tree are smaller than the leaves at the bottom because more light is available at the top of a tree and not as much leaf surface is needed in order to absorb this surplus of light. Leaves at the bottom of a tree must be much larger than those at the top in order to absorb as much of the small amount of available light as possible. Similarly, leaves of a young tree must be larger than those of an adult tree because young trees are much shorter than adult trees and there is not as much light available at the forest floor.
© Chicago Botanic Garden 27
NAME Teacher Answer Key
Is the Environment Really Changing? A Study of Local Forests
One of the few constants in life is that it is always changing. The same can be said for natural areas as well. Change can occur at both small and large scales, internally and externally, and at different lengths of time. Ecologists have always studied how ecosystems change in an attempt to understand them. However, in recent years, our attention has shifted from simply trying to understand ecosystems to trying to preserve them in their current state or restore them to their previous state. The study of ecological succession will continue to be an important area of research as our natural areas continue to shrink and continue to be subject to the external pressures of humanity. During this experiment, you will study a portion of a local forest preserve. In order to determine how important a tree is to a forest, scientists look at the overall size of the tree and how often that specific tree occurs throughout the forest. You will determine the size of a tree by measuring its diameter and converting it into basal area, which refers to how much space the tree takes up. You will determine how often a tree occurs by counting and comparing the numbers of each species you find during your study. The combination of these factors will help you determine the importance of each tree species, which can be used to determine what the forest looked like in the past, which trees are vital to the present day forest, and make predictions regarding what the forest will look like in the future.
Pre-lab Questions 1. What is ecological succession? Why is it an important area of ecological research?
Ecological succession refers to how an ecosystem changes over time. Ecosystems progress through stages that are defined by the plant and animal species that occupy a specific area. This is an important area of research because it allows scientists to compare an ecosystem’s present condition with that of the past and also predict what might happen in the future. If an ecosystem does not progress properly, it might be evidence of the influence of humans.
2. What type of natural environments can you presently find in Illinois? How do these
environments compare to those that were here hundreds of years ago? Answers will vary
Students should mention that Illinois contains forests, savannahs, prairies, and wetlands. When compared to those that existed hundreds of years ago, our current environments are smaller, more fragmented and are poorer in quality due to the influence of humans.
3. Are forests in Illinois currently changing? Please explain your answer and give specific
examples. Do not worry about being right or wrong. Just write down what you think is happening.
Answers will vary Forests in Illinois are changing both by natural and human-induced methods. Oak and hickory forests are becoming dominated by shade tolerant species such as maples, basswood, and black cherry. A wide variety of invasive species have altered all aspects of our forest, particularly the understory and forest floor. Common buckthorn and honeysuckle are two specific examples of invasives that can easily dominate a forest to the point where nothing else can grow.
© Chicago Botanic Garden 28
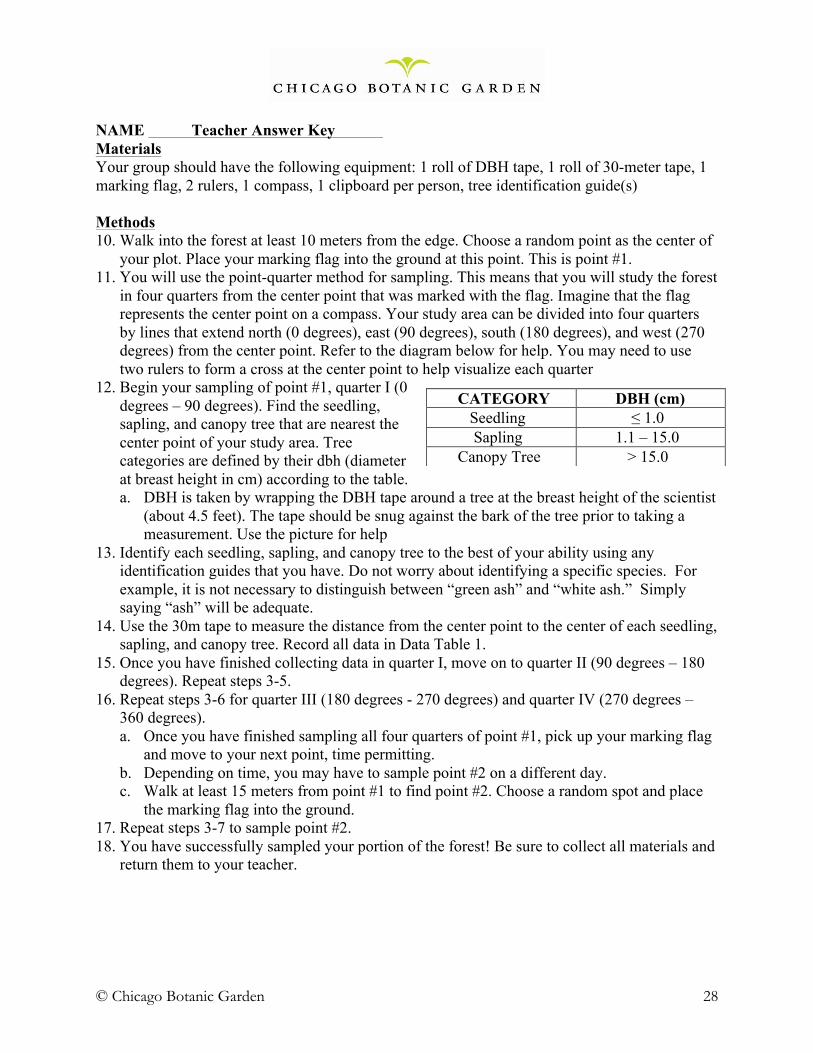
NAME Teacher Answer Key Materials Your group should have the following equipment: 1 roll of DBH tape, 1 roll of 30-meter tape, 1 marking flag, 2 rulers, 1 compass, 1 clipboard per person, tree identification guide(s) Methods 10. Walk into the forest at least 10 meters from the edge. Choose a random point as the center of
your plot. Place your marking flag into the ground at this point. This is point #1. 11. You will use the point-quarter method for sampling. This means that you will study the forest
in four quarters from the center point that was marked with the flag. Imagine that the flag represents the center point on a compass. Your study area can be divided into four quarters by lines that extend north (0 degrees), east (90 degrees), south (180 degrees), and west (270 degrees) from the center point. Refer to the diagram below for help. You may need to use two rulers to form a cross at the center point to help visualize each quarter
12. Begin your sampling of point #1, quarter I (0 degrees – 90 degrees). Find the seedling, sapling, and canopy tree that are nearest the center point of your study area. Tree categories are defined by their dbh (diameter at breast height in cm) according to the table. a. DBH is taken by wrapping the DBH tape around a tree at the breast height of the scientist
(about 4.5 feet). The tape should be snug against the bark of the tree prior to taking a measurement. Use the picture for help
13. Identify each seedling, sapling, and canopy tree to the best of your ability using any identification guides that you have. Do not worry about identifying a specific species. For example, it is not necessary to distinguish between “green ash” and “white ash.” Simply saying “ash” will be adequate.
14. Use the 30m tape to measure the distance from the center point to the center of each seedling, sapling, and canopy tree. Record all data in Data Table 1.
15. Once you have finished collecting data in quarter I, move on to quarter II (90 degrees – 180 degrees). Repeat steps 3-5.
16. Repeat steps 3-6 for quarter III (180 degrees - 270 degrees) and quarter IV (270 degrees – 360 degrees). a. Once you have finished sampling all four quarters of point #1, pick up your marking flag
and move to your next point, time permitting. b. Depending on time, you may have to sample point #2 on a different day. c. Walk at least 15 meters from point #1 to find point #2. Choose a random spot and place
the marking flag into the ground. 17. Repeat steps 3-7 to sample point #2. 18. You have successfully sampled your portion of the forest! Be sure to collect all materials and
return them to your teacher.
CATEGORY DBH (cm) Seedling ≤ 1.0 Sapling 1.1 – 15.0 Canopy Tree > 15.0

© Chicago Botanic Garden 29
NAME Teacher Answer Key Data– Student data will vary. These data were taken during a trial run of the activity.
Data table 1: Distance from center point and DBH of seedlings, saplings, and canopy trees found in each quarter of Points 1 and 2 POINT #1
Quarter Seedling ID Distance (m)
Sapling ID Distance (m)
DBH (cm)
Canopy Tree ID Distance (m)
DBH (cm)
I
Basswood
4.0
Black cherry
3.75
10
White oak
5.1
43
II
White ash
1.1
Basswood
4.6
18
White oak
6.75
59
III
White ash
1.5
Black cherry
3.27
11
White oak
7.0
36
IV
White ash
0.72
Black cherry
6.9
13
White oak
3.55
59
POINT #2
I
American elm
4.1
Basswood
3.55
7.5
White oak
3.8
62.5
II
Basswood
3.8
Basswood
4.1
6
Green ash
5.3
20
III
Basswood
2.35
Basswood
2.7
13
White oak
7.4
64
IV
Green ash
1.3
Basswood
5.6
8.5
White oak
4.3
44
© Chicago Botanic Garden 30
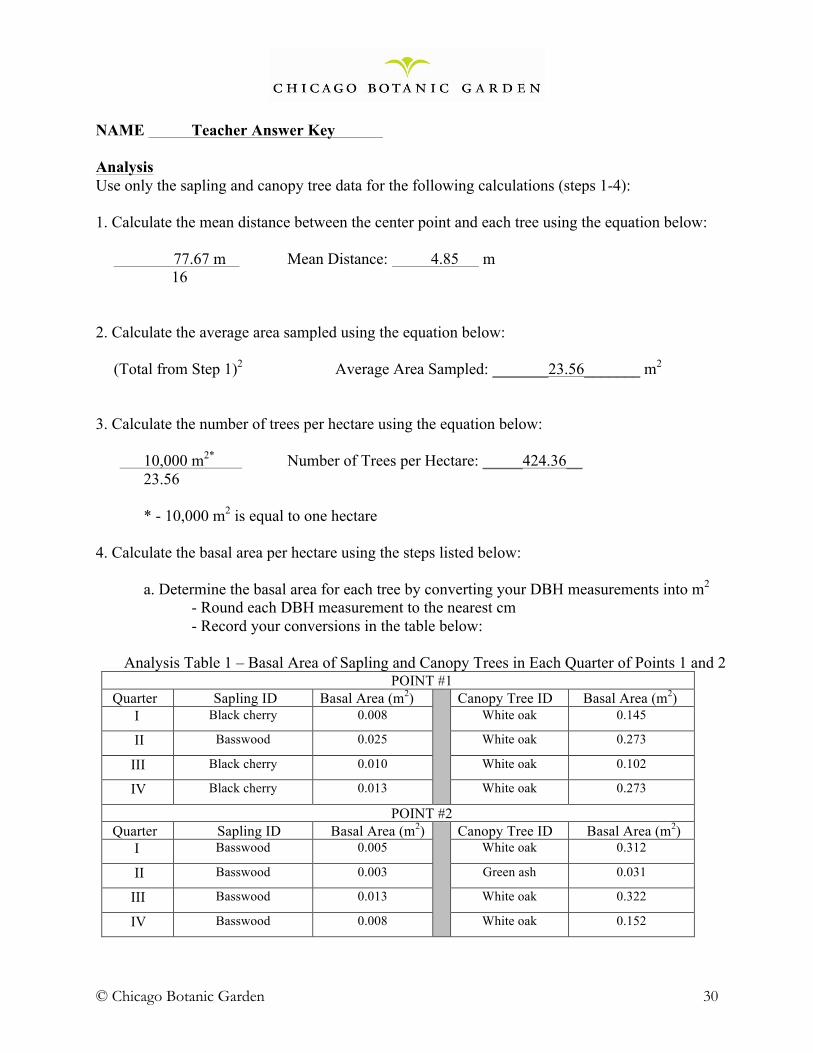
NAME Teacher Answer Key Analysis Use only the sapling and canopy tree data for the following calculations (steps 1-4): 1. Calculate the mean distance between the center point and each tree using the equation below:
77.67 m Mean Distance: 4.85 m 16 2. Calculate the average area sampled using the equation below:
(Total from Step 1)2 Average Area Sampled: _______23.56_______ m2
3. Calculate the number of trees per hectare using the equation below: 10,000 m2* Number of Trees per Hectare: _____424.36__
23.56
* - 10,000 m2 is equal to one hectare
4. Calculate the basal area per hectare using the steps listed below: a. Determine the basal area for each tree by converting your DBH measurements into m2
- Round each DBH measurement to the nearest cm - Record your conversions in the table below:
Analysis Table 1 – Basal Area of Sapling and Canopy Trees in Each Quarter of Points 1 and 2 POINT #1
Quarter Sapling ID Basal Area (m2) Canopy Tree ID Basal Area (m2) I Black cherry 0.008 White oak 0.145
II Basswood 0.025 White oak 0.273
III Black cherry 0.010 White oak 0.102
IV Black cherry 0.013 White oak 0.273
POINT #2 Quarter Sapling ID Basal Area (m2) Canopy Tree ID Basal Area (m2) I Basswood 0.005 White oak 0.312
II Basswood 0.003 Green ash 0.031
III Basswood 0.013 White oak 0.322
IV Basswood 0.008 White oak 0.152

© Chicago Botanic Garden 31
NAME Teacher Answer Key 4 Continued…
b. Add-up all basal areas and record that value below: ∑ Basal areas: ________1.695_______ m2
c. Calculate basal area per tree using the equation below:
1.695 Basal area per tree: ___.106____
16*
* This is the total number of trees sampled. If more points were sampled, this number must be adjusted accordingly.
d. Calculate basal area per hectare using the equation below. Basal area per hectare is a
measure of the total volume of wood sampled. These numbers will be used to calculate the dominance of a tree species.
.106 x 424.36 Basal area per hectare: ____44.98____ * Basal area / tree x Number of trees / hectare
________________________________________________ Use all sampled tree data (seedling, sapling, and canopy tree) for the following calculations (steps 5-9) 5. Calculate the frequency value for each tree species using the equation below. Record the
values in Analysis Table 2 below:
Number of points at which a species occurred * Total number of points sampled **
* This number will be either 1 or 2 because a tree species will have occurred at either 1
point or both points that were sampled. If more points were sampled, this number must be adjusted accordingly.
** This number should be 2 since 2 points were sampled. If more points were sampled, this
number must be adjusted accordingly.

© Chicago Botanic Garden 32
NAME Teacher Answer Key
Analysis Table 2 – Relative Frequency, Density, Dominance, and Importance Values for All Trees (as applicable)
Tree Species* Frequency Relative Frequency
Relative Density
Relative Dominance**
Importance Value
American elm 1/2 12.5 4.2 N/A 16.7 Basswood 2/2 25.0 33.3 3.2 61.5
Black cherry 1/2 12.5 12.5 1.8 26.8 Green ash 1/2 12.5 8.3 1.8 22.6 White ash 1/2 12.5 12.5 N/A 25.0 White oak 2/2 25.0 29.2 93.3 147.5
* Space for 12 species is provided which assumes new species will be found at every quarter and that no species will repeat ** Only calculated for sapling and canopy trees with DBH >1.1 cm Analysis continued
6. Calculate relative frequency for each tree species using the steps listed below. Relative frequency is a measure of how often a tree species appeared in your sample area a. Add-up all frequency values
∑ Frequency values: __________4_________
b. Divide frequency value for each species by the sum of all frequency values (from Step 6a) using the equation below:
Frequency value for a species
∑ Frequency values
c. Multiply each total from Step 6b by 100 Record all values in Analysis Table 2 on the previous page

© Chicago Botanic Garden 33
8. Calculate relative density for each tree species using the equation below. Relative density tells you what percentage of trees sampled were a certain species. Record all values in Analysis Table 2 on the previous page
Number of individuals of a species x 100 Total number of tree species*
* This number should be 24 if two points were sampled. If more points were sampled, this number
must be adjusted accordingly.
9. Calculate the relative dominance of each sapling and canopy tree using the steps listed below: a. Add up the basal area for each sapling and canopy tree listed in Analysis Table 1. Write
these values in the space below:
.031 - Black Cherry, .054 – Basswood, .031 – Green Ash, 1.579 – White Oak
b. Add up the basal area for all tree species in Analysis Table 1. Write this value in the space below:
Basal area for trees in Table 1 = 1.695
c. Divide the basal area for each species by the basal area for all species. Multiply each value by 100 using the equation below. Record all values in Analysis Table 2 on the previous page.
∑ Basal area of a species x 100 ∑ Basal area for all species
10. Calculate the species importance value for all seedling, sapling, and canopy trees using the
equation listed below. The importance value of a species tells you how important that species is to the ecosystem that was sampled. The most important species have higher importance values. Record all values in Analysis Table 2 on the previous page.
Relative Frequency + Relative Density + Relative Dominance
Making Conclusions - Individual Use the totals from the Analysis section to answer the following questions regarding the past, present, and future status of the forest that you sampled. Answers will vary for all questions depending on data and region. 1. Which tree species was the most common canopy tree? Based on this information, what type
of tree was most common in this forest hundreds of years ago? Please explain your answer.
© Chicago Botanic Garden 34
The most common canopy tree was white oak. Based on this information, I believe that white oak was the most common tree in the forest hundreds of years ago because oaks take a long time to grow and in order for these trees to be dominant now, they must have been dominant in the past as well. The acorns that were dropped by the dominant trees hundreds of years ago lead to the trees that we see in the forest today.
2. Examine your relative density values in Analysis Table 2. Which tree species was the most
common? Which tree species was the least common? Examine your Relative Dominance values in Analysis Table 2. Was the most common tree also the most dominant? Provide an explanation for these data. According to my density values, the most common tree was basswood. 33.3% of all trees sampled were basswood. The least common was American elm. 4.2% of all trees sampled were American elm. The most dominant tree was not the most common because white oak is the most dominant, while basswood is the most common.
I believe this may be because the conditions in the forest have changed which allow basswood trees to grow better than oak trees. Oak offspring may have been able to survive in the past, but they are not able to survive now.
3. What are the top three most important tree species in the portion of the forest that you
sampled? Include data to support your answer. Why might these species be the most important?
The top three most important species are white oak, basswood, and black cherry with importance values of 147.5, 61.5, and 26.8 respectively. (Answers will vary.) I think these are the most important species for this ecosystem because they are the most common trees and are also some of the largest. All of this factors into the calculation of a species’ importance. “Species 1” represent what the forest looked like in the past, and the basswood and black vherry represent what the forest may look like in the future.
4. Which tree species was the most common sapling? Which was the most common seedling?
Based on this information, what do you think this forest will look like in the next hundred years? Explain your answer.
The most common sapling was basswood and the most common seedlings were basswood and white ash. In the next hundred years I think that many of the oak trees that dominate now may no longer be alive. Since there are not many oak seedlings or saplings to replace them, I think that the most dominant trees of the future will be basswood and white ash. There are many basswood and white ash saplings and seedling present in the forest right now. I predict that these will continue to grow and become the most dominant and also the most important trees in this forest.
5. Was the most common canopy tree also the most common sapling or seedling? What does
this mean about the future of the most common canopy tree? Please explain your answer.
© Chicago Botanic Garden 35
No, the most common canopy tree was not the most common sapling or seedling. White oak was the most dominant canopy tree. We did not sample any white oak saplings or seedlings in any of our points and we did not see many throughout the forest either. I predict that this tree will not be the most common canopy tree in the future because there are no young trees to replace the dominant old trees that are alive in the present day.
6. Existing trees in the forest you surveyed have adapted to past local conditions. However, as
humans have moved closer to forests, they have introduced a variety of challenges in different regions. These include intensive logging, invasive species, forest fire frequency (more or fewer), and land use changes that may impact normal forest succession. List some of the challenges in your region and explain how each might the affect forest succession?
In our region, intensive logging is a challenge. This could impact forest succession because the climax species, pine in our region, are begin harvested. When these species are harvested, other potentially invasive species may take advantage of the ecological gap. Another consequence could be that the forest is returned to an intermediate seral.
7. The challenges you noted above may impact the survival of native trees and the animals that
depend on them. What are some suggestions that you can think of to help keep native trees dominant in our forests? How might ecologists and forest managers work to help native offspring survive in forests that have been changed by humans?
In our region, where logging is a challenge, land managers could log selectively, sparing some trees in each area to provide habitat for animals and to maintain the diversity of the forest. Another option might be to limit logging to specific areas, leaving other natural areas untouched. Finally, replanting native trees in areas that have been logged could help maintatin the native population over the long term.
Drawing Conclusions – whole class Use the space below to respond to class discussion questions as directed by your teacher.
Answers will vary based on class discussions.