activity coefficients in aqueous mixtures of phosphates ... · activity coefficients in aqueous...
TRANSCRIPT
U. S. Department of Commerce National Bureau of Standards
Research Paper RP 1837 Volume 39, November 1947
Part of the Journal of Research of the National Bureau of Standards
Activity Coefficients in Aqueous Mixtures of Phosphates with Sodium Chloride, Sodium Bromide, and Sodium Iodide, and the pH of Phosphate Buffer Solutions
By Roger G. Bo tes
The electromotive force of cells with hydrogen electrodes and silver-silver bromide or
silver-sih'er iodide electrodes was measured at 25° C, The electrolyte i n each cell consisted
of an aqueous mixture of (a) potassiu m dihydrogen phosphate, (b) disodium hydrogen
phosphate, and (c) sodium bromide or sod ium iodide. The molalities or (a) and (b) were
always equal, whereas the ratio or the molality of (c) to that of (a) or (b) was 1, 0.5, or 0.2.
The ionic strengths ranged from 0.04 to 0.25. The data are compared \vi th similar measure
ments for phosphate-chloride m ixtures reported in an earlier paper. At a given ion ic st rength ,
the activity-coefficient term, jH2POJxlfHP04 wh ere X represents halide, in creases when
brom ide at a given conce ntrat ion is substituted for chloride at t he same conce ntrat ion , or
when iod ide r eplaces bromide. Accurate valu es for the pH of phosphate buffer solu tions
with and without added salt ca n be obtained onl y at low ion ic s t rengths.
1. Introduction
During the past several years, methods for determining activity pR (- log ali) for standard buffer solut ions from electromotive-force measurements of cells without liquid junction have been developed. These methods have been used to assign pR valu es to ccr tain phosphate, phthalate, and bora te solu tions prepared from Standard Samples certified by the National Bureau of
, Standards [I, 2, 3J. 1 Cells with hydrogen and silver-silver chloride electrodes were employed in each instance. Th e electromo tive-force data for aqueous mixt ures of the buffers with sodium or potassium chloride afford an unequivocal
l detcrmination of - log aHfc l , where JCI is the , activity coefficien t of chloridc ion 2 for each solu
tion studied. Fmthcrmore, the value of this quantity in a buffer solu t ion without chloride can be ascertained by a suitablc extrapolation from a series of determinflt ions in which the molal
I Figures in brackets indicate the liter"LUre references at (he end of this paper.
' The molal scale of act ivity is used throughout this paper. Tbe so,called "activity pH", - log aH, will be designat.ed paB, in accordance with the suggestion of Sprensen and Lindc rs t r~m,Lan g 141. Concentrations will be ~ivcn in molality (m). rl~ h c symbo l p. is lIsed for ion ic strength.
Activity Coefficients of Phosphate Buffers
ratio of chloride to buffcr is vari ed. It is impo ible to dcrive - log aH from these measurablc quantities without an estimate offcl, and the cvaluation of this ionic activ ity coefficient must rest partly upon arbitrary co nsiderations. It must be realized that paR compu tcd from the em f of cells without liquid junction is primarily a uni t on an arbitrary scale, as is that determined by the llsual pR asscmbly with a liquid junction [5, 6]. Its significancc in terms of thermodynam ic constants may be limited to a small numbcr of standard solutions of assigned paH and may not be imparted to mixturcs of unknown composit ion whose paR it is desired to determine,
Th e chloride ion plays a unique and important role ill the derivation of paR from th e emf of the hydrogen-silver chloride cell witbou t junction, However reasonable the assumptions involved in the computation may appear, their validi ty can usually not be affirmed. Hence, it is important to demonstrate the extent to which the propertiE's of chloride ion, and of the sil ver-sil vel' chloride electrode, influence the paR of the bufl'er solution without chloride obtaincd by these means. For this purpose, equimolal mixtures of potassium
411
dihydrogen phosphate and disodium hydrogen phosphate were chosen. The paH of these solutions has already been calculated from measuremen 1,s of - log aHfel in mixtmes of the phosphate buffer with varying amounts of sodium chloride [1]. Sodium bromide and sodium iodide were added to equimolal phosphate buffers in such amounts that the ratios of the molality of halide to that of each phosphate had the tlu'ee values 1, 0.5, and 0.2 . Measurements of the emf of hydrogen-silver bromide and hydrogen-silver iodide cells, with these phosphate-halide mixtmes as cell solutions, were made at 25° C. The assumptions were tested by computing the paH of the phcsphate buffer, in the absence of added salt, from the three series of emf data.
II. Determination of the Activity Coefficients
The cells used in this study can all be repre· sented by the following scheme,
Pt ; H 2(g, 1 atm), KH2P04(mj), Na2HP04(mJ), NaX(m2), AgX (s); Ag,
wh ere X is chleride, bromide, or iodide, and m is molality. When the standard potential, EO, of the cell is known, - log aHfx is readily obtained from the emf, E, and natmal constants:
In eq 1, F is the faraday, R the gas constant, and T the absolute temperature. By substitution of the equilibrium constant for the second dissociation of phosphoric acid in eq 1, we obtain an equation for the activity-coefficient term, designated log f T'
(2)
where pK is the common logarithm of the reciprecal of K , the second dissociation constant [1 , 7] . In all of the phosphate buffers to be discussed, the last term of eq 2 is zero.
412
1. Experimental Procedures
Preparation of the equimolal mixture of solid potassium dihydrogen phosphate and disodium hydrogen phosphate was described by Bates and Acree [1] . Sodium bromide was recrystallized three times from water and was dried at 200° to 300° C. The dry product was fo und to be neutral. Sodium iodide was recrystallized twice from water and dried in vacuum at 50° C for 1 to 2 days. Filters of sintered glass were used in each instance for separating the crystals from the saturated solu tion.
Silver-silver bromide electrodes were made as described by Keston [8]. However, the paste of silver oxide and silver bromate was decomposed at 550° C instead of at 650° C. Silver bromate was prepared from sodium bromate and silver nitrate. It was recrystallized from hot water. Silver-silver iodide electrodes were formed on platin um spirals by thermal decomposition, at 450° C, of a paste composed of 90 percent of silver oxide and 10 percent of silver iodide by weight [9] . Silver iodide, prepared from silver nitrate and recrystallized potassium iodide, was washed 40 t imes with water and digested at 70° C uncleI' water for 2 days. Hydrogen electrodes wer e made by deposition of platinum black on platinum foils sealed in glass. A 3-percent solution of chloroplatinic acid that contained a small amount of lead acetate was used, and the electrolysis was continued for 3 minutes at a current of 250 to 300 rna. Electrodes were always used in pairs and were freshly made for each cell .
'The solutions were prepared by weight methods, and nitrogen was passed through them to remove air. Details of the cells and of a part of the equipment are given in an earlier publication [fl. Some of the temperature measurements were made with a platinum r esistance thermometer and the rest with a calibrated mercury thermometer. The temperature was regulated within ± 0.03 , deg C.
The titra tion cell already described [10] was used for a part of the measurements made with hydrogen and silver-silver bromide electrodes. For this purpose, "semimicro" silver-silver bromide electrodes were prepared. The mixture of silver and silver bromide on each electrode weighed 15 to 20 mg. The cell was immersed in the constant-temperature bath and a known
Journal of Research
~ I
amount of buffer-bromide mix ture added. When the emf had become constant, usually in about 2 hours, a measured portion of air-free water was in troduced from the bmette. Occasionally a second dilution was made. The emf data for the seven solutions prepared by dilu tion within the cell are not considered to be as accurate as the rest. These measurements are therefore marked for identification in the table of results given in the nex t section.
The measuring equipmen t was checked in two ways. The potentiometer was connected with another similar instrument in the same laboratory, and the emf of a cell was occasionally measured by both instrwnents. The two values always agreed within 0.02 my. The potentiometers and standard cells had been calibrated by this Bureau. The second method offered a comparison of the silver-silver chloride electrodes with those of H arned and Ehlers [11], for which the standard potential of this electrode was derived. It furnished , as well , an additional check upon the temperature control and on the acc.uracy of the potentiometer . The emf of tlu'ee hydrogensilver chloride cells that contained 0.Og931m of hydrochloric acid was measured Md found to be 0.35272 ± 0.00002 v at 25° C. Thi value l S
identical with that obtained by interpolation in the data of Harned and Ehlers.
2 . Results and Calculations
The experimental data are summarized in tables 1 and 2. Values of - log (jHjXmH), where X represents either bromide or iodide, are given in the last columns. They were calculated from the emf by eq 1.
The standard potential , EO, of the hydrogensilver bromide cell was taken to be 0.07128 v at 25 ° C [12] . For the hydrogen-silver iodide cell , the emf data of table 2, together with pl{= 7.198 [1, 7], yield, by the method of Owen [13], - 0.15201 v for EO. This potential was used in the su bsequent computations. Owen [13] found - 0.15225 for the same cell with silver- ilver iodide electrodes formed by the thermal decomposition of a mixture of siher oxide and silver iodate. Gonld and Vosburgh [14], however , obtained - 0.1519. Their electrodes were of the same type as those used in tIns in vestiga tion.
Values of - log (jRjXmH) for oln tions tha t contained sodium bromide and sodium iodide at a
Activity Coefficients of Phosphate Buffers
T ABLE l. Emf of the cell, Pt ; H z (1 atm), IUhPO, (xm, ), NazHPO, (xm,) , NaBr (xm,) , AgBr (s ); Ag, at 25° C; values of - log (f IJ fD,mn )
.r
SERIES A: ml ~ m,~0.05
Volt 1. • . ................. ........... ...••••..•.•. •••• 0. 55418 0.9438....... . .............................. . .... .55601 0.5666....................................... .... .57237 0.4172 . ..... .. ................................... . 582]] 0.3800........................................... . 58487 0.1882............................... .. .. . ....... .60625
SERIES B: ml ~2m'= O.05
l. ...................................... ........ b O.57322 0. 8486..................... ..................... . 57815 0.6544 ........................................... .58666 0.5218 • __ ........................................ . 59343 0. 4984 • __ ........................................ . 59523 0.3506........................................... . 60570 0. 2468 . ..... ____ ................................. .61647
SERIES C : m, = 5", ,=0.05
L . .. ............................................ ' 0. 59731 0.8070 .............................. ______ . __ .. __ . 60417 0. 6600 · .... __ .......... __ ... __ . __ . __ ..... __ ...... . 61051 0.52,10 .... __ . __________ ..... ..................... . 61754 0. 4922 . ..... __ .......................... __ ...... . 0. 4316 . ....... __ ............................... ..
• Di lu tion made in a titrat ion cell . b Average of two cells. M ean deviation, 0.09 ro v. , Average of three cells. Mean dev iation, 0.04 m v.
.61966
. 62338 1
6.864 6. 870 6. 924 6.957 6.963 7.019
6.885 6.897 6.928 6. 9'15 6. 955 6. 979 7.009
6.S95 6.918 6. 937 6.956 6. 965 6. 971
T ABLE 2. EmJ of the cell, Pt; H2 (1 atm), KH2PO, (x m ,), NazHPO. (X1n, ) , NaI (X1n2) , AgI (s); Ag, at 25° C; values oj - log (f,.,J,ln IJ )
I
SERIES D: m, = m.=0.05
1. ______ .... __ . __ .. ______ . __ . ______ .. __ .. __ . __ . __ 0.5616 .. __ . __ . ____ __ . __ . __ ... __________________ .. 0.3228 . __ . __ .. ____________ __ __ . ______ __ ____ . __ __ . 0.1606 .. ____________________ . __ . ____ . ____ . __ . __ __
SE RI ES E: m, ~ 2m,~ 0.05
l. __ . ____ .. ______ .. ____ .. . ... __ __ ____ . __ . __ . __ . __
0. 4594 .... __ . __ .. __ .. __ . . .... __ . __ . __ . __ . . __ . __ __ 0. 3314 ..... ______ ... __ .. ____ . __ .. ________ . __ . __ __
1 .... __ ...........................•.............. O. 6462 .. ______________ .. __ . __ ... __ . __ . ________ .. . 0. 4090 . __ . ________________________ . ______ . __ ... __ O. 3006. ____________ . ____________________________ .
Volt
• O. 33036 • . 34898 • . 36620 • . 38753
0. 34925 .37387 . 3 402
0.37355 . 38749 . 401 83 . 41116
- 10; ([H(rmH )
6. 856 6. 920 6.971 i .028
6. 874 6. 952 6. 982
6.887 6. 933 6.977 7. 001
• Average emf of two cells. Tbe differences between duplicate cells made from these fo ur solutions were 0.07,0.17,0.07, and 0.04 roy .
413

molality equal to that of each phosphate sal t are compared wi th similar data for phosphate-chloride mixtures [1] in figure 1. When the three curves, plo t ted from measurements a t sufficiently high concentrations that the buffer rat io was always unity , are extended to zero ionic strength, they meet at 7.198, the value of pK a t 25° C. The separation of these three curves at a given ionic strength decreases as th e ratio of halide to phosphate decreases, but the curves fail to meet, if t he ionic strength exceeds 0.05 , even a t zero concen tra t ion of halide.
%
E ~
%
JSI I 7.00
6.911----+-- --\-'\--''<+-- ---1-----+------1
"':: 6.941----+----+--'\--'1,.- -'<--1-----+------1 .., o ..J . ,
6 . 9 ' 1----+----+---~-"--"'_+---_1
6.ee l----+-----+---- -I-----)...,---', -----'''-1
6.8 5.,.0---.".0.",05,...-----::I0.""O-----,0'"'.'=-5 ----::1:".-----,0-::-:::25 I ON I C STREN GTH
FIGUR E 1. V alues of - log (fHfxmB ) in equimolal phosphate bujJel's containing sodium halide (NaX) at a molality equal to that of each phosphate , plotted as a f1mction of ionic strength.
The activi ty-coeffi cien t term, log ,iHzPOJX/.fB PO) ,
was computed by eq 2. The values obtained in t his manner for each ratio of bromide and iodide t o phosphate were smoo thed wi th the aid of :plo ts of P, defined by
P = log iT- 1.017.J~/ (l + 1.31.J; ), (3 )
as a function of ionic strength , J1.. These lines w ere drawn to the origin, inasmuch as P is zero at infinite dilution. Their curvatures were small. The average deviation, fl , of the" observed" log i T from the smooth curve is given in the next to
414
th e last column of table 3. These deviations, expressed in millivolts, are designated 1::..' and are listed in the last column. The value of log i T in phosphate buffer solutions with varying amounts of sodium chloride, sodium bromide, or sodium iodide, and in buffer solutions withou t halide (log i ; ), is given in table 4. Log f T in mixtures
T ABLE 3. Smoothing of log I T
Series
PHOSP H AT E-BROMI DE MIXTU R ES
mv A_______________________________ _______ 0.2 0.0009 0.05 B __ ______ ____ .. _ .. _. __ .. . _._ .. _._._._._ . 11 .0026 _ 15
C . _' __ .. __ . __ .... ____ . __ .. __ . __ __ __ __ __ . 048 . 0014 . 08
P H OSPHA T E -IODID E M IXTU RES
D . ________ . . . __ ..... ____ . ______ _______ . 0.2 4 0.0006 0. 04 .01 08
E ___ ._._ ...•• __ .. ______ .. ___ •.•. __ .____ . 11 3 .0002 F . ________ . ____ .... __ .. ____ ... ____ . __ __ . 048 . 00 14
T AB!.!'; 4. Log f T, log f: , and - log (fH./'xmB)° jO!' 7Jhosphate bujJer solutions
log / r w hen 'm NaXIJ.! is- - log fonic strength
I I 1 0gJ~ (fHJX
0.2 0.11 0.048 77h1 ) °
X = C I
I 0.01. __ • ________ . ______ • __ .• __ . __ .... __________ .... __ . __ . 0.089 i.l09 .05 •.. ___ . _ .. __ •. _. ____ •.• __ .• __ O. l iiO O. I i 60 aO. I i49 . li48 i.023 .m __ .. ________ . _____________ .__ .2018 . 2004 . 1989 . 1983 i . ooo .1 . _ ..• __ ._. ___ ..•••••••• __ .____ . 2310 . 2290 . 2268 . 2263 6.9n .15 _____ . ____________ .... __ . __ __ . 26i9 .2649 . 2616 . 2610 6. 93i .20 ~ __ . ____ . ____ . __ . __________ .. . 2908 . 2926 .2884 .28iO 6.911 .25 .. ____ ...•••• ______ ... __ .. __ _ . 3209 .3156 . 3103 . 3084 6. 890
X= Br
0 .01 ..... __ . ____ .. __ ... ____ ... ____ .. __ .. ________ .. ____ __ 0.090 i . 108 .05 _ ...•• __ . ____ .• __ • ••• • • __ .. __ 0. 1818 0. 1802 0. li82 . 17i2 7. 021 .Oi .... _. __ . ____ . __ ..... __ . __ ... .2080 . 2058 . 2035 . 2020 6. 996 .1 ... _. ____ . ________ .•. _ ... ____ . . 2391 . 2360 .2330 . 23 10 6. 96i .15 ... ______ • __ ...••••••••• __ .__ .2786 .2739 . 2690 . 26i2 6. 931 .20 __ ......• __ . •.. __ . __ ..... __ . . 3091 .3032 . 2986 . 2952 6. 903 .25 ..... __ ..... __ .... __ .• __ ... __ . 3340 . 3270 . 3220 . 3183 6.880
X = I
0.01. "---- ------------- - ----- ---- ---- ---- - - - - -- - ~ -------- 0. 091 i . 10i . 05 ... __ • __ . __ . ____ • ___ . ... __ •.. O . 1859 0. 1836 O. 1808 li90 i . 010 .07 .. __ •• •••• • . __ ••. ____ .•.•• __ . 2132 . 2\05 206i . 2048 6.993 .1 - - - - - - - - - - - - ---- ~ - -- - - - - --- - -- 2453 242 1 ~372 . 2350 6.963 .15 .. ___ . __ • __ . __ ' __ .'. ___ . ___ .' 2857 2811 ~ i59 .2730 6.925 .20 .. _. ___ •. __ .... __ ..... _ .••••. .3\ i O .311 6 . 3058 . 3028 6.895 .25 ......... __ • _. __ . __ . __ . ___ .• _ .3425 3357 3306 . 326i 6. 8i!
a Values of log fr in the phosphate-l':hlor ide m ixtures a re gh-e n for m NaCI/ J1. =
0.03 instpad of 0.048 .
•
Journal of Research
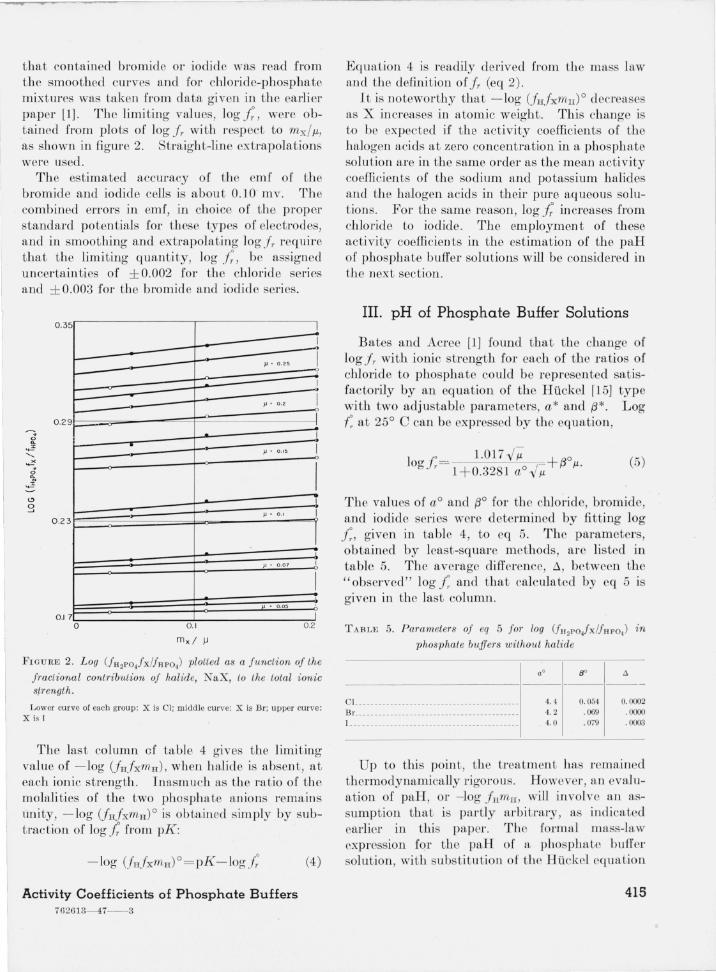
that contained bromide or iodide was read from the smoothed curves and for chloride-phosphate mixtures was taken from data given in the earlier paper [1] . The limi ting values, log i ; , were obtained from plots of log i T with respect to mx/ fJ., as shown in figure 2. Straight-line extrapolations were used .
The estimated accuracy of the emf of the bromide and iodide cells is about 0.10' mv. The combined errors in emf, in choice of the proper standard potentials for these types of electrodes, and in smoothing and extrapolating log i T require that the limiting quantity, log i ;, be assigned uncertainties of ± 0.002 for the chloride series and ± 0.003 for the bromide and iodide serie .
J '-... ..!!
~ ~
l!> g
0.35
---
0.29
0 .23
0.17 o 0 .1
mx l )J
-1 --l
JJ ' 0.25 j .-.;
J J..I' 0.2 I
I ~
1
JJ • 0 , 15 I
I I
JJ • 0 .1 I
I }J • 0.07 I
I . 0.05
1
0.2
FIGURE 2. Log (fH2Po.!xlfr'lPo4) plotted as a function of the
fractiona l cont.rib1tlion of halide, NaX, to the total ionic strength.
Lower curve of each group : X is 01; midd le curve: X is ilr; upper curve: X is I
The last column of table 4 gives the limiting value of - log (fH.1xmH), when halide is absent, at each ionic strength. Inasmuch a the ratio of the molalities of the two phosphate anions remains unity, - log (fH.1xmH) O is obtained s impJy by subtraction of log .1; from pK:
Activity Coefficients of Phosphate Buffers 762613- 47--3
EqLlaLion 4 is readily derived from the mass law and the defin ition OfjT (eq 2) .
It is noteworthy that - log (fHixmlI)O decreases as X in creases in atomic weight. This change is to be expected if the activ ity coefficients of the halogen acids at zero concentration in a phosphate solu tion are in the same order as the mean activity coefficients of the sodium and potassium halides and the halogen acids in their pure aqueous solutions. For the same reason, log l increases from chloride to iodide. The employment of these activity coefficien ts in the es timation of the paH of phosphate buffer solutions will be considered in the next section.
III. pH of Phosphate Buffer Solutions
Bates and Acree [1] fOLlnd that the change of log i T with ionic strength for each of the ratios of chloride to phosphate could be represented satisfactorily by an equation of the Huckel [15] type with two adjustable parameters, a* and {3*. Log r: at 25° C call be expressed by the equation,
(5)
The values of aO and {30 for the chJoride, bromide, and iodide series were determined by fitting log i ;, given in table 4, to eq 5. The parameters, obtained by least-square method , arc listed in table 5. The average difference, 6 , between the "observed" log i ; and that calculated by eq 5 is given in the last column .
T ABLE 5. Parameters of eq 5 for log (fu 2Po.fxlfBPo4) in
phosphate buffers without halide
8" A ----------·---------------1-----------------01. ........................................ . il r. ........................................ . L ............................... .......... .
4. " 4.2
. 4.0
0.054 . 069 . Oi9
0. 0002 . ()()()()
. 0003
Up to this point, the treatment has remained thermodynamically rigo rous. However , an evaluation of paH, or - log inmu, will invol ve an assumpt ion that is partly arb itrary , as indicated earlier in this paper. Th e formal mass-law expression for the paH of a phosphate buffer solution , with substitution of the Huckel equation
415

for the activity coefficients of the two phosphate anions at 25° C, can be written as follows ,
paR = pK- log mH2P04 _ 1.5255-/P. -(3 (6) mHP04 1 + 0.3281a .JM J.L.
Bates and Acree assumed that aO and (30, the parameters of eq 5 for phosphate buffers without added chloride, could be identified with a and (3 of eq 6, for the same buffer solu tions.3 The validi ty 'of this assumption is not subj ect to experimental proof, but a partial test can be obtained through a comparison of the paR derived in this manner from emf meaSUTements made with the three different halide electrodes. The r esul ts of these calculations are given in the first half of table 6. At 0.25, the highest; ionic strength studied, the paH values derived from meaSUTements of the chloride and iodide cells differ by 0.025 unit.
It is evident from a comparison of paH with - log (jH.iXmH)O given in table 4 that the normal
TABLE 6. paH of phosphate buffer mixtures: KH2PO,(ml), Na2HPO, (ml), NaX(m2 = O), fr om the emf of cells without liquid junction at 25° C
Ionic paR when X is-
m, strengtb Cbloride I Bromide I Iodide
Equation 6
0. 0025 0. 01 7. 065 7.063 7.062 . 005 .02 7.017 7.016 7. 014 . 01 . 04 6. 959 6.956 6. 953 .0125 . 05 6. 937 6. 934 6. 931
. 025 . 10 6. 862 6.855 6.849
. 0375 . 15 6. 811 6.803 6. 794
. Q5 .20 6. 773 6. 762 6. 752
. 0625 . 25 6. 742 6. 729 6. 717
Equation 7
. 0025 0.01 7.066 7.065 --- --
. 005 .02 7. 019 7. 020 - --- -
. 01 .04 6. 962 - ---- - -- - -
. 0125 .,i 5 6. 942 6. 944 - -- --
. 025 . 10 6.873 6.873 6. 876
. 0375 . 15 6. 830 6.829 6. 834
. 05 .20 6. 796 6. 796 6. 802
. 0625 . 25 6. 774 6.774 6. 781
3 'rhe last two terms or eQ 6 represent - log UH2PO/ fHI'O,)O. It is evident
by eomparis~n with eq 5 that tbis metbodor evaluating paR sets logf~ eq ual to --{J.5085.../ p/ (1 +0.328lao~) , witbout a term linear in ionic strengtb.
416
decrease of the latter quantity with increasinO' atomic weight of the halogen has not been com~ pensated; indeed paH shows a slightly larger decrease than does - log (jn.ixmn) ° at the same ionic strength . A part of the difficulty is associated with the two-parameter form of eq 5. If a small systematic change, within experimental error, were made in log .i~ , significant changes in aO and (30 of a compensatory nature migh t be necessary to afford the best fit of the data to eq 5. For example, aO = 4.0 and (3° = 0.079 reproduce log j~ for the iodide series with a mean deviation of 0.0003. Yet the deviation would be only 0.0008 or still considerably less than the un certain t; assigned to log .i~ , if 4.4 and 0.135 were chosen as the correct set of parameters. If the latter values gave the best fit , however, the paH computed from the iodide series would be 0.006 unit higher at an ionic strength of 0.25. In other words, these changes in the two parameters do not offset one another in the calculation of paH. Measurements at ionic strengths above 0.25 , which are of most use in fixin g accurate values of the parameters, are lacking here.
If the activity-coefficients of the three halide ions in the phosphate solution were assumed to equal the mean activity coefficients of the corresponding halogen acids, after the suggestion of Guggenheim [16], and these mean activity coefficients were set equal to their values in pUTe solutions of RX [11, 17, 18] at the appropriate ionic strengths , paH could be evaluated:
paH= -log (jHjxmn)o+ logj~= - log (jn.fxmn)° + log .inC! (7)
The results of this calculation are given in the second half of table 6. The agreement among the three sets of values is improved, but the paH is higher than before. The activity coefficient of hydrochloric acid is lowered by potassium ions [19] and sodium ions [201 . Hence, paH computed in this manner is understandably too high.
The paH calculated from pK or from - log (jHjxmn) ° will approach - log aHin dilute solutions, where all reasonable assumptions relating the ionic activity coefficients yield substantially equivalent, results. In the region of higher ionic strengths, the paH value must be considered a unit on an arbitrary scale.
Journal of Research

IV. References
[1] R. G. Bates and S. F. Acree, J . Research NBS 340, 373 (1945) RP1648.
[2] W. J. Hamer, G. D. Pinching, and S. F . Acree, J . Research NBS 36, 47 (1946) RP1690.
[3] G. G. Manov, N. J . DeLollis, P. W. Lindvall, and S. F . Acree, J. Research NBS 36, 543 (1946) RP1721.
[4] S. P. L. S¢rensen and K. Linderstr¢m-Lang, Compt. rend. tray. lab. Carlsberg 15, No.6 (1924).
[5] D . A. MacInnes, Cold Spring Harbor Symposia on Quant. Biol. 1, 190 (1933).
[6] J. Sendroy, Jr. , Trans. Electrochem. Soc. 740, 595 (1938).
[7] R. G. Bates and S. F. Acree, J. Research NBS 30, 129 (1943) RP1524.
[8] A. S. Keston, J . Am. Chem. Soc. 57, 1671 (1935). {9] R. G. Bates, J. Am. Chern. Soc. 60, 2983 (1938).
Activity Coefficients of Phosphate Buffers
[10] R. G. Bates, G. L. Siegel, and S. F. Acree, J . Research NBS 30, 347 (1943) RP1537.
[1l] H . S. Harned and R. W. Ehlers, J . Am. Chern. Soc. 55, 2179 (1933).
[12] B. B. Owen and L. Foering, J. Am. Chern. oc. 58, 1575 (1936).
[13] B. B. Owen, J . Am. Chern. Soc. 57, 1526 (1935). [14] R . K. Gould and W. C. Vosburgh, J. Am. Chern. Soc.
62,1817 (1940). [15] E. Huckel, Physik. Z. 26, 93 (1925). [16] E. A. Guggenheim, J. Phys. Chem. 340, 1758 (1930). [17] H. S. Harned, A. S. Keston, and J. G. Donelson,
J . Am. Chem. Soc. 58, 989 (1936). [18] H. S. Harned and R. A. Robinson, Trans. Faraday
Soc. 37, 302 (1941). [19] H. S. Harned and W. J. Hamer, J . Am. Chern. Soc. 55,
2194 (1933). [20] H . S. Harned, J. Am. Cbem. Soc. 57, 1865 (1935).
WASHING'l'ON, May 12,1947.
417