activity diagrams - school of informatics state in an activity diagram is a point where some event...
TRANSCRIPT
Activity Diagrams
Massimo Felici
Massimo Felici Activity Diagrams c© 2004–2011

1
Activity Diagrams
• Activity Diagrams consist of activities, states and transitions between activitiesand states
• Activity Diagrams describe
– how activities are coordinated to provide a service– the events needed to achieve some operation– how the events in a single use case relate to one another– how a collection of use cases coordinate to create a workflow for an
organisation
Massimo Felici Activity Diagrams c© 2004–2011
Slide 1: Activity Diagrams
• Activity Diagrams describe– how activities are coordinated to provide a service – the service can be at
different levels of abstraction– the events needed to achieve some operation, particularly where the
operation is intended to achieve a number of different things that requirecoordination
– how the events in a single use case relate to one another – in particular, usecases where activities may overlap and require coordination
– how a collection of use cases coordinate to create a workflow for anorganisation
• Activity Diagrams– focus on the flow of activities involved in a single process– show how activities depend on one another– capture activities that are made up of smaller actions
Rationale 2
Activity Diagrams
• Model business workflows
• Identify candidate use cases, through the examination of business workflows
• Identify pre- and post-conditions for use cases
• Model workflows between/within use cases
• Model complex workflows in operations on objects
• Model in detail complex activities in a high level activity diagram
Massimo Felici Activity Diagrams c© 2004–2011

Basics 3
Activity Diagrams
• Activities and Actions• Transitions and Activity Edges• Tokens and Activity Nodes• Control Nodes
– Initial and Final Nodes– Forks and Joins– Decision and Merge Points
• States• Swimlanes
Massimo Felici Activity Diagrams c© 2004–2011
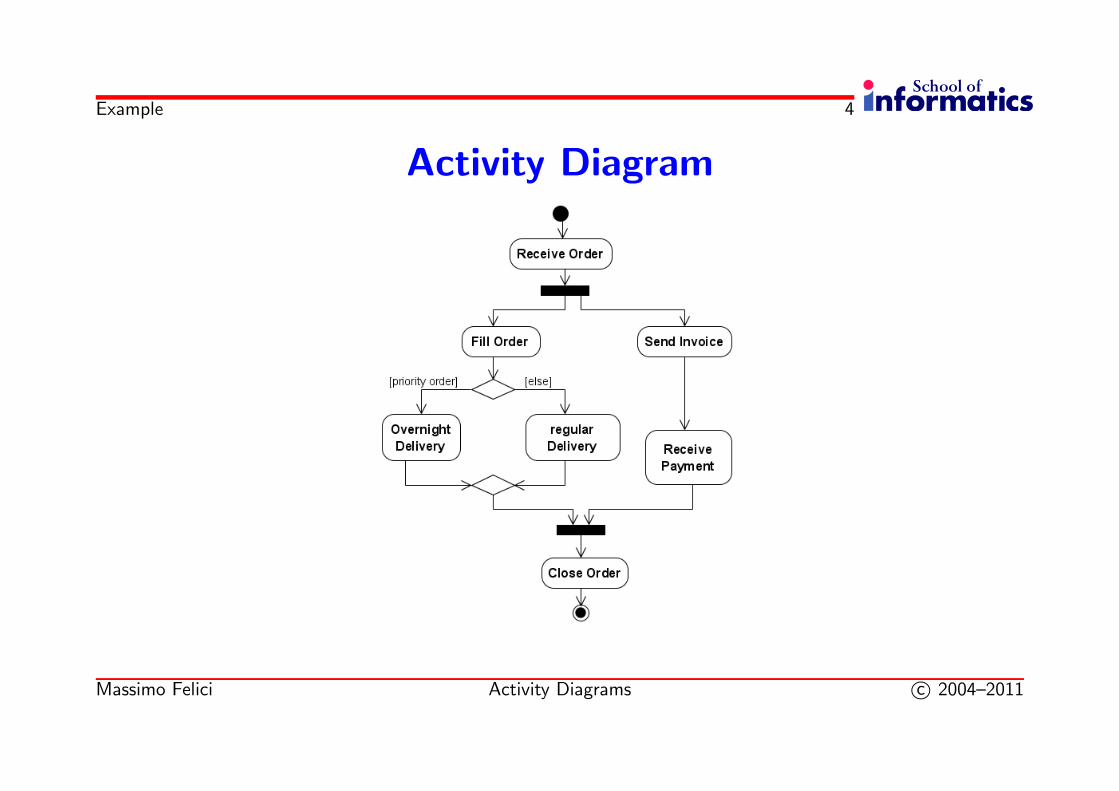
Example 4
Activity Diagram
Massimo Felici Activity Diagrams c© 2004–2011
5
Activities
• An Activity is the process being modelled
• Activities are the vertices of the diagram
• An Activity is a unit of work that needs to be carried out
• Any Activity takes time
• An activity is like a state where the criterion for leaving the state is thecompletion of the activity
Massimo Felici Activity Diagrams c© 2004–2011
6
Actions
• An Action is a step in the overall activity
• The work can be documented as Actions in the activity
• There are four ways in which an action can be triggered
1. On Entry – as soon as the activity starts2. Do – during lifetime of the activity3. On Event – in response to an event4. On Exit – just before the activity completes
Massimo Felici Activity Diagrams c© 2004–2011

7
Transitions
• A Transition is the movement from one activity to another, the change fromone state to another, or the movement between a state and an activity ineither direction
• Transitions: unlabelled arrows from one activity to the next
• Transitions take place when one activity is complete and the next can commence
Massimo Felici Activity Diagrams c© 2004–2011

8
Activity Edges
• The flow of an activity is shown using arrowed lines called edges or paths
• Control-flow Transitions indicate the order of action states
• Object-flow Transitions indicate that an action state inputs or outputs anobject
Massimo Felici Activity Diagrams c© 2004–2011

Slide 8: Activity Edges
• Time could be a factor in an activity
• Time events are drawn with an hourglass symbol
9
Tokens
• Conceptually, UML models information moving along an edge as a token (e.g.,real data, an object or focus of control)
• Each edge may have
– a weight associated with it that indicates how many tokens must beavailable before the tokens are presented to the target action
– a guard condition
Massimo Felici Activity Diagrams c© 2004–2011
10
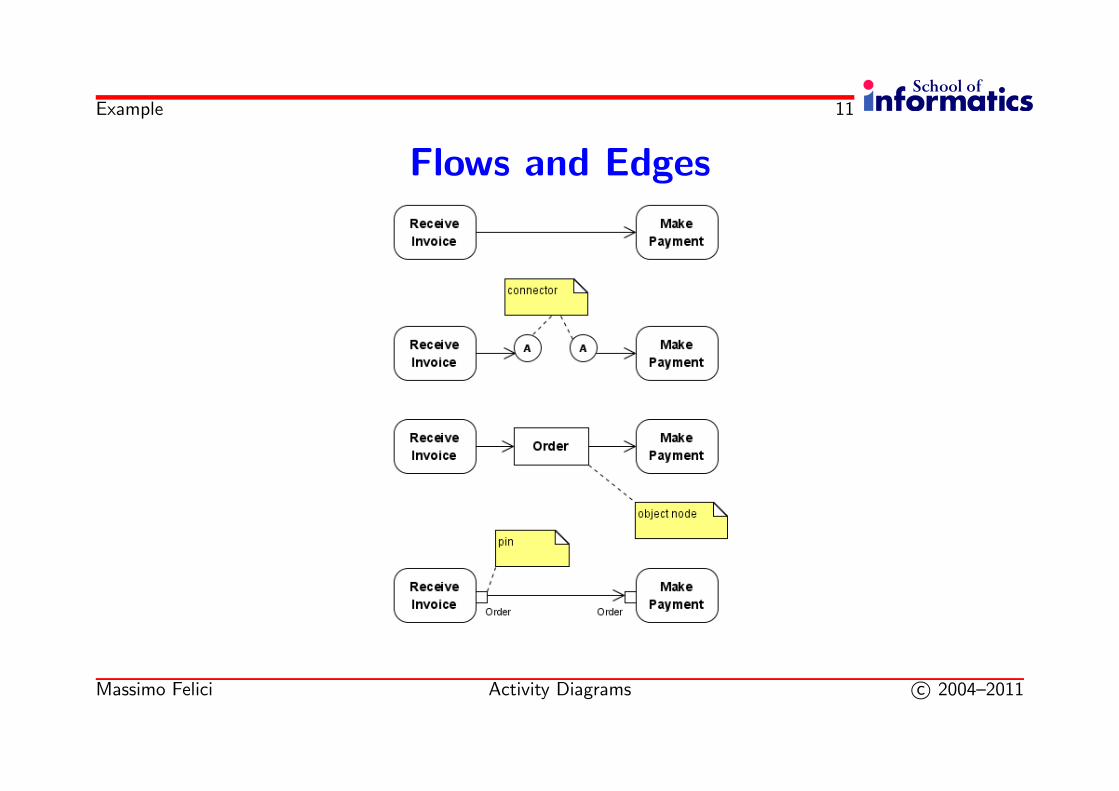
Activity Nodes
• UML 2.0 defines several types of activity nodes to model different types ofinformation flow
– Parameters nodes– Object nodes– (input or output) Pins - special notation for object nodes; exception pins,
value pins
Massimo Felici Activity Diagrams c© 2004–2011
Example 11
Flows and Edges
Massimo Felici Activity Diagrams c© 2004–2011
12
Initial and Final Nodes
• An initial node is the starting point for an activity
• Two types of final nodes: activity final and flow final
• An activity final node terminates the entire activity
• A flow final node terminates a path through an activity, but not the entireactivity
• It is possible to have multiple initial nodes and final nodes
Massimo Felici Activity Diagrams c© 2004–2011

Example 13
Final Nodes
Warnings: be careful when using a flow final node after a fork. As soon as theactivity final node is reached, all other actions in the activity (including the onesbefore the final flow node) terminate. If you want all forked actions to finish,make sure to add a join.
Massimo Felici Activity Diagrams c© 2004–2011
14
Forks
• A transition can be split into multiple paths and multiple paths combined intoa single transitions by using a synchronisation bar
• A synchronisation may have many in-arcs from activities and a number ofout-arcs to activities
• A fork is where the paths split
• On an occurrence of the transition all the activities with arcs from the transitionare initiated
• A fork node splits the current flow through an activity into multiple concurrentflows
Massimo Felici Activity Diagrams c© 2004–2011

Slide 14: Forks
In a detailed design model, you can use forks to represent multiple processes ormultiple threads in a program.

15
Joins
• A join is where the paths meet
• The bar represents synchronisation of the completion of those activities witharcs into the transition
• A join synchronises multiple flows of an activity back to a single flow ofexecution
Massimo Felici Activity Diagrams c© 2004–2011

16
Decision and Merge Points
• A decision point shows where the exit transition from a state or activity maybranch in alternative directions depending on a condition
• A decision involves selecting one control-flow transition out of many control-flow transitions based on a condition
• Each branched edge contains a guard condition
• Guard expressions (inside []) label the transitions coming out of a branch
• A merge point brings together alternate flows into a single output flow - notethat it does not synchronise multiple concurrent flows
Massimo Felici Activity Diagrams c© 2004–2011

17
States
• A state in an activity diagram is a point where some event needs to take placebefore activity can continue
• Activities and States are similar
– States carry out actions as activities do– Activities need to complete their actions before exiting– States are used to imply waiting, not doing
• It is possible to show an object changing states as it flows through an activity
Massimo Felici Activity Diagrams c© 2004–2011

18
Start and End States
• The Start state is the entry point to a flow
• There can be several End states – multiple End states can be used to indicateddifferent follow-on processes from a particular process
• Start and End states can have actions too
• Malformed diagrams – it is possible to form ill-formed diagrams that requiremultiple activations of activities or can allow deadlock
Massimo Felici Activity Diagrams c© 2004–2011

19
Swimlanes
• Swimlanes (or activity partitions) indicate where activities take place.
• Swimlanes can also be used to identify areas at the technology level whereactivities are carried out
• Swimlanes allow the partition an activity diagram so that parts of it appear inthe swimlane relevant to that element in the partition
Massimo Felici Activity Diagrams c© 2004–2011

Slide 19: Swimlanes
Partitions may be constructed on the basis of:
• the class and actor doing the activity
• Partitioning by class and actor can help to identify new associations that havenot been documented in the class model
• the use case the activity belongs to
• Partitioning by use cases can help document how use cases interact

Slide 19: Smimlanes – Example

20
Sending and Receiving Signals
• In activity diagrams, signals represent interactions with external participants
• Signals are messages that can be sent or received
• A receive signal has the effect of waking up an action in your activity diagram
• Send signals are signals sent to external participants
Massimo Felici Activity Diagrams c© 2004–2011

Slide 20: Sending and Receiving Signals
• Note that combining send and receive signals results in behaviour similar tosynchronous call, or a call that waits for a response.
• It is common to combine send and receive signals in activity diagrams, becauseyou often need a response to the signal you sent.

Example 21
Signals on Activity Diagrams
Massimo Felici Activity Diagrams c© 2004–2011

Example 22
Sending and Receiving Signals
Massimo Felici Activity Diagrams c© 2004–2011

Slide 22: Advanced Activity Modelling
• Connectors• UML 2.0 provides supports for modelling Exception Handling• It is possible to show that an action, or set of actions, executes over a collection
of input data by placing the action in an Expansion Region (<<parallel>>,<<iterative>> or <<stream>>)
• UML 2.0 defines a construct to mode looping in activity diagrams – A loopnode has three subregions: setup, body and test
• An action is said to be streaming if it can produce output while it is processinginput
• Interruptible activity region• UML 2.0 introduces a new type of activity node, called the central buffer
node, that provides a place to specify queueing functionality for data passingbetween object nodes
• A data store node is a special type of central buffer node that copies all datathat passes through it

Activity Diagrams for Use Case Modelling 23
How to construct Activity Diagrams
1. Finding system Actors, Classes and use cases2. Identifying key scenarios of system use cases3. Combining the scenarios to produce comprehensive workflows described using
activity diagrams4. Where significant object behaviour is triggered by a workflow, adding object
flows to the diagrams5. Where workflows cross technology boundaries, using swimlanes to map the
activities6. Refining complicated high level activities similarly, nested activity diagrams
Massimo Felici Activity Diagrams c© 2004–2011
Activity Diagrams for Business Modelling 24
How to construct Activity Diagrams
1. Finding business actors and use cases
2. Identifying key scenarios of business use cases
3. Combining the scenarios to produce comprehensive workflows described usingactivity diagrams
4. Where appropriate, mapping activities to business areas and recording thisusing swimlanes
5. Refining complicated high level activities similarly, nested activity diagrams
Massimo Felici Activity Diagrams c© 2004–2011

25
Readings
Required Readings
• UML course textbook, Chapter 11 on Activities
Massimo Felici Activity Diagrams c© 2004–2011
26
Summary
• Activity Diagrams are good for describing synchronization and concurrencybetween activities
• Activity diagrams are useful for capturing detailed activities, but they can alsocapture elements of the high level workflow the system is intended to support
• Partitioning can be helpful in investigating responsibilities for interactions andassociations between objects and actors
Massimo Felici Activity Diagrams c© 2004–2011