activity guide new-aug23 - building an army of citizen...
TRANSCRIPT

Secondary EducationInformation and Investigations
Secondary EducationInformation and Investigations
Astronomy
MATH
Meteorology
Ecology
PHYSICS
PHYSICAL EDUCATION/HEALTH
CHEMISTRY
Physiology
BIOLOGY
MATH
ECOLOGY
Physics
ASTRONOMY
Education

AcknowledgementsPublished by authority of the Minister of the Environment
Copyright Minister of Public Works and Government Services Canada, 2002
Catalogue No En56-177/2002E
ISBN: 0-662-31984-2
Egalement disponible en français
Authors:
Association for Canadian Educational Resources Team (ACER)
(led by Alice Casselman, Andrea Berry and Douglas Hain with ESA staff)
Angus Fergusson (Environment Canada)
Editing:
The Mallard Group
Pictures and Diagrams:
Alice Casselman (Association for Canadian Educational Resources)
Angus Fergusson (Environment Canada)
Translation:
Marie-France Gueraud
(Translation Bureau, Public Works and Government Services, Montreal)
Layout and Design:
BTT Communications (Toronto)
Also available under the title “UV Index, Weather and You”:
• UV Index posters• UV Index brochures, pamphlets• UV Index Web site: (www.msc-smc.ec.gc.ca/uvindex)
Additional copies may also be obtained, free of charge, from:
ANGUS FERGUSSONScience Assessment and Integration BranchMeteorological Service of Canada4905 Dufferin Street,Downsview, Ontario M3H 5T4e-mail: [email protected]
III
ACTIVITY INFORMATION GUIDE
Section 1 INTRODUCTIONWhat is UV?……2Using a UV meter……3
Section 2 HOW UV RADIATION AFFECTS THE WEATHERDaily Weather Reporting……3Maps: Annual Sunlight and UV Hours……4-5Lab: How Cool is Cool?……6UV Radiation and Clouds……7UV Radiation and Air Pressure……8
Section 3 HOW WE CHANGE THE IMPACT OF UV RADIATIONWhat is Ozone?……9What are Ozone Holes?……11Lab: Polar Projections……12What are Greenhouse Gases?……13Triple Whammy……14Map: Smog Levels in Canada……15Making Smog……16Quiz: How do We Know?……17Quiz: 20 Questions……18
INSERT — SPECIALS ACTIVITIES …… Centre PageYou and the BrewerWhat’s in our Atmospheric Soup?Going South for a Tan?Protection Makes a Difference
Section 4 HOW UV RADIATION AFFECTS USUV and Your Health……17-19UV and More Damage……21-22Some Beneficial Effects……22
Section 5 TOWARD HEALING What can I do?……23Political Action……24Tying It All Together……25
Section 6 RESOURCESGlossary……26-29Further Research……30Web Sites……Inside back cover
TABLE OF CONTENTS

Sola
r U
V in o
ur
Worl
d S
econda
ry E
duca
tion
INF
OR
MATIO
N A
ND
IN
VE
STIG
ATIO
NS
Topi
cPa
geBi
olog
yC
hem
istr
yG
eogr
aphy
Mat
hPh
ysic
sPh
ys. E
dW
hat
is U
V?
2bi
olog
ical
lyio
nosp
here
laye
rs o
f ex
pone
nts
EM s
pect
rum
awar
enes
sac
tive
UVB
atm
osph
ere
scal
esw
avel
engt
hsU
V M
eter
Use
3m
ax. b
urn
min
s.LE
D
UV/
wea
ther
inde
xes/
angl
esso
lar
pow
erfie
ld u
seC
anad
ian
map
s4
sunl
ight
leve
lsaw
aren
ess
clim
ogra
phs
cont
our
calc
.U
V le
vels
risk
leve
lsH
ow C
ool?
6sc
i. m
etho
dsc
i. m
etho
dsc
i. m
etho
dva
riabl
essc
i. m
etho
dsc
i. m
etho
dey
e da
mag
epl
asti
c/gl
ass
cond
itio
nsef
fect
iven
ess
filte
rsle
ns c
hoic
eU
V/C
loud
s7
awar
enes
sw
ater
vap
our
pres
sure
sys
tem
spe
rcen
tcl
ouds
filt
ers
daily
cho
ice
UV/
Wea
ther
8su
nscr
een
O3/
air
dens
ity
wea
ther
sys
tem
sre
lati
onsh
ips
air
pres
sure
suns
cree
nW
hat
is O
zone
?9
O, O
2an
d O
3fo
rmul
aepo
lar
flow
hv=e
nerg
yST
Paw
aren
ess
Ozo
ne h
oles
11ro
les
reac
tion
soz
one
hole
sD
obso
n un
iten
ergy
at
wor
kaw
aren
ess
Pola
r V
iew
s12
awar
enes
sH
NO
3lo
ngit
ude
% c
hang
eai
r d
ensi
tysp
ring
even
tsG
reen
hous
e G
ases
13fo
ssil
fuel
seq
uilib
rium
stra
tosp
here
ecol
ogic
al
refr
iger
atio
nec
olog
ical
ca
taly
sts
natu
ral s
yste
ms
foot
prin
tae
roso
lsfo
otpr
int
Trip
le W
ham
my
14ec
olog
yH
NO
3, H
2SO
4PS
C’s
rate
of
chan
gehe
at t
raps
choi
ces
Smog
15he
alth
eff
ects
reac
tion
ste
mp
inve
rsio
ngr
aphi
ngU
V an
d sm
og
tim
e/le
vels
Wea
ther
Qui
z17
awar
enes
saw
aren
ess
rese
arch
too
lsaw
aren
ess
rese
arch
too
lsaw
aren
ess
20 Q
uest
ions
18en
tire
boo
klet
con
tent
ove
rall
know
ledg
e an
d un
ders
tand
ing
of in
form
atio
n pr
esen
ted
You
& B
rew
erA
daily
read
ings
anal
ysis
sour
ces
grap
hing
Br
ewer
dev
ice
awar
enes
sA
tom
. Sou
pB
air
com
pone
nts
form
ulae
glob
al is
sues
pi
e ch
arts
addi
tive
she
alth
eff
ects
Goi
ng S
outh
?C
mel
anin
/agi
ngaw
aren
ess
lati
tude
cal
c.su
n an
gle
angl
esch
oice
s80
bef
ore
18?
Dsk
in e
ffec
tsSP
F fo
rmul
ascl
imog
raph
s co
st c
alc.
cum
ulat
ive
calc
.ev
ents
/ris
kU
V/H
ealt
h19
phys
iolo
gyst
erili
zati
onw
orld
issu
es%
dea
ths/
pop
appl
ied
opti
csm
elan
oma
UV
dam
age
21ec
olog
ypa
int
ecos
yste
ms
epid
emio
logy
UVA
,B,C
vita
min
DW
hat
can
I do?
23pr
otec
t yo
urse
lf a
nd h
elp
othe
rs t
ake
prec
auti
onar
y m
easu
res
Polit
ical
Act
ion
24aw
aren
ess
awar
enes
sw
orld
issu
esgr
aphi
ngaw
aren
ess
awar
enes
sro
le o
f C
anad
ians
as
wor
ld c
itiz
ens
both
at
gove
rnm
ent
and
indi
vidu
al le
vels
pas
t an
d fu
ture
Tyin
g to
geth
er25
A d
iagr
am in
tegr
atin
g th
e ef
fect
s of
gre
enho
use
gase
s an
d hu
man
impa
ct in
our
atm
osph
ere
Glo
ssar
y26
an e
xten
sive
refe
renc
e re
sour
ce fo
r al
l sub
ject
are
as a
nd in
tere
sts
Futu
re R
esea
rch
30ga
ps in
pre
sent
dat
a su
gges
ting
fur
ther
wor
k by
bot
h st
uden
ts a
nd s
cien
tist
sN
ote:
cal
c. =
cal
cula
tion
s
Environment�
Canada�
�
Environnement�
Canada�
�

1
ACTIVITY INFORMATION GUIDE
IntroductionAhhh… nothing feels quite like the warmth of the sun on your skin, especially after a long, coldwinter. But did you know that sunlight could have serious negative effects on your health and theenvironment?
For example:• Ultraviolet (UV) radiation can cause skin cancer, weaken your immune system, damage your eyes
and lead to wrinkles and premature aging.• The effects of UV exposure are cumulative, increasing over time.• 80 per cent of the damage from UV exposure may be done before you reach 18.• The average thickness of the ozone layer changes seasonally over Canada.• Ozone can have positive or negative effects on your health – depending on where it is in the
atmosphere.But the news is not all gloomy. We can each take precautions to protect ourselves from harmful UV radiation. Simple activities, such as standing in the shade, wearing protective clothing, applyingsunscreen and visiting a doctor if you suspect skin cancer, are positive steps. In addition, opting for activities that decrease the amount of fossil fuel you consume will help reduce the number of UV rays that reach our planet.
The Government of Canada, recognizing the need for action, has launched this UV-awareness programand other initiatives that include monitoring the rate and effects of change on our climate and in ourforest ecosystems. Governments are also supporting research and pilot projects in transportation,sustainable agriculture and energy production that will reduce greenhouse gas emissions.
Students can lead the way by taking positive steps. And they can also protect themselves andothers against UV exposure. They can reduce their use of fossil fuels directly (in vehicles) andindirectly (through energy conservation). Students can help others understand the serious, long-term effects of the damage we are imposing on our planet.
We need to work together today to prevent tomorrow’s problems!

2
What is UV?UV (ultraviolet radiation 100-400nm) is part of the electromagnetic radiation spectrum(sunlight) travelling from the sun to the earth. The radiation or energy is of the nature ofwaves extending from gamma rays (shortest) to radio waves (longest). Visible light isshown in blue in the diagram below. UVA, UVB and UVC radiation wavelengths areshorter than visible light(vl). Note: 1 nm = nanometer = 1 x 10⁻⁹ m or 0.000000001 metres
Electromagnetic Radiation Spectrum
UV radiation is affected by time of day and year; altitude and latitude; thickness ofatmospheric ozone layer; cloud cover; and the levels of reflection from elements such as snow, water, concrete and sand. It is not affected by surface temperature.
Layers of the Atmosphere
PROTECT YOURSELF
Visible light
Ultraviolet InfraredVisible Spectrum
X-rays
10-12
10-10
10-8
10-6
10-4
10-2
100
102
104
106
Infrared Microwaves Radio waves
Gamma rays Ultra-violet
Televisionand FM AM broadcast
longestshortest
100 200 300 400 500 600 700 800
Ozone Layer
Stratosphere
Wavelength(nm)
UVAUVBUVC
Wavelength

3
ACTIVITY INFORMATION GUIDE
Using a UV MeterThe UV Index (UVI) is a measure of the intensity of UVB radiation reaching Earth’s surface. To find the level of UV radiation:
• Hold the UV meter horizontally. Press the switch until the LED screen activates. • Release the switch and note the UV level shown.• Record your reading.
UV Meter Photo Front Back
Use the chart on the back side of the UV meter only to determine the maximum minutes for your skin type to burn at different UV levels (Precautionary principle!)
NOTE: The heat you feel on your skin is from the longer wavelengths of infrared radiation.
Questions:
1. How do the readings change when you alter the angle of the meter?a) Perpendicular to sun’s rays?b) Perpendicular to ground?c) Parallel to ground?
2. Determine your skin type using the 1 – 6 scale (lightest to darkest) and UV level. 3. Is there a relationship between the degrees of slope and the UV Index?
Optional: 4. How many minutes (maximum) will it take your skin to burn at this level?5. Is there a linear relationship between skin type and minutes to burn?
Daily UV Index Forecast The local UV Index forecasts found on the radio, television, in the newspapers or on the web are available from April through October. The UV Index forecast is a prediction of the maximum UV Index value for that day (morning forecast) or the next day (evening forecast). It is a combinationof computer predictions of ozone-layer thickness and observations at the 12 Canadian ozone-monitoring (Brewer) stations. The latitude and time of year are factored into the local clear-sky UV Index, which is adjusted based on forecasts for local cloud cover and precipitation.
Questions: 1. What was the UV Index (UVI) in your area at solar noon today? 2. How does the UVI forecast in the media compare with your UV reading?
ab
c
4
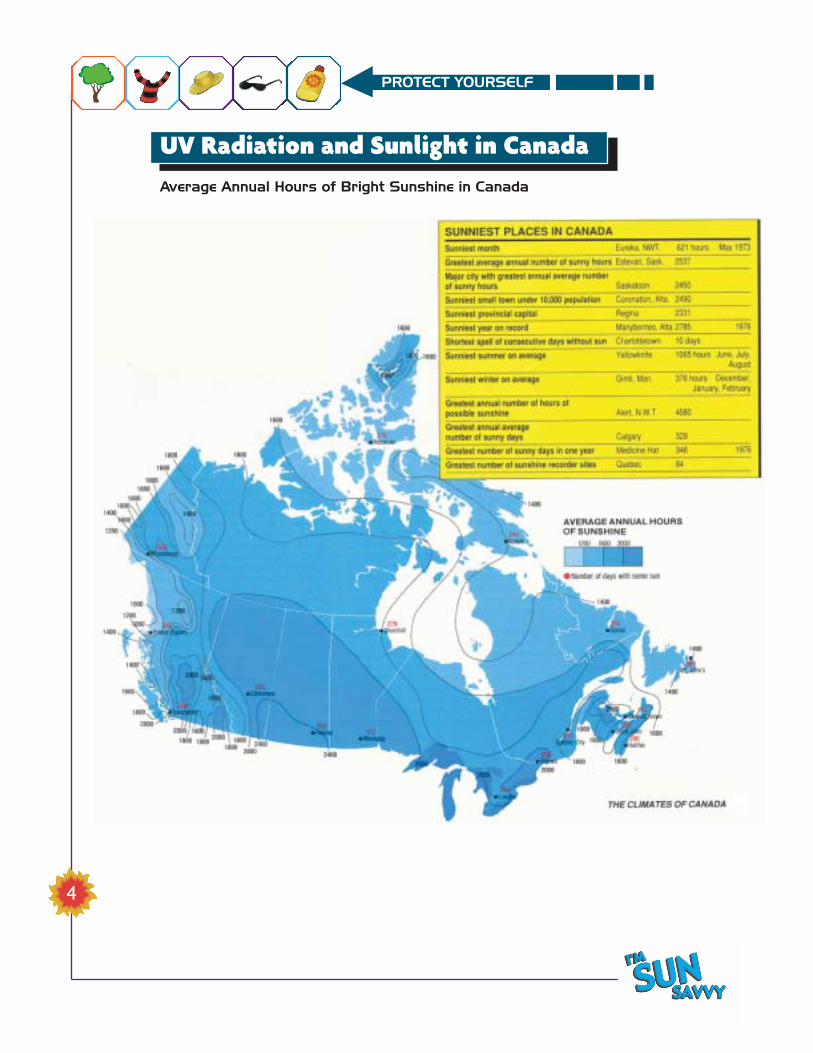
UV Radiation and Sunlight in CanadaAverage Annual Hours of Bright Sunshine in Canada
PROTECT YOURSELF
5
ACTIVITY INFORMATION GUIDE
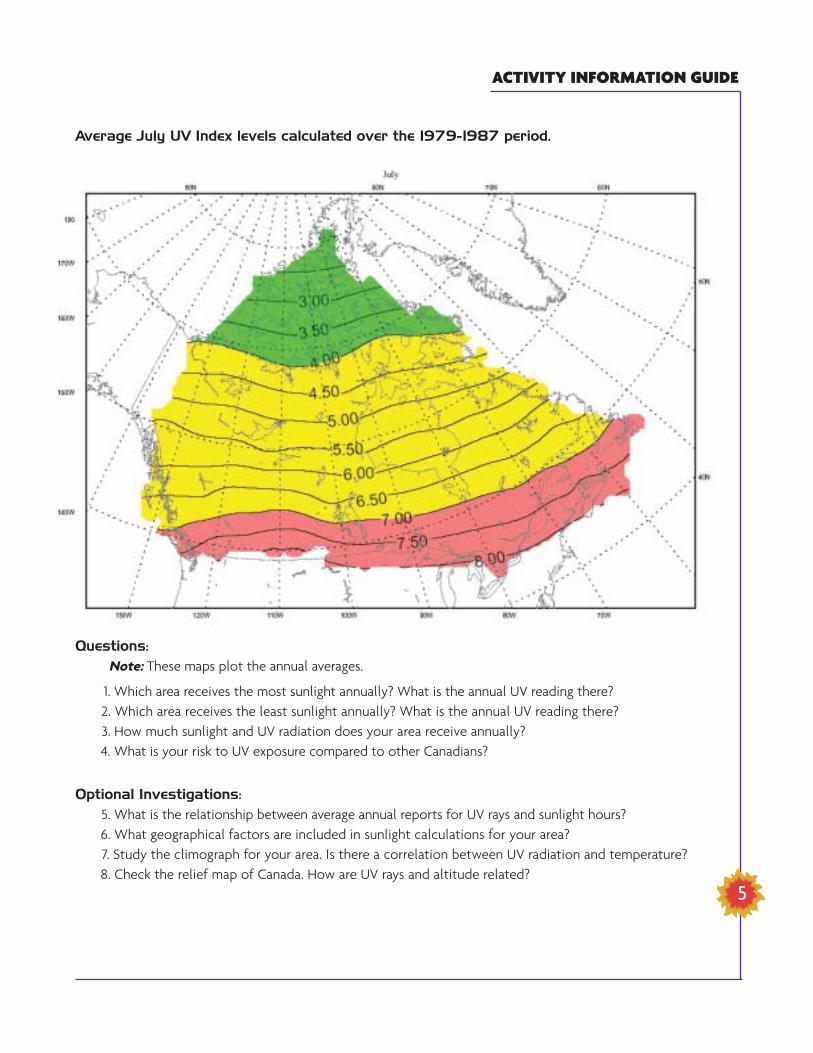
Average July UV Index levels calculated over the 1979-1987 period.
Questions:
Note: These maps plot the annual averages.
1. Which area receives the most sunlight annually? What is the annual UV reading there?2. Which area receives the least sunlight annually? What is the annual UV reading there?3. How much sunlight and UV radiation does your area receive annually?4. What is your risk to UV exposure compared to other Canadians?
Optional Investigations:
5. What is the relationship between average annual reports for UV rays and sunlight hours?6. What geographical factors are included in sunlight calculations for your area?7. Study the climograph for your area. Is there a correlation between UV radiation and temperature?8. Check the relief map of Canada. How are UV rays and altitude related?
6
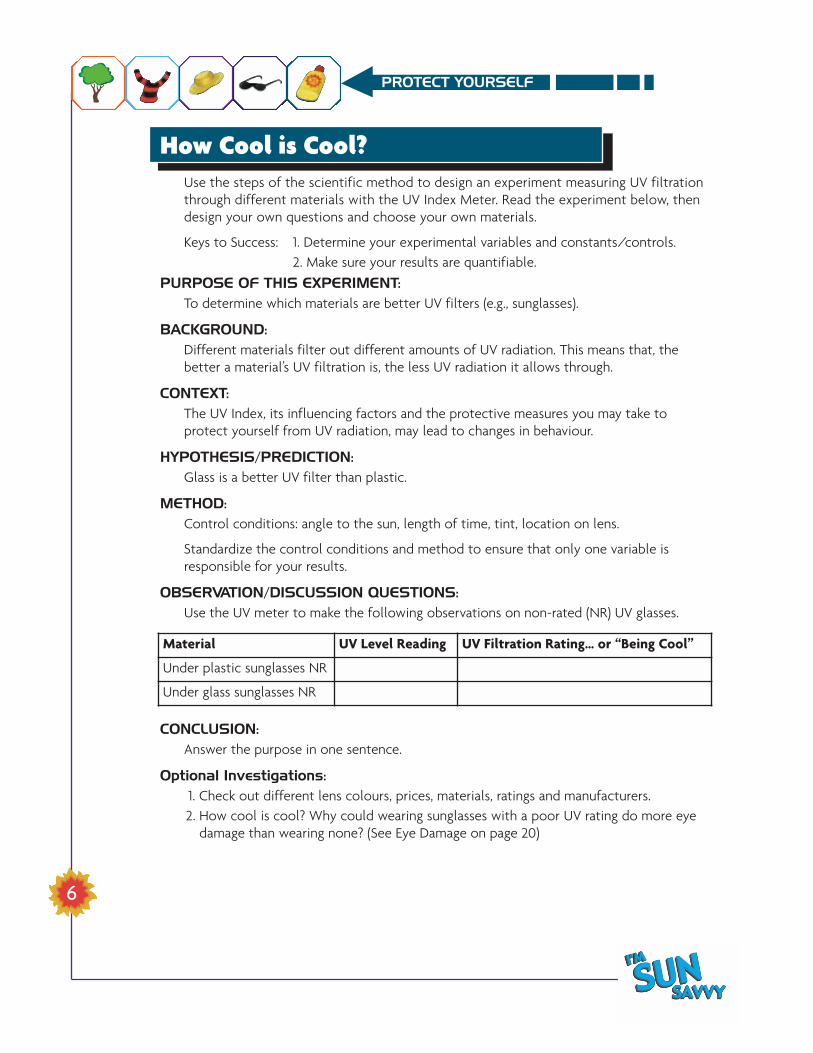
How Cool is Cool?Use the steps of the scientific method to design an experiment measuring UV filtrationthrough different materials with the UV Index Meter. Read the experiment below, thendesign your own questions and choose your own materials.
Keys to Success: 1. Determine your experimental variables and constants/controls.2. Make sure your results are quantifiable.
PURPOSE OF THIS EXPERIMENT:
To determine which materials are better UV filters (e.g., sunglasses).
BACKGROUND:
Different materials filter out different amounts of UV radiation. This means that, thebetter a material’s UV filtration is, the less UV radiation it allows through.
CONTEXT:
The UV Index, its influencing factors and the protective measures you may take toprotect yourself from UV radiation, may lead to changes in behaviour.
HYPOTHESIS/PREDICTION:
Glass is a better UV filter than plastic.
METHOD:
Control conditions: angle to the sun, length of time, tint, location on lens.
Standardize the control conditions and method to ensure that only one variable isresponsible for your results.
OBSERVATION/DISCUSSION QUESTIONS:
Use the UV meter to make the following observations on non-rated (NR) UV glasses.
CONCLUSION:
Answer the purpose in one sentence.
Optional Investigations:
1. Check out different lens colours, prices, materials, ratings and manufacturers.2. How cool is cool? Why could wearing sunglasses with a poor UV rating do more eye
damage than wearing none? (See Eye Damage on page 20)
PROTECT YOURSELF
Material UV Level Reading UV Filtration Rating… or “Being Cool”
Under plastic sunglasses NR
Under glass sunglasses NR

7
ACTIVITY INFORMATION GUIDE
UV Radiation and Clouds
UV Index Adjustment for Cloud and Precipitation
Note: The factor shown is determined by statistical analysis of weather effects.
Questions:
1. Complete the chart.2. What relationship do you see between cloud type and UV filtration?3. From your knowledge of science, in what ways could water vapour or droplets affect the amount
of UV radiation reaching the earth’s surface?
Type
Scattered clouds
Hazy
Mainly cloudy with/without precipitation
Cloudy
Cloudy with/without precipitation
Overcast
Heavily overcast with/without rain/drizzle
Factor
1.1
0.9
0.7
0.6
04
0.3
0.2
% UV Absorbed
+10%
30%
40%
80%
Mainly cloudy conditions partly reduce UV transmission.
Heavy overcast conditions greatly reduceUV transmission.
Scattered clouds reflect UV, increasing theUV rays reaching the earth’s surface.

8
UV Radiation and Air PressureCross-section of the weather map below from A to B.
Questions:
1. Compare the two perspectives of this weather system.Where is the ozone level the thickest along the line AB?
2.What is the weather like on most high-pressure days?3. Who needs the most sunscreen in the lower diagram — the figure at the left,
in the centre or on the right?
Optional Investigation:
4. Explain your answer by describing the relationship of air pressure, the thickness of the ozone layer and UV radiation. Assume the top ofthe ozone layer is relatively flat.
PROTECT YOURSELF
A
A B
B
Weather map ofCanada showing
pressure systems.

9
ACTIVITY INFORMATION GUIDE
What is Ozone? Ozone (O3) is a toxic gas molecule composed of three oxygen atoms. It forms as a natural layer in the stratosphere. Ozone is formed over the tropics under intense UVC radiation from the sun andflows toward the poles. The density and thickness of the ozone layer is constantly changing asmeteorological conditions change. The average thickness of the ozone layer over Canada ranges from 300 to 500 Dobson Units (DU) where 1 DU = .01mm of pure ozone at standard temperature and pressure at sea level.
The ozone layer is our natural sunscreen since it absorbs UV radiation in the cycle of making ozone and breaking down ozone. All UVC radiation from the sun is absorbed in breaking the oxygen moleculesapart to form ozone. Ozone is constantly broken down in the stratosphere by UVB/UVA radiation.During this process, only part of the UVB is absorbed. Almost all UVA reaches the Earth’s surface.
The ozone layer is maintained by a natural balance between the UV-driven reactions that formozone from molecular oxygen (O2), and oxygen from ozone. Atomic oxygen (O) is extremely active and immediately reacts to form new molecules of oxygen or ozone.
O2 + UVC➝ O- + O-
O + O2 + M ➝ O3 + M (M can be any given molecule, e.g., N2 or O2, to act as a collision partnerneeded to conserve energy and momentum.)
Ozone is photodissociated by UVB/UVA and visible light.
O3 + UVB/UVA ➝ O2 + O-
Which in turn allows the oxygen atom to break down ozone.
O3 + O- ➝ O2 + O2
Ozone is also broken down by additional catalytic reactions involving a hydrogen radical (H), ahydroxyl radical (OH), a nitrous radical (NO), a chlorine radical (Cl) or a bromine radical (Br). Thecatalyst is reformed after the reaction with ozone and is able to perform the ozone cycle once again.
In summary, the oxygen-ozone balance in the stratosphere can be shown as:

10
Action of Pollutants on the Natural SystemIn the stratosphere, reactions normally maintain equilibrium keeping the ozone layer atapproximately the same thickness. Pollutant molecules, like the chlorine from CFCs,unbalance these natural reactions by destroying ozone molecules at a faster rate. CFCshave, in the past, been used as refrigerants and aerosol propellants. This has led to severeozone depletion that is predicted to take from 50-500 years to recover.
(CFC-11 = chlorofluorocarbon – CFCl3)
CFCl3 + UV +O3 ➝ ClO + O2 THEN O- + ClO ➝ O2 + Cl-
This frees the chlorine atom to act as a catalyst and repeat the process for manydecades, destroying more stratospheric ozone. Thus, the loss of global ozone becomesgreater than its formation.
Exercise
1. The chlorine in the CFCs depletes ozone by catalyzing its breakdown to oxygen(O2).Using your chemistry kit, build a model to demonstrate this.
2. Bromine found in halons and methyl bromine destroys ozone. How effective is it indestroying ozone compared to chlorine?
PROTECT YOURSELF
11
ACTIVITY INFORMATION GUIDE
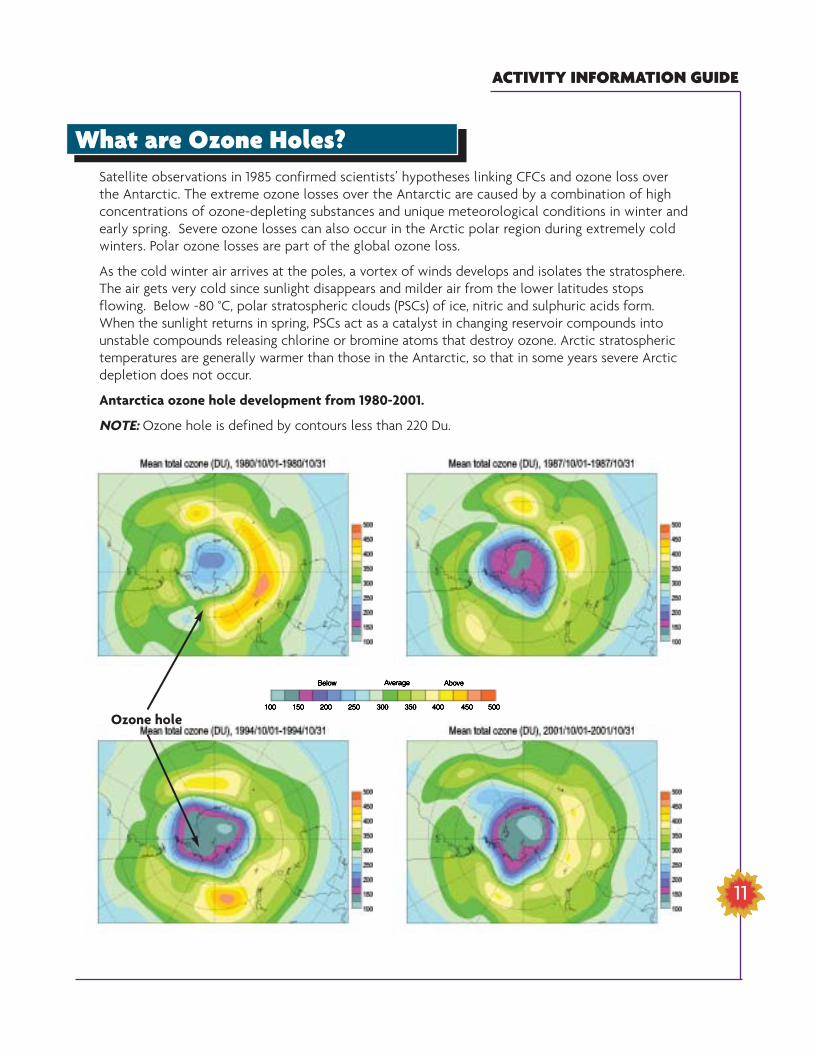
What are Ozone Holes?Satellite observations in 1985 confirmed scientists’ hypotheses linking CFCs and ozone loss overthe Antarctic. The extreme ozone losses over the Antarctic are caused by a combination of highconcentrations of ozone-depleting substances and unique meteorological conditions in winter andearly spring. Severe ozone losses can also occur in the Arctic polar region during extremely coldwinters. Polar ozone losses are part of the global ozone loss.
As the cold winter air arrives at the poles, a vortex of winds develops and isolates the stratosphere.The air gets very cold since sunlight disappears and milder air from the lower latitudes stopsflowing. Below -80 °C, polar stratospheric clouds (PSCs) of ice, nitric and sulphuric acids form.When the sunlight returns in spring, PSCs act as a catalyst in changing reservoir compounds intounstable compounds releasing chlorine or bromine atoms that destroy ozone. Arctic stratospherictemperatures are generally warmer than those in the Antarctic, so that in some years severe Arcticdepletion does not occur.
Antarctica ozone hole development from 1980-2001.
NOTE: Ozone hole is defined by contours less than 220 Du.
Ozone hole

12
Polar Projections
Mean deviation is the percentage loss of ozone layer thickness as compared to pre-1980values. i.e., changes in Dobson Units as percent.
Questions:
1. Which longitude has the greatest % change in UV protection?2. Which area has the greatest UV protection?3. What is the % change in the ozone layer in your area?
Optional Investigations:
4. Why is the Arctic ozone layer thicker than the Antarctic ozone layer? Why are bothregions vulnerable to UV damage?
5. What chemicals in our atmosphere are most responsible for ozone loss?6. Why was the record for the month of March chosen for this projection?
PROTECT YOURSELF
Antarctic Ozone Hole(2001)
Severe Arctic Ozone Depletion(2000)
%Increase
Zero
%Decrease
Find the South Pole.
28 million square kilometers
Find the North Pole.

13
ACTIVITY INFORMATION GUIDE
What Are Greenhouse Gases?Greenhouse gases (GHGs) trap thermal energy (heat) from the sun’s infrared radiation within ourtroposphere and slows its rate of escape into the thermosphere and outer space. GHGs are createdby fossil-fuel combustion and natural processes such as photosynthesis, digestion and respiration.Examples of greenhouse gases causing heating of our atmosphere are: carbon dioxide, nitrogenoxides, methane and halocarbon gases (e.g., CO2, N2O, CH4, CFCl3 or CFCl2). Since the 1750s, theatmospheric concentration of CO2 has increased by about 31%, N2O by 17% and CH4 by 151%. Manyof the halocarbons are both ozone-depleting and greenhouse gases, and have a high global warmingpotential compared to carbon dioxide.
Global warming and ozone depletion are linked at the physical, chemical and ecosystem levels, andby human-related stresses on natural systems. The health of the ozone layer depends on our abilityto control greenhouse gases and to rid the atmosphere of ozone-depleting substances. As Pogosays “We have seen the enemy, and them is us!”
Exercise:
Complete the chart below showing the chemical and structural formulae for the GHGs named and their source.
Optional:
Research other GHG’s and add to the chart.
Name Chemical formulae Structural formulae Role(s)
Carbon Dioxide CO2 Photosynthesis
N2O
CH4
CFCI3
CFC – 12 CFCI2 Pollutant

14
TRIPLE WHAMMYUV, Climate Change, Global Warming and Us
Climate change and global warming are caused by the changes in concentration and inthe composition of greenhouse gases. Some greenhouse gases are produced naturally,and, in normal concentrations, have historically kept the temperature of the earth 33C°warmer than it would otherwise be and the planet is able to support life.
Note: Remember that our ozone layer normally keeps the stratosphere warm by UV-driven reactions of ozone. This also reduces the amount of UV reaching earth.
Enhancing our heat trap
Greenhouse gas concentration in our troposphere has increased due to increasedemissions from land use, landfills, and fossil fuel combustion from transportation,energy production, air conditioning, etc. These emissions trap long-wave radiation (heat)in the troposphere, causing its temperature to rise. However, with less heat reaching thestratosphere, it is becoming cooler. A single whammy
Making a better heat trap
Carbon dioxide makes up a large percentage of fossil fuel emissions into theatmosphere. In the troposphere, the more carbon dioxide released, the more heat isretained and the warmer the troposphere becomes. In the stratosphere, however,increases in carbon dioxide cause more heat to be reflected back into the tropospherethan into space resulting in a cooler stratosphere. Double whammy
The better the heat trap, the better the cooling effect
At the poles, a cooling of the stratosphere causes the polar vortex to become morestable with an increased frequency of polar stratospheric clouds (PSC). These clouds,made up of ice crystals and nitric and sulphuric acids, act as a catalyst in the destructionof ozone. Thus, a cooler and more stable polar vortex during winter will result in a higherfrequency of PSCs and higher rates of spring ozone loss. Loss of ozone thus results in acooler stratosphere, and a negative feedback loop that causes more ozone loss each year.Triple Whammy
To sum up: The more greenhouse gas emissions produced, the more heat is trapped inthe troposphere, the greater the stratospheric cooling effect especially at the poles, thegreater the ozone loss becomes, and the more UV radiation can reach us! Bingo
PROTECT YOURSELF

15
ACTIVITY INFORMATION GUIDE
Smog Levels in Canada
AQO = Air Quality Objectives
Questions:
1. What is smog?2. Which area has the most days exceeding the smog standard?3. Which area has the fewest smog days? What is the smog situation where you live?
Optional Investigations:
4. What is the effect of temperature inversion on the behaviour of smog?5. Check for correlation(s) between city size and smog production or between city hospital
respiratory admissions and smog or sunlight hours /UV hours /smog.

16
Making SmogThe combustion of fossil fuels release primary pollutants (e.g., nitrogen oxides, sulphurdioxide, volatile hydrocarbons (VOCs) and carbon monoxide) in great quantities. The UVradiation in sunlight causes these compounds to form smog, which is full of highlyreactive secondary pollutants or photochemical oxidants, such as ozone, that damageplants and animals. Smog production peaks after the release primary pollutants. See thegraph below.
Example: NO2 + HxCx - UV ➝ ozone + aldehydes + ketones + PANs + others
primary pollutants secondary pollutants
Question:
1. At what time does the maximum concentrations of ozone occur each day?2. At what time do the highest UV values occur each day?3. What is the average time lag between the peak in UV radiation and the peak in ground
level ozone?
Optional:
4. What emissions do vehicles using water as fuel release?
PROTECT YOURSELF

17
ACTIVITY INFORMATION GUIDE
How Do We Know?Identify the equipment below used to study the ozone layer.
1.
3.
4.
5.
2.
1. Stevenson Screen2. Tethered Sonde3. Brewer Spectrophotometer
4. SCISAT-1: Canadian Scientific Satellite5. Polyethylene Ballon carrying ozone instruments

18
UV and U: 20 Questions
1. What does SPF mean?
2. Does UV radiation have long or short waves?
3. What does GHG mean?
4. Define melanoma.
5. How high do ozone sondes fly?
6. Define the UV Index.
7. What does CFC mean?
8. How many oxygen atoms are there in ozone?
9. Is ozone toxic?
10. How many Canadian Brewer stations are there in 2002?
11. Where is the ozone hole in our atmosphere in winter?
12. Name one volatile hydrocarbon.
13. What ratio of Canadians will likely develop melanoma?
14. Name one secondary pollutant from automobiles.
15. How high does the UV Index unit go?
16. How does high UV exposure damage a food chain?
17. When was the Montreal Protocol signed?
18. What is the percentage of Canadian green house gas emissions
that are attributed to individual/personal actions?
19. How many tonnes of GHG do Canadians produce in a year?
How does this compare to the global average?
20. Is damage from exposure to UV radiation cumulative?
PROTECT YOURSELF

19
ACTIVITY INFORMATION GUIDE
UV and Your HealthSkin Damage
Have you ever been complimented on your “sunny glow”, or your great tan? While that may be aflattering statement, research shows there is no such thing as a healthy tan. Skin produces a darkpigment called melanin (a tan) as a shield against UV damage. Any change from our natural skincolour is a sign of damage to the skin cells andsusceptibility to further negative effects. Skinburns because high doses of UV radiation havekilled most cells in the upper skin layer anddamaged the rest.
In 2001, 3900 cases of malignant melanoma werediagnosed in Canadians. From these, 840 peopledied. An additional 70,000 new cases of non-melanoma skin cancer were reported in the sameyear. Research has tied UV exposure directly tothe development of non-melanoma skin cancer and there is also an indication that it might belinked to melanoma but more research is needed to be certain. One in five Canadians can expect todevelop some form of skin cancer in their lifetime.
Does darker skin have more natural UV protection? Yes, about 8 SPF. But on darker skin, it is alsoharder to detect the signs of skin cancer–moles and dark skin patches. If you detect any signs ofskin cancer on your body, see your doctor immediately. The sooner a cancer is detected, the greateryour chances for its complete removal.
Question:
Look around your classroom – how many people may experience a UV-related skin disease?
20
Immune Deficiency and Infectious Diseases
Hanging out in the sun can also have negative impacts on the immune system — the body’s natural defense against disease. One experiment showed that about 100minutes of midday sun exposure can suppress resistance to Listeria monocytogenese, a bacterial agent that can cause meningitis. Long-term research in Australia (where halfthe population may get skin cancer) has demonstrated that the rate of skin cancersincreases in medically immune-suppressed patients. For example, of people who hadkidney transplants, 7 per cent developed skin cancer after one year, 45 per cent after 11years and 70 per cent after 20 years.
UV radiation can also take its toll on infectious diseases. Smallpox lesions grow insunlight, and Herpes simplex Virus I and II (manifested in cold sores) are reactivated. In fact, ground-level UV radiation may act synergistically with climate changes toincrease the frequency and severity of infectious diseases.
Eye Damage
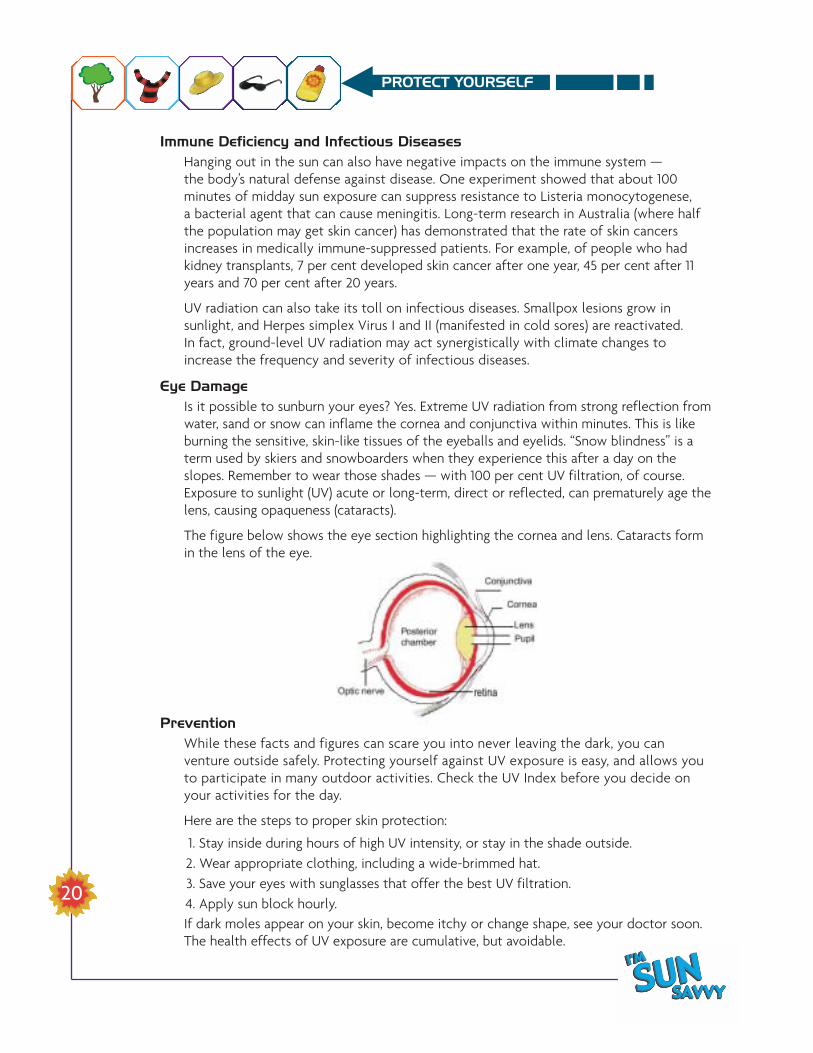
Is it possible to sunburn your eyes? Yes. Extreme UV radiation from strong reflection fromwater, sand or snow can inflame the cornea and conjunctiva within minutes. This is likeburning the sensitive, skin-like tissues of the eyeballs and eyelids. “Snow blindness” is aterm used by skiers and snowboarders when they experience this after a day on theslopes. Remember to wear those shades — with 100 per cent UV filtration, of course.Exposure to sunlight (UV) acute or long-term, direct or reflected, can prematurely age thelens, causing opaqueness (cataracts).
The figure below shows the eye section highlighting the cornea and lens. Cataracts formin the lens of the eye.
Prevention
While these facts and figures can scare you into never leaving the dark, you canventure outside safely. Protecting yourself against UV exposure is easy, and allows youto participate in many outdoor activities. Check the UV Index before you decide onyour activities for the day.
Here are the steps to proper skin protection:
1. Stay inside during hours of high UV intensity, or stay in the shade outside. 2. Wear appropriate clothing, including a wide-brimmed hat.3. Save your eyes with sunglasses that offer the best UV filtration. 4. Apply sun block hourly.If dark moles appear on your skin, become itchy or change shape, see your doctor soon.The health effects of UV exposure are cumulative, but avoidable.
PROTECT YOURSELF

21
ACTIVITY INFORMATION GUIDE
More Damage… Humans are not the only beings affected by UV radiation. It also affects plants, animals, food websand entire ecosystems.
Plants
Sunlight is the source of life for “primary production”, or plant growth, which forms the foundationof the food chains and webs that support all life. Any changes to UV levels on the earth’s surfacedirectly affect the productivity of plants. UV radiation damages membranes around plant cells aswell as the DNA within cell nuclei. It also targets membrane-bound chloroplasts, decreasing aplant’s ability to produce energy by altering leaf area, plant height, fruit size and taste. Exposedpollen and eggs can also be damaged, decreasing fertility and seed production.
The effects of UV exposure can be devastating for Canada’s agricultural sector. In studies on morethan 100 varieties of 12 important crop species, scientists found negative effects on biomassproduction on over 60 per cent of plant varieties exposed to UV levels equivalent to a 20-per-centreduction in the ozone layer. This effect on production means that farm income in Canada wouldlikely decrease by $387 million per year (based on 1995 yield estimates).
Forest Ecosystems
Although forests comprise 80 per cent of total terrestrial biomass, not much is known about theeffects of increased UV on forests, except that they are cumulative (trees live for a lot longer thanagricultural crops, which are generally grown for one season). Also, photosynthesis system (PS) II,used by trees, is more affected by UV radiation than PS I.
Knowing that plants use CO2 in photosynthesis, some people think that global warming (causedlargely by increased CO2 in the atmosphere) can be positive for plant growth. Studies have shown,however, that while biomass production has increased with higher CO2 levels, productivity hasdecreased with corresponding higher UV exposure, due to a thinner ozone layer.
Fresh-water Ecosystems
Our lakes and river systems are also fragile. An increase in UV radiation can decrease primaryproductivity, disrupt nutrient cycles, alter community structures and modify toxic chemical patternsin the food chain. Research has shown that, while primary production of phytoplankton maydecrease with higher UV, the population of the creatures that feed on phytoplankton (chromonidfamily) decreases even more. In the study, phytoplankton biomass increased because the feederpopulation was so diminished that it disrupted a vital food chain link.
UV penetration in fresh water has been directly correlated to the amount of dissolved organiccarbon (DOC). Less DOC means more UV penetration and more intense effects. In Ontario, 46 lakesstudied for 20 years have shown a 15 to 20 per-cent decrease in DOC levels with a corresponding 22to 60 per-cent rise in UV penetration. Originally thought to be effects of climatic change and acidrain, these changes are now recognized as being related to UV radiation. Shade trees along thebanks provide some UV protection for streams, creeks and small ponds.

22
Marine Ecosystems
Canada has the longest ocean coastline in the world. Marine ecosystems are importantto our coastal communities. Oceans cover 71 per cent of the earth’s surface and accountfor 40 per cent of the world’s primary biological productivity. Besides being the basis ofmarine food chains, phytoplankton also plays a crucial role in climate change bymaintaining a large and variable sink for atmospheric CO2. As in freshwater ecosystems,increased UV exposure can kill algae causing a decrease in phytoplankton production andthus limit the dependent food webs.
Animals
Documented evidence exists that Chilean sheep and Australian kangaroos have goneblind from UV damage to their eyes. More research is needed to document such damageto Canadian animals.
Paint
UV causes “chalking” or formation of a powdery coating. “Fading” occurs as inorganicpigments are degraded, especially in lighter reds, oranges and yellows.
Clothing
Fabric tests for UV penetration show that heavier fabrics, tighter weaves and darkercolours, offer better protection. Polyester or polyester blends are recommended.
Note: UV shields are often used on lights in clothing stores to prevent colour shift infabrics due to long-term UV exposure.
Beneficial AspectsWhile we have focused on the negative effects of UV radiation, we must keep in mindthat it does kill bacteria, build bones and provide “black light” effects.
• Water Purification Systems — Use UVC + UVB. (Note: Check system needs for energy,cleaning, quality of intake water and its ability to kill parasitic cysts.)
• Sterilization — UVC radiation is a bactericide in different locations and processes.• Vitamin D, formed by summer sun UV: 10 to 15 minutes 3 times a week on face,
forearms and hands, will maintain bone calcium, immune functions and blood-cellformation.
PROTECT YOURSELF

23
ACTIVITY INFORMATION GUIDE
What Can I Do?Protect Yourself
These protective measures are listed from most to least important.
1. Use shade when available — if no UV protection, stay indoors for peak UV hours. 2. Choose appropriate protective clothing.3. Wear a hat.4. Purchase and wear approved UV-filtering sunglasses.5. Wear appropriate sunscreen and reapply it often since it is absorbed very quickly and becomes
ineffective, usually after one hour.
ALSO REMEMBER TO:
• Educate yourself about the dangers of immediate and long-term effects.• Check yourself for possible skin cancer signs: irregular spots, moles, or patches. • Add your ideas to sun protection — beginning with you and your friends.
Help Others
• Share information with others about UV protection and damage.• Establish a “Sun Smart” school program.• Check out UV precautions taken by your friends to prevent sunburns.• Start reducing the size of your ecological footprint by launching an energy conservation
program. Remember that most of the electricity produced for your home is from the burningof fossil fuels, not to mention the fossil fuel consumption in our vehicles.
• Start a “walking school bus” program, a waste audit and/or a recycling program as energyconservation measures to reduce the school’s ecological footprint.
• Investigate developing a program of political action to increase awareness and political will towork toward solutions to this problem.
• Your ideas — beginning with you and your friends.PS. Make sure you understand the connection between increased greenhouse gas emissions andincreased UV radiation on our planet.
Answers to 20 questions:
1. Sun Protection factor 6. Measure of UVBintensity
11. Over the North Pole 16. Changes theproductivity of plants
2. Short waves 7. Chlorofluorocarbons 12. Ethanol, Propane,Propylene, Acetylene
17. 1987
3. Greenhouse gas 8. 3 13. 1 in 5 18. 28%
4. Dangerous type of skin cancer
9. Yes 14. NO, CO 19. 23 tonnes per year, 6 to one
5. 20 km 10. 12 15. 16+ 20. Yes

24
Political ActionMontreal Protocol
In 1974, scientists Rowland Sherwood and Mario Molina suggested that chlorine fromCFCs could deplete stratospheric ozone. In 1987, the Montreal Protocol — aninternational agreement on ozone-depleting substances found in refrigerants, solventsand propellants — was signed by 81 countries acting on the precautionary principle.
Canada was one of the first nations to ban the use of CFCs as an aerosol propellant.Because of its northern location, Canada is one of the countries most at risk from ozonedepletion. The Arctic ecosystems, already suffering from the impacts of climate change,are especially vulnerable.
If this agreement had not been signed, one-third of the world’s population would havebecome new ozone-destroyers. The follow-up meetings in London (1990), Copenhagen(1992), Vienna (1995) and Beijing (1999) led to the Montreal Protocol’s ratification by 175nations. The benefits of this action are expected to outweigh costs by ten to one.Atmospheric concentrations of CFC-11 and CFC-12 are now decreasing or slowing.
Questions:
1. What factors would be included in calculations of this cost/benefit ratio?2. What pro and anti forces were involved in the signing of the Montreal Protocol? 3. Are these forces still at work in the agreement process for the Kyoto Accord?
Kyoto Accord
In 1997, Canada agreed to reduceits greenhouse gas (GHG)emissions to six per cent below1990 levels by 2008.
Actions taken since then focuson education, research andvoluntary programs. Our GHGemissions rose 15 per centbetween 1990 and 2000.
Note: B.A.U. = Business As UsualMt = megatonnes
e = equilvalent
Questions:
4. What is the progress toward agreement on this accord?Canadians produce 22.5 tonnes of greenhouse gases per person annually. The globalaverage is 3.8 tonnes of GHGs per person annually. What factors account for this?
5. How does use of carbon credits make this a world issue?
PROTECT YOURSELF

25
ACTIVITY INFORMATION GUIDE
Tying It All Together
Find the DIFFERENCES in our atmosphere shown in this diagram that are due to the impact ofhuman activities on our ozone layer. Check the box to show the change.
CONDITION CHANGE ( + or - )
+ more - less
1. Concentration of ozone molecules ❒ ❒
2. Temperature of our stratosphere ❒ ❒
3. Amount of UV reaching us on earth ❒ ❒
4. Greenhouse gas concentrations ❒ ❒
5. Smog concentration ❒ ❒
6. Vegetation health ❒ ❒
7. Temperature of our troposphere ❒ ❒
8. Ground level ozone concentration ❒ ❒
Other differences you can find on this diagram? ❒ ❒
You may be able to list related changes not shown on this diagram from your work in this bookletand other research, e.g.,extreme weather events, increased incidence of skin cancer-melanoma.

26
UV GlossaryBasal cell carcinoma (BCC)
Most common type of skin cancer, originating from basal cells. Usually appears asa scaly, red lump and rarely metastasizes (spreads to other organs).
Black Light
UV radiation ranging from 350 to 390 nanometers; used for special theatre effects.
Carcinogen
An agent or substance that induces cancer.
Cataract
A disease that partially or completely clouds the eye lens, impairing vision orcausing blindness. Vision can be restored by surgically removing the lens andreplacing it with an artificial one.
Chlorofluorocarbon (CFC)
Compound containing carbon, chlorine, fluorine and sometimes hydrogen. Usedas a refrigerant, solvent, aerosol propellant or element in plastic foam.
Conjunctiva
Mucous membrane that lines the inner surface of the eyelids and covers the frontpart of the eyeball.
Cornea
Transparent part of the eyeball that covers the iris and pupil. Admits light to theinterior of the eye.
Dobson Units (DU)
The standard unit for total ozone (100 DU = 1mm at standard temperature andpressure). It is an indication of thickness.
Electromagnetic Radiation (EMR)
Waves of energy primarily from the sun. Also generated by high-voltagetransmission lines, cell phones, microwave ovens, computers and televisions.
Electromagnetic Spectrum
Range of wavelengths of radiant energy measured from the shortest (gamma rays)in nanometres (nm) to the longest (radiowaves) in metres (m). Includes the visiblelight spectrum from approximately 380 nm – 720 nm.
Erythema
Redness of the skin. Mildest form of sunburn.
PROTECT YOURSELF

27
ACTIVITY INFORMATION GUIDE
GHGs
Greenhouse gases that trap heat energy in our atmosphere and include carbon dioxide,methane, dinitrogen oxide and chlorofluorocarbons (CFCs).
Ionosphere
A layer of charged particles in the upper mesosphere and thermosphere created whenatoms and molecules absorb UV energy from the sun. The ionosphere allows microwavesthrough but reflects radio waves back to earth.
Immune system
System involving some special cells that protects the body from foreign substances.Produces antibodies to fight intruders.
Malignant melanoma (Melanoma)
Malignant cancer of melanocytes. Usually has an irregular outline and patchy colouring.Rarest but most dangerous type of skin cancer that often spreads to other organs andcould be fatal (metastasizes).
Melanin
Black, dark brown or reddish pigments produced by specialized skin cells called melanocytes.
Melanocyte
Cell in the upper skin layer that produces the pigment melanin.
Metastasis
Process where cells break away from a tumour to spread to other parts of the body andstart to grow as a new tumour.
Nitrogen Oxides (NOx)
Molecules containing combinations of nitrogen and oxygen (NO, N2O, NO2, N2O5).
Ozone (O3)
Form of oxygen with three atoms in each molecule. Formed and destroyed in UV-drivenreactions.
Ozone layer
Layer of high ozone concentration in the stratosphere that absorbs most solar ultraviolet(UV) radiation, preventing UV from entering the lower atmosphere.
PANs
Peroxyacetyl nitrates, which are highly reactive compounds. Secondary pollutant productsof reactions forming smog.
Photochemical activity
Chemical changes produced by light, e.g., UV radiation in the production of smog.

28
Photosensitivity
Skin condition that makes a person particularly sensitive to ultraviolet radiation.Exposure leads to allergic reactions such as rashes or severe sunburn. Often a sideeffect of medication.
Phototherapy
Therapeutic use of light and/or ultraviolet radiation to diseases such as rickets,psoriasis, eczema and jaundice.
Planetary wind pattern
Global movement of air determined by the convection created by the sun’suneven heating of the earth and the daily earth’ s rotation. These are calledprevailing westerlies, global winds, worldwide winds or trade winds.
Polar projection
A map showing the perspective from the earth’s North or South Pole.
Precautionary Principle
The guiding rule used to put into place the most conservative measures possibleuntil the science or a process is better understood.
Quasi-biennial oscillation
Reversal of direction of stratospheric winds that circle the globe in an easterlyand westerly direction. Occurs every 20-30 months. Not fully understood, butwe know there are a number of causal factors, including atmospheric ozone.
Skin cancer
A tumour on the skin. Classified as melanoma and non-melanoma skin cancers(basal and squamous cell carcinoma).
Snow blindness
Inflammation of the cornea leading to temporary blindness. Caused byexposure of the eyes to ultraviolet B radiation reflections from snow or ice.
Solar noon
The time of day when the sun is directly overhead or as high as possible for yourlatitude.
Squamous cell carcinoma (SCC)
Scaly or plate-like malignant tumour of the skin that sometimes spreads(metastasizes) to other organs. Second most common form of skin cancer.
Stratosphere
The atmospheric layer between the tropopause and the stratopause (10-50 km).
PROTECT YOURSELF

29
ACTIVITY INFORMATION GUIDE
Stratopause
The layer separating the upper stratosphere from the mesosphere, at an altitude of about 50 km.
STP
Standard pressure and temperature conditions measured at sea level.
Sun protection factor (SPF)
A measure of the amount of UVR protection provided by a sunscreen product. Measuresthe ability of a sunscreen product to prevent sunburn on the skin.
Troposphere
The lowest layer of the atmosphere, between the earth’s surface and the tropopause (0-10 km).
Tropopause
The atmospheric layer separating the troposphere and stratosphere.
Ultraviolet (UV) radiation
Part of the solar emissions that include light, heat and UV radiation. UV region covers thewavelength range of 100-400 nm and is divided into three bands: UVA, UVB, and UVC. All three bands are classified as probable human carcinogens.
UVA radiation
Long wavelength UVA covers a range of 315-400 nm, and makes up approximately 90 percent of UV radiation reaching the earth’s surface. Not significantly filtered by theatmosphere.
UVB radiation
Medium wavelength UVB covers a range of 280-315 nm. Approximately 90 per cent of solarUVB radiation is absorbed by the ozone layer.
UVC radiation
Short wavelength UVC covers a range of 100-280 nm. All solar UVC radiation is absorbed bythe ozone layer.
UV Index (UVI)
Describes the level of solar UV radiation at the earth’s surface and provides a useful way toalert people about the need to adopt protective measures.
Vitamin D
Vitamin that is essential for normal bone and tooth structure. Found in cod-liver oil, egg yolkand milk. Bodily synthesis is activated by ultraviolet B radiation on the skin.
VOCs
Volatile organic carbons – compounds that are reactants in the making of smog. May behydrocarbons, like methane.

30
UV and Further ResearchSome ideas for further research:
• establish a protocol for rating the severity of sunburn• determine the UV sensitivity of specific plants and animals • quantify the relationship between UV penetration and freshwater algae• quantify this effect on the rest of the freshwater ecosystem • apply this research to stream bank or riparian restoration programs • quantify the relationship between UV penetration of canopies of shade trees • develop “breathing” clothing materials with better UV filtration • take hourly readings of nitrogen oxides/hydrocarbons/ozone at ground level in
high-traffic areas to quantify the direct relationship and timing of the formation ofground-level ozone
• and……?
PROTECT YOURSELF

SPECIAL ACTIVITIES
You and the BrewerThe Meteorological Service of Canada (MSC) forecasts the UV Index (UVI) levels for each day of the year for 48 locations across the country. These are posted atwww.cmc.ec.gc.ca/cmc/data/fpcn48.html by the Canadian Meteorological Centre in Montreal.
From April to October each year, the regional offices of MSC issue precise UV Index forecasts that take into account regional characteristics. These forecasts are reported in the media (radio, television and newspaper) and on the Meteorological Service of Canada website at www.weatheroffice.com
Note: Brewer spectrophotometer is the name of the UV measuring instrument. (12 Brewers in Canada)
Purpose
To compare UV values from different locations.
Method/Observations
Use the chart below to record two weeks of UV Index listings from: the MSC Web site, your ownreading, and your local media. From the website, you will obtain the max UVI value for the closestBrewer station to you. The local media will give you the UV Index forecast for today. Use the meterat solar noon to obtain your maximum UV Index value.
Discussion
Using your data, plot a graph of the daily UV radiation levels.
Optional
Continue to record and post a two-week period so that the class can produce cumulative graphs ofUV readings over several months.
a) Which month(s) of the school year have the highest UV readings?b) How does this relate to the reported seasonal ozone layer thickness?
Conclusion
What have you learned from your comparison?
DAY 1 2 3 4 5 6 7 8 9 10 11 12 13 14
UV Web
UV meter
UV media

What’s in our Atmospheric Soup?1. Write the chemical and structural diagrams for these natural components of our
atmosphere: molecular oxygen, nitrogen gas and carbon dioxide.
A. O2 | O = O B. C.
2. Write the chemical formulae for these 4 major human-made additives: methane,ozone, nitrous oxide, chlorofluorocarbons. Does UV react with these additives?
A. B. C. D. CFC l3
BONUS: Show the structural formulae for these 4 molecules.
3. Draw two pie charts: One to illustrate the quantities of natural components of theatmosphere and another to show the quantities of human-made additives. Workclockwise and start with the largest per cent at 12 o’clock.
% of natural components % of human-made additives
4. What are the health effects of the four leading human-made additives?
5. What actions are being taken to reduce these levels:
a) Locally? b) Provincially? c) Nationally? d) Internationally?
6. What actions can you personally take to reduce these levels?
PROTECT YOURSELF
Additive % Source Effect
1.
2.
3.
4.
SPECIAL ACTIVITIES
Going South for a Tan?The intensity of solar radiation depends partly on the latitude of a given place and time of year.
We know the sun is directly overhead at the:
• Equator (0°) on/about March 21 and September 21 (spring and autumn equinoxes);• Tropic of Cancer (23.5° N) on/about June 21 (summer solstice);• Tropic of Capricorn (23.5° S) on/about December 21 (winter solstice).
The sun therefore moves through a latitude range of 47° every six months (182.5 days) or about onedegree of latitude every four days. Knowing this, we can calculate when the sun will be directlyoverhead in different latitudes.
For example, the sun will be directly overhead at 10° S latitude on:
23.5° S - 10° S = 13.5° S13.5° S x 4 days/degree = 54 days after December 21 (when the sun was overhead at 23.5° S)Adding 54 days to December 21, the date is February 13.
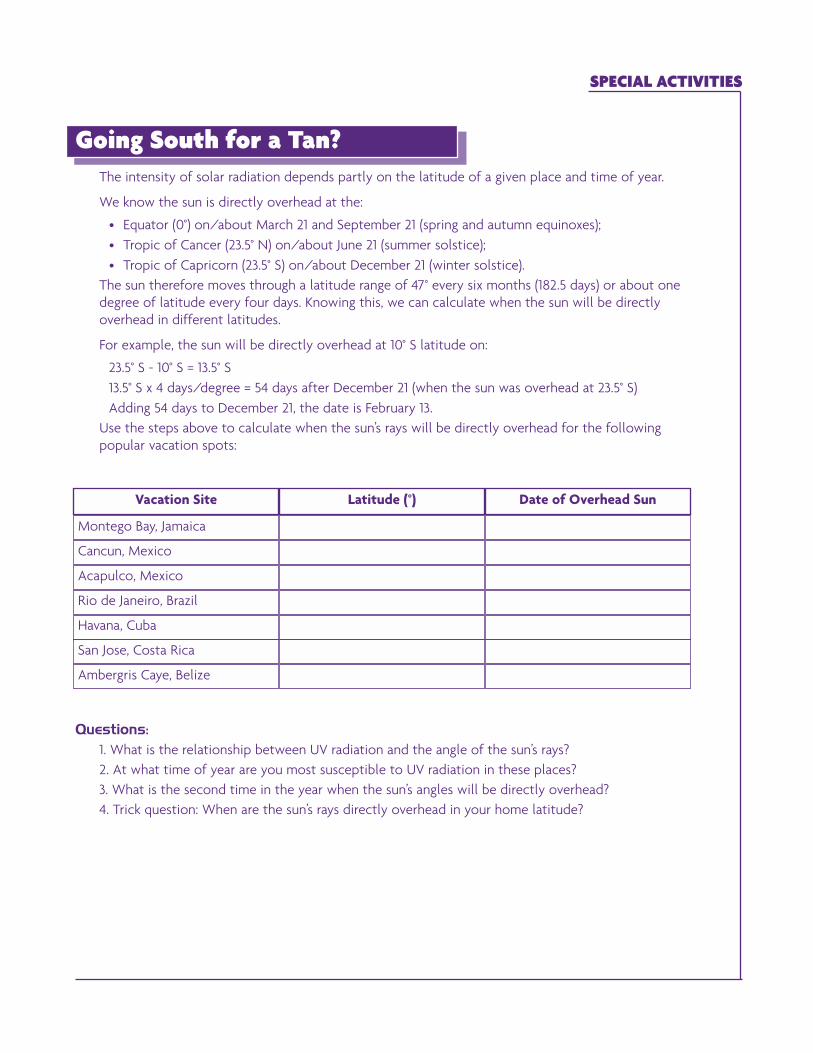
Use the steps above to calculate when the sun’s rays will be directly overhead for the followingpopular vacation spots:
Questions:
1. What is the relationship between UV radiation and the angle of the sun’s rays?2. At what time of year are you most susceptible to UV radiation in these places?3. What is the second time in the year when the sun’s angles will be directly overhead?4. Trick question: When are the sun’s rays directly overhead in your home latitude?
Vacation Site Latitude (°) Date of Overhead Sun
Montego Bay, Jamaica
Cancun, Mexico
Acapulco, Mexico
Rio de Janeiro, Brazil
Havana, Cuba
San Jose, Costa Rica
Ambergris Caye, Belize

Protection makes a DifferenceUVB damage is cumulative. However, diligent use of sunscreens during the first 18 yearsof life could reduce the lifetime incidence of non-melanoma skin cancer by 78%. Studiesalso show that long-term unprotected exposure to UVB increases the rate of aging of theskin, similar to the effects of heavy smoking, i.e., increased keratinization (the leatherylook), and increased wrinkles.
Your outside activities, the amount of clothing and sunscreen you have on, all determinethe amount of UVB you are exposed to in your area. Knowing this you can take measuresto protect yourself.
1. List four of your school ’s outdoor programs / events in the chart below.
2. Calculate the monthly averages from the UV values obtained in the “ You and theBrewer” investigation.
3. Plot these UV averages on the climograph for your city (closest) and compare the trendto those for temperature and precipitation.
4. Describe and explain any relationship found among these three averages. See the solarradiation and UV radiation maps for Canada on pages 4 and 5
5. Use this information for planning to host a school outdoor sporting event. Whatwould be the cost of providing sunscreen for your team? For all teams invited? See theprotection priority list.
Note: To use sunscreen as a factor you must standardize. e.g., applications, number ofgames.
Optional Investigations:
6. SPF 15 is about 96% effective. How much more does a sunscreen with a SPF of 30protect you? Is it cost effective?
7. Melanoma is a skin cancer that may be caused by cumulative UVB exposure. It isprojected that 1 in 5 Canadians will develop melanoma.
a) List the factors that might be taken into account to determine the risk of a baseballplayer developing melanoma. (Minimum of eight factors)
b) Calculate the difference in exposure to sunlight for a person who plays one seasonof soccer: i) with no sunscreen ii) with SPF 15 iii) with SPF 45.
PROTECT YOURSELF
School Program/Event Month(s) Usually Held
1.
2.
3.
4.

ACTIVITY INFORMATION GUIDE
WEB SITESListed below are a few Web sites that contain information about the UV Index, the ozone layer, ozonedepletion and protection from the sun. These sites also have hot links that students can explore. Manymore sites can be found through search engines.
WEATHERCanadian Weather www.weatheroffice.ec.gc.caSky Watchers www.weatheroffice.ec.gc.ca/skywatchers/index_e.html
THE UV INDEXMeteorological Service of Canada www.msc-smc.ec.gc.ca/uvindexUnited States Climate
Prediction Center www.cpc.ncep.noaa.gov/products/stratosphere/uv_indexWorld Health Organization www.who.int/peh-uvU.S. Environment www.epa.gov/sunwise
Protection Agency
THE OZONE LAYERExperimental Studies Division of http://exp-studies.tor.ec.gc.ca
Environment CanadaClimate Prediction Center, www.cpc.ncep.noaa.gov/products/stratosphere/sbuv2to/ozone_hole.htmlOzone Tour, USAThe Ozone Hole Tour www.atm.ch.cam.ac.uk/tour/index.htmlBritish Antarctic Survey www.antarctica.ac.uk/met/jds/ozone
HEALTH SITESCanadian Dermatology Association www.dermatologie.ca/english/index.htmlCanadian Dermatology Association www.dermatologie.ca/english/public-patients/spotcheck_e.html
Spot CheckHealth Canada www.hc-sc.gc.ca/english/feature/summer/air_sun/links.htmlThe Anti-Cancer Council of www.sunsmart.com.au
Victoria (Australia)
EDUCATION SITESACER – Association for Canadian www.acer-acre.org
Educational Resources
RESOURCES FROM ENVIRONMENT CANADA produced in collaboration with Health Canada
To obtain the information below, please send an email to [email protected]
• UV Index Posters 1998, 1999, 2000, 2001 and 2002• UV and You brochure: Living with Ultraviolet• UV Index, Weather, and You: Activity and Information Guide• Arctic Ozone: The sensitivity of the Ozone layer to Chemical Depletion and Climate Change• Ozone Depletion and Climate Change: Understanding the Linkages
UV and U: 20 Questions
1. What does SPF mean?
2. Does UV radiation have long or short waves?
3. What does GHG mean?
4. Define melanoma.
5. How high do ozone sondes fly?
6. Define the UV Index.
7. What does CFC mean?
8. How many oxygen atoms are there in ozone?
9. Is ozone toxic?
10. How many Canadian Brewer stations are there in 2002?
11. Where is the ozone hole in our atmosphere in winter?
12. Name one volatile hydrocarbon.
13. What ratio of Canadians will likely develop melanoma?
14. Name one secondary pollutant from automobiles.
15. How high does the UV Index unit go?
16. How does high UV exposure damage a food chain?
17. When was the Montreal Protocol signed?
18. What is the percentage of Canadian green house gas emissions
that are attributed to Individual/personal actions?
19. How many tonnes of GHG do Canadians produce in a year?
How does this compare to the global average?
20. Is damage from exposure to UV radiation cumulative?