activity patterns of marbled murrelets in old-growth...
TRANSCRIPT

The Condor 95:X31-848 0 The Cooper Ornithological Society 1993
ACTIVITY PATTERNS OF MARBLED MURRELETS IN OLD-GROWTH FOREST IN THE
QUEEN CHARLOTTE ISLANDS, BRITISH COLUMBIA’
MICHAEL S. RODWAY~ Canadian Wildlcfe Service, P.O. Box 340, Delta, British Columbia V4K 3Y3, Canada
HEIDI M. REGEHR Department of Biology, Memorial University of Newfoundland,
St. John’s, Newfoundland AlB 3X9, Canada
JEAN-PIERRE L. SAVARD~ Canadian Wildlife Service, P.O. Box 340, Delta, British Columbia V4K 3Y3, Canada
Abstract. Activity patterns of Marbled Murrelets (Brachyrumphus marmoratus) in old- growth forest were compared at two sites in the Queen Charlotte Islands, British Columbia. Number of detections peaked in late July at both sites. More activity was recorded on cloudy mornings than on clear mornings and the duration of activity was greater on cloudy days than on clear days. Number of detections, number of calls and duration of the activity period per survey were highly variable and were correlated on a coarse scale (seasonally) but not always on a fine scale (weekly). Activity levels at the two stations were correlated over the entire season but not on a monthly or weekly basis. Detections were always more numerous in the morning than in the evening. Most detections were auditory only, but birds were seen in 20 and 26% ofdetections at the two sites. Approximately half ofvisual detections were of silent birds. Most birds sighted were either singles or in pairs and the majority of single birds were silent and tended to fly at lower altitudes than grouped birds. Knowledge of the behavior of Marbled Murrelets at inland locations is essential for the design of survey methodology and interpretation of survey results.
Key words: Marbled Murrelet; Brachyramphus marmoratus; old-growth forest; activity patterns; British Columbia.
INTRODUCTION
Concern for Marbled Murrelets (Bruchyrumphus marmoratus) has heightened in recent years due to mounting evidence that the species depends on unique characteristics of old-growth forest for nesting in the southern portion of their range in North America (Binford et al. 1975, Sealy and Carter 1984, Marshall 1988, Quinlan and Hughes 1990, Rodway 1990, Singer et al. 199 1). The continuing harvest of old-growth forest habitat has prompted intensive efforts to identify forest stands used by Marbled Mm-relets, especially in California, Oregon and Washington (Carter and Erickson 1988; Paton and Ralph 1988; Nelson 1989; Varoujean et al. 1989; Paton and Ralph
’ Received 24 February 1993. Accepted 11 May 1993. 2 Present address: Department of Biology, Memorial
University of Newfoundland, St. John’s, Newfound- land AlB-3X9, Canada.
3 Present address: Canadian Wildlife Service. 1141 Route De L’Eglise, P.O. Box 10100, Ste-Foy, Quebec GlV 4H5, Canada.
1990; Hamer and Cummins 1990, 1991; Paton et al. 1992) and more recently in British Colum- bia (Eisenhawer and Reimchen 1990, Rodway et al. 199 1, Manley et al. 1992). Marbled Murre- let nests are difficult to find, and survey meth- odology has depended on visual and auditory detections (Paton et al. 1988) of birds flying to and from inland locations. Numbers of detec- tions are used as coarse indicators of habitat use, but interpretations are limited because of the variability in the number of detections at par- ticular sites (Paton et al. 1988, 1990; Nelson 1989; Ralph et al. 1989) and because the behavior of breeding birds in the vicinity of nests is poorly known (Singer et al. 1991). To interpret counts of detections made in different areas and at dif- ferent times of the breeding season, it is impor- tant to know what factors affect the variability of detection counts and how activity levels vary daily, seasonally and geographically. As a detec- tion is broadly defined as “the sighting and/or hearing of a single bird or a flock of birds acting in a similar manner” (Paton et al. 1990) changes
F311

832 M. S. RODWAY, H. M. REGEHR AND J-P. L. SAVARD
in flock size or behavior will affect the interpre- tation of numbers of detections. This becomes important when attempting to compare Marbled Murrelet activity levels among sites and set pri- orities for habitat protection.
This paper is a portion of a larger study of Marbled Murrelets in the Queen Charlotte Is- lands, British Columbia (Rodway et al. 1991). Our objectives were to: (1) monitor seasonal changes in Marbled Murrelet activity at two in- land sites in old-growth forest habitat where breeding was suspected, (2) determine the effects of weather on inland activity, (3) determine whether numbers of detections per survey, num- bers of calls per survey, and duration of activity per survey provide similar measures of activity and show similar trends, (3) compare the vari- ability of those measures between stations and at different temporal scales from daily to sea- sonally, (5) monitor changes in hock size and behavior over the breeding season, (6) compare evening and morning activity levels, and (7) con- sider the implications that observed activity pat- terns have for survey methodology and inter- pretation of survey results. This study extends our knowledge of the inland behavior of Marbled Murrelets in a poorly studied part of their range (Rodway 1990).
STUDY SITES
The two study sites were located in old-growth (325-t year-old) forest in the Lagins Creek (53”14’14”N, 132”22’33”W) and Phantom Creek (53”20’44”N, 132’20’49”W) valleys on Graham Island in the Queen Charlotte Islands, British Columbia. Stations were 3.6 and 4.8 km inland at elevations of 90 and 250 m respectively. Forest habitat was a Western Redcedar (Thuja plicata)l Sitka Spruce (Picea sitchensis)-foamflower (Ti- arella unijidiata) site association within the Wet Hypermaritime Coastal Western Hemlock bio- geoclimatic subzone (Banner et al. 1990). Dom- inant tree species in the vicinity of the stations were Western Hemlock (7’sugu heterophyla) and Sitka Spruce. The Lagins Creek survey station was located in the bottom of an east-facing valley in the middle of an alluvial flat about 1 km wide. The station was under an opening in the canopy providing clear visibility of about 20% of the sky. About 80% of the sky was visible at the Phantom Creek station, situated on a road running along the side of a ‘V-shaped’ valley and overlooking the canopy in the valley bottom. The station was
located near the divide between west and east flowing drainage systems. Access to the ocean was to the west. The Lagins Creek valley was encircled by mountains and was probably not used as a fly-way to other areas, whereas the Phantom Creek valley provided access to inte- rior areas of Graham Island and may have been used as a corridor by birds travelling further in- land to other sites where Marbled Murrelet ac- tivity had been recorded (Rodway et al. 199 1).
METHODS
Intensive inventory methods were used at the two fixed stations (Paton et al. 1988, 1990). Morning surveys were conducted in 1990 be- tween 7 May and 23 August at Phantom Creek (n = 49) and between 22 May and 28 July at Lagins Creek (n = 33). Surveys were done in sets of four to six consecutive days repeated at one to two week intervals, except for the week of 2 1 August when only two surveys were performed (Table 1). Concurrent morning surveys were con- ducted at the two stations during the weeks of 22 May, 29 May, 12 June, 11 July and 24 July (n = 24). Observations were initially conducted from 45 min before to 75 min after sunrise, but times were changed to 75 min before to 45 min after sunrise on 15 May when it became apparent that Marbled Murrelets were active earlier in the Queen Charlotte Islands than further south, probably due to longer twilight periods. If murre- lets were still active at the end of the standard survey period, observations were continued until there was a 15 min interval since the last detec- tion. Evening surveys followed by morning sur- veys were conducted on 26 nights (19 at Lagins Creek and 7 at Phantom Creek) between 22 May and 27 July from 45 min before to 75 min after sunset. We used sunrise and sunset times for Sandspit, provided by Atmospheric Environ- ment Service, Environment Canada. All times are Pacific Standard Time.
We distinguished primary “keer” calls from other calls and attempted to count all keer calls heard for each detection. When activity was in- tense, making counting difficult, numbers of keer calls > 10 were recorded as “multiple.” To an- alyze total keer calls, we replaced “multiple” with the mean number of calls > 10 that were actually counted. The duration of the activity period was defined as the time between the first and the last detection recorded during a survey.
We retained the same observers as long as pos-

MARBLED MURRELET ACTIVITY 833
sible at each station in order to maintain ob- server consistency. The availability of personnel required that we change observers twice over the season at each station. We assessed inter-ob- server reliability by having replacement person- nel conduct concurrent, independent surveys for two days at the station with the person being replaced. This was not possible for one change in August at Phantom Creek.
Coefficients of variation (CV = 100 x standard deviation/mean) were calculated to assess and compare variability in number of detections, number of calls and duration of activity period per survey. Daily and seasonal activity patterns at each site were compared. Analysis of covari- ante (ANCOVA) was used to separate effects of weather and date. Weather conditions were di- vided into two categories: fog or ~80% cloud (cloudy) and ~80% cloud (clear). These catego- ries were used to distinguish overcast, low-light conditions from brighter, high-light conditions. Only birds seen were used to analyze behavior and group size. Tolerance for Type I error was set at 5% for all tests. Residuals were checked for acceptability.
RESULTS
INTER-OBSERVER RELIABILITY
Numbers of detections recorded on the same day at the same site by paired observers were closely correlated (r = 0.97, P = 0.002, n = 6) as were estimates of the duration of activity (Y = 0.96, P = 0.003). Numbers of keer calls estimated by different observers showed more variation, but were still highly correlated (1. = 0.88, P = 0.021). Differences between observers were inconsistent and we concluded that there was no bias through time due to change of observers.
There were significant differences between ob- servers in the proportion of visual detections re- corded. One observer stationed at Lagins Creek from 22 May to 20 June recorded very few visual detections and was found to see a consistently lower proportion of birds than the observer re- placing her (x2, = 20.96, P < O.OOOi). This did not affect the total number of detections she re- corded which were similar or higher than those counted by her replacement, but did compromise the analysis of visual detections at Lagins Creek in May and June (see below). The bias in pro- portion of visual detections recorded was con- fined to the one observer as other observers re-
corded proportions similar to the person that replaced her (x2, = 0.53, P = 0.465).
EFFECTS OF WEATHER AND DATE ON ACTIVITY LEVELS
Cloudy weather tended to be more frequent at the Phantom Creek station (62% of survey days) than at Lagins Creek (55% of survey days), but overall weather patterns at the two stations were significantly correlated (Y = 0.70, P < 0.001). The highest proportion of cloudy days occurred in May at Phantom Creek and in June at Lagins Creek. Clear days were more frequent in July at both stations (Table 1). There were no significant differences among months in the proportions of cloudy and clear weather at either station (Phan- tom Creek: xzj = 0.87, P = 0.833; Lagins Creek: x*Z = 3.45, P = 0.178).
Number of detections. Numbers of detections per survey increased from May to July and peaked during the week of 24-28 July at both Phantom Creek and Lagins Creek (Tables 1 and 2, Figs. 1 and 2). At Phantom Creek, numbers of detec- tions increased from May to June (r* = 0.59, P < 0.0001, n = 32) and were similar in June and July (9 = 0.19, P = 0.060, n = 19). At Lagins Creek, numbers of detections were similar in May and June (r* = 0.01, P = 0.67, n = 20), and increased from June to July (r2 = 0.50, P < 0.000 1, y1= 23). The number of detections were slightly more numerous at Lagins Creek than at Phantom Creek in May but not in June or July when they were higher at Phantom Creek (Table 1, Figs. 1 and 2). Differences between the two stations were not significant, even in July when the mean difference was 22.1 detections (paired t-test, t, = 1.95, P = 0.087). Activity decreased abruptly during the second week of August at Phantom Creek (Tables 1 and 2, Fig. 1).
The mean number ofdetections per survey was higher on cloudy days than clear days at Phan- tom Creek (58.3 ? 3.9 vs. 40.8 + 5.0) and Lagins Creek (55.6 f 3.5 vs. 46.1 ? 3.8) though the effect of weather was significant only at Phantom Creek (Table 2).
Number of calls. The mean number of calls > 10 that were actually counted per detection were 25.6 ? 0.6 (n = 553) at Phantom Creek and 24.0 f 0.9 (n = 201) at Lagins Creek. To analyze total keer calls per survey, a value of 25 was used to replace all records of “multiple” calls. Numbers of calls per detection were not affected by weather and were similar in May, June and

834 M. S. RODWAY, H. M. REGEHR AND J-P. L. SAVARD
TABLE 1. Marbled Mm-relet activity during morning surveys at fixed stations at Phantom Creek and Lagins Creek in 1990.
Date Cloud
cover (%)
Phantom Creek
No. of No. of detections keer calls
Duration (min)
Lagins Creek
Cloud No. of No. of Duration cover (%) detections keer calls (min)
07 May 08 May 09 May 10 May 11 May 12 May
14 May 15 May 16 May 17 May 18 May 19 May
21 May 22 May 23 May 24 May 25 May 26 May
29 May 30 May 31 May 01 Jun 02 Jun
12 Jun 13 Jun 14 Jun 15 Jun 16 Jun
19 Jun 20 Jun 21 Jun 22 Jun 23 Jun
21 Jun 28 Jun 29 Jun 30 Jun 01 Jul
11 Jul 12 Jul 13 Jul 14 Jul
18 Jul 19 Jul 20 Jul 21 Jul
24 Jul 25 Jul 26 Jul 27 Jul 28 Jul
90 100 100 100 90
100
23 23 24
:: 36
318 37 393 51 386 63 521 51 489 60 587 66
60 17 282 42 100 21 321 64 100 41 648 120 60 17 325 37
100 27 463 63 90 21 260 54
100 33 272 82 0 35 322 63
100 24 191 65 98 19 209 53 10 19 264 71 50 16 130 44
100 32 537 83 25 40 159 80 0 29 516 68 0 21 342 43
100 46 595 99
100 0 0
100 100
100 0
100 100 100
100 100 100 40
40 40
100 1 0
78 1,430 150 42 559 68 35 538 68 82 975 146 48 864 123
92 963 154 56 508 50 48 550 67 78 1,219 113 68 531 86
57 882 66 78 1,644 85
106 1,918 131 87 1,420 103
130 2,064 100 100 1,740 99 155 2,429 150 42 125 101 46 626 61
0 0
100 10
100
100 100
0 0
100
100 0 0
100 100
100 100 100 100
100 100 50
100
0 0
:
0 0
100 50 0
21 163 43 36 350 92 56 953 72 23 355 52 38 542 56
42 710 110 34 711 66 48 678 72 36 697 47 64 946 99
31 515 73 39 515 47 15 255 35 25 380 84 26 340 75
49 816 89 99 1,946 127 47 440 84 29 235 96 28 351 70
56 711 72 56 534 92 45 753 76 57 987 70
63 63 19 74
56 61 62 63
88 72 88 59 81
1,308 908
1,347 1,289
1,727 1,466 1,813 1,242 1,798
84 70 91 84 90

MARBLED MURRELET ACTIVITY 835
TABLE 1. Continued.
Date Cloud
COYa (%)
Phantom Creek
No. of No. of detections keer calls
Duratmn Cloud (min) COYer (%I
Lagins Creek
No. of No. of detectlons keer calls
Duration lminl
07 Aug 100 28 256 98 08 Aug 95 19 44 61 09 Aug 100 4 30 10 Aug 0 8
:: 33
11 Aug 0 6 25 21
21 Aug 70 14 124 22 23 Aug 100 6 17 15
July at each station (ANCOVA, P > 0.05 for all comparisons). They dropped sharply from 24 July to 23 August at Phantom Creek (r2 = 0.74, P = 0.001, 12 = 12).
Numbers of calls showed similar seasonal pat- terns as numbers of detections, increasing from May to July, reaching a maximum during the week of 24-28 July at Phantom Creek and Lagins Creek, and decreasing abruptly in the second week of August at Phantom Creek (Tables 1 and 2, Figs. 1 and 2). We were unable to detect an effect of weather on numbers of calls (Table 2).
Duration of activity. The duration of the Mar- bled Murrelet morning activity period ranged be- tween 15 and 154 min at Phantom Creek and between 35 and 127 min at Lagins Creek. There was an increase in the duration of activity from May to July at Phantom Creek but not at Lagins Creek (Tables 1 and 2, Figs. 1 and 2). Over the entire season, duration was significantly longer at Phantom Creek than at Lagins Creek (paired t-test, tz3 = 2.50, P = 0.020). Duration was sim- ilar in both areas in May (t, = -0.64, P = 0.54) and July (tg = 1.91, P = 0.093) but differed in
TABLE 2. Type I error estimates for rejection of null hypotheses of no change in Marbled Murrelet activity due to date and weather. Dependent variables were number of detections, number of calls and duration of activity period per survey at Phantom Creek and Lagins Creek in 1990. Date was treated as a continuous variable and weather was dichotomous (see Methods). Null hypotheses were tested using ANCOVA. An interaction term, Weather. Date, was included in initial models. If the interaction was not significant, it was dropped from the model to test main effects of weather and date. Values for rz are from initial models and have 3 degrees of freedom. Where indicated, measurements have been log transformed to meet assumptions of homoscedasticity and normality.
Weather Date Weather’Date
6 df F P df F P df F P
Phantom Creek-morning surveys 7 May to 26 July (n = 40) Log # of detections 0.82 1 10.29 0.003 1 148.87 0.000 1 2.29 0.139 Log # of calls 0.67 1 4.04 0.052 1 69.05 0.000 1 1.28 0.265 Log duration 0.50 1 10.27 0.003 1 29.61 0.000 1 0.00 0.991
Phantom Creek-morning surveys 24 July to 23 Aug (n = 12) Log # of detections 0.70 1 0.03 0.879 1 18.75 0.002 1 0.20 0.665 Log # of calls 0.72 1 0.41 0.538 1 18.28 0.002 1 0.39 0.548 Log duration 0.88 1 3.41 0.098 1 52.66 0.000 1 1.82 0.214
Lagins Creek-morning surveys 22 May to 28 July (n = 33) Log # of detections 0.44 1 0.68 0.416 1 21.67 0.000 1 1.10 0.303 Log # of calls 0.44 1 0.18 0.678 1 19.06 0.000 1 2.68 0.112 Log duration 0.34 1 14.33 0.001 1 1.81 0.189 1 0.40 0.530
Lagins Creek-evening surveys 22 May to 27 July (n = 19) Log # of detections 0.71 1 0.29 0.601 1 21.22 0.000 1 0.91 0.355 Number of calls 0.89 1 1.91 0.190 1 41.88 0.000 1 7.32 0.018 Duration 0.42 1 0.63 0.439 1 10.95 0.004 1 0.00 0.984

836 M. S. RODWAY, H. M. REGEHR AND J-P. L. SAVARD
2000 I I I I I I I I I I
g 1500 -
"0 I I
j 1000 -
2 1
2 I I
3 500 - I
I I
0 I I I i I I I I f 1
I I I I I I I I I I
FIGURE 1. Weekly mean ( f SE) numbers of Marbled Mm-relet detections, keer calls and duration of activity period per survey at Phantom Creek in 1990.


838 M. S. RODWAY, H. M. REGEHR AND J-P. L. SAVARD
n Cloudy 1 0 Clear
i
Minutes before and after official sunrise
FIGURE 3. Timing of Marbled Mm-relet detections in relation to sunrise and weather from May through July 1990 at Phantom Creek and Lagins Creek.
June, being longer at Phantom Creek than at Lagins Creek (t, = 2.93, P = 0.026). As with numbers of detections and calls, the duration of activity dropped considerably in August (Tables 1 and 2, Fig. 1).
Activity started later and lasted longer in cloudy weather (Fig. 3). At Lagins Creek, 80% of detec- tions occurred within 47 to 0.5 min before sun- rise on clear days (median = 25 min before sun- rise), and 35 min before to 30 min after sunrise
on cloudy days (median = 5 min before sunrise). The range of times varied from month to month, but differences in mean detection times relative to sunrise on clear and cloudy days existed during all months at both stations (t-test: P < 0.0001 for all comparisons). The mean duration of ac- tivity was longer on cloudy than on clear days at Phantom Creek (95.7 f 4.6 vs. 61.1 + 5.9 min) and Lagins Creek (82.5 & 3.8 vs. 64.7 +- 4.1 min; Table 2), though at Phantom Creek the av-

MARBLED MURRELET ACTIVITY 839
TABLE 3. Pearson correlation matrix for measures of Marbled Murrelet morning activity over the entire season at Phantom Creek and Lagins Creek in 1990 (n = 49 at Phantom Creek, 33 at Lagins Creek and 24 for comparisons between Phantom Creek and Lagins Creek).
Detectmns
Phantom Creek
Calls Duratmn Detections
Lagms Creek
Calls Duration
Phantom Creek Detections Calls Duration
Lagins Creek
Detections Calls Duration *P < 0.05.
**P < 0.01. *** P < 0.001
1.000 0.954*** 1.000 0.787*** 0.740*** 1.000
0.586** 0.565** 0.153 1 .ooo 0.578** 0.547** 0.206 0.942*** 1.000 0.336 0.335 0.407* 0.444* 0.360* 1 .ooo
erage difference (3 5 min) was nearly twice as long as at Lagins Creek (18 min).
CORRELATIONS BETWEEN MEASURES OF ACTIVITY
Over the season, and at both stations, number of detections per survey were highly correlated with number of keer calls per survey (Table 3). Correlation between number of detections and duration of activity and between numbers of calls and duration of activity were weaker, especially at Lagins Creek, though still significant at both stations (Table 3). At Phantom Creek, correla- tions between these variables were also signifi- cant within each month (P < 0.05 for all pairwise comparisons). At Lagins Creek, correlations be- tween detections and calls were significant within each month (P < O.OOS), and correlations be- tween detections and duration and calls and du- ration were significant only in June (P < 0.05). On a weekly basis, correlations between detec- tions and calls were significant in three of nine weeks at Phantom Creek and in four of seven weeks at Lagins Creek. Significant correlations were found between numbers of detections and duration in six of nine weeks at Phantom Creek and in zero of seven weeks at Lagins Creek, and between number of calls and duration in three of nine weeks at Phantom Creek and in zero of seven weeks at Lagins Creek.
CORRELATIONS IN ACTIVITY LEVELS BETWEEN STATIONS
The number of detections recorded on concur- rent surveys at Phantom Creek and Lagins Creek were significantly correlated over the entire sea- son (Table 3). The number of calls and the du-
ration of activity were also correlated between the two stations over the entire season (Table 3). On a monthly basis, and at smaller time scales, there was a lack of correlation between the two stations for all measures of activity (Table 4). On a daily and weekly scale, activity often increased at one station while decreasing at the other (Table 1, Figs. 1 and 2).
DAILY VARIABILITY
At both Phantom Creek and Lagins Creek, vari- ability was highest for number of calls (CV * SE = 88.3 + 14.3 and 59.5 +- 9.6%, respectively) and number of detections (CV = 75.6 f 14.8 and 43.2 I-t 6.2%) and lowest for duration of activity (CV = 46.6 f 5.6 and 26.7 + 3.5%). Variance was higher at Phantom Creek than at Lagins Creek for numbers of detections (F48,32 = 2.29, P = 0.008) and duration (F48,32 = 3.08, P = 0.001) and similar for numbers of calls (Fa8,)* = 1.25, P = 0.255). The variability of these mea- sures changed during the summer and showed different patterns at the two stations. At Phan- tom Creek, variance was lowest in May for all measures, increased from May to June for de- tections (F,,,, = 8.39, P < O.OOl), calls (F,,,,, = 4.35, P = 0.003) and duration (F,,,, = 4.86, P = O.OOl), increased from June to July for calls (F,,,, = 3.87, P = 0.023) and was similar in June and July for detections (F,,,, = 2.67, P = 0.071) and duration (F,,,, = 2.35, P = 0.107). Variances of all measures were low in August, similar to those in May, but the low variances in August were a function of smaller means in that month and coefficients of variation were much higher in August (72.2 * 27.6, 113.4 ? 57.3 and 71.1

840 M. S. RODWAY, H. M. REGEHR AND J-P. L. SAVARD
TABLE 4. Pearson correlation matrix for measures of Marbled Murrelet morning activity on a monthly basis at Phantom Creek and Lagins Creek in 1990.
Phantom Creek
Calls Duration Detections
Lagins Creek
Calls Duration
May (n = 2 1 at Phantom Creek, 8 at Lagins Creek and 8 for comparisons between Phantom Creek and Lagins Creek)
Phantom Creek Detections 1.000 Calls 0.802*** 1.000 Duration 0.721*** 0.544* 1 .ooo
Lagins Creek Detections -0.236 0.023 -0.210 1.000 Calls -0.059 0.310 0.024 0.877** 1.000 Duration 0.116 0.233 0.442 0.510 0.420 1.000
June (n = 11 at Phantom Creek, 12 at Lagins Creek and 7 for comparisons between Phantom Creek and Lagins Creek)
Phantom Creek Detections 1.000 Calls 0.817** 1.000 Duration 0.837** 0.855** 1 .ooo
Lagins Creek Detections -0.140 -0.217 -0.115 1 .ooo Calls -0.187 -0.208 -0.195 0.949*** 1 .ooo Duration 0.580 0.447 0.695 0.735** 0.623* 1.000
July (n = 10 at Phantom Creek, 13 at Lagins Creek and 9 for comparisons between Phantom Creek and Lagins Creek)
Phantom Creek Detections 1.000 Calls 0.930*** 1.000 Duration 0.783** 0.757* 1 .ooo
Lagins Creek Detections 0.455 0.293 0.089 1 .ooo Calls 0.347 0.163 0.171 0.887*** 1 .ooo Duration 0.085 0.089 0.056 0.201 0.198 1.000
August (n = 7 at Phantom Creek) Phantom Creek
Detections 1.000 Calls 0.863* 1.000 Duration 0.899** 0.772* 1.000
*P < 0.05. **p < 0.01.
***p < 0.001.
+- 26.9% for detections, calls and duration, re- spectively) than in May (29.0 ? 4.8, 41.7 & 7.5 and 29.9 f 5.0% for the same measures). At Lagins Creek, numbers of detections were more variable in June than in both May (F,,,, = 3.67, P = 0.048) and July (F ,,,, z = 2.75, P = 0.048). Variance in number of calls was similar from May to June (F,,,, = 3.38, P = 0.058) and from June to July (F,,,,, = 1.24, P = 0.357). Duration was less variable in July than in June (F,,,,, = 4.23, P = 0.010) and May (F,,Iz = 3.09, P = 0.042).
COMPARISON OF MORNING AND EVENING DETECTIONS
The number of detections recorded during eve- ning surveys was always less than the number recorded the following morning (X = 18.9 * 3.8 vs. 59.7 +- 4.2, n = 19 at Lagins Creek and K = 6.1 f 2.1 vs. 67.0 -I- 8.5, n = 7 at Phantom Creek; Tables 1 and 5, Fig. 4). At Lagins Creek, the number of evening detections increased from May to July (Table 2). Small numbers of evening detections were recorded in June and July at Phantom Creek (Table 5). The seasonal increase

MARBLED MURRELET ACTIVITY 841
80
20
0
,J Morning 0 Evening
Dab (I May = I)
FIGURE 4. Numbers of detections recorded on evening and following morning surveys at Lagins Creek in 1990. Lines were produced by LOWESS smoothing (Cleveland 1981) used in the SYSTAT graphics program (Wilkinson 1990).
in evening activity at Lagins Creek paralleled the increase observed in morning activity (Fig. 4) although, proportionately, evening detections were 7.6 times more numerous in July (K = 32.1 + 3.7, IZ = 10) than in May and June (.x = 4.2 f 1.4, 12 = 9) compared to morning detections which were only 1.5 times more numerous (67.4 f 4.3 vs. 45.4 + 7.6). Numbers of detections in the evening and following morning at Lagins Creek were weakly correlated seasonally (r = 0.56, P = 0.012) but not within each month.
Numbers of detections per evening survey were correlated with numbers of calls (r = 0.96, P < 0.001) and duration of activity (r = 0.72, P = 0.001) which also increased from May to July at Lagins Creek (Tables 2 and 5). Evening detec- tions were rare before sunset (two of 359) and 95% of detections occurred between sunset and 45 min after sunset. Mean duration of evening activity was 26.2 f 3.3 min (range: O-51 min).
BEHAVIOR AND GROUP SIZE
Proportion of visual detections. Most detections were auditory, but birds were seen in 25.6% of detections at Phantom Creek and 12.1% of de- tections at Lagins Creek. The proportion of de- tections that were visual increased from May to July at both Phantom Creek (15.0 to 32.0%; AN- COVA with weather: r2 = 0.24, F,,,, = 12.03, P = 0.001) and Lagins Creek (1.7 to 18.7%; r* = 0.39, F,,,, = 16.77, P -C 0.001) and decreased in August at Phantom Creek (8.2%; r2 = 0.79, F,,, = 21.6 1, P = 0.001). However, this trend was suspect at Lagins Creek because of the low pro- portion of visual detections recorded by the ob- server there in May and early June (see above). Excluding records by that observer, birds were seen in 19.8% of detections at Lagins Creek from 2 1 June to 28 July. No trend was apparent in the proportion of visual detections recorded during

842 M. S. RODWAY, H. M. REGEHR AND J-P. L. SAVARD
TABLE 5. Marbled Mm-relet activity during evening surveys at fixed stations at Phantom Creek and Lagins Creek in 1990.
Date Cloud
cover (%)
Phantom Creek No. of No. of
detections keer calls Duratmn
(min) Cloud
cover (%)
Lagins Creek No. of No. of
detectmns keer calls Duration
(min)
22 May 0 2 50 18 23 May 0 6 128 27 24 May 30 3 75 14 25 May 0 0 0 0 29 May 100 14 265 31 30 May 100 5 125 12 12 Jun 0 1 0 1 15 Jun 100 1 0 1 100 3 75 7 18 Jun 100 1 * 1 19 Jun 100 4 * 27 29 Jun 100 4 19 39 30 Jun 100 15 23 25 11 Jul 50 21 373 51 12 Jul 100 16 227 39 13 Jul 0 13 167 27 100 27 373 32 18 Jul 0 30 622 37 19 Jul 0 57 835 47 20 Jul 0 38 818 37 24 Jul 0 5 51 8 0 31 662 23 25 Jul 100 24 494 31 26 Jul 0 40 821 31 27 Jul 30 4 121 9 15 37 746 32
*Not recorded.
that period at Lagins Creek (r2 = 0.20, F,,,, = 0.42, P = 0.530) or Phantom Creek (r2 = 0.02, F 1.16 = 0.29, P = 0.596). There was no evidence that weather affected the proportion of birds sighted at Phantom Creek (ANCOVA with date: r2 = 0.30, F, 39 = (r2 = 0.39, F, 30
0.85, P = 0.364) or Lagins Creek = 2.27, P = 0.143). A greater
proportion of visual detections were recorded at Phantom Creek than at Lagins Creek in July (ANOVA: Y> = 0.16, F,,z, = 4.77, P = 0.039). This probably relates to the greater visibility at the Phantom Creek station.
Lagins Creek (x*~ = 23.4, P = 0.0001). The pro- portion of birds seen in flocks larger than two was 8.1% in May and 53.2% in July at Phantom Creek (Fig. 5). The seasonal increase in average flock size from 1.4 in May and 1.6 in June to 2.4 in July meant that the same number ofdetections represented 1.7 times as many birds in July as in May.
Birds were calling in 50.3 and 45.5% of visual detections at Phantom and Lagins creeks, re- spectively. Detections that were visual only com- prised 12.9% of all detections at Phantom Creek and 8.2% of detections recorded from 21 June to 28 July at Lagins Creek.
The majority of single birds sighted were silent in all months at both stations (Fig. 6). Propor- tions of silent birds were more variable for groups of two, with silent birds dominating only in June. The ratio of silent to calling flocks was greater for small flocks than large flocks at both Phantom Creek (xz4 = 135.8, P < 0.0001) and Lagins Creek (x24 = 37.9, P < 0.0001). All sighted flocks larger than two were calling, except for one detection of three silent birds at Lagins Creek.
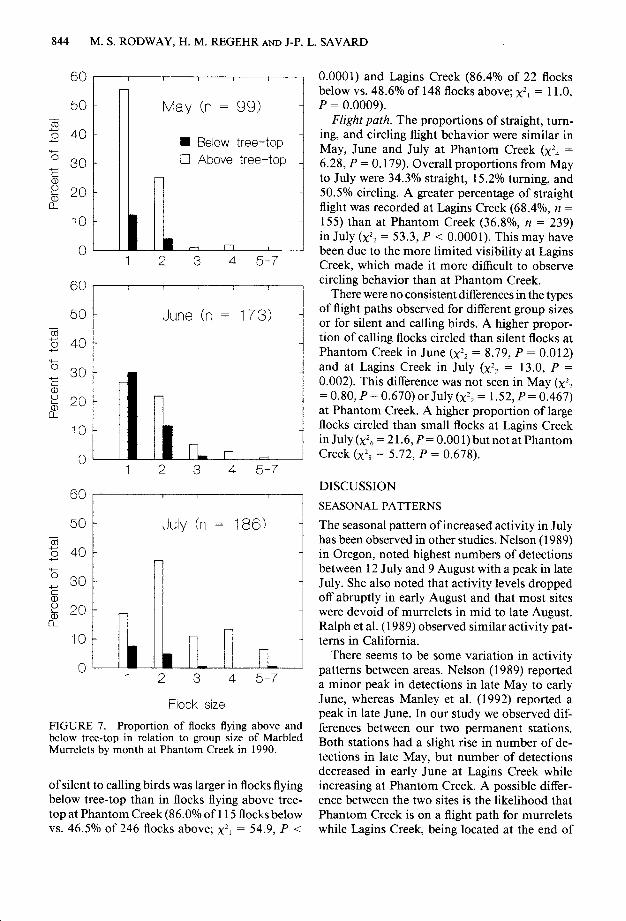
Group size. Group size of sighted Marbled Height ofjlight. Most visual detections were Murrelet flocks ranged from one to seven birds. above tree-top at Phantom Creek (75.1% above Single birds were most frequent in May and June, vs. 24.9% below tree-top, n = 461) and Lagins and groups of two were most prevalent in July Creek (89.2% above vs. 10.8% below tree-top, n at both stations (Fig. 5). The relative frequency = 166). At Phantom Creek, those proportions of larger flocks was similar in May and June at changed through the season, with the greatest Phantom Creek and increased from June to July proportion of birds flying below tree-top (42.8% at Phantom Creek (xZ4 = 45.6, P < 0.0001) and of detections) occurring in June, and the largest

844 M. S. RODWAY, H. M. REGEHR AND J-P. L. SAVARD
60 I , I 1 /
50- n May (n = 99)
N Below tree-top
q Above tree-top
?LuL 1 2 3 4 5-7
60 / I I / /
50 - June (n = 173) m g 40-
: 30-
; zo- $
10 -
n rl 4 ”
5-7
604 1 July in = 186)
J 1 2 3 4 5-7
Flock size
FIGURE 7. Proportion of flocks flying above and below tree-top in relation to group size of Marbled Murrelets by month at Phantom Creek in 1990.
of silent to calling birds was larger in flocks flying below tree-top than in flocks flying above tree- top at Phantom Creek (86.0% of 115 flocks below vs. 46.5% of 246 flocks above; x2, = 54.9, P <
0.0001) and Lagins Creek (86.4% of 22 flocks below vs. 48.6% of 148 flocks above; x2, = 11 .O, P = 0.0009).
Flight path. The proportions of straight, turn- ing, and circling flight behavior were similar in May, June and July at Phantom Creek (xz4 = 6.28, P = 0.179). Overall proportions from May to July were 34.3% straight, 15.2% turning, and 50.5% circling. A greater percentage of straight flight was recorded at Lagins Creek (68.4%, n = 155) than at Phantom Creek (36.8%, n = 239) in July (x*~ = 53.3, P < 0.0001). This may have been due to the more limited visibility at Lagins Creek, which made it more difficult to observe circling behavior than at Phantom Creek.
There were no consistent differences in the types of flight paths observed for different group sizes or for silent and calling birds. A higher propor- tion of calling flocks circled than silent flocks at Phantom Creek in June (xz2 = 8.79, P = 0.012) and at Lagins Creek in July (xZZ = 13.0, P = 0.002). This difference was not seen in May (x*~ = 0.80, P = 0.670) or July (xzZ = 1.52, P = 0.467) at Phantom Creek. A higher proportion of large flocks circled than small flocks at Lagins Creek in July (x*~ = 2 1.6, P = 0.00 1) but not at Phantom Creek (X~~ = 5.72, P = 0.678).
DISCUSSION
SEASONAL PATTERNS
The seasonal pattern of increased activity in July has been observed in other studies. Nelson (1989) in Oregon, noted highest numbers of detections between 12 July and 9 August with a peak in late July. She also noted that activity levels dropped off abruptly in early August and that most sites were devoid of murrelets in mid to late August. Ralph et al. (1989) observed similar activity pat- terns in California.
There seems to be some variation in activity patterns between areas. Nelson (1989) reported a minor peak in detections in late May to early June, whereas Manley et al. (1992) reported a peak in late June. In our study we observed dif- ferences between our two permanent stations. Both stations had a slight rise in number of de- tections in late May, but number of detections decreased in early June at Lagins Creek while increasing at Phantom Creek. A possible differ- ence between the two sites is the likelihood that Phantom Creek is on a flight path for murrelets while Lagins Creek, being located at the end of

MARBLED MURRELET ACTIVITY 845
an inlet, is less likely to serve as a flight corridor. If this is the case then patterns observed at Lagins Creek may reflect more closely what could be observed at breeding areas.
EFFECT OF WEATHER
Murrelets were detected more frequently on cloudy days and were active for longer periods than on clear days. Nelson (1989) also noted that the number of detections varied with weather conditions. However, she found that most de- tections occurred on clear and completely over- cast days and that fewer detections were recorded on moderately cloudy days. Paton et al. (1988) and Ralph et al. (1989) found that murrelet ac- tivity tended to start later on foggy and misty mornings but continued for a longer period of time and appeared to be more intense than on clear days. The trend in our study and that of Paton et al. (1988) and Ralph et al. (1989) in- dicate a relationship between light conditions and the intensity and duration of murrelet activity. Reduced activity when light intensities are high may serve to minimize risks of predation as has been suggested for Leach’s Storm-Petrels (Oceanodroma leucorhoa; Watanuki 1986, Bry- ant 1993) and Ancient Mm-relets (Synthlibor- amphus antiquus; Jones et al. 1990). Weather is a major factor contributing to daily variability in the number of mm-relet detections at a given site, and should be taken into consideration when comparing murrelet activity between sites.
CORRELATIONS BETWEEN MEASURES OF ACTIVITY
The strong correlation on a seasonal and monthly basis between numbers of detections and total numbers of keer calls recorded per survey sug- gests that they provide similar measures of Mar- bled Murrelet activity at those time scales. Thus, just counting total calls during a survey period may be an alternative to counting numbers of detections if a comparable measure of activity is all that is desired. Observers must be trained to discriminate detections, and counting or record- ing calls may be simpler and less subjective. Counts of calls plus careful records of visual de- tections would provide detailed measures of ac- tivity patterns. The duration of the activity pe- riod was correlated with numbers of detections on a seasonal basis but not always on a monthly basis and is probably not as useful as detections or calls as a measure of activity.
CORRELATION IN ACTIVITY LEVELS BETWEEN STATIONS
Although there was a significant correlation in murrelet activity between our two permanent stations over the entire season, there was a lack of correlation at smaller temporal scales (month- ly or weekly). Local weather patterns sometimes differed and may have contributed to differences in activity levels, but we cannot pinpoint at this time the factors besides weather that may have accounted for the different patterns observed in the two areas.
DAILY VARIABILITY
The wide variation in activity levels on a daily and weekly basis recorded in this study has been noted before (Nelson 1989, Manley et al. 1992). The causes of this variation are still unknown but may include weather factors, vocalization behavior and flight patterns ofbreeding and non- breeding birds, and the effects these have on ob- servations. Because of this large variability in detection levels from day to day, caution must be taken when comparing different areas, es- pecially when surveyed on different days or un- der different conditions. Large samples are re- quired to obtain statistical power when making comparisons between sites or attempting to in- terpret trends in activity levels at particular sites.
MORNING VS. EVENING SURVEYS
Several other studies have documented lower numbers of detections in the evening than in the morning (Manley et al. 1992, Eisenhawer and Reimchen 1990, Paton and Ralph 1990, Paton et al. 1990, Nelson 1989). The lack ofcorrelation within months found in this study between the numbers of detections recorded on evening and morning surveys suggests that they are more or less independent events. Morning surveys are more efficient for detecting murrelet activity.
The seasonal increase in evening activity may reflect shifts in behavior as the breeding season progresses. Exchange of incubation duties oc- curred at dawn at all monitored nests but feeding of young occurred at various times (Singer et al. 1991; Simons 1980; Nelson, pers. comm.).
FLIGHT BEHAVIOR AND VOCALIZATION
Most murrelets sighted were either flying alone or in pairs. Single birds flying below the canopy may be close to nest sites. This is supported by the high frequency of single birds that were silent

846 M. S. RODWAY, H. M. REGEHR AND J-P. L. SAVARD
(see Singer et al. 199 1). We would expect murre- lets to be silent in proximity to their nests to minimize the danger of nest detection by pred- ators. Ten of the 23 tree nests found to date in North America were depredated (Nelson, pers. comm.). Predators at nest sites include Common Raven (Corvus corux), Steller’s Jay (Cyanocitta stelleri) and Great Horned Owl (Bubo virgini- anus; Singer et al. 1991; Nelson, pers. comm.). The high frequency of silent single or paired birds stresses the importance of selecting observation stations in areas maximizing the chances of vi- sual detections, i.e., with large sections of open sky. Several studies (Nelson 1989, Paton and Ralph 1988, Varoujean et al. 1989) have indi- cated that visual detections are crucial in iden- tifying potential nesting areas. Birds flying below the canopy, birds landing in trees, and silent birds flying through the forest all could indicate po- tential nesting and roosting sites. Sightings in May and June may represent mostly breeding birds and may provide a better indication of nest- ing sites. Larger groups were more often seen in July, possibly involving non-breeding birds in- specting potential nest sites and familiarizing themselves with breeding areas. Several seabirds prospect for nest sites in the year(s) preceding first breeding (Manuwal 1974a, Sealy 1976, Gas- ton 1990). The seasonal increase in the propor- tion of large flocks, and thus in the average num- ber of birds per detection, means that results of surveys conducted at different times during the breeding season may not be directly comparable in terms of the numbers of birds using an area.
Nothing is known about the pairing behavior of Marbled Mm-relets or when they select nesting sites. Cassin’s Auklets (Ptychorumphus aleutica) and Ancient Murrelets have elaborate displays in their breeding colonies at night, and pairing may occur there (Manuwal 1974b, Thorensen 1964, Sealy 1976, Joneset al. 1989, Gaston 1990). Some of the aerial displays observed over the forest may be associated with pairing behavior, pair bond maintenance, prospecting for nest sites, or spacing behavior. It is likely that some of the circling behavior observed permits birds to fa- miliarize themselves with the location of the nest or nesting groves. Renesting has not been doc- umented in the Marbled Murrelet, however the large spread of the breeding season and the seem- ingly high predation pressure on the species sug- gest that it may occur. If so, then renesting birds
may prospect for new nesting sites during the breeding season. The two nests found in Cali- fornia in 1989 had been depredated and were not reused by mm-relets in 1989 or 1990 (Singer et al. 1991; Singer, pers. comm.).
The results of this study indicate that caution must be used when comparing numbers of de- tections at different sites, taking into considera- tion the high levels of daily and seasonal vari- ability, effects of weather, the amount of visibility at specific survey stations, and changes in group size and behavior over the breeding season. Set- ting priorities for habitat protection based on relative activity levels is problematical because we as yet have no gauge with which to relate measures of activity to breeding population. Be- havioral studies in the vicinity of known breed- ing sites and known nesting densities are required to determine the significance of behaviors ob- served during surveys and the relationship be- tween activity levels and habitat use.
ACKNOWLEDGMENTS
This research was funded by B.C. Ministry of Forests, B.C. Ministry of Environment, B.C. Ministry of Parks, Canadian Wildlife Service, Canadian Parks Service, Fletcher Challenge Canada, Husby Trucking Ltd., MacMillan Bloedel, Western Forest Products, and World Wildlife Fund. We would like to acknowledge the foresight and genuine concern of the forest com- panies involved. Research committee members in- eluded: Fred Bunnell, Forestry U.B.C.; Wayne Camp- bell. Roval B.C. Museum: Bill Dumont. Western Forest Products; Gary Kaiser, Canadian Wildlife Service; Dave Lindsay, Fletcher Challenge; Ron McLaughlin and Bill Pollard. MacMillan Bloedel: Bob Moodv. B.C. Con- servation Foundation; Dale Seip, Minis& of Forests; Bob Redhead and Doug Burles, Canadian Parks Ser- vice. Research assistants included Don Gamier, Moira Lemon, and Audrey Pearson. Field work by Heidi Re- gehr was funded by Malcom Ramsay of the University of Saskatchewan. Special thanks to the volunteers Ker- ry Baker, Julie Stoneman, Inez Weston and Tom Wes- ton for their generous help and wonderful company. Thanks to Gene Matchitt, Lorne McIntosh, Keith Moore and Ken Morgan for help with logistic prob- lems. Administrative support was provided by Bob Moody and Deborah Gibson of the B.C. Conservation Foundation. The B.C. Conservation Foundation also helped in entering the fleld data on the computer, a monumental task. We especially thank Dianne Rose- Talarico for her efforts in that regard. C. J. Ralph, D. C. Schneider and S. W. Singer provided many helpful comments on the manuscript.
LITERATURE CITED
BANNER, A., R. N. GREEN, A. INSELBERG, K. KLINKA, D. S. MCLENNAN, D. V. MEIDINGER, F. C.

MARBLED MURRELET ACTIVITY 847
NUZDORFER, AND J. POJAR. 1990. Site classifi- cation for coastal British Columbia. B.C. Min. For. pamphlet, Victoria, B.C.
BINFORD, L. C., B. G. ELLIOTT, AND S. W. SINGER. 1975. Discovery of a nest and the downy young of the Marbled Murrelet. Wilson Bull. 87:303- 319.
BRYANT, S. 1993. Effects of gulls and nocturnal en-
ramphus marmoratus) in coniferous forests of the Oregon coast range. Unpubl. rept., Nongame Pro- gram, Oregon Dept. Fish Wild]., Publ. No. 88-6- 01.
PATON, P.W.C., AND C. J. RALPH. 1988. Geographic distribution of the Marbled Murrelet in California at inland sites during the 1988 breeding season. Unpubl. rept., California Dept. Fish Game, Sac-
vironmental conditions in activity patterns of ran&to, CA. Leach’s Storm-Petrels at the breeding colonv. PATON. P.W.C.. AND C. J. RALPH. 1990. Distribution M.Sc.thesis, Memorial Univ. of Newf&ndlanh, of’the Maibled Murrelet at inland sites in Cali- St. John’s, Newfoundland. fomia. Northwestern Naturalist 7 1:72-84.
CARTER, H. R., AND R. A. ERICKSON. 1988. Popu- PATON, P.W.C., C. J. RALPH, AND H. R. CARTER. 1988. lation status and conservation problems of the The Pacific Seabird Group’s Marbled Murrelet Marbled Murrelet in California, 1892-1987. Un- survey and intensive inventory handbook. Un- publ. rept., California Dept. Fish Game, Sacra- publ. rept., U.S. For. Serv., Pac. Southwest Re- mento, CA. search Sta., Arcata, CA.
CLEVELAND, W. S. 1981. LOWESS: a program for PATON, P.W.C., C. J. RALPH, AND R. A. ERICKSON. smoothing scatter-plots by robust locallv weighted 1992. Use of an inland site in northwestern Cal- regression. American Statistician 3554.
ramphis marmoratus) on the Queen Chailotte is-
land sites by Marbled Murrelets in northwestern
-
lands, British Columbia. Can. Field-Nat. 104:439-
Washington. Unpubl. rept. Wash. Dept. Wildl.,
EISENHAWER, A. E., AND T. E. REIMCHEN. 1990. In-
444.
Olympia, WA.
land flight patterns of Marbled Murrelets (Brachy-
GASTON, A. J. 1990. Population parameters of the Ancient Murrelet. Condor 92:998-1011.
HAMER, T. E., AND E. B. CUMMINS. 1990. Forest hab- itat relationships of Marbled Murrelets in north- western Washington. Unpubl. rept. Wash. Dept. Wildl. Olympia, WA.
HAMER, T. E., AND E. B. CUMMINS. 199 1. Relation- ships between forest characteristics and use of in-
America. Proc. West. Found. Vertebr. Zool. 5.
em and central California. An in&m report. U.S.
ifomia by Marbled Murrelets, p. 109-l 16. In H.
PATON, P.W.C., C. J. RALPH, H. R. CARTER, AND S. K.
For. Serv., Pac. Southwest Research Sta., Arcata,
R. Carter and M. L. Morrison [eds.], Status and
NELSON. 1990. Surveying Marbled Murrelets at
CA.
conservation of the Marbled Murrelet in North
inland forested sites: a guide. U.S. For. Serv., Gen. Tech. Rept. PSW-120.
QUINLAN, S. E., AND J. H. HUGHES. 1990. Location and description of a Marbled Murrelet tree nest site in Alaska. Condor 92:1068-1073.
RALPH, C J., S. L. MILLER, N. L. NASLUND, B. O’DONNELL, P.W.C. PATON, AND J. SEAY. 1989. Marbled Murrelet research during 1989 in north-
JONES, I. L., J. B. FALLS, AND A. J. GASTON. 1989. The vocal repertoire of the Ancient Murrelet. Con- dor 91:699-710.
JONES, I. L., A. J. GASTON, AND J. B. FALLS. 1990. Factors affecting colony attendance by Ancient Murrelets (Synthliboramphus antiquus). Can. J. Zool. 68:433-441.
MANLEY, I., R. SHORTT, AND A. E. BURGER. 1992. Marbled Murrelet activity patterns in the Car- manah Valley on the southwest coast of Vancou- ver Island, p. 7 l-75. In K. Vermeer, R. W. Butler, and K. H. Morgan [eds.], The ecology,status and conservation of marine and shoreline birds of the west coast of Vancouver Island. Can. Wildl. Serv. Occasional Pap. No. 75, Ottawa.
MANUWAL, D. A. 1974a. The natural history of Cas- sin’s Auklet (Ptychoramphus aleuticus). Condor 76:421-431.
MANUWAL, D. A. 1974b. Effects of territoriality on breeding in a population of Cassin’s Auklet. Ecol- ogy 55:1399-1406.
MARSHALL, D. B. 1988. Status of the Marbled Murre- let in North America: with special emphasis on California, Oregon, and Washington. U.S. Fish Wildl. Serv. Biol. Rep. 88.
NELSON, S. K. 1989. Development of inventory tech- niques for surveying Marbled Murrelets (Brachy-
RODWAY, M. S. 1990. Status report on the Marbled Murrelet Brachyramphus marmoratus in Canada 1990. Committee on the Status of Endangered Wildlife in Canada, Ottawa.
RODWAY, M. S., SAVARD, J-P. L., AND H. M. REGEHR. 199 1. Habitat use and activity patterns of Mar- bled Murrelets at inland and at-sea sites in the Queen Charlotte Islands, British Columbia. Tech. Rept. Ser. No. 122, Can. Wildl. Serv., Pacific and Yukon Region.
SEALY, S. G. 1976. Biology ofnesting Ancient Murre- lets. Condor 78:294-306.
SEALY, S. G., AND H. R. CARTER. 1984. At-sea dis- tribution and nesting habitat of the Marbled Murrelet in British Columbia: problems in the conservation of a solitarily nesting seabird, p. 737- 756. In J. P. Croxall, P.G.H. Evans, and R. W. Schreiber [eds.], ICBP Tech. Publ. No. 2.
SIMONS, T. R. 1980. Discovery of a ground nesting Marbled Murrelet. Condor 82: l-9.
SINGER, S. W., N. L. NASLUND, S. A. SINGER, AND C. J. RALPH. 199 1. Discovery and observations of two tree nests of the Marbled Murrelet. Condor 93:330-339.
THORENSEN, A. C. 1964. The breeding behaviour of the Cassin’s Auklet. Condor 66:456-476.
VAROUJEAN, D. H., W. A. WILLIAMS, AND D. R.

848 M. S. RODWAY, H. M. REGEHR AND J-P. L. SAVARD
WARRICK. 1989. Nest locations and nesting hab- WATANUKI, Y. 1986. Moonlight avoidance behav- itat of the Marbled Murrelet (Bruchyrum&us iour in Leach’s Storm-Petrels as a defense against marmoratus) in coastal Oregon. Nongame Wildl. - Slaty-backed Gulls. Auk 103: 14-22. Program, Oregon Dept. Fish Wildl., Publ. No. 88- WILKINSON, L. 1990. SYGRAPH: the system for 6-02. graphics. SYSTAT, Inc., Evanston, IL.