activity-travel planning and rescheduling … · activity-travel planning and rescheduling...
TRANSCRIPT
van Bladel, Bellemans, Janssens and Wets
1
ACTIVITY-TRAVEL PLANNING AND RESCHEDULING BEHAVIOR: AN EMPIRICAL ANALYSIS OF INFLUENCING FACTORS Kelly van Bladel +32 (0)11 26 91 21 [email protected] Transportation Research Institute Hasselt University - Campus Diepenbeek Wetenschapspark 5, bus 6 B - 3590 Diepenbeek, Belgium Tom Bellemans +32 (0)11 26 91 27 [email protected] Transportation Research Institute Hasselt University - Campus Diepenbeek Wetenschapspark 5, bus 6 B - 3590 Diepenbeek, Belgium Davy Janssens +32 (0)11 26 91 28 [email protected] Transportation Research Institute Hasselt University - Campus Diepenbeek Wetenschapspark 5, bus 6 B - 3590 Diepenbeek, Belgium Geert Wets (corresponding author) +32 (0)11 26 91 58 +32 (0)11 26 91 99 (fax) [email protected] Transportation Research Institute Hasselt University - Campus Diepenbeek Wetenschapspark 5, bus 6 B - 3590 Diepenbeek, Belgium Abstract 158Text 5285Tables 4 * 250 = 1000References 1046Total Word Count 7489 Paper submitted to the Transportation Research Record: Journal of the Transportation Research Board, on March 13, 2009.
van Bladel, Bellemans, Janssens and Wets
2
ABSTRACT An increasing interest in dynamic activity scheduling could be witnessed in travel behavior research over the past years. This research analyzes the factors influencing the actual activity scheduling process, using detailed activity-travel data from an extensive dataset that was collected in Flanders (Belgium). A first model examines the attributes that influence activity planning; a second model analyzes the factors that affect activity rescheduling. The explanatory variables considered in both models are individual, household, activity and schedule attributes and their impact is analyzed using mixed logit models. Random effects are added to the models to test for within-individual variance.
The results reveal that activity and schedule characteristics considerably affect activity planning. The rescheduling model also has several highly significant activity and schedule attributes. Most individual and household attributes considered in this paper do not influence activity planning and rescheduling behavior, although strong statistical evidence indicates that individual-specific preferences for planning and rescheduling determine the process of activity scheduling.
van Bladel, Bellemans, Janssens and Wets
3
INTRODUCTION Over the past decade an increasing interest in activity scheduling and rescheduling could be witnessed in travel behavior research. Transport policy measures currently focus on transport demand management policies and the success of these policies is dependent on how people schedule and change their activity-travel patterns. Gärling et al. (1) developed the first comprehensive theoretical scheduling model and authors such as Arentze and Timmermans (2), Pendyala et al. (3) and Miller and Roorda (4) recently developed operational scheduling models, which are being deployed to evaluate transport policy measures in the Netherlands, the United States and Canada.
It is generally accepted in activity-based research that executed activities are the result of a complex scheduling process, in which activity episodes are inserted, deleted and modified, and that other attributes than activity type alone are required to model the scheduling process (5, 6). Most activity-based scheduling models, however, assume that activities are scheduled in a fixed order and do not attempt to model activity rescheduling. This means that activity scheduling is almost always considered to be a static process, while in reality it is a dynamic combination of (re)scheduling decisions. Recognizing this limitation of existing activity scheduling models, Gärling et al. (7) and Timmermans et al. (8) developed conceptual frameworks describing the effect of time pressure on activity rescheduling. The Aurora model (e.g. (9, 10)) predicts how individuals change their activity schedule during the day as a result of unexpected events or time pressure.
Since scheduling and rescheduling decisions are difficult to observe and since traditional trip- and activity-based diaries are not developed to collect this type of information, specific computer-based survey instruments were designed (e.g. (11, 12, 13)) to gather empirical data on scheduling process dynamics. Following studies, based on these data, aim at improving the understanding of (re)scheduling processes. Mohammadian and Doherty (14, 15) model the time elapsed between planning and execution of activities by using hazard and mixed logit models to analyze the effect of activity type and individual and situational factors on the planning process. Roorda and Miller (16) present a descriptive analysis about the rescheduling decisions people make to resolve conflicts with overlapping activities. Joh et al. (17) analyze which attributes influence the probability that an activity is rescheduled between it’s planning and execution. Whereas this study stresses which factors make an activity more amenable to schedule modifications in general, other studies model rescheduling choices in reaction to specific schedule conflicts. Ruiz et al. (6) and Ruiz and Timmermans (18, 19) look deeper into the conflict situations in which a new activity is inserted between two pre-planned activities and overlaps with one or both of the planned activities. The specific case on which Roorda and Andre (20) focus, is an unexpected one-hour delay. They investigate the factors affecting the rescheduling decisions that follow on this particular conflict type.
This study contributes to this line of research and aims at enhancing the insight in the activity scheduling process. Recent studies reveal that some activities are scheduled days or even weeks in advance (21). These activities are referred to as planned activities in the remainder of this paper. Other activities – so-called impulsive activities – do not seem to be scheduled in advance at all. Although impulsive activities frequently occur in the activity-travel schedules on which existing scheduling models are based, impulsive activities are hardly considered in these models’ scheduling processes. This research studies which activities are planned beforehand and which are impulsively executed, using a mixed logit model to assess the individual, household, activity and schedule determinants of this decision.
van Bladel, Bellemans, Janssens and Wets
4
Since activity scheduling is an ongoing process, a choice has to be made about the cut-off between planned and impulsive activities: from which moment on, activities are considered to be impulsive? This moment cannot be too far away from the activity execution, because then many deliberate planning decisions are ignored. But if this moment is too close to activity execution, the distinction between planned and impulsive activities fades away. The scheduling data in this paper stems from a paper-and-pencil survey in which planning is defined as the scheduling process that continues until the eve of the execution day; all activities scheduled thereafter are considered to be impulsive. Although by this definition activities planned on the execution day will be assigned to the impulsive category, the distinction between planned and impulsive activities was defined in this way to reduce respondent burden and to minimize the impact of the survey on the respondents’ activity-travel schedules.
The continuous character of the scheduling process implies furthermore that decisions about activity scheduling are made until the actual activity execution or deletion. The fact that an activity is planned in advance, does not mean that there can be no further modifications to the activity or its planned attributes. Therefore, this paper presents a second mixed logit model that examines the attributes influencing the activity rescheduling process. As for the planning model, activity, schedule, individual and household attributes are considered as explanatory variables.
This paper is structured as follows. The survey and data sample used for the analyses are presented in the next section. Subsequently, the mixed logit models and their estimation results are discussed for both models. A summary of the main findings concludes this paper.
DATA
Feathers Data Collection In order to perform the analyses described in the introduction, detailed information is needed about activity-travel schedules. This information stems from a large-scale data collection that has been conducted in Flanders (22). The data collection gathers activity-travel information for FEATHERS, an activity-based scheduling model for Flanders (23). For approximately 2500 households, detailed activity-travel schedules for a 7-day period are collected. The households are selected from census data and constitute a representative sample selection of the Flemish population with respect to geographical spread, socio-demographic characteristics and household composition.
For each household one person is asked to complete a household questionnaire that gathers data about household composition, household mobility (number of available vehicles, etc.) and key events on a household level that occurred during the past year. Examples of key events are changes in the household structure or purchase of a car.
Each individual respondent has to fill out an individual questionnaire, designed to collect socio-demographic data. Information about transportation (e.g. frequently used transport modes), activities (e.g. average activity frequency) and key events (e.g. changes in work situation) is collected on an individual level.
In addition to these questionnaires, an activity-travel planning tool was developed in order to gather data about the planning, namely the type of planned activities and their planned attributes (duration, location, start time, stop time, transport mode, etc.) as far as they are known beforehand. Since activity planning is defined as the scheduling process that continues until the eve of the execution day, the planned activities and their known attributes have to be filled out in the planning on the eve of the postulated execution day.
van Bladel, Bellemans, Janssens and Wets
5
The fourth component of the survey consists of a traditional activity-travel diary: for each diary day the executed activities and their specific attributes (e.g. activity type, duration, start time, location, trip attributes) have to be completed. For each executed activity, the respondent also has to indicate whether the activity was planned in advance or not, i.e. whether the activity also occurs in the planning or not.
The questionnaires are always in paper-and-pencil format, but for the activity-travel diary and planning, both a traditional paper-and-pencil survey and a software application that is installed on a personal digital assistant (24) are designed.
Data Sample The models in this paper are estimated based on data from the paper-and-pencil diaries and planning booklets gathered until the start of 2008. Whether an activity is planned or not can be extracted directly from the executed activity-travel diaries since respondents have to indicate in the diary whether an executed activity was planned or not. The planned attributes can then be retrieved from the planning booklet. After removing poor-quality records and eliminating activities for which it was unclear or unknown whether they were planned or not, 9548 activities that are either executed or planned or both are included in the final dataset.
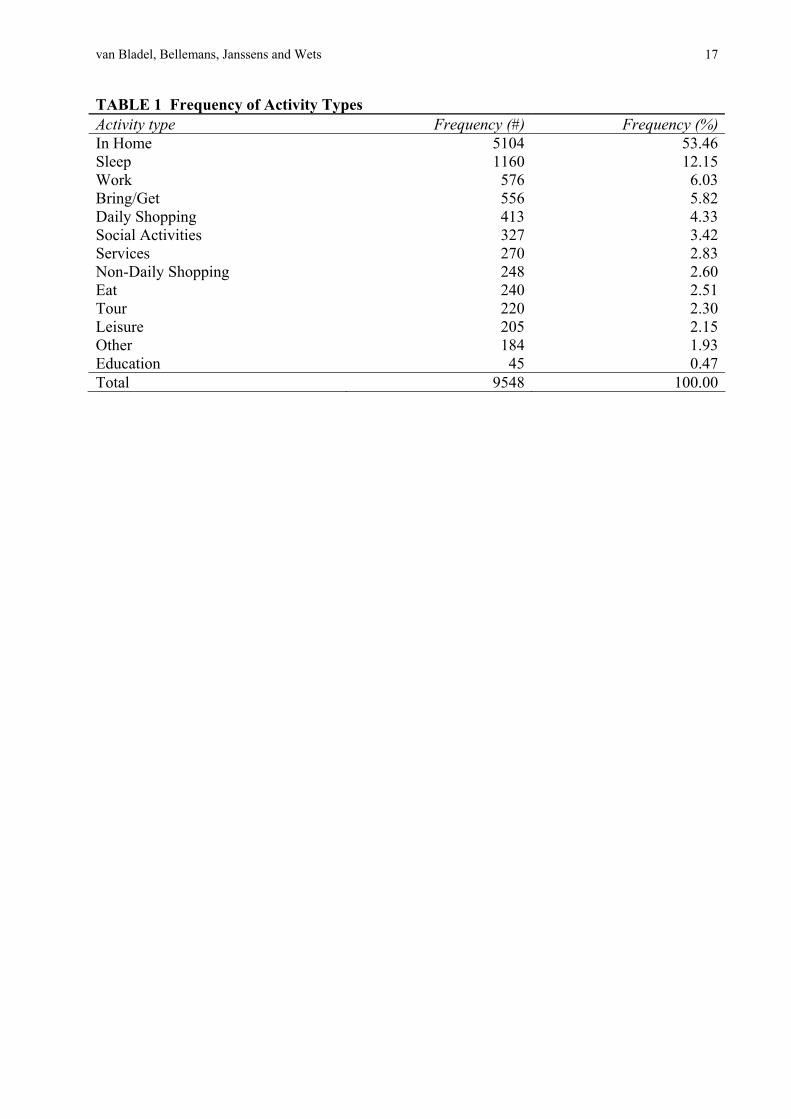
The sample consists of 272 respondents (55% females, 45% males) that are between 19 and 83 years old (average age of 50 years). These socio-demographic statistics are quite similar to the distribution of gender and age in the Flemish population (25). The respondents are presented with 13 pre-defined activity types from which they can choose to fill out the planning and the diary. The frequency of each activity type in the sample is presented in Table 1, which demonstrates that all activity types occur. Although Education is only observed 45 times, this is a reasonable number since the minimum age of respondents in the sample is 19 years, so that the sample contains merely 2% full time students. Flemish time-use data (26) reveal that in Flanders 70% of the activities are performed at home, so that the high shares of the In Home (53%) and the Sleep activities (12%) are as can be expected.
Properties of the Data Sample The activities in the sample can easily be classified according to their planning and execution status, as presented in Table 2.
Respondents were asked to indicate the reason why they would perform an activity impulsively. The main reasons were (1) the activity was planned during the execution day itself (19%), (2) the activity was impulsively executed (11%) and (3) interference of other people (10%). Additionally, the respondents were inquired after the reasons why 287 planned activities were not executed. Following answers occurred the most frequently: (1) the respondent did not feel like performing the activity (17%), (2) the duration of another activity changed (14%) and (3) the activity was already performed by somebody else (13%). It should be noted that these results are indicative and have to be interpreted with care, since these questions had a non-response rate of almost 40%.
Table 2 also classifies activities according to whether they are rescheduled or not and groups them by rescheduling type. Rescheduling can be captured for each planned activity by comparing the planned with the executed activity attributes. The dataset for the rescheduling model therefore consists of 7290 activities, of which 2268 were executed without rescheduling. Different types of rescheduling are distinguished: attributes can be modified with respect to timing or non-timing attributes. Combinations of these are also possible, e.g. if planned start time
van Bladel, Bellemans, Janssens and Wets
6
and location both differ from executed start time and location. Activities that are present in the planning but not in the activity-travel diary of the following day are said to be deleted. These activities may be postponed, but for this study the difference between postponement and activity deletion is irrelevant: both are defined as rescheduling.
In practice, activities are said to be rescheduled with respect to timing attributes if the planned start time or duration differ by more than 10 minutes from the executed start time or duration. The 10 minutes margin is chosen to allow for flexibility: a time difference of a limited magnitude is not significant with respect to activity-travel behavior. Furthermore, the dataset shows that start and end times, durations and travel times are rounded off to multiples of 5 minutes, so that smaller differences are difficult to capture given the data available.
Activities are defined as rescheduled with respect to non-timing attributes if location, number of accompanying persons or transport mode have changed between activity planning and execution. In case these attributes have missing values for the planning, which indicates that the respondent did not plan these attributes beforehand, the activity is also said to be rescheduled. This assumption ensures that all scheduling decisions made after the planning are captured.
MODEL ESTIMATION
Model Formulation The planning as well as the rescheduling model developed in this paper are based upon the theory of discrete choice. For the planning model, the two exclusive choices are planning and no planning; for the rescheduling model, the dichotomous options are rescheduling versus no rescheduling. It is assumed that the probability that an activity is planned can be expressed as a function of different attributes; the same holds for the probability that an activity is rescheduled. These attributes are activity, schedule, individual and household characteristics. The activity attributes used in both models as explanatory variables are, however, not the same. In the planning model, the attributes of the executed activities are used, since the planned attributes are not available for all activities. Since planned activity attributes are available for the activities considered in the rescheduling model, these are used instead of executed activity attributes.
Classical logistic regression hypothesizes that observations used in a model, should be independent. But given the dataset available, it might not be justified to assume that the outcome of every activity is completely unrelated to the outcome of every other activity, since activities are clustered per respondent. Individuals can be assumed to have a certain preference or dislike for activity planning or rescheduling that is not explained by the activity, schedule, individual or household attributes under consideration in the analyses. Therefore, logistic regression models with individual-level random effects are applied (27). The assumption of independent choices is relaxed in these so-called mixed logit models. For respondent i the utility of planning an activity in choice situation j is given by Equation (1) and the corresponding probability by Equation (2):
inn
pijij
pij
pij uxxYwithYU ++++=+= βββε ...110 (1)
)exp()exp()exp(
)( npij
pij
pij
iij YYY
upP+
= (2)
where β1,…,βn are the coefficients of the explanatory variables x1,…,xn and the constant term β0 reflects the inherent preference of respondents for planning. ui captures the individual-level

van Bladel, Bellemans, Janssens and Wets
7
random effect assumed to be normally distributed with variance σ²u, i.e. ui ~ N(0,σ²u), and the εij values are assumed to be independent and identically distributed (iid) type I extreme value with variance σ²ε.
A second assumption concerning the dataset is the fact that the number of activities an individual can realistically plan or execute during a day is restricted, because time is a limited resource. If time pressure (approximated by an increasing number activities in the schedule) increases, the competition between different activities will also increase. The assumption is made that stronger competition reduces the probability that an activity is scheduled and therefore the total number of executed activities is incorporated for the planning model. Similarly, the total number of planned activities is added as an explanatory variable to the rescheduling model.
The utility and the probability of respondent i for planning an activity in choice situation j is expressed by Equations (3) and (4):
inn
rijij
rij
rij uxxYwithYU ++++=+= βββε ...110 (3)
)exp()exp()exp(
)( nrij
rij
rij
iij YYY
urP+
= (4)
where β1,…,βn are again the coefficients of the explanatory variables x1,…,xn and β0 now reflects the inherent preference of respondents for rescheduling. ui denotes the individual-level random effect assumed to be N(0,σ²u) and the εij values are assumed to be iid type I extreme value with variance σ²ε.
In the planning and the rescheduling model σ²u expresses the variation between individuals due to differences in the activity or the situation, while the within-individual variation is captured by σ²ε. The parameter estimates that result from these models express the impact of the corresponding explanatory variables on the probability of the dependent variable. A positive coefficient indicates that an increase (decrease) in the explanatory variable increases (decreases) the probability of activity planning or rescheduling; a negative coefficient means that if the explanatory variable increases (decreases) the probability of activity planning or rescheduling decreases (increases).
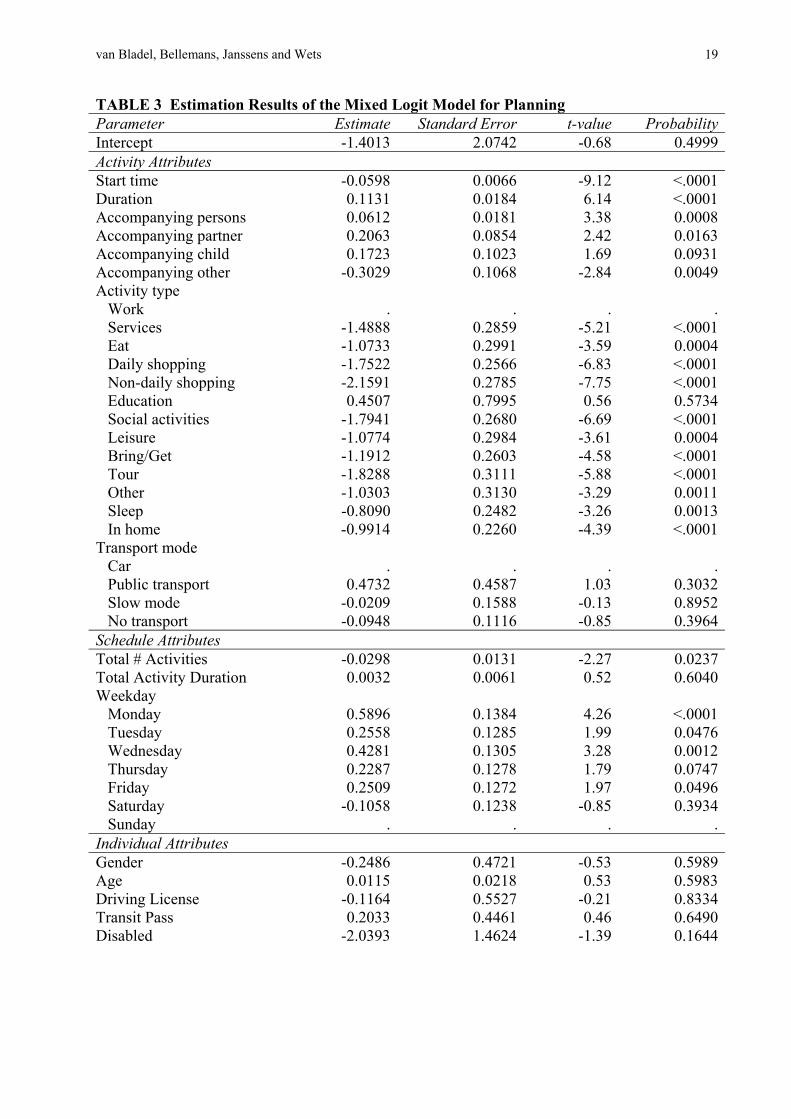
Planning Model First, a multicollinearity analysis is performed on the explanatory variables available in the dataset, which reveals that the individual attributes gender and family function are highly correlated as are the activity attributes location (with categories ‘in-home’ and ‘out-of-home’) and activity type. Since the variable family function has only an administrative meaning, this attribute is removed from the analysis. Location is also removed from the model, because In Home and Sleep are performed at home by default and the other activities are almost always executed somewhere else. Location – as it is defined in this analysis – can thus be seen as inherently linked with activity type. The first column of Table 3 shows the resulting explanatory variables: 8 activity attributes and 3 schedule attributes in addition to 8 individual and 3 household characteristics on a personal level. The estimation results of the planning model are presented in Table 3.
The mixed logit model for activity planning has a good model fit compared to the intercept-only model: the log likelihood value of the mixed logit model with covariates is -3422 compared to a log likelihood of -5144 for the model with only β0 as parameter. The likelihood
van Bladel, Bellemans, Janssens and Wets
8
ratio index of the mixed logit model for planning amounts to 0.467 and the adjusted likelihood ratio index (28) is 0.459, which is a considerable rise compared to the value of 0.251 for the adjusted likelihood ratio index of the multinomial logit (MNL) model with the same variables, but without the random effects. This increase is statistically significant on a 5% level and indicates that the explanatory power of the mixed logit model has improved due to the incorporation of the random effects in the model. The model fit of the mixed logit model is thus better than the fit of the standard MNL model. This finding is supported by the Akaike Information Criterion (AIC): the mixed model has an AIC of 6948 compared to the AIC of 9610 that is found for the MNL model for activity planning. These results imply that individuals have a personal preference or dislike for activity planning.
The attributes found to be significant in the MNL model are overall the same as those of the mixed logit model, but the estimated coefficients are different in both models. Most of the mixed logit coefficients are larger than their MNL counterparts. This implies that the influence of the explanatory variables will be biased if the MNL model is applied instead of the planning model with individual-level random effects.
One-by-one examination of the groups of explanatory variables reveals that the signs of the parameter estimates are overall consistent with general expectations and with results of commensurable studies (e.g. (14)).
Some of the activity attributes turn out to be highly significant, whereas others do not seem to influence the probability that an activity is planned in advance. The t-test indicates significant effects for start time and duration. As derived from the parameter estimates, the estimated odds of planning decrease by 6% for an increase in start time by one hour and increase by 12% for an increase in duration by one hour. This means that activities early in the day tend to be planned more in advance than those later in the day, which are logically more likely to be planned during the execution day itself. Longer activities tend to be planned beforehand, probably because they require more scheduling effort. Scheduling activities with other people is also expected to require more effort, which is confirmed by the results: the more people join in the activity, the higher the probability that the activity is planned in advance. The odds increase by 6% for every additional person. If the respondent’s partner or child is involved in the activity, the odds of planning increase by respectively 23% and 19%, although the accompanying child variable is only significant on a 10% level. Surprising is the finding that if non-household members are involved in an activity, the activity in question is more likely to be impulsively performed or at least not planned until the execution day itself: the odds decrease significantly by 26% if non-household members join in the activity. These results seem to suggest that household members indeed take each other’s activity-travel schedules into account by planning activities with family members in advance, a result that contributes to the justification of the recent trend of modeling activity-travel patterns at the household level, whereas activities that involve non-household members are performed more impulsively.
Since activity type and transport mode are categorical variables, the likelihood ratio is calculated, from which it is concluded that activity type significantly affects the probability of planning and transport mode does not. Work and Education, typically referred to as fixed activities (e.g. (2)), turn out to be the activity types that have the highest probability of being planned beforehand, followed by Sleep and In Home. Daily and Non-Daily Shopping, Touring and Social Activities are the activities most impulsively performed.
The total duration of the activities executed on a specific day is the only schedule attribute that does not significantly affect the probability that an activity is planned in advance.
van Bladel, Bellemans, Janssens and Wets
9
The odds of planning decrease by 3% for every additional activity executed during a day. It appears that if there is still some time left after the planned activities are executed, individuals are likely to fill up the spare time with other activities. The day of the week results indicate that the probability that an activity is planned in advance is highest for weekday activities. This intuitive finding can be explained by the fact that people have more time available during the weekend and less fixed commitments.
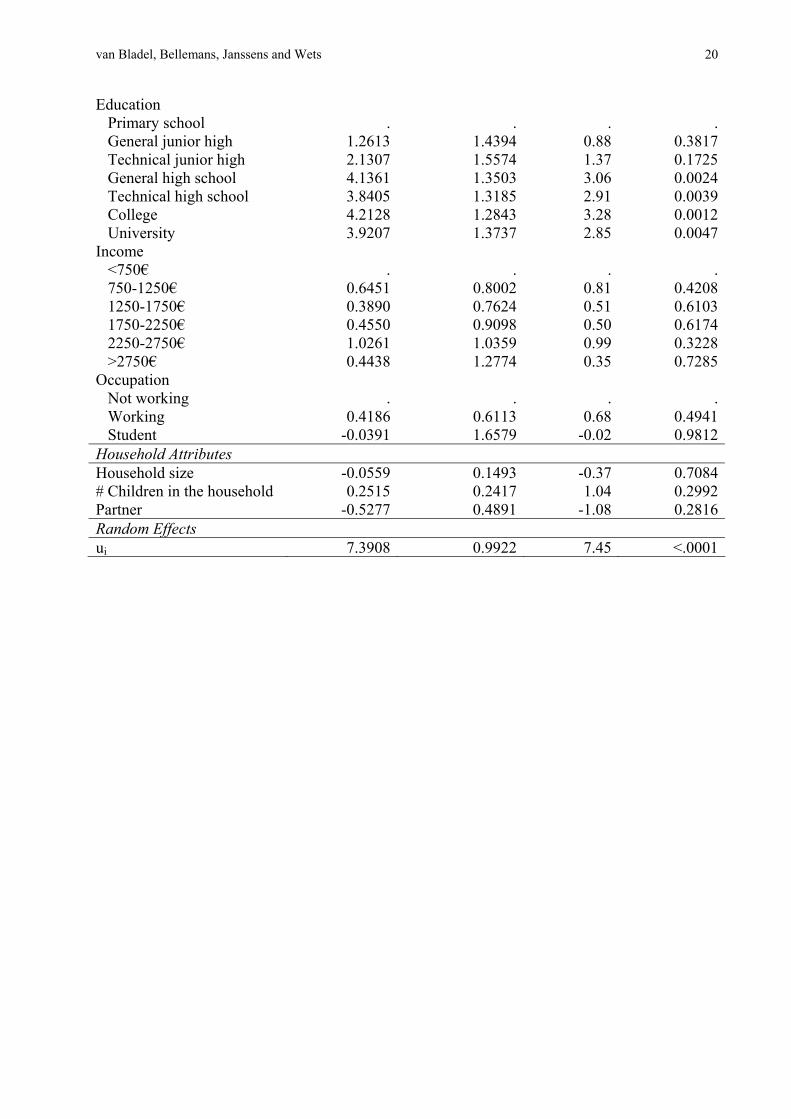
Although the results of the planning model show that neither individual nor household characteristics affect the planning significantly, the individual-level random effects significantly affect the probability of activity planning. The assumption of dependency within a cluster cannot be rejected, which confirms the results of the above comparison of the MNL and the mixed logit model: an individual-specific preference or dislike for planning seems to exist. Traditional socio-demographic data are not able to account for these preferences, but concepts from cognitive psychology or behavioral decision-making science might be helpful for further research into this topic (29, 30).
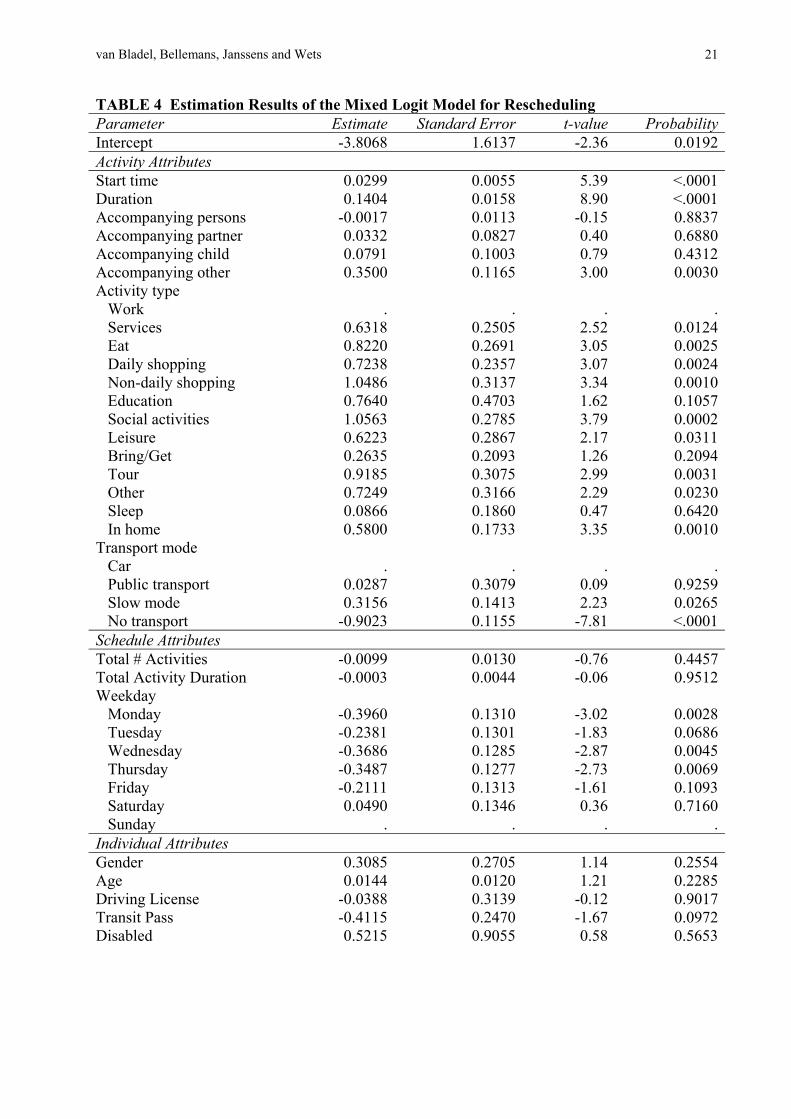
Rescheduling Model The explanatory variables incorporated in the rescheduling model are almost the same as those used in the planning model: as explained above, the planned activity attributes are used for the rescheduling model instead of the activity attributes as they are executed. Again, family function is correlated with gender and the planned activity location is also subject to multicollinearity: both variables are removed from the analysis. Table 4 presents the estimation results of the mixed logit model for activity rescheduling.
Comparison of the log likelihood value of the mixed logit model for rescheduling with covariates (-3222) with the log likelihood of the intercept-only model (-4062) reveals that the full model of Table 4 has a better model fit than the intercept-only model. The rescheduling model with covariates has a likelihood ratio of 0.251 and an adjusted likelihood ratio of 0.239. This is an increase with 90% compared to the adjusted likelihood ratio of the MNL model with the same explanatory variables, but without the random effects. This increase is statistically significant on a 5% level. The rescheduling model has gained explanatory power thanks to the incorporation of the random effects in the model. This result can also be derived from the highly significant value of the t-statistic for the between-individual variance. The model fit of the mixed logit model is clearly better than the fit of the MNL model without random effects, what can be concluded from the amelioration of the AIC from 7519 for the MNL model to 6548 for the mixed logit model for rescheduling. Comparing the coefficients of the MNL and mixed model shows that they differ in size, although the same explanatory variables are significant in both models. All these goodness-of-fit measures indicate that individuals have a preference or dislike for rescheduling that cannot only be explained by differences in socio-demographic or situational characteristics. Additional research into these individual effects could originate from decision-making science and cognitive psychology, as was suggested for the planning model (29, 30).
Exploration of the different groups of covariates reveals that the signs of the coefficients are overall consistent with results of similar studies (e.g. (17)). It turns out that several activity attributes determine whether an activity is prone to rescheduling or not. Start time and duration significantly affect the chance that an activity is rescheduled. The estimated odds of rescheduling increase by 3% for an increase in start time by one hour and by 15% for an increase in duration by one hour. This means that activities planned to be executed later during the day tend to be rescheduled more than those earlier in the day, because activities executed later in the day are
van Bladel, Bellemans, Janssens and Wets
10
presumably more subject to unexpected events, preceding activities that lasted longer than expected, etc. Longer activities are more likely to conflict with other activities and are thus more likely to be rescheduled. The odds of activity rescheduling increase significantly by 42% if non-household members join in on the activity. If other people are involved in an activity, the activity becomes less controllable: not only the schedule of the respondent, but also that of the people that join in can be modified and these modifications will spread to the other schedules. This could be a possible reason why the presence of non-household members increases the odds of rescheduling. As opposed to the planning model, no conclusive statements can be made about how the number of accompanying persons or the involvement of household members influence activity rescheduling, because the corresponding coefficients are far from statistically significant. The likelihood ratio analysis confirms that activity type is a significant explanatory variable for the activity rescheduling model. Work, Sleep and Bring/Get are the activity types that have the lowest probability of being rescheduled. As argued before, Work is typically considered to be a fixed activity type and the Bring/Get activity is also usually associated with fixed commitments and hence less likely to be rescheduled. Touring, Non-Daily Shopping and Social Activities are the most likely to be rescheduled. Non-Daily Shopping and Touring are activity types that do not usually have a fixed start or end time, so the duration is typically rather flexible. Furthermore, both activities can often be executed on a variety of different locations and this location flexibility can also cause impulsive changes in the scheduling process. Transport mode also turns out to significantly affect activity rescheduling and the model results reveal that activities reached on foot or by bike are subject to rescheduling more often than activities reached by car: the odds of activity rescheduling increase by 37% if people use a slow transport mode. Activities performed at the same location as the preceding activity decrease the odds of rescheduling significantly by 59% and are thus the least likely to be rescheduled. This indicates that trips to locations where more than one activity will be executed, also have a structuring influence on the schedule.
Day of the week is the only schedule attribute that significantly affects rescheduling and it is clear that there are less activities rescheduled during the week than on Sunday. The higher probability of planning during the week due to the lower amount of spare time available from Monday to Thursday can account for this finding.
Few individual variables turn out to be significant. On a 5% significance level, it is clear that working people reschedule their activities far more often than non-working people. One possible reason could be that working people usually have a tighter schedule than non-working people, so unexpected events disturb their schedule more vigorously. Since there is little spare time to absorb changes in the workers’ schedules, more activities are rescheduled. The possession of a transit pass is only significant on a 10% level: people with a public transport pass are less likely to reschedule their activities than people without a public transit pass. The fixed timetable of public transport services could be the main reason that public transport users do not need to reschedule their activities as often as people without a transit pass, but since busses and trains do not always follow their timetable, the explanation could also be that public transport users calculate possible delays in their planning and thus do not need to reschedule when they are actually delayed.
The number of children in the household turns out to be a significant household attribute on the 10% significance level: the odds of rescheduling decrease by 20% with every additional child in the household. The presence of children in a family entails the need to structure daily activity-travel patterns more thoroughly. Depending on the age of the children, they can e.g. not
van Bladel, Bellemans, Janssens and Wets
11
be sufficiently independent to stay home alone, to travel on their own, etc. Adult family members need to structure their schedules to some extent so that the children are taken care of.
CONCLUSIONS The aim of this paper is to contribute to the understanding of activity scheduling and rescheduling, because the factors influencing these behavioral scheduling processes are still largely unexplored in spite of the increased interest in scheduling and rescheduling research. Activity-based models driven by dynamic scheduling and rescheduling processes potentially provide more accurate activity-travel pattern predictions, which is important in the context of e.g. the evaluation of transport policies.
Two different mixed logit models are discussed. The first model analyzes whether an activity is planned in advance or not and the second model examines whether a planned activity is rescheduled between planning and execution. Both models are based on activity, schedule, individual and household attributes that are collected by an extensive, large-scale activity-travel survey in Flanders. The survey gathers traditional activity-travel schedules and information about the scheduling process for 7 consecutive days.
The following analysis results are particularly relevant to understand the role of interpersonal interactions in scheduling research. It was found that the activity planning process is significantly influenced by social interactions with other people. Not only the number of people that join in on the activity influences the planning, but also the ‘type’ of company is relevant. Furthermore, the effect of performing activities together with other people also affects the rescheduling process, though to a lesser extent: rescheduling is influenced by the presence of non-household members, but not by the number of accompanying people. These findings support the growing interest in activity-based modeling of household interactions and social networks in activity-travel research and encourage modelers to take up the challenge of incorporating interpersonal relations in activity-based models.
One of the most important results confirms the growing belief that activity type alone may not be sufficient to assess whether activities are planned beforehand or not. The planning model demonstrates that other activity attributes together with situational and environmental circumstances also play an important role in the planning process and the same holds for the rescheduling process. Sequential activity-based models should thus take more explanatory variables into account in assessing which activities are planned or rescheduled and in which order, than merely activity type. It should however be noted that activity type still has strong explanatory power in the planning as well as in the rescheduling model, despite the various covariates that are incorporated in both models and that are statistically significant. Given that for example Work is mostly planned in advance and rarely rescheduled, it can be concluded that Work still constitutes a part of the activity-travel schedule that has a strong structuring influence.
Most estimation results regarding activity planning and rescheduling are in line with general expectations about the determinants of individual scheduling behavior. Interesting results are found with respect to between-individual variance: although the personal preference of individuals regarding activity planning or rescheduling is often neglected in scheduling analyses, it is clear from the model results that this component cannot longer be ignored in future attempts to model the planning or rescheduling process. The substantial explanatory power added by incorporating random effects into the mixed logit models incites further research into individual preferences for planning and rescheduling.
van Bladel, Bellemans, Janssens and Wets
12
In order to verify the above conclusions, future research will focus on reanalyzing the models in this paper based on the personal digital assistant dataset and the results of the analyses will then be incorporated in FEATHERS, an activity-based model for Flanders.
REFERENCES
1 Gärling, T., T. Kalén, J. Romanus, M. Selart and B. Vilhelmson. Computer Simulation of
Household Activity Scheduling. Environment and Planning A, Vol.30, No.4, 1998, pp.665–679.
2 Arentze, T. A. and H. J. P. Timmermans. Albatross: A Learning-Based Transportation
Oriented Simulation System. EIRASS, Eindhoven University of Technology, The Hague, the Netherlands, 2000.
3 Pendyala, R. M., R. Kitamura, A. Kikuchi, T. Yamamoto and S. Fujii. Florida Activity
Mobility Simulator: Overview and Preliminary Validation Results. In Transportation Research Record: Journal of the Transportation Research Board, No.1921, Transportation Research Board of the National Academies, Washington, DC, USA, 2005, pp.123–130.
4 Miller, E. J. and M. J. Roorda. Prototype Model of Household Activity-Travel
Scheduling. In Transportation Research Record: Journal of the Transportation Research Board, No. 1831, Transportation Research Board of the National Academies, Washington, DC, USA, 2003, pp.114–121.
5 Doherty, S. T. Should We Abandon Activity Type Analysis? Presented at the 10th
International Conference on Travel Behaviour Research (IATBR), Lucerne, Switzerland, 2003.
6 Ruiz, T., J. W. Polak and C.-H. Joh. Empirical Analysis of Factors Affecting the
Resolution of Activity-Scheduling Conflicts. In Transportation Research Record: Journal of the Transportation Research Board, No.1926, Transportation Research Board of the National Academies, Washington, DC, USA, 2005, pp.50–60.
7 Gärling, T., T. Gillholm and W. Montgomery. The Role of Anticipated Time Pressure in
Activity Scheduling. Transportation, Vol.26, No.2, 1999, pp.173–191. 8 Timmermans, H. J. P., T. A. Arentze and C.-H. Joh. Modeling Effects of Anticipated
Time Pressure on Execution of Activity Programs. In Transportation Research Record: Journal of the Transportation Research Board, No.1752, Transportation Research Board of the National Academies, Washington, DC, USA, 2001, pp.8–15.
9 Joh, C.-H., T. A. Arentze and H. J. P. Timmermans. Activity-Travel Scheduling and
Rescheduling Decision Processes: Empirical Estimation of Aurora Model. In Transportation Research Record: Journal of the Transportation Research Board,
van Bladel, Bellemans, Janssens and Wets
13
No.1898, Transportation Research Board of the National Academies, Washington, DC, USA, 2004, pp.10–18.
10 Timmermans, H. J. P., T. A. Arentze and C.-H. Joh. Modeling Learning and Evolutionary
Adaptation Processes in Activity Settings: Theory and Numerical Simulations. In Transportation Research Record: Journal of the Transportation Research Board, No.1718, Transportation Research Board of the National Academies, Washington, DC, USA, 2000, pp.27–33.
11 Doherty, S. T. and E. J. Miller. A Computerized Household Activity Scheduling Survey.
Transportation, Vol.27, 2000, pp.75–97. 12 Ettema, D., A. W. J. Borgers and H. J. P. Timmermans. Using Interactive Computer
Experiments for Identifying Activity Scheduling Heuristics. Presented at the 7th International Conference on Travel Behaviour Research (IATBR), Valle Nevada, Chile, 1994.
13 Lee, M. S. and M. G. McNally. Experiments with a Computerized Self-Administrative
Activity Survey. In Transportation Research Record: Journal of the Transportation Research Board, No.1752, Transportation Research Board of the National Academies, Washington, DC, USA, 2001, pp.91–99.
14 Mohammadian, A. and S. T. Doherty. Mixed Logit Model of Activity-Scheduling Time
Horizon Incorporating Spatial–Temporal Flexibility Variables. In Transportation Research Record: Journal of the Transportation Research Board, No.1926, Transportation Research Board of the National Academies, Washington, DC, USA, 2005, pp.33–40.
15 Mohammadian, A. and S. T. Doherty. Modeling Activity Scheduling Time Horizon:
Duration of Time between Planning and Execution of Pre-Planned Activities. Transportation Research Part A: Policy and Practice, Vol.40, 2006, pp.475–490.
16 Roorda, M. J. and E. J. Miller. Strategies for Resolving Activity Scheduling Conflicts:
An Empirical Analysis. In H. J. P. Timmermans (Ed.), Progress in Activity-Based Analysis. Elsevier Science Ltd., Oxford, United Kingdom, 2005, pp.203–222.
17 Joh, C.-H., S. T. Doherty and J. W. Polak. Analysis of Factors Affecting the Frequency
and Type of Activity Schedule Modification. In Transportation Research Record: Journal of the Transportation Research Board, No.1926, Transportation Research Board of the National Academies, Washington, DC, USA, 2005, pp.19–25.
18 Ruiz, T. and H. J. P. Timmermans. Changing the Timing of Activities in Resolving
Scheduling Conflicts. Transportation, Vol.33, 2006, pp.429–445.

van Bladel, Bellemans, Janssens and Wets
14
19 Ruiz, T. and H. J. P. Timmermans. Changing the Duration of Activities in Resolving Scheduling Conflicts. Transportation Research Part A: Policy and Practice, Vol.42, No.2, 2008, pp.347–359.
20 Roorda, M. J. and B. K. Andre. A Stated Adaptation Survey of Activity Rescheduling:
Empirical and Preliminary Model Results. Presented at the 86th Annual Meeting of the Transportation Research Board (TRB), Washington, DC, USA, 2007.
21 Doherty, S. T. How Far in Advance Are Activities Planned? Measurement Challenges
and Analysis. In Transportation Research Record: Journal of the Transportation Research Board, No.1926, Transportation Research Board of the National Academies, Washington, DC, USA, 2005, pp.41–49.
22 Cools, M., E. Moons, T. Bellemans, D. Janssens and G. Wets. Surveying Activity-Travel
Behavior in Flanders: Assessing the Impact of the Survey Design. Research report, Transportation Research Institute, Hasselt University, 2008, 15p.
23 Janssens, D., G. Wets, H. J. P. Timmermans and T. A. Arentze. Modelling Short-Term
Dynamics in Activity-Travel Patterns: The Feathers Model. Presented at the 11th World Conference on Transportation Research, Berkeley, U.S.A., 2007.
24 Bellemans, T., B. Kochan, D. Janssens, G. Wets and H. J. P. Timmermans. Field
Evaluation of Personal Digital Assistant Enabled by Global Positioning System: Impact on Quality of Activity and Diary Data. In Transportation Research Record: Journal of the Transportation Research Board, No.2049, Transportation Research Board of the National Academies, Washington, DC, USA, 2008, pp.136–143.
25 Statistics Belgium. FOD Economie, Algemene Directie Statistiek en Economische
Informatie, Dienst Demografie, 2008. Information retrieved on November 1st, 2008 from http://www.statbel.fgov.be.
26 Glorieux, I., K. Coppens, S. Koelet, M. Moens and J. Vandeweyer. Vlaanderen in Uren
En Minuten. De Tijdsbesteding Van De Vlamingen in 480 Tabellen. CD-ROM, VUB Press, VUB, Brussels, Belgium, 2002. Information retrieved on from CD-ROM.
27 Littell, R. C., G. A. Milliken, W. W. Stroup, R. D. Wolfinger and O. Schabenberger. SAS
for Mixed Models, Second Edition. SAS Press, SAS Institute, Cary, U.S.A., 2006. 28 Ben-Akiva, M. E. and S. R. Lerman. Discrete Choice Analysis: Theory and Application
to Travel Demand. MIT Press, Cambridge, U.S.A., 1985. 29 Fishbein, M., H. C. Triandis, F. H. Kanfer, M. Becker, S. E. Middlestadt and A. Eichler.
Factors Influencing Behavior and Behavior Change. In A. Baum, T. A. Revenson and J. E. Singer (Ed.), Handbook of Health Psychology. Lawrence Erlbaum, Mahway, New Jersey, USA, 2001, pp.3–17.

van Bladel, Bellemans, Janssens and Wets
15
30 Gillholm, R. and T. Gärling. Determinants of Implementation Intentions. Department of Psychology, Göteborg University, Göteborg, Sweden, 1997.

van Bladel, Bellemans, Janssens and Wets
16
LIST OF TABLE TITLES AND FIGURE CAPTIONS TABLE 1 Frequency of Activity Types TABLE 2 Classification of Activities for the Planning and Rescheduling Model TABLE 3 Estimation Results of the Mixed Logit Model for Planning TABLE 4 Estimation Results of the Mixed Logit Model for Rescheduling
van Bladel, Bellemans, Janssens and Wets
17
TABLE 1 Frequency of Activity Types Activity type Frequency (#) Frequency (%)In Home 5104 53.46Sleep 1160 12.15Work 576 6.03Bring/Get 556 5.82Daily Shopping 413 4.33Social Activities 327 3.42Services 270 2.83Non-Daily Shopping 248 2.60Eat 240 2.51Tour 220 2.30Leisure 205 2.15Other 184 1.93Education 45 0.47Total 9548 100.00

van Bladel, Bellemans, Janssens and Wets
18
TABLE 2 Classification of Activities for the Planning and Rescheduling Model Classification Planning Model Classification Rescheduling Model Not Planned 2258 Not Rescheduled 2268Planned 7290 Rescheduled 5022
Executed 7003 Timing 1746Not Executed 287 Non-Timing 1125
Combination Timing / Non-Timing 1864 Deletion 287Total 9548 Total 7290
van Bladel, Bellemans, Janssens and Wets
19
TABLE 3 Estimation Results of the Mixed Logit Model for Planning Parameter Estimate Standard Error t-value ProbabilityIntercept -1.4013 2.0742 -0.68 0.4999Activity Attributes Start time -0.0598 0.0066 -9.12 <.0001Duration 0.1131 0.0184 6.14 <.0001Accompanying persons 0.0612 0.0181 3.38 0.0008Accompanying partner 0.2063 0.0854 2.42 0.0163Accompanying child 0.1723 0.1023 1.69 0.0931Accompanying other -0.3029 0.1068 -2.84 0.0049Activity type
Work . . . .Services -1.4888 0.2859 -5.21 <.0001Eat -1.0733 0.2991 -3.59 0.0004Daily shopping -1.7522 0.2566 -6.83 <.0001Non-daily shopping -2.1591 0.2785 -7.75 <.0001Education 0.4507 0.7995 0.56 0.5734Social activities -1.7941 0.2680 -6.69 <.0001Leisure -1.0774 0.2984 -3.61 0.0004Bring/Get -1.1912 0.2603 -4.58 <.0001Tour -1.8288 0.3111 -5.88 <.0001Other -1.0303 0.3130 -3.29 0.0011Sleep -0.8090 0.2482 -3.26 0.0013In home -0.9914 0.2260 -4.39 <.0001
Transport mode Car . . . .Public transport 0.4732 0.4587 1.03 0.3032Slow mode -0.0209 0.1588 -0.13 0.8952No transport -0.0948 0.1116 -0.85 0.3964
Schedule Attributes Total # Activities -0.0298 0.0131 -2.27 0.0237Total Activity Duration 0.0032 0.0061 0.52 0.6040Weekday
Monday 0.5896 0.1384 4.26 <.0001Tuesday 0.2558 0.1285 1.99 0.0476Wednesday 0.4281 0.1305 3.28 0.0012Thursday 0.2287 0.1278 1.79 0.0747Friday 0.2509 0.1272 1.97 0.0496Saturday -0.1058 0.1238 -0.85 0.3934Sunday . . . .
Individual Attributes Gender -0.2486 0.4721 -0.53 0.5989Age 0.0115 0.0218 0.53 0.5983Driving License -0.1164 0.5527 -0.21 0.8334Transit Pass 0.2033 0.4461 0.46 0.6490Disabled -2.0393 1.4624 -1.39 0.1644
van Bladel, Bellemans, Janssens and Wets
20
Education Primary school . . . .General junior high 1.2613 1.4394 0.88 0.3817Technical junior high 2.1307 1.5574 1.37 0.1725General high school 4.1361 1.3503 3.06 0.0024Technical high school 3.8405 1.3185 2.91 0.0039College 4.2128 1.2843 3.28 0.0012University 3.9207 1.3737 2.85 0.0047
Income <750€ . . . .750-1250€ 0.6451 0.8002 0.81 0.42081250-1750€ 0.3890 0.7624 0.51 0.61031750-2250€ 0.4550 0.9098 0.50 0.61742250-2750€ 1.0261 1.0359 0.99 0.3228>2750€ 0.4438 1.2774 0.35 0.7285
Occupation Not working . . . .Working 0.4186 0.6113 0.68 0.4941Student -0.0391 1.6579 -0.02 0.9812
Household Attributes Household size -0.0559 0.1493 -0.37 0.7084# Children in the household 0.2515 0.2417 1.04 0.2992Partner -0.5277 0.4891 -1.08 0.2816Random Effects ui 7.3908 0.9922 7.45 <.0001
van Bladel, Bellemans, Janssens and Wets
21
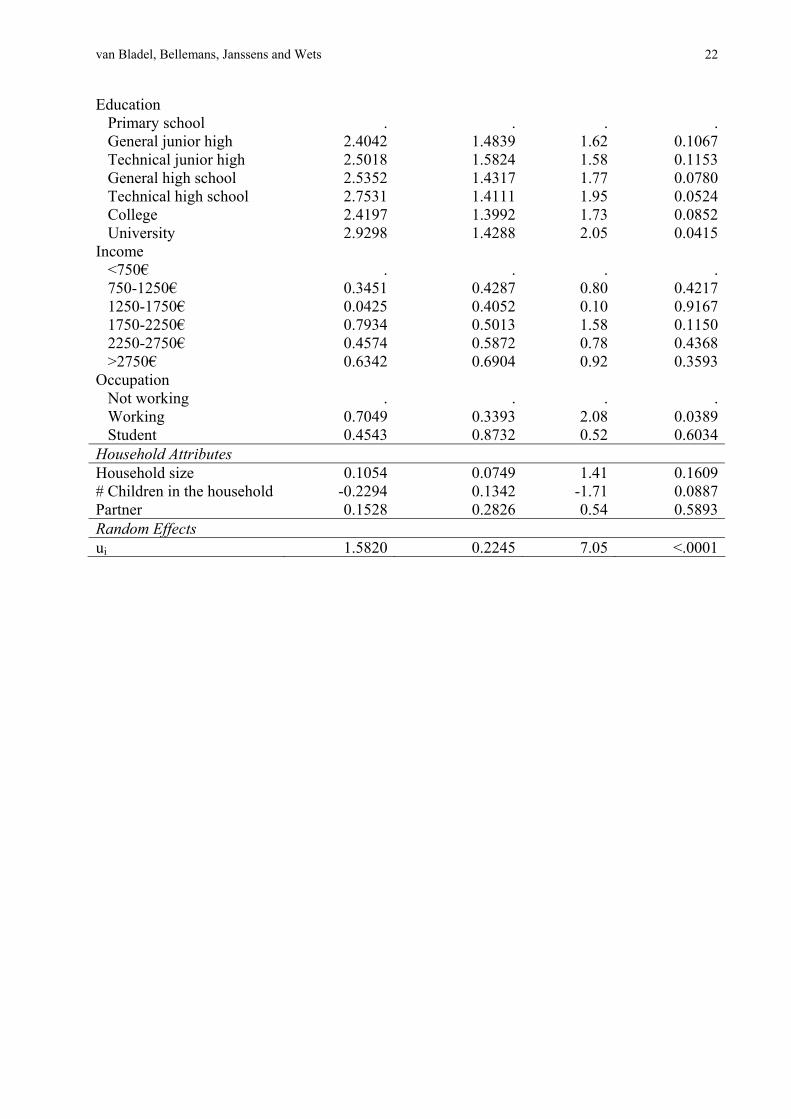
TABLE 4 Estimation Results of the Mixed Logit Model for Rescheduling Parameter Estimate Standard Error t-value ProbabilityIntercept -3.8068 1.6137 -2.36 0.0192Activity Attributes Start time 0.0299 0.0055 5.39 <.0001Duration 0.1404 0.0158 8.90 <.0001Accompanying persons -0.0017 0.0113 -0.15 0.8837Accompanying partner 0.0332 0.0827 0.40 0.6880Accompanying child 0.0791 0.1003 0.79 0.4312Accompanying other 0.3500 0.1165 3.00 0.0030Activity type
Work . . . .Services 0.6318 0.2505 2.52 0.0124Eat 0.8220 0.2691 3.05 0.0025Daily shopping 0.7238 0.2357 3.07 0.0024Non-daily shopping 1.0486 0.3137 3.34 0.0010Education 0.7640 0.4703 1.62 0.1057Social activities 1.0563 0.2785 3.79 0.0002Leisure 0.6223 0.2867 2.17 0.0311Bring/Get 0.2635 0.2093 1.26 0.2094Tour 0.9185 0.3075 2.99 0.0031Other 0.7249 0.3166 2.29 0.0230Sleep 0.0866 0.1860 0.47 0.6420In home 0.5800 0.1733 3.35 0.0010
Transport mode Car . . . .Public transport 0.0287 0.3079 0.09 0.9259Slow mode 0.3156 0.1413 2.23 0.0265No transport -0.9023 0.1155 -7.81 <.0001
Schedule Attributes Total # Activities -0.0099 0.0130 -0.76 0.4457Total Activity Duration -0.0003 0.0044 -0.06 0.9512Weekday
Monday -0.3960 0.1310 -3.02 0.0028Tuesday -0.2381 0.1301 -1.83 0.0686Wednesday -0.3686 0.1285 -2.87 0.0045Thursday -0.3487 0.1277 -2.73 0.0069Friday -0.2111 0.1313 -1.61 0.1093Saturday 0.0490 0.1346 0.36 0.7160Sunday . . . .
Individual Attributes Gender 0.3085 0.2705 1.14 0.2554Age 0.0144 0.0120 1.21 0.2285Driving License -0.0388 0.3139 -0.12 0.9017Transit Pass -0.4115 0.2470 -1.67 0.0972Disabled 0.5215 0.9055 0.58 0.5653
van Bladel, Bellemans, Janssens and Wets
22
Education Primary school . . . .General junior high 2.4042 1.4839 1.62 0.1067Technical junior high 2.5018 1.5824 1.58 0.1153General high school 2.5352 1.4317 1.77 0.0780Technical high school 2.7531 1.4111 1.95 0.0524College 2.4197 1.3992 1.73 0.0852University 2.9298 1.4288 2.05 0.0415
Income <750€ . . . .750-1250€ 0.3451 0.4287 0.80 0.42171250-1750€ 0.0425 0.4052 0.10 0.91671750-2250€ 0.7934 0.5013 1.58 0.11502250-2750€ 0.4574 0.5872 0.78 0.4368>2750€ 0.6342 0.6904 0.92 0.3593
Occupation Not working . . . .Working 0.7049 0.3393 2.08 0.0389Student 0.4543 0.8732 0.52 0.6034
Household Attributes Household size 0.1054 0.0749 1.41 0.1609# Children in the household -0.2294 0.1342 -1.71 0.0887Partner 0.1528 0.2826 0.54 0.5893Random Effects ui 1.5820 0.2245 7.05 <.0001