actuarial valuation report - your pension service · actuarial valuation report lancashire county...
TRANSCRIPT

H E A L T H W E A L T H C A R E E R
ACTUARIALVALUATION
REPORT
LANCASHIRE COUNTYPENSION FUND
AS AT 31 MARCH 2016

A C T U A R I A L V A L U A T I O N A S A T 3 1 M A R C H 2 0 1 6 L A N C A S H I R E C O U N T YP E N S I O N F U N D
M E R C E R ii
CONTENTS
1. Introduction 1
2. Funding Strategy – Key Elements 2
3. Key results of the funding assessment 3· Solvency funding position 3· Primary contribution rate 4· Correcting the shortfall – secondary contribution rate 4
4. Experience since last valuation 5· Summary of key inter-valuation experience 5· Reasons for the change in funding position since the last actuarial valuation 6
5. Cashflows, risks and alternative funding positions 7· Benefit cashflows 7· Projected funding position at next actuarial valuation 8· Material risks faced by the Fund 8· Sensitivity of funding position to changes in key assumptions 8· Minimum risk funding position 9
APPENDICES
A. Assumptions 11· How the benefits are valued 11· Financial assumptions used to calculate the funding target 12· Demographic assumptions used 12· Assumptions used to calculate the primary contribution rate 15
B. Summary membership data 17C. Assets 18D. Scheme benefits 19E. Summary of income and expenditure 20F. Analysis of membership experience 21G. Rates and adjustments certificate issued in accordance with Regulation 62 22
· Primary contribution rate 22· Secondary contribution rate 22· Contribution amounts payable 22· Further adjustments 22· Regulation 62(8) 23
H. Schedule to the rates and adjustments certificate dated 31 March 2017 24I. Glossary 44

A C T U A R I A L V A L U A T I O N A S A T 3 1 M A R C H 2 0 1 6 L A N C A S H I R E C O U N T YP E N S I O N F U N D
M E R C E R 1
1INTRODUCTION
This report is addressed to the Administering Authority of the Lancashire County Pension Fund(“the Administering Authority”) and is provided to meet the requirements of Regulation 62 of theLocal Government Scheme Regulations 2013 (as amended) (“the Regulations”). It describes thefactors considered by the Administering Authority when carrying out the actuarial valuation as at 31March 2016 and the decisions reached as a result.
The purpose of the actuarial valuation is for the Administering Authority to determine:
· The expected cost of providing the benefits built up by members at the valuation date (the“liabilities”), and compare this against the funds held by the Fund (the “assets”).
· The contributions needed to cover the cost of the benefits that active members will build up inthe future and other costs incurred in running the Fund (the ‘Primary Contribution Rate’).
· An appropriate plan for making up the shortfall if the Fund has less assets than liabilities. Thisplan will cover the amounts which will need to be paid (the ‘Secondary Contribution Rate’) andthe timeframe over which they will be paid (‘the Recovery Period’).
This report uses various technical terms. These are explained in more detail in the explanatory boxes whichappear throughout this report, and in the Glossary at Appendix I.
This report has been prepared in accordance with the version of the Pensions Technical Actuarial Standard current atthe date this report is signed. It also complies with the relevant requirements of Technical Actuarial Standards R:Reporting Actuarial Information, D: Data and M: Modelling, where they apply to this report. These Standards are allissued by the Financial Reporting Council. The calculations referred to in the report use methods and assumptionsappropriate for reviewing the financial position of the Fund and determining a contribution rate for the future. Mercer doesnot accept liability to any third party in respect of this report; nor do we accept liability to the Administering Authority if theinformation provided in this report is used for any purpose other than that stated. The report may be disclosed tomembers and others who have a statutory right to see it. It may also be disclosed to any participating employer and, ifthe Administering Authority and Mercer consent, it may be disclosed to other third parties.
S I G N A T U R E
N A M E John Livesey Mark Wilson
Q U A L I F I C A T I O N Fellow of the Institute andFaculty of Actuaries
Fellow of the Institute andFaculty of Actuaries
D A T E 31 March 2017

A C T U A R I A L V A L U A T I O N A S A T 3 1 M A R C H 2 0 1 6 L A N C A S H I R E C O U N T YP E N S I O N F U N D
M E R C E R 2
2FUNDING STRATEGY – KEY ELEMENTS
Fundamental to the valuation results is the funding strategyadopted by the Fund. This funding strategy is set out in a specificdocument (the Funding Strategy Statement or FSS for short) whichis one of the Administering Authority’s key governance documentsfor the Fund. In essence, the FSS sets out an overview of theapproach to be used for the actuarial valuation. Amongst otherthings it outlines the assumptions, both economic anddemographic, to be used in calculating the value of the liabilitiesbuilt up and the contributions required to correct any fundingshortfall, and the contribution rate required to fund the benefits forfuture service. It also sets out the strategy for making good anyfunding shortfall, in particular how any shortfall is expected to befinanced in terms of the balance between future contributions andfuture investment returns, and the period over which any shortfall is expected to be recovered.
The principal elements of the funding strategy adopted for this actuarial valuation are as follows:
• Assumed rate of future CPI inflation – 2.2% p.a., based on the yields available on gilts andindex-linked gilts of appropriate duration less an adjustment of 1% p.a. to allow for thedifference between market-implied future RPI and estimated future CPI inflation.
• Real investment returns over and above CPI for past service – 2.2% p.a., based on theanticipated real returns achievable on the Fund’s expected long-term investment strategy witha suitable margin for prudence.
• Real investment returns over and above CPI for future service – 2.75% p.a., based on theanticipated real returns achievable on future invested contributions.
• Future pay growth – 1% p.a. over the 4 years to April 2020, taking into account thegovernment’s policy on pay restraint in the public sector, and then 1.5% p.a. over and aboveCPI in the longer term.
• Baseline life expectancy based on a scheme-specific mortality study.
• Future mortality improvements based on the CMI 2015 model with a long-term improvementtrend of 1.5% p.a.
• An average recovery period for making good any shortfall of approximately 16 years. TheFSS sets out the circumstances in which this might vary from one employer to another.
The FSS is the AdministeringAuthority’s key governancedocument in relation to the
actuarial valuation. It sets outthe funding policies adopted, theactuarial assumptions used, and
the timescales over whichdeficits will be paid off.
Employers are consulted aboutthe FSS as part of the actuarial
valuation process.

A C T U A R I A L V A L U A T I O N A S A T 3 1 M A R C H 2 0 1 6 L A N C A S H I R E C O U N T YP E N S I O N F U N D
M E R C E R 3
3KEY RESULTS OF THE FUNDINGASSESSMENT
SO L VENCY FUNDING PO SIT IONThe table below compares the assets and liabilities of the Fund at 31 March 2016. Figures are alsoshown for the last valuation as at 31 March 2013 for comparison.
The liability value at 31 March 2016 shown in the table above isknown as the Fund’s “solvency funding target”. The solvencyfunding target is calculated using assumptions that theAdministering Authority has determined are appropriate havingconsulted with the actuary, and are also set out in theAdministering Authority’s Funding Strategy Statement (FSS).
The chart shows that at 31 March 2016 there was a shortfall of£690m against the Fund’s solvency funding target. Analternative way of expressing the position is that the Fund’sassets were sufficient to cover 90% of its liabilities – thispercentage is known as the solvency funding level of the Fund.
At the previous valuation at 31 March 2013 the shortfall was£1,377m, equivalent to a solvency funding level of 78%. Thekey reasons for the changes between the two valuations areconsidered in Section 4.
2,860 3,096
1,0881,305
2,4402,325
5,0116,036
78% 90%
0
1,000
2,000
3,000
4,000
5,000
6,000
7,000
8,000
Assets£5,011m
Liabilities£6,388m
Assets£6,036m
Liabilities£6,726m
£ m
Pensioners Deferreds Actives Assets
31 MARCH 2013 31 MARCH 2016Solvency funding level Solvency funding level
The LGPS Regulations require thecontributions to be set so as tosecure the Fund’s solvency andlong-term cost efficiency. In this
context solvency means being ableto meet the liabilities as and when
they arise, with long-term costefficiency meaning that contribution
levels should not be set so as togive rise to additional costs at a
later date. In practice, contributionlevels have been set so as to targeta solvency funding level of 100%,based on the funding parameters
outlined in Section 2 above.

A C T U A R I A L V A L U A T I O N A S A T 3 1 M A R C H 2 0 1 6 L A N C A S H I R E C O U N T YP E N S I O N F U N D
M E R C E R 4
Further details of the way in which the solvency funding target has been calculated are set out inAppendix A.
PRI MARY CONT RIBUT ION RATEThe valuation looks at the normal employer contribution raterequired to cover the cost of the benefits (including deathbenefits and expenses) that will be built up over the yearafter the valuation date (the “Primary Contribution Rate”). Asummary of the assumptions used is provided in Appendix A.
The table below gives a breakdown of the PrimaryContribution Rate at 31 March 2016 and also shows thecorresponding rate at 31 March 2013 for comparison. In calculating the average PrimaryContribution Rate in 2016 we have not made any allowance for future members to opt for the 50:50scheme.
Active members pay contributions to the Fund as a condition of membership in line with the ratesrequired under the governing Regulations (see Appendix D).
% of Pensionable PayPRIMARY CONTRIBUTION RATE* 31 March 2016 31 March 2013Normal Contribution rate for retirement and death benefits 20.8 19.1Allowance for administrative expenses 0.5 0.4Total normal contribution rate 21.3 19.5Average member contribution rate 6.4 6.4Primary contribution rate* 14.9 13.1
* In line with updated CIPFA guidance, the 2016 Primary Contribution Rate is the weighted average of the individual employer PrimaryContribution Rates as derived based on their individual circumstances (e.g. whether or not they are closed to new entrants).
CORRECTING THE SHO RT FALL – SECONDARY CONTRIBUT ION RATEThe funding objective as set out in the FSS is to achieve and maintain a solvency funding level of100% of liabilities (the solvency funding target). In line with the FSS, where a shortfall exists at theeffective date of the valuation a deficit recovery plan will be put in place which requires additionalcontributions to correct the shortfall (or contribution reductions to refund any surplus).
The FSS sets out the process for determining the recoveryplan in respect of each employer. At this actuarial valuationthe average deficit recovery period adopted is approximately16 years, and the total initial recovery payment (the“Secondary rate” for 2017/18) is approximately £41.5m perannum in £ terms (which also includes allowance for someemployers to phase in any increases).
The “Primary rate” of the employers’contribution is the contribution rate
required to meet the cost of the futureaccrual of benefits including ancillary,death in service and ill health benefits
together with administration costs.
The “Secondary rate” of theemployers’ contribution is an
adjustment to the Primary rate toreflect any past service deficit orsurplus, to arrive at the rate theemployers are required to pay.

A C T U A R I A L V A L U A T I O N A S A T 3 1 M A R C H 2 0 1 6 L A N C A S H I R E C O U N T YP E N S I O N F U N D
M E R C E R 5
4EXPERIENCE SINCE LAST VALUATION
SUMMARY OF KEY I NTER -VAL UAT ION EX PERI ENCEThe last actuarial valuation was carried out with an effective date of 31March 2013. With effect from 1 April 2014 the scheme’s benefitstructure changed from a Final Salary Scheme to a Career AverageRevalued Earnings (CARE) Scheme, and the 2013 actuarial valuationtook these changes into account.
The average Pensionable Salary increase for the Fund members whowere in service for the whole of the inter-valuation period was 2.1% perannum.
Pensions in payment (in excess of Guaranteed Minimum Pensions(GMPs)) were increased as guaranteed under the Fund as follows:
· April 2014 2.7%· April 2015 1.2%· April 2016 0%
Over the intervaluation period, benefit inflation has averaged 1.3% p.a. Over the three years to 31March 2016 the gross investment return on the Fund’s assets has averaged 7.9% per annum,meaning that the average real return has been about 6.6% p.a.
The outcomes from thevaluation are determinedboth by the assumptions
adopted for the future, andthe Fund’s historic
experience relative toassumptions made in thepast. In this section we
consider the effect of theFund’s experience over the
last three years.

A C T U A R I A L V A L U A T I O N A S A T 3 1 M A R C H 2 0 1 6 L A N C A S H I R E C O U N T YP E N S I O N F U N D
M E R C E R 6
REASONS FO R THE CHANG E IN FUNDING POSIT ION S INCE THE L ASTACT UARI AL VALUAT IO NThe shortfall at the last valuation date was £1,377m. The chart below sets out the main reasons forthe change in the shortfall between 31 March 2013 and 31 March 2016.
-690
-138
56
191
94
175
-68
61
524
-208
-1,377
-1,500 -1,000 -500 0 500 1,000
Shortfall at 31 March 2016
Member movements and other factors
Leavers
Assumed short term pay growth (1% pa for 4 years)
Change in demographic assumptions
Pension and deferred increases vs 2013 assumptions
Salary increases vs 2013 assumpton
Total contributions paid vs benefits accruing
Investment return vs 2013 assumption
Unwinding of deficit interest
Shortfall at 31 March 2013
£m

A C T U A R I A L V A L U A T I O N A S A T 3 1 M A R C H 2 0 1 6 L A N C A S H I R E C O U N T YP E N S I O N F U N D
M E R C E R 7
5CASHFLOWS, RISKS AND ALTERNATIVEFUNDING POSITIONS
BENEFIT CASHFLOW SThe projected benefit cashflows which result from applying thepast service assumptions as set out in Section 2 are shown in thechart below. The additional red elements sets out how thoseprojected benefit cashflows would change if we were to assumeinflation of 0.25% p.a. higher than the assumption of 2.2% p.a.used for the actuarial valuation. Over the 20 years following thevaluation date, the extra benefit payments which would result fromthe extra 0.25% p.a. inflation assumption are projected to be£150m.
The actuarial valuation processis principally concerned with
projecting all the benefitcashflows into the future, and
then converting them intocurrent day values by
discounting them to allow forassumed future investment
returns. The chart shows thoseprojected cashflows, and alsoillustrates how sensitive they
are to the future inflationassumption.
200
250
300
350
400
450
2016
2017
2018
2019
2020
2021
2022
2023
2024
2025
2026
2027
2028
2029
2030
2031
2032
2033
2034
2035
£m
Projected benefit cashflows
Impact of +0.25%pa. inflationProjectedcashflows

A C T U A R I A L V A L U A T I O N A S A T 3 1 M A R C H 2 0 1 6 L A N C A S H I R E C O U N T YP E N S I O N F U N D
M E R C E R 8
PROJ ECTED FUNDI NG PO SIT ION AT NEXT ACTUARI AL VALUAT IONAs part of this valuation, the Administering Authority has set an average recovery plan to pay offthe shortfall of approximately 16 years. The next actuarial valuation will take place with an effectivedate of 31 March 2019. If experience up to that date is in line with the assumptions made for thiscurrent actuarial valuation and contributions are paid at the agreed rates or amounts, the shortfallat 31 March 2019 would be £646m, equivalent to a funding level of 91%.
MAT ERI AL RI SKS FACED BY T HE FUNDThe Fund is subject to some potentially material risks that are, to an extent, outside theAdministering Authority’s control, but could affect the funding level. Any material worsening of thefunding level will mean more contributions are needed (either at an increased rate or at the samerate over a longer period) to be able to provide the benefits built up in the Fund – unlessexperience acts in other ways to improve the funding level. Examples of such risks, and how theAdministering Authority manages them, are:
· If an Employer becomes unable to pay contributions or to make good deficits in the future, theFund’s assets will be lower than expected and the funding level will be worse than expected.The Administering Authority regularly monitors the financial strength of the Employers so thatactions can be taken to mitigate (but not fully remove) the risk.
· If future investment returns on assets are lower than assumed in the valuation, the Fund’sassets will be lower, and the funding level worse, than expected. The Administering Authorityhas a process in place to monitor investment performance quarterly, and it reviews the Fund’sinvestment strategy alongside each actuarial valuation.
· If improvements in life expectancy are greater than assumed, the cost of benefits will increasebecause members are living longer than expected. This will mean the funding level will beworse than expected. The Administering Authority regularly reviews the Fund’s experience andensures that the assumptions it makes about members’ life expectancy take the most recentinformation available into account.
· If members make decisions about their options which increase the Fund’s liabilities, the fundinglevel will be worse than expected. An example would be if members commute less possiblepension for cash, than is being assumed. The Administering Authority reviews the Fund’sexperience at each valuation to ensure that their treatment of member options remainsappropriate.
SENSIT IV ITY OF FUNDI NG PO SIT ION TO CHANGES I N KEYASSUMPTIONSThe value placed on the Fund’s liabilities is critically dependent on the assumptions used to carryout the calculations. If future experience differs from the assumptions the Administering Authorityhas used after consulting with the Employers, then the projected future funding level will bedifferent from the level described above.

A C T U A R I A L V A L U A T I O N A S A T 3 1 M A R C H 2 0 1 6 L A N C A S H I R E C O U N T YP E N S I O N F U N D
M E R C E R 9
To illustrate how sensitive the funding level is to experience being different from assumed, thetable below shows how the valuation results at 31 March 2016 would have differed given smallchanges in the key assumptions.
ASSUMPTION CHANGE
CHANGE INSHORTFALL AT31 MARCH 2016
(£M)
RESULTANTSHORTFALL AT31 MARCH 2016
(£M)Original solvency funding position - 690
Real investment return 0.25% lower than assumed 297 987
Pensionable Salary growth 0.25% higher than assumed 51 741
Members live one year longer than assumed 160 850
Growth assets fall by 25% 1,119 1,809
MI N I MUM RISK FUNDI NG POSIT IONIn assessing the value of the Fund’s liabilities (the funding target), allowance has been made forinvestment returns as described in Appendix A, taking into account the investment strategyadopted by the Fund, as set out in the Fund’s Investment Strategy Statement (ISS).
It is not possible to construct a portfolio of investments which produces a stream of income exactlymatching the expected liability outgo. However, it is possible to construct a portfolio which closelymatches the liabilities and represents the minimum risk investment position. Such a portfolio wouldconsist mainly of a mixture of long-term index-linked and fixed interest gilts. Investment of theFund’s assets in line with the minimum risk portfolio would minimise fluctuations in the Fund’songoing funding level between successive actuarial valuations.
If, at the valuation date, the Fund had been invested in this portfolio, then in carrying out thevaluation it would not be appropriate to make any allowance for out-performance of the Fundinvestments. In this event the value of the liabilities would have increased substantially, to£10,249m, and the funding level would have reduced correspondingly to 59%. If the actuarialassumptions are borne out in practice, the projected funding level on this basis at the next actuarialvaluation would be slightly lower at 57%.
The value of the liabilities on the solvency funding target assumptions was £6,726m, which is£3,523m less than the value on the minimum risk basis. The funding plan is therefore makingallowance for future investment returns of £3,523m over and above those available from theminimum risk investment portfolio.

A C T U A R I A L V A L U A T I O N A S A T 3 1 M A R C H 2 0 1 6 L A N C A S H I R E C O U N T YP E N S I O N F U N D
M E R C E R 10
APPENDICES

A C T U A R I A L V A L U A T I O N A S A T 3 1 M A R C H 2 0 1 6 L A N C A S H I R E C O U N T YP E N S I O N F U N D
M E R C E R 11
AASSUMPTIONS
HOW THE BENEFITS ARE VAL UEDIn order to calculate the liabilities, there is a need to make assumptions about various factors thataffect the cost of the benefits provided by the Fund – for example, how long members will live, orthe future level of inflation. The table below explains the key assumptions being made in thevaluation.
ASSUMPTION WHY IT IS IMPORTANT AND HOW IT IMPACTS ON THE LIABILITIES
Discount rate The majority of benefits in a pension fund are paid many years in the future.In the period before the benefits are paid, the Administering Authority investthe funds held by the fund with the aim of achieving a return on those funds.When calculating how much money is needed now to make these benefitpayments, it is appropriate to make allowance for the investment return thatis expected to be earned on these funds. This is known as “discounting”.The higher the investment return achieved, the less money needs to be setaside now to pay for benefits. The calculation reflects this by placing a lowervalue on the liabilities if the “discount rate” is higher.
Inflation Pensions in payment increase in line with price inflation. Salary growth isalso normally linked to price inflation in the long term. A higher inflationassumption will, all other things being equal, lead to a higher value beingplaced on the liabilities.
Pensionable Salary growth Benefits earned prior to 1 April 2014 for active members are based on theirsalaries immediately before retirement, so it is necessary to make anassumption about future Pensionable Salary growth. The higher thisassumption, the higher the value placed on the liabilities for activemembers.
Life expectancy Pensions are paid while the member (and potentially their spouse orpartner) is alive. The longer people live, the greater is the cost of providinga pension. Allowing for longer life expectancy therefore increases theliabilities.

A C T U A R I A L V A L U A T I O N A S A T 3 1 M A R C H 2 0 1 6 L A N C A S H I R E C O U N T YP E N S I O N F U N D
M E R C E R 12
The liabilities of the Fund are calculated projecting forward all of the future benefit cashflows anddiscounting them back to the effective date of the valuation, using these assumptions. Forexample, the liability for a single pensioner is calculated by estimating the amount of each pensionpayment they will receive in the future, multiplying by the probability that the member will still bealive by the date of each payment, and then discounting each payment back to the effective date ofthe valuation; and then summing up all of these discounted amounts. The liabilities for the wholeFund are calculated by summing the liabilities for each of the individual members.
F I NANCI AL ASSUMPTIO NS USED TO CALCULAT E THE FUNDI NG TARG ET
The table below summarises the key financial assumptions used in the calculation of the fundingtarget and those used for the 31 March 2013 actuarial valuation.
FINANCIAL ASSUMPTIONS 31 March 2016 31 March 2013Discount rate 4.40% p.a. 4.80% p.a.Price inflation (CPI) 2.2% p.a. 2.6% p.a.Salary increases (short term) 1% p.a. for 4 years 1% p.a. for 3 yearsSalary increases (long term) 3.7% p.a. 4.1% p.a.Pension increases in payment: 2.2% p.a. 2.6% p.a.
DEMOG RAPHIC ASSUMPTIO NS USED
Post-retirement Mortality
Mortality (or life expectancy) tables are typically made up of three elements: a baseline table(equivalent to the expected current mortality), an allowance for future improvements, and a marginfor prudence. Very few pension funds are largeenough for them to be able to determine abespoke set of baseline assumptions basedpurely on the scheme’s own membershipexperience. Typically, the life expectancyassumptions are set by benchmarking a fund’smembership profile and mortality experienceagainst larger external datasets. For thisactuarial valuation, we have benchmarked thefund’s membership profile and experienceagainst the “S2 tables” published by the CMI.We have applied weightings and age ratings asappropriate to adjust the standard tables so asto arrive at assumptions which are appropriatefor the Fund. We have generally used theS2PA tables, other than for female dependantswhere the S2DA tables have been used. At the2013 actuarial valuation the S1PA tables wereused (S1DA tables for future female dependants).
There are two separate decisions on mortalityassumptions:
– The baseline table for the current rates ofmortality; and
– The allowance for future improvements.
BaselineLife expectancy today
Future ChangesHow things may change
Measured by LGPS-wide and fund-specific
study
More uncertain andsubjective
PrudenceMargin for uncertainty
A C T U A R I A L V A L U A T I O N A S A T 3 1 M A R C H 2 0 1 6 L A N C A S H I R E C O U N T YP E N S I O N F U N D
M E R C E R 13
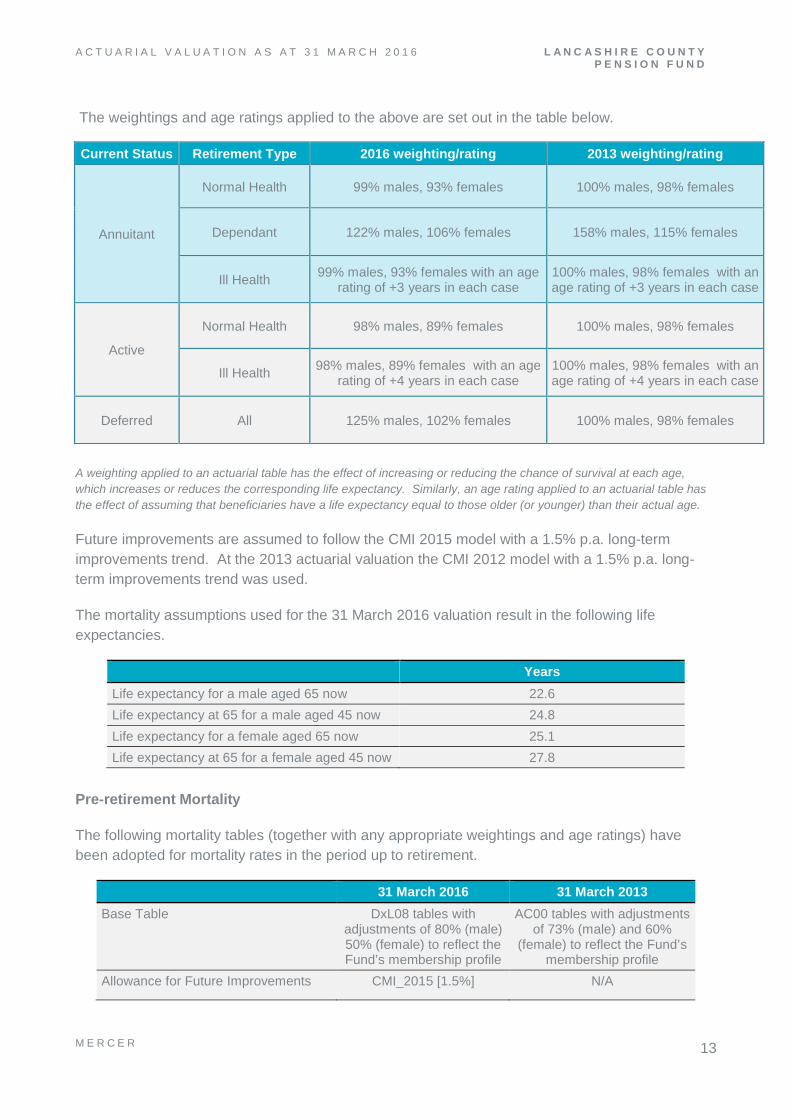
The weightings and age ratings applied to the above are set out in the table below.
A weighting applied to an actuarial table has the effect of increasing or reducing the chance of survival at each age,which increases or reduces the corresponding life expectancy. Similarly, an age rating applied to an actuarial table hasthe effect of assuming that beneficiaries have a life expectancy equal to those older (or younger) than their actual age.
Future improvements are assumed to follow the CMI 2015 model with a 1.5% p.a. long-termimprovements trend. At the 2013 actuarial valuation the CMI 2012 model with a 1.5% p.a. long-term improvements trend was used.
The mortality assumptions used for the 31 March 2016 valuation result in the following lifeexpectancies.
YearsLife expectancy for a male aged 65 now 22.6Life expectancy at 65 for a male aged 45 now 24.8Life expectancy for a female aged 65 now 25.1Life expectancy at 65 for a female aged 45 now 27.8
Pre-retirement Mortality
The following mortality tables (together with any appropriate weightings and age ratings) havebeen adopted for mortality rates in the period up to retirement.
31 March 2016 31 March 2013Base Table DxL08 tables with
adjustments of 80% (male)50% (female) to reflect theFund’s membership profile
AC00 tables with adjustmentsof 73% (male) and 60%
(female) to reflect the Fund’smembership profile
Allowance for Future Improvements CMI_2015 [1.5%] N/A
Current Status Retirement Type 2016 weighting/rating 2013 weighting/rating
Annuitant
Normal Health 99% males, 93% females 100% males, 98% females
Dependant 122% males, 106% females 158% males, 115% females
Ill Health 99% males, 93% females with an agerating of +3 years in each case
100% males, 98% females with anage rating of +3 years in each case
Active
Normal Health 98% males, 89% females 100% males, 98% females
Ill Health 98% males, 89% females with an agerating of +4 years in each case
100% males, 98% females with anage rating of +4 years in each case
Deferred All 125% males, 102% females 100% males, 98% females

A C T U A R I A L V A L U A T I O N A S A T 3 1 M A R C H 2 0 1 6 L A N C A S H I R E C O U N T YP E N S I O N F U N D
M E R C E R 14
Commutation
It has been assumed that, on average, 50% ofretiring members will take the maximum tax-freecash available at retirement and 50% will take a3/80ths cash sum (the standard for pre April 2008service). The members have the option to commutepart of their pension at retirement in return for a lumpsum at a rate of £12 cash for each £1 per annum ofpension given up.
Early retirement
For those members who are entitled to receive their accrued benefits (or partof those benefits) prior to the Fund’s normal pension age, a proportion of theactive membership is assumed to retire in normal health prior to age 65, asset out below:
% retiring perannum
% retiring perannum
Age Males Females60 10 2061 8 1562 8 1563 8 1564 8 1565 100 100
The appropriate early retirement factors applied to the relevant tranche of benefits are in line withGAD guidance.
Ill health retirement
A small proportion of the active membership has been assumed to retireowing to ill health. As an example of the rates assumed, the following is anextract from the decrement table used:
% retiring perannum
% retiring perannum
Age Males Females35 0.03 0.0345 0.08 0.0855 0.35 0.31
The level of ill-healthretirement benefit
provided for a memberfalls into one of three“tiers”, depending on
whether and when themember might be
expected to resumegainful employment.
Tier 1, for example, ison the basis that themember is unlikely to
be able to do so beforeNormal Pension Age.Full details are set out
in the LGPSRegulations.
Retirement lump sums are less costly for theFund to provide than the alternative pension, as
members receive only £12 of each £1 p.a. ofpension given up. If members take the cashsum option at a higher rate than has beenassumed then this will normally lead to an
improvement in the funding level.
If members take earlyretirement to a greaterextent than has beenassumed then this will
typically lead to aworsening of the
funding level. This isbecause many
members are able totake substantial partsof their benefits fromage 60 without them
being reduced for earlypayment.

A C T U A R I A L V A L U A T I O N A S A T 3 1 M A R C H 2 0 1 6 L A N C A S H I R E C O U N T YP E N S I O N F U N D
M E R C E R 15
The proportion of ill health early retirements falling into each tier category has been assumed to beas set out below:
Tier 1 Tier 2 Tier 3Males & Females 75% 12.5% 12.5%
Withdrawal
This assumption relates to those members who leave the schemewith an entitlement to a deferred pension or transfer value. It hasbeen assumed that active members will leave the Scheme at thefollowing sample rates:
% leaving per annum % leaving per annumAge Males Females25 20.25 22.3835 5.09 6.2745 2.54 3.89
Partners’ and Dependants’ Proportions
It has been assumed that the proportions of members below will on deathgive rise to a dependant’s pension (spouse’s and partner’s), and thatspouses/partners of female (male) members are three years older(younger), on average than the member.
ASSUMPTIONS USED TO CALCUL ATE THE PRI MAR Y CO NTRIBUT IONRATE
The cost of future accrual (normal cost) has been calculated using the same actuarial assumptionsas used to calculate the funding target and recovery plan as set out above except that the financialassumptions adopted are as described below.
The financial assumptions for assessing the future service contribution rate should take account ofthe fact that contributions will be invested in market conditions applying at future dates, which areunknown at the effective date of the valuation, and which are not directly linked to marketconditions at the valuation date.
% spouse/partner % spouse/partnerAge Males Females25 43 4635 69 6045 72 6055 74 6065 76 55
In relation to pre 2014benefits, deferred benefits
tend to be less costly for theFund to provide than if the
member had remained in theFund until retirement. If thenumber of members leaving
the Fund is greater thanexpected then this will typicallylead to a slight improvement in
the funding level.
If more members thanassumed have
partners then this willlead to an increase in
the number ofdependants pensionscoming into paymentover and above that
expected. This wouldlead to a worsening of
the funding level.

A C T U A R I A L V A L U A T I O N A S A T 3 1 M A R C H 2 0 1 6 L A N C A S H I R E C O U N T YP E N S I O N F U N D
M E R C E R 16
The financial assumptions in relation to future service (i.e. the normal cost) are not specificallylinked to investment conditions as at the valuation date itself, and are based on an overallassumed real return (i.e. return in excess of price inflation) of 2.75% per annum. This represents areduction of 0.25% per annum compared to the 2013 valuation, which increases the estimated costof providing LGPS benefits. With a long term average assumption for price inflation of 2.2% perannum, this gives rise to an overall discount rate of 4.95% p.a. (the corresponding discount rate atthe 2013 actuarial valuation was 5.6% p.a.).

A C T U A R I A L V A L U A T I O N A S A T 3 1 M A R C H 2 0 1 6 L A N C A S H I R E C O U N T YP E N S I O N F U N D
M E R C E R 17
BSUMMARY MEMBERSHIP DATA
The membership data is summarised in the table, with figures at the previous valuation shown forcomparison.
Data in relation to members of the Fund were supplied by the Funding administrator on behalf ofthe Administering Authority. The accuracy of the data provided has been relied on. Whilereasonableness checks on the data have been carried out, they do not guarantee thecompleteness or the accuracy of the data. Consequently Mercer does not accept any liability inrespect of its advice where it has relied on data that is incomplete or inaccurate.
31 March 2016 31 March 2013
Active members
Number 51,613 51,439
Total Pensionable Salaries (£000s p.a.) 860,203 854,743
Average Pensionable Salary (£ p.a.) 16,666 16,617
Average age (pension weighted) 49.6 49.2
Deferred pensioners
Number 65,940 52,039
Total deferred pensions revalued to valuation date(£000s p.a.) 76,171 60,697
Average deferred pension (£ p.a.) 1,155 1,166
Average age (pension weighted) 48.9 48.3
Pensioners
Number 44,537 41,115
Total pensions payable (£000s p.a.) 202,082 184,005
Average pension (£ p.a.) 4,537 4,475
Average age (pension weighted) 70.4 69.6
The above pensioner figures include current dependant pensioners.

A C T U A R I A L V A L U A T I O N A S A T 3 1 M A R C H 2 0 1 6 L A N C A S H I R E C O U N T YP E N S I O N F U N D
M E R C E R 18
CASSETS
The market value of the Fund’s assets was £6,036,200,000 on the valuation date.
The Administering Authority’s investment strategy is to proportion the Fund’s assets by asset classas shown in the table below. The actual distribution of assets will vary over time due to changes infinancial markets. The table also shows the distribution of assets at the valuation date.
INVESTMENTSTRATEGY
ACTUAL MARKET VALUE OF ASSETSAT 31 MARCH 2016
% £000s %
Global equities 40% - 60%
Equities - UK quoted 191,300 3.2%
Equities - Overseas quoted 1,878,600 31.1%
Equities - Overseas funds 485,700 8.0%
Venture capital 1,211,400 20.1%
Diversified property 10%-20%
Direct property 608,100 10.1%
Property funds 80,600 1.3%
Lower volatility strategies 20%-40%
Fixed interest securities 123,100 2.0%
Fixed interest funds 1,157,300 19.2%
Index linked securities 63,700 1.1%
Derivative contracts 307,600 5.1%
Currency contracts -291,000 -4.8%
Cash 210,900 3.5%
Net current assets 8,900 0.1%
Total 100.0% 6,036,200 100.0%
The Administering Authority also holds additional voluntary contributions (AVCs), which areseparately invested. These assets have been excluded from the market value shown as theyexactly match the value of the benefits they cover.
The details of the assets at the valuation date and the financial transactions during the inter-valuation period have been obtained from the audited accounts for the Fund.

A C T U A R I A L V A L U A T I O N A S A T 3 1 M A R C H 2 0 1 6 L A N C A S H I R E C O U N T YP E N S I O N F U N D
M E R C E R 19
DSCHEME BENEFITS
The benefits valued within our calculations are those in force at the effective date of the valuation.Full details of these can be found in the Local Government Pension Scheme Regulations 2013 (asamended):
The Local Government Pension Scheme Regulations 2013(http://www.legislation.gov.uk/uksi/2013/2356/contents/made)
The Local Government Pension Scheme (Transitional Provisions, Savings and Amendment)Regulations 2014 (http://www.legislation.gov.uk/uksi/2014/525/contents/made)
The direction by the Treasury dated 5 April 2016 under Section 59A of the Social SecurityPensions Act 1975 (http://www.lgpsregs.org/images/OtherGuidance/HMTDirectionApr2016.pdf)
We have made no allowance for other changes which may be introduced in the future.
The Fund is also responsible for paying and, where appropriate, recharging to employers thebenefits arising from the award of compensatory added years (CAY) of service on prematureretirement. Unless these CAY benefits have been converted into “funded” benefits, they arenormally recharged to the relevant employer (together with associated pension increases), and soare excluded from the valuation.
The benefits that will emerge from money purchase AVCs paid by members, and SCAVCs paid byemployers, and the corresponding invested assets in respect of these AVCs and SCAVCs, havebeen excluded from the valuation.
UK and European law requires pension schemes to provide equal benefits to men and women inrespect of service after 17 May 1990 (the date of the “Barber” judgement) and this includesproviding equal benefits accrued from that date to reflect the differences in GMPs. There is noconsensus or legislative guidance as to what adjustments have to be made to scheme benefits tocorrect these inequalities for ongoing schemes (i.e. for schemes other than those which are in thePension Protection Fund). The valuation makes no allowance for removal of these inequalities. It isconsequently possible that additional funding will be required for equalisation once the law hasbeen clarified. It is recommended that the Administering Authority seek further professional adviceif it is concerned about this issue.

A C T U A R I A L V A L U A T I O N A S A T 3 1 M A R C H 2 0 1 6 L A N C A S H I R E C O U N T YP E N S I O N F U N D
M E R C E R 20
ESUMMARY OF INCOME AND EXPENDITURE
INCOMEYEAR ENDING 31 MARCH
2014£000s
2015£000s
2016£000s
Total£000s
Fund at beginning of year 5,011,000 5,188,100 5,830,700 5,011,000
Contributions to Fund:
Employees 54,000 54,800 54,900 163,700
Employers 160,000 183,200 183,700 526,900
Transfer Values received 7,100 4,800 5,500 17,400
Investment income 105,300 90,700 99,100 295,100
Change in market value ofinvestments
118,400 684,700 165,900 969,000
EXPENDITUREYEAR ENDING 31 MARCH
2014£000s
2015£000s
2016£000s
Total£000s
Pensions for members/spouses/partners/dependants
183,900 192,000 200,200 576,100
Retiring allowances and deathgratuities
37,200 48,200 45,600 131,000
Withdrawals - - - -
Transfer Values paid 15,300 100,100 12,500 127,900
Investment expenses 25,100 29,400 32,500 87,000
Administration expenses 6,000 6,000 12,800 24,800
Fund at end of year 5,188,100 5,830,700 6,036,200 6,036,200

A C T U A R I A L V A L U A T I O N A S A T 3 1 M A R C H 2 0 1 6 L A N C A S H I R E C O U N T YP E N S I O N F U N D
M E R C E R 21
FANALYSIS OF MEMBERSHIP EXPERIENCE
The analysis below compares the actual experience over the 3 year period with the assumptionsused for the 2016 valuation.
ACTUAL EXPECTED %
Ill Health Retirements 311 289 108
Withdrawals 16,962 7,786 218
Pensioner Deaths (lives) 3,619 3,026 120
Pensioner Deaths (£000 p.a. of pension) 12,085 10,938 110
Note that actual withdrawals can include members moving to another LGPS Fund, bulk transfersand also transfers under the special transfer club terms.

A C T U A R I A L V A L U A T I O N A S A T 3 1 M A R C H 2 0 1 6 L A N C A S H I R E C O U N T YP E N S I O N F U N D
M E R C E R 22
GRATES AND ADJUSTMENTS CERTIFICATEISSUED IN ACCORDANCE WITH REGULATION62
NAME OF FUND Lan ca sh i re Cou n t y Pe ns io n Fun d
PRI MARY CONT RIBUT ION RATEI hereby certify that, in my opinion, the primary rate of the employers’ contribution for the wholeFund for each of the three years beginning 1 April 2017 is 14.9% of pensionable pay.
The primary rate of contribution for each employer for the three year period beginning 1 April 2017is set out in the attached schedule.
SECO NDARY CONTRI BUT ION R ATEI hereby certify that, in my opinion, the secondary rate of the employer’s contribution for the wholeFund for each of the three years beginning 1 April 2017 is as follows:
2017/18 £36.0 million plus 0.6% of pensionable pay2018/19 £37.1 million plus 0.7% of pensionable pay2019/20 £38.1 million plus 0.9% of pensionable pay
The secondary rate of contribution for each employer for each of the three years beginning 1 April2017 is set out in the attached schedule.
CONTRI BUT ION AMO UNTS PAYABL EThe total contribution payable for each employer is the total of the primary and secondary rates asdetailed in the attached schedule. Contributions will be paid monthly in arrears with each paymentnormally being due by the 19th of the following month (or the 22nd if paid electronically) unlessotherwise noted in the schedule.
FURTHER ADJ USTMENTSA further individual adjustment shall be applied in respect of each non-ill health early retirementoccurring in the period of three years covered by this certificate. This further individual adjustmentwill be calculated in accordance with methods agreed from time to time between the Fund’sActuary and the Administering Authority.
The contributions set out in the attached schedule represent the minimum contribution which maybe paid by each employer in total over the 3 years covered by the certificate. Additionalcontributions or a different pattern of contributions may be paid if requested by the employerconcerned at the sole discretion of the Administering Authority as agreed with the Actuary. Thetotal contributions payable by each employer will be subject to a minimum of zero.

A C T U A R I A L V A L U A T I O N A S A T 3 1 M A R C H 2 0 1 6 L A N C A S H I R E C O U N T YP E N S I O N F U N D
M E R C E R 23
The individual employer contributions may be varied as agreed by the Actuary and AdministeringAuthority to reflect any changes in contribution requirements as a result of any benefit costs beinginsured with a third party or parties including where the third party or parties participate in theFund.
In cases where an element of an existing Scheme employer's deficit is transferred to a newemployer on its inception, the Scheme employer's deficit recovery contributions, as shown on theschedule to this Certificate in Appendix H, may be reallocated between the Scheme employer andthe new employer to reflect this, on advice of the Actuary and as agreed with the AdministeringAuthority so that the total payments remain the same overall.
The Administering Authority and employer with advice from the Fund’s Actuary can agree thatcontributions payable under this certificate can be sourced under an alternative financingarrangement which provides the Fund with equivalent cash contributions.
REG UL AT ION 62(8 )No allowance for non-ill health early retirements has been made in determining the results of thevaluation, on the basis that the costs arising will be met by additional contributions. Allowance forill health retirements has been included in each employer’s contribution rate, on the basis of themethod and assumptions set out in the report.
Signature: Signature:
Name: John Livesey Name: Mark Wilson
Qualification: Fellow of the Institute Qualification:Fellow of the Instituteand Faculty of Actuaries and Faculty of Actuaries
Date of signing: 31 March 2017

A C T U A R I A L V A L U A T I O N A S A T 3 1 M A R C H 2 0 1 6 L A N C A S H I R E C O U N T Y P E N S I O N F U N D
M E R C E R 24
HSCHEDULE TO THE RATES AND ADJUSTMENTS CERTIFICATE DATED31 MARCH 2017
Employer
Primary rate2017/18 to
2019/20
Secondary rates Total Contribution rates
2017/18 2018/19 2019/20 2017/18 2018/19 2019/20
Major authoritiesBlackburn with Darwen BoroughCouncil
14.8%-2.4% plus£4,773,000
-1.4% plus£4,773,000
£4,857,50012.4% plus£4,773,000
13.4% plus£4,773,000
14.8% plus£4,857,500
Blackpool Borough Council 14.8% *£3,315,200 *£4,087,500 *£4,501,40014.8% plus*£3,315,200
14.8% plus*£4,087,500
14.8% plus*£4,501,400
Burnley Borough Council 15.4% *£1,379,800 *£1,370,600 *£1,361,40015.4% plus*£1,379,800
15.4% plus*£1,370,600
15.4% plus*£1,361,400
Chorley Borough Council 14.4% £790,500 £840,500 £966,30014.4% plus£790,500
14.4% plus£840,500
14.4% plus£966,300
Fylde Borough Council 15.2% *£583,800 *£579,900 *£576,00015.2% plus*£583,800
15.2% plus*£579,900
15.2% plus*£576,000
Hyndburn Borough Council 15.3% 12.7% 12.7% 12.7% 28% 28% 28%
Lancashire Chief Constable 14.0% **£1,791,700 **£1,858,000 **£1,926,70014% plus
**£1,791,70014% plus
**£1,858,00014% plus
**£1,926,700Lancashire County Council -excluding schools
15.1% *£9,534,200 *£9,470,300 *£9,406,90015.1% plus*£9,534,200
15.1% plus*£9,470,300
15.1% plus*£9,406,900
Lancashire County Councilschools
15.1% 4.7% 4.8% 4.9% 19.8% 19.9% 20.0%
Lancashire Fire & Rescue Service 14.7% ***(£312,700) ***(£324,300) ***(£336,300)14.7% less***£312,700
14.7% less***£324,300
14.7% less***£336,300

A C T U A R I A L V A L U A T I O N A S A T 3 1 M A R C H 2 0 1 6 L A N C A S H I R E C O U N T Y P E N S I O N F U N D
M E R C E R 25
Employer
Primary rate2017/18 to
2019/20
Secondary rates Total Contribution rates
2017/18 2018/19 2019/20 2017/18 2018/19 2019/20
Lancaster City Council 15.5% *£945,900 *£939,600 *£933,30015.5% plus*£945,900
15.5% plus*£939,600
15.5% plus*£933,300
Pendle Borough Council 15.5% *£1,219,900 *£1,211,700 *£1,203,60015.5% plus*£1,219,900
15.5% plus*£1,211,700
15.5% plus*£1,203,600
Preston City Council 15.4% *£1,409,100 *£1,399,700 *£1,390,30015.4% plus*£1,409,100
15.4% plus*£1,399,700
15.4% plus*£1,390,300
Ribble Valley Borough Council 16.5% **£173,500 **£179,900 **£186,50016.5% plus**£173,500
16.5% plus**£179,900
16.5% plus**£186,500
Rossendale Borough Council 15.6% *£996,900 *£990,200 *£983,60015.6% plus*£996,900
15.6% plus*£990,200
15.6% plus*£983,600
South Ribble Borough Council 14.9% **£547,200 **£567,500 **£588,40014.9% plus**£547,200
14.9% plus**£567,500
14.9% plus**£588,400
West Lancashire District Council 16.3% *£985,600 *£979,000 *£972,40016.3% plus*£985,600
16.3% plus*£979,000
16.3% plus*£972,400
Wyre Borough Council 15.8% *£707,700 *£702,900 *£698,20015.8% plus*£707,700
15.8% plus*£702,900
15.8% plus*£698,200

A C T U A R I A L V A L U A T I O N A S A T 3 1 M A R C H 2 0 1 6 L A N C A S H I R E C O U N T Y P E N S I O N F U N D
M E R C E R 26
Employer
Primary rate2017/18 to
2019/20
Secondary rates Total Contribution rates
2017/18 2018/19 2019/20 2017/18 2018/19 2019/20
Other scheme employers
Accrington & Rossendale College 15.1% £269,300 £279,200 £289,60015.1% plus£269,300
15.1% plus£279,200
15.1% plus£289,600
Blackburn College 14.2% £82,800 £85,900 £89,00014.2% plus
£82,80014.2% plus
£85,90014.2% plus
£89,000
Blackburn St Mary's College 14.6% £9,100 £9,400 £9,80014.6% plus
£9,10014.6% plus
£9,40014.6% plus
£9,800
Blackpool & The Fylde College 14.4% £192,600 £199,700 £207,10014.4% plus£192,600
14.4% plus£199,700
14.4% plus£207,100
Blackpool Coastal Housing 13.9% -1.9% -1.9% -1.9% 12% 12% 12%Blackpool Housing Company Ltd 13.4% -0.1% -0.1% -0.1% 13.3% 13.3% 13.3%Blackpool Sixth Form College 12.1% -0.3% -0.3% -0.3% 11.8% 11.8% 11.8%
Burnley College 13.2% £124,900 £129,500 £134,30013.2% plus£124,900
13.2% plus£129,500
13.2% plus£134,300
Cardinal Newman College 13.9% £49,400 £51,200 £53,10013.9% plus
£49,40013.9% plus
£51,20013.9% plus
£53,100County Councils Network 5.2% £700 £700 £800 5.2% plus £700 5.2% plus £700 5.2% plus £800
Edge Hill University 14.3% £780,300 £809,200 £839,10014.3% plus£780,300
14.3% plus£809,200
14.3% plus£839,100
Lancaster & Morecambe College 15.3% £121,300 £125,800 £130,40015.3% plus£121,300
15.3% plus£125,800
15.3% plus£130,400
Myerscough College 14.2% £165,800 £171,900 £178,30014.2% plus£165,800
14.2% plus£171,900
14.2% plus£178,300
Nelson and Colne College 14.0% £50,700 £52,500 £54,500 14% plus £50,700 14% plus £52,500 14% plus £54,500
Police & Crime Commissioner 13.9% £3,800 £3,900 £4,10013.9% plus
£3,80013.9% plus
£3,90013.9% plus
£4,100

A C T U A R I A L V A L U A T I O N A S A T 3 1 M A R C H 2 0 1 6 L A N C A S H I R E C O U N T Y P E N S I O N F U N D
M E R C E R 27
Employer
Primary rate2017/18 to
2019/20
Secondary rates Total Contribution rates
2017/18 2018/19 2019/20 2017/18 2018/19 2019/20
Preston College 13.3% £259,900 £269,500 £279,50013.3% plus£259,900
13.3% plus£269,500
13.3% plus£279,500
Runshaw College 15.7% £86,000 £89,200 £92,50015.7% plus
£86,00015.7% plus
£89,20015.7% plus
£92,500
University of Central Lancashire 14.3% £949,800 £984,900 £1,021,40014.3% plus£949,800
14.3% plus£984,900
14.3% plus£1,021,400

A C T U A R I A L V A L U A T I O N A S A T 3 1 M A R C H 2 0 1 6 L A N C A S H I R E C O U N T Y P E N S I O N F U N D
M E R C E R 28
Employer
Primary rate2017/18 to
2019/20
Secondary rates Total Contribution rates
2017/18 2018/19 2019/20 2017/18 2018/19 2019/20
Designated / Resolution bodyBlackpool Transport Services Ltd 23.1% -23.1% -23.1% -23.1% 0% 0% 0%Catterall Parish Council 25.3% Nil Nil Nil 25.3% 25.3% 25.3%Darwen Town Council 15.9% Nil Nil Nil 15.9% 15.9% 15.9%Garstang Town Council 17.5% Nil Nil Nil 17.5% 17.5% 17.5%Habergham Eaves Parish Council 15.8% Nil Nil Nil 15.8% 15.8% 15.8%Kirkland Parish Council 25.2% -0.7% -0.7% -0.7% 24.5% 24.5% 24.5%Lancs Sports Partnership Ltd 10.9% -0.6% -0.6% -0.6% 10.3% 10.3% 10.3%Marketing Lancashire Ltd 12.6% -1.1% -1.1% -1.1% 11.5% 11.5% 11.5%Morecambe Town Council 19.2% -1.2% -1.2% -1.2% 18% 18% 18%Old Laund Booth Parish Council 15.9% Nil Nil Nil 15.9% 15.9% 15.9%Penwortham Town Council 15.8% -3.4% -3.4% -3.4% 12.4% 12.4% 12.4%Pilling Parish Council 27.6% £100 £100 £100 27.6% plus £100 27.6% plus £100 27.6% plus £100Preesall Town Council 23.2% £100 £100 £100 23.2% plus £100 23.2% plus £100 23.2% plus £100Rossendale Transport Ltd. 25.6% Nil Nil Nil 25.6% 25.6% 25.6%St Anne’s on Sea Town Council 17.0% £1,100 £1,100 £1,200 17% plus £1,100 17% plus £1,100 17% plus £1,200The Lancashire Colleges Ltd 17.8% -3.7% -3.7% -3.7% 14.1% 14.1% 14.1%Whittle-le-woods Parish Council 17.0% Nil Nil Nil 17% 17% 17%
Whitworth Town Council 12.8% £2,200 £2,200 £2,30012.8% plus
£2,20012.8% plus
£2,20012.8% plus
£2,300

A C T U A R I A L V A L U A T I O N A S A T 3 1 M A R C H 2 0 1 6 L A N C A S H I R E C O U N T Y P E N S I O N F U N D
M E R C E R 29
Employer
Primary rate2017/18 to
2019/20
Secondary rates Total Contribution rates
2017/18 2018/19 2019/20 2017/18 2018/19 2019/20
Academies / schools
Academy at Worden 14.6% £13,400 £13,900 £14,40014.6% plus
£13,40014.6% plus
£13,90014.6% plus
£14,400Accrington Academy 14.3% -2.9% -2.9% -2.9% 11.4% 11.4% 11.4%Albany Science College(Academy)
16.2% £23,800 £24,700 £25,60016.2% plus
£23,80016.2% plus
£24,70016.2% plus
£25,600All Saints CE Primary School(Academy)
14.1% £16,200 £16,800 £17,40014.1% plus
£16,20014.1% plus
£16,80014.1% plus
£17,400Anchorsholme Academy 16.0% £34,900 £36,200 £37,500 16% plus £34,900 16% plus £36,200 16% plus £37,500ANWET - Darwen AldridgeCommunity Academy
14.3% -2% -2% -2% 12.3% 12.3% 12.3%
ANWET - Darwen Vale Academy 15.1% £64,600 £67,000 £69,50015.1% plus
£64,60015.1% plus
£67,00015.1% plus
£69,500
ANWET - Sudell PS Academy 19.1% £18,300 £19,000 £19,70019.1% plus
£18,30019.1% plus
£19,00019.1% plus
£19,700Bacup and Rawtenstall GrammarSchool (Academy)
14.8% £22,600 £23,400 £24,30014.8% plus
£22,60014.8% plus
£23,40014.8% plus
£24,300
Belthorn Primary Academy 18.6% £7,300 £7,600 £7,90018.6% plus
£7,30018.6% plus
£7,60018.6% plus
£7,900
BFET (Marton Primary Academy) 16.3% £22,800 £23,600 £24,50016.3% plus
£22,80016.3% plus
£23,60016.3% plus
£24,500
BFET (South Shore Academy) 14.9% £48,200 £50,000 £51,80014.9% plus
£48,20014.9% plus
£50,00014.9% plus
£51,800Bishop Rawstorne C of E HighAcademy
17.5% £28,500 £29,600 £30,60017.5% plus
£28,50017.5% plus
£29,60017.5% plus
£30,600

A C T U A R I A L V A L U A T I O N A S A T 3 1 M A R C H 2 0 1 6 L A N C A S H I R E C O U N T Y P E N S I O N F U N D
M E R C E R 30
Employer
Primary rate2017/18 to
2019/20
Secondary rates Total Contribution rates
2017/18 2018/19 2019/20 2017/18 2018/19 2019/20
Blackpool MAT (Revoe) 14.6% £47,500 £49,300 £51,10014.6% plus
£47,50014.6% plus
£49,30014.6% plus
£51,100
Blessed Edward MAT (Christ) 16.3% £11,900 £12,300 £12,80016.3% plus
£11,90016.3% plus
£12,30016.3% plus
£12,800Blessed Edward MAT (StCuthbert)
15.3% £24,900 £25,800 £26,80015.3% plus
£24,90015.3% plus
£25,80015.3% plus
£26,800
Blessed Edward MAT (St Mary’s) 15.5% £46,500 £48,200 £50,00015.5% plus
£46,50015.5% plus
£48,20015.5% plus
£50,000
Bowland High Academy Trust 17.6% £29,000 £30,100 £31,20017.6% plus
£29,00017.6% plus
£30,10017.6% plus
£31,200Cidari Ed Ltd (Marsden St John) 17.0% £9,600 £10,000 £10,400 17% plus £9,600 17% plus £10,000 17% plus £10,400
Cidari Edu Ltd (Baines Endowed) 12.7% £39,300 £40,800 £42,30012.7% plus
£39,30012.7% plus
£40,80012.7% plus
£42,300Cidari Education Trust 8.8% £2,400 Nil Nil 8.8% plus £2,400 8.8% 8.8%Cidari Education Ltd (St Aidans) 14.0% £17,100 £17,700 £18,400 14% plus £17,100 14% plus £17,700 14% plus £18,400Cidari Education Ltd (StBarnabas)
16.2% £20,100 £20,800 £21,60016.2% plus
£20,10016.2% plus
£20,80016.2% plus
£21,600
Cidari Education Ltd (St James) 13.8% £17,300 £17,900 £18,60013.8% plus
£17,30013.8% plus
£17,90013.8% plus
£18,600Clitheroe Royal Grammar School(Academy)
16.7% £58,000 £60,100 £62,40016.7% plus
£58,00016.7% plus
£60,10016.7% plus
£62,400CSCST (Burnley High FreeSchool)
13.6% £300 £300 £300 13.6% plus £300 13.6% plus £300 13.6% plus £300
Devonshire Academy 15.7% £36,900 £38,300 £39,70015.7% plus
£36,90015.7% plus
£38,30015.7% plus
£39,700

A C T U A R I A L V A L U A T I O N A S A T 3 1 M A R C H 2 0 1 6 L A N C A S H I R E C O U N T Y P E N S I O N F U N D
M E R C E R 31
Employer
Primary rate2017/18 to
2019/20
Secondary rates Total Contribution rates
2017/18 2018/19 2019/20 2017/18 2018/19 2019/20
Education Partnership Trust (CoalClough)
17.6% £20,000 £20,700 £21,50017.6% plus
£20,00017.6% plus
£20,70017.6% plus
£21,500Education Partnership Trust(Eden School)
10.7% £1,400 £1,500 £1,60010.7% plus
£1,40010.7% plus
£1,50010.7% plus
£1,600Education Partnership Trust(Pleckgate HS)
15.9% £66,200 £68,600 £71,20015.9% plus
£66,20015.9% plus
£68,60015.9% plus
£71,200
FACT (Unity Academy) 13.5% £59,500 £61,700 £64,00013.5% plus
£59,50013.5% plus
£61,70013.5% plus
£64,000
FCAT (Aspire Academy) 17.1% £48,500 £50,300 £52,20017.1% plus
£48,50017.1% plus
£50,30017.1% plus
£52,200
FCAT (Montgomery HS Academy) 14.3% £55,000 £57,000 £59,10014.3% plus
£55,00014.3% plus
£57,00014.3% plus
£59,100Fulwood Academy 15.2% -3.9% -3.9% -3.9% 11.3% 11.3% 11.3%
Fylde Coast Academy Trust 13.4% £1,500 £1,600 £1,60013.4% plus
£1,50013.4% plus
£1,60013.4% plus
£1,600
Garstang Community Academy 17.9% £27,900 £28,900 £30,00017.9% plus
£27,90017.9% plus
£28,90017.9% plus
£30,000
Hambleton Primary Academy 13.6% £6,800 £7,100 £7,30013.6% plus
£6,80013.6% plus
£7,10013.6% plus
£7,300
Hawe Side Primary School 15.6% £17,500 £18,100 £18,80015.6% plus
£17,50015.6% plus
£18,10015.6% plus
£18,800
Hodgson Academy 17.5% £43,400 £45,000 £46,70017.5% plus
£43,40017.5% plus
£45,00017.5% plus
£46,700Lancashire Care Foundation 20.1% -5% -5% -5% 15.1% 15.1% 15.1%Lancaster Girls Grammar School(Academy)
15.5% £41,900 £43,400 £45,00015.5% plus
£41,90015.5% plus
£43,40015.5% plus
£45,000

A C T U A R I A L V A L U A T I O N A S A T 3 1 M A R C H 2 0 1 6 L A N C A S H I R E C O U N T Y P E N S I O N F U N D
M E R C E R 32
Employer
Primary rate2017/18 to
2019/20
Secondary rates Total Contribution rates
2017/18 2018/19 2019/20 2017/18 2018/19 2019/20
Lancaster Royal Grammar School(Academy)
17.9% £66,500 £69,000 £71,50017.9% plus
£66,50017.9% plus
£69,00017.9% plus
£71,500Langdale Free School 15.4% Nil Nil Nil 15.4% 15.4% 15.4%
Lostock Hall Academy Trust 17.2% £30,100 £31,200 £32,40017.2% plus
£30,10017.2% plus
£31,20017.2% plus
£32,400Maharishi School (Free School) 18.4% -0.1% -0.1% -0.1% 18.3% 18.3% 18.3%Moorside Community PSAcademy
14.8% £10,800 £11,200 £11,60014.8% plus
£10,80014.8% plus
£11,20014.8% plus
£11,600Norbreck Primary Academy 15.0% £18,400 £19,100 £19,800 15% plus £18,400 15% plus £19,100 15% plus £19,800
Parbold Douglas CE Academy 16.1% £9,700 £10,100 £10,40016.1% plus
£9,70016.1% plus
£10,10016.1% plus
£10,400
Park Academy 13.2% £55,300 £57,300 £59,50013.2% plus
£55,30013.2% plus
£57,30013.2% plus
£59,500
Parklands High School (Academy) 14.6% £25,900 £26,800 £27,80014.6% plus
£25,90014.6% plus
£26,80014.6% plus
£27,800Pendle Education Trust (ColnePrimet)
17.5% £14,200 £14,700 £15,30017.5% plus
£14,20017.5% plus
£14,70017.5% plus
£15,300Pendle Education Trust(Castercliff)
17.2% £24,900 £25,800 £26,80017.2% plus
£24,90017.2% plus
£25,80017.2% plus
£26,800Pendle Education Trust (WalterStreet Primary School)
15.5% £14,700 £15,200 £15,80015.5% plus
£14,70015.5% plus
£15,20015.5% plus
£15,800
Penwortham Priory Academy 15.4% £17,100 £17,700 £18,30015.4% plus
£17,10015.4% plus
£17,70015.4% plus
£18,300Queen Elizabeth's GrammarSchool
16.1% £67,100 £69,600 £72,20016.1% plus
£67,10016.1% plus
£69,60016.1% plus
£72,200

A C T U A R I A L V A L U A T I O N A S A T 3 1 M A R C H 2 0 1 6 L A N C A S H I R E C O U N T Y P E N S I O N F U N D
M E R C E R 33
Employer
Primary rate2017/18 to
2019/20
Secondary rates Total Contribution rates
2017/18 2018/19 2019/20 2017/18 2018/19 2019/20
Ripley St Thomas C of EAcademy
17.6% £43,000 £44,600 £46,20017.6% plus
£43,00017.6% plus
£44,60017.6% plus
£46,200
Roseacre Primary Academy 15.3% £23,100 £24,000 £24,80015.3% plus
£23,10015.3% plus
£24,00015.3% plus
£24,800St Christopher's C of E highSchool (Academy)
16.1% £88,000 £91,300 £94,60016.1% plus
£88,00016.1% plus
£91,30016.1% plus
£94,600
St Georges Academy 15.1% £39,200 £40,700 £42,20015.1% plus
£39,20015.1% plus
£40,70015.1% plus
£42,200
St Luke and St Philip (Academy) 14.7% £28,100 £29,100 £30,20014.7% plus
£28,10014.7% plus
£29,10014.7% plus
£30,200St Michael's C of E High School(Academy)
16.5% £45,600 £47,200 £49,00016.5% plus
£45,60016.5% plus
£47,20016.5% plus
£49,000
St Wilfrid's C of E Academy 13.9% £91,900 £95,300 £98,80013.9% plus
£91,90013.9% plus
£95,30013.9% plus
£98,800
Tarleton Academy 14.9% £29,400 £30,500 £31,60014.9% plus
£29,40014.9% plus
£30,50014.9% plus
£31,600Tauheedul Education Trust 11.2% -1.1% -1.1% -1.1% 10.1% 10.1% 10.1%Tauheedul ET (Eden BS Preston) 10.8% £900 Nil Nil 10.8% plus £900 10.8% 10.8%Tauheedul ET (Eden GSBirmingham)
10.1% Nil Nil Nil 10.1% 10.1% 10.1%
Tauheedul ET (Eden GS Slough) 12.2% £100 Nil Nil 12.2% plus £100 12.2% 12.2%Tauheedul ET (Olive Blackburn) 8.5% -1% -1% -1% 7.5% 7.5% 7.5%Tauheedul ET (Olive London) 8.3% -1.1% -1.1% -1.1% 7.2% 7.2% 7.2%Tauheedul ET Eden BS Bolton FS 14.2% £100 £100 £100 14.2% plus £100 14.2% plus £100 14.2% plus £100Tauheedul ET Eden GS Coventry 8.6% -0.3% -0.3% -0.3% 8.3% 8.3% 8.3%

A C T U A R I A L V A L U A T I O N A S A T 3 1 M A R C H 2 0 1 6 L A N C A S H I R E C O U N T Y P E N S I O N F U N D
M E R C E R 34
Employer
Primary rate2017/18 to
2019/20
Secondary rates Total Contribution rates
2017/18 2018/19 2019/20 2017/18 2018/19 2019/20
Tauheedul ET Eden GS Waltham 11.6% £1,300 £1,300 £1,40011.6% plus
£1,30011.6% plus
£1,30011.6% plus
£1,400
Tauheedul ET Islam Girls HS 16.1% £17,900 £18,600 £19,20016.1% plus
£17,90016.1% plus
£18,60016.1% plus
£19,200Tauheedul Islam Boys HighSchool (Free School)
10.5% £900 £900 £1,000 10.5% plus £900 10.5% plus £90010.5% plus
£1,000
Thames Primary Academy 14.2% £29,100 £30,200 £31,30014.2% plus
£29,10014.2% plus
£30,20014.2% plus
£31,300The Heights Free School 14.0% £22,600 £23,400 £24,300 14% plus £22,600 14% plus £23,400 14% plus £24,300Tower MAT (Blackpool GatewayAcademy)
12.0% £4,400 £4,600 £4,700 12% plus £4,400 12% plus £4,600 12% plus £4,700
Waterloo Primary School(Academy)
14.2% £30,900 £32,000 £33,20014.2% plus
£30,90014.2% plus
£32,00014.2% plus
£33,200Wensley Fold CE PrimaryAcademy
14.1% £29,900 £31,000 £32,20014.1% plus
£29,90014.1% plus
£31,00014.1% plus
£32,200Westcliff Primary School(Academy)
15.3% £12,600 £13,100 £13,50015.3% plus
£12,60015.3% plus
£13,10015.3% plus
£13,500
Witton Park Academy Trust 15.8% £55,900 £58,000 £60,10015.8% plus
£55,90015.8% plus
£58,00015.8% plus
£60,100

A C T U A R I A L V A L U A T I O N A S A T 3 1 M A R C H 2 0 1 6 L A N C A S H I R E C O U N T Y P E N S I O N F U N D
M E R C E R 35
Employer
Primary rate2017/18 to
2019/20
Secondary rates Total Contribution rates
2017/18 2018/19 2019/20 2017/18 2018/19 2019/20
Admitted bodies (community)
Arnold Schools Ltd. 19.4% £26,200 £27,100 £28,10019.4% plus
£26,20019.4% plus
£27,10019.4% plus
£28,100Blackpool Fylde Wyre BlindSociety
21.6% -20.6% -20.6% -20.6% 1% 1% 1%
Blackpool Zoo 19.6% -4.4% -4.4% -4.4% 15.2% 15.2% 15.2%Blackpool, Fylde and Wyre CreditUnion
21.2% -1.6% -1.6% -1.6% 19.6% 19.6% 19.6%
Calico Housing Limited 13.8% £209,200 £216,900 £224,90013.8% plus£209,200
13.8% plus£216,900
13.8% plus£224,900
Catholic Caring Services 16.6% £65,500 £67,900 £70,40016.6% plus
£65,50016.6% plus
£67,90016.6% plus
£70,400Chorley Community Housing 16.4% -3.9% -3.9% -3.9% 12.5% 12.5% 12.5%Community and BusinessPartners CIC
14.8% -2% -2% -2% 12.8% 12.8% 12.8%
Community Council of Lancashire 19.5% £26,000 £27,500 £28,50019.5% plus
£26,00019.5% plus
£27,50019.5% plus
£28,500Community Gateway Association 16.1% -1.5% -1.5% -1.5% 14.6% 14.6% 14.6%Contour Housing Group 22.2% -22.2% -22.2% -22.2% 0% 0% 0%
Fylde Community Link 16.8% £11,200 £11,700 £12,10016.8% plus
£11,20016.8% plus
£11,70016.8% plus
£12,100
Galloways Society for Blind 20.2% £16,600 £17,200 £17,80020.2% plus
£16,60020.2% plus
£17,20020.2% plus
£17,800Hyndburn Homes Ltd 18.4% -2.8% -2.8% -2.8% 15.6% 15.6% 15.6%Kirkham Grammar School(Independent)
19.9% £29,300 £30,400 £31,50019.9% plus
£29,30019.9% plus
£30,40019.9% plus
£31,500

A C T U A R I A L V A L U A T I O N A S A T 3 1 M A R C H 2 0 1 6 L A N C A S H I R E C O U N T Y P E N S I O N F U N D
M E R C E R 36
Employer
Primary rate2017/18 to
2019/20
Secondary rates Total Contribution rates
2017/18 2018/19 2019/20 2017/18 2018/19 2019/20
Lancashire County Branch Unison 18.2% -18.2% -18.2% -18.2% 0% 0% 0%
Lancaster University 13.4% £504,700 £523,400 £542,70013.4% plus£504,700
13.4% plus£523,400
13.4% plus£542,700
Leisure in Hyndburn 13.0% £47,800 £49,600 £51,400 13% plus £47,800 13% plus £49,600 13% plus £51,400Local Pensions Partnership Ltd 12.4% Nil Nil Nil 12.4% 12.4% 12.4%Lytham Schools Foundation 18.0% -4.4% -4.4% -4.4% 13.6% 13.6% 13.6%North West & North Wales SeaFisheries Committee
16.6% £25,500 £26,500 £27,50016.6% plus
£25,50016.6% plus
£26,50016.6% plus
£27,500
Pendle Leisure Trust 12.6% £20,600 £21,400 £22,20012.6% plus
£20,60012.6% plus
£21,40012.6% plus
£22,200
Preston Care and Repair 13.7% £3,600 Nil Nil13.7% plus
£3,60013.7% 13.7%
Progress Housing Group Ltd 17.9% -2.3% -2.3% -2.3% 15.6% 15.6% 15.6%QEGS Blackburn Ltd 16.5% -0.3% -0.3% -0.3% 16.2% 16.2% 16.2%Ribble Valley Homes Ltd 18.9% -10.2% -10.2% -10.2% 8.7% 8.7% 8.7%Rossendale Leisure Trust 13.6% -2.1% -2.1% -2.1% 11.5% 11.5% 11.5%
Surestart Hyndburn 13.8% £22,400 £23,200 £24,10013.8% plus
£22,40013.8% plus
£23,20013.8% plus
£24,100
The Ormerod Home Trust Ltd. 21.2% £145,100 £150,400 £156,00021.2% plus£145,100
21.2% plus£150,400
21.2% plus£156,000
Together Housing 14.7% £87,700 £90,900 £94,30014.7% plus
£87,70014.7% plus
£90,90014.7% plus
£94,300
University of Cumbria 14.0% £608,700 £631,200 £654,60014% plus£608,700
14% plus£631,200
14% plus£654,600
Wyre Housing Association 19.3% £257,600 £267,100 £277,00019.3% plus£257,600
19.3% plus£267,100
19.3% plus£277,000

A C T U A R I A L V A L U A T I O N A S A T 3 1 M A R C H 2 0 1 6 L A N C A S H I R E C O U N T Y P E N S I O N F U N D
M E R C E R 37
Employer
Primary rate2017/18 to
2019/20
Secondary rates Total Contribution rates
2017/18 2018/19 2019/20 2017/18 2018/19 2019/20
Admitted bodies (contractor)Alternative Futures Group Ltd 22.2% -22.2% -22.2% -22.2% 0% 0% 0%Andron (formerly Solar) 21.3% -21.3% -21.3% -21.3% 0% 0% 0%Bootstrap Enterprises Ltd 18.8% -17.9% -17.9% -17.9% 0.9% 0.9% 0.9%Bulloughs (Carr Head PS) 25.6% £500 Nil Nil 25.6% plus £500 25.6% 25.6%Bulloughs (Lytham Hall) 21.0% Nil Nil Nil 21% 21% 21%Bulloughs (Our Lady) 16.8% -7.3% -7.3% -7.3% 9.5% 9.5% 9.5%Burnley Leisure 13.6% -2% -2% -2% 11.6% 11.6% 11.6%Capita (Rossendale BC Transfer) 20.7% -20.7% -20.7% -20.7% 0% 0% 0%Catering Academy Ltd 20.1% -20.1% -20.1% -20.1% 0% 0% 0%Caterlink (Mount Pleasant School) 16.8% -1.9% -1.9% -1.9% 14.9% 14.9% 14.9%CG Cleaning (Kennington Rd) 22.7% -17.4% Nil Nil 5.3% 22.7% 22.7%CG Cleaning (St Augustine) 22.1% -3% Nil Nil 19.1% 22.1% 22.1%Churchill (Holy Family) 21.4% -16% Nil Nil 5.4% 21.4% 21.4%Churchill (St Anne St Joseph) 18.5% -2.8% Nil Nil 15.7% 18.5% 18.5%Cofely FM Ltd (Blake/Cross) 26.7% -26.7% -26.7% -26.7% 0% 0% 0%Cofely FM Ltd (Lend Lease) 21.9% -5.4% -5.4% -5.4% 16.5% 16.5% 16.5%Cofely FM Ltd (Pleckgate) 18.8% -10.8% -10.8% -10.8% 8% 8% 8%Cofely FM Ltd (Witton Park) 23.2% -3.2% -3.2% -3.2% 20% 20% 20%Compass Contract Services 23.4% -0.4% -0.4% -0.4% 23% 23% 23%Compass Contract Services (UK)Ltd (Preston College)
20.9% -0.9% -0.9% -0.9% 20% 20% 20%
Consultant Caterers Ltd 22.5% -17.8% -17.8% -17.8% 4.7% 4.7% 4.7%Creative Support Limited (MidwayMental health)
18.2% -4.2% -4.2% -4.2% 14% 14% 14%
Creative Support Ltd 21.0% -21% -21% -21% 0% 0% 0%

A C T U A R I A L V A L U A T I O N A S A T 3 1 M A R C H 2 0 1 6 L A N C A S H I R E C O U N T Y P E N S I O N F U N D
M E R C E R 38
Employer
Primary rate2017/18 to
2019/20
Secondary rates Total Contribution rates
2017/18 2018/19 2019/20 2017/18 2018/19 2019/20
Elite CES Ltd (Fulwood Cadley) 19.9% Nil Nil Nil 19.9% 19.9% 19.9%Elite CES Ltd (Moor Nook PS) 23.1% Nil Nil Nil 23.1% 23.1% 23.1%Elite Cleaning and EnvironmentalServices Ltd
16.7% -9.8% -9.8% -9.8% 6.9% 6.9% 6.9%
Eric Wright Facilities ManagementLtd (Highfield High School)
20.2% -19.5% -19.5% -19.5% 0.7% 0.7% 0.7%
FCC Environment 20.6% Nil Nil Nil 20.6% 20.6% 20.6%Fylde YMCA 16.5% -16.5% -16.5% -16.5% 0% 0% 0%I CARE 26.1% -26.1% -26.1% -26.1% 0% 0% 0%Ind Living Fund (Blackpool BC) 19.7% -2% Nil Nil 17.7% 19.7% 19.7%Lend Lease Cons.(EMEA) ICT 18.8% -5.3% -5.3% -5.3% 13.5% 13.5% 13.5%Lend Lease Cons.(EMEA) ph3 13.9% -3% -3% -3% 10.9% 10.9% 10.9%Lend Lease Construction (EMEA)Limited (Fulwood Academy)
16.9% -1.9% -1.9% -1.9% 15% 15% 15%
Liberata (UK) Ltd (Burnley) 18.7% -1.4% -1.4% -1.4% 17.3% 17.3% 17.3%Liberata UK Ltd (Pendle) 19.2% -6.5% -6.5% -6.5% 12.7% 12.7% 12.7%Mack Trading Int. (Ltd) 21.1% -21.1% -21.1% -21.1% 0% 0% 0%May Gurney Fleet and PassengerServices Limited
21.7% -21.7% -21.7% -21.7% 0% 0% 0%
Mellor's (Bishop Rawstorne) 21.2% -6% -6% -6% 15.2% 15.2% 15.2%Mellors (Brinscall St John) 18.9% -0.1% -0.1% -0.1% 18.8% 18.8% 18.8%Mellor's (Hambleton PS) 27.6% -1.7% -1.7% -1.7% 25.9% 25.9% 25.9%Mellors (Queens Drive) 20.5% Nil Nil Nil 20.5% 20.5% 20.5%Mellors (Trinity, St Michael) 24.7% Nil Nil Nil 24.7% 24.7% 24.7%Mellor's (Worden SC) 28.8% -28.8% -28.8% -28.8% 0% 0% 0%

A C T U A R I A L V A L U A T I O N A S A T 3 1 M A R C H 2 0 1 6 L A N C A S H I R E C O U N T Y P E N S I O N F U N D
M E R C E R 39
Employer
Primary rate2017/18 to
2019/20
Secondary rates Total Contribution rates
2017/18 2018/19 2019/20 2017/18 2018/19 2019/20
Mellor's Catering (BelthornAcademy)
21.1% Nil Nil Nil 21.1% 21.1% 21.1%
NCP Services Ltd 23.6% -23.6% -23.6% -23.6% 0% 0% 0%RCCN (Basnett Nursery) 22.2% Nil Nil Nil 22.2% 22.2% 22.2%Ridge Crest Clean Nrth Sacred 28.8% -28.8% -28.8% -28.8% 0% 0% 0%Service Alliance (Barnoldswick) 21.3% Nil Nil Nil 21.3% 21.3% 21.3%Service Alliance (Whalley PS) 22.2% Nil Nil Nil 22.2% 22.2% 22.2%Service Alliance Ltd (Altham) 25.7% -3.1% Nil Nil 22.6% 25.7% 25.7%Service Alliance Ltd (RCC) 26.6% £500 Nil Nil 26.6% plus £500 26.6% 26.6%South Ribble Community Lesure(Serco)
13.5% £80,400 £83,400 £86,50013.5% plus
£80,40013.5% plus
£83,40013.5% plus
£86,500Urbaser Ltd 23.9% £400 £400 £400 23.9% plus £400 23.9% plus £400 23.9% plus £400West Lancashire CommunityLeisure (Serco)
14.9% -14.9% -14.9% -14.9% 0% 0% 0%

A C T U A R I A L V A L U A T I O N A S A T 3 1 M A R C H 2 0 1 6 L A N C A S H I R E C O U N T Y P E N S I O N F U N D
M E R C E R 40
Employer
Primary rate2017/18 to
2019/20
Secondary rates Total Contribution rates
2017/18 2018/19 2019/20 2017/18 2018/19 2019/20
Other employers confirmed post valuationFreckleton Parish Council 18.6% Nil Nil Nil 18.6% 18.6% 18.6%
PET (West Craven) 17.2% £18,100 £18,800 £19,50017.2% plus
£18,10017.2% plus
£18,80017.2% plus
£19,500Andron Heyhouses 23.3% Nil Nil Nil 23.3% 23.3% 23.3%Blessed Edward Trust 10.7% Nil Nil Nil 10.7% 10.7% 10.7%Churchill Moorside 25.1% -4.3% -4.3% -4.3% 20.8% 20.8% 20.8%Clayton-le-Woods Parish Council 17.8% -0.9% -0.9% -0.9% 16.9% 16.9% 16.9%Cliviger Parish Council 15.9% Nil Nil Nil 15.9% 15.9% 15.9%Compass HHC 21.6% Nil Nil Nil 21.6% 21.6% 21.6%Education Partnership Trust 11.2% -0.4% -0.4% -0.4% 10.8% 10.8% 10.8%
FCAT Mereside Primary Academy 16.3% £27,600 £28,600 £29,70016.3% plus
£27,60016.3% plus
£28,60016.3% plus
£29,700Mellors Lostock 21.9% Nil Nil Nil 21.9% 21.9% 21.9%PET 15.5% £700 £700 £700 15.5% plus £700 15.5% plus £700 15.5% plus £700
Tauheedul Highfield Humanities 16.4% £57,700 £59,800 £62,00016.4% plus
£57,70016.4% plus
£59,80016.4% plus
£62,000Tauheedul Olive Birmingham 7.6% Nil Nil Nil 7.6% 7.6% 7.6%Tauheedul Olive Bolton 11.1% Nil Nil Nil 11.1% 11.1% 11.1%Tauheedul Olive Preston 9.7% Nil Nil Nil 9.7% 9.7% 9.7%Taylor Shaw (Parklands HS) 22.4% -3% -3% -3% 19.4% 19.4% 19.4%
Tor View 12.6% £57,300 £59,400 £61,60012.6% plus
£57,30012.6% plus
£59,40012.6% plus
£61,600Vision Learning Trust 13.3% -0.1% -0.1% -0.1% 13.2% 13.2% 13.2%

A C T U A R I A L V A L U A T I O N A S A T 3 1 M A R C H 2 0 1 6 L A N C A S H I R E C O U N T Y P E N S I O N F U N D
M E R C E R 41
Employer
Primary rate2017/18 to
2019/20
Secondary rates Total Contribution rates
2017/18 2018/19 2019/20 2017/18 2018/19 2019/20
Employers grouped with CouncilAndron Fearns Sport College 15.1% Nil Nil Nil 15.1% 15.1% 15.1%Bulloughs (St Patrick) 15.1% Nil Nil Nil 15.1% 15.1% 15.1%Churchill (Clayton Brook) 15.1% Nil Nil Nil 15.1% 15.1% 15.1%Churchill (Morecambe Bay) 15.1% Nil Nil Nil 15.1% 15.1% 15.1%Consultant Cleaners (St James) 15.1% Nil Nil Nil 15.1% 15.1% 15.1%Elite CES Ltd (St Annes) 15.1% Nil Nil Nil 15.1% 15.1% 15.1%Elite CES Ltd (Carr Hill) 15.1% Nil Nil Nil 15.1% 15.1% 15.1%I Care (Ind) 14.8% -2.4% -1.4% Nil 12.4% 13.4% 14.8%Maxim (Acorns PS) 15.1% Nil Nil Nil 15.1% 15.1% 15.1%Maxim (Newton Bluecoat) 15.1% Nil Nil Nil 15.1% 15.1% 15.1%Maxim (St Matthews CE PS) 15.1% Nil Nil Nil 15.1% 15.1% 15.1%Mellors (Delph Side PS) 15.1% Nil Nil Nil 15.1% 15.1% 15.1%Mellors (Holy Cross) 15.1% Nil Nil Nil 15.1% 15.1% 15.1%Mellors (Little Hoole) 15.1% Nil Nil Nil 15.1% 15.1% 15.1%Mellors (White Ash PS) 15.1% Nil Nil Nil 15.1% 15.1% 15.1%Premiserv (St Peter) 15.1% Nil Nil Nil 15.1% 15.1% 15.1%RCCN (Burscough) 15.1% Nil Nil Nil 15.1% 15.1% 15.1%RCCN (Our Ladys Catholic HS) 15.1% Nil Nil Nil 15.1% 15.1% 15.1%RCCN (St Johns) 15.1% Nil Nil Nil 15.1% 15.1% 15.1%RCCN (Whitefield) 15.1% Nil Nil Nil 15.1% 15.1% 15.1%Service Alliance (Clitheroe PendlePrimary)
15.1% Nil Nil Nil 15.1% 15.1% 15.1%
Service Alliance (St MaryMagdalene)
15.1% Nil Nil Nil 15.1% 15.1% 15.1%
Service Alliance (St Marys RCP) 15.1% Nil Nil Nil 15.1% 15.1% 15.1%

A C T U A R I A L V A L U A T I O N A S A T 3 1 M A R C H 2 0 1 6 L A N C A S H I R E C O U N T Y P E N S I O N F U N D
M E R C E R 42
Employer
Primary rate2017/18 to
2019/20
Secondary rates Total Contribution rates
2017/18 2018/19 2019/20 2017/18 2018/19 2019/20
Service Alliance (St Wilfred) 15.1% Nil Nil Nil 15.1% 15.1% 15.1%Service Alliance (Whittlefield) 15.1% Nil Nil Nil 15.1% 15.1% 15.1%
Other interested bodies with no pensionable employees
Notes:
1. Cash payments in respect of £ lump sums marked * are payable by 30 April 2017. Cash payments in respect of £ lump sums marked ** are payable by 30April of the year in which they are due. Cash payments in respect of £ lump sums marked *** are payable by the end of the year in which they are dueWhere applicable these amounts have been reduced to reflect this early payment;
2. With the agreement of the Administering Authority employers may also opt to pay any other element of their employer contributions early, with either allthree years being paid in April 2017 or payment being made in the April of the year in question. The cash amounts payable will be reduced in return for thisearly payment as follows:
· Payments made in the April of the certified year will be reduced by 2.1% (i.e. the above amounts will be multiplied by 0.979)· 2018/19 payments made in April 2017 will be reduced by 6.3% (i.e. the above amounts will be multiplied by 0.937)
EmployerProportion of Pension
Increases to be Recharged%
Blackpool & Fylde Society for the Deaf 100Burnley & Pendle Development Association 100Burton Manor Residential College 100Ex Department of Transport 100Ex National Health Service 100Fylde Coast Development Association 100Lancashire South East Probation Committee 100Spastics Society 100

A C T U A R I A L V A L U A T I O N A S A T 3 1 M A R C H 2 0 1 6 L A N C A S H I R E C O U N T Y P E N S I O N F U N D
M E R C E R 43
· 2019/20 payments made in April 2017 will be reduced by 10.2% (i.e. the above amounts will be multiplied by 0.898)
For these cases the employer will need to estimate in advance the pensionable pay for the entire period, and a balancing adjustment to reflect the actualpensionable pay over the period would be made at the end of the period (no later than 19th April or 22nd April as appropriate following the year end).
3. The percentages shown are percentages of pensionable pay and apply to all members, including those who are members under the 50:50 option under theLGPS from 1 April 2014;
4. The total contributions payable by each employer each year will be subject to a minimum of zero;
5. In cases where an element of an existing Scheme Employer’s deficit is transferred to a new employer on its inception, the Scheme Employer’s deficitrecovery contributions shown in this certificate may be reallocated between the Scheme Employer and the new employer to reflect this, on advice from theactuary.
6. There are a number of additional employers who no longer had any active members within the Fund as at the valuation date. Any final contributionrequirement for these employers will be assessed by the Fund in due course on the basis of actuarial advice.
7. The Fund has implemented an internal captive insurance arrangement in order to pool the risks associated with ill health retirement costs. The captive hasbeen designed for employers that could be materially affected by the ill health retirement of one or more of their members. The employers (both existing andnew) that will be included in the captive are those with less than 150 active members (excluding major Councils). New employers entering the Fund who fallinto this category will also be included. For those employers in the ill-health captive arrangement, allowance for ill health retirements has been included ineach employer’s contribution rate, on the basis of the method and assumptions set out in the report.

A C T U A R I A L V A L U A T I O N A S A T 3 1 M A R C H 2 0 1 6 L A N C A S H I R E C O U N T YP E N S I O N F U N D
M E R C E R 44
IGLOSSARY
Actuarial Valuation: an investigation by an actuary into the ability of the Fund to meet its liabilities.For the LGPS the Fund Actuary will assess the funding level of each participating employer andagree contribution rates with the administering authority to fund the cost of new benefits and makegood any existing deficits as set out in the separate Funding Strategy Statement.
Best Estimate Assumption: an assumption where the outcome has a 50/50 chance of beingachieved.
Bonds: loans made to an issuer (often a government or a company) which undertakes to repay theloan at an agreed later date. The term refers generically to corporate bonds or government bonds(gilts).
Career Average Revalued Earnings Scheme (CARE): with effect from 1 April 2014, benefitsaccrued by members in the LGPS take the form of CARE benefits. Every year members will accruea pension benefit equivalent to 1/49th of their pensionable pay in that year. Each annual pensionaccrued receives inflationary increases (in line with the annual change in the Consumer PricesIndex) over the period to retirement.
Corporate Bond Basis: an approach where the discount rate used to assess the liabilities isdetermined based on the market yields of high quality corporate bond investments (usually at leastAA rated) based on the appropriate duration of the liabilities being assessed. This is usuallyadopted when an employer is exiting the Fund.
CPI: acronym standing for “Consumer Prices Index”. CPI is a measure of inflation with a basket ofgoods that is assessed on an annual basis. The reference goods and services differs from those ofRPI. These goods are expected to provide lower, less volatile inflation increases. Pensionincreases in the LGPS are linked to the annual change in CPI.
Deficit: the extent to which the value of the Fund’s past service liabilities exceeds the value of theFund’s assets.
Discount Rate: the rate of interest used to convert a cash amount e.g. future benefit paymentsoccurring in the future to a present value.
Employer Covenant: the degree to which an employer participating in an occupational pensionscheme is willing and able to meet the funding requirements of the scheme.
Employer's Future Service Contribution Rate: the contribution rate payable by an employer,expressed as a % of pensionable pay, as being sufficient to meet the cost of new benefits beingaccrued by active members in the future. The cost will be net of employee contributions and willinclude an allowance for the expected level of administrative expenses.
Equities: shares in a company which are bought and sold on a stock exchange.

A C T U A R I A L V A L U A T I O N A S A T 3 1 M A R C H 2 0 1 6 L A N C A S H I R E C O U N T YP E N S I O N F U N D
M E R C E R 45
Solvency/Funding Level: the ratio of the value of the Fund’s assets and the value of the Fund’sliabilities expressed as a percentage.
Funding Strategy Statement: This is a key governance document that outlines how theadministering authority will manage employer’s contributions to the Fund.
Solvency Funding Target: an assessment of the present value of benefits to be paid in the future.The desired funding target is to achieve a solvency level of a 100% i.e. assets equal to the pastservice liabilities assessed on the ongoing concern basis.
Investment Strategy: the long-term distribution of assets among various asset classes that takesinto account the Funds objectives and attitude to risk.
Past Service Liabilities: this is the present value of the benefits accrued by members up to thevaluation date. It is assessed based on a set of assumptions agreed between the AdministeringAuthority and the Actuary.
Prepayment: the payment by employers of contributions to the Fund earlier than that certified bythe Actuary. The amount paid will be reduced compared to the certified amount to reflect the earlypayment.
Present Value: the value of projected benefit payments, discounted back to the valuation date.
Primary rate of the employers’ contribution: the contribution rate required to meet the cost of thefuture accrual of benefits including ancillary, death in service and ill health benefits together withadministration costs. It is expressed as a percentage of pensionable pay, ignoring any past servicesurplus or deficit, but allowing for any employer-specific circumstances, such as its membershipprofile, the funding strategy adopted for that employer, the actuarial method used and/or theemployer’s covenant. The Primary rate for the whole fund is the weighted average (by payroll) ofthe individual employers’ Primary rates.
Prudent Assumption: an assumption where the outcome has a greater than 50/50 chance of beingachieved i.e. the outcome is more likely to be overstated than understated. Legislation requires theassumptions adopted for an actuarial valuation to be prudent.
Real Return or Real Discount Rate: a rate of return or discount rate net of CPI inflation.
Recovery Plan: a strategy by which an employer will make up a funding deficit over a specifiedperiod of time (“the recovery period”, as set out in the Funding Strategy Statement.
Secondary rate of the employers’ contribution: an adjustment to the Primary rate to reflect any pastservice deficit or surplus, to arrive at the rate each employer is required to pay. The Secondaryrate may be expressed as a percentage adjustment to the Primary rate, and/or a cash adjustmentin each of the three years beginning 1 April in the year following that in which the valuation datefalls. The Secondary rate is specified in the rates and adjustments certificate. For any employer,the rate they are actually required to pay is the sum of the Primary and Secondary rates.Secondary rates for the whole fund in each of the three years shall also be disclosed. These will

A C T U A R I A L V A L U A T I O N A S A T 3 1 M A R C H 2 0 1 6 L A N C A S H I R E C O U N T YP E N S I O N F U N D
M E R C E R 46
be calculated as the weighted average based on the whole fund payroll in respect of percentagerates and as a total amount in respect of cash adjustments.
50/50 Scheme: in the LGPS, active members are given the option of accruing a lower benefit in the50/50 Scheme, in return for paying a lower level of contribution.

A C T U A R I A L V A L U A T I O N A S A T 3 1 M A R C H 2 0 1 6 L A N C A S H I R E C O U N T YP E N S I O N F U N D
Mercer Limited is authorised and regulated by the Financial ConductAuthorityRegistered in England No. 984275 Registered Office: 1 Tower PlaceWest, Tower Place, London EC3R 5BU
M E R C E R L I M I T E DNo 4 St Paul’s Square,Old Hall Street,Liverpool,L3 9SJwww.mercer.com