actuarial valuation reports - texas · actuarial valuation reports for pension plans administered...
TRANSCRIPT

As of August 31, 2017 | Prepared by Gabriel Roeder Smith & Company
ACTUARIAL VALUATION REPORTSFor Pension Plans Administered by ERS

Copyright © 2017 GRS – All rights reserved.
Actuarial Valuations of the ERS Retirement Funds as of August 31, 2017 December 12, 2017
Ryan Falls, FSA, EA, MAAA Joe Newton, FSA, EA, MAAA

Agenda
• Purpose of Actuarial Valuation • Summary of Changes in Actuarial Assumptions
and Methods • Impact of Asset Returns • ERS Funding Valuation Results • LECOSRF and JRS2 Funding Valuation Results • Accounting Results at August 31, 2017
2
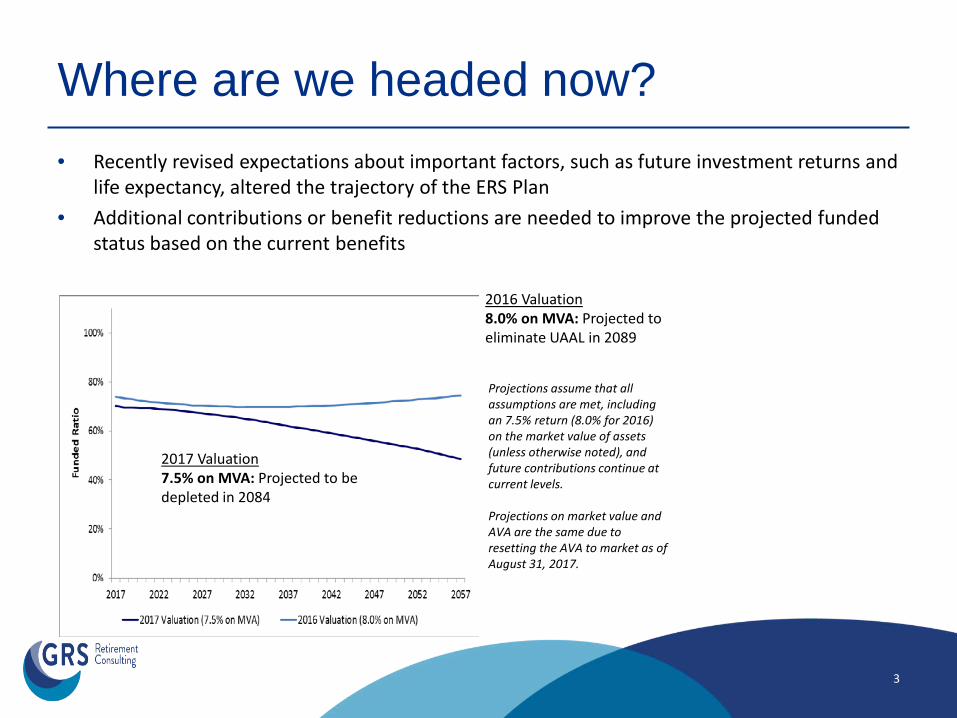
Where are we headed now? • Recently revised expectations about important factors, such as future investment returns and
life expectancy, altered the trajectory of the ERS Plan • Additional contributions or benefit reductions are needed to improve the projected funded
status based on the current benefits
3
2017 Valuation 7.5% on MVA: Projected to be depleted in 2084
2016 Valuation 8.0% on MVA: Projected to eliminate UAAL in 2089
Projections assume that all assumptions are met, including an 7.5% return (8.0% for 2016) on the market value of assets (unless otherwise noted), and future contributions continue at current levels. Projections on market value and AVA are the same due to resetting the AVA to market as of August 31, 2017.
4
Purpose of Actuarial Valuation

Purpose of Actuarial Valuation
• Prepared as of August 31, 2017 using member data, financial data, benefit and contribution provisions, actuarial assumptions and methods as of that date
• Purposes: – Measure the actuarial liabilities and funding levels – Determine adequacy of current statutory contributions – Provide other information for reporting
GASB 67/68, Consolidated Annual Financial Report – Explain changes in actuarial condition of the plans – Track changes over time – Analyze future outlook
5
6
Summary of Changes in Actuarial
Assumptions and Methods
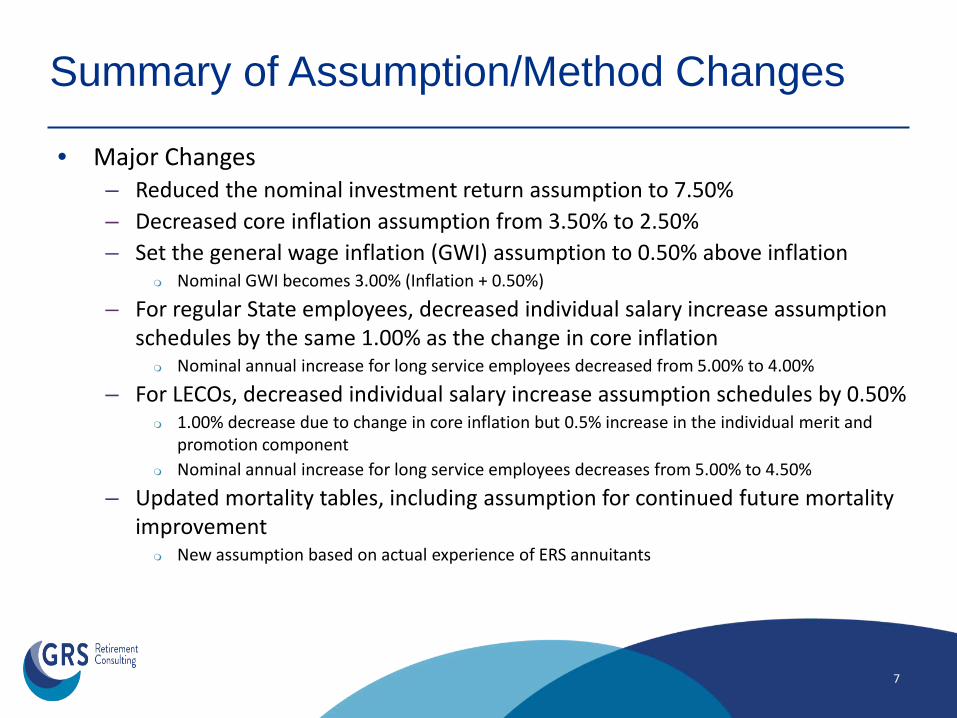
Summary of Assumption/Method Changes
• Major Changes – Reduced the nominal investment return assumption to 7.50% – Decreased core inflation assumption from 3.50% to 2.50% – Set the general wage inflation (GWI) assumption to 0.50% above inflation
Nominal GWI becomes 3.00% (Inflation + 0.50%)
– For regular State employees, decreased individual salary increase assumption schedules by the same 1.00% as the change in core inflation
Nominal annual increase for long service employees decreased from 5.00% to 4.00%
– For LECOs, decreased individual salary increase assumption schedules by 0.50% 1.00% decrease due to change in core inflation but 0.5% increase in the individual merit and
promotion component Nominal annual increase for long service employees decreases from 5.00% to 4.50%
– Updated mortality tables, including assumption for continued future mortality improvement
New assumption based on actual experience of ERS annuitants
7

Summary of Assumption/Method Changes
• Minor Changes – Changed the asset smoothing method to a traditional
individual year deferral method, but allow direct offsetting of gains and losses Reset the actuarial (smoothed) value market value as of August 31,
2017 New method to apply prospectively
– Changed actuarial cost method to Individual EAN (from Ultimate EAN)
– Reduced rates of disability and retirement – Slightly increased rates of termination – Increased administrative expense load from 0.25% of
payroll to 0.33% for ERS Lowered LECOSRF from 0.10% to 0.08% and lowered JRS2 from
0.50% to 0.33%
8

9
Impact of Asset Returns
Asset Experience
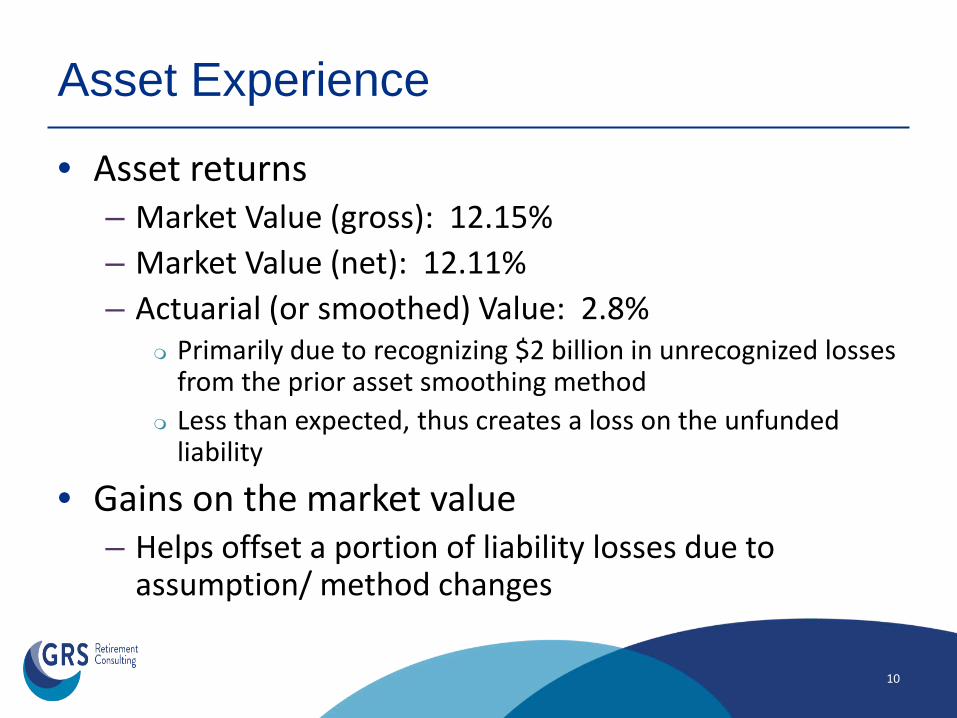
• Asset returns – Market Value (gross): 12.15% – Market Value (net): 12.11% – Actuarial (or smoothed) Value: 2.8%
Primarily due to recognizing $2 billion in unrecognized losses from the prior asset smoothing method
Less than expected, thus creates a loss on the unfunded liability
• Gains on the market value – Helps offset a portion of liability losses due to
assumption/ method changes
10

Estimated Yields Based on Market Value of Assets
11
2008 2009 2010 2011 2012 2013 2014 2015 2016 2017Market -4.69% -6.71% 6.48% 12.36% 8.04% 9.87% 14.58% 0.44% 5.28% 12.11%
-15.0%
-10.0%
-5.0%
0.0%
5.0%
10.0%
15.0%
20.0%
25.0%
8.34% average compound net return (on market value) over last 5 years. 5.54% average compound net return (on market value) over last 10 years. 6.41% average compound net return (on market value) over last 20 years.
7.50% 5.54%

Actuarial, Market and Hypothetical* Values of Assets for ERS
12
* Hypothetical uses 2006 market value and projects forward using actual cash flows and investment returns consistent with actuarial assumptions in effect.
2006 2007 2008 2009 2010 2011 2012 2013 2014 2015 2016 2017Actuarial $21.8 $22.9 $23.5 $23.5 $23.6 $24.0 $24.3 $24.7 $25.4 $25.9 $26.6 $26.4Market $21.5 $23.5 $21.5 $19.1 $19.6 $21.2 $21.8 $22.9 $25.1 $24.0 $24.5 $26.4Hypothetical* $21.5 $22.6 $23.6 $24.7 $25.9 $27.2 $28.3 $29.5 $30.8 $32.1 $33.8 $35.4
$0
$5
$10
$15
$20
$25
$30
$35
$40$ Billions

13
ERS Funding Valuation Results
at August 31, 2017

Funded Status (ERS) ($ in millions)
14
AVA MVA
Actuarial Accrued Liability $37,630 $37,630AVA / MVA 26,372 26,372Unfunded Accrued Liability $11,258 $11,258Funded Ratio 70.1% 70.1%Funding Period Never Never
AVA MVA
Actuarial Accrued Liability $35,303 $35,303AVA / MVA 26,557 24,465Unfunded Accrued Liability $8,746 $10,838Funded Ratio 75.2% 69.3%Funding Period 35 73
Actuarial Valuation as of August 31, 2017
Actuarial Valuation as of August 31, 2016

Actuarially Sound Contribution (ERS)
15
23.21% 19.88%
9.50% 9.50%
9.50% 9.50%
0.50% 0.50%
0%
4%
8%
12%
16%
20%
24%
28%
FY 2018 ASC23.21%
FY 2018 Actual19.50%
FY 2017 ASC19.88%
FY 2017 Actual19.50%
ASC Employee State Employer
Shortfall 0.38%
Shortfall 3.71%

Funded Ratio History (ERS)
16
2001 2002 2003 2004 2005 2006 2007 2008 2009 2010 2011 2012 2013 2014 2015 2016 2017Funded Ratio on AVA 104.9 102.5 97.6% 97.3% 94.8% 95.2% 95.6% 92.6% 87.4% 83.2% 82.6% 81.0% 77.4% 77.2% 76.3% 75.2% 70.1%Funded Ratio on MVA 103.0 89.1% 87.5% 91.3% 93.1% 94.2% 97.9% 84.5% 71.0% 68.9% 73.0% 72.8% 71.7% 76.1% 70.9% 69.3% 70.1%
0%
20%
40%
60%
80%
100%
120%

Membership (ERS) (counts in 1000’s)
17
2001 2002 2003 2004 2005 2006 2007 2008 2009 2010 2011 2012 2013 2014 2015 2016 2017Actives 149 149 142 133 131 132 132 135 141 142 137 133 134 134 142 146 142Payees 48 52 59 62 66 68 70 73 76 79 83 88 91 96 100 104 108
0
20
40
60
80
100
120
140
160
Active membership increase in 2015 includes approximately 7,000 new members from the elimination of the 90-day wait on September 1, 2015.

2001 2002 2003 2004 2005 2006 2007 2008 2009 2010 2011 2012 2013 2014 2015 2016 2017Actual Payroll $4.9 $5.0 $4.8 $4.6 $4.8 $5.1 $5.3 $5.4 $5.8 $5.9 $5.8 $5.7 $6.0 $6.2 $6.7 $6.8 $6.8Projected Payroll $4.9 $5.1 $5.3 $5.5 $5.7 $5.9 $6.1 $6.3 $6.5 $6.7 $7.0 $7.2 $7.5 $7.7 $8.0 $8.3 $8.5
$0
$1
$2
$3
$4
$5
$6
$7
$8
$9
Payroll – Actual vs. Expected* (ERS) ($ in billions)
18
*Projected from 2001 using payroll growth assumption in effect
20% less payroll at 2017 than projected from 2001
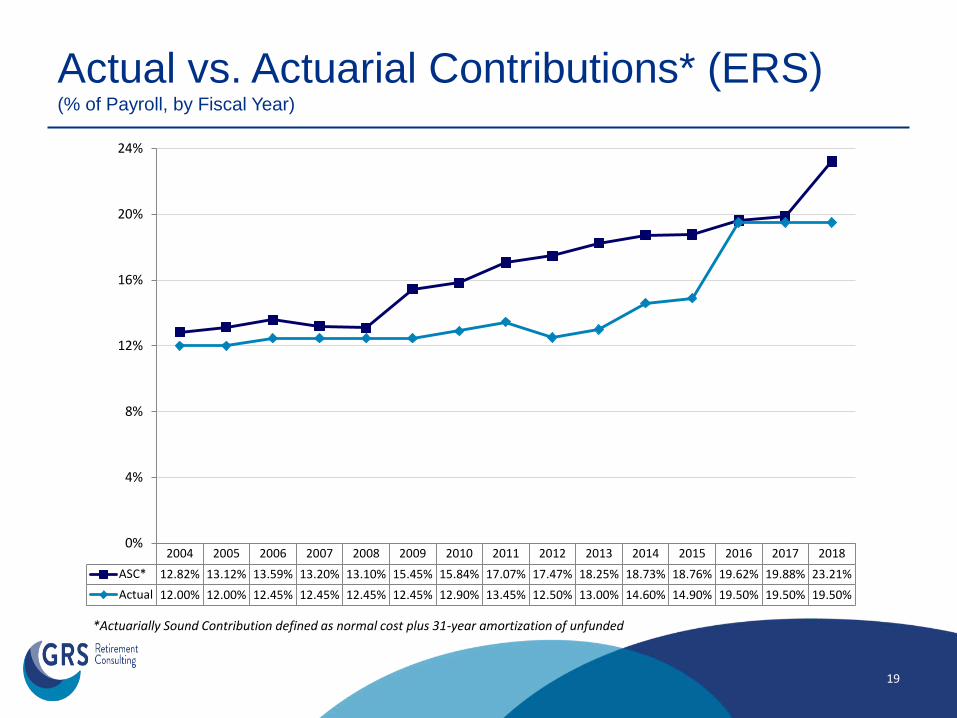
Actual vs. Actuarial Contributions* (ERS) (% of Payroll, by Fiscal Year)
19
*Actuarially Sound Contribution defined as normal cost plus 31-year amortization of unfunded
2004 2005 2006 2007 2008 2009 2010 2011 2012 2013 2014 2015 2016 2017 2018ASC* 12.82% 13.12% 13.59% 13.20% 13.10% 15.45% 15.84% 17.07% 17.47% 18.25% 18.73% 18.76% 19.62% 19.88% 23.21%Actual 12.00% 12.00% 12.45% 12.45% 12.45% 12.45% 12.90% 13.45% 12.50% 13.00% 14.60% 14.90% 19.50% 19.50% 19.50%
0%
4%
8%
12%
16%
20%
24%
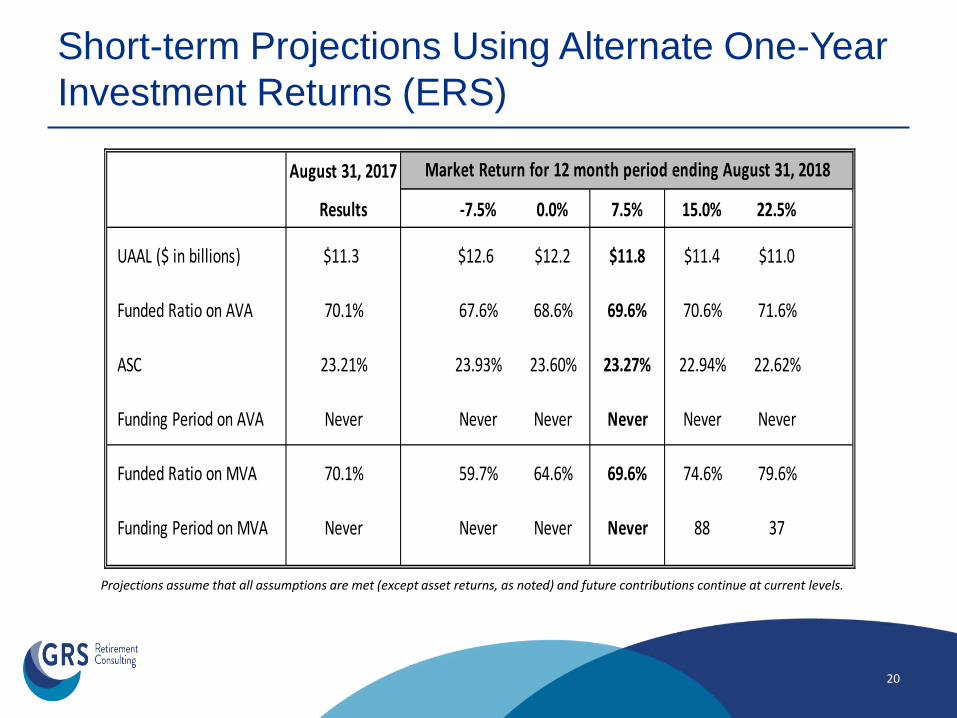
Short-term Projections Using Alternate One-Year Investment Returns (ERS)
20
Projections assume that all assumptions are met (except asset returns, as noted) and future contributions continue at current levels.
August 31, 2017
Results -7.5% 0.0% 7.5% 15.0% 22.5%
UAAL ($ in billions) $11.3 $12.6 $12.2 $11.8 $11.4 $11.0
Funded Ratio on AVA 70.1% 67.6% 68.6% 69.6% 70.6% 71.6%
ASC 23.21% 23.93% 23.60% 23.27% 22.94% 22.62%
Funding Period on AVA Never Never Never Never Never Never
Funded Ratio on MVA 70.1% 59.7% 64.6% 69.6% 74.6% 79.6%
Funding Period on MVA Never Never Never Never 88 37
Market Return for 12 month period ending August 31, 2018

21
Projections assume that all assumptions are met, including an 7.5% return on the market value of assets, and future contributions continue at current levels.
5-Year Funded Ratio and ASC Projections (ERS)
Actuarial Valuation as of August 31,
Funded Ratio on AVA ASC
Funding Period on AVA
2017 70.1% 23.21% Never2018 69.6% 23.27% Never2019 69.6% 23.33% Never2020 69.4% 23.40% Never2021 69.2% 23.47% Never
Projection Assuming 7.5% Investment Returns

22
Funded Ratio Projections (ERS)
Projections assume no changes to current assumptions and except actual asset returns, as noted, all other assumptions are met and future contributions continue at current levels.
0%
20%
40%
60%
80%
100%
2017 2022 2027 2032 2037 2042 2047 2052 2057 2062 2067
6.5% Return Scenario 7.5% Return Scenario
8.5% Return Scenario 7.8% Return Scenario
100% funded in 2048
“Tread water” scenario
Fund depleted in 2084
Fund depleted in 2057

23
Funded Ratio Projections (ERS)
Projections assume no changes to current assumptions and except State Contribution rates, as noted, all other assumptions are met.
0%
20%
40%
60%
80%
100%
2017 2022 2027 2032 2037 2042 2047 2052 2057 2062 20677.5% Return (Current State Contribution)
7.5% Return (+1% State Contribution)
7.5% Return (+2% State Contribution)
Fund depleted in 2084
68% funded after 100 years
100% funded in 2068

24
LECOSRF and JRS2
Funding Valuation Results at August 31, 2017

LECOSRF and JRS2 Results
• LECOSRF had a reduction in funded status – Contributions are not sufficient to sustain the plan – Projected depletion date in 2044
• JRS2 had a reduction in funded status – However, current statutory rates sufficient to
sustain the plan
25
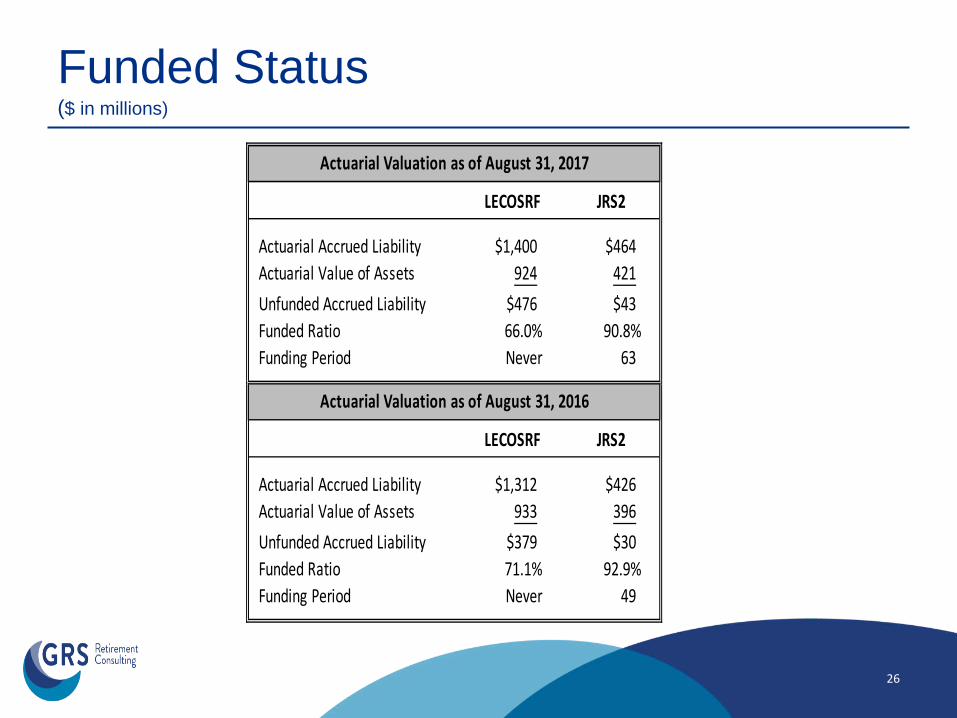
Funded Status ($ in millions)
26
LECOSRF JRS2
Actuarial Accrued Liability $1,400 $464Actuarial Value of Assets 924 421Unfunded Accrued Liability $476 $43Funded Ratio 66.0% 90.8%Funding Period Never 63
LECOSRF JRS2
Actuarial Accrued Liability $1,312 $426Actuarial Value of Assets 933 396Unfunded Accrued Liability $379 $30Funded Ratio 71.1% 92.9%Funding Period Never 49
Actuarial Valuation as of August 31, 2017
Actuarial Valuation as of August 31, 2016

Actuarially Sound Contribution (LECOSRF)
27
3.67% 3.10%
0.50% 0.50%
0.50% 0.50%
0.80% 0.77%
0%
1%
2%
3%
FY 2018 ASC3.67%*
FY 2018 Actual1.80%*
FY 2017 ASC3.10%*
FY 2017 Actual1.77%*
ASC Employee State Court Fees
Shortfall 1.87%
Shortfall 1.33%
*The 0.80% amount for LECOSRF is projected to be about $18.8 million for FY18, based on a 4-year average of actual revenues. The amount of court fees received by LECOSRF is not based on a percent of payroll and is expected to decline as a percent of payroll going forward.

Actuarially Sound Contribution (JRS2)
28
23.85% 23.48%
7.43% 7.44%
15.663% 15.663%
0%
5%
10%
15%
20%
25%
FY 2018 ASC23.85%
FY 2018 Actual23.093%
FY 2017 ASC23.48%
FY 2017 Actual23.103%
ASC Employee State
Shortfall 0.377%
Shortfall 0.757%
29
Accounting Results as of
August 31, 2017

Accounting Valuation Results
• ERS adopted GASB 67 for plan year ending August 31, 2014
• GASB 68 measures were included in Texas state reporting starting in fiscal year ending August 31, 2016 – State has elected to utilize one year reporting lag
GASB 67/68 valuation as of August 31, 2016 used for August 31, 2017 reporting
• GASB 73 outlines new reporting for JRS1
30

Determining Discount Rate
• Discount rate used in determining the Total Pension Liability (TPL) is a blend of two rates – Long-term expected rate of return on pension plan
investments (7.50% based on current investment policy) Can be used to discount plan obligations as long as there are
projected assets sufficient to pay projected plan benefits – Yield or index rate for a 20-year, tax-exempt general
obligation municipal bond (3.42% as of August 31, 2017) Used to discount plan obligations after the projected assets
have been extinguished – JRS1 uses municipal bond rate since there are no trust
assets 31

Accounting Valuation Results • ($ in millions)
32
August 31, 2017 ERS LECOSRF JRS2 JRS1
Single Discount Rate (SDR) 5.36% 4.21% 7.50% 3.42%
Total Pension Liability $48,237 $2,164 $464 $277
Plan Fiduciary Net Position 26,372 924 421 0
Net Pension Liability (NPL) 21,865 1,240 43 277
August 31, 2016
Single Discount Rate (SDR) 5.73% 3.69% 6.53% 2.84%
Total Pension Liability $44,223 $2,214 $486 $328
Plan Fiduciary Net Position 24,466 860 381 0
Net Pension Liability (NPL) 19,757 1,354 105 328

33
Summary

Summary • Changes in future expectations had a large impact on
the projected funded status of the plans • Asset experience exceeded expectations on a market
basis • For ERS and LECOSRF, current contribution level is not
sufficient to sustain the system – Without an increase of contributions over the current
schedule, or a reduction of benefits, the funded status will continue to decline
• Contribution rates and current level of plan benefits are sufficient to sustain JRS2 – However, there is no margin for adverse deviation or
response to additional cost pressures
34

Disclaimers
• This presentation is intended to be used in conjunction with the actuarial valuation reports issued in December 2017. This presentation should not be relied on for any purpose other than the purpose described in the valuation reports.
• This presentation shall not be construed to provide tax advice, legal advice or investment advice.
35
Employees Retirement System of Texas Annual Actuarial Valuation - Funding As of August 31, 2017
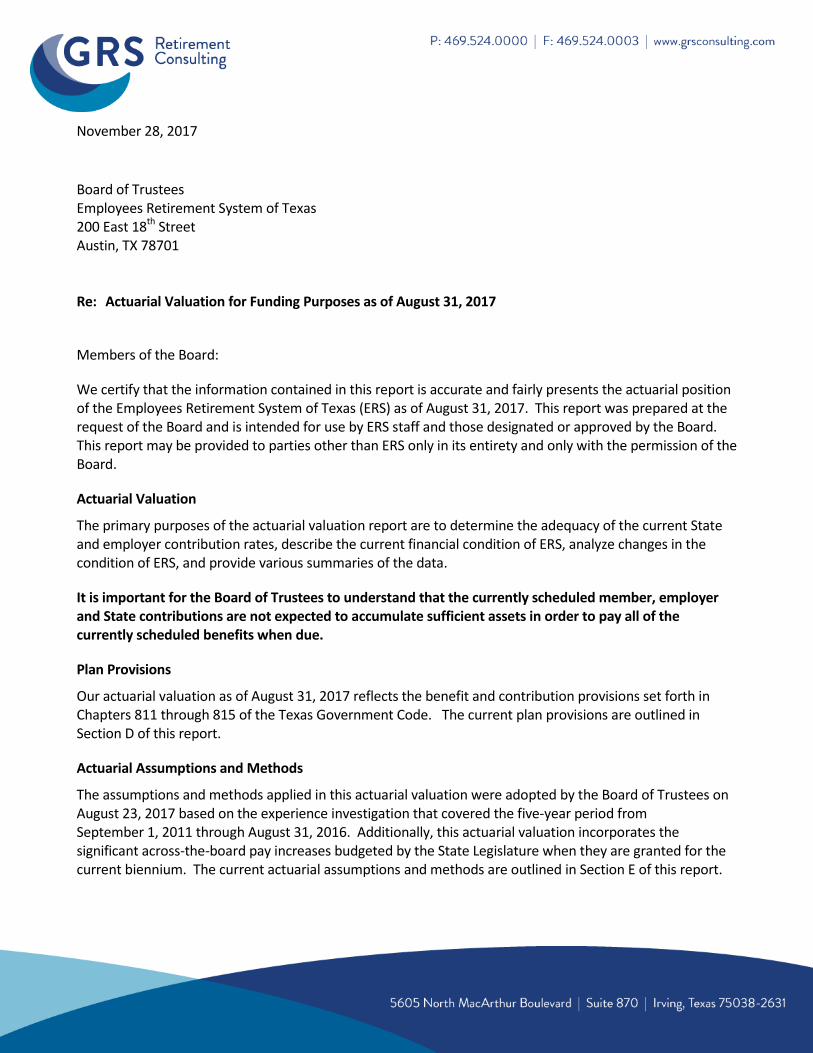
November 28, 2017
Board of Trustees Employees Retirement System of Texas 200 East 18th Street Austin, TX 78701 Re: Actuarial Valuation for Funding Purposes as of August 31, 2017
Members of the Board:
We certify that the information contained in this report is accurate and fairly presents the actuarial position of the Employees Retirement System of Texas (ERS) as of August 31, 2017. This report was prepared at the request of the Board and is intended for use by ERS staff and those designated or approved by the Board. This report may be provided to parties other than ERS only in its entirety and only with the permission of the Board.
Actuarial Valuation
The primary purposes of the actuarial valuation report are to determine the adequacy of the current State and employer contribution rates, describe the current financial condition of ERS, analyze changes in the condition of ERS, and provide various summaries of the data.
It is important for the Board of Trustees to understand that the currently scheduled member, employer and State contributions are not expected to accumulate sufficient assets in order to pay all of the currently scheduled benefits when due.
Plan Provisions
Our actuarial valuation as of August 31, 2017 reflects the benefit and contribution provisions set forth in Chapters 811 through 815 of the Texas Government Code. The current plan provisions are outlined in Section D of this report.
Actuarial Assumptions and Methods
The assumptions and methods applied in this actuarial valuation were adopted by the Board of Trustees on August 23, 2017 based on the experience investigation that covered the five-year period from September 1, 2011 through August 31, 2016. Additionally, this actuarial valuation incorporates the significant across-the-board pay increases budgeted by the State Legislature when they are granted for the current biennium. The current actuarial assumptions and methods are outlined in Section E of this report.

Board of Trustees November 28, 2017 Page 2
Data
The valuation was based upon information as of August 31, 2017, furnished by ERS staff, concerning system benefits, financial transactions, plan provisions and active members, terminated members, retirees and beneficiaries. We checked for internal and year-to-year consistency, but did not audit the data. We are not responsible for the accuracy or completeness of the information provided by ERS staff.
Certification
All of our work conforms with generally accepted actuarial principles and practices, and to the Actuarial Standards of Practice issued by the Actuarial Standards Board. In our opinion, our calculations also comply with the requirements of, where applicable, the Internal Revenue Code and ERISA.
The signing actuaries are independent of the plan sponsor. They are all Enrolled Actuaries, Fellows of the Society of Actuaries, and Members of the American Academy of Actuaries, and meet the Qualification Standards of the American Academy of Actuaries. Finally, each of the undersigned are experienced in performing valuations for large public retirement systems.
Respectfully submitted,
Gabriel, Roeder, Smith & Company
R. Ryan Falls, FSA, EA, MAAA Joseph P. Newton, FSA, EA, MAAA
Senior Consultant & Actuary Pension Market Leader & Actuary
Dana Woolfrey, FSA, EA, MAAA
Consultant & Actuary

Employees Retirement System of Texas
Table of Contents
Section
Cover Letter
Section A Executive Summary
Section B Discussion
Section C Tables
1 - Development of Employer Cost
2 - Actuarial Present Value of Future Benefits
3 - Analysis of Normal Cost
4 - Historical Summary of Active Member Data
5 - Reconciliation of Plan Net Assets
6 - Development of Actuarial Value of Assets
7 - History of Investment Return Rates
8 - History of Cash Flow
9 - Total Experience Gain or Loss
10 - Solvency Test
11 - Historical Contribution Rates
Section D Summary of Plan Provisions
Section E Summary of Actuarial Assumptions and Methods
Section F Detailed Summaries of Membership Data
Section G Glossary
Section H Law Enforcement and Custodial Officer (LECO) Plan Accounting

SECTION A
EXECUTIVE SUMMARY
Employees Retirement System of Texas A - 1
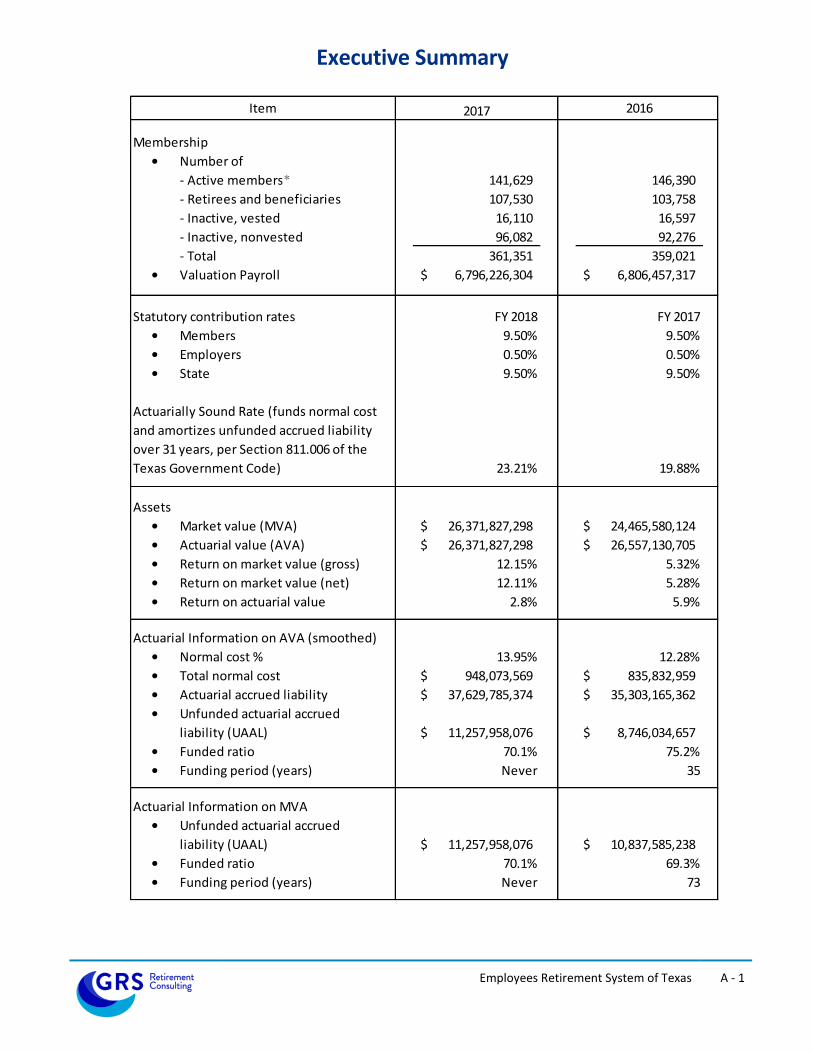
Executive Summary
2017 2016
Membership
• Number of
- Active members* 141,629 146,390
- Retirees and beneficiaries 107,530 103,758
- Inactive, vested 16,110 16,597
- Inactive, nonvested 96,082 92,276
- Total 361,351 359,021
• Valuation Payroll 6,796,226,304$ 6,806,457,317$
Statutory contribution rates FY 2018 FY 2017
• Members 9.50% 9.50%
• Employers 0.50% 0.50%
• State 9.50% 9.50%
Actuarially Sound Rate (funds normal cost
and amortizes unfunded accrued liability
over 31 years, per Section 811.006 of the
Texas Government Code) 23.21% 19.88%
Assets
• Market value (MVA) 26,371,827,298$ 24,465,580,124$
• Actuarial value (AVA) 26,371,827,298$ 26,557,130,705$
• Return on market value (gross) 12.15% 5.32%
• Return on market value (net) 12.11% 5.28%
• Return on actuarial value 2.8% 5.9%
Actuarial Information on AVA (smoothed)
• Normal cost % 13.95% 12.28%
• Total normal cost 948,073,569$ 835,832,959$
• Actuarial accrued liability 37,629,785,374$ 35,303,165,362$
• Unfunded actuarial accrued
liability (UAAL) 11,257,958,076$ 8,746,034,657$
• Funded ratio 70.1% 75.2%
• Funding period (years) Never 35
Actuarial Information on MVA
• Unfunded actuarial accrued
liability (UAAL) 11,257,958,076$ 10,837,585,238$
• Funded ratio 70.1% 69.3%
• Funding period (years) Never 73
Item
Employees Retirement System of Texas A - 2
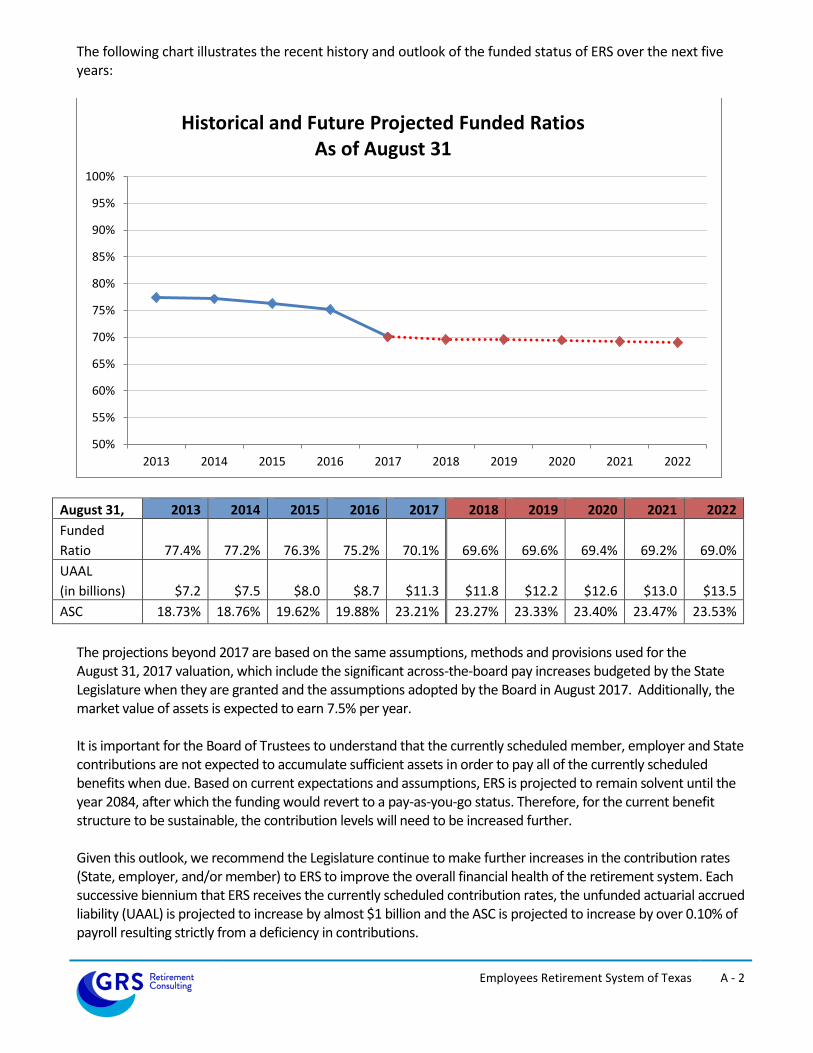
The following chart illustrates the recent history and outlook of the funded status of ERS over the next five years:
August 31, 2013 2014 2015 2016 2017 2018 2019 2020 2021 2022
Funded
Ratio
77.4%
77.2%
76.3%
75.2%
70.1%
69.6%
69.6%
69.4%
69.2%
69.0%
UAAL
(in billions) $7.2 $7.5 $8.0 $8.7 $11.3 $11.8 $12.2 $12.6 $13.0 $13.5
ASC 18.73% 18.76% 19.62% 19.88% 23.21% 23.27% 23.33% 23.40% 23.47% 23.53%
The projections beyond 2017 are based on the same assumptions, methods and provisions used for the August 31, 2017 valuation, which include the significant across-the-board pay increases budgeted by the State Legislature when they are granted and the assumptions adopted by the Board in August 2017. Additionally, the market value of assets is expected to earn 7.5% per year. It is important for the Board of Trustees to understand that the currently scheduled member, employer and State contributions are not expected to accumulate sufficient assets in order to pay all of the currently scheduled benefits when due. Based on current expectations and assumptions, ERS is projected to remain solvent until the year 2084, after which the funding would revert to a pay-as-you-go status. Therefore, for the current benefit structure to be sustainable, the contribution levels will need to be increased further. Given this outlook, we recommend the Legislature continue to make further increases in the contribution rates (State, employer, and/or member) to ERS to improve the overall financial health of the retirement system. Each successive biennium that ERS receives the currently scheduled contribution rates, the unfunded actuarial accrued liability (UAAL) is projected to increase by almost $1 billion and the ASC is projected to increase by over 0.10% of payroll resulting strictly from a deficiency in contributions.
50%
55%
60%
65%
70%
75%
80%
85%
90%
95%
100%
2013 2014 2015 2016 2017 2018 2019 2020 2021 2022
Historical and Future Projected Funded Ratios As of August 31

SECTION B
DISCUSSION

Employees Retirement System of Texas B - 1
Discussion
Introduction The results of the August 31, 2017 actuarial valuation of the Employees Retirement System of Texas (ERS) are presented in this report. The primary purposes of this actuarial valuation report are to determine the adequacy of the current State and employer contribution rates, describe the current financial condition of ERS, analyze the changes in the condition of ERS, and provide various summaries of the data. The total contribution rate for the current fiscal year exceeds the normal cost by 5.55% of payroll, which, on both an actuarial and market value of assets basis, is not sufficient to amortize the unfunded liability over a finite period of time. Based on current expectations and assumptions, ERS is expected to remain solvent until the year 2084, after which the funding would revert to a pay-as-you-go status. In the prior valuation, the total contribution rate was expected to be sufficient to amortize the unfunded liability over time. This change is primarily due to the changes in actuarial assumptions and methods described below. All of the tables referenced in the following discussion appear in Section C of this report. Plan Provisions There were no changes to the plan provisions during the past year. The current plan provisions are outlined in Section D of this report. Actuarial Assumptions and Methods The assumptions and methods applied in this actuarial valuation were adopted by the Board of Trustees on August 23, 2017 based on the experience investigation that covered the five-year period from September 1, 2011 through August 31, 2016. We believe the assumptions are internally consistent and are reasonable, based on the actual experience of ERS. A detailed account of the revised actuarial assumptions and methods can be found in our Actuarial Experience Study report dated June 28, 2017. A summary of key changes in assumptions and methods is highlighted below:
Economic Assumptions
Decrease the investment return assumption from 8.00% to 7.50%
Decrease the inflation assumption from 3.50% to 2.50%
No change to the salary scales above inflation for regular State employees. For LECO members, the merit component was increased by 0.50%, and thus when combined with the decrease in inflation, the nominal assumption is 0.50% lower than the previous assumption. Additionally, the step rates for LECO members were extended from 10 years of service to 19 years of service.
Establish a general wage inflation assumption of 0.50% above inflation, or 3.00%. Mortality Assumptions
The post-retirement mortality tables for non-disabled retirees are based on recent ERS experience. A one year set-forward is applied to male LECO members. Fully generational mortality
Employees Retirement System of Texas B - 2
improvements are assumed using the ultimate rates from the scale most recently published by Retirement Plans Experience Committee of the Society of Actuaries (“Scale U-MP”).
The post-retirement mortality tables for disabled retirees is based on the most recently published national tables, the RP-2014 tables for disabled lives. Fully generational mortality improvements are assumed using Scale U-MP.
The pre-retirement mortality tables for active employees are based on the most recently published national tables, the RP-2014 tables for employees. Fully generational mortality improvements are assumed using Scale U-MP.
Other Demographic Assumptions
Modifications to the methodologies used to project termination patterns for members, with small adjustments in the overall rates consistent with experience and future expectations.
Modifications to the methodologies used to project retirement patterns for members, with small adjustments in the overall rates consistent with experience and future expectations and to better reflect expected differences among the benefit groups.
Small decreases to the disability patterns for members consistent with experience and future expectations.
For LECO members that retire in the future, 40% of males are assumed to choose a 100% joint and survivor annuity option.
Actuarial Methods and Policies
Change in the asset smoothing method to a method that recognizes each year’s gain or loss over a closed five-year period. However, the method will continue to allow direct offsetting of gains and losses. The actuarial (smoothed) value of assets was set to equal to market value (mark to market) as of August 31, 2017, with the smoothing method to be applied prospectively.
Modified the application of the Entry Age Normal (EAN) actuarial cost method to base the normal cost rate on the benefits payable to each individual active member, generally referred to as “individual” EAN. Previously, the normal cost rate was based on the benefits payable to a new member and the entry age characteristics of the current active membership, generally referred to as “ultimate” EAN. As a result of this change, the funding period and Actuarially Sound Contribution (ASC) rate will be determined based on an open group projection.
The actuarial valuation as of August 31, 2017 incorporates the significant across-the-board pay increases budgeted by the State Legislature when they are granted for the current biennium. Specifically, employees were assumed to receive no across-the-board increase on September 1, 2017 or September 1, 2018. The results of the actuarial valuation are dependent upon the actuarial assumptions used. Actual results can and almost certainly will differ, as actual experience deviates from the assumptions. Even seemingly minor changes in the assumptions can materially change the liabilities, calculated contribution rates and funding periods. A review of the impact of a different set of assumptions on the funded status of ERS is outside the scope of this actuarial valuation. The current actuarial assumptions and methods are outlined in Section E of this report.
Employees Retirement System of Texas B - 3
Funding Adequacy The funding objective of ERS is to fund the sum of the normal cost and the amount necessary to amortize any unfunded actuarial accrued liability over a period that does not exceed 30 years by one or more years. Contribution rates should be established which, over time, will remain level as a percent of payroll. The member contribution rates are established by State statute and the State contribution rate is set by State statute and legislative appropriation. Members contribute 9.50% of payroll and the State is scheduled to contribute 10.00% of payroll (9.50% from statewide appropriations and 0.50% from agency appropriations) for each year in the future based on appropriations for the current biennium and expectations regarding future biennia. The long-term State contribution rates are subject to future legislative appropriations. The unfunded actuarial accrued liability (UAAL) of ERS increased from $8.7 billion as of August 31, 2016 to $11.3 billion as of August 31, 2017. Additionally, the funded ratio of ERS—actuarial value of assets divided by the actuarial accrued liability—decreased from 75.2% to 70.1% as of August 31, 2017. This decrease was primarily due to the changes in actuarial assumptions and methods adopted by the Board in August 2017. The funded status is one of many metrics used to show trends and develop future expectations about the health of a retirement system. The funded status measure itself is not appropriate for assessing the sufficiency of plan assets to cover the estimated cost of settling the plan’s benefit obligations or assessing the need for or the amount of future contributions since it does not reflect normal cost contributions, the timing of amortization payments, or future experience other than expected. The valuation shows that the total normal cost for funding purposes is 13.95% of payroll. The total contribution rate is currently 19.50% of payroll. Thus, the total contribution rate for the current fiscal year exceeds the normal cost by 5.55% of payroll which will be available to amortize the unfunded liability. As the number of members eligible for the newest benefit provisions increases over time, the normal cost rate is expected to decrease, and the amount available to amortize the unfunded liability will increase as a percentage of payroll. However, the projected contributions are not expected to be sufficient to eliminate the unfunded liability over a finite period of time. Assuming the market value of assets earns 7.5% per year, ERS is projected to remain solvent until the year 2084, after which the funding would revert to a pay-as-you-go status. Section 811.006 of the Texas Government Code limits the modifications to ERS that would, essentially, increase benefits or lower contributions to the trust unless the current level of benefits and contributions are considered actuarially sound. Section 811.006 defines actuarially sound as a retirement system that is receiving a total contribution rate sufficient to cover the normal cost, administrative expenses, and amortize the UAAL over a period of 31 years, or less. Based on the actuarial valuation as of August 31, 2017, the Actuarially Sound Contribution (ASC) rate for ERS is 23.21% of payroll. As noted, the ASC is currently calculated based on a 31-year open amortization period. This means that the ASC will always be calculated with the same 31-year period and the UAAL would never completely be eliminated. Even though the contributions to ERS are not based on this ASC, the Board may want to consider adopting a funding policy that includes an ultimate goal of eliminating the UAAL by a certain date. This type of funding policy will allow the Board to better assess the level of contributions received from the employers and the State.
Employees Retirement System of Texas B - 4
System Assets This report contains several tables that summarize key information with respect to the ERS assets. The total market value of assets increased from $24.5 billion to $26.4 billion as of August 31, 2017. Table 5 reconciles the changes in the fund during the year. Total contributions increased slightly from $1,361 million to $1,386 million. Table 6 shows the development of the actuarial value of assets. As part of the actuarial experience study and adoption of revised actuarial assumptions and methods, the Board voted to reset the actuarial value of assets (AVA) to be equal to the market value of assets (MVA), or “mark to market” as of August 31, 2017. In subsequent years the AVA will be calculated using a new method. The new method will recognize each year’s gain or loss over a closed five year period. However, the method will continue to allow direct offsetting of gains and losses. When measured on a market value, the approximate gross investment return for the fiscal year ending August 31, 2017 was 12.15%, and the return net of investment expenses was 12.11%. When measured on an actuarial value, the net investment return was 2.8%. The lower return on an actuarial basis is due to the transition to the new asset smoothing method as of August 31, 2017. Table 7 shows a history of return rates. The ERS ten-year average market return, gross of all expenses as reported by the ERS Master Trust Custodian, is 5.67%. The ten-year average return net of investment expenses is 5.54%. Table 8 provides a history of the contributions paid into ERS and the administrative expenses and benefit payments that have been paid out of ERS. This table shows that ERS paid administrative expenses and benefit payments, in excess of contributions received, of $806 million (or 3.3% of assets) in fiscal year 2016 and the amount was $926 million (or 3.5% of assets) in fiscal year 2017. ERS should continue to monitor this deficit as it could impact the future liquidity needs of ERS. Table 11 provides a history of contribution rates, as a percent of payroll, paid into the trust by the State, agencies, and members. This table also shows a history of the total normal cost and the Actuarially Sound Contribution (ASC), as defined by Section 811.006 of the Texas Government Code. Data The valuation was based upon information as of August 31, 2017, furnished by ERS staff, concerning system benefits, financial transactions, plan provisions and active members, terminated members, retirees and beneficiaries. We checked for internal and year-to-year consistency, but did not otherwise audit the data. We are not responsible for the accuracy or completeness of the information provided by ERS staff. The tables in Section F show key census statistics for the various groups included in the valuation.

SECTION C
TABLES

Employees Retirement System of Texas C - 1
Table 1 Development of Employer Cost
August 31, 2017 August 31, 2017 August 31, 2016
Final Assumptions Prior Assumptions
1. Payroll
a. Reported Payroll (August Payroll of Active Members) 6,796,226,304$ 6,796,226,304$ 6,806,457,317$
b. Valuation Payroll (Expected Covered Payroll for
Following Plan Year) 6,796,226,304 6,796,226,304 6,806,457,317
2. Total Normal Cost Rate
a. Gross normal cost rate 13.62% 12.03% 12.03%
b. Administrative expenses 0.33% 0.25% 0.25%
c. Total (Item 2a + Item 2b) 13.95% 12.28% 12.28%
3. Actuarial Accrued Liability for Active Members
a. Present value of future benefits for active members 20,957,726,436$ 19,874,913,086$ 20,307,684,320$
b. Less: present value of future normal costs (6,298,157,130) (5,352,499,726) (5,429,877,061)
c. Actuarial accrued liability 14,659,569,306$ 14,522,413,360$ 14,877,807,259$
4. Total Actuarial Accrued Liability for:
a. Retirees and beneficiaries 21,378,759,742$ 19,993,121,879$ 19,017,977,910$
b. Inactive members 1,591,456,326 1,458,569,867 1,407,380,193
c. Active members (Item 3c) 14,659,569,306 14,522,413,360 14,877,807,259
d. Total 37,629,785,374$ 35,974,105,106$ 35,303,165,362$
5. Actuarial Value of Assets 26,371,827,298$ 27,448,977,878$ 26,557,130,705$
6. Unfunded Actuarial Accrued Liability
(UAAL) (Item 4d - Item 5) 11,257,958,076$ 8,525,127,228$ 8,746,034,657$
7. Contribution Rate Needed to Fund Normal Cost Plus
Amortize the UAAL Over 31 Years 23.21% 19.94% 19.88%
8. Allocation of Contribution Rate
a. Combined State and employer rates 10.00% 10.00% 10.00%
b. Member rate 9.50% 9.50% 9.50%
c. Total contribution rate 19.50% 19.50% 19.50%
d. Total normal cost rate 13.95% 12.28% 12.28%
e. Available contribution rate to amortize UAAL 5.55% 7.22% 7.22%
f. Total contribution rate 19.50% 19.50% 19.50%
9. Funding period based on statutory contribution rates
and Actuarial Value of Assets (years) Never 36 35

Employees Retirement System of Texas C - 2
Table 2 Actuarial Present Value of Future Benefits
August 31, 2017 August 31, 2017 August 31, 2016
Final Assumptions Prior Assumptions
1. Active Members
a. Service Retirement 18,996,374,108$ 18,050,093,694$ 18,497,623,991$
b. Disability Benefits 159,942,672 290,240,164 289,378,636
c. Death Before Retirement 241,281,528 300,702,101 305,729,174
d. Termination 1,560,128,128 1,233,877,127 1,214,952,519
e. Total 20,957,726,436$ 19,874,913,086$ 20,307,684,320$
2. Inactive Members 1,591,456,326$ 1,458,569,867$ 1,407,380,193$
3. Annuitants 21,378,759,742$ 19,993,121,879$ 19,017,977,910$
4. Total Actuarial Present Value 43,927,942,504$ 41,326,604,832$ 40,733,042,423$ of Future Benefits

Employees Retirement System of Texas C - 3
Table 3 Analysis of Normal Cost
August 31, 2017 August 31, 2017 August 31, 2016
Final Assumptions Prior Assumptions
1. Gross Normal Cost Rate
a. Service Retirement 9.72% 8.63% 8.63%
b. Disability Benefits 0.14% 0.28% 0.28%
c. Death Before Retirement 0.18% 0.24% 0.24%
d. Termination 3.58% 2.88% 2.88%
e. Total 13.62% 12.03% 12.03%
2. Administrative Expenses 0.33% 0.25% 0.25%
3. Total Normal Cost 13.95% 12.28% 12.28%
4. Less: Member Rate 9.50% 9.50% 9.50%
5. Employer Normal Cost Rate 4.45% 2.78% 2.78%

Employees Retirement System of Texas C - 4
Table 4 Historical Summary of Active Member Data
Valuation as of Percent Amount in Percent Percent Average Average
August 31, Number Increase $ Millions Increase $ Amount Increase Age Service
(1) (2) (3) (4) (5) (6) (7) (8) (9)
2008 134,626 N/A 5,313 N/A 39,468 N/A 43.7 9.4
2009 141,223 4.9% 5,677 6.8% 40,202 1.9% 43.6 9.2
2010 142,490 0.9% 5,845 3.0% 41,022 2.0% 43.8 9.2
2011 137,293 -3.6% 5,714 -2.2% 41,620 1.5% 44.1 9.5
2012 132,669 -3.4% 5,597 -2.0% 42,188 1.4% 44.3 9.7
2013 133,669 0.8% 5,689 1.7% 42,564 0.9% 44.3 9.6
2014 134,162 0.4% 5,953 4.6% 44,374 4.3% 44.3 9.4
2015 142,409 6.1% 6,407 7.6% 44,990 1.4% 43.6 8.8
2016 146,390 2.8% 6,806 6.2% 46,495 3.3% 43.3 8.5
2017 141,629 -3.3% 6,796 -0.2% 47,986 3.2% 43.6 8.7
Active Members Covered Payroll Average Salary
Employees Retirement System of Texas C - 5
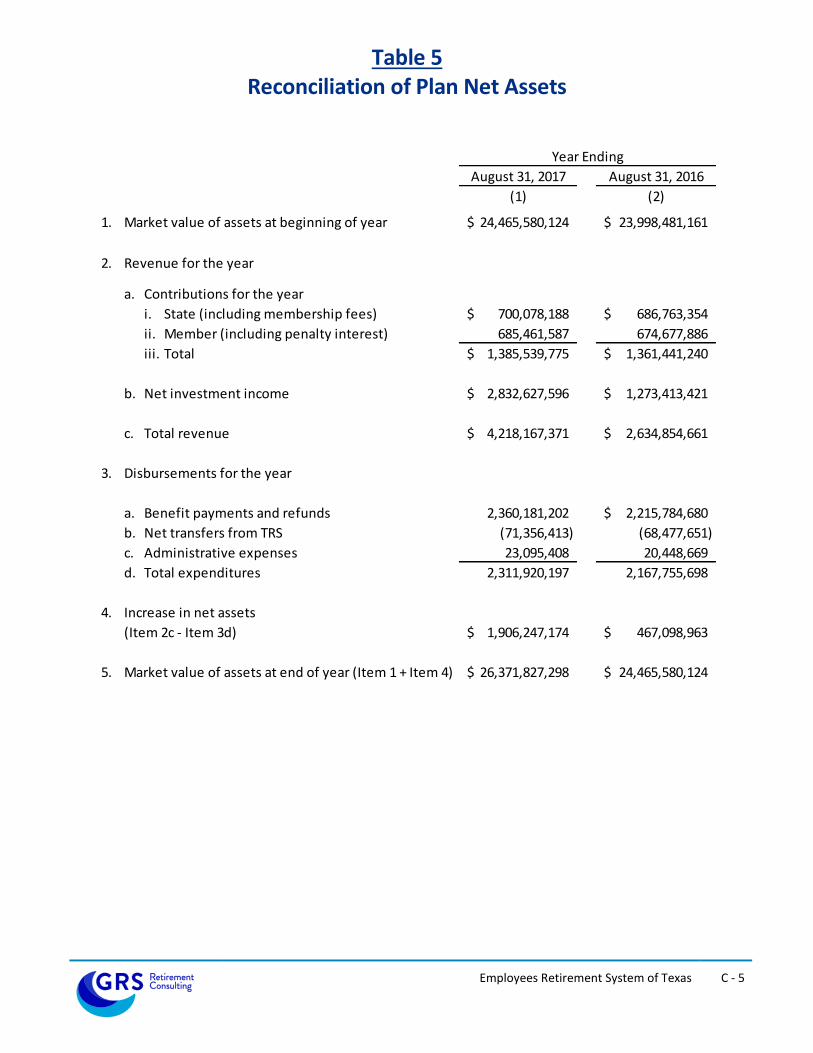
Table 5 Reconciliation of Plan Net Assets
August 31, 2017 August 31, 2016
(1) (2)
1. Market value of assets at beginning of year 24,465,580,124$ 23,998,481,161$
2. Revenue for the year
a. Contributions for the year
i. State (including membership fees) 700,078,188$ 686,763,354$
ii. Member (including penalty interest) 685,461,587 674,677,886
iii. Total 1,385,539,775$ 1,361,441,240$
b. Net investment income 2,832,627,596$ 1,273,413,421$
c. Total revenue 4,218,167,371$ 2,634,854,661$
3. Disbursements for the year
a. Benefit payments and refunds 2,360,181,202 2,215,784,680$
b. Net transfers from TRS (71,356,413) (68,477,651)
c. Administrative expenses 23,095,408 20,448,669
d. Total expenditures 2,311,920,197 2,167,755,698
4. Increase in net assets
(Item 2c - Item 3d) 1,906,247,174$ 467,098,963$
5. Market value of assets at end of year (Item 1 + Item 4) 26,371,827,298$ 24,465,580,124$
Year Ending

Employees Retirement System of Texas C - 6
Table 6 Development of Actuarial Value of Assets
Year Ending
August 31, 2017
1. Actuarial value of assets at beginning of year 26,557,130,705$
2. Net new investments
a. Contributions for the year (Table 5) 1,385,539,775$
b. Disbursements for the year (Table 5) (2,311,920,197)
c. Subtotal (926,380,422)
3. Assumed investment return rate 7.50%
4. Expected return 1,957,045,537$
5. Expected actuarial value of assets at end of year
(Item 1 + Item 2c + Item 4) 27,587,795,820$
6. Market value of assets at end of year 26,371,827,298$
7. Market Adjustment as of August 31, 2017* (1,215,968,522)$
8. Actuarial value of assets (Item 5 + Item 7) 26,371,827,298$
9. Estimated rate of return 2.8%
10. Actuarial value as percentage of market value 100.0%
* A one-time adjustment to reset the actuarial value to market value was applied as of
August 31, 2017. Smoothing will be applied in future valuation reports.

Employees Retirement System of Texas C - 7
Table 7 History of Investment Return Rates
Year Ending Market Market
August 31 of Returns (Gross) Returns (Net) Actuarial
(1) (2) (3) (4)
1998 8.30% 8.23% 11.5%
1999 16.26% 16.46% 12.5%
2000 9.43% 9.40% 11.8%
2001 -6.91% -6.93% 7.6%
2002 -7.17% -7.21% 4.7%
2003 9.20% 9.14% 5.4%
2004 11.69% 11.64% 6.4%
2005 12.71% 12.62% 7.5%
2006 8.83% 8.76% 7.7%
2007 13.88% 13.76% 8.6%
2008 -4.58% -4.69% 5.7%
2009 -6.60% -6.71% 3.2%
2010 6.65% 6.48% 3.6%
2011 12.58% 12.36% 5.0%
2012 8.22% 8.04% 5.4%
2013 10.07% 9.87% 6.1%
2014 14.70% 14.58% 7.6%
2015 0.49% 0.44% 6.1%
2016 5.32% 5.28% 5.9%
2017 12.15% 12.11% 2.8%
Average Returns
Last Five Years: 8.43% 8.34% 5.7%
Last Ten Years: 5.67% 5.54% 5.1%
Last Fifteen Years: 7.49% 7.39% 5.8%
Last Twenty Years: 6.49% 6.41% 6.7% Market returns provided by ERS Master Trust Custodian.
Rates in Column (2) represent the market returns gross of all expenses. Rates in Column (3) represent the market returns net of investment expenses. Net returns may exceed gross returns in years where adjustments are made to fee expenses.

Employees Retirement System of Texas C - 8
Table 8 History of Cash Flow
External External Cash
Year Ending Benefit Payments Administrative Cash Flow Market Value Flow as Percent
August 31, Contributions and Refunds Expenses Total for the Year of Assets of Market Value
(1) (2) (3) (5) (6) (7) (8) (9)
2007 657.7$ (1,333.2)$ (16.0)$ (1,349.2)$ (691.5)$ 23,480$ -2.9%
2008 678.8 (1,383.9) (16.2) (1,400.1) (721.3) 21,464 -3.4%
2009 716.1 (1,449.0) (17.3) (1,466.3) (750.2) 19,098 -3.9%
2010 810.4 (1,512.4) (19.0) (1,531.4) (721.0) 19,581 -3.7%
2011 839.9 (1,612.5) (18.8) (1,631.3) (791.4) 21,204 -3.7%
2012 758.1 (1,733.7) (17.8) (1,751.5) (993.4) 21,826 -4.6%
2013 798.3 (1,834.4) (18.7) (1,853.1) (1,054.8) 22,869 -4.6%
2014 912.8 (1,963.5) (20.2) (1,983.7) (1,070.9) 25,050 -4.3%
2015 962.6 (2,049.3) (21.8) (2,071.1) (1,108.5) 23,998 -4.6%
2016 1,361.4 (2,147.3) (20.4) (2,167.7) (806.3) 24,466 -3.3%
2017 1,385.5 (2,288.8) (23.1) (2,311.9) (926.4) 26,372 -3.5%
Dollar amounts in mill ions
Column (7) = Column (2) + Column (6).
Distributions and Expenditures

Employees Retirement System of Texas C - 9
Table 9 Total Experience Gain or Loss
Year Ending Year Ending
August 31, 2017 August 31, 2016
(2) (3)
A. Calculation of total actuarial gain or loss
1. Unfunded actuarial accrued liability (UAAL), previous year 8,746,034,657$ 8,017,817,926$
2. Assumption/Method changes - Liability Only 1,473,636,172$ 0$
3. UAAL, previous year, after assumption changes (Item 1 + Item 2) 10,219,670,829$ 8,017,817,926$
4. Normal cost for the year (excluding administrative expenses) 930,442,715 800,489,556
5. Actual administrative expenses 23,095,408 20,448,669
6. Contributions for the year (excluding service purchases) (1,345,514,398) (1,321,742,138)
7. Interest at 7.5% for FYE 2017, 8% for FYE 2016
a. On UAAL 766,475,312$ 641,425,434$
b. On normal cost and administrative expenses 35,757,680 32,837,529
c. On contributions (50,456,790) (52,869,686)
d. Total 751,776,202$ 621,393,277$
8. Legislative changes*– Across-the-board pay increases budgeted for
upcoming biennium by the State Legislature (616,581,747) 0
9. Expected UAAL (Sum of Items 3 through 8) 9,962,889,009 8,138,407,290
10. Actual UAAL 11,257,958,076 8,746,034,657
11. Total (gain)/loss for the year (Item 10 - Item 9) 1,295,069,067$ 607,627,367$
B. Source of gains and losses
12. Asset (Gain)/Loss for the year - Prior Smoothing Method 0.00% 0$ 522,887,645$
13. Asset (Gain)/Loss for the year - New Smoothing Method 3.23% 1,215,968,522 0
14. Pay Increases (Less)/Greater than Expected 0.26% 98,199,712 39,084,397
15. Non-Retired Demographic (Gains)/Losses 0.06% 20,900,814 (9,121,228)
16. Post-Retirement Mortality (Gains)/Losses 0.10% (35,749,657) 19,613,169
17. Other Demographic (Gains)/Losses 0.01% (4,250,324) 35,163,384
18. Total (Sum of Items 12 through 17) 3.44% 1,295,069,067$ 607,627,367$
Item
(1)
% of
AAL
* The plan experiences a (gain)/loss when across-the-board pay increases budgeted by the State Legislature
are (less)/greater than assumed.
Employees Retirement System of Texas C - 10
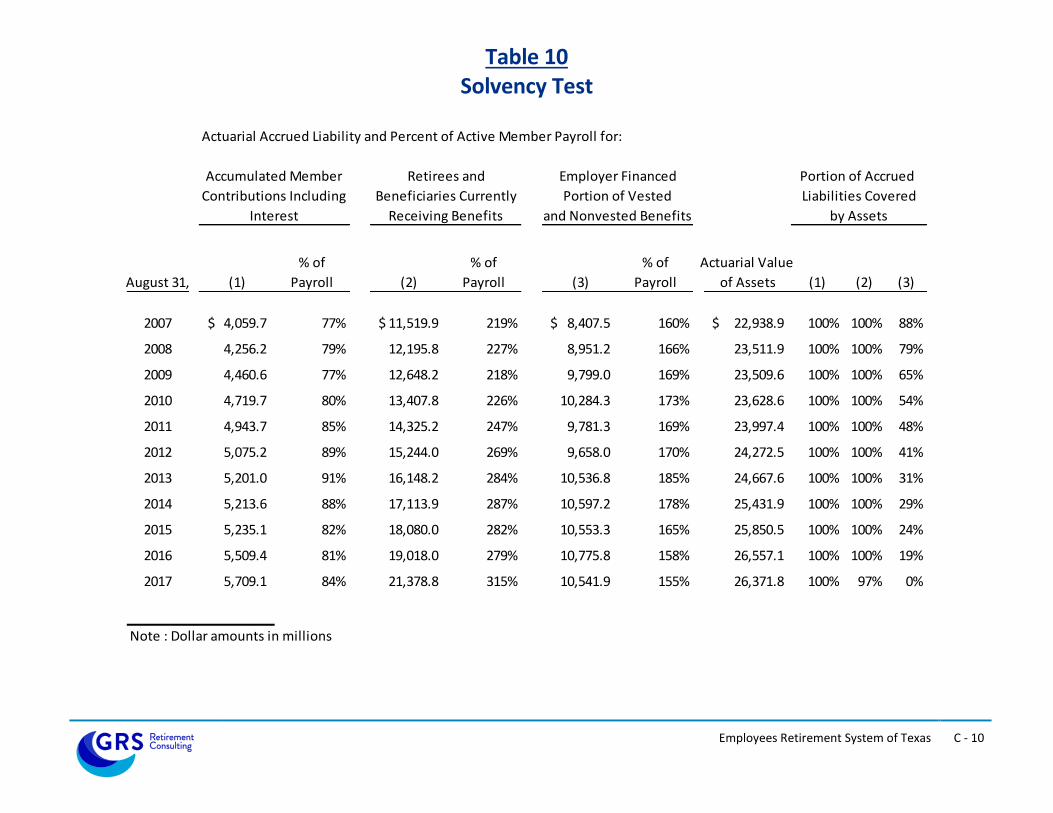
Table 10 Solvency Test
Actuarial Accrued Liability and Percent of Active Member Payroll for:
% of % of % of Actuarial Value
August 31, (1) Payroll (2) Payroll (3) Payroll of Assets (1) (2) (3)
2007 4,059.7$ 77% 11,519.9$ 219% 8,407.5$ 160% 22,938.9$ 100% 100% 88%
2008 4,256.2 79% 12,195.8 227% 8,951.2 166% 23,511.9 100% 100% 79%
2009 4,460.6 77% 12,648.2 218% 9,799.0 169% 23,509.6 100% 100% 65%
2010 4,719.7 80% 13,407.8 226% 10,284.3 173% 23,628.6 100% 100% 54%
2011 4,943.7 85% 14,325.2 247% 9,781.3 169% 23,997.4 100% 100% 48%
2012 5,075.2 89% 15,244.0 269% 9,658.0 170% 24,272.5 100% 100% 41%
2013 5,201.0 91% 16,148.2 284% 10,536.8 185% 24,667.6 100% 100% 31%
2014 5,213.6 88% 17,113.9 287% 10,597.2 178% 25,431.9 100% 100% 29%
2015 5,235.1 82% 18,080.0 282% 10,553.3 165% 25,850.5 100% 100% 24%
2016 5,509.4 81% 19,018.0 279% 10,775.8 158% 26,557.1 100% 100% 19%
2017 5,709.1 84% 21,378.8 315% 10,541.9 155% 26,371.8 100% 97% 0%
Note : Dollar amounts in millions
Liabilities Covered
by Assets
Employer Financed
Portion of Vested
and Nonvested BenefitsInterest
Retirees and
Beneficiaries Currently
Receiving Benefits
Accumulated Member
Contributions Including
Portion of Accrued

Employees Retirement System of Texas C - 11
Table 11 Historical Contribution Rates
Total Normal
State Agency Members Total Cost Rate ASC *
1998 6.00% 0.00% 6.00% 12.00% 11.86% Not calculated
1999 6.00% 0.00% 6.00% 12.00% 12.33% Not calculated
2000 6.00% 0.00% 6.00% 12.00% 12.41% Not calculated
2001 6.00% 0.00% 6.00% 12.00% 12.67% Not calculated
2002 6.00% 0.00% 6.00% 12.00% 12.71% Not calculated
2003 6.00% 0.00% 6.00% 12.00% 12.26% 12.82%
2004 6.00% 0.00% 6.00% 12.00% 12.45% 13.12%
2005 6.45% 0.00% 6.00% 12.45% 12.28% 13.59%
2006 6.45% 0.00% 6.00% 12.45% 11.98% 13.20%
2007 6.45% 0.00% 6.00% 12.45% 11.98% 13.10%
2008 6.45% 0.00% 6.00% 12.45% 13.37% 15.45%
2009 ** 6.78% 0.00% 6.48% 13.26% 12.38% 15.84%
2010 6.95% 0.00% 6.50% 13.45% 12.30% 17.07%
2011 6.00% 0.00% 6.50% 12.50% 12.31% 17.47%
2012 6.50% 0.00% 6.50% 13.00% 12.31% 18.25%
2013 7.50% 0.50% 6.60% 14.60% 11.57% 18.73%
2014 7.50% 0.50% 6.90% 14.90% 11.58% 18.76%
2015 9.50% 0.50% 9.50% 19.50% 12.27% 19.62%
2016 9.50% 0.50% 9.50% 19.50% 12.28% 19.88%
2017 9.50% 0.50% 9.50% 19.50% 13.95% 23.21%
** For Fiscal Year 2010, members contributed 6.45% from September through December and 6.50% from January
through August. Similarly, the State contributed 6.45% from September through December and 6.95% from January
through August.
* The Actuarially Sound Contribution Rate (ASC) is the rate determined as of the valuation date to fund the normal
cost and amortize the UAAL over a 31 year period.
Contributions from:Actuarial
Valuation as
of August 31,

SECTION D
SUMMARY OF PLAN PROVISIONS

Employees Retirement System of Texas D - 1
Summary of Plan Provisions for Employees Retirement System of Texas
Classes of Membership
1. Elected Class Membership:
a. Membership is optional and limited to:
i. Elected State officials not covered by either of the Judicial Retirement Systems
ii. Members of the Legislature; and
iii. District and Criminal District Attorneys paid by the State general revenue fund.
2. Employee Class Membership:
a. Membership is mandatory for all employees and appointed officers of every department, commission, board, agency, or institution of the State except for:
i. Independent contractors;
ii. Persons covered by the Teacher Retirement System or either of the Judicial Retirement Systems; and
iii. Employee Class Members already receiving retirement benefits under the System.
b. Includes two types of Employee Class service:
i. CPO/CO: Certified Peace Officer / Custodial Officer – in general, service rendered while a law enforcement officer, custodial officer, parole officer or caseworker (collectively referred to as “LECOs”); and
ii. Regular: Non-CPO/CO service.
c. Prior to September 1, 2015, membership begins after a 90-day waiting period. Effective September 1, 2015, membership begins immediately.
Member Contributions
1. Elected Class:
a. Legislators:
i. Fiscal year 2015: 8.00% of compensation
ii. Fiscal year 2016 and beyond: 9.50% of compensation
b. Non-legislators:
i. Fiscal year 2015: 6.90% of compensation
ii. Fiscal year 2016 and beyond: 9.50% of compensation. Beginning in fiscal year 2018, the 9.50% will be reduced one-tenth of one percent for each one-tenth of one percent that the State contribution rate for the fiscal year to which the service relates is less than the State contribution rate established for the 2017 fiscal year.

Employees Retirement System of Texas D - 2
2. Employee Class:
a. Fiscal year 2015: 6.90% of compensation
b. Fiscal year 2016 and beyond: 9.50% of compensation. Beginning in fiscal year 2018, the 9.50% will be reduced one-tenth of one percent for each one-tenth of one percent that the State contribution rate for the fiscal year to which the service relates is less than the State contribution rate established for the 2017 fiscal year.
c. Additional member contributions may be allowable for service purchases.
3. Member contributions cease when a member’s benefit accrual has reached 100% of Average Monthly Compensation.
4. Member contributions accumulate interest at 5.00% per year through December 31, 2013 and 2.00% interest per year, thereafter.
State of Texas and Employer Contributions
State and employer contributions are set biennially by the legislature. The current projected contribution rates, as a percentage of compensation, are shown below. In addition, the State makes contributions for lump-sum death benefits, establishing service not previously established, and annual membership fees. State payroll contributions cease when a member’s benefit accrual has reached 100% of Average Monthly Compensation.
FY2015 FY2016
FY2017 and
beyond
Employer (agency appropriations) 0.50% 0.50% 0.50%
State (statewide appropriations) 7.50% 9.50% 9.50%
State contributions after the 2019 fiscal year are subject to future legislative appropriations.
Return to Work Surcharge
For members who, on or after September 1, 2009, retire from the employee class and are rehired as a retiree into a position that would otherwise include membership in the employee class, the department or agency that employs the member must remit to the retirement system an amount equal to the amount of the State contribution that the department or agency would remit for an active member employed in the person's position.
Compensation
Compensation includes base salary, longevity and hazardous duty pay and excludes overtime pay. This amount is limited by Section 401(a)(17) of the Internal Revenue Code for members hired after August 31, 1996.
Employees Retirement System of Texas D - 3
Average Monthly Compensation (AMC)
1. Elected Class Service: The State salary, excluding longevity pay, of a district judge, as adjusted from time to time.
2. Employee Class Service:
a. Members hired prior to September 1, 2009: Average of the 36 highest months of compensation for service in the employee class of membership
b. Members hired on or after September 1, 2009 and prior to September 1, 2013: Average of the 48 highest months of compensation for service in the employee class of membership
c. Members hired on or after September 1, 2013: Average of the 60 highest months of compensation for service in the employee class of membership
Creditable Service
The types of service creditable in ERS are membership service, military service and equivalent membership service. Equivalent membership service includes: previously cancelled service, service not previously established, waiting period service, and Additional Service Credit.
Unused Sick and Annual Leave
In many cases, unused sick and annual leave can be used to establish Creditable Service. Members hired prior to September 1, 2009 can use unused sick and annual leave to satisfy service requirements for Retirement and Death Benefit Plan eligibility as well as to calculate plan benefits. Members hired on or after September 1, 2009 can only use unused sick and annual leave to calculate plan benefits. However, members hired on or after September 1, 2013 cannot use unused annual leave to calculate plan benefits if the member opts to receive the unused annual leave as a lump-sum payment. Elected Class service is not granted for unused sick and annual leave.
Standard Service Retirement Annuity
1. Elected Class:
a. Eligibility:
i. Age 60 and eight years of elected class service; or
ii. Age 50 and 12 years of elected class service.
b. Benefits: 2.3% of AMC times years of Creditable Service, adjusted automatically based on the State salary of a district judge. Alternatively, an elected class member may elect to transfer their elected class service to the employee class in order to have their AMC based on actual compensation. However, if the elected service is transferred to the employee class, the member forfeits increases based on changes in the State salary of a district judge unless the service is transferred back to the elected class.

Employees Retirement System of Texas D - 4
2. Employee Class:
a. Eligibility:
i. Members hired prior to September 1, 2009: Age 60 with five years of employee class service;
ii. Members hired on or after September 1, 2009: Age 65 with 10 years of employee class service;
iii. Five years of service and age plus employee class service is at least 80 (Rule of 80)
iv. Age 55 with 10 years of CPO/CO service
v. Any age with 20 years of CPO/CO service
b. Benefits: 2.3% of AMC times years of Creditable Service
c. Applicable Reductions for eligibilities 2.a.iii. and 2.a.iv.:
i. For members hired prior to September 1, 2009, none.
ii. For members hired on or after September 1, 2009, but prior to September 1, 2013, reduced five percent for each year the member retires prior to age 60, with a maximum possible reduction of 25 percent.
iii. For members hired on or after September 1, 2013, reduced five percent for each year the member retires prior to age 62, with no maximum possible reduction.
d. Applicable Reductions for eligibility 2.a.v.:
i. For members hired prior to September 1, 2009, retiring after attaining age 50 or after attaining Rule of 80, there is no reduction. Otherwise, the member receives the percentage of the benefit stated in the following table:
Attained Age at Retirement
Reduction Percentage
Attained Age at Retirement
Reduction Percentage
36 31.2% 43 55.3%
37 33.9% 44 60.1%
38 36.7% 45 65.3%
39 39.8% 46 71.1%
40 43.2% 47 77.3%
41 46.9% 48 84.2%
42 50.9% 49 91.7%
ii. For members hired after on or after September 1, 2009, but prior to September 1, 2013, reduced five percent for each year the member retires prior to age 55, with a maximum possible reduction of 25 percent.
iii. For members hired on or after September 1, 2013, reduced five percent for each year the member retires prior to age 57, with no maximum possible reduction.
3. Normal Form of Payment: Payable for the life of the member with any remaining member account balance paid at time of death. Survivorship options and partial lump-sum option are available on an actuarially equivalent basis.

Employees Retirement System of Texas D - 5
Standard Non-Occupational Disability Annuity
1. Elected Class:
a. Eligibility:
i. 8 years of elected class service; or
ii. 6 years of elected class service plus 2 years of pre-1978 military service; and
iii. Not eligible for a Standard Service Retirement Annuity.
b. Benefits: 2.3% of AMC times years of Creditable Service, adjusted automatically based on the State salary of a district judge.
2. Employee Class:
a. Eligibility:
i. 10 years of employee class service; and
ii. Not eligible for a Standard Service Retirement Annuity on the basis of Rule of 80 or age 55 and 10 years of CPO/CO Service.
b. Benefits: 2.3% of AMC times years of Creditable Service
c. Applicable Reductions: Actuarially reduced from the age that the member would have been eligible for Standard Service Retirement Annuity
3. Normal Form of Payment: Annuity payable for life or until member is no longer incapacitated for the performance of duty. Any remaining member account balance paid at time of death. Survivorship options and partial lump-sum option are available on an actuarially equivalent basis.
Standard Occupational Disability Annuity
1. Elected Class:
a. Eligibility: Disability as a direct result of some risk or hazard inherent to employment
b. Benefits: 2.3% of AMC times years of Creditable Service, but not less than 18.4% of AMC, adjusted automatically based on the State salary of a district judge
2. Employee Class (Regular State Employees):
a. Eligibility: Disability as a direct result of some risk or hazard inherent to employment
b. Benefits: 2.3% of AMC times years of Creditable Service, but not less than 35% of AMC

Employees Retirement System of Texas D - 6
3. Employee Class (LECO Members):
a. Eligibility: Disability as a direct result of some risk or hazard inherent to law enforcement or custodial duties
i. Total: Incapable of substantial gainful activity and eligible for Social Security disability benefits
ii. Non-total: Does not satisfy definition of Total Disability
b. Benefits:
i. Non-total with less than 20 years of CPO/CO Service: 2.3% of AMC times years of Creditable Service, but not less than 50% of AMC. 15% of AMC payable from LECOSRF and the remaining 35% of AMC is payable from the ERS trust
ii. Non-total with 20 years of CPO/CO Service: 2.3% of AMC times years of Creditable Service
iii. Total: 2.3% of AMC times years of Creditable Service, but not less than 35% of AMC
4. Normal Form of Payment: Annuity payable for life or until member is no longer incapacitated for the performance of duty. Any remaining member account balance paid at time of death. Survivorship options and partial lump-sum option are available on an actuarially equivalent basis.
Occupational Disability Lump-Sum Death Benefit
If a member receiving an occupational disability retirement annuity dies and it is determined that the death was an occupational death, a lump-sum death benefit is payable in an amount equal to one year's salary, computed on the basis of the retiree's rate of compensation at the time of disability retirement, and payable to a surviving spouse or dependent minor child.

Employees Retirement System of Texas D - 7
Death Benefit Plan (DBP) Annuity
1. Eligibility:
a. 10 years of employee class service; or
b. Eligible for Standard Service Retirement Annuity at time of death.
2. Benefits: Benefits are calculated as if the member had elected an optional form of payment, received a standard service retirement annuity, and died immediately thereafter. If the member dies before becoming eligible for the Standard Service Retirement Annuity, the benefit is reduced for early retirement as follows:
a. With 12 years of elected class service, the benefit is actuarially reduced from the member’s age 50,
b. With 10 years of CPO/CO service, the benefit is actuarially reduced from the member’s age 55,
c. With five years of employee class service for members hired before September 1, 2009 or eight years of elected class service, the benefit is actuarially reduced from the member’s age 60, and
d. With 10 years of employee class service for members hired on or after September 1, 2009, the benefit is actuarially reduced from the member’s age 65.
Pre-Retirement Death Refund Alternative
A refund of accumulated contributions is payable in cases of pre-retirement death where the member did not meet the eligibility requirements for a Death Benefit Plan Annuity, or the eligible beneficiary choses to receive a refund of the member account balance in lieu of an annuity. This amount is increased by 5% of the member’s account balance at death, times full years of service credit at death, to a maximum of 100%.
Occupational Death Lump-Sum Benefit
If an active member dies and it is determined that the death was an occupational death, a lump-sum death benefit is payable in an amount equal to one year's salary, computed on the basis of the member's rate of compensation at the time of death and payable to a surviving spouse or dependent minor child in addition to any other death benefits.
Post-Retirement Death General Lump-Sum Benefit
$5,000 upon the death of a retired member. This amount is funded separately by the State and not reflected in this valuation.
Employees Retirement System of Texas D - 8
Deferred Service Retirement Annuity
1. Elected Class:
a. Eligibility: Eight years of elected class service
b. Benefits: Standard Service Retirement Annuity payable at age 60 (or 50 with 12 years of elected class service)
2. Employee Class:
a. Eligibility:
i. Members hired prior to September 1, 2009: Five years of employee class service
ii. Members hired on or after September 1, 2009: 10 years of employee class service
b. Benefits:
i. For members hired prior to September 1, 2009: Standard Service Retirement Annuity payable at age 60
ii. For members hired on or after September 1, 2009: Standard Service Retirement Annuity payable at age 65
iii. For members with 10 years of CPO/CO service: Standard Service Retirement Annuity payable at age 55
3. Normal Form of Payment: Payable for the life of the member with any remaining member account balance paid at time of death. Survivorship options and partial lump-sum option are available on an actuarially equivalent basis.
Refund of Accumulated Contributions
A refund of accumulated contributions is payable in cases where a terminated member did not meet the eligibility requirements for an annuity, or a terminated member chooses to receive a refund of his or her account balance in lieu of an annuity.
Maximum Benefits
Annuity benefits are limited to 100% of Average Monthly Compensation. For members with CPO/CO service, this benefit limitation includes benefits from all sources (ERS and the Law Enforcement and Custodial Officer Supplemental Retirement Fund).
Limit on Plan Modifications
According to Section 811.006 of the Texas Government Code – a rate of member or State contributions to or a rate of interest required for the establishment of credit in the retirement system may not be reduced or eliminated, a type of service may not be made creditable in the retirement system, a limit on the maximum permissible amount of a type of creditable service may not be removed or raised, a new monetary benefit payable by the retirement system may not be established, and the determination of the amount of a monetary benefit from the system may not be increased, if, as a result of the particular action, the time, as determined by an actuarial valuation, required to amortize the UAAL of the retirement system would be increased to a period that exceeds 30 years by one or more years.

SECTION E
ACTUARIAL ASSUMPTIONS AND METHODS

Employees Retirement System of Texas E - 1
Summary of Actuarial Assumptions and Methods
The assumptions and methods applied in this actuarial valuation were adopted by the Board of
Trustees on August 23, 2017 based on the experience investigation that covered the five-year
period from September 1, 2011 through August 31, 2016.
I. Valuation Date
The valuation date is August 31 of each plan year. This is the date as of which the actuarial
present value of future benefits and the actuarial value of assets are determined.
II. Actuarial Cost Method
The actuarial valuation is used to determine the adequacy of the State contribution rate
(established by Legislative appropriation) and employer contribution rate (established by statute)
and to describe the current financial condition of ERS.
The actuarial valuation uses the Entry Age Normal actuarial cost method. Under this method, the
first step is to determine the contribution rate (level as a percentage of pay) required to provide
the benefits to each member, or the normal cost rate. The normal cost rate consists of two
pieces: (i) the member’s contribution rate, and (ii) the remaining portion of the normal cost rate
which is the employer’s normal cost rate. The total normal cost rate is based on the benefits
payable to each individual active member.
The Unfunded Actuarial Accrued Liability (UAAL) is the liability for future benefits which is in
excess of (i) the actuarial value of assets, and (ii) the present value of future normal costs. The
employer contribution provided in excess of the employer normal cost is applied to amortize the
UAAL.
The funding period is calculated as the number of years required to fully amortize the UAAL, and is
calculated with the use of an open group projection that takes into account: (a) future market
earnings, net of investment-related expenses, will equal 7.50% per year, (b) there will be no
changes in assumptions, (c) the number of active members will remain unchanged, (d) active
members who leave employment will be replaced by new entrants each year, and (e) State and
employer contributions will remain the same percentage of payroll as described in Section D of
the valuation report.
The Entry Age actuarial cost method is an “immediate gain” method (i.e., experience gains and
losses are separately identified as part of the UAAL). However, they are amortized over the same
period applied to all other components of the UAAL.

Employees Retirement System of Texas E - 2
III. Actuarial Value of Assets
The actuarial value of assets is based on the market value of assets with a five-year phase-in of
actual investment return in excess of (less than) expected investment income. Offsetting
unrecognized gains and losses are immediately recognized, with the shortest remaining bases
recognized first and the net remaining bases continue to be recognized on their original
timeframe. Expected investment income is determined using the assumed investment return rate
and the market value of assets (adjusted for receipts and disbursements during the year). The
returns are computed net of investment-related expenses. The actuarial value of assets was reset
to be equal to the market value of assets as of August 31, 2017 and the new method will be
applied prospectively.
IV. Actuarial Assumptions
Investment Return: 7.50% per year, net of investment-related expenses (composed of an assumed 2.50% inflation rate and a 5.00% real rate of return)
Administrative Expenses: 0.33% of valuation payroll per year
Salary Increases: Inflationary pay increases are assumed to occur at the beginning of the year and the remaining pay increases associated with merit, promotion and longevity are assumed to occur at the middle of the valuation year and vary by employee group. The components of the annual increases are:
Inflation ***Real Wage Growth
(Productivity)
Merit, Promotion
and Longevity
Legislators 0% 0% 0%
2.50% 0.50% 0%
2.50%
included in Merit,
Promotion and
Longevity Increases
See sample rates
2.50% 0.25% 0%
2.50% 0% 2.50%
Employee Group
Judges and Elected Class
other than Legislators
Employee Class
State Salary of a District
Judge*
Inactive members who
transfer to TRS**
* The State salary of a district judge is the compensation used to determine benefit amounts for Legislators. It is also used for benefits for other Elected Class members if it provides a more valuable benefit amount than actual average compensation.
** Assumed in estimating benefits of former members who transfer to the Teacher Retirement System of Texas (TRS).
*** Total liabilities for this valuation reflect the significant across-the-board pay increases appropriated by the State legislature for the current biennium compared to the assumed rate of inflation.

Employees Retirement System of Texas E - 3
Sample Rates:
Age
20 6.80 % 5.25 % 4.75 % 4.30 %
25 6.40 5.25 4.75 3.50 2.50 %
30 5.90 5.25 4.75 3.00 2.50 2.00 %
35 5.40 4.75 4.00 3.00 2.50 2.00 1.90 %
40 4.90 4.75 4.00 3.00 2.50 1.90 1.80
45 4.40 4.25 3.75 3.00 2.40 1.90 1.70
50 3.90 3.70 3.20 2.70 2.20 1.70 1.60
55 3.40 3.20 2.80 2.40 1.90 1.60 1.50
60+ 2.90 2.70 2.30 2.00 1.60 1.40 1.30
Annual Salary Increases for Merit, Promotion and Longevity
Male and Female Regular State Employees
Years of Eligibility Service
0 1 2 - 4 5 - 9 10 - 14 15 - 19 20+
Age
All 7.00 % 5.00 % 3.50 % 2.50 % 2.25 % 2.00 %
Annual Salary Increases for Merit, Promotion and Longevity
Male and Female LECO Members
Years of Eligibility Service
0 1 2 -4 5 - 8 9 - 17 18+
Payroll Growth: 3.00% per year, compounded annually (for projecting valuation payroll).
Post-Retirement Increases for Elected Class Members: If benefits are based on the State salary of a district judge, the benefits are assumed to increase 2.75% per year during retirement (each September 1), compounded annually, consistent with the assumed salary increase for a district judge. Increases are assumed to also occur during deferral periods (if any). Otherwise, no increases are assumed.
Age and Service Assumptions and Methods:
Eligibility Service: Eligibility Service is considered to be all service eligible for vesting purposes, which includes service earned as a regular State employee, a LECO member, a member of the Elected Class, as State Judge, and service earned in the Teacher Retirement System of Texas (“TRS”).
Benefit Service: Current Benefit Service in years and months as of the valuation date was provided by ERS. This service plus Future Earned Service, Service Credit at Retirement, and Eligibility Service at Retirement were used to project benefit amounts.
Future Earned Service: Active members were assumed to earn one additional year of service credit in each future year employed based on their current class of membership (but not beyond the amount of credit needed to provide a 100% of average monthly compensation standard service retirement annuity).
Employees Retirement System of Texas E - 4
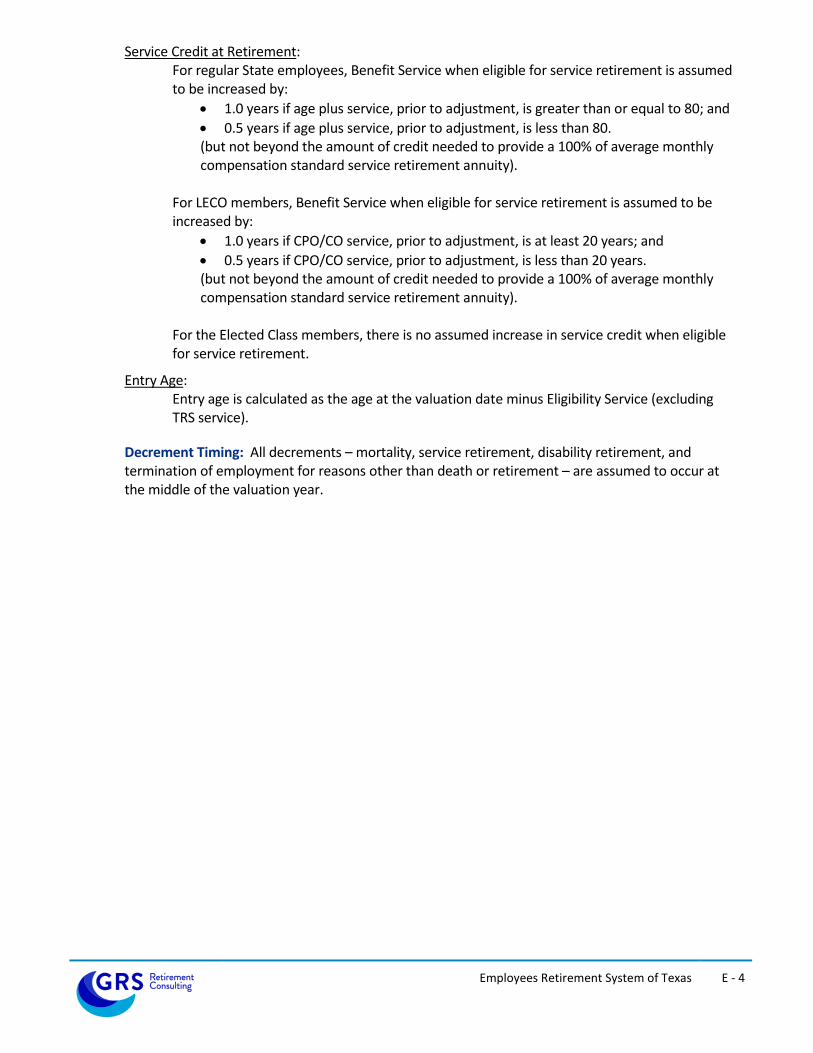
Service Credit at Retirement: For regular State employees, Benefit Service when eligible for service retirement is assumed to be increased by:
1.0 years if age plus service, prior to adjustment, is greater than or equal to 80; and
0.5 years if age plus service, prior to adjustment, is less than 80. (but not beyond the amount of credit needed to provide a 100% of average monthly compensation standard service retirement annuity).
For LECO members, Benefit Service when eligible for service retirement is assumed to be increased by:
1.0 years if CPO/CO service, prior to adjustment, is at least 20 years; and
0.5 years if CPO/CO service, prior to adjustment, is less than 20 years. (but not beyond the amount of credit needed to provide a 100% of average monthly compensation standard service retirement annuity).
For the Elected Class members, there is no assumed increase in service credit when eligible for service retirement.
Entry Age: Entry age is calculated as the age at the valuation date minus Eligibility Service (excluding TRS service).
Decrement Timing: All decrements – mortality, service retirement, disability retirement, and termination of employment for reasons other than death or retirement – are assumed to occur at the middle of the valuation year.

Employees Retirement System of Texas E - 5
Mortality Decrements:
Service Retirees, Beneficiaries, and Inactive Members 2017 State Retirees of Texas (SRT) mortality table. Generational mortality improvements in accordance with the ultimate rates from the scale most recently published by Retirement Plans Experience Committee of the Society of Actuaries (“Scale U-MP”) and projected from the year 2017. Rates for male LECO members are set forward one year. Sample rates for the base mortality table included below.
Age Males Females
40 0.0603 0.0380
45 0.1059 0.0687
50 0.1825 0.1215
55 0.3145 0.2150
60 0.5421 0.3804
65 0.9344 0.6730
70 1.6105 1.1908
75 2.7757 2.1069
80 4.7842 3.7277
85 8.2459 6.5956
90 14.2527 11.7028
Annual Mortality Rates per 100 Individuals
Active Members RP-2014 Active Member Mortality table. Generational mortality improvements in accordance with Scale U-MP are projected from the year 2014.
Disability Retirees RP-2014 Disabled Retiree Mortality. Generational mortality improvements in accordance with Scale U-MP are projected from the year 2014.
Occupational Death 1.0% of male and female active member deaths are assumed to be occupational.
Employees Retirement System of Texas E - 6
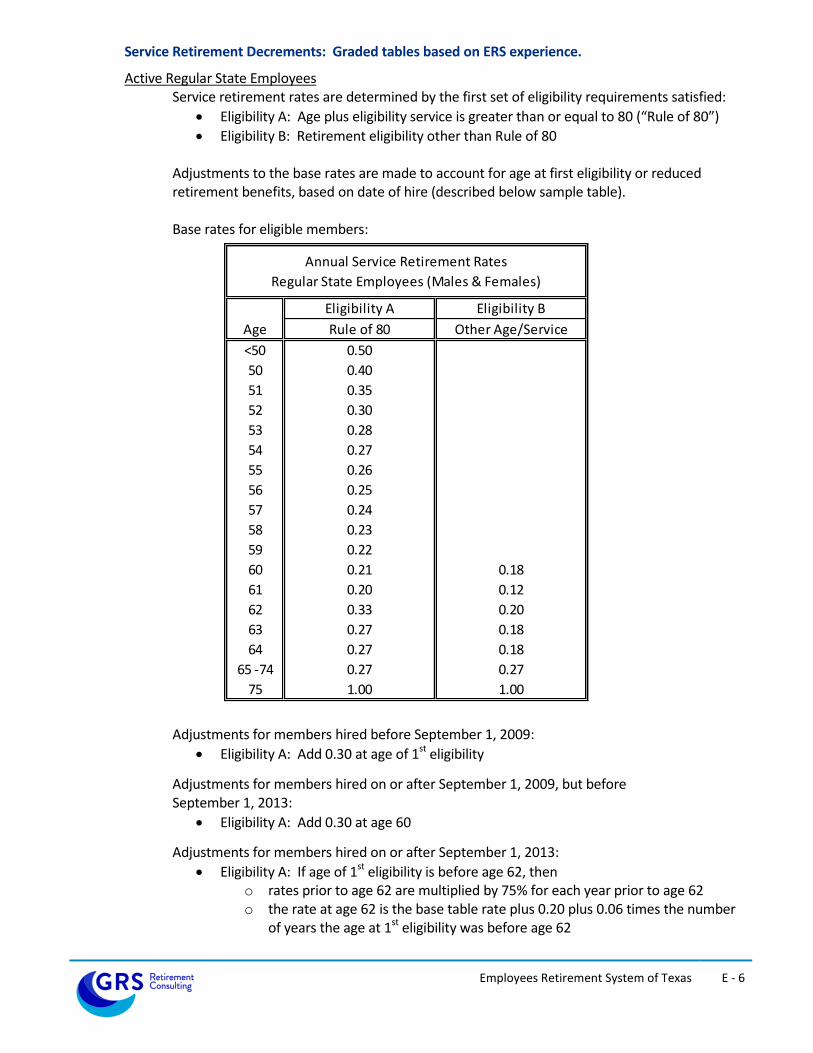
Service Retirement Decrements: Graded tables based on ERS experience.
Active Regular State Employees Service retirement rates are determined by the first set of eligibility requirements satisfied:
Eligibility A: Age plus eligibility service is greater than or equal to 80 (“Rule of 80”)
Eligibility B: Retirement eligibility other than Rule of 80 Adjustments to the base rates are made to account for age at first eligibility or reduced retirement benefits, based on date of hire (described below sample table). Base rates for eligible members:
Eligibility A Eligibility B
Age Rule of 80 Other Age/Service
<50 0.50
50 0.40
51 0.35
52 0.30
53 0.28
54 0.27
55 0.26
56 0.25
57 0.24
58 0.23
59 0.22
60 0.21 0.18
61 0.20 0.12
62 0.33 0.20
63 0.27 0.18
64 0.27 0.18
65 -74 0.27 0.27
75 1.00 1.00
Annual Service Retirement Rates
Regular State Employees (Males & Females)
Adjustments for members hired before September 1, 2009:
Eligibility A: Add 0.30 at age of 1st eligibility
Adjustments for members hired on or after September 1, 2009, but before September 1, 2013:
Eligibility A: Add 0.30 at age 60
Adjustments for members hired on or after September 1, 2013:
Eligibility A: If age of 1st eligibility is before age 62, then o rates prior to age 62 are multiplied by 75% for each year prior to age 62 o the rate at age 62 is the base table rate plus 0.20 plus 0.06 times the number
of years the age at 1st eligibility was before age 62

Employees Retirement System of Texas E - 7
Active LECO Members Service retirement rates are determined by the first set of eligibility requirements satisfied:
Eligibility A: 20 years of CPO/CO service
Eligibility B: Age 55 and 10 years of CPO/CO service
Eligibility C: Any eligibility pertaining to regular State employees (see rates and adjustments for regular State employees)
Adjustments to the base rates are made to account for age at first eligibility or reduced retirement benefits, based on date of hire (described below sample table).
Base rates for eligible members:
Age 20 yrs CPO/CO Age Age 55 & 10 yrs CPO/CO
<48 0.03
48 0.04 55 0.20
49 0.05 56 0.18
50 0.60 57 0.16
51 - 61 0.33 58 - 61 0.14
62 - 74 0.50 62 - 74 0.27
75 1.00 75 1.00
Annual Service Retirement Rates
LECO Members (Males & Females)
Eligibility A Eligibility B
Adjustments for members hired before September 1, 2013:
Eligibility A and B: Rate set to zero if member has 18 or 19 years of CPO/CO service. Rate is doubled if member has 20 years of CPO/CO service. Adjustments only apply to members that attain 20 years of CPO/CO service prior to age 65.
Adjustments for members hired on or after September 1, 2013:
Eligibility A: If age of 1st eligibility is before age 57, then o rates prior to age 57 are multiplied by 75% for each year prior to age 57 o the rate at age 57 is 100%
Eligibility B: If member will attain 20 years of CPO/CO service at or before age 62, rates are zero prior to age 62 and 100% when member attains 20 years of CPO/CO service.
Eligibility B: If member will attain 20 years of CPO/CO service after age 62, then o rates prior to age 62 are multiplied by 75% for each year prior to age 62 o the rate at age 62 is the base table rate plus 0.20 plus 0.06 times the number
of years the age at 1st eligibility was before age 62
Active Elected Class Members
Age Male and Female
50 - 61 0.10
62 - 74 0.20
75+ 1.00
Annual Service Retirement Rates
Elected Class Members
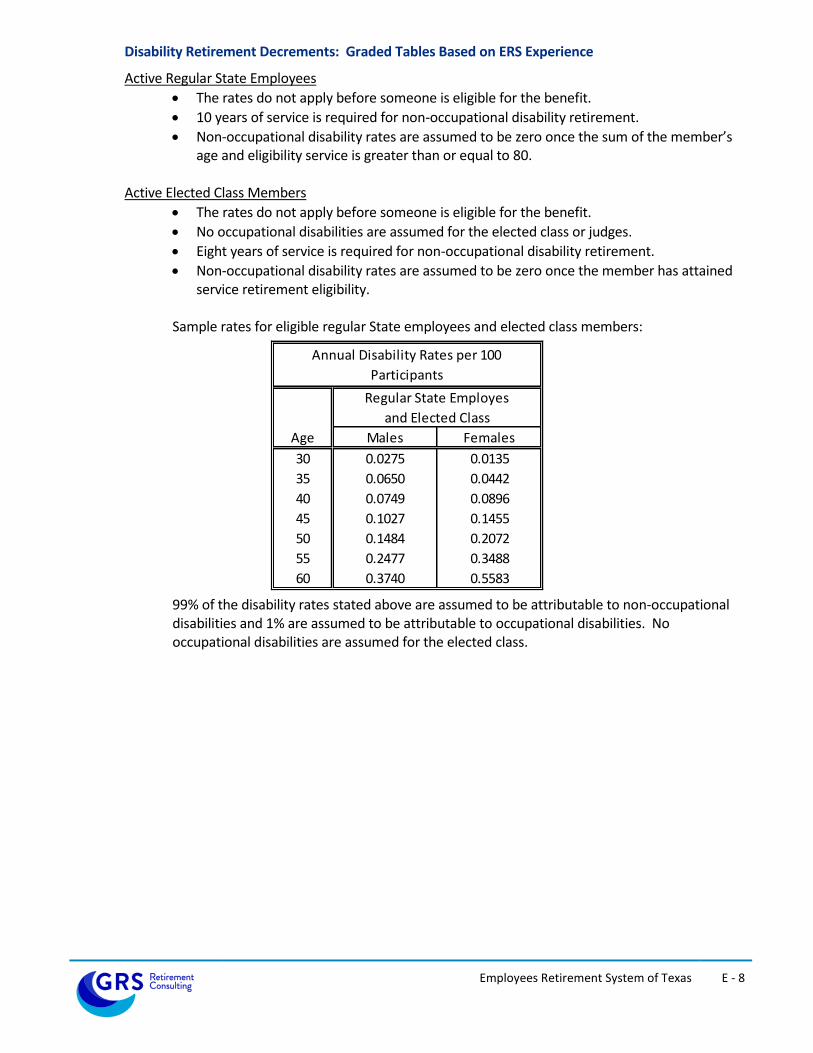
Employees Retirement System of Texas E - 8
Disability Retirement Decrements: Graded Tables Based on ERS Experience
Active Regular State Employees
The rates do not apply before someone is eligible for the benefit.
10 years of service is required for non-occupational disability retirement.
Non-occupational disability rates are assumed to be zero once the sum of the member’s age and eligibility service is greater than or equal to 80.
Active Elected Class Members
The rates do not apply before someone is eligible for the benefit.
No occupational disabilities are assumed for the elected class or judges.
Eight years of service is required for non-occupational disability retirement.
Non-occupational disability rates are assumed to be zero once the member has attained service retirement eligibility.
Sample rates for eligible regular State employees and elected class members:
Age Males Females
30 0.0275 0.0135
35 0.0650 0.0442
40 0.0749 0.0896
45 0.1027 0.1455
50 0.1484 0.2072
55 0.2477 0.3488
60 0.3740 0.5583
Annual Disability Rates per 100
Participants
Regular State Employes
and Elected Class
99% of the disability rates stated above are assumed to be attributable to non-occupational disabilities and 1% are assumed to be attributable to occupational disabilities. No occupational disabilities are assumed for the elected class.

Employees Retirement System of Texas E - 9
Active LECO Members
The rates do not apply before a member is eligible for the benefit.
Service greater than zero is required for occupational disability retirement.
10 years of service is required for non-occupational disability retirement.
Non-occupational disability rates are assumed to be zero once the sum of the member’s age and eligibility service is greater than or equal to 80, or the member has attained age 55 with 10 or more years of CPO/CO service.
Sample rates for members:
Age Males and Females
30 0.0092
35 0.0314
40 0.0586
45 0.0980
50 0.1774
55 0.2460
60 0.3150
Annual Disability Rates per 100 Participants
LECO Members
95% of the disability rates stated above are assumed to be attributable to non-occupational disabilities, 4.5% are assumed to be attributable to non-total occupational disabilities, and 0.5% are assumed to be attributable to total occupational disabilities.

Employees Retirement System of Texas E - 10
Termination Decrements for Reasons Other Than Death or Retirement: Graded Tables Based on ERS Experience.
Rates of termination are zero for members eligible for service retirement. To account for active regular State employees and LECO members that accumulate additional eligibility service at retirement through converting sick/annual leave or other types of service purchases, termination rates are also set to zero in the year prior to first retirement eligibility. Rates for members not eligible for service retirement:
Active Regular State Employees
Eligibility
Service
Entry age 35 or
youngerEntry age over 35
0 25.25 19.63
1 21.24 16.07
2 17.88 13.26
3 15.07 11.08
4 12.76 9.42
5 10.86 8.16
6 9.33 7.21
7 8.09 6.49
8 7.10 5.94
9 6.31 5.50
10 5.67 5.11
11 5.15 4.75
12 4.71 4.39
13 4.32 4.03
14 3.97 3.66
15 3.64 3.29
16 3.30 2.95
17 2.97 2.69
18 2.62 2.53
19 2.27 1.00
20 1.92 1.00
21 1.59 1.00
22 1.29 1.00
23 1.05 1.00
24 0.89 1.00
25+ 0.85 1.00
Annual Rates of Termination per 100 Participants
Regular State Employees
Male and Female

Employees Retirement System of Texas E - 11
Active LECO Members
Eligibility
ServiceMale and Female
0 23.00
1 19.22
2 15.36
3 12.48
4 10.36
5 8.81
6 7.67
7 6.81
8 6.11
9 5.52
10 4.96
11 4.42
12 3.90
13 3.43
14 3.07
15 2.90
16 2.50
17 1.00
18 1.00
19+ 0.00
Annual Rates of Termination
per 100 Participants
LECO Members
Elected Class Members: 4 per 100 participants for members not eligible for service retirement
Withdrawal of Employee Contributions: Members that terminate with a vested benefit are assumed to choose the most valuable option available to them at the time of termination: withdrawal of contributions or deferred annuity.

Employees Retirement System of Texas E - 12
Percentage of Members Electing Various Benefit Options:
Sex / Benefit
Standard Life
Annuity Option 1 Option 4
Male Member
Disability 50% 50% 0%
Service Retirement
Non-LECO 100% 0% 0%
LECO 60% 40% 0%
Death Benefit Plan 0% 85% 15%
Female Member
Disability 75% 25% 0%
Service Retirement 100% 0% 0%
Death Benefit Plan 0% 70% 30%
The value of the Standard Service Retirement Life Annuity reflects the return of excess contributions payable as a lump sum death benefit in cases the annuity benefits paid are less than the member account balance at the time of retirement.
Beneficiary Characteristics: Males are assumed to be two years older than females.
Transfers from ERS to TRS:
Contributing ERS members:
It is assumed that 10% of regular State employees and LECO members who cease contributing to ERS and do not withdraw employee contributions will transfer ERS service credit to TRS at retirement.
Noncontributing ERS Members:
Records of ERS and TRS are matched by ERS staff to determine former ERS members who are currently contributing under TRS.
TRS Retirement Age:
Former ERS members who are, or are assumed to become, contributing TRS members are assumed to continue to earn service credit under TRS until first eligible for unreduced service retirement benefits, retire at that time, and transfer ERS service credit to TRS.

Employees Retirement System of Texas E - 13
Census Data and Assets
The valuation was based on members of ERS as of August 31, 2017 and does not take into account future members, with the exception of determining the funding period.
All census data was supplied by ERS and was subject to reasonable consistency checks.
There were data elements that were modified for some members as part of the valuation in order to make the data complete. However, the number of missing data items was immaterial.
Asset data was supplied by ERS.
Other Actuarial Valuation Procedures
No provision was made in this actuarial valuation for the limitations of Internal Revenue Code Sections 415 or 401(a)17.
Valuation payroll (earnings applied to the current valuation year) is the expected payroll for the fiscal year following the valuation date. It is based on reported payroll determined from August member contributions increased to reflect the across-the-board salary increases appropriated by the State legislature, effective on or after September 1, and projected according to the actuarial assumptions for the upcoming fiscal year.
No liability was included for benefits which are funded by special State appropriations.
State appropriations for membership fees are currently immaterial in relation to the overall payroll contributions and have been ignored.

14
SECTION F
DETAILED SUMMARIES OF MEMBERSHIP DATA
Employees Retirement System of Texas F - 1
Detailed Summaries of Membership Data
Table Page
Number
A F-2 Summary of Membership Data
B F-3 Active Members: Distribution by Age and Service (All Members)
C F-4 Active Members: Distribution by Age and Service (Regular State Employees)
D F-5 Active Members: Distribution by Age and Service (LECO Members)
E F-6 Active Members: Distribution by Age and Service (Elected Class Members)
F F-7 Retired and Beneficiary Members: Distribution by Age and Category (Excluding Deferred LECOSRF and ERS Reimbursing TRS Annuitants)
G F-8 Retired and Beneficiary Members: Distribution by Age and Category (LECOSRF Annuitants Deferred in ERS)
H F-9 Retired and Beneficiary Members: Distribution by Age and Category (Annuitants where ERS is Reimbursing TRS)
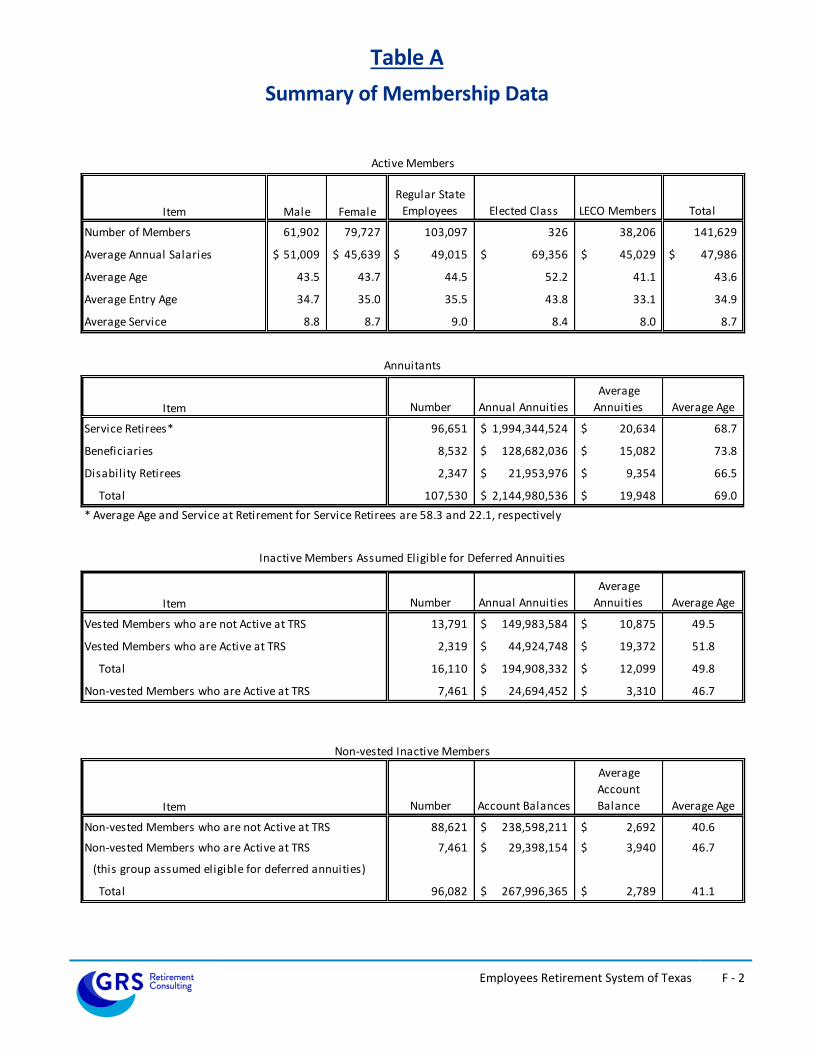
Employees Retirement System of Texas F - 2
Table A
Summary of Membership Data
Item Male Female
Regular State
Employees Elected Class LECO Members Total
Number of Members 61,902 79,727 103,097 326 38,206 141,629
Average Annual Salaries 51,009$ 45,639$ 49,015$ 69,356$ 45,029$ 47,986$
Average Age 43.5 43.7 44.5 52.2 41.1 43.6
Average Entry Age 34.7 35.0 35.5 43.8 33.1 34.9
Average Service 8.8 8.7 9.0 8.4 8.0 8.7
Item Number Annual Annuities
Average
Annuities Average Age
Service Retirees* 96,651 1,994,344,524$ 20,634$ 68.7
Beneficiaries 8,532 128,682,036$ 15,082$ 73.8
Disability Retirees 2,347 21,953,976$ 9,354$ 66.5
Total 107,530 2,144,980,536$ 19,948$ 69.0
* Average Age and Service at Retirement for Service Retirees are 58.3 and 22.1, respectively
Item Number Annual Annuities
Average
Annuities Average Age
Vested Members who are not Active at TRS 13,791 149,983,584$ 10,875$ 49.5
Vested Members who are Active at TRS 2,319 44,924,748$ 19,372$ 51.8
Total 16,110 194,908,332$ 12,099$ 49.8
Non-vested Members who are Active at TRS 7,461 24,694,452$ 3,310$ 46.7
Item Number Account Balances
Average
Account
Balance Average Age
Non-vested Members who are not Active at TRS 88,621 238,598,211$ 2,692$ 40.6
Non-vested Members who are Active at TRS 7,461 29,398,154$ 3,940$ 46.7
(this group assumed eligible for deferred annuities)
Total 96,082 267,996,365$ 2,789$ 41.1
Active Members
Annuitants
Inactive Members Assumed Eligible for Deferred Annuities
Non-vested Inactive Members

Employees Retirement System of Texas F - 3
Table B
Active Members – All Members
Distribution by Age and Service
Age 0-4 5-9 10-14 15-19 20-24 25-29 30-34 35-39 40+ Total
Under 25 8,669 51 8,720
31,212$ 37,254$ 31,247$
25 - 29 12,796 1,650 43 14,489
39,037$ 42,436$ 39,341$ 39,425$
30 - 34 10,696 4,729 1,349 75 16,849
41,297$ 49,884$ 50,559$ 51,653$ 44,495$
35 - 39 8,157 4,482 2,949 1,348 51 16,987
42,304$ 50,795$ 58,072$ 56,755$ 59,483$ 48,480$
40 - 44 6,688 3,757 2,655 2,981 1,314 55 17,450
42,568$ 49,523$ 56,687$ 60,541$ 60,229$ 61,673$ 50,674$
45 - 49 6,042 3,636 2,590 3,238 3,313 1,469 72 20,360
42,413$ 48,751$ 54,021$ 57,771$ 62,810$ 64,991$ 64,627$ 52,491$
50 - 54 4,912 3,296 2,492 2,674 2,469 1,951 485 22 18,301
41,767$ 47,253$ 51,116$ 54,600$ 60,580$ 66,886$ 79,272$ 64,208$ 52,140$
55 - 59 3,952 2,985 2,220 2,378 1,739 1,076 549 151 10 15,060
42,750$ 46,522$ 51,624$ 53,553$ 60,421$ 67,792$ 76,514$ 71,915$ 86,378$ 51,893$
60 - 64 2,130 2,351 1,579 1,632 894 556 294 143 22 9,601
42,882$ 47,846$ 50,175$ 52,424$ 60,776$ 66,427$ 69,359$ 76,933$ 60,584$ 51,307$
Over 64 814 1,038 684 541 366 200 100 39 30 3,812
43,351$ 48,353$ 50,641$ 55,623$ 61,070$ 66,336$ 70,638$ 76,246$ 71,284$ 51,942$
Total 64,856 27,975 16,561 14,867 10,146 5,307 1,500 355 62 141,629
40,067$ 48,475$ 53,585$ 56,293$ 61,265$ 66,422$ 75,041$ 73,934$ 69,922$ 47,986$
Years of Service

Employees Retirement System of Texas F - 4
Table C
Active Members – Regular State Employees
Distribution by Age and Service
Age 0-4 5-9 10-14 15-19 20-24 25-29 30-34 35-39 40+ Total
Under 25 4,706 21 4,727
28,605$ 33,377$ 28,626$
25 - 29 8,754 937 18 9,709
38,946$ 40,280$ 33,024$ 39,064$
30 - 34 7,983 3,305 824 45 12,157
42,004$ 49,437$ 50,904$ 52,608$ 44,667$
35 - 39 6,032 3,384 2,079 827 27 12,349
43,450$ 51,342$ 58,353$ 56,000$ 59,136$ 48,997$
40 - 44 4,993 2,873 1,901 2,061 710 34 12,572
43,789$ 50,513$ 57,554$ 61,131$ 60,501$ 57,625$ 51,231$
45 - 49 4,548 2,721 1,849 2,327 2,058 999 58 14,560
43,507$ 49,606$ 55,365$ 58,904$ 64,272$ 65,093$ 62,624$ 53,106$
50 - 54 3,748 2,445 1,831 2,010 2,023 1,669 375 21 14,122
42,836$ 48,119$ 52,404$ 56,051$ 60,818$ 66,188$ 76,868$ 62,430$ 53,141$
55 - 59 3,054 2,246 1,732 1,878 1,487 987 504 142 10 12,040
44,227$ 47,434$ 52,852$ 55,253$ 61,616$ 67,511$ 75,313$ 69,825$ 86,378$ 53,480$
60 - 64 1,665 1,784 1,305 1,331 738 529 277 140 22 7,791
43,982$ 49,234$ 51,489$ 53,556$ 63,080$ 66,926$ 68,639$ 76,687$ 60,584$ 52,956$
Over 64 626 780 550 439 326 191 92 37 29 3,070
44,867$ 50,326$ 52,148$ 58,313$ 62,221$ 65,794$ 74,330$ 78,743$ 73,494$ 54,188$
Total 46,109 20,496 12,089 10,918 7,369 4,409 1,306 340 61 103,097
40,912$ 49,129$ 54,512$ 57,249$ 62,196$ 66,242$ 73,711$ 73,164$ 70,950$ 49,015$
Years of Service

Employees Retirement System of Texas F - 5
Table D
Active Members – LECO Members
Distribution by Age and Service
Age 0-4 5-9 10-14 15-19 20-24 25-29 30-34 35-39 40+ Total
Under 25 3,963 30 3,993
34,307$ 39,968$ 34,350$
25 - 29 4,042 713 25 4,780
39,234$ 45,270$ 43,890$ 40,159$
30 - 34 2,703 1,423 525 30 4,681
39,090$ 50,950$ 50,018$ 50,222$ 43,992$
35 - 39 2,103 1,091 867 521 24 4,606
38,813$ 49,014$ 57,576$ 57,954$ 59,874$ 47,036$
40 - 44 1,667 876 750 920 604 21 4,838
38,311$ 46,209$ 54,221$ 59,220$ 59,910$ 68,228$ 49,010$
45 - 49 1,466 895 730 906 1,253 470 14 5,734
38,512$ 45,447$ 50,212$ 54,846$ 60,499$ 64,774$ 72,923$ 50,706$
50 - 54 1,149 837 648 659 444 281 110 1 4,129
37,923$ 43,489$ 46,492$ 49,728$ 59,732$ 71,243$ 87,466$ 101,551$ 48,228$
55 - 59 880 729 477 497 251 87 45 9 2,975
37,477$ 43,522$ 46,051$ 46,607$ 53,555$ 70,844$ 89,972$ 104,893$ 45,189$
60 - 64 449 561 268 295 149 27 16 3 1,768
37,772$ 43,156$ 44,244$ 46,883$ 50,097$ 56,633$ 85,713$ 88,410$ 43,828$
Over 64 178 253 125 96 36 9 4 1 702
37,067$ 42,032$ 42,774$ 44,958$ 52,944$ 77,827$ 49,148$ 52,891$ 42,380$
Total 18,600 7,408 4,415 3,924 2,761 895 189 14 38,206
37,756$ 46,380$ 50,712$ 53,505$ 58,950$ 67,361$ 86,026$ 97,408$ 45,029$
Years of Service

Employees Retirement System of Texas F - 6
Table E
Active Members – Elected Class Members
Distribution by Age and Service
Age 0-4 5-9 10-14 15-19 20-24 25-29 30-34 35-39 40+ Total
Under 25
25 - 29
30 - 34 10 1 11
73,600$ 7,200$ 67,564$
35 - 39 22 7 3 32
61,527$ 64,114$ 7,200$ 57,000$
40 - 44 28 8 4 40
78,287$ 57,000$ 106,800$ 76,881$
45 - 49 28 20 11 5 2 66
68,857$ 80,287$ 80,886$ 60,320$ 7,200$ 71,810$
50 - 54 15 14 13 5 2 1 50
69,173$ 121,029$ 100,196$ 113,440$ 7,200$ 7,200$ 92,467$
55 - 59 18 10 11 3 1 2 45
49,911$ 60,320$ 99,895$ 140,000$ 7,200$ 73,600$ 70,552$
60 - 64 16 6 6 6 7 1 42
71,850$ 73,600$ 29,333$ 73,756$ 45,143$ 7,200$ 60,308$
Over 64 10 5 9 6 4 4 1 1 40
60,320$ 60,320$ 67,830$ 29,490$ 40,400$ 7,200$ 7,200$ 7,200$ 47,425$
Total 147 71 57 25 16 3 5 1 1 326
67,336$ 78,289$ 79,411$ 76,331$ 32,100$ 51,467$ 7,200$ 7,200$ 7,200$ 69,356$
Years of Service

Employees Retirement System of Texas F - 7
Table F
Retired and Beneficiary Members – Excluding Deferred LECOSRF and ERS Reimbursing TRS Annuitants
Distribution by Age and Category
Age Last Birthday Number Annual Benefit
Average Annual
Benefit
Service Retirees
Under 60 15,023 452,901,852 30,147
60 - 64 17,698 419,340,180 23,694
65 - 69 21,878 441,205,368 20,167
70 - 74 16,799 308,001,876 18,335
75 - 79 9,964 165,253,704 16,585
Over 79 10,480 186,410,328 17,787
Total 91,842 1,973,113,308 21,484
Beneficiaries
Under 60 1,066 13,244,628 12,425
60 - 64 666 9,575,616 14,378
65 - 69 1,075 15,778,992 14,678
70 - 74 1,254 18,148,260 14,472
75 - 79 1,310 19,810,056 15,122
Over 79 2,955 51,335,796 17,373
Total 8,326 127,893,348 15,361
Disabled Retirees
Under 60 533 4,364,292 8,188
60 - 64 391 4,088,292 10,456
65 - 69 492 5,157,168 10,482
70 - 74 374 3,805,812 10,176
75 - 79 196 1,948,704 9,942
Over 79 200 2,061,984 10,310
Total 2,186 21,426,252 9,802
Grand Total 102,354 2,122,432,908 20,736

Employees Retirement System of Texas F - 8
Table G
Retired and Beneficiary Members – LECOSRF Annuitants Deferred in ERS
Distribution by Age and Category
Age Last Birthday Number Annual Benefit
Average Annual
Benefit
All Participants
Under 45 0 0 0
45 - 49 23 413,052 17,959
Total 23 413,052 17,959
Grand Total 23 413,052 17,959
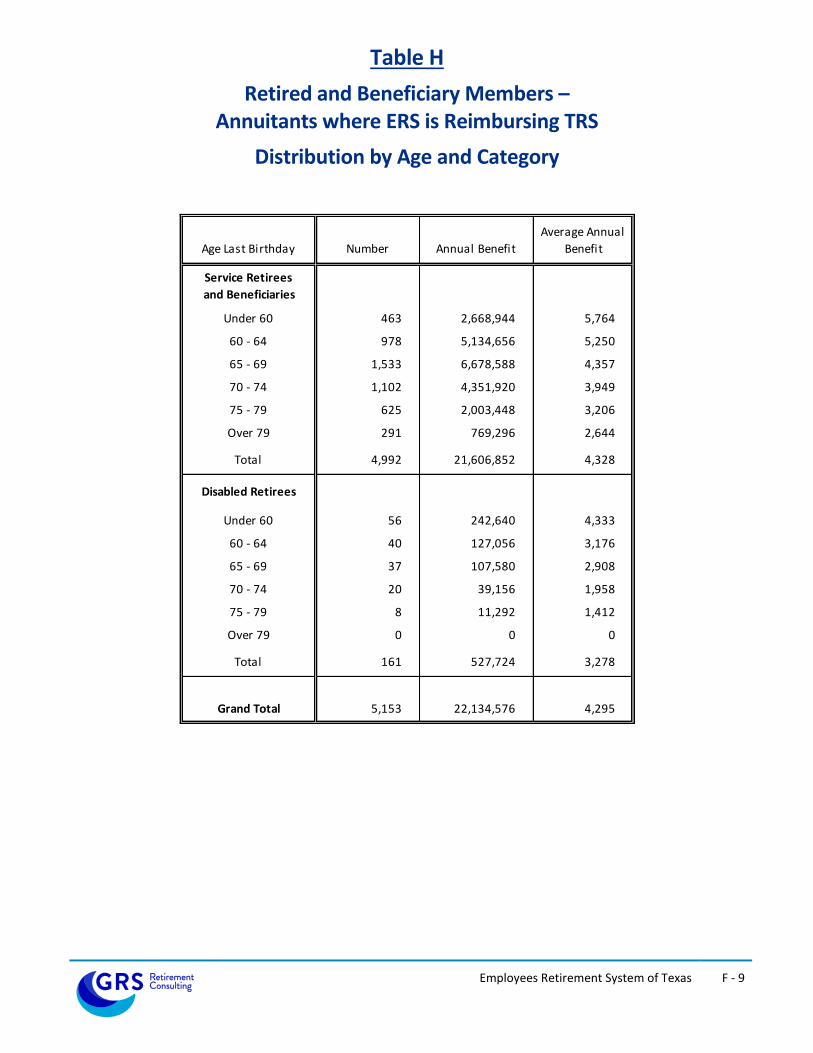
Employees Retirement System of Texas F - 9
Table H
Retired and Beneficiary Members – Annuitants where ERS is Reimbursing TRS
Distribution by Age and Category
Age Last Birthday Number Annual Benefit
Average Annual
Benefit
Service Retirees
and Beneficiaries
Under 60 463 2,668,944 5,764
60 - 64 978 5,134,656 5,250
65 - 69 1,533 6,678,588 4,357
70 - 74 1,102 4,351,920 3,949
75 - 79 625 2,003,448 3,206
Over 79 291 769,296 2,644
Total 4,992 21,606,852 4,328
Disabled Retirees
Under 60 56 242,640 4,333
60 - 64 40 127,056 3,176
65 - 69 37 107,580 2,908
70 - 74 20 39,156 1,958
75 - 79 8 11,292 1,412
Over 79 0 0 0
Total 161 527,724 3,278
Grand Total 5,153 22,134,576 4,295

10
SECTION G
GLOSSARY

Employees Retirement System of Texas G - 1
Glossary
Actuarial Accrued Liability (AAL): That portion, as determined by a particular Actuarial Cost Method, of the Actuarial Present Value of Future Plan Benefits which is not provided for by future Normal Costs. It is equal to the Actuarial Present Value of Future Plan Benefits minus the actuarial present value of future Normal Costs. Actuarial Assumptions: Assumptions as to future experience under the Fund. These include assumptions about the occurrence of future events affecting costs or liabilities, such as:
mortality, withdrawal, disablement, and retirement;
future increases in salary;
future rates of investment earnings and future investment and administrative expenses;
characteristics of members not specified in the data, such as marital status;
characteristics of future members;
future elections made by members; and
other relevant items. Actuarial Cost Method or Funding Method: A procedure for allocating the Actuarial Present Value of Future Benefits to various time periods; a method used to determine the Normal Cost and the Actuarial Accrued Liability. These items are used to determine the ADC. Actuarial Gain or Actuarial Loss: A measure of the difference between actual experience and that expected based upon a set of Actuarial Assumptions, during the period between two Actuarial Valuation dates. Through the actuarial assumptions, rates of decrements, rates of salary increases, and rates of fund earnings have been forecasted. To the extent that actual experience differs from that assumed, Actuarial Accrued Liabilities emerge which may be the same as forecasted, or may be larger or smaller than projected. Actuarial gains are due to favorable experience, e.g., the Fund's assets earn more than projected, salaries do not increase as fast as assumed, members retire later than assumed, etc. Favorable experience means actual results produce actuarial liabilities not as large as projected by the actuarial assumptions. On the other hand, actuarial losses are the result of unfavorable experience, i.e., actual results that produce actuarial liabilities which are larger than projected. Actuarial gains will shorten the time required for funding of the actuarial balance sheet deficiency while actuarial losses will lengthen the funding period. Actuarially Equivalent: Of equal actuarial present value, determined as of a given date and based on a given set of Actuarial Assumptions. Actuarial Present Value (APV): The value of an amount or series of amounts payable or receivable at various times, determined as of a given date by the application of a particular set of Actuarial Assumptions. For purposes of this standard, each such amount or series of amounts is:
a. adjusted for the probable financial effect of certain intervening events (such as changes in compensation levels, marital status, etc.),
b. multiplied by the probability of the occurrence of an event (such as survival, death, disability, termination of employment, etc.) on which the payment is conditioned, and
c. discounted according to an assumed rate (or rates) of return to reflect the time value of money.
Employees Retirement System of Texas G - 2
Actuarial Present Value of Future Plan Benefits: The Actuarial Present Value of those benefit amounts which are expected to be paid at various future times under a particular set of Actuarial Assumptions, taking into account such items as the effect of advancement in age and past and anticipated future compensation and service credits. The Actuarial Present Value of Future Plan Benefits includes the liabilities for active members, retired members, beneficiaries receiving benefits, and inactive, nonretired members either entitled to a refund or a future retirement benefit. Expressed another way, it is the value that would have to be invested on the valuation date so that the amount invested plus investment earnings would be provide sufficient assets to pay all projected benefits and expenses when due. Actuarial Valuation: The determination, as of a valuation date, of the Normal Cost, Actuarial Accrued Liability, Actuarial Value of Assets, and related Actuarial Present Values for a plan. An Actuarial valuation for a governmental retirement system typically also includes calculations of items needed for compliance with GASB. Actuarial Value of Assets or Valuation Assets: The value of the Fund’s assets as of a given date, used by the actuary for valuation purposes. This may be the market or fair value of plan assets, but commonly actuaries use a smoothed value in order to reduce the year-to-year volatility of calculated results, such as the funded ratio and the ADC. Actuarially Determined: Values which have been determined utilizing the principles of actuarial science. An actuarially determined value is derived by application of the appropriate actuarial assumptions to specified values determined by provisions of the law. Amortization Method: A method for determining the Amortization Payment. The most common methods used are level dollar and level percentage of payroll. Under the Level Dollar method, the Amortization Payment is one of a stream of payments, all equal, whose Actuarial Present Value is equal to the UAAL. Under the Level Percentage of Pay method, the Amortization payment is one of a stream of increasing payments, whose Actuarial Present Value is equal to the UAAL. Under the Level Percentage of Pay method, the stream of payments increases at the assumed rate at which total covered payroll of all active members will increase. Amortization Payment: That portion of the pension plan contribution or ADC which is designed to pay interest on and to amortize the Unfunded Actuarial Accrued Liability. Actuarially Determined Contribution (ADC) or Annual Required Contribution (ARC): A calculated contribution for a defined benefit pension plan for the reporting period, most often determined based on the funding policy of the plan. Typically the calculated contribution has a normal cost payment and an amortization payment. Closed Amortization Period: A specific number of years that is counted down by one each year and therefore declines to zero with the passage of time. For example if the amortization period is initially set at 30 years, it is 29 years at the end of one year, 28 years at the end of two years, etc. See Funding Period and Open Amortization Period. Decrements: Those causes/events due to which a member’s status (active-inactive-retiree-beneficiary) changes, that is: death, retirement, disability, or termination.

Employees Retirement System of Texas G - 3
Defined Benefit Plan: An employer-sponsored retirement benefit that provides workers, upon attainment of designated age and service thresholds, with a monthly benefit based on the employee’s salary and length of service. The value of a benefit from a defined benefit plan is generally not affected by the return on the assets that are invested to fund the benefit. Defined Contribution Plan: A retirement plan, such as a 401(k) plan, a 403(b) plan, or a 457 plan, in which the contributions to the plan are assigned to an account for each member, and the plan’s earnings are allocated to each account, and each member’s benefits are a direct function of the account balance. Employer Normal Cost: The portion of the Normal Cost to be paid by the employers. This is equal to the Normal Cost less expected member contributions. Experience Study: A periodic review and analysis of the actual experience of the Fund which may lead to a revision of one or more actuarial assumptions. Actual rates of decrement and salary increases are compared to the actuarially assumed values and modified as deemed appropriate by the Actuary. Funded Ratio: The ratio of the actuarial value of assets (AVA) to the actuarial accrued liability (AAL). Plans sometimes calculate a market funded ratio, using the market value of assets (MVA), rather than the AVA. Funding Period or Amortization Period: The term “Funding Period” is used it two ways. In the first sense, it is the period used in calculating the Amortization Payment as a component of the ADC. This funding period is chosen by the Board of Trustees. In the second sense, it is a calculated item: the number of years in the future that will theoretically be required to amortize (i.e., pay off or eliminate) the Unfunded Actuarial Accrued Liability, based on the statutory employer contribution rate, and assuming no future actuarial gains or losses. GASB: The Governmental Accounting Standards Board is an organization that exists in order to promulgate accounting standards for governmental entities. Normal Cost: That portion of the Actuarial Present Value of pension plan benefits and expenses which is allocated to a valuation year by the Actuarial Cost Method. Any payment in respect of an Unfunded Actuarial Accrued Liability is not part of Normal Cost (see Amortization Payment). For pension plan benefits which are provided in part by employee contributions, Normal Cost refers to the total of employee contributions and employer Normal Cost unless otherwise specifically stated. Under the entry age normal cost method, the Normal Cost is intended to be the level cost (when expressed as a percentage of pay) needed to fund the benefits of a member from hire until ultimate termination, death, disability or retirement. Open Amortization Period: An open amortization period is one which is used to determine the Amortization Payment but which does not change over time. In other words, if the initial period is set as 30 years, the same 30-year period is used in determining the Amortization Period each year. In theory, if an Open Amortization Period is used to amortize the Unfunded Actuarial Accrued Liability, the UAAL will never completely disappear, but will become smaller each year, either as a dollar amount or in relation to covered payroll. Unfunded Actuarial Accrued Liability: The excess of the Actuarial Accrued Liability over the Actuarial Value of Assets. This value may be negative in which case it may be expressed as a negative Unfunded Actuarial Accrued Liability, also called the Funding Surplus.

Employees Retirement System of Texas G - 4
Valuation Date or Actuarial Valuation Date: The date as of which the value of assets is determined and as of which the Actuarial Present Value of Future Plan Benefits is determined. The expected benefits to be paid in the future are discounted to this date.

5
SECTION H
LAW ENFORCEMENT AND CUSTODIAL OFFICER (LECO) PLAN
ACCOUNTING

Employees Retirement System of Texas H - 1
Law Enforcement and Custodial Officer (LECO) Plan Accounting
Executive Summary
Senate Bill 1459 passed by the 83rd Legislature of the State of Texas (SB1459) included a mandate that assets and liabilities attributable to members and retirees of the LECOSRF be measured and accounted for in aggregate and separately from ERS main fund for the subsequent biennium. Even though the mandate has passed, the contents of this Section outline the measurement of the potential separate accounting for the stand-alone retirement plan for LECO members. The two populations can either have separate accounting for assets and liabilities or be fully separated.

Employees Retirement System of Texas H - 2
Summary of Results
Membership
• Number of
- Active members 103,423 38,206
- Retirees and beneficiaries* 89,326 18,204
- Inactive, vested* 13,733 2,377
- Inactive, nonvested* 74,158 21,924
- Total 280,640 80,711
• Valuation Payroll 5,075,863,840$ 1,720,362,464$
Statutory contribution rates
• Members 9.50% 10.00%
• Employers 0.50% 0.50%
• State 9.50% 10.00%
Total Payroll Contribution Rate 19.50% 20.50%
• Expected contributions from
court fees N/A $18.8 million per year
Actuarially Sound Rate (funds normal cost
and amortizes unfunded accrued liability
over 31 years, per Section 811.006 of the
Texas Government Code)
- Total Contribution Rate 22.62% 28.61%
- In addition to Court Fees 22.62% 27.81%
-3.12% -7.31%
Assets
• Market value (MVA) 21,688,712,755$ 5,607,104,123$
• Actuarial value (AVA) 21,688,712,755$ 5,607,104,123$
Actuarial Information on AVA (smoothed)
• Normal cost % 13.67% 16.90%
• Total normal cost 693,870,587$ 290,741,256$
• Actuarial accrued liability 29,838,529,521$ 9,191,132,510$
• Unfunded actuarial accrued
liability (UAAL) 8,149,816,766$ 3,584,028,387$
• Funded ratio 72.7% 61.0%
• Funding period (years) Never Never
Actuarial Information on MVA
• Unfunded actuarial accrued
liability (UAAL) 8,149,816,766$ 3,584,028,387$
• Funded ratio 72.7% 61.0%
• Funding period (years) Never Never
* Annuitants with at least 10 years of CPO service are identified as LECO annuitants. Inactive members with at
least three-fourths of total service certified as CPO service are identified as LECO inactive members. These
headcounts are shown for i l lustration purposes and do not directly relate to the methods used to allocate
individual l iabilities to the two resulting plans.
Item
Contribution Rate Sufficiency (Negative
figures indicates contribution shortfall)
Law Enforcement and
Custodial OfficersRegular Class

Employees Retirement System of Texas H - 3
Methodology for the LECO Plan
The goal was to re-assemble these plans for LECO members and regular State (non-LECO) employees as if they had been separate plans from the beginning. In broad terms, the methodology for structuring the proposed stand-alone retirement plan for LECO members can be described as: allocation of ERS liabilities, allocation of ERS assets, and addition of LECOSRF. Allocation of ERS Liabilities
The first step is to determine the plan liabilities for each resulting plan. ERS plan liabilities for currently contributing LECO members were attributed to the new LECO plan. Liabilities for individual annuitants and non-contributing members were attributed to the new LECO plan based on the proportion of their CPO-service relative to their total ERS plan service. The remaining ERS plan liabilities would remain in the regular State (non-LECO) employees plan. Adjusted Plan Liability for Purposes of Allocating Assets
LECO members are eligible for enhanced benefits at earlier ages with less reduction for early retirement; therefore, these benefits are more valuable than the benefits available to regular State (non-LECO) employees. Even though LECO members received more valuable benefits from the ERS plan, contributions for these members (State contributions and member contributions) to the ERS plan have historically been the same percentage of payroll as the contributions for regular State (non-LECO) employees. Solely for the purpose of allocating the plan assets, current ERS plan liabilities for LECO members were re-cast, or adjusted, to approximate the plan liabilities as if LECO members received the same benefits as regular State (non-LECO) employees. Allocation of Assets
Adjusted ERS plan liabilities of annuitants and non-contributing members in both of the resulting plans were fully funded with ERS assets at market value. There is precedence for first allocating assets to retiree liabilities in corporate plan spinoffs. In a sense, retiree liabilities have the highest “demand” for assets since benefit payments are already being made. The remaining assets were allocated evenly across the adjusted ERS plan liabilities for contributing members in both of the resulting plans. The ratio of actuarial to market value of assets was applied to the market-value asset allocation to arrive at the final actuarial value asset allocation.
Employees Retirement System of Texas H - 4
Impact of LECOSRF
The final step in allocating the liabilities and assets for a stand-alone plan for LECO members is to combine the allocated LECO liabilities and assets from the ERS plan with the liabilities and assets of the Law Enforcement and Custodial Officer Supplemental Retirement Fund (LECOSRF). Financing of Restructured Plans
Based on the results of the August 31, 2017 actuarial valuations of the ERS plan and LECOSRF, neither plan was considered actuarially sound. In this context, an actuarially sound retirement plan receives a total contribution rate sufficient to cover the normal cost, administrative expenses, and amortize the unfunded actuarial accrued liability over a period of 31 years, or less. Based on the allocation of liabilities and assets outlined in this Section, neither the stand-alone LECO plan nor the regular State (non-LECO) employees plan would be considered actuarially sound as of August 31, 2017. Administrative Considerations
The asset allocation outlined in this Section is only one of many “reasonable” asset allocations. Actuarial standards of practice give guidance on how to assess the actuarial soundness of a proposed allocation, but they do not prescribe a particular methodology for allocation of the assets in a situation such as this. As previously noted, there are detailed rules regarding the allocation of assets in corporate plan spinoffs, but there is very little precedent for public pension plans. There is supporting rationale for this allocation method, but there are other methods which could also be supported.

Law Enforcment and Custodial Officer Supplemental Retirement Fund of the Employees Retirement System of Texas Annual Actuarial Valuation - Funding As of August 31, 2017

November 28, 2017
Board of Trustees Employees Retirement System of Texas 200 East 18th Street Austin, TX 78701 Re: Actuarial Valuation for Funding Purposes as of August 31, 2017
Members of the Board:
We certify that the information contained in this report is accurate and fairly presents the actuarial position of the Law Enforcement and Custodial Officer Supplemental Retirement Fund (LECOSRF) of the Employees Retirement System of Texas as of August 31, 2017. This report was prepared at the request of the Board and is intended for use by ERS staff and those designated or approved by the Board. This report may be provided to parties other than ERS only in its entirety and only with the permission of the Board.
Actuarial Valuation
The primary purposes of the actuarial valuation report are to determine the adequacy of the current State and employer contribution rates, describe the current financial condition of LECOSRF, analyze changes in the condition of LECOSRF, and provide various summaries of the data.
It is important for the Board of Trustees to understand that the currently scheduled member, employer and State contributions are not expected to accumulate sufficient assets in order to pay all of the currently scheduled benefits when due.
Plan Provisions
Our actuarial valuation as of August 31, 2017 reflects the benefit and contribution provisions set forth in Chapters 811 through 815 of the Texas Government Code with respect to the amounts payable from the Law Enforcement and Custodial Officer Supplemental Retirement Fund. The current plan provisions are outlined in Section D of this report.
Actuarial Assumptions and Methods
The assumptions and methods applied in this actuarial valuation were adopted by the Board of Trustees on August 23, 2017 based on the experience investigation that covered the five-year period from September 1, 2011 through August 31, 2016. Additionally, this actuarial valuation incorporates the significant across-the-board pay increases budgeted by the State Legislature when they are granted for the current biennium. The current actuarial assumptions and methods are outlined in Section E of this report.

Board of Trustees November 28, 2017 Page 2
Data
The valuation was based upon information as of August 31, 2017, furnished by ERS staff, concerning system benefits, financial transactions, plan provisions and active members, terminated members, retirees and beneficiaries. We checked for internal and year-to-year consistency, but did not audit the data. We are not responsible for the accuracy or completeness of the information provided by ERS staff.
Certification
All of our work conforms with generally accepted actuarial principles and practices, and to the Actuarial Standards of Practice issued by the Actuarial Standards Board. In our opinion, our calculations also comply with the requirements of, where applicable, the Internal Revenue Code and ERISA.
The signing actuaries are independent of the plan sponsor. They are all Enrolled Actuaries, Fellows of the Society of Actuaries, and Members of the American Academy of Actuaries, and meet the Qualification Standards of the American Academy of Actuaries. Finally, each of the undersigned are experienced in performing valuations for large public retirement systems.
Respectfully submitted,
Gabriel, Roeder, Smith & Company
R. Ryan Falls, FSA, EA, MAAA Joseph P. Newton, FSA, EA, MAAA
Senior Consultant & Actuary Pension Market Leader & Actuary
Dana Woolfrey, FSA, EA, MAAA
Consultant & Actuary
Law Enforcement and Custodial Officer Supplemental Retirement Fund of the Employees Retirement System of Texas
Table of Contents
Section
Cover Letter
Section A Executive Summary
Section B Discussion
Section C Tables
1 - Development of Employer Cost
2 - Actuarial Present Value of Future Benefits
3 - Analysis of Normal Cost
4 - Historical Summary of Active Member Data
5 - Reconciliation of Plan Net Assets
6 - Development of Actuarial Value of Assets
7 - History of Investment Return Rates
8 - History of Cash Flow
9 - Total Experience Gain or Loss
10 - Solvency Test
11 - Historical Contribution Rates
Section D Summary of Plan Provisions
Section E Summary of Actuarial Assumptions and Methods
Section F Detailed Summaries of Membership Data
Section G Glossary

SECTION A
EXECUTIVE SUMMARY

Law Enforcement and Custodial Officer Supplemental Retirement Fund of the Employees Retirement System of Texas
A - 1
Executive Summary
2017 2016
Membership
• Number of
- Active members 38,206 39,066
- Retirees and beneficiaries 12,248 11,515
- Inactive, vested 109 95
- Inactive, nonvested 16,991 15,108
- Total 67,554 65,784
• Valuation Payroll 1,720,362,464$ 1,743,679,004$
Statutory contribution rates FY 2018 FY 2017
• Members 0.50% 0.50%
• State 0.50% 0.50%
• Expected annual contributions
from court fees $18.8 million $19.2 million
Actuarially Sound Rate (funds normal cost
and amortizes unfunded accrued liability
over 31 years, per Section 811.006 of the
Texas Government Code)
- Total Contribution Rate 3.67% 3.10%
- In addition to Court Fees 2.87% 2.33%
Assets
• Market value (MVA) 923,989,580$ 860,049,223$
• Actuarial value (AVA) 923,989,580$ 933,534,062$
• Return on market value (gross) 12.15% 5.32%
Return on market value (net) 12.11% 5.28%
• Return on actuarial value 2.8% 5.9%
Actuarial Information on AVA - smoothed
• Normal cost % 2.11% 1.81%
• Total normal cost 36,299,648$ 31,560,590$
• Actuarial accrued liability 1,399,876,657$ 1,312,392,501$
• Unfunded actuarial accrued
liability (UAAL) 475,887,077$ 378,858,439$
• Funded ratio 66.0% 71.1%
• Funding period (years) Never Never
Actuarial Information on MVA
• Unfunded actuarial accrued
liability (UAAL) 475,887,077$ 452,343,278$
• Funded ratio 66.0% 65.5%
Item

Law Enforcement and Custodial Officer Supplemental Retirement Fund of the Employees Retirement System of Texas
A - 2
The following chart illustrates the recent history and outlook of the funded status of LECOSRF over the next five years:
August 31, 2013 2014 2015 2016 2017 2018 2019 2020 2021 2022
Funded
Ratio
70.4%
73.2%
72.0%
71.1%
66.0%
65.0%
64.0%
62.9%
61.7%
60.3%
UAAL
(in millions) $354 $323 $353 $379 $476 $512 $550 $592 $637 $687
ASC 3.09% 2.96% 3.01% 2.33% 2.87% 2.96% 3.06% 3.15% 3.25% 3.36%
* For 2016 and thereafter, the stated Actuarially Sound Contribution rate is the contribution necessary to be actuarially sound based on the 31-year standard in addition to expected annual contribution from court fees. Prior to 2016, the expected court fees were included in the ASC as 1.20% of pay.
The projections beyond 2017 are based on the same assumptions, methods and provisions used for the August 31, 2017 valuation, which include the significant across-the-board pay increases budgeted by the State Legislature when they are granted and the assumptions adopted by the Board in August 2017. Additionally, the market value of assets is expected to earn 7.5% per year. It is important for the Board of Trustees to understand that the currently scheduled member, employer and State contributions are not expected to accumulate sufficient assets in order to pay all of the currently scheduled benefits when due. Based on current expectations and assumptions, LECOSRF is projected to remain solvent until the year 2044, after which the funding would revert to a pay-as-you-go status. Therefore, for the current benefit structure to be sustainable, the contribution levels will need to be increased further. Given this outlook, we recommend the Legislature continue to make further increases in the contribution rates (State, employer, and/or member) to LECOSRF to improve the overall financial health of the retirement system.
50%
55%
60%
65%
70%
75%
80%
85%
90%
95%
100%
2013 2014 2015 2016 2017 2018 2019 2020 2021 2022
Historical and Future Projected Funded Ratios As of August 31

SECTION B
DISCUSSION
Law Enforcement and Custodial Officer Supplemental Retirement Fund of the Employees Retirement System of Texas
B - 1
Discussion
Introduction The results of the August 31, 2017 actuarial valuation of the Law Enforcement and Custodial Officer Supplemental Retirement Fund (LECOSRF) of the Employees Retirement System (ERS) of Texas are presented in this report. The primary purposes of this actuarial valuation report are to determine the adequacy of the current State and employer contribution rates, describe the current financial condition of LECOSRF, analyze the changes in the condition of LECOSRF, and provide various summaries of the data. The total contribution rate for the current fiscal year is less than the normal cost by 0.02% of payroll, which, on both an actuarial and market value of assets basis, is not sufficient to amortize the unfunded liability over a finite period of time. As a result, the UAAL is expected to grow indefinitely and the funding objective is not currently being realized. Based on current expectations and assumptions, LECOSRF is expected to remain solvent until the year 2044, after which the funding would revert to a pay-as-you-go status. All of the tables referenced in the following discussion appear in Section C of this report. Plan Provisions There were no changes to the plan provisions during the past year. The current plan provisions are outlined in Section D of this report. Actuarial Assumptions and Methods The assumptions and methods applied in this actuarial valuation were adopted by the Board of Trustees on August 23, 2017 based on the experience investigation that covered the five-year period from September 1, 2011 through August 31, 2016. We believe the assumptions are internally consistent and are reasonable, based on the actual experience of LECOSRF. A detailed account of the revised actuarial assumptions and methods can be found in our Actuarial Experience Study report dated June 28, 2017. A summary of key changes in assumptions and methods is highlighted below:
Economic Assumptions
Decrease the investment return assumption from 8.00% to 7.50%
Decrease the inflation assumption from 3.50% to 2.50%
The merit component of the salary scale for LECO members was increased by 0.50%, and thus when combined with the decrease in inflation, the nominal assumption is 0.50% lower than the previous assumption. Additionally, the step rates were extended from 10 years of service to 19 years of service.
Establish a general wage inflation assumption of 0.50% above inflation, or 3.00%. Mortality Assumptions
The post-retirement mortality tables for non-disabled retirees are based on recent ERS experience. A one year set-forward is applied to male LECO members. Fully generational mortality

Law Enforcement and Custodial Officer Supplemental Retirement Fund of the Employees Retirement System of Texas
B - 2
improvements are assumed using the ultimate rates from the scale most recently published by Retirement Plans Experience Committee of the Society of Actuaries (“Scale U-MP”).
The post-retirement mortality tables for disabled retirees is based on the most recently published national tables, the RP-2014 tables for disabled lives. Fully generational mortality improvements are assumed using Scale U-MP.
The pre-retirement mortality tables for active employees are based on the most recently published national tables, the RP-2014 tables for employees. Fully generational mortality improvements are assumed using Scale U-MP.
Other Demographic Assumptions
Modifications to the methodologies used to project termination patterns for members, with small adjustments in the overall rates consistent with experience and future expectations.
Modifications to the methodologies used to project retirement patterns for members, with small adjustments in the overall rates consistent with experience and future expectations and to better reflect expected differences among the benefit groups.
Small decreases to the disability patterns for members consistent with experience and future expectations.
For members that retire in the future, 40% of males are assumed to choose a 100% joint and survivor annuity option.
Actuarial Methods and Policies
Change in the asset smoothing method to a method that recognizes each year’s gain or loss over a closed five-year period. However, the method will continue to allow direct offsetting of gains and losses. The actuarial (smoothed) value of assets was set to equal to market value (mark to market) as of August 31, 2017, with the smoothing method to be applied prospectively.
Modified the application of the Entry Age Normal (EAN) actuarial cost method to base the normal cost rate on the benefits payable to each individual active member, generally referred to as “individual” EAN. Previously, the normal cost rate was based on the benefits payable to a new member and the entry age characteristics of the current active membership, generally referred to as “ultimate” EAN. As a result of this change, the funding period and Actuarially Sound Contribution (ASC) rate will be determined based on an open group projection.
The actuarial valuation as of August 31, 2017 incorporates the significant across-the-board pay increases budgeted by the State Legislature when they are granted for the current biennium. Specifically, employees were assumed to receive no across-the-board increase on September 1, 2017 or September 1, 2018. The results of the actuarial valuation are dependent upon the actuarial assumptions used. Actual results can and almost certainly will differ, as actual experience deviates from the assumptions. Even seemingly minor changes in the assumptions can materially change the liabilities, calculated contribution rates and funding periods. A review of the impact of a different set of assumptions on the funded status of LECOSRF is outside the scope of this actuarial valuation. The current actuarial assumptions and methods are outlined in Section E of this report. Funding Adequacy The funding objective of LECOSRF is to fund the sum of the normal cost and the amount necessary to amortize any unfunded actuarial accrued liability over a period that does not exceed 30 years by one or
Law Enforcement and Custodial Officer Supplemental Retirement Fund of the Employees Retirement System of Texas
B - 3
more years. Contribution rates should be established which, over time, will remain level as a percent of payroll. The member contribution rates are established by State statute and the State contribution rate is set by State statute and legislative appropriation. For the fiscal year beginning September 1, 2017, members contribute 0.50% of payroll and the State contributes 0.50% of payroll. LECOSRF also receives a portion of the court fees collected under Section 133.102 of the Local Government Code. The contribution from this source is expected to be approximately $18.8 million for fiscal year 2018 and all subsequent years based on a four-year average of the actual contributions. It should be noted that level dollar contributions from court fees in future years will result in total contributions that are not expected to remain level as a percent of payroll over time. For fiscal year 2018, the contribution from court fees is expected to be approximately 1.09% of payroll. The unfunded actuarial accrued liability (UAAL) of LECOSRF increased from $379 million as of August 31, 2016 to $476 million as of August 31, 2017. Additionally, the funded ratio of LECOSRF—actuarial value of assets divided by the actuarial accrued liability—decreased from 71.1% to 66.0% as of August 31, 2017. This decrease was primarily due to the changes in actuarial assumptions and methods adopted by the Board in August 2017. The funded status is one of many metrics used to show trends and develop future expectations about the health of a retirement system. The funded status measure itself is not appropriate for assessing the sufficiency of plan assets to cover the estimated cost of settling the plan’s benefit obligations or assessing the need for or the amount of future contributions since it does not reflect normal cost contributions, the timing of amortization payments, or future experience other than expected. The valuation shows that the total normal cost for funding purposes is 2.11% of payroll. The approximate total contribution rate is currently 2.09% of payroll. Thus, the total contribution rate for the current fiscal year is less than the normal cost by 0.02% of payroll and no payment will be available to amortize the unfunded liability. As the number of members eligible for the newest benefit provisions increases over time, the normal cost rate is expected to decrease. However, the projected contributions are not expected to exceed the normal cost in any year and will not be sufficient to eliminate the unfunded liability over a finite period of time. Assuming the market value of assets earns 7.5% per year, LECOSRF is projected to remain solvent until the year 2044, after which the funding would revert to a pay-as-you-go status. Section 811.006 of the Texas Government Code limits the modifications to LECOSRF that would, essentially, increase benefits or lower contributions to the trust unless the current level of benefits and contributions are considered actuarially sound. Section 811.006 defines actuarially sound as a retirement system that is receiving a total contribution rate sufficient to cover the normal cost, administrative expenses, and amortize the UAAL over a period of 31 years, or less. Based on the actuarial valuation as of August 31, 2017, the actuarially sound contribution (ASC) rate for LECOSRF is 2.87% of payroll in addition to the expected annual contributions from court fees of $18.8 million. As noted, the ASC is currently calculated based on a 31-year open amortization period. This means that the ASC will always be calculated with the same 31-year period and the UAAL would never completely be eliminated. Even though the contributions to LECOSRF are not based on this ASC, the Board may want to consider adopting a funding policy that includes an ultimate goal of eliminating the UAAL by a certain date. This type of funding policy will allow the Board to better assess the level of contributions received from the employers and the State.

Law Enforcement and Custodial Officer Supplemental Retirement Fund of the Employees Retirement System of Texas
B - 4
System Assets This report contains several tables that summarize key information with respect to the LECOSRF assets. The total market value of assets increased from $860 million to $924 million as of August 31, 2017. Table 5 reconciles the changes in the fund during the year. Total contributions decreased slightly from $37.0 million to $36.2 million. Contributions for fiscal year 2018 are anticipated to be approximately 2.09% of pay. Contributions in subsequent years are expected to increase in dollar amount, but at a declining percentage of pay since contributions from court fees are expected to remain level. Table 6 shows the development of the actuarial value of assets. As part of the actuarial experience study and adoption of revised actuarial assumptions and methods, the Board voted to reset the actuarial value of assets (AVA) to be equal to the market value of assets (MVA), or “mark to market” as of August 31, 2017. In subsequent years the AVA will be calculated using a new method. The new method will recognize each year’s gain or loss over a closed five year period. However, the method will continue to allow direct offsetting of gains and losses. When measured on a market value, the approximate gross investment return for the fiscal year ending August 31, 2017 was 12.15%, and the return net of investment expenses was 12.11%. When measured on an actuarial value, the net investment return was 2.8%. The much lower return on an actuarial basis is due to the transition to the new asset smoothing method as of August 31, 2017. Table 7 shows a history of return rates. The LECOSRF ten-year average market return, gross of all expenses as reported by the ERS Master Trust Custodian, is 5.67%. The ten-year average return net of investment expenses is 5.54%. Table 8 provides a history of the contributions paid into LECOSRF and the administrative expenses and benefit payments that have been paid out of LECOSRF. This table shows that LECOSRF paid administrative expenses and benefit payments, in excess of contributions received, of $28.9 million (or 3.4% of assets) in fiscal year 2016 and that amount was $35.4 million (or 3.8% of assets) in fiscal year 2017. ERS should continue to monitor this deficit as it could impact the future liquidity needs of LECOSRF. Table 11 provides a history of contribution rates, as a percent of payroll, paid into the trust by the state, agencies, and members. This table also shows a history of the total normal cost and the Actuarially Sound Contribution rate (ASC), as defined by Section 811.006 of the Texas Government Code. Data The valuation was based upon information as of August 31, 2017, furnished by ERS staff, concerning system benefits, financial transactions, plan provisions and active members, terminated members, retirees and beneficiaries. We checked for internal and year-to-year consistency, but did not otherwise audit the data. We are not responsible for the accuracy or completeness of the information provided by ERS staff. The tables in Section F show key census statistics for the various groups included in the valuation.

SECTION C
TABLES

Law Enforcement and Custodial Officer Supplemental Retirement Fund of the Employees Retirement System of Texas
C - 1
Table 1 Development of Employer Cost
August 31, 2017 August 31, 2017 August 31, 2016
Final Assumptions Prior Assumptions
1. Payroll
a. Reported Payroll (August Payroll of Active Members) 1,720,362,464$ 1,720,362,464$ 1,743,679,004$
b. Valuation Payroll (Expected Covered Payroll for
Following Plan Year) 1,720,362,464 1,720,362,464 1,743,679,004
2. Total Normal Cost Rate
a. Gross normal cost rate 2.03% 1.71% 1.71%
b. Administrative expenses 0.08% 0.10% 0.10%
c. Total (Item 2a + Item 2b) 2.11% 1.81% 1.81%
3. Actuarial Accrued Liability for Active Members
a. Present value of future benefits for active members 933,603,380$ 851,371,868$ 882,442,051$
b. Less: present value of future normal costs (248,727,185) (191,115,131) (198,521,400)
c. Actuarial accrued liability 684,876,195$ 660,256,737$ 683,920,651$
4. Total Actuarial Accrued Liability for:
a. Retirees and beneficiaries 702,926,185$ 664,031,042$ 618,987,770$
b. Inactive members 12,074,277 11,624,788 9,484,080
c. Active members (Item 3c) 684,876,195 660,256,737 683,920,651
d. Total 1,399,876,657$ 1,335,912,567$ 1,312,392,501$
5. Actuarial Value of Assets 923,989,580$ 961,918,154$ 933,534,062$
6. Unfunded Actuarial Accrued Liability
(UAAL) (Item 4d - Item 5) 475,887,077$ 373,994,413$ 378,858,439$
7. Total Contribution Rate Needed to Fund Normal Cost Plus
Amortize the UAAL Over 31 Years 3.67% 3.14% 3.10%
8. Expected Contribution from Court Fees
a. Expected future contributions 18,800,000$ 18,800,000$ 19,200,000$
b. Equivalent contribution rate for fiscal year 1.09% 1.09% 1.10%
9. Contribution Rate In Addition to Expected Court Fees
Needed to Fund Normal Cost Plus Amortize the UAAL
Over 31 Years 2.87% 2.35% 2.33%
10. Allocation of Contribution Rate for the Current Fiscal Year
a. Equivalent employer rate for fiscal year* 1.59% 1.59% 1.60%
b. Member rate 0.50% 0.50% 0.50%
c. Total contribution rate for fiscal year* 2.09% 2.09% 2.10%
d. Total normal cost rate 2.11% 1.81% 1.81%
e. Available contribution rate to amortize UAAL* -0.02% 0.28% 0.29%
f. Total contribution rate for fiscal year* 2.09% 2.09% 2.10%
11. Funding period based on statutory contribution rates,
expected court fees, and Actuarial Value of Assets (years) Never Never Never
* The annual court fees contributed to LECOSRF are expected to remain level in the future. As a result, the equivalent contribution
rate is expected to decrease over time as the payroll increases.
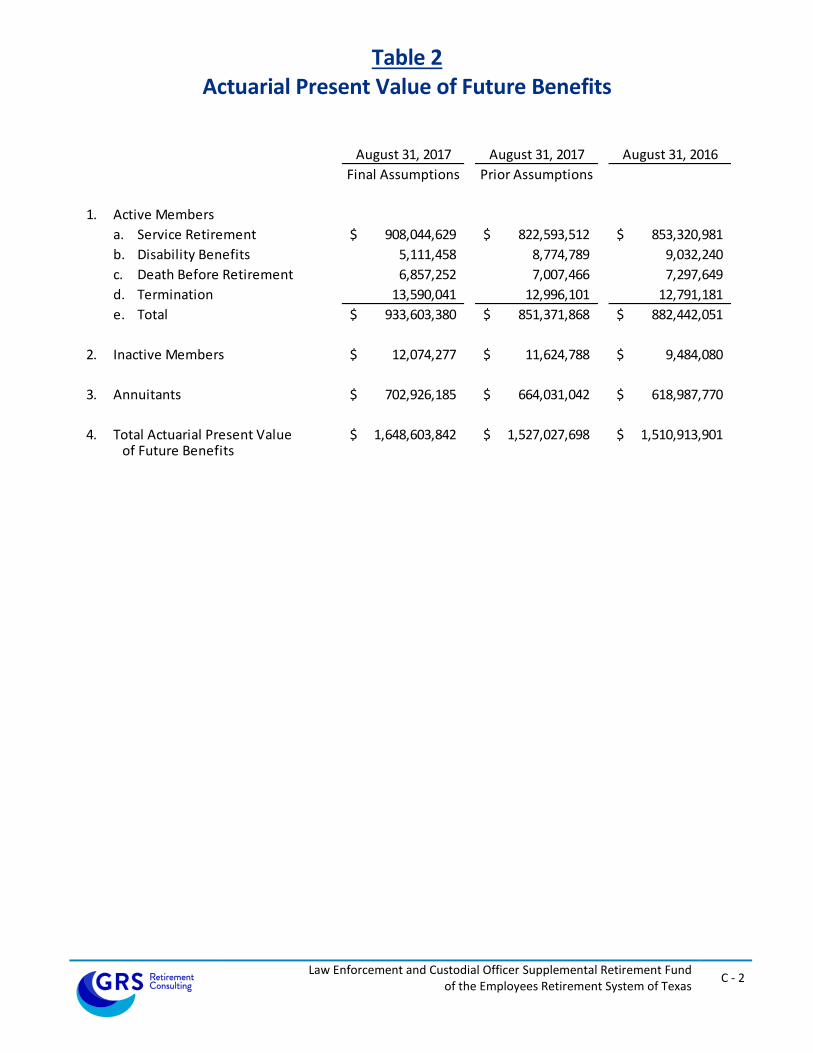
Law Enforcement and Custodial Officer Supplemental Retirement Fund of the Employees Retirement System of Texas
C - 2
Table 2 Actuarial Present Value of Future Benefits
August 31, 2017 August 31, 2017 August 31, 2016
Final Assumptions Prior Assumptions
1. Active Members
a. Service Retirement 908,044,629$ 822,593,512$ 853,320,981$
b. Disability Benefits 5,111,458 8,774,789 9,032,240
c. Death Before Retirement 6,857,252 7,007,466 7,297,649
d. Termination 13,590,041 12,996,101 12,791,181
e. Total 933,603,380$ 851,371,868$ 882,442,051$
2. Inactive Members 12,074,277$ 11,624,788$ 9,484,080$
3. Annuitants 702,926,185$ 664,031,042$ 618,987,770$
4. Total Actuarial Present Value 1,648,603,842$ 1,527,027,698$ 1,510,913,901$ of Future Benefits

Law Enforcement and Custodial Officer Supplemental Retirement Fund of the Employees Retirement System of Texas
C - 3
Table 3 Analysis of Normal Cost
August 31, 2017 August 31, 2017 August 31, 2016
Final Assumptions Prior Assumptions
1. Gross Normal Cost Rate
a. Service Retirement 1.85% 1.53% 1.53%
b. Disability Benefits 0.02% 0.03% 0.03%
c. Death Before Retirement 0.01% 0.02% 0.02%
d. Termination 0.15% 0.13% 0.13%
e. Total 2.03% 1.71% 1.71%
2. Administrative Expenses 0.08% 0.10% 0.10%
3. Total Normal Cost 2.11% 1.81% 1.81%
4. Less: Member Rate 0.50% 0.50% 0.50%
5. Employer Normal Cost Rate 1.61% 1.31% 1.31%

Law Enforcement and Custodial Officer Supplemental Retirement Fund of the Employees Retirement System of Texas
C - 4
Table 4 Historical Summary of Active Member Data
Valuation as of Percent Amount in Percent Percent Average Average
August 31, Number Increase $ Millions Increase $ Amount Increase Age Service
(1) (2) (3) (4) (5) (6) (7) (8) (9)
2008 33,642 N/A 1,245 N/A 37,021 N/A 42.7 9.6
2009 37,819 12.4% 1,387 11.4% 36,687 -0.9% 42.0 8.6
2010 39,052 3.3% 1,483 6.9% 37,979 3.5% 41.9 8.5
2011 36,806 -5.8% 1,452 -2.1% 39,454 3.9% 42.2 8.9
2012 37,404 1.6% 1,475 1.6% 39,444 0.0% 42.5 9.1
2013 37,415 0.0% 1,477 0.1% 39,469 0.1% 42.4 9.1
2014 37,084 -0.9% 1,542 4.4% 41,584 5.4% 42.3 8.9
2015 38,526 3.9% 1,616 4.8% 41,957 0.9% 41.7 8.4
2016 39,066 1.4% 1,744 7.9% 44,634 6.4% 41.0 8.0
2017 38,206 -2.2% 1,720 -1.3% 45,029 0.9% 41.1 8.0
Active Members Covered Payroll Average Salary

Law Enforcement and Custodial Officer Supplemental Retirement Fund of the Employees Retirement System of Texas
C - 5
Table 5 Reconciliation of Plan Net Assets
August 31, 2017 August 31, 2016
(1) (2)
1. Market value of assets at beginning of year 860,049,223$ 844,145,332$
2. Revenue for the year
a. Contributions for the year
i. State (including membership fees) 26,583,162$ 27,497,297$
ii. Member (including penalty interest) 9,583,044 9,538,658
iii. Total 36,166,206$ 37,035,955$
b. Net investment income 99,340,827$ 44,831,113$
c. Total revenue 135,507,033$ 81,867,068$
3. Disbursements for the year
a. Benefit payments and refunds 69,755,566 64,541,719$
b. Net transfers from TRS 0 0
c. Administrative expenses 1,811,110 1,421,458
d. Total expenditures 71,566,676 65,963,177
4. Increase in net assets
(Item 2c - Item 3d) 63,940,357$ 15,903,891$
5. Market value of assets at end of year (Item 1 + Item 4) 923,989,580$ 860,049,223$
Year Ending

Law Enforcement and Custodial Officer Supplemental Retirement Fund of the Employees Retirement System of Texas
C - 6
Table 6 Development of Actuarial Value of Assets
Year Ending
August 31, 2017
1. Actuarial value of assets at beginning of year 933,534,062$
2. Net new investments
a. Contributions for the year (Table 5) 36,166,206$
b. Disbursements for the year (Table 5) (71,566,676)
c. Subtotal (35,400,470)
3. Assumed investment return rate 7.50%
4. Expected return 68,687,537$
5. Expected actuarial value of assets at end of year
(Item 1 + Item 2c + Item 4) 966,821,129$
6. Market value of assets at end of year 923,989,580$
7. Market Adjustment as of August 31, 2017* (42,831,549)$
8. Actuarial value of assets (Item 5 + Item 7) 923,989,580$
9. Estimated rate of return 2.8%
10. Actuarial value as percentage of market value 100.0%
* A one-time adjustment to reset the actuarial value to market value was applied as of
August 31, 2017. Smoothing will be applied in future valuation reports.

Law Enforcement and Custodial Officer Supplemental Retirement Fund of the Employees Retirement System of Texas
C - 7
Table 7 History of Investment Return Rates
Year Ending Market Market
August 31 of Returns (Gross) Returns (Net) Actuarial
(1) (2) (3) (4)
1998 8.30% 8.23% N/A
1999 16.26% 16.46% N/A
2000 9.43% 9.40% N/A
2001 -6.91% -6.93% N/A
2002 -7.17% -7.21% N/A
2003 9.20% 9.14% 5.2%
2004 11.69% 11.64% 6.3%
2005 12.71% 12.62% 7.4%
2006 8.83% 8.76% 7.6%
2007 13.88% 13.76% 8.5%
2008 -4.58% -4.69% 5.7%
2009 -6.60% -6.71% 3.2%
2010 6.65% 6.48% 3.7%
2011 12.58% 12.36% 5.1%
2012 8.22% 8.04% 5.4%
2013 10.07% 9.87% 6.1%
2014 14.70% 14.58% 7.6%
2015 0.49% 0.44% 6.1%
2016 5.32% 5.28% 5.9%
2017 12.15% 12.11% 2.8%
Average Returns
Last Five Years: 8.43% 8.34% 5.7%
Last Ten Years: 5.67% 5.54% 5.2%
Last Fifteen Years: 7.49% 7.39% 5.8%
Last Twenty Years: 6.49% 6.41% N/A Market returns provided by ERS Master Trust Custodian.
Rates in Column (2) represent the market returns gross of all expenses. Rates in Column (3) represent the market returns net of investment expenses. Net returns may exceed gross returns in years where adjustments are made to fee expenses.
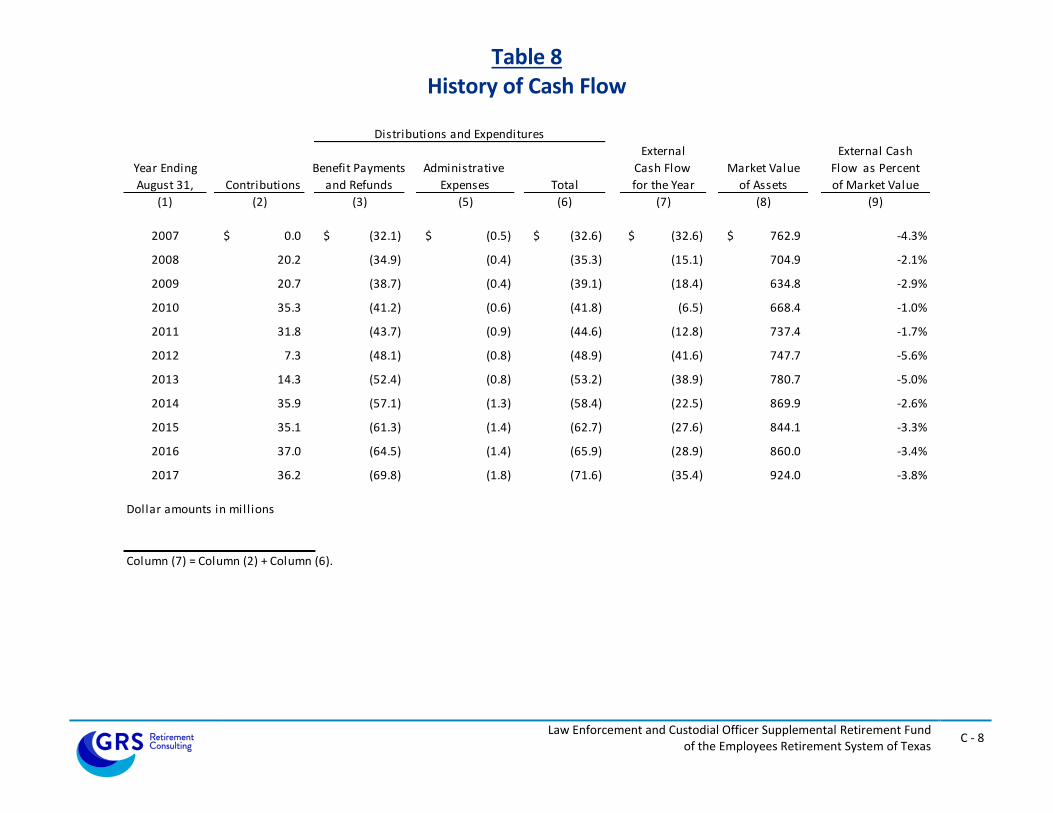
Law Enforcement and Custodial Officer Supplemental Retirement Fund of the Employees Retirement System of Texas
C - 8
Table 8 History of Cash Flow
External External Cash
Year Ending Benefit Payments Administrative Cash Flow Market Value Flow as Percent
August 31, Contributions and Refunds Expenses Total for the Year of Assets of Market Value
(1) (2) (3) (5) (6) (7) (8) (9)
2007 0.0$ (32.1)$ (0.5)$ (32.6)$ (32.6)$ 762.9$ -4.3%
2008 20.2 (34.9) (0.4) (35.3) (15.1) 704.9 -2.1%
2009 20.7 (38.7) (0.4) (39.1) (18.4) 634.8 -2.9%
2010 35.3 (41.2) (0.6) (41.8) (6.5) 668.4 -1.0%
2011 31.8 (43.7) (0.9) (44.6) (12.8) 737.4 -1.7%
2012 7.3 (48.1) (0.8) (48.9) (41.6) 747.7 -5.6%
2013 14.3 (52.4) (0.8) (53.2) (38.9) 780.7 -5.0%
2014 35.9 (57.1) (1.3) (58.4) (22.5) 869.9 -2.6%
2015 35.1 (61.3) (1.4) (62.7) (27.6) 844.1 -3.3%
2016 37.0 (64.5) (1.4) (65.9) (28.9) 860.0 -3.4%
2017 36.2 (69.8) (1.8) (71.6) (35.4) 924.0 -3.8%
Dollar amounts in mill ions
Column (7) = Column (2) + Column (6).
Distributions and Expenditures

Law Enforcement and Custodial Officer Supplemental Retirement Fund of the Employees Retirement System of Texas
C - 9
Table 9 Total Experience Gain or Loss
Year Ending Year Ending
August 31, 2017 August 31, 2016
(2) (3)
A. Calculation of total actuarial gain or loss
1. Unfunded actuarial accrued liability (UAAL), previous year 378,858,439$ 353,061,775$
2. Assumption/Method changes - Liability Only 62,287,122$ 0$
3. UAAL, previous year, after assumption changes (Item 1 + Item 2) 441,145,561$ 353,061,775$
4. Normal cost for the year (excluding administrative expenses) 35,571,052 29,236,842
5. Actual administrative expenses 1,811,110 1,421,458
6. Contributions for the year (excluding service purchases) (35,327,522) (36,180,288)
7. Interest at 7.5% for FYE 2017, 8% for FYE 2016
a. On UAAL 33,085,917$ 28,244,942$
b. On normal cost and administrative expenses 1,401,831 1,226,332
c. On contributions (1,324,782) (1,447,212)
d. Total 33,162,966$ 28,024,062$
8. Legislative changes*– Across-the-board pay increases budgeted for
upcoming biennium by the State Legislature (34,995,327) 0
9. Expected UAAL (Sum of Items 3 through 8) 441,367,840 375,563,849
10. Actual UAAL 475,887,077 378,858,439
11. Total (gain)/loss for the year (Item 10 - Item 9) 34,519,237$ 3,294,590$
B. Source of gains and losses
12. Asset (Gain)/Loss for the year - Prior Smoothing Method 0.00% 0$ 18,371,210$
13. Asset (Gain)/Loss for the year - New Smoothing Method 3.06% 42,831,549 0
14. Pay Increases (Less)/Greater than Expected 0.06% 908,628 (4,012,226)
15. Non-Retired Demographic (Gains)/Losses 0.70% (9,838,111) (12,523,340)
16. Post-Retirement Mortality (Gains)/Losses 0.19% (2,669,207) 214,071
17. Other Demographic (Gains)/Losses 0.23% 3,286,378 1,244,875
18. Total (Sum of Items 12 through 17) 2.47% 34,519,237$ 3,294,590$
Item
(1)
% of
AAL
* The plan experiences a (gain)/loss when across-the-board pay increases budgeted by the State Legislature
are (less)/greater than assumed.

Law Enforcement and Custodial Officer Supplemental Retirement Fund of the Employees Retirement System of Texas
C - 10
Table 10 Solvency Test
Actuarial Accrued Liability and Percent of Active Member Payroll for:
% of % of % of Actuarial Value
August 31, (1) Payroll (2) Payroll (3) Payroll of Assets (1) (2) (3)
2007 0.0$ 0% 278.1$ 22% 484.6$ 9% 747.8$ 100% 100% 97%
2008 0.0 0% 314.6 25% 527.5 42% 774.5 100% 100% 87%
2009 0.0 0% 334.6 24% 572.5 41% 780.8 100% 100% 78%
2010 7.3 0% 368.0 25% 591.3 40% 802.9 100% 100% 72%
2011 13.9 1% 400.9 28% 578.0 40% 830.5 100% 100% 72%
2012 19.5 1% 447.5 30% 577.3 39% 832.5 100% 100% 63%
2013 24.4 2% 482.7 33% 690.0 47% 843.0 100% 100% 49%
2014 29.5 2% 533.3 35% 644.0 42% 883.6 100% 100% 50%
2015 34.5 2% 578.9 36% 648.9 40% 909.2 100% 100% 46%
2016 41.5 2% 619.0 35% 651.9 37% 933.5 100% 100% 42%
2017 47.0 3% 702.9 41% 649.9 38% 924.0 100% 100% 27%
Note: Dollar amounts in millions
Liabilities Covered
by Assets
Employer Financed
Portion of Vested
and Nonvested BenefitsInterest
Retirees and
Beneficiaries Currently
Receiving Benefits
Accumulated Member
Contributions Including
Portion of Accrued

Law Enforcement and Custodial Officer Supplemental Retirement Fund of the Employees Retirement System of Texas
C - 11
Table 11 Historical Contribution Rates
Actuarial
Valuation as Court Total Normal
of August 31, State Fees* Members Total Cost Rate ASC**
1998 0.00% 0.00% 0.00% 0.00% 1.70% Not calculated
1999 0.00% 0.00% 0.00% 0.00% 1.98% Not calculated
2000 0.00% 0.00% 0.00% 0.00% 1.95% Not calculated
2001 0.00% 0.00% 0.00% 0.00% 1.76% Not calculated
2002 0.00% 0.00% 0.00% 0.00% 1.75% Not calculated
2003 0.00% 0.00% 0.00% 0.00% 1.61% Not calculated
2004 0.00% 0.00% 0.00% 0.00% 1.62% Not calculated
2005 0.00% 0.00% 0.00% 0.00% 1.63% 1.54%
2006 0.00% 0.00% 0.00% 0.00% 1.55% 1.50%
2007 1.59% 0.00% 0.00% 1.59% 1.54% 1.61%
2008 1.59% 0.00% 0.00% 1.59% 2.18% 2.51%
2009 1.59% 0.00% 0.50% 2.09% 2.07% 2.58%
2010 1.59% 0.00% 0.50% 2.09% 2.07% 2.72%
2011 0.00% 0.00% 0.50% 0.50% 2.07% 2.72%
2012 0.50% 0.00% 0.50% 1.00% 2.02% 2.86%
2013 0.50% 1.20% 0.50% 2.20% 1.80% 3.09%
2014 0.50% 1.20% 0.50% 2.20% 1.77% 2.96%
2015 0.50% 1.20% 0.50% 2.20% 1.77% 3.01%
2016 0.50% 1.10% 0.50% 2.10% 1.81% 3.10%
2017 0.50% 1.09% 0.50% 2.09% 2.11% 3.67%
***LECOSRF did not receive any contributions for 14 years, from fiscal years 1994 through 2007.
Contributions from:
* From 2013 to 2015, it was assumed that contributions from court fees would remain level as a percentage of pay.
Beginning in 2016 and thereafter, the amount shown is the assumed level dollar amount as a percentage of
valuation payroll.
** The Actuarially Sound Contribution (ASC) rate is the rate determined as of the valuation date to fund the normal
cost and amortize the UAAL over a 31 year period. In all cases, the ASC is calculated as the total contribution
necessary to meet the objective, including any expected contributions from court fees.

SECTION D
SUMMARY OF PLAN PROVISIONS
Law Enforcement and Custodial Officer Supplemental Retirement Fund of the Employees Retirement System of Texas
D - 1
Summary of Plan Provisions for Law Enforcement and Custodial Officer Supplemental Retirement
Fund of the Employees Retirement System of Texas Classes of Membership
1. Employee Class Membership:
a. Membership is mandatory for all employees and appointed officers of every department, commission, board, agency, or institution of the State except for:
i. Independent contractors;
ii. Persons covered by the Teacher Retirement System or either of the Judicial Retirement Systems; and
iii. Employee Class Members already receiving retirement benefits under the System.
b. Includes two types of Employee Class service:
i. CPO/CO: Certified Peace Officer / Custodial Officer – in general, service rendered while a law enforcement officer, custodial officer, parole officer or caseworker (collectively referred to as “LECOs”); and
ii. Regular: Non-CPO/CO service.
c. Prior to September 1, 2015, membership begins after a 90-day waiting period. Effective September 1, 2015, membership begins immediately.
The benefits payable by the Law Enforcement and Custodial Officer Supplemental Retirement Fund (LECOSRF) only apply to members that have accrued CPO/CO service.
Member Contributions
1. 0.5% of compensation to LECOSRF in addition to contributions payable to ERS. Additional member contributions may be allowable for service purchases.
2. Member contributions cease when a member’s benefit accrual has reached 100% of Average Monthly Compensation.
3. Member contributions accumulate interest at 2.00% per year.
State of Texas and Employer Contributions
State contributions are set biennially by the legislature. The current sources of contributions are shown below.
1. Payroll Contributions: The current projected contribution rate for the State is 0.50% of compensation for the 2018 and 2019 fiscal years. State payroll contributions cease when a member’s benefit accrual has reached 100% of Average Monthly Compensation.
2. Court Fees: LECOSRF also receives a portion of the court fees collected under Section 133.102 of the Local Government Code. Based on historical information, the contribution from this source is expected to be approximately $18.8 million for fiscal year 2018.
State contributions after the 2019 fiscal year are subject to future legislative appropriations.
Law Enforcement and Custodial Officer Supplemental Retirement Fund of the Employees Retirement System of Texas
D - 2
Return to Work Surcharge
For members who, on or after September 1, 2009, retire from the employee class and are rehired as a retiree into a position that would otherwise include membership in the employee class, the department or agency that employs the member must remit to the retirement system an amount equal to the amount of the State contribution that the department or agency would remit for an active member employed in the person's position.
Compensation
Compensation includes base salary, longevity and hazardous duty pay and excludes overtime pay. This amount is limited by Section 401(a)(17) of the Internal Revenue Code for members hired after August 31, 1996.
Average Monthly Compensation (AMC)
1. Members hired prior to September 1, 2009: Average of the 36 highest months of compensation for service in the employee class of membership
2. Members hired on or after September 1, 2009 and prior to September 1, 2013: Average of the 48 highest months of compensation for service in the employee class of membership
3. Members hired on or after September 1, 2013: Average of the 60 highest months of compensation for service in the employee class of membership.
Creditable Service
The types of service creditable in LECOSRF are membership service, military service and equivalent membership service. Equivalent membership service includes: previously cancelled service, service not previously established, waiting period service, and Additional Service Credit.
Unused Sick and Annual Leave
In many cases, unused sick and annual leave can be used to establish Creditable Service. Members hired prior to September 1, 2009 can use unused sick and annual leave to satisfy service requirements for Retirement and Death Benefit Plan eligibility as well as to calculate plan benefits. Members hired on or after September 1, 2009 can only use unused sick and annual leave to calculate plan benefits. However, members hired on or after September 1, 2013 cannot use unused annual leave to calculate plan benefits if the member opts to receive the unused annual leave as a lump-sum payment.
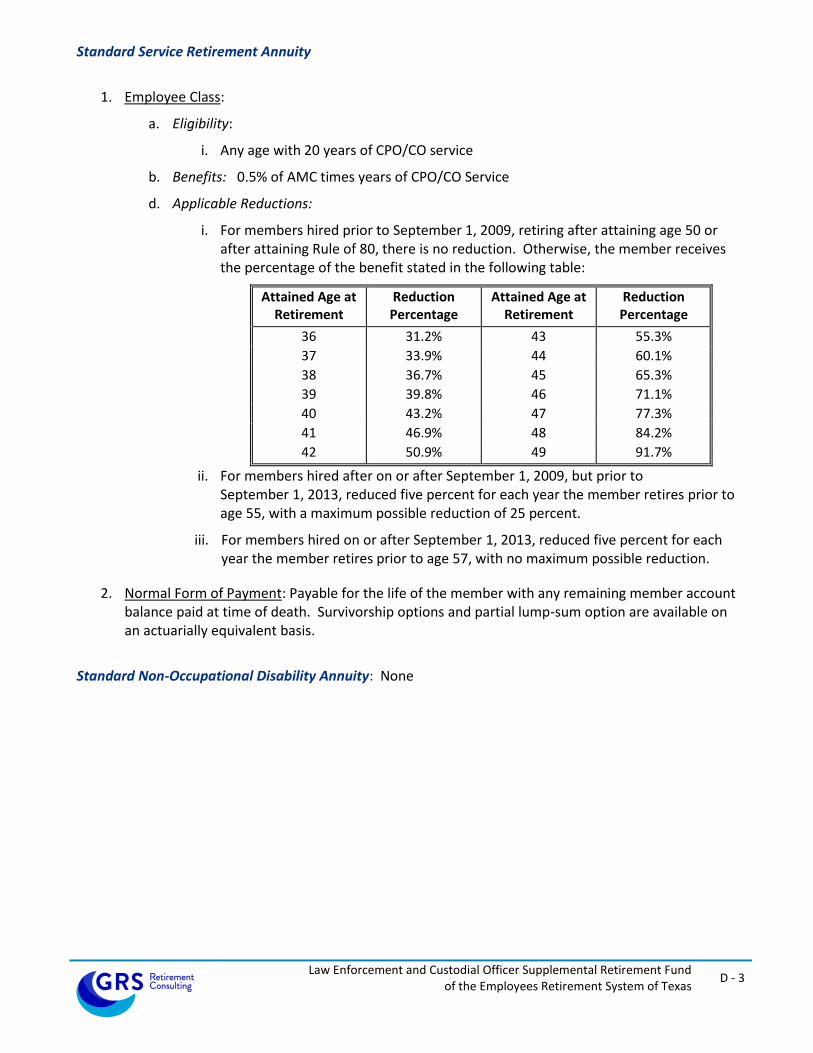
Law Enforcement and Custodial Officer Supplemental Retirement Fund of the Employees Retirement System of Texas
D - 3
Standard Service Retirement Annuity
1. Employee Class:
a. Eligibility:
i. Any age with 20 years of CPO/CO service
b. Benefits: 0.5% of AMC times years of CPO/CO Service
d. Applicable Reductions:
i. For members hired prior to September 1, 2009, retiring after attaining age 50 or after attaining Rule of 80, there is no reduction. Otherwise, the member receives the percentage of the benefit stated in the following table:
Attained Age at Retirement
Reduction Percentage
Attained Age at Retirement
Reduction Percentage
36 31.2% 43 55.3%
37 33.9% 44 60.1%
38 36.7% 45 65.3%
39 39.8% 46 71.1%
40 43.2% 47 77.3%
41 46.9% 48 84.2%
42 50.9% 49 91.7%
ii. For members hired after on or after September 1, 2009, but prior to September 1, 2013, reduced five percent for each year the member retires prior to age 55, with a maximum possible reduction of 25 percent.
iii. For members hired on or after September 1, 2013, reduced five percent for each year the member retires prior to age 57, with no maximum possible reduction.
2. Normal Form of Payment: Payable for the life of the member with any remaining member account balance paid at time of death. Survivorship options and partial lump-sum option are available on an actuarially equivalent basis.
Standard Non-Occupational Disability Annuity: None
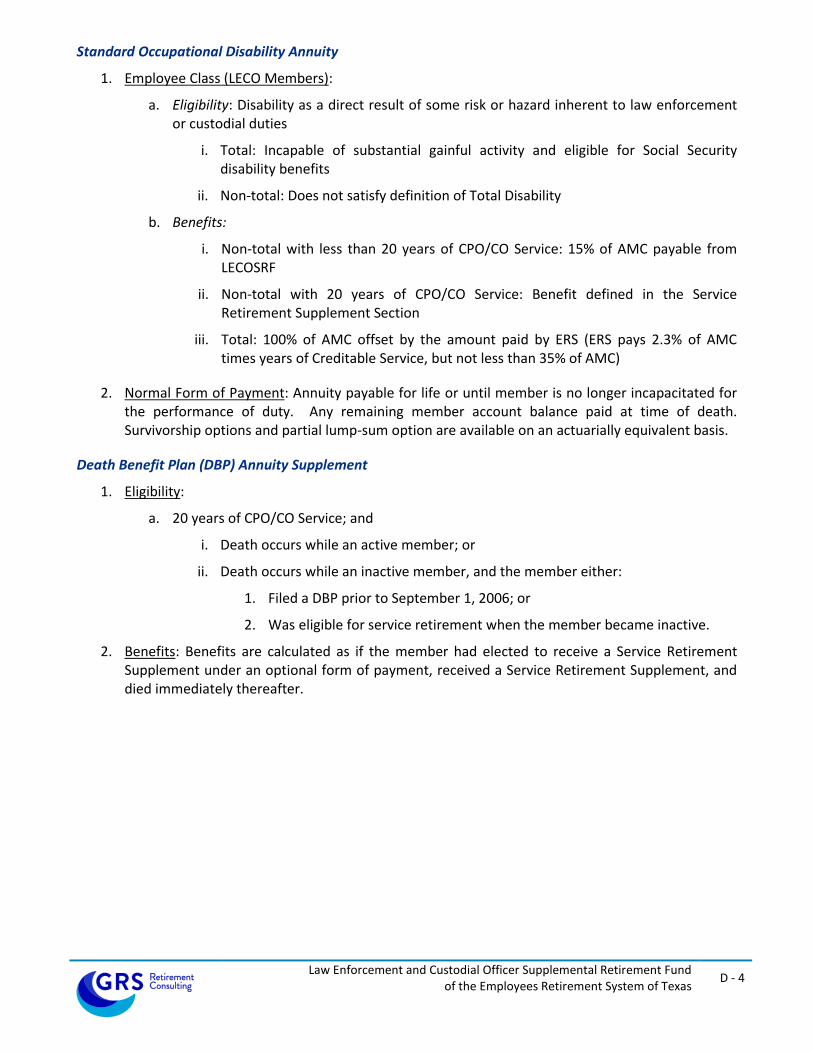
Law Enforcement and Custodial Officer Supplemental Retirement Fund of the Employees Retirement System of Texas
D - 4
Standard Occupational Disability Annuity
1. Employee Class (LECO Members):
a. Eligibility: Disability as a direct result of some risk or hazard inherent to law enforcement or custodial duties
i. Total: Incapable of substantial gainful activity and eligible for Social Security disability benefits
ii. Non-total: Does not satisfy definition of Total Disability
b. Benefits:
i. Non-total with less than 20 years of CPO/CO Service: 15% of AMC payable from LECOSRF
ii. Non-total with 20 years of CPO/CO Service: Benefit defined in the Service Retirement Supplement Section
iii. Total: 100% of AMC offset by the amount paid by ERS (ERS pays 2.3% of AMC times years of Creditable Service, but not less than 35% of AMC)
2. Normal Form of Payment: Annuity payable for life or until member is no longer incapacitated for the performance of duty. Any remaining member account balance paid at time of death. Survivorship options and partial lump-sum option are available on an actuarially equivalent basis.
Death Benefit Plan (DBP) Annuity Supplement
1. Eligibility:
a. 20 years of CPO/CO Service; and
i. Death occurs while an active member; or
ii. Death occurs while an inactive member, and the member either:
1. Filed a DBP prior to September 1, 2006; or
2. Was eligible for service retirement when the member became inactive.
2. Benefits: Benefits are calculated as if the member had elected to receive a Service Retirement Supplement under an optional form of payment, received a Service Retirement Supplement, and died immediately thereafter.

Law Enforcement and Custodial Officer Supplemental Retirement Fund of the Employees Retirement System of Texas
D - 5
Deferred Service Retirement Annuity
1. Employee Class:
a. Eligibility:
i. 20 years of CPO/CO service at termination of CPO/CO employment, and either;
1. The member transfers to and retires from active regular class service; or
2. The member terminates all employee class service, and the regular employee class account balance is not withdrawn from the ERS trust.
b. Benefits:
i. Service Retirement Supplement, based on the member’s age at benefit commencement. AMC used in calculating the benefit payable from the ERS trust and the LECOSRF will both be based on all employee class service.
ii. Payments may commence at any age, provided that the member has terminated all employee class service. The member must retire simultaneously from the ERS trust and the LECOSRF.
2. Normal Form of Payment: Payable for the life of the member with any remaining member account balance paid at time of death. Survivorship options and partial lump-sum option are available on an actuarially equivalent basis.
Refund of Accumulated Contributions
A refund of accumulated contributions is payable in cases where a terminated member did not meet the eligibility requirements for an annuity, or a terminated member chooses to receive a refund of his or her account balance in lieu of an annuity.
Maximum Benefits
Annuity benefits are limited to 100% of Average Monthly Compensation. For members with CPO/CO service, this benefit limitation includes benefits from all sources (ERS and the Law Enforcement and Custodial Officer Supplemental Retirement Fund).
Limit on Plan Modifications
According to Section 811.006 of the Texas Government Code – a rate of member or State contributions to or a rate of interest required for the establishment of credit in the retirement system may not be reduced or eliminated, a type of service may not be made creditable in the retirement system, a limit on the maximum permissible amount of a type of creditable service may not be removed or raised, a new monetary benefit payable by the retirement system may not be established, and the determination of the amount of a monetary benefit from the system may not be increased, if, as a result of the particular action, the time, as determined by an actuarial valuation, required to amortize the UAAL of the retirement system would be increased to a period that exceeds 30 years by one or more years.

SECTION E
ACTUARIAL ASSUMPTIONS AND METHODS

Law Enforcement and Custodial Officer Supplemental Retirement Fund of the Employees Retirement System of Texas
E - 1
Summary of Actuarial Assumptions and Methods
The assumptions and methods applied in this actuarial valuation were adopted by the Board of
Trustees on August 23, 2017 based on the experience investigation that covered the five-year
period from September 1, 2011 through August 31, 2016.
I. Valuation Date
The valuation date is August 31 of each plan year. This is the date as of which the actuarial
present value of future benefits and the actuarial value of assets are determined.
II. Actuarial Cost Method
The actuarial valuation is used to determine the adequacy of the State contribution rate
(established by Legislative appropriation) and employer contribution rate (established by statute)
and to describe the current financial condition of LECOSRF.
The actuarial valuation uses the Entry Age Normal actuarial cost method. Under this method, the
first step is to determine the contribution rate (level as a percentage of pay) required to provide
the benefits to each member, or the normal cost rate. The normal cost rate consists of two
pieces: (i) the member’s contribution rate, and (ii) the remaining portion of the normal cost rate
which is the employer’s normal cost rate. The total normal cost rate is based on the benefits
payable to each individual active member.
The Unfunded Actuarial Accrued Liability (UAAL) is the liability for future benefits which is in
excess of (i) the actuarial value of assets, and (ii) the present value of future normal costs. The
employer contribution provided in excess of the employer normal cost is applied to amortize the
UAAL.
The funding period is calculated as the number of years required to fully amortize the UAAL, and is
calculated with the use of an open group projection that takes into account: (a) future market
earnings, net of investment-related expenses, will equal 7.50% per year, (b) there will be no
changes in assumptions, (c) the number of active members will remain unchanged, (d) active
members who leave employment will be replaced by new entrants each year, and (e) State and
employer contributions will remain the same percentage of payroll as described in Section D of
the valuation report.
The Entry Age actuarial cost method is an “immediate gain” method (i.e., experience gains and
losses are separately identified as part of the UAAL). However, they are amortized over the same
period applied to all other components of the UAAL.

Law Enforcement and Custodial Officer Supplemental Retirement Fund of the Employees Retirement System of Texas
E - 2
III. Actuarial Value of Assets
The actuarial value of assets is based on the market value of assets with a five-year phase-in of
actual investment return in excess of (less than) expected investment income. Offsetting
unrecognized gains and losses are immediately recognized, with the shortest remaining bases
recognized first and the net remaining bases continue to be recognized on their original
timeframe. Expected investment income is determined using the assumed investment return rate
and the market value of assets (adjusted for receipts and disbursements during the year). The
returns are computed net of investment-related expenses. The actuarial value of assets was reset
to be equal to the market value of assets as of August 31, 2017 and the new method will be
applied prospectively.
IV. Actuarial Assumptions
Investment Return: 7.50% per year, net of investment-related expenses (composed of an assumed 2.50% inflation rate and a 5.00% real rate of return)
Administrative Expenses: 0.08% of valuation payroll per year
Salary Increases: Inflationary pay increases are assumed to occur at the beginning of the year and the remaining pay increases associated with merit, promotion and longevity are assumed to occur at the middle of the valuation year and vary by employee group. The components of the annual increases are:
Inflation *Real Wage Growth
(Productivity)
Merit, Promotion
and Longevity
2.50%
included in Merit,
Promotion and
Longevity Increases
See sample rates
Employee Group
Employee Class
* Total liabilities for this valuation reflect the significant across-the-board pay increases appropriated by the State legislature for the current biennium compared to the assumed rate of inflation.
Age
All 7.00 % 5.00 % 3.50 % 2.50 % 2.25 % 2.00 %
Annual Salary Increases for Merit, Promotion and Longevity
Male and Female LECO Members
Years of Eligibility Service
0 1 2 -4 5 - 8 9 - 17 18+
Payroll Growth: 3.00% per year, compounded annually (for projecting valuation payroll).

Law Enforcement and Custodial Officer Supplemental Retirement Fund of the Employees Retirement System of Texas
E - 3
Age and Service Assumptions and Methods:
Eligibility Service: Eligibility Service is considered to be all service eligible for vesting purposes, which includes service earned as a regular State employee, a LECO member, a member of the Elected Class, as State Judge, and service earned in the Teacher Retirement System of Texas (“TRS”).
Benefit Service: Current Benefit Service in years and months as of the valuation date was provided by ERS. This service plus Future Earned Service, Service Credit at Retirement, and Eligibility Service at Retirement were used to project benefit amounts.
Future Earned Service: Active members were assumed to earn one additional year of service credit in each future year employed based on their current class of membership (but not beyond the amount of credit needed to provide a 100% of average monthly compensation standard service retirement annuity).
Service Credit at Retirement: For LECO members, Benefit Service when eligible for service retirement is assumed to be increased by:
1.0 years if CPO/CO service, prior to adjustment, is at least 20 years; and
0.5 years if CPO/CO service, prior to adjustment, is less than 20 years. (but not beyond the amount of credit needed to provide a 100% of average monthly compensation standard service retirement annuity).
Entry Age: Entry age is calculated as the age at the valuation date minus Eligibility Service (excluding TRS service).
Decrement Timing: All decrements – mortality, service retirement, disability retirement, and termination of employment for reasons other than death or retirement – are assumed to occur at the middle of the valuation year.

Law Enforcement and Custodial Officer Supplemental Retirement Fund of the Employees Retirement System of Texas
E - 4
Mortality Decrements:
Service Retirees, Beneficiaries, and Inactive Members 2017 State Retirees of Texas (SRT) mortality table. Generational mortality improvements in accordance with the ultimate rates from the scale most recently published by Retirement Plans Experience Committee of the Society of Actuaries (“Scale U-MP”) and projected from the year 2017. Rates for male LECO members are set forward one year. Sample rates for the base mortality table included below.
Age Males Females
40 0.0603 0.0380
45 0.1059 0.0687
50 0.1825 0.1215
55 0.3145 0.2150
60 0.5421 0.3804
65 0.9344 0.6730
70 1.6105 1.1908
75 2.7757 2.1069
80 4.7842 3.7277
85 8.2459 6.5956
90 14.2527 11.7028
Annual Mortality Rates per 100 Individuals
Active Members RP-2014 Active Member Mortality table. Generational mortality improvements in accordance with Scale U-MP are projected from the year 2014.
Disability Retirees RP-2014 Disabled Retiree Mortality. Generational mortality improvements in accordance with Scale U-MP are projected from the year 2014.
Occupational Death 1.0% of male and female active member deaths are assumed to be occupational.

Law Enforcement and Custodial Officer Supplemental Retirement Fund of the Employees Retirement System of Texas
E - 5
Service Retirement Decrements: Graded tables based on ERS experience.
Active LECO Members Service retirement rates are determined by the first set of eligibility requirements satisfied:
Eligibility A: 20 years of CPO/CO service
Eligibility B: Age 55 and 10 years of CPO/CO service
Eligibility C: Any eligibility pertaining to regular State employees (see rates and adjustments for regular State employees)
Adjustments to the base rates are made to account for age at first eligibility or reduced retirement benefits, based on date of hire (described below sample table). Base rates for eligible members:
Age 20 yrs CPO/CO Age Age 55 & 10 yrs CPO/CO
<48 0.03
48 0.04 55 0.20
49 0.05 56 0.18
50 0.60 57 0.16
51 - 61 0.33 58 - 61 0.14
62 - 74 0.50 62 - 74 0.27
75 1.00 75 1.00
Annual Service Retirement Rates
LECO Members (Males & Females)
Eligibility A Eligibility B
Adjustments for members hired before September 1, 2013:
Eligibility A and B: Rate set to zero if member has 18 or 19 years of CPO/CO service. Rate is doubled if member has 20 years of CPO/CO service. Adjustments only apply to members that attain 20 years of CPO/CO service prior to age 65.
Adjustments for members hired on or after September 1, 2013:
Eligibility A: If age of 1st eligibility is before age 57, then o rates prior to age 57 are multiplied by 75% for each year prior to age 57 o the rate at age 57 is 100%
Eligibility B: If member will attain 20 years of CPO/CO service at or before age 62, rates are zero prior to age 62 and 100% when member attains 20 years of CPO/CO service.
Eligibility B: If member will attain 20 years of CPO/CO service after age 62, then o rates prior to age 62 are multiplied by 75% for each year prior to age 62 o the rate at age 62 is the base table rate plus 0.20 plus 0.06 times the number
of years the age at 1st eligibility was before age 62
Disability Retirement Decrements: Graded Tables Based on ERS Experience Active LECO Members
The rates do not apply before a member is eligible for the benefit.
Service greater than zero is required for occupational disability retirement.
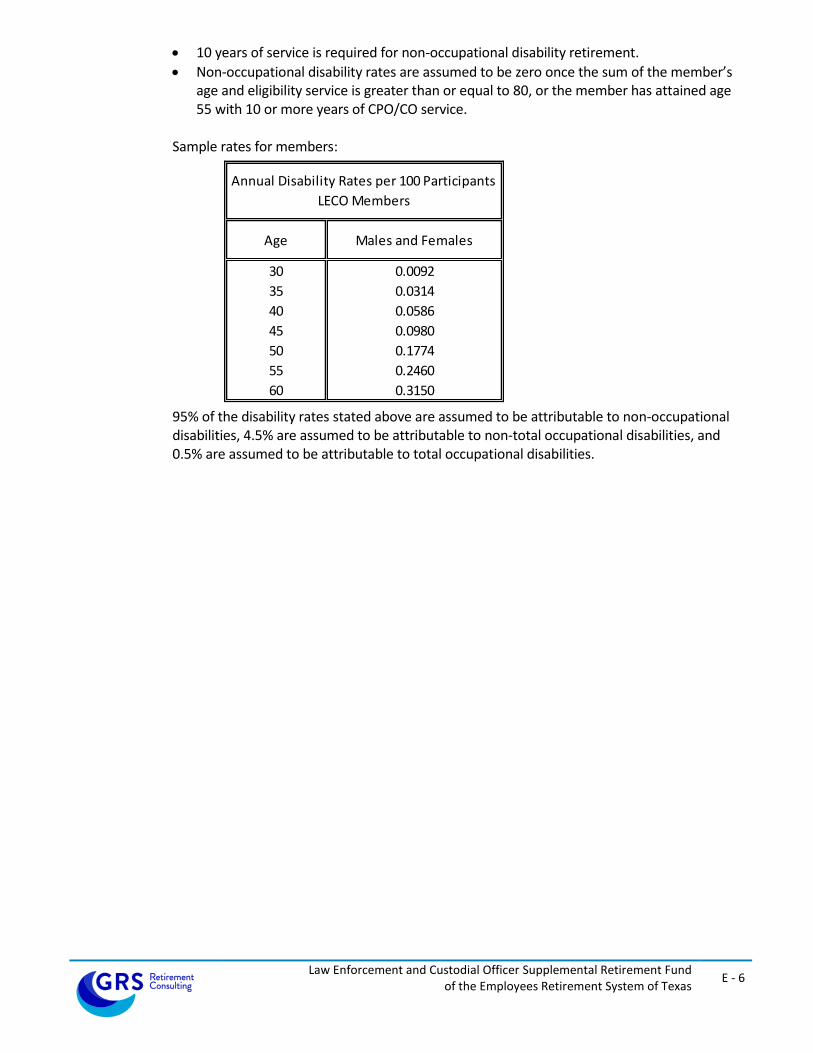
Law Enforcement and Custodial Officer Supplemental Retirement Fund of the Employees Retirement System of Texas
E - 6
10 years of service is required for non-occupational disability retirement.
Non-occupational disability rates are assumed to be zero once the sum of the member’s age and eligibility service is greater than or equal to 80, or the member has attained age 55 with 10 or more years of CPO/CO service.
Sample rates for members:
Age Males and Females
30 0.0092
35 0.0314
40 0.0586
45 0.0980
50 0.1774
55 0.2460
60 0.3150
Annual Disability Rates per 100 Participants
LECO Members
95% of the disability rates stated above are assumed to be attributable to non-occupational disabilities, 4.5% are assumed to be attributable to non-total occupational disabilities, and 0.5% are assumed to be attributable to total occupational disabilities.

Law Enforcement and Custodial Officer Supplemental Retirement Fund of the Employees Retirement System of Texas
E - 7
Termination Decrements for Reasons Other Than Death or Retirement: Graded Tables Based on ERS Experience. Rates of termination are zero for members eligible for service retirement. To account for active members that accumulate additional eligibility service at retirement through converting sick/annual leave or other types of service purchases, termination rates are also set to zero in the year prior to first retirement eligibility. Rates for members not eligible for service retirement:
Active LECO Members
Eligibility
ServiceMale and Female
0 23.00
1 19.22
2 15.36
3 12.48
4 10.36
5 8.81
6 7.67
7 6.81
8 6.11
9 5.52
10 4.96
11 4.42
12 3.90
13 3.43
14 3.07
15 2.90
16 2.50
17 1.00
18 1.00
19+ 0.00
Annual Rates of Termination
per 100 Participants
LECO Members
Withdrawal of Employee Contributions: Every member that terminates employment and does not have a benefit payable from this plan is assumed to withdraw their employee contributions.
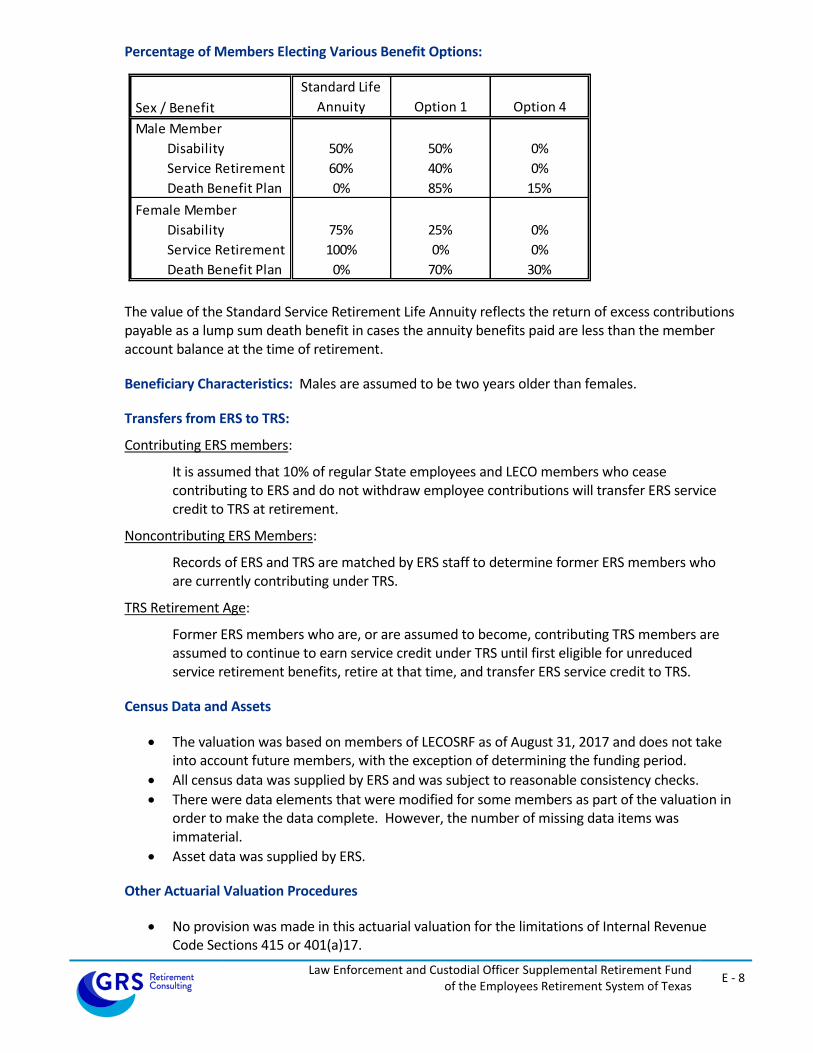
Law Enforcement and Custodial Officer Supplemental Retirement Fund of the Employees Retirement System of Texas
E - 8
Percentage of Members Electing Various Benefit Options:
Sex / Benefit
Standard Life
Annuity Option 1 Option 4
Male Member
Disability 50% 50% 0%
Service Retirement 60% 40% 0%
Death Benefit Plan 0% 85% 15%
Female Member
Disability 75% 25% 0%
Service Retirement 100% 0% 0%
Death Benefit Plan 0% 70% 30%
The value of the Standard Service Retirement Life Annuity reflects the return of excess contributions payable as a lump sum death benefit in cases the annuity benefits paid are less than the member account balance at the time of retirement.
Beneficiary Characteristics: Males are assumed to be two years older than females.
Transfers from ERS to TRS:
Contributing ERS members:
It is assumed that 10% of regular State employees and LECO members who cease contributing to ERS and do not withdraw employee contributions will transfer ERS service credit to TRS at retirement.
Noncontributing ERS Members:
Records of ERS and TRS are matched by ERS staff to determine former ERS members who are currently contributing under TRS.
TRS Retirement Age:
Former ERS members who are, or are assumed to become, contributing TRS members are assumed to continue to earn service credit under TRS until first eligible for unreduced service retirement benefits, retire at that time, and transfer ERS service credit to TRS.
Census Data and Assets
The valuation was based on members of LECOSRF as of August 31, 2017 and does not take into account future members, with the exception of determining the funding period.
All census data was supplied by ERS and was subject to reasonable consistency checks.
There were data elements that were modified for some members as part of the valuation in order to make the data complete. However, the number of missing data items was immaterial.
Asset data was supplied by ERS.
Other Actuarial Valuation Procedures
No provision was made in this actuarial valuation for the limitations of Internal Revenue Code Sections 415 or 401(a)17.

Law Enforcement and Custodial Officer Supplemental Retirement Fund of the Employees Retirement System of Texas
E - 9
Valuation payroll (earnings applied to the current valuation year) is the expected payroll for the fiscal year following the valuation date. It is based on reported payroll determined from August member contributions increased to reflect the across-the-board salary increases appropriated by the State legislature, effective on or after September 1, and projected according to the actuarial assumptions for the upcoming fiscal year.
No liability was included for benefits which are funded by special State appropriations.
State appropriations for membership fees are currently immaterial in relation to the overall payroll contributions and have been ignored.

10
SECTION F
DETAILED SUMMARIES OF MEMBERSHIP DATA

Law Enforcement and Custodial Officer Supplemental Retirement Fund of the Employees Retirement System of Texas
F - 1
Detailed Summaries of Membership Data
Table Page
Number
A F-2 Summary of Membership Data
B F-3 Active Members: Distribution by Age and Service
C F-4 Retired and Beneficiary Members: Distribution by Age and Category
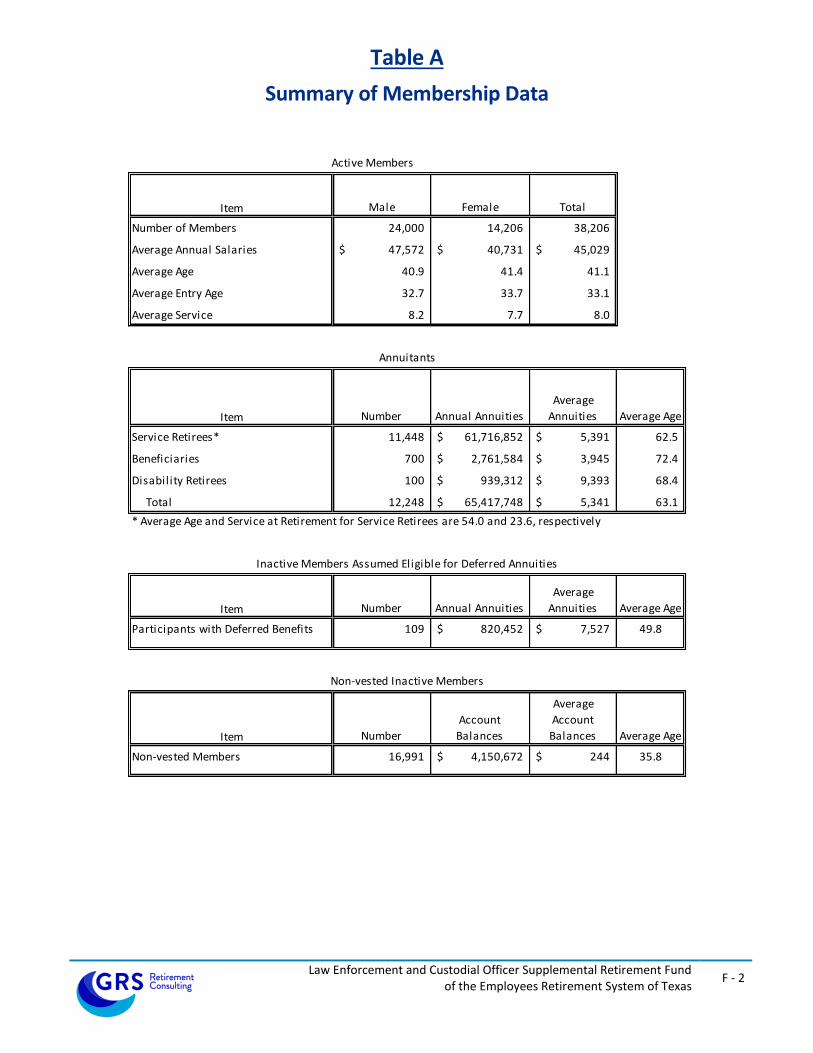
Law Enforcement and Custodial Officer Supplemental Retirement Fund of the Employees Retirement System of Texas
F - 2
Table A
Summary of Membership Data
Item Male Female Total
Number of Members 24,000 14,206 38,206
Average Annual Salaries 47,572$ 40,731$ 45,029$
Average Age 40.9 41.4 41.1
Average Entry Age 32.7 33.7 33.1
Average Service 8.2 7.7 8.0
Item Number Annual Annuities
Average
Annuities Average Age
Service Retirees* 11,448 61,716,852$ 5,391$ 62.5
Beneficiaries 700 2,761,584$ 3,945$ 72.4
Disability Retirees 100 939,312$ 9,393$ 68.4
Total 12,248 65,417,748$ 5,341$ 63.1
* Average Age and Service at Retirement for Service Retirees are 54.0 and 23.6, respectively
Item Number Annual Annuities
Average
Annuities Average Age
Participants with Deferred Benefits 109 820,452$ 7,527$ 49.8
Item Number
Account
Balances
Average
Account
Balances Average Age
Non-vested Members 16,991 4,150,672$ 244$ 35.8
Annuitants
Inactive Members Assumed Eligible for Deferred Annuities
Non-vested Inactive Members
Active Members

Law Enforcement and Custodial Officer Supplemental Retirement Fund of the Employees Retirement System of Texas
F - 3
Table B
Active Members
Distribution by Age and Service
Age 0-4 5-9 10-14 15-19 20-24 25-29 30-34 35-39 40+ Total
Under 25 3,963 30 3,993
34,307$ 39,968$ 34,350$
25 - 29 4,042 713 25 4,780
39,234$ 45,270$ 43,890$ 40,159$
30 - 34 2,703 1,423 525 30 4,681
39,090$ 50,950$ 50,018$ 50,222$ 43,992$
35 - 39 2,103 1,091 867 521 24 4,606
38,813$ 49,014$ 57,576$ 57,954$ 59,874$ 47,036$
40 - 44 1,667 876 750 920 604 21 4,838
38,311$ 46,209$ 54,221$ 59,220$ 59,910$ 68,228$ 49,010$
45 - 49 1,466 895 730 906 1,253 470 14 5,734
38,512$ 45,447$ 50,212$ 54,846$ 60,499$ 64,774$ 72,923$ 50,706$
50 - 54 1,149 837 648 659 444 281 110 1 4,129
37,923$ 43,489$ 46,492$ 49,728$ 59,732$ 71,243$ 87,466$ 101,551$ 48,228$
55 - 59 880 729 477 497 251 87 45 9 2,975
37,477$ 43,522$ 46,051$ 46,607$ 53,555$ 70,844$ 89,972$ 104,893$ 45,189$
60 - 64 449 561 268 295 149 27 16 3 1,768
37,772$ 43,156$ 44,244$ 46,883$ 50,097$ 56,633$ 85,713$ 88,410$ 43,828$
Over 64 178 253 125 96 36 9 4 1 702
37,067$ 42,032$ 42,774$ 44,958$ 52,944$ 77,827$ 49,148$ 52,891$ 42,380$
Total 18,600 7,408 4,415 3,924 2,761 895 189 14 38,206
37,756$ 46,380$ 50,712$ 53,505$ 58,950$ 67,361$ 86,026$ 97,408$ 45,029$
Years of Service
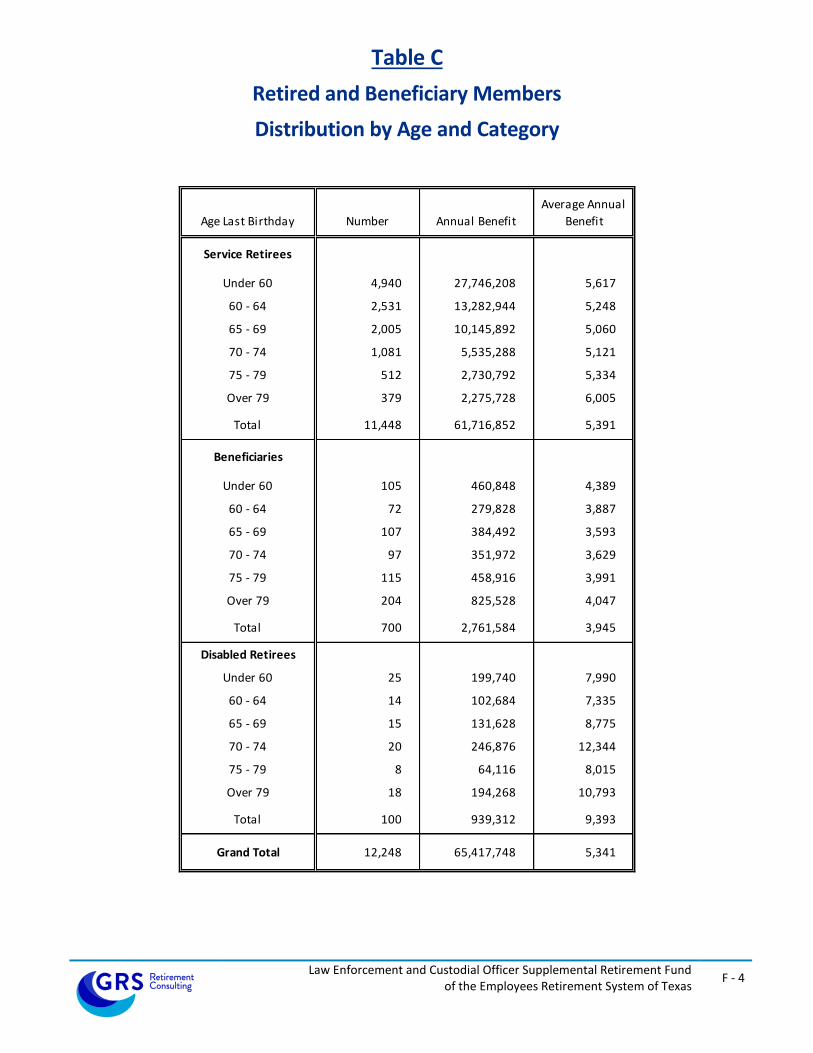
Law Enforcement and Custodial Officer Supplemental Retirement Fund of the Employees Retirement System of Texas
F - 4
Table C
Retired and Beneficiary Members
Distribution by Age and Category
Age Last Birthday Number Annual Benefit
Average Annual
Benefit
Service Retirees
Under 60 4,940 27,746,208 5,617
60 - 64 2,531 13,282,944 5,248
65 - 69 2,005 10,145,892 5,060
70 - 74 1,081 5,535,288 5,121
75 - 79 512 2,730,792 5,334
Over 79 379 2,275,728 6,005
Total 11,448 61,716,852 5,391
Beneficiaries
Under 60 105 460,848 4,389
60 - 64 72 279,828 3,887
65 - 69 107 384,492 3,593
70 - 74 97 351,972 3,629
75 - 79 115 458,916 3,991
Over 79 204 825,528 4,047
Total 700 2,761,584 3,945
Disabled Retirees
Under 60 25 199,740 7,990
60 - 64 14 102,684 7,335
65 - 69 15 131,628 8,775
70 - 74 20 246,876 12,344
75 - 79 8 64,116 8,015
Over 79 18 194,268 10,793
Total 100 939,312 9,393
Grand Total 12,248 65,417,748 5,341

5
SECTION G
GLOSSARY

Law Enforcement and Custodial Officer Supplemental Retirement Fund of the Employees Retirement System of Texas
G - 1
Glossary
Actuarial Accrued Liability (AAL): That portion, as determined by a particular Actuarial Cost Method, of the Actuarial Present Value of Future Plan Benefits which is not provided for by future Normal Costs. It is equal to the Actuarial Present Value of Future Plan Benefits minus the actuarial present value of future Normal Costs. Actuarial Assumptions: Assumptions as to future experience under the Fund. These include assumptions about the occurrence of future events affecting costs or liabilities, such as:
mortality, withdrawal, disablement, and retirement;
future increases in salary;
future rates of investment earnings and future investment and administrative expenses;
characteristics of members not specified in the data, such as marital status;
characteristics of future members;
future elections made by members; and
other relevant items. Actuarial Cost Method or Funding Method: A procedure for allocating the Actuarial Present Value of Future Benefits to various time periods; a method used to determine the Normal Cost and the Actuarial Accrued Liability. These items are used to determine the ADC. Actuarial Gain or Actuarial Loss: A measure of the difference between actual experience and that expected based upon a set of Actuarial Assumptions, during the period between two Actuarial Valuation dates. Through the actuarial assumptions, rates of decrements, rates of salary increases, and rates of fund earnings have been forecasted. To the extent that actual experience differs from that assumed, Actuarial Accrued Liabilities emerge which may be the same as forecasted, or may be larger or smaller than projected. Actuarial gains are due to favorable experience, e.g., the Fund's assets earn more than projected, salaries do not increase as fast as assumed, members retire later than assumed, etc. Favorable experience means actual results produce actuarial liabilities not as large as projected by the actuarial assumptions. On the other hand, actuarial losses are the result of unfavorable experience, i.e., actual results that produce actuarial liabilities which are larger than projected. Actuarial gains will shorten the time required for funding of the actuarial balance sheet deficiency while actuarial losses will lengthen the funding period. Actuarially Equivalent: Of equal actuarial present value, determined as of a given date and based on a given set of Actuarial Assumptions. Actuarial Present Value (APV): The value of an amount or series of amounts payable or receivable at various times, determined as of a given date by the application of a particular set of Actuarial Assumptions. For purposes of this standard, each such amount or series of amounts is:
a. adjusted for the probable financial effect of certain intervening events (such as changes in compensation levels, marital status, etc.),
b. multiplied by the probability of the occurrence of an event (such as survival, death, disability, termination of employment, etc.) on which the payment is conditioned, and
c. discounted according to an assumed rate (or rates) of return to reflect the time value of money.

Law Enforcement and Custodial Officer Supplemental Retirement Fund of the Employees Retirement System of Texas
G - 2
Actuarial Present Value of Future Plan Benefits: The Actuarial Present Value of those benefit amounts which are expected to be paid at various future times under a particular set of Actuarial Assumptions, taking into account such items as the effect of advancement in age and past and anticipated future compensation and service credits. The Actuarial Present Value of Future Plan Benefits includes the liabilities for active members, retired members, beneficiaries receiving benefits, and inactive, nonretired members either entitled to a refund or a future retirement benefit. Expressed another way, it is the value that would have to be invested on the valuation date so that the amount invested plus investment earnings would be provide sufficient assets to pay all projected benefits and expenses when due. Actuarial Valuation: The determination, as of a valuation date, of the Normal Cost, Actuarial Accrued Liability, Actuarial Value of Assets, and related Actuarial Present Values for a plan. An Actuarial valuation for a governmental retirement system typically also includes calculations of items needed for compliance with GASB. Actuarial Value of Assets or Valuation Assets: The value of the Fund’s assets as of a given date, used by the actuary for valuation purposes. This may be the market or fair value of plan assets, but commonly actuaries use a smoothed value in order to reduce the year-to-year volatility of calculated results, such as the funded ratio and the ADC. Actuarially Determined: Values which have been determined utilizing the principles of actuarial science. An actuarially determined value is derived by application of the appropriate actuarial assumptions to specified values determined by provisions of the law. Amortization Method: A method for determining the Amortization Payment. The most common methods used are level dollar and level percentage of payroll. Under the Level Dollar method, the Amortization Payment is one of a stream of payments, all equal, whose Actuarial Present Value is equal to the UAAL. Under the Level Percentage of Pay method, the Amortization payment is one of a stream of increasing payments, whose Actuarial Present Value is equal to the UAAL. Under the Level Percentage of Pay method, the stream of payments increases at the assumed rate at which total covered payroll of all active members will increase. Amortization Payment: That portion of the pension plan contribution or ADC which is designed to pay interest on and to amortize the Unfunded Actuarial Accrued Liability. Actuarially Determined Contribution (ADC) or Annual Required Contribution (ARC): A calculated contribution for a defined benefit pension plan for the reporting period, most often determined based on the funding policy of the plan. Typically the calculated contribution has a normal cost payment and an amortization payment. Closed Amortization Period: A specific number of years that is counted down by one each year and therefore declines to zero with the passage of time. For example if the amortization period is initially set at 30 years, it is 29 years at the end of one year, 28 years at the end of two years, etc. See Funding Period and Open Amortization Period. Decrements: Those causes/events due to which a member’s status (active-inactive-retiree-beneficiary) changes, that is: death, retirement, disability, or termination.

Law Enforcement and Custodial Officer Supplemental Retirement Fund of the Employees Retirement System of Texas
G - 3
Defined Benefit Plan: An employer-sponsored retirement benefit that provides workers, upon attainment of designated age and service thresholds, with a monthly benefit based on the employee’s salary and length of service. The value of a benefit from a defined benefit plan is generally not affected by the return on the assets that are invested to fund the benefit. Defined Contribution Plan: A retirement plan, such as a 401(k) plan, a 403(b) plan, or a 457 plan, in which the contributions to the plan are assigned to an account for each member, and the plan’s earnings are allocated to each account, and each member’s benefits are a direct function of the account balance. Employer Normal Cost: The portion of the Normal Cost to be paid by the employers. This is equal to the Normal Cost less expected member contributions. Experience Study: A periodic review and analysis of the actual experience of the Fund which may lead to a revision of one or more actuarial assumptions. Actual rates of decrement and salary increases are compared to the actuarially assumed values and modified as deemed appropriate by the Actuary. Funded Ratio: The ratio of the actuarial value of assets (AVA) to the actuarial accrued liability (AAL). Plans sometimes calculate a market funded ratio, using the market value of assets (MVA), rather than the AVA. Funding Period or Amortization Period: The term “Funding Period” is used it two ways. In the first sense, it is the period used in calculating the Amortization Payment as a component of the ADC. This funding period is chosen by the Board of Trustees. In the second sense, it is a calculated item: the number of years in the future that will theoretically be required to amortize (i.e., pay off or eliminate) the Unfunded Actuarial Accrued Liability, based on the statutory employer contribution rate, and assuming no future actuarial gains or losses. GASB: The Governmental Accounting Standards Board is an organization that exists in order to promulgate accounting standards for governmental entities. Normal Cost: That portion of the Actuarial Present Value of pension plan benefits and expenses which is allocated to a valuation year by the Actuarial Cost Method. Any payment in respect of an Unfunded Actuarial Accrued Liability is not part of Normal Cost (see Amortization Payment). For pension plan benefits which are provided in part by employee contributions, Normal Cost refers to the total of employee contributions and employer Normal Cost unless otherwise specifically stated. Under the entry age normal cost method, the Normal Cost is intended to be the level cost (when expressed as a percentage of pay) needed to fund the benefits of a member from hire until ultimate termination, death, disability or retirement. Open Amortization Period: An open amortization period is one which is used to determine the Amortization Payment but which does not change over time. In other words, if the initial period is set as 30 years, the same 30-year period is used in determining the Amortization Period each year. In theory, if an Open Amortization Period is used to amortize the Unfunded Actuarial Accrued Liability, the UAAL will never completely disappear, but will become smaller each year, either as a dollar amount or in relation to covered payroll. Unfunded Actuarial Accrued Liability: The excess of the Actuarial Accrued Liability over the Actuarial Value of Assets. This value may be negative in which case it may be expressed as a negative Unfunded Actuarial Accrued Liability, also called the Funding Surplus.

Law Enforcement and Custodial Officer Supplemental Retirement Fund of the Employees Retirement System of Texas
G - 4
Valuation Date or Actuarial Valuation Date: The date as of which the value of assets is determined and as of which the Actuarial Present Value of Future Plan Benefits is determined. The expected benefits to be paid in the future are discounted to this date.

Judicial Retirement System of Texas, Plan 2 Annual Actuarial Valuation - Funding As of August 31, 2017
November 28, 2017
Board of Trustees Employees Retirement System of Texas 200 East 18th Street Austin, TX 78701 Re: Actuarial Valuation for Funding Purposes as of August 31, 2017
Members of the Board:
We certify that the information contained in this report is accurate and fairly presents the actuarial position of the Judicial Retirement System of Texas, Plan 2 (JRS-2) as of August 31, 2017. This report was prepared at the request of the Board and is intended for use by ERS staff and those designated or approved by the Board. This report may be provided to parties other than ERS only in its entirety and only with the permission of the Board.
Actuarial Valuation
The primary purposes of the actuarial valuation report are to determine the adequacy of the current State and employer contribution rates, describe the current financial condition of JRS-2, analyze changes in the condition of JRS-2, and provide various summaries of the data.
Plan Provisions
Our actuarial valuation as of August 31, 2017 reflects the benefit and contribution provisions set forth in Chapters 836 through 840 of the Texas Government Code. The current plan provisions are outlined in Section D of this report.
Actuarial Assumptions and Methods
The assumptions and methods applied in this actuarial valuation were adopted by the Board of Trustees on August 23, 2017 based on the experience investigation that covered the five-year period from September 1, 2011 through August 31, 2016. Additionally, this actuarial valuation incorporates the significant across-the-board pay increases budgeted by the State Legislature when they are granted for the current biennium. The current actuarial assumptions and methods are outlined in Section E of this report.
Data
The valuation was based upon information as of August 31, 2017, furnished by ERS staff, concerning system benefits, financial transactions, plan provisions and active members, terminated members, retirees and beneficiaries. We checked for internal and year-to-year consistency, but did not audit the data. We are not responsible for the accuracy or completeness of the information provided by ERS staff.

Board of Trustees November 28, 2017 Page 2
Certification
All of our work conforms with generally accepted actuarial principles and practices, and to the Actuarial Standards of Practice issued by the Actuarial Standards Board. In our opinion, our calculations also comply with the requirements of, where applicable, the Internal Revenue Code and ERISA.
The signing actuaries are independent of the plan sponsor. They are all Enrolled Actuaries, Fellows of the Society of Actuaries, and Members of the American Academy of Actuaries, and meet the Qualification Standards of the American Academy of Actuaries. Finally, each of the undersigned are experienced in performing valuations for large public retirement systems.
Respectfully submitted,
Gabriel, Roeder, Smith & Company
R. Ryan Falls, FSA, EA, MAAA Joseph P. Newton, FSA, EA, MAAA
Senior Consultant & Actuary Pension Market Leader & Actuary
Dana Woolfrey, FSA, EA, MAAA
Consultant & Actuary

Judicial Retirement System of Texas, Plan 2
Table of Contents
Section
Cover Letter
Section A Executive Summary
Section B Discussion
Section C Tables
1 - Development of Employer Cost
2 - Actuarial Present Value of Future Benefits
3 - Analysis of Normal Cost
4 - Historical Summary of Active Member Data
5 - Reconciliation of Plan Net Assets
6 - Development of Actuarial Value of Assets
7 - History of Investment Return Rates
8 - History of Cash Flow
9 - Total Experience Gain or Loss
10 - Solvency Test
11 - Historical Contribution Rates
Section D Summary of Plan Provisions
Section E Summary of Actuarial Assumptions and Methods
Section F Detailed Summaries of Membership Data
Section G Glossary

SECTION A
EXECUTIVE SUMMARY
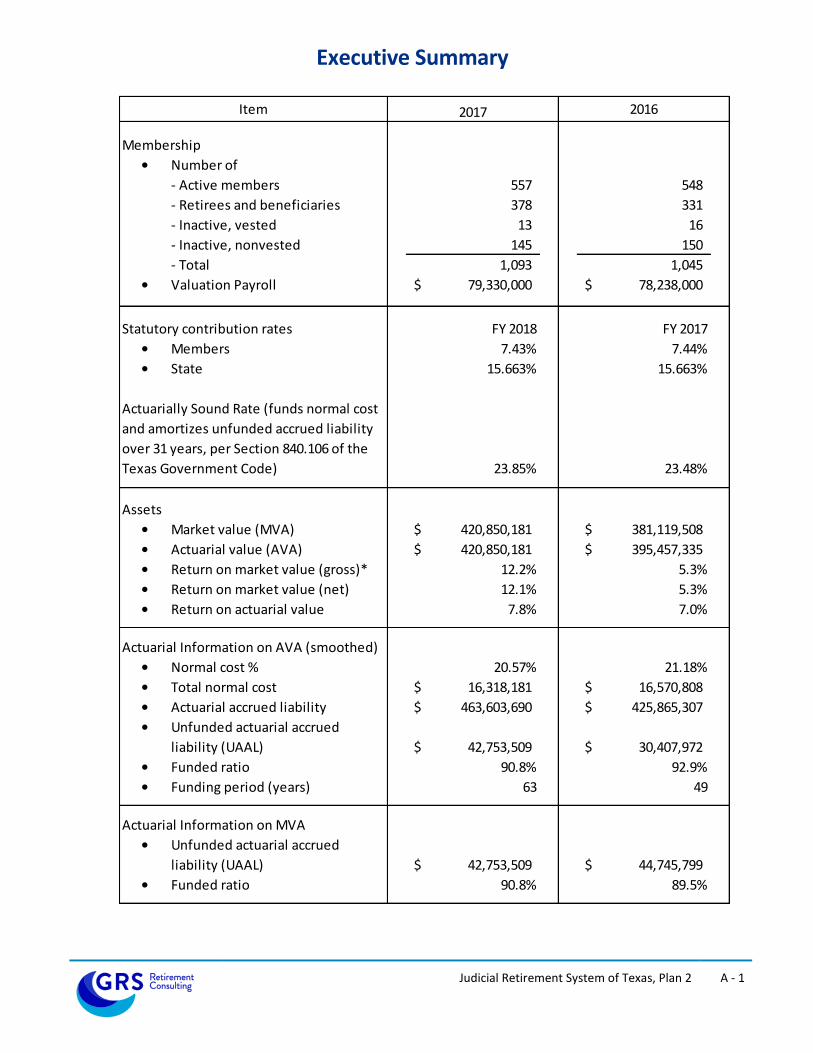
Judicial Retirement System of Texas, Plan 2 A - 1
Executive Summary
2017 2016
Membership
• Number of
- Active members 557 548
- Retirees and beneficiaries 378 331
- Inactive, vested 13 16
- Inactive, nonvested 145 150
- Total 1,093 1,045
• Valuation Payroll 79,330,000$ 78,238,000$
Statutory contribution rates FY 2018 FY 2017
• Members 7.43% 7.44%
• State 15.663% 15.663%
Actuarially Sound Rate (funds normal cost
and amortizes unfunded accrued liability
over 31 years, per Section 840.106 of the
Texas Government Code) 23.85% 23.48%
Assets
• Market value (MVA) 420,850,181$ 381,119,508$
• Actuarial value (AVA) 420,850,181$ 395,457,335$
• Return on market value (gross)* 12.2% 5.3%
• Return on market value (net) 12.1% 5.3%
• Return on actuarial value 7.8% 7.0%
Actuarial Information on AVA (smoothed)
• Normal cost % 20.57% 21.18%
• Total normal cost 16,318,181$ 16,570,808$
• Actuarial accrued liability 463,603,690$ 425,865,307$
• Unfunded actuarial accrued
liability (UAAL) 42,753,509$ 30,407,972$
• Funded ratio 90.8% 92.9%
• Funding period (years) 63 49
Actuarial Information on MVA
• Unfunded actuarial accrued
liability (UAAL) 42,753,509$ 44,745,799$
• Funded ratio 90.8% 89.5%
Item

Judicial Retirement System of Texas, Plan 2 A - 2
The following chart illustrates the recent history and outlook of the funded status of JRS-2 over the next five years:
August 31, 2013 2014 2015 2016 2017 2018 2019 2020 2021 2022
Funded
Ratio
88.6%
90.2%
92.2%
92.9%
90.8%
90.5%
90.7%
90.9%
91.0%
91.1%
UAAL
(in millions) $41.0 $37.9 $31.4 $30.4 $42.8 $46.1 $46.9 $47.8 $48.7 $49.6
ASC 24.08% 23.86% 23.79% 23.48% 23.85% 24.00% 23.98% 23.96% 23.94% 23.90%
The projections beyond 2017 are based on the same assumptions, methods and provisions used for the August 31, 2017 valuation, which include the significant across-the-board pay increases budgeted by the State Legislature when they are granted and the assumptions adopted by the Board in August 2017. Additionally, the market value of assets is expected to earn 7.5% per year. Assuming the actuarial (smoothed) value of assets earns 7.5% per year, JRS-2 is projected to reach full funding in 2080. It is important for the Board of Trustees to understand that the vast majority of the total contribution for JRS-2 goes towards the normal cost for current members and only a small portion of the total contribution goes towards eliminating the UAAL. As a result, small deviations from both demographic and economic assumptions can have a notable impact on the projected solvency of JRS-2.
50%
55%
60%
65%
70%
75%
80%
85%
90%
95%
100%
2013 2014 2015 2016 2017 2018 2019 2020 2021 2022
Historical and Future Projected Funded Ratios As of August 31

SECTION B
DISCUSSION

Judicial Retirement System of Texas, Plan 2 B - 1
Discussion
Introduction The results of the August 31, 2017 actuarial valuation of the Judicial Retirement System of Texas, Plan 2 (JRS-2) are presented in this report. The primary purposes of this actuarial valuation report are to determine the adequacy of the current State and employer contribution rates, describe the current financial condition of JRS-2, analyze the changes in the condition of JRS-2, and provide various summaries of the data. The total contribution rate for the current fiscal year exceeds the normal cost by 2.523% of payroll, which, on both an actuarial and market value of assets basis, is sufficient to amortize the unfunded liability over a period of 63 years. All of the tables referenced in the following discussion appear in Section C of this report. Plan Provisions There were no changes to the plan provisions during the past year. The current plan provisions are outlined in Section D of this report. Actuarial Assumptions and Methods The assumptions and methods applied in this actuarial valuation were adopted by the Board of Trustees on August 23, 2017 based on the experience investigation that covered the five-year period from September 1, 2011 through August 31, 2016. We believe the assumptions are internally consistent and are reasonable, based on the actual experience of JRS-2. A detailed account of the revised actuarial assumptions and methods can be found in our Actuarial Experience Study report dated June 28, 2017. A summary of key changes in assumptions and methods is highlighted below:
Economic Assumptions
Decrease the investment return assumption from 8.00% to 7.50%
Decrease the inflation assumption from 3.50% to 2.50%
The merit component was increased from 0.00% to 0.50%, and thus when combined with the decrease in inflation, the nominal assumption is 0.50% lower than the previous assumption.
Establish a general wage inflation assumption of 0.50% above inflation, or 3.00%. Mortality Assumptions
The post-retirement mortality tables for non-disabled retirees are based on recent ERS experience. Fully generational mortality improvements are assumed using the ultimate rates from the scale most recently published by Retirement Plans Experience Committee of the Society of Actuaries (“Scale U-MP”).
The post-retirement mortality tables for disabled retirees is based on the most recently published national tables, the RP-2014 tables for disabled lives. Fully generational mortality improvements are assumed using Scale U-MP.
Judicial Retirement System of Texas, Plan 2 B - 2
The pre-retirement mortality tables for active employees are based on the most recently published national tables, the RP-2014 tables for employees. Fully generational mortality improvements are assumed using Scale U-MP.
Other Demographic Assumptions
No change to termination patterns for members.
Small adjustments in the overall retirement rates consistent with experience and future expectations and to better reflect expected differences among the benefit groups. Reduced rates for members eligible for early retirement.
Small decreases to the disability patterns for members consistent with experience and future expectations.
Actuarial Methods and Policies
Change in the asset smoothing method to a method that recognizes each year’s gain or loss over a closed five-year period. However, the method will continue to allow direct offsetting of gains and losses. The actuarial (smoothed) value of assets was set to equal to market value (mark to market) as of August 31, 2017, with the smoothing method to be applied prospectively.
The actuarial valuation as of August 31, 2017 incorporates the significant across-the-board pay increases budgeted by the State Legislature when they are granted for the current biennium. Specifically, judges were assumed to receive no increase on September 1, 2017 or September 1, 2018. The results of the actuarial valuation are dependent upon the actuarial assumptions used. Actual results can and almost certainly will differ, as actual experience deviates from the assumptions. Even seemingly minor changes in the assumptions can materially change the liabilities, calculated contribution rates and funding periods. A review of the impact of a different set of assumptions on the funded status of ERS is outside the scope of this actuarial valuation. The current actuarial assumptions and methods are outlined in Section E of this report. Funding Adequacy The funding objective of JRS-2 is to fund the sum of the normal cost and the amount necessary to amortize any unfunded actuarial accrued liability over a period that does not exceed 30 years by one or more years. Contribution rates should be established which, over time, will remain level as a percent of payroll. The member contribution rates are established by State statute and the State contribution rate is set by State statute and legislative appropriation. For the fiscal year beginning September 1, 2017, members accruing benefits contribute 7.50% of payroll and the State contributes 15.663% of payroll. Since some active JRS-2 members have elected to cease contributing to the plan as well as cease accruing additional benefits, the effective member contribution rate for the fiscal year beginning September 1, 2017 is 7.43% of payroll. This State contribution rate is subject to future legislative appropriations. The unfunded actuarial accrued liability (UAAL) of JRS-2 increased from $30.4 million as of August 31, 2016 to $42.8 million as of August 31, 2017. Additionally, the funded ratio of JRS-2—actuarial value of assets divided by the actuarial accrued liability—decreased from 92.9% to 90.8% as of August 31, 2017. This decrease was primarily due to the changes in actuarial assumptions and methods adopted by the Board in August 2017. The funded status is one of many metrics used to show trends and develop future

Judicial Retirement System of Texas, Plan 2 B - 3
expectations about the health of a retirement system. The funded status measure itself is not appropriate for assessing the sufficiency of plan assets to cover the estimated cost of settling the plan’s benefit obligations or assessing the need for or the amount of future contributions since it does not reflect normal cost contributions, the timing of amortization payments, or future experience other than expected. The valuation shows that the total normal cost for funding purposes is 20.57% of payroll. The total contribution rate is 23.093% of payroll for the current fiscal year. The total contribution rate for the current fiscal year exceeds the normal cost by 2.523% of payroll, which is sufficient to amortize the UAAL over 63 years on an actuarial value of assets basis. As a result, the current contribution rates are expected to eliminate the UAAL for JRS-2 in 63 years based on the current benefit provisions and actuarial assumptions. Section 840.106 of the Texas Government Code limits the modifications to JRS-2 that would, essentially, increase benefits or lower contributions to the trust unless the current level of benefits and contributions are considered actuarially sound. Section 840.106 defines actuarially sound as a retirement system that is receiving a total contribution rate sufficient to cover the normal cost, administrative expenses, and amortize the UAAL over a period of 31 years, or less. Based on the actuarial valuation as of August 31, 2017, the actuarially sound contribution (ASC) rate for JRS-2 is 23.85% of payroll. As noted, the ASC is currently calculated based on a 31-year open amortization period. This means that the ASC will always be calculated with the same 31-year period and the UAAL would never completely be eliminated. Even though the contributions to JRS-2 are not based on this ASC, the Board may want to consider adopting a funding policy that includes an ultimate goal of eliminating the UAAL by a certain date. This type of funding policy will allow the Board to better assess the level of contributions received from the employers and the State. System Assets This report contains several tables that summarize key information with respect to the ERS assets. The total market value of assets increased from $381.1 million to $420.9 million as of August 31, 2017. Table 5 reconciles the changes in the fund during the year. Total contributions increased slightly from $18.1 million to $18.5 million. Table 6 shows the development of the actuarial value of assets. As part of the actuarial experience study and adoption of revised actuarial assumptions and methods, the Board voted to reset the actuarial value of assets (AVA) to be equal to the market value of assets (MVA), or “mark to market” as of August 31, 2017. In subsequent years the AVA will be calculated using a new method. The new method will recognize each year’s gain or loss over a closed five year period. However, the method will continue to allow direct offsetting of gains and losses. When measured on a market value, the approximate gross investment return for the fiscal year ending August 31, 2017 was 12.15%, and the return net of investment expenses was 12.11%. When measured on an actuarial value, the net investment return was 7.8%. The lower return on an actuarial basis is due to the transition to the new asset smoothing method as of August 31, 2017. Table 7 shows a history of return rates. The JRS-2 ten-year average market return, gross of all expenses as reported by the ERS Master Trust Custodian, is 5.67%. The ten-year average return net of investment expenses is 5.54%. Table 8 provides a history of the contributions paid into JRS-2 and the administrative expenses and benefit payments that have been paid out of JRS-2. This table shows that JRS-2 paid administrative expenses and

Judicial Retirement System of Texas, Plan 2 B - 4
benefit payments, in excess of contributions received, of $3.3 million (or 0.9% of assets) in fiscal year 2016 and the amount was $5.1 million (or 1.2% of assets) in fiscal year 2017. ERS should continue to monitor this deficit as it could impact the future liquidity needs of JRS-2. Table 11 provides a history of contribution rates, as a percent of payroll, paid into the trust by the State, agencies, and members. This table also shows a history of the total normal cost and the Actuarially Sound Contribution (ASC), as defined by Section 840.106 of the Texas Government Code. Data The valuation was based upon information as of August 31, 2017, furnished by ERS staff, concerning system benefits, financial transactions, plan provisions and active members, terminated members, retirees and beneficiaries. We checked for internal and year-to-year consistency, but did not audit the data. We are not responsible for the accuracy or completeness of the information provided by ERS staff. The tables in Section F show key census statistics for the various groups included in the valuation.

SECTION C
TABLES

Judicial Retirement System of Texas, Plan 2 C - 1
Table 1 Development of Employer Cost
August 31, 2017 August 31, 2017 August 31, 2016
Final Assumptions Prior Assumptions
1. Payroll
a. Reported Payroll (August Payroll of Active Members) 79,330,000$ 79,330,000$ 78,238,000$
b. Valuation Payroll (Expected Covered Payroll for
Following Plan Year) 79,330,000 79,330,000 78,238,000
2. Total Normal Cost Rate
a. Gross normal cost rate 20.24% 20.81% 20.68%
b. Administrative expenses 0.33% 0.50% 0.50%
c. Total (Item 2a + Item 2b) 20.57% 21.31% 21.18%
3. Actuarial Accrued Liability for Active Members
a. Present value of future benefits for active members 291,526,354$ 289,954,635$ 300,182,639$
b. Less: present value of future normal costs (80,659,690) (83,533,927) (82,520,893)
c. Actuarial accrued liability 210,866,664$ 206,420,708$ 217,661,746$
4. Total Actuarial Accrued Liability for:
a. Retirees and beneficiaries 241,314,049$ 225,217,978$ 196,779,287$
b. Inactive members 11,422,977 10,833,371 11,424,274
c. Active members (Item 3c) 210,866,664 206,420,708 217,661,746
d. Total 463,603,690$ 442,472,057$ 425,865,307$
5. Actuarial Value of Assets 420,850,181$ 421,564,714$ 395,457,335$
6. Unfunded Actuarial Accrued Liability
(UAAL) (Item 4d - Item 5) 42,753,509$ 20,907,343$ 30,407,972$
7. Contribution Rate Needed to Fund Normal Cost Plus
Amortize the UAAL Over 31 Years 23.85% 22.92% 23.48%
8. Allocation of Contribution Rate
a. Employer rate 15.663% 15.663% 15.663%
b. Member rate 7.43% 7.44% 7.44%
c. Total contribution rate 23.093% 23.103% 23.103%
d. Total normal cost rate 20.57% 21.31% 21.18%
e. Available contribution rate to amortize UAAL 2.523% 1.793% 1.923%
f. Total contribution rate 23.093% 23.103% 23.103%
9. Funding period based on statutory contribution rates
and Actuarial Value of Assets (years) 63 26 49

Judicial Retirement System of Texas, Plan 2 C - 2
Table 2 Actuarial Present Value of Future Benefits
August 31, 2017 August 31, 2017 August 31, 2016
Final Assumptions Prior Assumptions
1. Active Members
a. Service Retirement 246,762,309$ 263,602,228$ 273,908,650$
b. Disability Benefits 2,811,567 3,649,852 3,610,321
c. Death Before Retirement 30,209,524 10,454,944 10,766,912
d. Termination 11,742,954 12,247,611 11,896,756
e. Total 291,526,354$ 289,954,635$ 300,182,639$
2. Inactive Members 11,422,977$ 10,833,371$ 11,424,274$
3. Annuitants 241,314,049$ 225,217,978$ 196,779,287$
4. Total Actuarial Present Value 544,263,380$ 526,005,984$ 508,386,200$
of Future Benefits

Judicial Retirement System of Texas, Plan 2 C - 3
Table 3 Analysis of Normal Cost
August 31, 2017 August 31, 2017 August 31, 2016
Final Assumptions Prior Assumptions
1. Gross Normal Cost Rate
a. Service Retirement 15.20% 17.33% 17.28%
b. Disability Benefits 0.40% 0.57% 0.55%
c. Death Before Retirement 2.71% 0.78% 0.77%
d. Termination 1.93% 2.13% 2.08%
e. Total 20.24% 20.81% 20.68%
2. Administrative Expenses 0.33% 0.50% 0.50%
3. Total Normal Cost 20.57% 21.31% 21.18%
4. Less: Member Rate 7.43% 7.44% 7.44%
5. Employer Normal Cost Rate 13.14% 13.87% 13.74%

Judicial Retirement System of Texas, Plan 2 C - 4
Table 4 Historical Summary of Active Member Data
Valuation as of Percent Annual Percent Percent Average Average
August 31, Number Increase Payroll ($) Increase $ Amount Increase Age Service
(1) (2) (3) (4) (5) (6) (7) (8) (9)
2008 518 N/A 66,110,000 N/A 127,625 N/A 54.9 9.4
2009 533 2.9% 67,967,500 2.8% 127,519 -0.1% 55.2 9.0
2010 539 1.1% 68,755,000 1.2% 127,560 0.0% 55.8 9.5
2011 546 1.3% 69,655,000 1.3% 127,573 0.0% 55.7 9.2
2012 541 -0.9% 68,777,500 -1.3% 127,130 -0.3% 56.5 10.0
2013 545 0.7% 69,515,000 1.1% 127,550 0.3% 56.5 9.6
2014 554 1.7% 79,122,500 13.8% 142,820 12.0% 57.3 10.2
2015 563 1.6% 80,352,000 1.6% 142,721 -0.1% 56.9 9.3
2016 548 -2.7% 78,238,000 -2.6% 142,770 0.0% 57.4 10.1
2017 557 1.6% 79,330,000 1.4% 142,424 -0.2% 57.2 9.8
Active Members Covered Payroll Average Salary
Judicial Retirement System of Texas, Plan 2 C - 5
Table 5 Reconciliation of Plan Net Assets
August 31, 2017 August 31, 2016
(1) (2)
1. Market value of assets at beginning of year 381,119,508$ 364,510,248$
2. Revenue for the year
a. Contributions for the year
i. State (including membership fees) 12,494,828$ 12,374,200$
ii. Member (including penalty interest) 6,016,757 5,754,349
iii. Total 18,511,585$ 18,128,549$
b. Net investment income 44,875,456$ 19,861,581$
c. Total revenue 63,387,041$ 37,990,130$
3. Disbursements for the year
a. Benefit payments and refunds 23,361,377 21,154,764$
b. Administrative expenses 294,991 226,106
c. Total expenditures 23,656,368 21,380,870
4. Increase in net assets
(Item 2c - Item 3c) 39,730,673$ 16,609,260$
5. Market value of assets at end of year (Item 1 + Item 4) 420,850,181$ 381,119,508$
Year Ending
Judicial Retirement System of Texas, Plan 2 C - 6
Table 6 Development of Actuarial Value of Assets
Year Ending
August 31, 2017
1. Actuarial value of assets at beginning of year 395,457,335$
2. Net new investments
a. Contributions for the year (Table 5) 18,511,585$
b. Disbursements for the year (Table 5) (23,656,368)
c. Subtotal (5,144,783)
3. Assumed investment return rate 7.50%
4. Expected return 29,466,371$
5. Expected actuarial value of assets at end of year
(Item 1 + Item 2c + Item 4) 419,778,923$
6. Market value of assets at end of year 420,850,181$
7. Market Adjustment as of August 31, 2017* 1,071,258$
8. Actuarial value of assets (Item 5 + Item 7) 420,850,181$
9. Estimated rate of return 7.8%
10. Actuarial value as percentage of market value 100.0%
* A one-time adjustment to reset the actuarial value to market value was applied as of
August 31, 2017. Smoothing will be applied in future valuation reports.
Judicial Retirement System of Texas, Plan 2 C - 7
Table 7 History of Investment Return Rates
Year Ending Market Market
August 31 of Returns (Gross) Returns (Net) Actuarial
(1) (2) (3) (4)
1998 8.30% 8.23% N/A
1999 16.26% 16.46% N/A
2000 9.43% 9.40% N/A
2001 -6.91% -6.93% N/A
2002 -7.17% -7.21% N/A
2003 9.20% 9.14% 5.2%
2004 11.69% 11.64% 6.2%
2005 12.71% 12.62% 7.5%
2006 8.83% 8.76% 7.7%
2007 13.88% 13.76% 8.8%
2008 -4.58% -4.69% 5.9%
2009 -6.60% -6.71% 3.5%
2010 6.65% 6.48% 4.1%
2011 12.58% 12.36% 5.7%
2012 8.22% 8.04% 7.6%
2013 10.07% 9.87% 8.0%
2014 14.70% 14.58% 9.3%
2015 0.49% 0.44% 7.4%
2016 5.32% 5.28% 7.0%
2017 12.15% 12.11% 7.8%
Average Returns
Last Five Years: 8.43% 8.34% 7.9%
Last Ten Years: 5.67% 5.54% 6.6%
Last Fifteen Years: 7.49% 7.39% 6.8%
Last Twenty Years: 6.49% 6.41% N/A Market returns provided by ERS Master Trust Custodian.
Rates in Column (2) represent the market returns gross of all expenses. Rates in Column (3) represent the market returns net of investment expenses. Net returns may exceed gross returns in years where adjustments are made to fee expenses.

Judicial Retirement System of Texas, Plan 2 C - 8
Table 8 History of Cash Flow
External External Cash
Year Ending Benefit Payments Administrative Cash Flow Market Value Flow as Percent
August 31, Contributions and Refunds Expenses Total for the Year of Assets of Market Value
(1) (2) (3) (5) (6) (7) (8) (9)
2007 15,034 (5,805) (395) (6,200) 8,834 217,665 4.1%
2008 15,102 (6,717) (244) (6,962) 8,141 215,041 3.8%
2009 15,579 (8,229) (240) (8,469) 7,110 205,730 3.5%
2010 15,632 (9,407) (277) (9,684) 5,948 225,265 2.6%
2011 16,224 (11,768) (286) (12,054) 4,170 259,624 1.6%
2012 8,321 (12,982) (230) (13,212) (4,891) 295,913 -1.7%
2013 8,817 (14,869) (228) (15,098) (6,281) 318,385 -2.0%
2014 17,406 (16,420) (267) (16,687) 719 365,290 0.2%
2015 17,922 (19,238) (284) (19,522) (1,600) 364,510 -0.4%
2016 18,129 (21,155) (226) (21,381) (3,252) 381,120 -0.9%
2017 18,511 (23,361) (295) (23,656) (5,145) 420,850 -1.2%
Dollar amounts in thousands
Column (7) = Column (2) + Column (6).
Distributions and Expenditures

Judicial Retirement System of Texas, Plan 2 C - 9
Table 9 Total Experience Gain or Loss
Year Ending Year Ending
August 31, 2017 August 31, 2016
(2) (3)
A. Calculation of total actuarial gain or loss
1. Unfunded actuarial accrued liability (UAAL), previous year 30,407,972$ 31,395,567$
2. Assumption/Method changes - Liability Only 18,378,089$ 0$
3. UAAL, previous year, after assumption changes (Item 1 + Item 2) 48,786,061$ 31,395,567$
4. Normal cost for the year (excluding administrative expenses) 15,725,838 16,793,568
5. Actual administrative expenses 294,991 226,106
6. Contributions for the year (excluding service purchases) (18,251,419) (18,113,430)
7. Interest at 7.5% for FYE 2017, 8% for FYE 2016
a. On UAAL 3,658,955$ 2,511,645$
b. On normal cost and administrative expenses 600,781 680,787
c. On contributions (684,428) (724,537)
d. Total 3,575,308$ 2,467,895$
8. Legislative changes*– Pay increases budgeted for upcoming biennium by
the State Legislature (11,736,556) 0
9. Expected UAAL (Sum of Items 3 through 8) 38,394,223 32,769,706
10. Actual UAAL 42,753,509 30,407,972
11. Total (gain)/loss for the year (Item 10 - Item 9) 4,359,286$ (2,361,734)$
B. Source of gains and losses
12. Asset (Gain)/Loss for the year - Prior Smoothing Method 0.00% 0$ 3,584,457$
13. Asset (Gain)/Loss for the year - New Smoothing Method 0.23% (1,071,258) 0
14. Pay Increases (Less)/Greater than Expected 0.00% 0 0
15. Non-Retired Demographic (Gains)/Losses 0.73% 3,384,069 (7,807,497)
16. Post-Retirement Mortality (Gains)/Losses 0.15% 717,849 885,212
17. Other Demographic (Gains)/Losses 0.29% 1,328,626 976,094
18. Total (Sum of Items 12 through 17) 0.94% 4,359,286$ (2,361,734)$
Item
(1)
% of
AAL
* The plan experiences a (gain)/loss when across-the-board pay increases budgeted by the State Legislature are (less)/greater than assumed.
Judicial Retirement System of Texas, Plan 2 C - 10
Table 10 Solvency Test
Actuarial Accrued Liability and Percent of Active Member Payroll for:
% of % of % of Actuarial Value
August 31, (1) Payroll (2) Payroll (3) Payroll of Assets (1) (2) (3)
2007 44,615$ 69% 62,008$ 96% 114,261$ 177% 211,933$ 100% 100% 92%
2008 50,408 76% 63,792 96% 124,898 189% 232,891 100% 100% 95%
2009 51,733 76% 85,845 126% 117,991 174% 248,279 100% 100% 94%
2010 57,347 83% 92,253 134% 132,160 192% 264,515 100% 100% 87%
2011 57,769 83% 120,798 173% 121,596 175% 283,935 100% 100% 87%
2012 63,678 93% 122,571 178% 128,950 187% 300,433 100% 100% 89%
2013 64,435 93% 147,052 212% 147,571 212% 318,026 100% 100% 72%
2014 69,364 88% 153,383 194% 163,539 207% 348,431 100% 100% 77%
2015 67,428 84% 194,524 242% 142,059 177% 372,615 100% 100% 78%
2016 73,450 94% 196,779 252% 155,636 199% 395,457 100% 100% 80%
2017 72,977 92% 241,314 304% 149,313 188% 420,850 100% 100% 71%
Note : Dollar amounts in thousands
Liabilities Covered
by Assets
Employer Financed
Portion of Vested
and Nonvested BenefitsInterest
Retirees and
Beneficiaries Currently
Receiving Benefits
Accumulated Member
Contributions Including
Portion of Accrued

Judicial Retirement System of Texas, Plan 2 C - 11
Table 11 Historical Contribution Rates
Actuarial
Valuation as Total Normal
of August 31, State Members* Total Cost Rate ASC**
1998 16.830% 6.00%* 22.830% 21.43% Not calculated
1999 16.830% 6.00%* 22.830% 21.82% Not calculated
2000 16.830% 6.00%* 22.830% 22.01% Not calculated
2001 16.830% 6.00%* 22.830% 22.37% Not calculated
2002 16.830% 6.00%* 22.830% 22.88% Not calculated
2003 16.830% 6.00%* 22.830% 19.58% Not calculated
2004 16.830% 6.00%* 22.830% 19.58% Not calculated
2005 16.830% 5.98% 22.810% 20.98% 22.64%
2006 16.830% 5.95% 22.780% 20.59% 21.70%
2007 16.830% 5.98% 22.810% 20.83% 21.60%
2008 16.830% 5.99% 22.820% 19.26% 19.81%
2009 16.830% 5.99% 22.820% 20.30% 20.94%
2010 16.830% 5.98% 22.810% 20.19% 21.68%
2011 6.000% 5.97% 11.970% 20.38% 21.76%
2012 6.500% 5.98% 12.480% 20.25% 21.52%
2013 15.663% 6.57% 22.233% 20.96% 24.08%
2014 15.663% 6.87% 22.533% 21.03% 23.86%
2015 15.663% 7.16% 22.823% 21.40% 23.79%
2016 15.663% 7.44% 23.103% 21.18% 23.48%
2017 15.663% 7.43% 23.093% 20.57% 23.85%
Contributions from:
** The Actuarially Sound Contribution Rate (ASC) is the rate determined as of the valuation date to
fund the normal cost and amortize the UAAL over a 31 year period.
* Effective member contribution rate due to the active JRS-2 members that have elected to cease
contributing to the plan as well as cease accruing additional benefits. FY 1998-2004 shows the rate
members contributed if they chose to continue contributions. FY 2005 and forward reflects the
effective rate that accounts for some JRS 2 members choosing not to participate after 20 years (or
12 years, if member is an appellate court justice).

SECTION D
SUMMARY OF PLAN PROVISIONS
Judicial Retirement System of Texas, Plan 2 D - 1
Summary of Plan Provisions for Judicial Retirement System, Plan 2
Membership
Membership is mandatory at the first day of employment for eligible persons who, after August 31, 1985, became a judge, justice, or commissioner of:
(1) The Supreme Court;
(2) The Court of Criminal Appeals;
(3) Courts of Appeals;
(4) District Courts; or
(5) Specified commissioners to a court.
Member Contributions
Judicial officers contribute a percentage of their compensation based on the following schedule:
a. Fiscal year 2014: 6.60%
b. Fiscal year 2015: 6.90%
c. Fiscal year 2016: 7.20%
d. Fiscal year 2017 and beyond: 7.50%
Beginning in fiscal year 2018, the 7.50% will be reduced one-tenth of one percent for each one-tenth of one percent that the State contribution rate for the fiscal year to which the service relates is less than the State contribution rate established for the 2015 fiscal year.
Contributions cease after member has accrued 20 years of service credit or has served 12 years on an appellate court and attained the Rule of 70. However, these members may elect to make contributions for each subsequent year of service credit and receive the additional benefit accruals.
Member contributions accumulate interest at 5.00% per year through December 31, 2013 and 2.00% interest per year, thereafter.
State of Texas Contributions
State contributions are set biennially by the legislature. For fiscal years 2018 and 2019, the State will contribute 15.663% of payroll.
Final Compensation
The State salary being paid at the time the member retires to a judge of a court of the same classification as the last court to which the member was elected or appointed.
Creditable Service
The types of service creditable in JRS-2 are membership service, military service and equivalent membership service. Equivalent membership service includes: previously cancelled service, service not previously established, waiting period service, and Additional Service Credit.

Judicial Retirement System of Texas, Plan 2 D - 2
Standard Service Retirement Annuity
1. Eligibility:
a. Age 65 and ten years of service if currently holding judicial office; or
b. Age 65 and twelve years of service; or
c. Twenty years of service, regardless of age; or
d. Member’s age plus service credited in the retirement system equals 70 (Rule of 70), if the member has served at least twelve years on an appellate court.
2. Benefits: Monthly annuity payable for life, equal to 50% of Final Compensation at retirement, increased by 10% of Final Compensation at retirement if the member has not been out of judicial office for one year or the member has served as a visiting judge within one year of benefit commencement.
Members who elect to continue their contributions after 20 years of service credit, or after serving 12 years on an appellate court and attaining the Rule of 70, can earn up to a maximum total benefit of 90% of Final Compensation. For each such year, the service retirement annuity would be increased by 2.3% of the Final Compensation at retirement.
3. Normal Form of Payment: Payable for the life of the member with any remaining member account balance paid at time of death. Survivorship options and partial lump-sum option are available on an actuarially equivalent basis.
Early Commencement of Standard Service Retirement Annuity
1. Eligibility:
a. Age 60 and ten years of service if currently holding judicial office; or
b. Age 60 and twelve years of service.
2. Benefits: Standard Service Retirement Annuity with the 50% replaced by the following percentages based on age at retirement:
Attained Age Percent of
Final Compensation
60 40.0%
61 41.7
62 43.6
63 45.6
64 47.7
3. Normal Form of Payment: Payable for the life of the member with any remaining member account balance paid at time of death. Survivorship options and partial lump-sum option are available on an actuarially equivalent basis.

Judicial Retirement System of Texas, Plan 2 D - 3
Standard Non-Occupational Disability Annuity
1. Eligibility: Seven years of service and Chief Justice of the Supreme Court and the medical board must certify that the member is mentally or physically incapacitated for the further performance of regular judicial duties.
2. Benefits: Unreduced Standard Service Retirement Annuity.
3. Normal Form of Payment: Payable for the life of the member with any remaining member account balance paid at time of death. Survivorship options and partial lump-sum option are available on an actuarially equivalent basis.
Death Benefit Plan (DBP) Annuity
1. Eligibility: Death of an active member with 10 years of service.
2. Benefits: Benefits are calculated as if the member had elected an optional form of payment, received a Standard Service Retirement Annuity, and died immediately thereafter. If the member dies before becoming eligible for a Standard Service Retirement Annuity, the benefit is reduced for early retirement from age 65.
Pre-Retirement Death Refund Alternative
A refund of accumulated contributions is payable in cases of pre-retirement death where the member did not meet the eligibility requirements for a Death Benefit Plan Annuity, or the eligible beneficiary chooses to receive a refund of the member account balance in lieu of an annuity. This amount is increased by 5% of the member’s account balance at death, times full years of service credit at death, to a maximum of 100%.
Deferred Service Retirement Annuity
1. Eligibility: Twelve or more years of service and Member Contributions have not been refunded.
2. Benefits: The Standard Service Retirement Annuity earned as of the date of termination; provided that the annuity may be increased under the provisions of the proportionate retirement program if the member becomes a contributing member of another system that participates in the program.
3. Payments may commence at: Age 65; or a reduced amount as early as age 60.
4. Normal Form of Payment: Payable for the life of the member with any remaining member account balance paid at time of death. Survivorship options and partial lump-sum option are available on an actuarially equivalent basis.
Refund of Accumulated Contributions
A refund of accumulated contributions is payable in cases where a terminated member did not meet the eligibility requirements for an annuity, or a terminated member chooses to receive a refund of his or her account balance in lieu of an annuity.

Judicial Retirement System of Texas, Plan 2 D - 4
Limit on Plan Modifications
According to Section 840.106 of the Texas Government Code – a rate of member or State contributions to or a rate of interest required for the establishment of credit in the retirement system may not be reduced or eliminated, a type of service may not be made creditable in the retirement system, a limit on the maximum permissible amount of a type of creditable service may not be removed or raised, a new monetary benefit payable by the retirement system may not be established, and the determination of the amount of a monetary benefit from the system may not be increased, if, as a result of the particular action, the time, as determined by an actuarial valuation, required to amortize the UAAL of the retirement system would be increased to a period that exceeds 30 years by one or more years.
SECTION E
ACTUARIAL ASSUMPTIONS AND METHODS
Judicial Retirement System of Texas, Plan 2 E - 1
Summary of Actuarial Assumptions and Methods
The assumptions and methods applied in this actuarial valuation were adopted by the Board of
Trustees on August 23, 2017 based on the experience investigation that covered the five-year
period from September 1, 2011 through August 31, 2016.
I. Valuation Date
The valuation date is August 31 of each plan year. This is the date as of which the actuarial
present value of future benefits and the actuarial value of assets are determined.
II. Actuarial Cost Method
Because the employer contribution rate is set by statute, the actuarial valuation is used to
determine the adequacy of the current State contribution rate and describe the current financial
condition of JRS-2.
The actuarial valuation uses the Entry Age Normal actuarial cost method. Under this method, the
first step is to determine the contribution rate (level as a percentage of pay) required to provide
the benefits to each member, or the normal cost rate. The normal cost rate consists of two
pieces: (i) the member’s contribution rate, and (ii) the remaining portion of the normal cost rate
which is the employer’s normal cost rate. The total normal cost rate is based on the benefits
payable to each individual active member.
The Unfunded Actuarial Accrued Liability (UAAL) is the liability for future benefits which is in
excess of (i) the actuarial value of assets, and (ii) the present value of future normal costs. The
employer contribution provided in excess of the employer normal cost is applied to amortize the
UAAL.
The funding period is calculated as the number of years required to fully amortize the UAAL,
assuming that: (a) future market earnings, net of investment-related expenses, will equal 7.50%
per year, (b) there will be no liability gains/losses or changes in assumptions, (c) the number of
active members will remain unchanged, (d) active members who leave employment will be
replaced by new entrants each year, and (e) State contributions will remain the same percentage
of payroll as the current fiscal year.
The Entry Age actuarial cost method is an “immediate gain” method (i.e., experience gains and
losses are separately identified as part of the UAAL). However, they are amortized over the same
period applied to all other components of the UAAL.

Judicial Retirement System of Texas, Plan 2 E - 2
III. Actuarial Value of Assets
The actuarial value of assets is based on the market value of assets with a five-year phase-in of
actual investment return in excess of (less than) expected investment income. Offsetting
unrecognized gains and losses are immediately recognized, with the shortest remaining bases
recognized first and the net remaining bases continue to be recognized on their original
timeframe. Expected investment income is determined using the assumed investment return rate
and the market value of assets (adjusted for receipts and disbursements during the year). The
returns are computed net of investment-related expenses. The actuarial value of assets was reset
to be equal to the market value of assets as of August 31, 2017 and the new method will be
applied prospectively.
IV. Actuarial Assumptions
Investment Return: 7.50% per year, net of investment-related expenses (composed of an assumed 2.50% inflation rate and a 5.00% real rate of return)
Administrative Expenses: 0.33% of valuation payroll per year
Salary Increases: Inflationary pay increases are assumed to occur at the beginning of the year and the remaining pay increases associated with merit, promotion and longevity are assumed to occur at the middle of the valuation year. The components of the annual increases are:
InflationReal Wage Growth
(Productivity)
Merit, Promotion
and Longevity
2.50% 0.50% 0.00%
Payroll Growth: 3.00% per year, compounded annually (for projecting valuation payroll).
Post-Retirement Increases: None
Age and Service Assumptions and Methods:
Eligibility Service: Eligibility Service is considered to be all service eligible for vesting purposes, which includes contributory and non-contributory service.
Benefit Service: Current Benefit Service in years and months as of the valuation date was provided by ERS. This service plus Future Earned Service, and Eligibility Service at Retirement were used to project benefit amounts.
Future Earned Service: Active members were assumed to earn one additional year of service credit in each future year employed based on their current class of membership (but not beyond the amount of credit needed to provide a 100% of average monthly compensation standard service retirement annuity).
Entry Age: Entry age is calculated as the age at the valuation date minus Eligibility Service.

Judicial Retirement System of Texas, Plan 2 E - 3
Decrement Timing: All decrements – mortality, service retirement, disability retirement, and termination of employment for reasons other than death or retirement – are assumed to occur at the middle of the valuation year.
Mortality Decrements:
Service Retirees, Beneficiaries, and Inactive Members 2017 State Retirees of Texas (SRT) mortality table. Generational mortality improvements in accordance with the ultimate rates from the scale most recently published by Retirement Plans Experience Committee of the Society of Actuaries (“Scale U-MP”) and projected from the year 2017. Sample rates for the base mortality table included below.
Age Males Females
40 0.0603 0.0380
45 0.1059 0.0687
50 0.1825 0.1215
55 0.3145 0.2150
60 0.5421 0.3804
65 0.9344 0.6730
70 1.6105 1.1908
75 2.7757 2.1069
80 4.7842 3.7277
85 8.2459 6.5956
90 14.2527 11.7028
Annual Mortality Rates per 100 Individuals
Active Members RP-2014 Active Member Mortality table. Generational mortality improvements in accordance with Scale U-MP are projected from the year 2014.
Disability Retirees RP-2014 Disabled Retiree Mortality. Generational mortality improvements in accordance with Scale U-MP are projected from the year 2014.
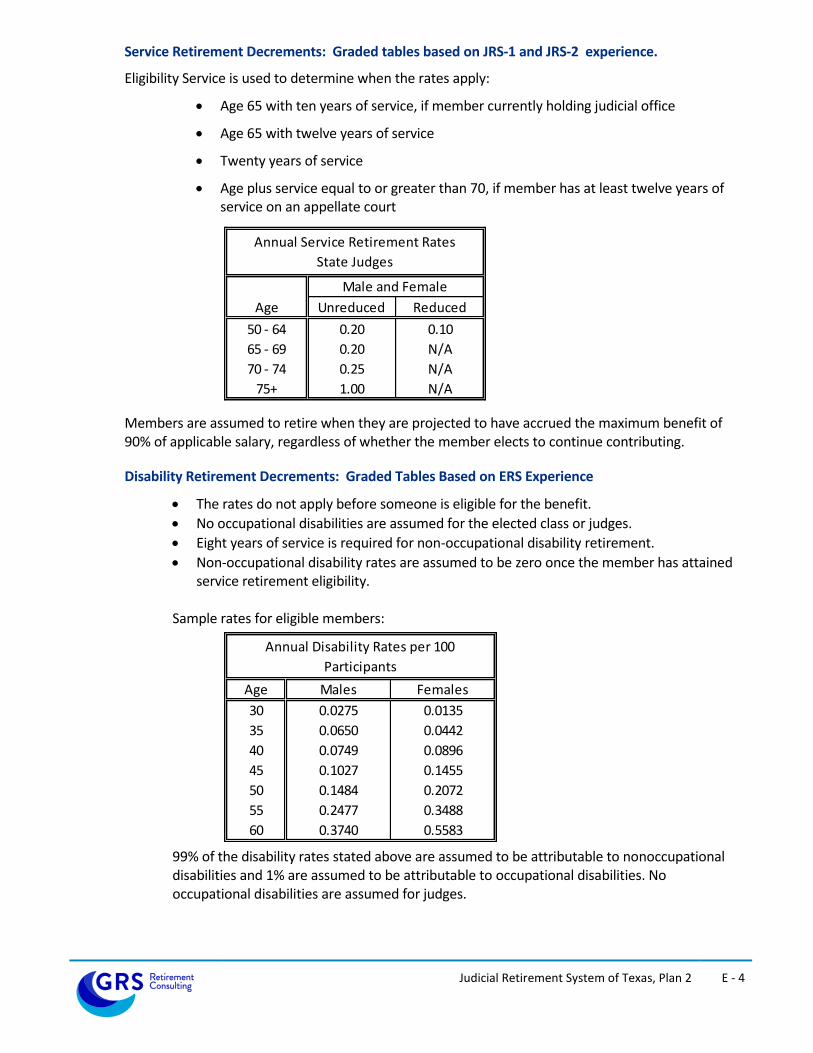
Judicial Retirement System of Texas, Plan 2 E - 4
Service Retirement Decrements: Graded tables based on JRS-1 and JRS-2 experience.
Eligibility Service is used to determine when the rates apply:
Age 65 with ten years of service, if member currently holding judicial office
Age 65 with twelve years of service
Twenty years of service
Age plus service equal to or greater than 70, if member has at least twelve years of service on an appellate court
Age Unreduced Reduced
50 - 64 0.20 0.10
65 - 69 0.20 N/A
70 - 74 0.25 N/A
75+ 1.00 N/A
Annual Service Retirement Rates
State Judges
Male and Female
Members are assumed to retire when they are projected to have accrued the maximum benefit of 90% of applicable salary, regardless of whether the member elects to continue contributing.
Disability Retirement Decrements: Graded Tables Based on ERS Experience
The rates do not apply before someone is eligible for the benefit.
No occupational disabilities are assumed for the elected class or judges.
Eight years of service is required for non-occupational disability retirement.
Non-occupational disability rates are assumed to be zero once the member has attained service retirement eligibility.
Sample rates for eligible members:
Age Males Females
30 0.0275 0.0135
35 0.0650 0.0442
40 0.0749 0.0896
45 0.1027 0.1455
50 0.1484 0.2072
55 0.2477 0.3488
60 0.3740 0.5583
Annual Disability Rates per 100
Participants
99% of the disability rates stated above are assumed to be attributable to nonoccupational disabilities and 1% are assumed to be attributable to occupational disabilities. No occupational disabilities are assumed for judges.

Judicial Retirement System of Texas, Plan 2 E - 5
Termination Decrements for Reasons Other Than Death or Retirement: Graded Tables Based on JRS-1 and JRS-2 Experience.
Four per 100 participants for members not eligible for service retirement.
Withdrawal of Employee Contributions: Members that terminate with a vested benefit are assumed to choose the most valuable option available to them at the time of termination: withdrawal of contributions or deferred annuity.
Percentage of Members Electing Various Benefit Options:
Sex / Benefit
Standard Life
Annuity Option 1 Option 4
Male Member
Disability 50% 50% 0%
Service Retirement 100% 0% 0%
Death Benefit Plan 0% 85% 15%
Female Member
Disability 75% 25% 0%
Service Retirement 100% 0% 0%
Death Benefit Plan 0% 70% 30%
The value of the Standard Service Retirement Life Annuity reflects the return of excess contributions payable as a lump sum death benefit in cases the annuity benefits paid are less than the member account balance at the time of retirement.
Beneficiary Characteristics: Males are assumed to be two years older than females.
Census Data and Assets
The valuation was based on members of JRS-2 as of August 31, 2017 and does not take into account future members, with the exception of determining the funding period.
All census data was supplied by ERS and was subject to reasonable consistency checks.
There were data elements that were modified for some members as part of the valuation in order to make the data complete. However, the number of missing data items was immaterial.
Asset data was supplied by ERS.
Other Actuarial Valuation Procedures
No provision was made in this actuarial valuation for the limitations of Internal Revenue Code Sections 415 or 401(a)17.
Valuation payroll (earnings applied to the current valuation year) is the expected payroll for the fiscal year following the valuation date. It is based on reported payroll determined from August member contributions increased to reflect the across-the-board salary increases appropriated by the State legislature, effective on or after September 1, and projected according to the actuarial assumptions for the upcoming fiscal year.
No liability was included for benefits which are funded by special State appropriations.
6
SECTION F
DETAILED SUMMARIES OF MEMBERSHIP DATA
Judicial Retirement System of Texas, Plan 2 F - 1
Detailed Summaries of Membership Data
Table Page
Number
A F-2 Summary of Membership Data
B F-3 Active Members: Distribution by Age and Service
C F-4 Retired and Beneficiary Members: Distribution by Age and Category
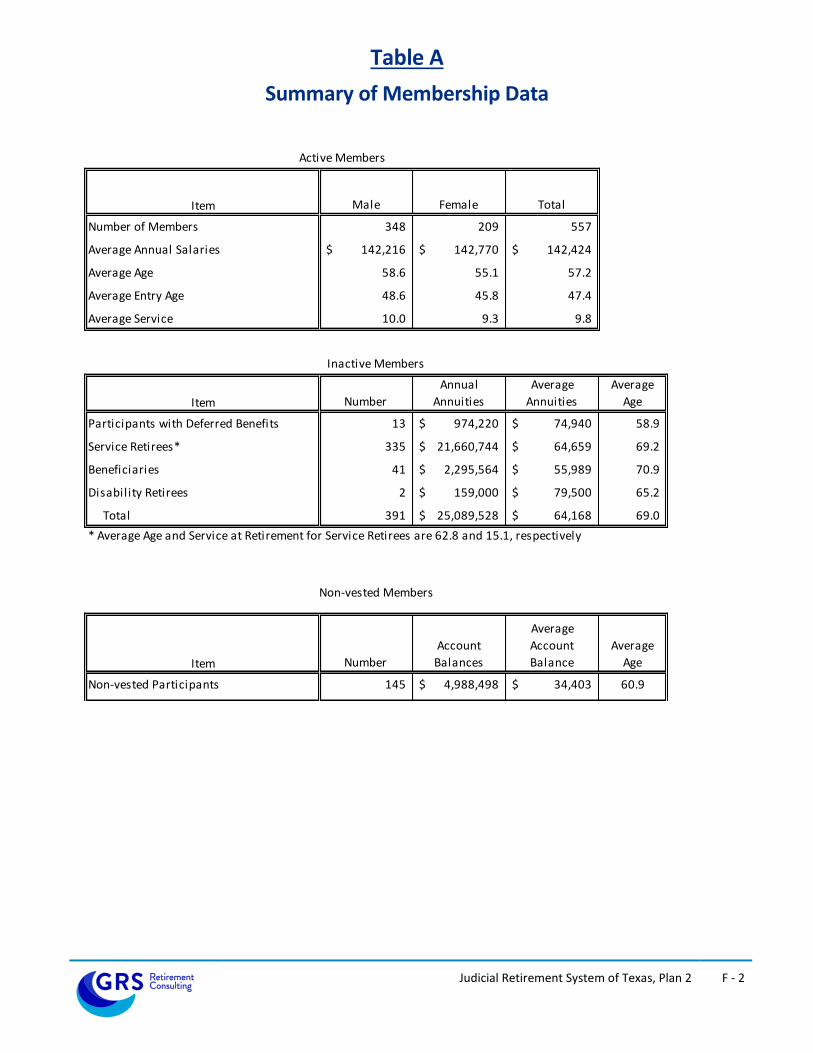
Judicial Retirement System of Texas, Plan 2 F - 2
Table A
Summary of Membership Data
Item Male Female Total
Number of Members 348 209 557
Average Annual Salaries 142,216$ 142,770$ 142,424$
Average Age 58.6 55.1 57.2
Average Entry Age 48.6 45.8 47.4
Average Service 10.0 9.3 9.8
Item Number
Annual
Annuities
Average
Annuities
Average
Age
Participants with Deferred Benefits 13 974,220$ 74,940$ 58.9
Service Retirees* 335 21,660,744$ 64,659$ 69.2
Beneficiaries 41 2,295,564$ 55,989$ 70.9
Disability Retirees 2 159,000$ 79,500$ 65.2
Total 391 25,089,528$ 64,168$ 69.0
* Average Age and Service at Retirement for Service Retirees are 62.8 and 15.1, respectively
Item Number
Account
Balances
Average
Account
Balance
Average
Age
Non-vested Participants 145 4,988,498$ 34,403$ 60.9
Inactive Members
Non-vested Members
Active Members
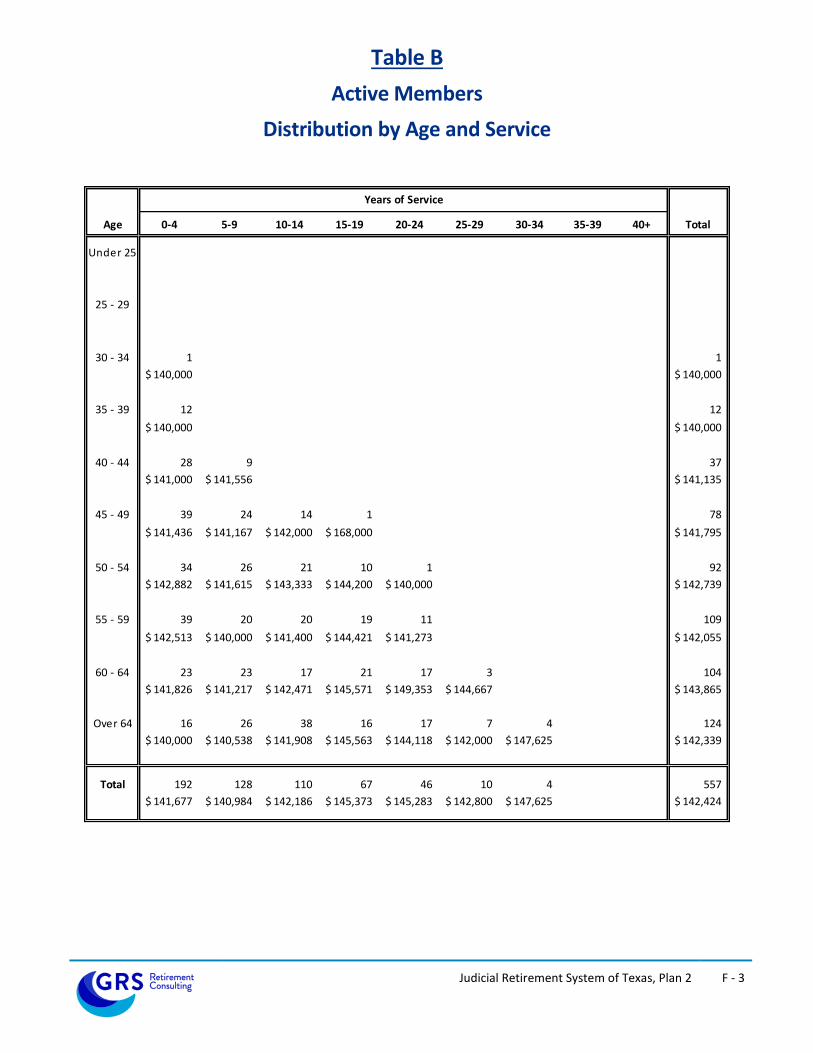
Judicial Retirement System of Texas, Plan 2 F - 3
Table B
Active Members
Distribution by Age and Service
Age 0-4 5-9 10-14 15-19 20-24 25-29 30-34 35-39 40+ Total
Under 25
25 - 29
30 - 34 1 1
140,000$ 140,000$
35 - 39 12 12
140,000$ 140,000$
40 - 44 28 9 37
141,000$ 141,556$ 141,135$
45 - 49 39 24 14 1 78
141,436$ 141,167$ 142,000$ 168,000$ 141,795$
50 - 54 34 26 21 10 1 92
142,882$ 141,615$ 143,333$ 144,200$ 140,000$ 142,739$
55 - 59 39 20 20 19 11 109
142,513$ 140,000$ 141,400$ 144,421$ 141,273$ 142,055$
60 - 64 23 23 17 21 17 3 104
141,826$ 141,217$ 142,471$ 145,571$ 149,353$ 144,667$ 143,865$
Over 64 16 26 38 16 17 7 4 124
140,000$ 140,538$ 141,908$ 145,563$ 144,118$ 142,000$ 147,625$ 142,339$
Total 192 128 110 67 46 10 4 557
141,677$ 140,984$ 142,186$ 145,373$ 145,283$ 142,800$ 147,625$ 142,424$
Years of Service
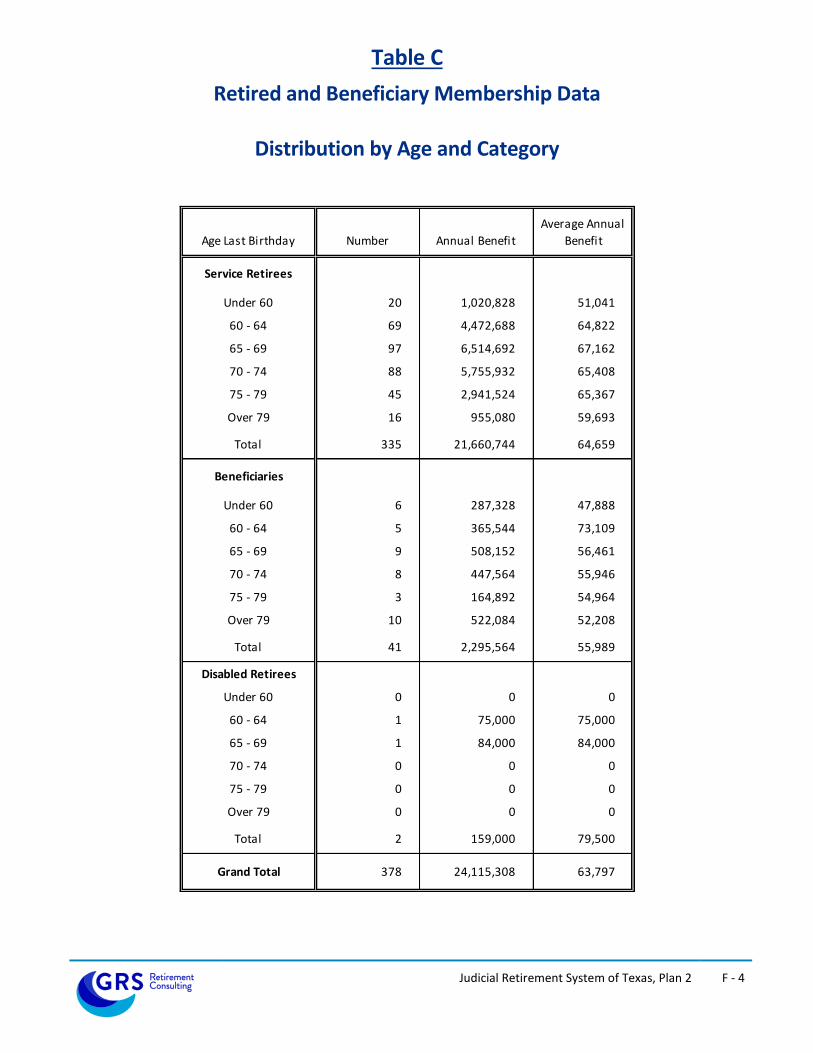
Judicial Retirement System of Texas, Plan 2 F - 4
Table C
Retired and Beneficiary Membership Data
Distribution by Age and Category
Age Last Birthday Number Annual Benefit
Average Annual
Benefit
Service Retirees
Under 60 20 1,020,828 51,041
60 - 64 69 4,472,688 64,822
65 - 69 97 6,514,692 67,162
70 - 74 88 5,755,932 65,408
75 - 79 45 2,941,524 65,367
Over 79 16 955,080 59,693
Total 335 21,660,744 64,659
Beneficiaries
Under 60 6 287,328 47,888
60 - 64 5 365,544 73,109
65 - 69 9 508,152 56,461
70 - 74 8 447,564 55,946
75 - 79 3 164,892 54,964
Over 79 10 522,084 52,208
Total 41 2,295,564 55,989
Disabled Retirees
Under 60 0 0 0
60 - 64 1 75,000 75,000
65 - 69 1 84,000 84,000
70 - 74 0 0 0
75 - 79 0 0 0
Over 79 0 0 0
Total 2 159,000 79,500
Grand Total 378 24,115,308 63,797

SECTION G
GLOSSARY

Judicial Retirement System of Texas, Plan 2 G - 1
Glossary
Actuarial Accrued Liability (AAL): That portion, as determined by a particular Actuarial Cost Method, of the Actuarial Present Value of Future Plan Benefits which is not provided for by future Normal Costs. It is equal to the Actuarial Present Value of Future Plan Benefits minus the actuarial present value of future Normal Costs. Actuarial Assumptions: Assumptions as to future experience under the Fund. These include assumptions about the occurrence of future events affecting costs or liabilities, such as:
mortality, withdrawal, disablement, and retirement;
future increases in salary;
future rates of investment earnings and future investment and administrative expenses;
characteristics of members not specified in the data, such as marital status;
characteristics of future members;
future elections made by members; and
other relevant items. Actuarial Cost Method or Funding Method: A procedure for allocating the Actuarial Present Value of Future Benefits to various time periods; a method used to determine the Normal Cost and the Actuarial Accrued Liability. These items are used to determine the ADC. Actuarial Gain or Actuarial Loss: A measure of the difference between actual experience and that expected based upon a set of Actuarial Assumptions, during the period between two Actuarial Valuation dates. Through the actuarial assumptions, rates of decrements, rates of salary increases, and rates of fund earnings have been forecasted. To the extent that actual experience differs from that assumed, Actuarial Accrued Liabilities emerge which may be the same as forecasted, or may be larger or smaller than projected. Actuarial gains are due to favorable experience, e.g., the Fund's assets earn more than projected, salaries do not increase as fast as assumed, members retire later than assumed, etc. Favorable experience means actual results produce actuarial liabilities not as large as projected by the actuarial assumptions. On the other hand, actuarial losses are the result of unfavorable experience, i.e., actual results that produce actuarial liabilities which are larger than projected. Actuarial gains will shorten the time required for funding of the actuarial balance sheet deficiency while actuarial losses will lengthen the funding period. Actuarially Equivalent: Of equal actuarial present value, determined as of a given date and based on a given set of Actuarial Assumptions. Actuarial Present Value (APV): The value of an amount or series of amounts payable or receivable at various times, determined as of a given date by the application of a particular set of Actuarial Assumptions. For purposes of this standard, each such amount or series of amounts is:
a. adjusted for the probable financial effect of certain intervening events (such as changes in compensation levels, marital status, etc.),
b. multiplied by the probability of the occurrence of an event (such as survival, death, disability, termination of employment, etc.) on which the payment is conditioned, and
c. discounted according to an assumed rate (or rates) of return to reflect the time value of money.

Judicial Retirement System of Texas, Plan 2 G - 2
Actuarial Present Value of Future Plan Benefits: The Actuarial Present Value of those benefit amounts which are expected to be paid at various future times under a particular set of Actuarial Assumptions, taking into account such items as the effect of advancement in age and past and anticipated future compensation and service credits. The Actuarial Present Value of Future Plan Benefits includes the liabilities for active members, retired members, beneficiaries receiving benefits, and inactive, nonretired members either entitled to a refund or a future retirement benefit. Expressed another way, it is the value that would have to be invested on the valuation date so that the amount invested plus investment earnings would be provide sufficient assets to pay all projected benefits and expenses when due. Actuarial Valuation: The determination, as of a valuation date, of the Normal Cost, Actuarial Accrued Liability, Actuarial Value of Assets, and related Actuarial Present Values for a plan. An Actuarial valuation for a governmental retirement system typically also includes calculations of items needed for compliance with GASB. Actuarial Value of Assets or Valuation Assets: The value of the Fund’s assets as of a given date, used by the actuary for valuation purposes. This may be the market or fair value of plan assets, but commonly actuaries use a smoothed value in order to reduce the year-to-year volatility of calculated results, such as the funded ratio and the ADC. Actuarially Determined: Values which have been determined utilizing the principles of actuarial science. An actuarially determined value is derived by application of the appropriate actuarial assumptions to specified values determined by provisions of the law. Amortization Method: A method for determining the Amortization Payment. The most common methods used are level dollar and level percentage of payroll. Under the Level Dollar method, the Amortization Payment is one of a stream of payments, all equal, whose Actuarial Present Value is equal to the UAAL. Under the Level Percentage of Pay method, the Amortization payment is one of a stream of increasing payments, whose Actuarial Present Value is equal to the UAAL. Under the Level Percentage of Pay method, the stream of payments increases at the assumed rate at which total covered payroll of all active members will increase. Amortization Payment: That portion of the pension plan contribution or ADC which is designed to pay interest on and to amortize the Unfunded Actuarial Accrued Liability. Actuarially Determined Contribution (ADC) or Annual Required Contribution (ARC): A calculated contribution for a defined benefit pension plan for the reporting period, most often determined based on the funding policy of the plan. Typically the calculated contribution has a normal cost payment and an amortization payment. Closed Amortization Period: A specific number of years that is counted down by one each year and therefore declines to zero with the passage of time. For example if the amortization period is initially set at 30 years, it is 29 years at the end of one year, 28 years at the end of two years, etc. See Funding Period and Open Amortization Period. Decrements: Those causes/events due to which a member’s status (active-inactive-retiree-beneficiary) changes, that is: death, retirement, disability, or termination.

Judicial Retirement System of Texas, Plan 2 G - 3
Defined Benefit Plan: An employer-sponsored retirement benefit that provides workers, upon attainment of designated age and service thresholds, with a monthly benefit based on the employee’s salary and length of service. The value of a benefit from a defined benefit plan is generally not affected by the return on the assets that are invested to fund the benefit. Defined Contribution Plan: A retirement plan, such as a 401(k) plan, a 403(b) plan, or a 457 plan, in which the contributions to the plan are assigned to an account for each member, and the plan’s earnings are allocated to each account, and each member’s benefits are a direct function of the account balance. Employer Normal Cost: The portion of the Normal Cost to be paid by the employers. This is equal to the Normal Cost less expected member contributions. Experience Study: A periodic review and analysis of the actual experience of the Fund which may lead to a revision of one or more actuarial assumptions. Actual rates of decrement and salary increases are compared to the actuarially assumed values and modified as deemed appropriate by the Actuary. Funded Ratio: The ratio of the actuarial value of assets (AVA) to the actuarial accrued liability (AAL). Plans sometimes calculate a market funded ratio, using the market value of assets (MVA), rather than the AVA. Funding Period or Amortization Period: The term “Funding Period” is used it two ways. In the first sense, it is the period used in calculating the Amortization Payment as a component of the ADC. This funding period is chosen by the Board of Trustees. In the second sense, it is a calculated item: the number of years in the future that will theoretically be required to amortize (i.e., pay off or eliminate) the Unfunded Actuarial Accrued Liability, based on the statutory employer contribution rate, and assuming no future actuarial gains or losses. GASB: The Governmental Accounting Standards Board is an organization that exists in order to promulgate accounting standards for governmental entities. Normal Cost: That portion of the Actuarial Present Value of pension plan benefits and expenses which is allocated to a valuation year by the Actuarial Cost Method. Any payment in respect of an Unfunded Actuarial Accrued Liability is not part of Normal Cost (see Amortization Payment). For pension plan benefits which are provided in part by employee contributions, Normal Cost refers to the total of employee contributions and employer Normal Cost unless otherwise specifically stated. Under the entry age normal cost method, the Normal Cost is intended to be the level cost (when expressed as a percentage of pay) needed to fund the benefits of a member from hire until ultimate termination, death, disability or retirement. Open Amortization Period: An open amortization period is one which is used to determine the Amortization Payment but which does not change over time. In other words, if the initial period is set as 30 years, the same 30-year period is used in determining the Amortization Period each year. In theory, if an Open Amortization Period is used to amortize the Unfunded Actuarial Accrued Liability, the UAAL will never completely disappear, but will become smaller each year, either as a dollar amount or in relation to covered payroll. Unfunded Actuarial Accrued Liability: The excess of the Actuarial Accrued Liability over the Actuarial Value of Assets. This value may be negative in which case it may be expressed as a negative Unfunded Actuarial Accrued Liability, also called the Funding Surplus.

Judicial Retirement System of Texas, Plan 2 G - 4
Valuation Date or Actuarial Valuation Date: The date as of which the value of assets is determined and as of which the Actuarial Present Value of Future Plan Benefits is determined. The expected benefits to be paid in the future are discounted to this date.

Judicial Retirement System of Texas, Plan 1 Annual Actuarial Valuation As of August 31, 2017
November 28, 2017
Board of Trustees Employees Retirement System of Texas 200 East 18th Street Austin, TX 78701 Re: Actuarial Valuation for Funding Purposes as of August 31, 2017
Members of the Board:
We certify that the information contained in this report is accurate and fairly presents the actuarial position of the Judicial Retirement System of Texas, Plan 1 (JRS-1) as of August 31, 2017. This report was prepared at the request of the Board and is intended for use by ERS staff and those designated or approved by the Board. This report may be provided to parties other than ERS only in its entirety and only with the permission of the Board.
Actuarial Valuation
JRS-1 is not advanced funded as the actual benefit payments are funded through legislative appropriations. As a result, the primary purpose for the annual actuarial valuation of JRS-1 is to provide a detailed summary of the provisions, assumptions, methods and data used to prepare the financial statement disclosure and reporting information as provided by the Governmental Accounting Standards Board. The applicable disclosure and reporting information for JRS-1 can be found in ERS’ Comprehensive Annual Financial Report for the fiscal year ending August 31, 2017. The purpose of this report is also to document the plan’s actuarial accrued liability and membership demographics as well as provide a projection of the appropriations needed to cover the actual plan benefit payments.
Plan Provisions
Our actuarial valuation as of August 31, 2017 reflects the benefit and contribution provisions set forth in Chapters 831 through 835 of the Texas Government Code. The current plan provisions are outlined in Section B of this report.
Actuarial Assumptions and Methods
The assumptions and methods applied in this actuarial valuation were adopted by the Board of Trustees on August 23, 2017 based on the experience investigation that covered the five-year period from September 1, 2011 through August 31, 2016. Additionally, this actuarial valuation incorporates the
Board of Trustees November 28, 2017 Page 2
significant across-the-board pay increases budgeted by the State Legislature when they are granted for the current biennium. The current actuarial assumptions and methods are outlined in Section C of this report.
Data
The valuation was based upon information as of August 31, 2017, furnished by ERS staff, concerning system benefits, financial transactions, plan provisions and active members, terminated members, retirees and beneficiaries. We checked for internal and year-to-year consistency, but did not audit the data. We are not responsible for the accuracy or completeness of the information provided by ERS staff. A summary of the membership data is provided in Section D of this report.
Certification
All of our work conforms with generally accepted actuarial principles and practices, and to the Actuarial Standards of Practice issued by the Actuarial Standards Board. In our opinion, our calculations also comply with the requirements of, where applicable, the Internal Revenue Code and ERISA.
The signing actuaries are independent of the plan sponsor. They are all Enrolled Actuaries, Fellows of the Society of Actuaries, and Members of the American Academy of Actuaries, and meet the Qualification Standards of the American Academy of Actuaries. Finally, each of the undersigned are experienced in performing valuations for large public retirement systems.
Respectfully submitted,
Gabriel, Roeder, Smith & Company
R. Ryan Falls, FSA, EA, MAAA Joseph P. Newton, FSA, EA, MAAA
Senior Consultant & Actuary Pension Market Leader & Actuary
Dana Woolfrey, FSA, EA, MAAA
Consultant & Actuary

Judicial Retirement System of Texas, Plan 1
Table of Contents
Section Page
Number
Cover Letter
Section A Actuarial Valuation Results
A-1 Summary of Plan Obligations
A-2 Summary of Projected Payments
A-2 Liability Based on Municipal Bond Rate
Section B Summary of Plan Provisions
Section C Summary of Actuarial Assumptions and Methods
Section D Summary of Membership Data
Section E Glossary

SECTION A
ACTUARIAL VALUATION RESULTS
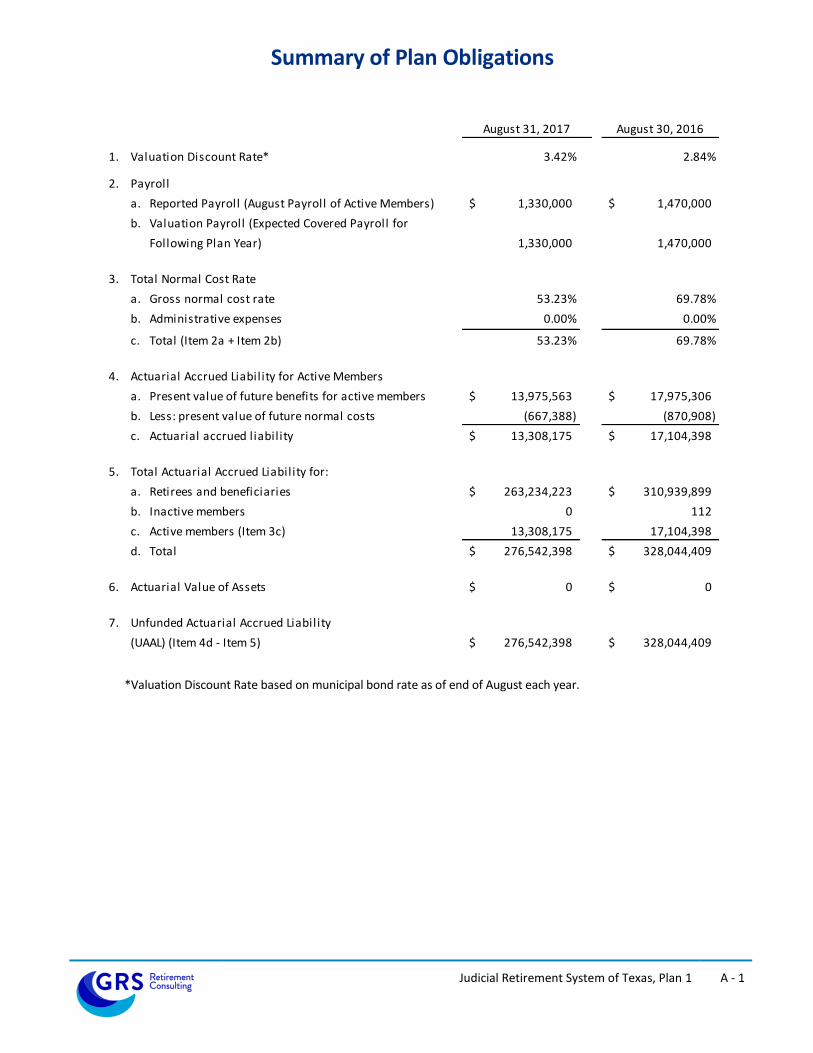
Judicial Retirement System of Texas, Plan 1 A - 1
Summary of Plan Obligations
August 30, 2016
1. Valuation Discount Rate* 3.42% 2.84%
2. Payroll
a. Reported Payroll (August Payroll of Active Members) 1,330,000$ 1,470,000$
b. Valuation Payroll (Expected Covered Payroll for
Following Plan Year) 1,330,000 1,470,000
3. Total Normal Cost Rate
a. Gross normal cost rate 53.23% 69.78%
b. Administrative expenses 0.00% 0.00%
c. Total (Item 2a + Item 2b) 53.23% 69.78%
4. Actuarial Accrued Liability for Active Members
a. Present value of future benefits for active members 13,975,563$ 17,975,306$
b. Less: present value of future normal costs (667,388) (870,908)
c. Actuarial accrued liability 13,308,175$ 17,104,398$
5. Total Actuarial Accrued Liability for:
a. Retirees and beneficiaries 263,234,223$ 310,939,899$
b. Inactive members 0 112
c. Active members (Item 3c) 13,308,175 17,104,398
d. Total 276,542,398$ 328,044,409$
6. Actuarial Value of Assets 0$ 0$
7. Unfunded Actuarial Accrued Liability
(UAAL) (Item 4d - Item 5) 276,542,398$ 328,044,409$
August 31, 2017
*Valuation Discount Rate based on municipal bond rate as of end of August each year.

Judicial Retirement System of Texas, Plan 1 A - 2
Summary of Projected Payments The following chart illustrates the outlook of the benefit payments and contributions of JRS-1 over the next 10 years:
Fiscal Year
Projected Benefit
Payments
Projected Member
Contributions
Net Projected
Appropriation
2018 $ 23,344,889 $ 31,180 $ 23,313,709
2019 22,552,994 16,790 22,536,204
2020 21,922,250 12,272 21,909,978
2021 21,271,837 8,945 21,262,892
2022 20,597,298 6,500 20,590,798
2023 19,912,284 3,791 19,908,493
2024 19,216,004 1,053 19,214,951
2025 18,417,235 0 18,417,235
2026 17,676,924 0 17,676,924
2027 16,935,426 0 16,935,426
The projections are based on the same assumptions, methods and provisions used for the August 31, 2017 valuation, which include known across-the-board pay increases budgeted by the State Legislature and the assumptions adopted by the Board in August 2017. The projected benefit payments for JRS-1 are expected to slowly decline over time because the reduction in benefits due to the mortality of current retirees will exceed the expected benefit increases and the new benefits payable to current active members. Note that the projected benefit payments assume no judicial pay increases on September 1, 2017 or September 1, 2018, and 2.75% per year beginning September 1, 2019 in accordance with the valuation assumptions.
Liability Based on Municipal Bond Rate Since there are no assets held in trust to pay the benefits of JRS-1, a reasonable measure of the plan’s obligation is to calculate the liability based on an investment return assumption, or discount rate, that reflects the expected return on the assets that will be used to pay benefits. In this case, the assets that will be used to pay benefits are the general funds of the State of Texas. Therefore, each year the Actuarial Accrued Liability for JRS-1 will be calculated using a municipal bond rate, which is expected to fluctuate from year to year. As of August 31, 2017, the Actuarial Accrued Liability of JRS-1 is $276,542,398 based on a municipal bond rate of 3.42%. As of August 31, 2016, the Actuarial Accrued Liability was $328,044,409 based on a municipal bond rate of 2.84%. The source of the municipal bond rate as of August 31, 2017 is the rate for Fixed Income Market Data/Yield Curve/Data Municipal bonds with 20 years to maturity that include only federally tax-exempt municipal bonds as reported in Fidelity Index’s “20-Year Municipal GO AA Index.” In describing this index, Fidelity notes that the municipal curves are constructed using option adjusted analytics of a diverse population of over 10,000 tax exempt securities. The rate shown is as of the last date available on or before the measurement date.

SECTION B
SUMMARY OF PLAN PROVISIONS

Judicial Retirement System of Texas, Plan 1 B - 1
Summary of Plan Provisions for Judicial Retirement System, Plan 1
Membership
Membership is mandatory at the first day of employment for eligible persons who, before August 31, 1985, became a judge, justice, or commissioner of:
(1) The Supreme Court;
(2) The Court of Criminal Appeals;
(3) Courts of Appeals;
(4) District Courts; or
(5) Specified commissioners to a court.
Member Contributions
Section 835.101 of the Texas Government Code requires members of JRS-1 to contribute the same amount as a member of the employee class of the Employees Retirement System of Texas. As a result, judicial officers contribute 9.50% of their compensation beginning in fiscal year 2016.
The ultimate member contribution rate may be subject to the State maintaining a certain level of contributions to the Employees Retirement System of Texas relative to the State’s contribution, beginning in fiscal year 2018.
Contributions cease after member has accrued 20 years of service credit or has served 12 years on an appellate court and attained the Rule of 70. However, these members may elect to make contributions for each subsequent year of service credit and receive the additional benefit accruals.
Member contributions accumulate interest at 5.00% per year through December 31, 2013 and 2.00% interest per year, thereafter.
State of Texas Contributions
Appropriations as needed to cover actual benefit payments.
Creditable Service
The types of service creditable in JRS-1 are membership service, military service and equivalent membership service. Equivalent membership service includes: previously cancelled service, service not previously established, waiting period service, and Additional Service Credit.
Standard Service Retirement Annuity
1. Eligibility:
a. Age 65 and ten years of service if currently holding judicial office; or
b. Age 65 and twelve years of service; or
c. Twenty years of service, regardless of age; or
d. Member’s age plus service credited in the retirement system equals 70 (Rule of 70), if the member has served at least twelve years on an appellate court.

Judicial Retirement System of Texas, Plan 1 B - 2
2. Benefits: Monthly annuity payable for life, equal to 50% of the State salary, as adjusted from time to time, being paid to a judge of a court of the same classification as the last court on which the member served before retirement. The 50% is increased to 60% if the member has not been out of judicial office for one year or the member has served as a visiting judge within one year of benefit commencement.
Members who elect to continue their contributions after 20 years of service credit could do so for up to an additional 13 years of service. For each such year, the Standard Service Retirement Annuity would be increased by 2.3% of the applicable State salary.
3. Normal Form of Payment: Payable for the life of the member with any remaining member account balance paid at time of death. Survivorship options and partial lump-sum option are available on an actuarially equivalent basis.
Early Commencement of Standard Service Retirement Annuity
1. Eligibility:
a. Age 60 and ten years of service if currently holding judicial office; or
b. Age 60 and twelve years of service.
2. Benefits: Standard Service Retirement Annuity with the 50% replaced by the following percentages based on age at retirement:
Attained Age Percent of
Final Compensation
60 40.0%
61 41.7
62 43.6
63 45.6
64 47.7
3. Normal Form of Payment: Payable for the life of the member with any remaining member account balance paid at time of death. Survivorship options and partial lump-sum option are available on an actuarially equivalent basis.

Judicial Retirement System of Texas, Plan 1 B - 3
Standard Non-Occupational Disability Annuity
1. Eligibility: Seven years of service and Chief Justice of the Supreme Court and the medical board must certify that the member is mentally or physically incapacitated for the further performance of regular judicial duties.
2. Benefits: Unreduced Standard Service Retirement Annuity.
3. Normal Form of Payment: Payable for the life of the member with any remaining member account balance paid at time of death. Survivorship options and partial lump-sum option are available on an actuarially equivalent basis.
Death Benefit Plan (DBP) Annuity
1. Eligibility: Death of an active member with 10 years of service.
2. Benefits: Benefits are calculated as if the member had elected an optional form of payment, received a Standard Service Retirement Annuity, and died immediately thereafter. If the member dies before becoming eligible for a Standard Service Retirement Annuity, the benefit is reduced for early retirement from age 65.
Pre-Retirement Death Refund Alternative
A refund of accumulated contributions is payable in cases of pre-retirement death where the member did not meet the eligibility requirements for a Death Benefit Plan Annuity, or the eligible beneficiary chooses to receive a refund of the member account balance in lieu of an annuity.
Deferred Service Retirement Annuity
1. Eligibility: Twelve or more years of service and Member Contributions have not been refunded.
2. Benefits: The Standard Service Retirement Annuity earned as of the date of termination; provided that the annuity may be increased under the provisions of the proportionate retirement program if the member becomes a contributing member of another system that participates in the program.
3. Payments may commence at: Age 65; or a reduced amount as early as age 60.
4. Normal Form of Payment: Payable for the life of the member with any remaining member account balance paid at time of death. Survivorship options and partial lump-sum option are available on an actuarially equivalent basis.
Refund of Accumulated Contributions
A refund of accumulated contributions is payable in cases where a terminated member did not meet the eligibility requirements for an annuity, or a terminated member chooses to receive a refund of his or her account balance in lieu of an annuity.
SECTION C
SUMMARY OF ACTUARIAL ASSUMPTIONS AND METHODS
Judicial Retirement System of Texas, Plan 1 C - 1
Summary of Actuarial Assumptions and Methods
The assumptions and methods applied in this actuarial valuation were adopted by the Board of
Trustees on August 23, 2017 based on the experience investigation that covered the five-year
period from September 1, 2011 through August 31, 2016.
I. Valuation Date
The valuation date is August 31 of each plan year. This is the date as of which the actuarial
present value of future benefits and the actuarial value of assets are determined.
II. Actuarial Cost Method
Because the employer contribution rate is set by statute, the actuarial valuation is used to
determine the adequacy of the current State contribution rate and describe the current financial
condition of JRS-1.
The actuarial valuation uses the Entry Age Normal actuarial cost method. Under this method, the
first step is to determine the contribution rate (level as a percentage of pay) required to provide
the benefits to each member, or the normal cost rate. The normal cost rate consists of two
pieces: (i) the member’s contribution rate, and (ii) the remaining portion of the normal cost rate
which is the employer’s normal cost rate. The total normal cost rate is based on the benefits
payable to each individual active member.
The Unfunded Actuarial Accrued Liability (UAAL) is the liability for future benefits which is in
excess of (i) the actuarial value of assets, and (ii) the present value of future normal costs. The
employer contribution provided in excess of the employer normal cost is applied to amortize the
UAAL.
The Entry Age actuarial cost method is an “immediate gain” method (i.e., experience gains and
losses are separately identified as part of the UAAL). However, they are amortized over the same
period applied to all other components of the UAAL.
III. Actuarial Value of Assets
JRS-1 is not an advance funded plan. No asset smoothing method is applicable.

Judicial Retirement System of Texas, Plan 1 C - 2
V. Actuarial Assumptions
Discount Rate: Municipal bond rate as of the end of August
Salary Increases: Inflationary pay increases are assumed to occur at the beginning of the year and the remaining pay increases associated with merit, promotion and longevity are assumed to occur at the middle of the valuation year. The components of the annual increases are:
Payroll Growth: Not applicable.
Post-Retirement Increases: Benefits are assumed to increase 2.75% per year during retirement (each September 1), compounded annually, consistent with the assumed Salary Increases for a judge of a court of the same classification as the last court on which the member served before retirement. Increases are assumed to also occur during deferral periods (if any).
Age and Service Assumptions and Methods:
Eligibility Service: Eligibility Service is considered to be all service eligible for vesting purposes, which includes contributory and non-contributory service.
Benefit Service: Current Benefit Service in years and months as of the valuation date was provided by ERS. This service plus Future Earned Service, and Eligibility Service at Retirement were used to project benefit amounts.
Future Earned Service: Active members were assumed to earn one additional year of service credit in each future year employed based on their current class of membership (but not beyond the amount of credit needed to provide a 100% of average monthly compensation standard service retirement annuity).
Entry Age: Entry age is calculated as the age at the valuation date minus Eligibility Service.
Decrement Timing: All decrements – mortality, service retirement, disability retirement, and termination of employment for reasons other than death or retirement – are assumed to occur at the middle of the valuation year.
Mortality Decrements:
Service Retirees, Beneficiaries, and Inactive Members 2017 State Retirees of Texas (SRT) mortality table. Generational mortality improvements in accordance with the ultimate rates from the scale most recently published by Retirement Plans Experience Committee of the Society of Actuaries (“Scale U-MP”) and projected from the year 2017. Sample rates for the base mortality table included below.

Judicial Retirement System of Texas, Plan 1 C - 3
Active Members RP-2014 Active Member Mortality table. Generational mortality improvements in accordance with Scale U-MP are projected from the year 2014.
Disability Retirees RP-2014 Disabled Retiree Mortality. Generational mortality improvements in accordance with Scale U-MP are projected from the year 2014.

Judicial Retirement System of Texas, Plan 1 C - 4
Service Retirement Decrements: Graded tables based on JRS-1 and JRS-2 experience.
Eligibility Service is used to determine when the rates apply:
Age 65 with ten years of service, if member currently holding judicial office
Age 65 with twelve years of service
Twenty years of service
Age plus service equal to or greater than 70, if member has at least twelve years of service on an appellate court
Members are assumed to retire when they are projected to have accrued the maximum benefit of 90% of applicable salary, regardless of whether the member elects to continue contributing.
Disability Retirement Decrements: Graded Tables Based on ERS Experience
The rates do not apply before someone is eligible for the benefit.
No occupational disabilities are assumed for the elected class or judges.
Eight years of service is required for non-occupational disability retirement.
Non-occupational disability rates are assumed to be zero once the member has attained service retirement eligibility.
Sample rates for eligible members:
99% of the disability rates stated above are assumed to be attributable to nonoccupational disabilities and 1% are assumed to be attributable to occupational disabilities. No occupational disabilities are assumed for judges.
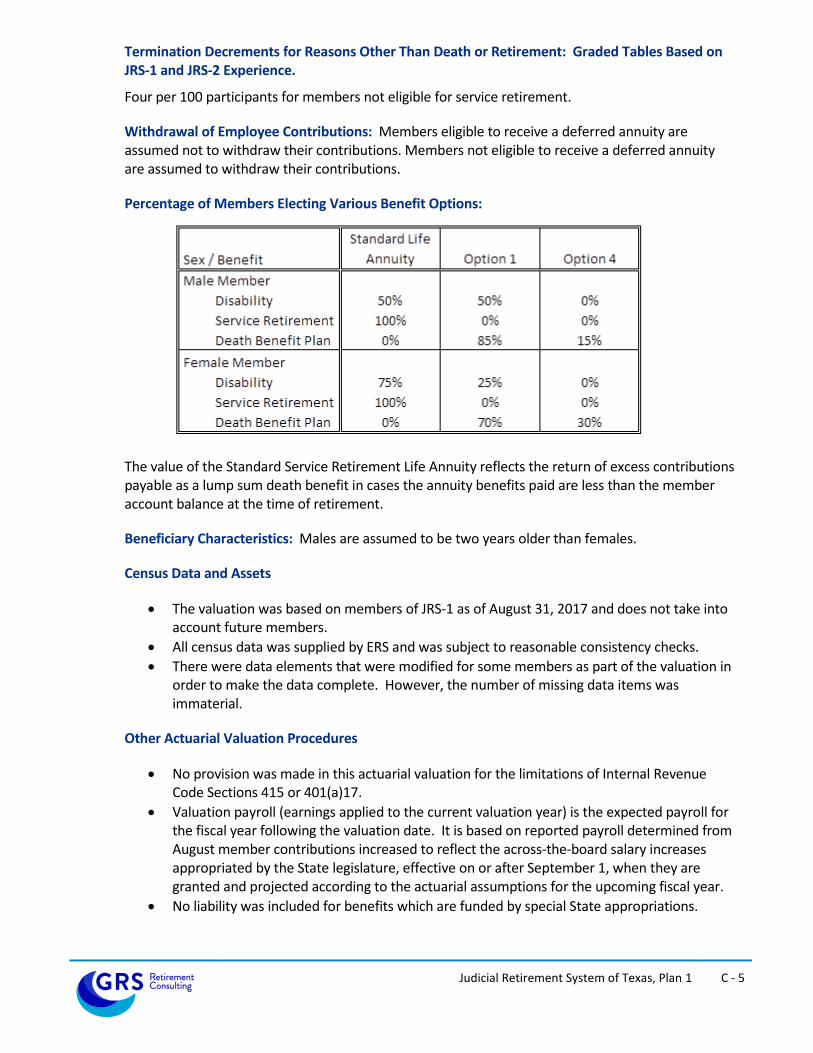
Judicial Retirement System of Texas, Plan 1 C - 5
Termination Decrements for Reasons Other Than Death or Retirement: Graded Tables Based on JRS-1 and JRS-2 Experience.
Four per 100 participants for members not eligible for service retirement.
Withdrawal of Employee Contributions: Members eligible to receive a deferred annuity are assumed not to withdraw their contributions. Members not eligible to receive a deferred annuity are assumed to withdraw their contributions.
Percentage of Members Electing Various Benefit Options:
The value of the Standard Service Retirement Life Annuity reflects the return of excess contributions payable as a lump sum death benefit in cases the annuity benefits paid are less than the member account balance at the time of retirement.
Beneficiary Characteristics: Males are assumed to be two years older than females.
Census Data and Assets
The valuation was based on members of JRS-1 as of August 31, 2017 and does not take into account future members.
All census data was supplied by ERS and was subject to reasonable consistency checks.
There were data elements that were modified for some members as part of the valuation in order to make the data complete. However, the number of missing data items was immaterial.
Other Actuarial Valuation Procedures
No provision was made in this actuarial valuation for the limitations of Internal Revenue Code Sections 415 or 401(a)17.
Valuation payroll (earnings applied to the current valuation year) is the expected payroll for the fiscal year following the valuation date. It is based on reported payroll determined from August member contributions increased to reflect the across-the-board salary increases appropriated by the State legislature, effective on or after September 1, when they are granted and projected according to the actuarial assumptions for the upcoming fiscal year.
No liability was included for benefits which are funded by special State appropriations.
6
SECTION D
SUMMARY OF MEMBERSHIP DATA

Judicial Retirement System of Texas, Plan 1 D - 1
Summary of Membership Data
Item Male Female Total
Number of Members 9 0 9
Average Annual Salaries 147,778$ N/A 147,778$
Average Age 70.7 N/A 70.7
Average Service 30.4 N/A 30.4
Item Number
Annual
Annuities
Average
Annuities
Average
Age
Participants with Deferred Benefits 0 0$ N/A N/A
Service Retirees 230 16,767,408$ 72,902 79.1
Beneficiaries 125 6,752,352$ 54,019 82.9
Disability Retirees 0 0$ N/A N/A
Total 355 23,519,760$ 66,253$ 80.4
Item Number
Account
Balances
Average
Account
Balance
Average
Age
Non-vested Participants 0 0$ N/A N/A
Inactive Members
Non-vested Members
Active Members

2
SECTION E
GLOSSARY

Judicial Retirement System of Texas, Plan 1 E - 1
Glossary
Actuarial Accrued Liability (AAL): That portion, as determined by a particular Actuarial Cost Method, of the Actuarial Present Value of Future Plan Benefits which is not provided for by future Normal Costs. It is equal to the Actuarial Present Value of Future Plan Benefits minus the actuarial present value of future Normal Costs. Actuarial Assumptions: Assumptions as to future experience under the Fund. These include assumptions about the occurrence of future events affecting costs or liabilities, such as:
mortality, withdrawal, disablement, and retirement;
future increases in salary;
future rates of investment earnings and future investment and administrative expenses;
characteristics of members not specified in the data, such as marital status;
characteristics of future members;
future elections made by members; and
other relevant items. Actuarial Cost Method or Funding Method: A procedure for allocating the Actuarial Present Value of Future Benefits to various time periods; a method used to determine the Normal Cost and the Actuarial Accrued Liability. These items are used to determine the ADC. Actuarial Gain or Actuarial Loss: A measure of the difference between actual experience and that expected based upon a set of Actuarial Assumptions, during the period between two Actuarial Valuation dates. Through the actuarial assumptions, rates of decrements, rates of salary increases, and rates of fund earnings have been forecasted. To the extent that actual experience differs from that assumed, Actuarial Accrued Liabilities emerge which may be the same as forecasted, or may be larger or smaller than projected. Actuarial gains are due to favorable experience, e.g., the Fund's assets earn more than projected, salaries do not increase as fast as assumed, members retire later than assumed, etc. Favorable experience means actual results produce actuarial liabilities not as large as projected by the actuarial assumptions. On the other hand, actuarial losses are the result of unfavorable experience, i.e., actual results that produce actuarial liabilities which are larger than projected. Actuarial gains will shorten the time required for funding of the actuarial balance sheet deficiency while actuarial losses will lengthen the funding period. Actuarially Equivalent: Of equal actuarial present value, determined as of a given date and based on a given set of Actuarial Assumptions. Actuarial Present Value (APV): The value of an amount or series of amounts payable or receivable at various times, determined as of a given date by the application of a particular set of Actuarial Assumptions. For purposes of this standard, each such amount or series of amounts is:
a. adjusted for the probable financial effect of certain intervening events (such as changes in compensation levels, marital status, etc.),
b. multiplied by the probability of the occurrence of an event (such as survival, death, disability, termination of employment, etc.) on which the payment is conditioned, and
c. discounted according to an assumed rate (or rates) of return to reflect the time value of money.

Judicial Retirement System of Texas, Plan 1 E - 2
Actuarial Present Value of Future Plan Benefits: The Actuarial Present Value of those benefit amounts which are expected to be paid at various future times under a particular set of Actuarial Assumptions, taking into account such items as the effect of advancement in age and past and anticipated future compensation and service credits. The Actuarial Present Value of Future Plan Benefits includes the liabilities for active members, retired members, beneficiaries receiving benefits, and inactive, nonretired members either entitled to a refund or a future retirement benefit. Expressed another way, it is the value that would have to be invested on the valuation date so that the amount invested plus investment earnings would be provide sufficient assets to pay all projected benefits and expenses when due. Actuarial Valuation: The determination, as of a valuation date, of the Normal Cost, Actuarial Accrued Liability, Actuarial Value of Assets, and related Actuarial Present Values for a plan. An Actuarial valuation for a governmental retirement system typically also includes calculations of items needed for compliance with GASB. Actuarial Value of Assets or Valuation Assets: The value of the Fund’s assets as of a given date, used by the actuary for valuation purposes. This may be the market or fair value of plan assets, but commonly actuaries use a smoothed value in order to reduce the year-to-year volatility of calculated results, such as the funded ratio and the ADC. Actuarially Determined: Values which have been determined utilizing the principles of actuarial science. An actuarially determined value is derived by application of the appropriate actuarial assumptions to specified values determined by provisions of the law. Amortization Method: A method for determining the Amortization Payment. The most common methods used are level dollar and level percentage of payroll. Under the Level Dollar method, the Amortization Payment is one of a stream of payments, all equal, whose Actuarial Present Value is equal to the UAAL. Under the Level Percentage of Pay method, the Amortization payment is one of a stream of increasing payments, whose Actuarial Present Value is equal to the UAAL. Under the Level Percentage of Pay method, the stream of payments increases at the assumed rate at which total covered payroll of all active members will increase. Amortization Payment: That portion of the pension plan contribution or ADC which is designed to pay interest on and to amortize the Unfunded Actuarial Accrued Liability. Actuarially Determined Contribution (ADC) or Annual Required Contribution (ARC): A calculated contribution for a defined benefit pension plan for the reporting period, most often determined based on the funding policy of the plan. Typically the calculated contribution has a normal cost payment and an amortization payment. Closed Amortization Period: A specific number of years that is counted down by one each year and therefore declines to zero with the passage of time. For example if the amortization period is initially set at 30 years, it is 29 years at the end of one year, 28 years at the end of two years, etc. See Funding Period and Open Amortization Period. Decrements: Those causes/events due to which a member’s status (active-inactive-retiree-beneficiary) changes, that is: death, retirement, disability, or termination.

Judicial Retirement System of Texas, Plan 1 E - 3
Defined Benefit Plan: An employer-sponsored retirement benefit that provides workers, upon attainment of designated age and service thresholds, with a monthly benefit based on the employee’s salary and length of service. The value of a benefit from a defined benefit plan is generally not affected by the return on the assets that are invested to fund the benefit. Defined Contribution Plan: A retirement plan, such as a 401(k) plan, a 403(b) plan, or a 457 plan, in which the contributions to the plan are assigned to an account for each member, and the plan’s earnings are allocated to each account, and each member’s benefits are a direct function of the account balance. Employer Normal Cost: The portion of the Normal Cost to be paid by the employers. This is equal to the Normal Cost less expected member contributions. Experience Study: A periodic review and analysis of the actual experience of the Fund which may lead to a revision of one or more actuarial assumptions. Actual rates of decrement and salary increases are compared to the actuarially assumed values and modified as deemed appropriate by the Actuary. Funded Ratio: The ratio of the actuarial value of assets (AVA) to the actuarial accrued liability (AAL). Plans sometimes calculate a market funded ratio, using the market value of assets (MVA), rather than the AVA. Funding Period or Amortization Period: The term “Funding Period” is used it two ways. In the first sense, it is the period used in calculating the Amortization Payment as a component of the ADC. This funding period is chosen by the Board of Trustees. In the second sense, it is a calculated item: the number of years in the future that will theoretically be required to amortize (i.e., pay off or eliminate) the Unfunded Actuarial Accrued Liability, based on the statutory employer contribution rate, and assuming no future actuarial gains or losses. GASB: The Governmental Accounting Standards Board is an organization that exists in order to promulgate accounting standards for governmental entities. Normal Cost: That portion of the Actuarial Present Value of pension plan benefits and expenses which is allocated to a valuation year by the Actuarial Cost Method. Any payment in respect of an Unfunded Actuarial Accrued Liability is not part of Normal Cost (see Amortization Payment). For pension plan benefits which are provided in part by employee contributions, Normal Cost refers to the total of employee contributions and employer Normal Cost unless otherwise specifically stated. Under the entry age normal cost method, the Normal Cost is intended to be the level cost (when expressed as a percentage of pay) needed to fund the benefits of a member from hire until ultimate termination, death, disability or retirement. Open Amortization Period: An open amortization period is one which is used to determine the Amortization Payment but which does not change over time. In other words, if the initial period is set as 30 years, the same 30-year period is used in determining the Amortization Period each year. In theory, if an Open Amortization Period is used to amortize the Unfunded Actuarial Accrued Liability, the UAAL will never completely disappear, but will become smaller each year, either as a dollar amount or in relation to covered payroll. Unfunded Actuarial Accrued Liability: The excess of the Actuarial Accrued Liability over the Actuarial Value of Assets. This value may be negative in which case it may be expressed as a negative Unfunded Actuarial Accrued Liability, also called the Funding Surplus.

Judicial Retirement System of Texas, Plan 1 E - 4
Valuation Date or Actuarial Valuation Date: The date as of which the value of assets is determined and as of which the Actuarial Present Value of Future Plan Benefits is determined. The expected benefits to be paid in the future are discounted to this date.