acute cognitive deficits after traumatic brain injury
TRANSCRIPT

ORIGINAL ARTICLE
Acute cognitive deficits after traumatic brain injurypredict Alzheimer’s disease-like degradation of the humandefault mode network
Andrei Irimia & Alexander S. Maher &
Nikhil N. Chaudhari & Nahian F. Chowdhury &
Elliot B. Jacobs &
the Alzheimer’s Disease Neuroimaging Initiative
Received: 9 June 2020 /Accepted: 29 July 2020# American Aging Association 2020
Abstract Traumatic brain injury (TBI) and Alzheimer’sdisease (AD) are prominent neurological conditions whoseneural and cognitive commonalities are poorly understood.The extent of TBI-related neurophysiological abnormali-ties has been hypothesized to reflect AD-like neurodegen-eration because TBI can increase vulnerability to AD.However, it remains challenging to prognosticate AD riskpartly because the functional relationship between acuteposttraumatic sequelae and chronic AD-like degradationremains elusive. Here, functional magnetic resonance im-aging (fMRI), network theory, andmachine learning (ML)
are leveraged to study the extent to which geriatric mildTBI (mTBI) can lead to AD-like alteration of resting-stateactivity in the default mode network (DMN). This networkis found to contain modules whose extent of AD-like,posttraumatic degradation can be accurately prognosticat-ed based on the acute cognitive deficits of geriatric mTBIpatients with cerebral microbleeds. Aside from establish-ing a predictive physiological association between geriatricmTBI, cognitive impairment, and AD-like functional deg-radation, these findings advance the goal of acutely fore-casting mTBI patients’ chronic deviations from normalityalong AD-like functional trajectories. The association ofgeriatric mTBI with AD-like changes in functional brainconnectivity as early as ~6 months post-injury carriessubstantial implications for public health because TBIhas relatively high prevalence in the elderly.
Keywords Alzheimer’s disease . Traumatic braininjury .Defaultmodenetwork .Resting state .Geriatrics .
Functional connectome
Introduction
Traumatic brain injury (TBI) can result in functionalbrain alterations causing neural and cognitive deficits[1, 2]. Even after mild TBI (mTBI), any cognitivedomain can be affected by such deficits [3], whosemanifestation may accelerate the onset of mild cognitiveimpairment (MCI) [4, 5], particularly in geriatric pa-tients [6]. Although neurotrauma increases the risk for
https://doi.org/10.1007/s11357-020-00245-6
Andrei Irimia and Alexander S. Maher contributed equally to thiswork.
Data used in preparation of this article were obtained from theAlzheimer’s Disease Neuroimaging Initiative (ADNI) database(adni.loni.usc.edu). As such, the investigators within the ADNIcontributed to the design and implementation of ADNI and/orprovided data but did not participate in the analysis or writing ofthis report. A complete listing of ADNI investigators can be foundat: http://adni.loni.usc.edu/wp-content/uploads/how_to_apply/ADNI_Acknowledgement_List.pdf
A. Irimia :A. S. Maher :N. N. Chaudhari :N. F. Chowdhury : E. B. JacobsEthel Percy Andrus Gerontology Center, Leonard Davis School ofGerontology, University of Southern California, Los Angeles, CA,USA
A. Irimia (*)Denney Research Center, Department of Biomedical Engineering,Viterbi School of Engineering, University of Southern California,Los Angeles, CA, USAe-mail: [email protected]
GeroScience (2020) 42:1411–1429
/Published online: 2 August 2020

Alzheimer’s disease (AD) [7], there is little knowledgeon how TBI affects functional trajectories and gives riseto neuropathophysiology. Furthermore, the relationshipbetween TBI severity and AD-like brain dysfunction ispoorly understood, and the mechanisms whereby TBIcan elicit functional abnormalities which increase ADrisk remains unclear. One hypothesis is that posttrau-matic functional changes exhibit patterns which pro-gressively resemble those of AD [5, 8, 9]; if this is thecase, characterizing AD-like brain alterations after TBIcould assist in improving AD risk assessment and theearly identification of TBI patients at higher risk for thisdisease.
The default mode network (DMN) is a large-scalebrain network which is most commonly active when aperson is at wakeful rest [10]. In this resting state (RS),individuals lie quietly awake without performing tasks orbeing exposed to stimuli, and their DMN activity can berecorded using techniques like functional magnetic reso-nance imaging (fMRI). RS fMRI recordings only requirepassive participation from study participants, such thatthe prospect of isolating AD prognosticators from suchdata is logistically and clinically appealing. AlthoughDMN alterations have been quantified in both AD andTBI [11–13], whether and how posttraumatic DMN ab-normalities reflect AD-like functional degradation re-mains unknown. Because the DMN includes some ofthe longest white matter tracts in the brain (includingtracts which integrate brain activity across the corpuscallosum) [14], this network is particularly vulnerable todiffuse axonal injury after trauma [15]. Thus, studyingTBI-related alterations in the DMN of subjects withcerebral microbleeds (CMBs, which are biomarkers ofnon-focal axonal injury [16])—as opposed to changes inother, less broadly distributed networks—is attractive. Toidentify posttraumatic biomarkers of AD risk, focusingon mTBI is appealing because the mTBI population isconsiderably larger, more homogeneous, and logisticallyeasier to study than that of patients with moderate-to-severe TBI. Additionally, geriatric TBI is a promisingsetting for studying how this condition can lead to AD-like neural degradation because the comparison of ADpatients to young or middle-aged TBI patients is con-founded by aging effects.
This study leverages fMRI recordings acquired fromhealthy controls (HCs), geriatric mTBI participants withCMBs, and AD patients to provide evidence that, within~ 6 months post-mTBI, functional connectivity (FC)within the DMN exhibits deviations from normality
whose spatiotemporal properties are statistically indis-tinguishable from those of similar deviations observedin AD. A linear combination of acute posttraumaticcognitive scores is found to be significantly and sensi-tively associated with chronic AD-like RS DMN alter-ations. Additionally, a supervised machine learning(ML) classifier is found to accurately identify mTBIpatients with relatively broad chronic abnormalities inthe DMN based on acute cognitive performance. Thesefindings establish a detailed functional and connectomicrelationship between mTBI-related acute cognition andAD-like DMN features, whose further characterizationmay facilitate the early identification of geriatric mTBIpatients with CMBs at relatively high risk for AD.
Methods
Participants
This study was conducted with the Institutional ReviewBoard approval. Included were one HC group (N1 = 48,22 females; age: μ = 69 y, σ = 5 y, range: 58–79 y) andtwo study groups: geriatric mTBI (N2 = 29, 13 females;age:μ = 68 y,σ = 6 y; range: 57–79 y) and AD (N3 = 37,19 females; age: μ = 70 y, σ = 8 y; range: 55–84 y). HCand AD subjects were selected from the AD Neuroim-aging Initiative (ADNI) cohort, whose eligibility criteriaare described elsewhere [17]. A total of 15 HC volun-teers (31%), 9 TBI participants (38%), and 17 ADpatients (46%) were hypertensive. Some ADNI partici-pants were receiving hormonal treatment (HC:N = 14 or29%; AD:N = 9 or 24%); somewere taking medicationsfor neurological and/or psychiatric disease (HC: N = 20or 42%; TBI: N = 18 or 62%; AD: N = 36 or 97%),vascular disease (HC: N = 29 or 60%; TBI: N = 19 or65%; AD: N = 22 or 59%), or metabolic disease (HC:N = 6 or 13%; TBI: N = 3 or 10%; AD: N = 5 or 14%).To be included, all participants had to have MontrealCognitive Assessment (MoCA) scores and a completesession of RS fMRI data. HC participants had beenclinically evaluated as having normal cognition; theirMoCA scores ranged from 22 to 29 (μ = 26, σ = 2). ADpatients’ scores ranged from 6 to 25 (μ = 17, σ = 5), andall had a clinical AD diagnosis; TBI participants’ scoreswere acquired within 48 h post-injury and were between20 and 29 (μ = 23, σ = 2). The Mini-Mental State Ex-amination (MMSE) scores were available for both HC(μ = 29, σ = 1; range: 26 to 30), TBI volunteers (μ = 22,
GeroScience (2020) 42:1411–14291412

σ = 7; range: 13 to 29), and AD participants (μ = 20,σ = 5; range: 9 to 28). AD patients had Clinical Demen-tia Rating (CDR) sub-scores between 2 and 17 (μ = 6,σ = 4), while HCs had CDR sub-scores between 0 and 2(μ = 1, σ = 0.7); CDR scores were not available for TBIparticipants. For HCs, the number of apolipoprotein E(ApoE) ε4 alleles was zero for 54% of the sample, onefor 31%, and two for 15%. For AD patients, 24% had noε4 alleles, 46% had one, and 30% had two. No ApoEallele information was available for TBI participants.TBIvolunteershad fMRI recordingsacquired~6monthspost-injury (μ = 5.6 months, σ = 0.5 months) at 3 T, i.e.,the same scanner field strength as the HC and ADparticipants. They had to have (a) a TBI due to a fall,(b) no clinical findings on acute T1/T2-weighted MRI,(c) no clinical findings other than CMBs onsusceptibility-weighted imaging (SWI), (d) an acuteGlasgow Coma Scale score greater than 12 (μ = 13.7,σ = 0.5) upon initial medical examination, (e) loss ofconsciousness of fewer than 30 min (μ ≃ 4 min, σ ≃8 min), (f) posttraumatic amnesia of fewer than 24 h (μ≃ 3.5 h, σ ≃ 3.2 h), and (g) a lack of clinical historyinvolving pre-traumatic neurological disease, psychiat-ric disorder, or drug/alcohol abuse. CMBs were identi-fied in each subject using an automatic algorithm forCMB segmentation [18] and the validity of the findingswere confirmed by two human experts with training inCMB identification from SWI, who had been blinded toautomatic segmentation results. Disagreements betweenthese experts were resolved by a third one (AI). Nullhypotheses of group differences in age and cognitionwere tested using Welch’s two-tailed t test for sampleswith unequal variances. The null hypothesis of indepen-dence between sex and group membership was testedusing Pearson’s χ2 test. Effect sizes were quantifiedusing Cohen’s d for Welch’s t test and the ϕ coefficientfor Pearson’s χ2 test.
Neuroimaging
HC and AD participant data used in the preparation ofthis article were obtained from the Alzheimer’s DiseaseNeuroimaging Initiative (ADNI) database (http://adni.loni.usc.edu). ADNI was launched in 2003 as a public-private partnership, led by Principal Investigator Mi-chael W. Weiner, MD. The primary goal of ADNI hasbeen to test whether serial MRI, positron emission to-mography (PET), other biological markers, and clinicaland neuropsychological assessment can be combined to
measure the progression of MCI and early AD. For up-to-date information, see www.adni-info.org. fMRIvolumes were acquired at 3 T using the ADNIacquisition protocol [19]. An average of 140 fMRIvolumes was obtained using the following parameters:TR = 3 s; TE = 30 ms; flip angle = 80°; slicethickness ≃ 3.3 mm; 48 slices). TBI subjects’ fMRIdata were acquired in a Siemens Trio TIM 3 T scannerusing an acquisition protocol very similar to the ADNIprotocol.
Preprocessing
fMRI analysis was implemented using the FreeSurfer(FS) Functional Analysis Stream (FS-FAST,https://surfer.nmr.mgh.harvard.edu/fswiki/FsFast) withdefault parameters for (a) motion correction, (b) framecensoring, (c) frequency filtering, (d) brain masking, (e)intensity normalization, (f) co-registration of fMRI vol-umes to T1-weighted volumes, (g) surface sampling tothe FS atlas, (h) smoothing (kernel with full width of5 mm at half maximum), (i) surface and volume sam-pling to the Montreal Neurological Institute (MNI) atlascontaining 305 subjects, and (j) smoothing for subcorti-cal structure analysis. The first four volumes in eachfMRI time series were discarded to preserve signalequilibrium and to account for each participant’s adap-tation to the sequence; the rest were used for analysis[20]. Nuisance variables (cerebrospinal fluid, white mat-ter, and motion correction parameters) were accountedfor using FS-FAST.
fMRI seeds
Seeds were derived in a two-step process. In the firststep, the cortical delineation of the DMN defined byYeo et al. [14] was used to parcel the cortex. Thisdelineation includes the following cortical regions: (a)frontal (prefrontal cortex, precentral ventral cortex, an-terior cingulate cortex, etc.), (b) medial temporal/retrosplenial (the parahippocampal complex), (c) later-al temporal (the inferior temporal gyrus and superiortemporal sulcus), (d) lateral parietal (inferior parietal,intraparietal regions, etc.), and (e) medial parietal/posterior cingulate (posterior cingulate cortex and partof the precuneus). In the second step, Yeo regions weredivided into gyral/sulcal parcels based on the intersec-tion of the Yeo regions with the cortical parcellationscheme of Destrieux et al. [21]. In other words, the final
GeroScience (2020) 42:1411–1429 1413
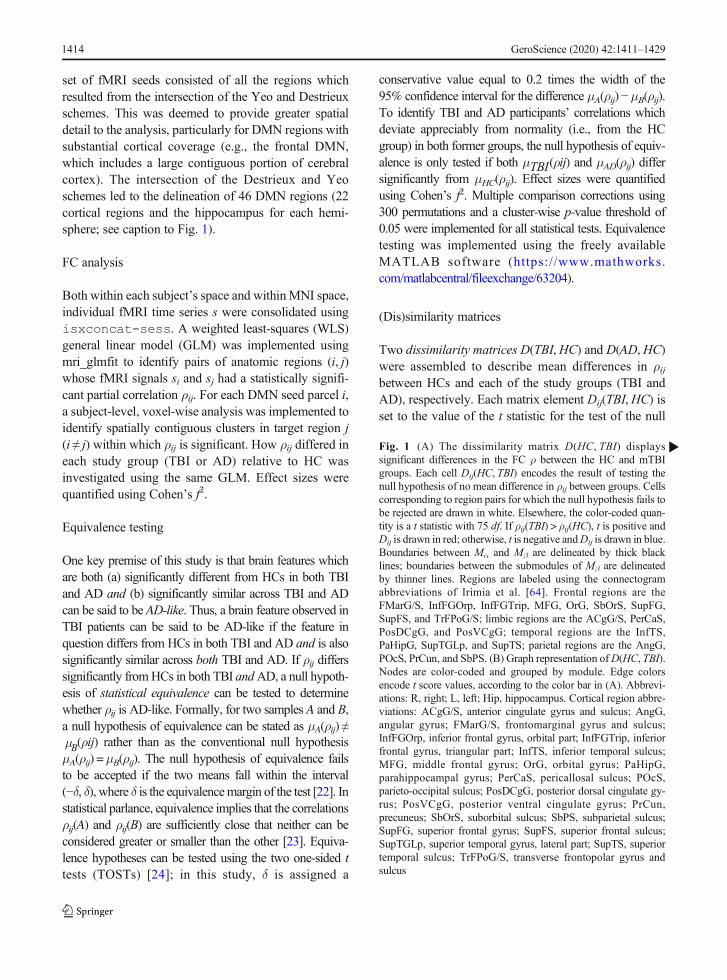
set of fMRI seeds consisted of all the regions whichresulted from the intersection of the Yeo and Destrieuxschemes. This was deemed to provide greater spatialdetail to the analysis, particularly for DMN regions withsubstantial cortical coverage (e.g., the frontal DMN,which includes a large contiguous portion of cerebralcortex). The intersection of the Destrieux and Yeoschemes led to the delineation of 46 DMN regions (22cortical regions and the hippocampus for each hemi-sphere; see caption to Fig. 1).
FC analysis
Both within each subject’s space and withinMNI space,individual fMRI time series s were consolidated usingisxconcat-sess. A weighted least-squares (WLS)general linear model (GLM) was implemented usingmri_glmfit to identify pairs of anatomic regions (i, j)whose fMRI signals si and sj had a statistically signifi-cant partial correlation ρij. For each DMN seed parcel i,a subject-level, voxel-wise analysis was implemented toidentify spatially contiguous clusters in target region j(i ≠ j) within which ρij is significant. How ρij differed ineach study group (TBI or AD) relative to HC wasinvestigated using the same GLM. Effect sizes werequantified using Cohen’s f2.
Equivalence testing
One key premise of this study is that brain features whichare both (a) significantly different from HCs in both TBIand AD and (b) significantly similar across TBI and ADcan be said to be AD-like. Thus, a brain feature observed inTBI patients can be said to be AD-like if the feature inquestion differs from HCs in both TBI and AD and is alsosignificantly similar across both TBI and AD. If ρij differssignificantly fromHCs in both TBI andAD, a null hypoth-esis of statistical equivalence can be tested to determinewhether ρij is AD-like. Formally, for two samples A and B,a null hypothesis of equivalence can be stated as μA(ρij) ≠μB(ρij) rather than as the conventional null hypothesisμA(ρij) =μB(ρij). The null hypothesis of equivalence failsto be accepted if the two means fall within the interval(−δ, δ), where δ is the equivalencemargin of the test [22]. Instatistical parlance, equivalence implies that the correlationsρij(A) and ρij(B) are sufficiently close that neither can beconsidered greater or smaller than the other [23]. Equiva-lence hypotheses can be tested using the two one-sided ttests (TOSTs) [24]; in this study, δ is assigned a
conservative value equal to 0.2 times the width of the95% confidence interval for the difference μA(ρij)−μB(ρij).To identify TBI and AD participants’ correlations whichdeviate appreciably from normality (i.e., from the HCgroup) in both former groups, the null hypothesis of equiv-alence is only tested if both μTBI(ρij) and μAD(ρij) differsignificantly from μHC(ρij). Effect sizes were quantifiedusing Cohen’s f2. Multiple comparison corrections using300 permutations and a cluster-wise p-value threshold of0.05 were implemented for all statistical tests. Equivalencetesting was implemented using the freely availableMATLAB software (https://www.mathworks.com/matlabcentral/fileexchange/63204).
(Dis)similarity matrices
Two dissimilarity matrices D(TBI,HC) and D(AD,HC)were assembled to describe mean differences in ρijbetween HCs and each of the study groups (TBI andAD), respectively. Each matrix element Dij(TBI,HC) isset to the value of the t statistic for the test of the null
Fig. 1 (A) The dissimilarity matrix D(HC, TBI) displayssignificant differences in the FC ρ between the HC and mTBIgroups. Each cell Dij(HC, TBI) encodes the result of testing thenull hypothesis of no mean difference in ρij between groups. Cellscorresponding to region pairs for which the null hypothesis fails tobe rejected are drawn in white. Elsewhere, the color-coded quan-tity is a t statistic with 75 df. If ρij(TBI) > ρij(HC), t is positive andDij is drawn in red; otherwise, t is negative andDij is drawn in blue.Boundaries between Mα and Mβ are delineated by thick blacklines; boundaries between the submodules of Mβ are delineatedby thinner lines. Regions are labeled using the connectogramabbreviations of Irimia et al. [64]. Frontal regions are theFMarG/S, InfFGOrp, InfFGTrip, MFG, OrG, SbOrS, SupFG,SupFS, and TrFPoG/S; limbic regions are the ACgG/S, PerCaS,PosDCgG, and PosVCgG; temporal regions are the InfTS,PaHipG, SupTGLp, and SupTS; parietal regions are the AngG,POcS, PrCun, and SbPS. (B) Graph representation ofD(HC, TBI).Nodes are color-coded and grouped by module. Edge colorsencode t score values, according to the color bar in (A). Abbrevi-ations: R, right; L, left; Hip, hippocampus. Cortical region abbre-viations: ACgG/S, anterior cingulate gyrus and sulcus; AngG,angular gyrus; FMarG/S, frontomarginal gyrus and sulcus;InfFGOrp, inferior frontal gyrus, orbital part; InfFGTrip, inferiorfrontal gyrus, triangular part; InfTS, inferior temporal sulcus;MFG, middle frontal gyrus; OrG, orbital gyrus; PaHipG,parahippocampal gyrus; PerCaS, pericallosal sulcus; POcS,parieto-occipital sulcus; PosDCgG, posterior dorsal cingulate gy-rus; PosVCgG, posterior ventral cingulate gyrus; PrCun,precuneus; SbOrS, suborbital sulcus; SbPS, subparietal sulcus;SupFG, superior frontal gyrus; SupFS, superior frontal sulcus;SupTGLp, superior temporal gyrus, lateral part; SupTS, superiortemporal sulcus; TrFPoG/S, transverse frontopolar gyrus andsulcus
b
GeroScience (2020) 42:1411–14291414

GeroScience (2020) 42:1411–1429 1415
hypothesis ρij(TBI) − ρij(HC) = 0, and a similar proce-dure is used forDij(AD,HC). A similarity matrix S(TBI,AD) was also calculated to describe significant statisticalequivalences of ρij across study groups. Each matrixelement Sij is set to the TOST t statistic which had thesmallest magnitude.
Network analysis
To investigate DMN-related commonalities and differ-ences between TBI and AD, three analyses were carriedout. The first two involved studying D(HC, TBI) andD(HC, AD) to group DMN nodes based on how TBImodulated their correlation differences relative to HCsand ADs, respectively. The third one examined S(TBI,AD) to identify DMN nodes affected equivalently inboth TBI and AD. To identify network modules, theLouvain algorithm for community detection [25] wasapplied 100 times for each matrix to identify modulepartitions. The symmetric reverse Cuthill-McKee(RCM) ordering [26] of each module was then calculat-ed to rearrange nodes within each module. This methodpermutes the rows and columns of a symmetric sparsematrix to form a band matrix with minimal bandwidth,i.e., whose nonzero elements are optimally close to thediagonal. The algorithm identifies a pseudo-peripheralvertex of the network, and then utilizes a breadth-firstsearch to order vertices by decreasing distance from thepseudo-peripheral vertex. When applied to each moduleof S, such blocks are arranged along the main diagonaland produce a visual representation which facilitatesmodule inspection and analysis. Network analysis wasimplemented using the freely available Brain Connec-tivity Toolbox (sites.google.com/site/bctnet).
Network randomization
To determine whether modules’ node membershipswere dependent upon the DMN parcellation schemeused in the study, the DMN was reparcelled randomly100 times to generate alternative parcellations whichhad the same number of nodes as the original DMNbut different cortical patches corresponding to eachnode. An approach similar to those of Gordon et al.[27] and Irimia and Van Horn [28] was used to obtainrandomized parcellations of the DMN. Briefly, randompoints within the cortical coverage of the DMN wereselected. From these seeds, parcels were simultaneouslyexpanded outward on the cortical mesh until they met
either other parcels or the boundary of the DMN. Theprocedure for identifying network modules was imple-mented for each randomized parcellation, and the mod-ularity structure of the network was found each time byapplying the Louvain algorithm 100 times to each ma-trix. The spatial overlap between each original moduleand the randomized modules was quantified using theSorensen-Dice coefficient [29].
Acute cognitive impairment vs. chronic brain function
A multivariate regression analysis was implemented tostudy the relationship between TBI patients’ acute Mo-CA scores and the number of their chronic FCs whichwere statistically equivalent to those of AD patients. Thelatter involved region pairs with the largest absolutevalues of Sij (highest similarity across TBI and AD):(a) the right superior temporal sulcus and the rightanterior cingulate gyrus/sulcus, (b) the left and rightsuperior frontal gyri, (c) the left hippocampus and supe-rior temporal sulcus, and (d) the left middle frontal gyrusand the ventral part of the posterior cingulate gyrus. Thepredictor variables were the entries in S associated withthese region pairs, and the response variable was theMoCA score. Sex, age at MRI acquisition, and educa-tional attainment were included as covariates. Cohen’sf2 was used as a measure of effect size and the nullhypothesis of overall regression was tested using Fish-er’s F test [30]. To confirm and to broaden regressionfindings, a support vector machine (SVM) was imple-mented in MATLAB (http://mathworks.com) withdefault parameters and using the iterative single dataalgorithm (ISDA), a linear kernel function, and aheuristically assigned kernel scale parameter. TheSVM was trained and cross-validated tenfold to distin-guish (a) TBIs with relatively moderate AD-like DMNdeviations from normality (i.e., with 7 or fewer statisti-cal equivalences across TBI and AD) from other TBIsand also (b) TBIs with relatively extensive abnormalities(i.e., with at least 15 equivalences) from other TBIs. LetNE be the number of significant equivalences identified(NE = 22 here, see Fig. 3). Then the threshold values of 7and 15 correspond to ⌊NE/3⌋ and ⌈2NE/3⌉, respectively(Fig. 3). For the SVM, the number of true negatives(TNs), true positives (TPs), false negatives (FNs), andfalse positives (FPs) was computed, as were the truepositive rate (TPR, or sensitivity), true negative rate(TNR, or specificity), positive prediction value (PPV,or precision) and Matthews’ correlation coefficient
GeroScience (2020) 42:1411–14291416

(MCC) [31]. Regression and SVM analyses were im-plemented in MATLAB using the glmfit, fitcsvm,and predict functions.
Visualization
Matrices were visualized to identify and examine DMNmodules (Fig. 1, Fig. 2, and Fig. 3). Matrix entries werethresholded by statistical significance; for example, if ρijdoes not differ significantly between the groups com-pared, the cell for Dij is drawn in white. Similarly, if ρijdoes not differ significantly between TBI and AD, andthe cell for Sij is also drawn in white. For statisticallysignificant results, dissimilarity matrix cells are drawn ineither red or blue, depending on their sign (see thecaption to Fig. 3). To facilitate inspection, the corticalregions within each module were drawn on an averageatlas representation of the brain. Graph representationsof each functional correlation matrix were also generat-ed using Gephi software (http://gephi.org). In these,each region’s node was depicted as a circle whosediameter was proportional to the number of corticalregions to which the region represented by the nodewas functionally connected. Similarly, edges werecolored using shades of blue or red to reflect the tscore of lowest magnitude associated with the TOSTsfor statistical equivalence testing.
Results
Demographics
Three cohorts were studied: HC participants (48 sub-jects, 22 females; age μ ± σ = 69 ± 5 years (y)), geriatricmTBI subjects with CMBs (29 subjects, 13 females; 68± 6 y), and AD patients (37 subjects, 18 females; 74 ± 8y). Further demographic descriptors are provided in the“Methods” section. CMB counts were found to rangefrom 0 to 43 (μ ± σ = 13 ± 9) in HCs, from 0 to 89 (μ± σ = 17 ± 14) in mTBI volunteers, and from 0 to 6 (μ± σ = 1.0� 1:7
1:0) in AD patients. No significant differ-ences in mean age were found between HC and TBIparticipants (t = 0.52, df = 47, p = 0.60, Cohen’s d =0.36), between HC and AD volunteers (t = − 0.95, df =55, p = 0.17, Cohen’s d = 0.16), or between TBI and ADpatients (t = − 1.24, df = 64, p = 0.11, Cohen’s d = 0.46).No significant differences in sex ratios were found
across groups (χ2 = 0.22, df = 1, p = 0.90, ϕ = 0.09).Significant differences in MoCA scores were foundbetween HC and acute TBI participants (t = 5.7, df =50, p < 0.001, Cohen’s d = 1.50), between HC and ADparticipants (t = 9.0, df = 44, p < 0.001, Cohen’s d =2.36), but not between acute TBI participants and ADpatients (t = 0.4, df = 61, p = 0.65, Cohen’s d = 1.58).Similarly, significant differences in MMSE scores werefound between HC and acute TBI participants (Welch’st = 5.4, df ≃ 28.7, p < 0.001, Cohen’s d = 1.2), betweenHC and AD participants (Welch’s t = 10.8, df ≃ 37.2,p < 0.001, Cohen’s d = 2.7), but not between acute TBIparticipants and AD patients (Welch’s t = 1.3, df ≃ 48.7,p = 0.1, Cohen’s d = 0.3).
(Dis)similarity matrices and modularity
Participants’ DMNs were delineated and then parcelledinto gyri and sulci based on the morphometric bound-aries between cortical structures, as previously de-scribed. For each pair of regions i and j, clusters ofsignificant functional correlations ρij were then identi-fied. Two dissimilarity matrices D(TBI,HC) andD(AD,HC) were computed to quantify significant mean differ-ences in ρij between HC and each of the study groups(TBI and AD, respectively). A similarity matrix S(TBI,AD) was also calculated to describe significant statisticalequivalences of ρij across TBI and AD. Both similarityand dissimilarity were quantified using Student’s tscores (see Methods).
To determine which brain regions are similarly vulner-able to TBI- and to AD-related deviations from normality(i.e., from HCs), network modules were identified withineach (dis)similarity matrix. For reproducibility, the depen-dence of module composition upon the anatomy-basedparcellation scheme was also explored. This was done byrepartitioning the DMN randomly and repeatedly to createalternative parcellations which had the same number ofnodes—but different spatial configurations—as the origi-nal, anatomy-based parcellation. The process of identify-ing network modules was then repeated for each of theserandomized parcellations. At every iteration, DMN mod-ules were identified in each dissimilarity matrix; the num-ber NR of randomized modules (μ ±σ = 2.01 ± 0.3) wasnot found to differ significantly from the number of mod-ules NA obtained using the anatomic parcellation (NA= 2;Student’s t > 0.37, df = 99, Cohen’s d = 0.03). Further-more, the original and randomized modules overlappedspatially with high consistency across the 100
GeroScience (2020) 42:1411–1429 1417

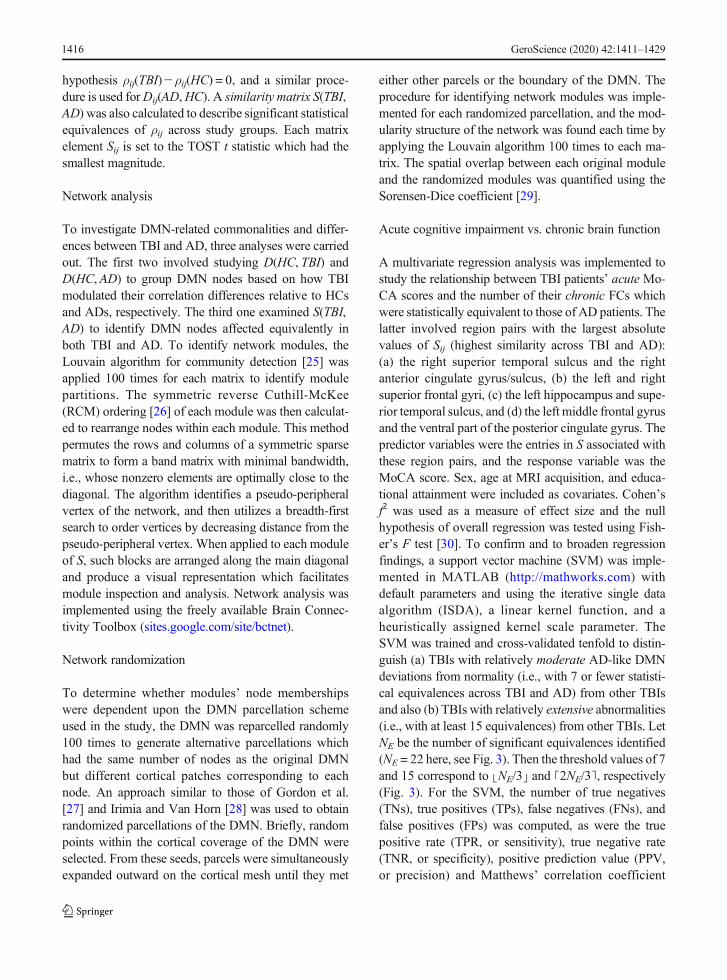
Fig. 2 Like Fig. 1, for D(HC, AD). The color-coded quantity is a t statistic with 82 df. See the caption of Fig. 1 for abbreviations
GeroScience (2020) 42:1411–14291418

randomizations (Sørensen-Dice coefficient μ ±σ = 0.94 ±0.06; 95% CI = [92.89, 95.10]). Thus, the randomizedmodules’ nodal memberships and spatial coverages agreedwith those of the original modules.
DMN modules in mTBI versus HC
RCM orderings [26] were used to display modules alongthe main diagonal of each (dis)similarity matrix. TheRCM-ordered modules of D(HC, TBI) and D(HC,AD)are displayed in Fig. 1 and Fig. 2, respectively, as are thegraph representations of the corresponding dissimilaritymatrices. Mα, the first module common to both D(HC,TBI) and D(HC,AD), includes (a) the hippocampus, (b)ventral and dorsal prefrontal cortex, and (c) the ventralaspect of the posterior cingulate gyrus. Significant func-tional correlations between nodes withinMα do not differsignificantly across TBI and HC (Fig. 1); this may indicatethat, on average, the geriatric mTBI patients did not expe-rience substantial FC alterations within brain areas coveredby Mα within the first ~ 6 months post-injury. Mβ, thesecondmodule along the diagonal ofD(HC,TBI), containsall the DMN regions outside Mα. Within Mβ, correlationsare consistently weaker in mTBI participants relative toHCs. Furthermore, the superior frontal gyrus andprecuneus are found to be the two structures whose TBI-related FC deviations from normality are the broadestacross the DMN. FC differences between TBI and HCinvolve relatively few pathways connecting Mα and Mβ.Thus, although Mα connections are considerably less af-fected by TBI comparedwithMβ, some pathways betweenthese modules are not.
DMN modules in AD versus HC
Whereas FC is typicallyweaker in TBI than inHC (Fig. 1),AD patients’ FC deviations from normality vary consider-ably (Fig. 2). These deviations can be grouped into fivemodules which occur bilaterally; the first is identical toMα
and the rest are subdivisions of Mβ (Mβ1through Mβ4
).Across AD and TBI,Mα,Mβ3
, andMβ4are similar in that
their intramodular FCs do not differ significantly fromthose of HC participants.Mβ1
is a frontotemporal modulewith relatively few intramodular FC differences betweenAD and HC but with considerably more differences of thiskind involving intermodular connections. Mβ2
containsbroadly distributed frontal, limbic, and parietal regions;comparing the HC and AD groups from the standpoint
of correlationswithinMβ2reveals sparse group differences
involving both intra- and intermodular connections. Likein the case ofMα, AD patients’Mβ3
andMβ4modules do
not have intramodular correlationswhich differ significant-ly fromHC, although both subunits exhibit numerous suchdifferences involving intermodular connections.
DMN modules in TBI versus AD
Figure 3 displays the similarity matrix S(TBI,AD) and itsgraph representation to identify regions with statisticalequivalences across study groups. Regions exhibiting suchsimilarities involve the dorsolateral prefrontal cortex, thelateral temporal lobe, and the ventral aspect of the posteriorcingulate gyrus. The hippocampus is topologically proxi-mal to the latter two areas; furthermore, hippocampo-cortical correlations are substantially affected in both TBIand AD. Nevertheless, only few hippocampo-cortical cor-relations are statistically equivalent across these conditions.The strongest similarities between TBI and AD involveconnectivity between the lateral temporal lobe and anteriorcingulate cortex, as well as between dorsolateral prefrontalcortex and each of the following three structures: thehippocampus, the lateral temporal lobe, and the posteriorcingulate cortex.
Acute cognition versus chronic DMN in TBI
Upon testing the association between MoCA scores andthe number of FC similarities (i.e., pairwise statisticalequivalences) between TBI and AD, the null hypothesisof the test for overall multivariate regression was rejected(F = 1.6, df1 = 5, df2 = 111, p< 0.0034, Cohen’s f
2 = 0.39).In other words, this test rejected the null hypothesis ac-cording to which there was no multivariate correlationbetween (a) MoCA scores and (b) the number of FCsimilarities involving TBI and AD. To study further therelationship between acute cognition and chronic DMNdysfunction, two support vector machines (SVM) wereused. The first one was trained on 50% of each cohort todistinguish TBI participants with relatively moderate AD-like DMN deviations from normality (i.e., with 7 or fewerstatistical equivalences across TBI and AD) from otherTBI participants. Another SVM was trained on 50% ofeach sample to distinguish TBI participants with relativelyextensive abnormalities (i.e., with 15 ormore equivalences)from the rest of the TBI participants. The means andstandard deviations for the number of TNs, TPs, FNs,
GeroScience (2020) 42:1411–1429 1419

GeroScience (2020) 42:1411–14291420

and FPs were computed, as were their TPRs (i.e., sensitiv-ities), TNRs (i.e., specificities), PPVs (i.e., precisions), andMCCs. Across 100 scenarios, the SVM trained to identifyTBI patients whose similarities to AD were relativelymodest (7 or fewer equivalences) achieved the followingmeans and standard deviations: TN= 18.0 ± 0.8; TP = 9.0± 0.6; FN = 1.0 ± 0.6; FP = 1.0 ± 1.0; TPR= 0.90 ± 0.06;TNR= 0.95 ± 0.06; PPV= 0.91 ± 0.1; and MCC= 0.85± 0.1. The SVM trained to predict which TBI patients’similarities to ADwere relatively broad (15 or more equiv-alences) yielded the following results: TN = 17.1 ± 0.7;TP = 10.0 ± 0.7; FN = 0.9 ± 0.7; FP = 1.1 ± 1.0; TPR =0.9 ± 0.1; TNR= 0.95 ± 0.1; PPV= 0.9 ± 0.1; and MCC=0.86 ± 0.1. Figure 4A displays cortical maps of Mα andMβ on the surface of an average brain atlas, contrasting thefact thatMα includes primarily frontal regions whereasMβ
includes the rest of the DMN. Figure 4B displays DMNparcels whose chronic DMN similarities across TBI andAD were accurately predicted from acute MoCA scoresusing the two SVMs. These regions include areas of thedorsolateral prefrontal, lateral temporal, posterior cingu-late, and parahippocampal cortices.
Discussion
Significance
mTBI patients with relatively high rates of neural deg-radation may be at commensurately high risk for AD,
and the estimation of such risk can be assisted byknowledge of how TBI modifies brain function alongAD-like trajectories. Thus, an important indication ofthis study is that the DMNs of geriatric mTBI patientscan exhibit distinct patterns of AD-like RS FC as earlyas ~ 6 months post-injury. If this is the case, our findinghighlights older adults’ substantial vulnerability to TBI[32] and may be unsurprising given that the highestincidence of TBI is in older adults [5], where eveninjuries of mild severity can increase AD risk [8]. Analternative, more general interpretation is that geriatricmTBI patients exhibit RS FC patterns which may occurin several neurodegenerative diseases among which ADcan be counted.
The outcome of the test of overall regression indi-cates a significant, inverse association between TBIpatients’ acute MoCA scores and the extent of theirchronic DMN similarities to AD. This outcome is con-firmed by the SVM classifications, which achieved sen-sitivities and specificities which compare favorably withthose for blood and imaging biomarkers of AD [33].Our results may be useful for predicting the risk of AD-like functional degradation after TBI because mTBIpatients’ acute cognitive scores are predictive of theirAD-like DMN features. Thus, our study is significant inthree distinct ways. Firstly, it identifies a set of function-al DMN features which are common to both geriatricmTBI and AD. Secondly, it demonstrates that the anal-ysis of RS FC in the DMN using the present approachcan reveal the extent to which mTBI-affected functionmay transition onto AD-like trajectories. Thirdly, itsuggests that, if AD-like abnormalities are indeed com-mensurate to mTBI patients’AD risk, the DMN featuresdescribed here can be used to improve AD risk estima-tion. An alternative and potentially broader implicationis that our results can be used to improve risk estimationnot only in AD but also in other neurodegenerativeconditions whose brain degradation patterns resemblethose of AD in their early stages.
Connectomic pathophysiology
Although DMN subdivisions have been mapped withhigh stability across health and disease [14], such sub-units’ relative vulnerability to TBI is not well under-stood. An intriguing finding of this study is that the nodememberships of Mα, Mβ2
, and Mβ4are consistently
similar across the TBI and AD groups (Fig. 1 and
Fig. 3 The similarity matrix S(TBI, AD) displays statisticallysignificant equivalences of functional correlation ρ between theTBI and AD groups. Each cell Sij encodes the result of testing thenull hypothesis of equivalence in ρij across these two groups. Thisnull hypothesis is only tested if both TBI and AD differsignificantly from HC. In other words, if there is no significantmean difference in ρ between/either (a) HC and TBI and/or (b) HCand AD, Sij is drawn in white. If both study groups differ from theHC group but no significant statistical equivalence is found acrossTBI andAD, Sij is also drawn in white. Elsewhere, the color-codedquantity is the value of the TOST procedure’s t statistic with thesmallest magnitude. The color-coded quantity is a t statistic with63 df. If a statistical equivalence is associated with a relativelystronger correlation in both TBI and AD relative to HC, t ispositive and Sij is drawn in red; if the correlation is weaker relativeto HC, t is negative and Sij is drawn in blue. Boundaries betweenMα andMβ are delineated by thick black lines; boundaries betweenthe submodules of Mβ are delineated by thinner lines. See thecaption of Fig. 1 for abbreviations. (B) Graph representation ofS(TBI, AD). Nodes are color-coded and grouped by module. Edgecolors encode t score values, according to the color bar in (A)
R
GeroScience (2020) 42:1411–1429 1421

Fig. 2). The probability of such an occurrence being dueto chance is low given the results of our randomizationanalysis and the fact that the modules of each dissimi-larity matrix were identified independently of one an-other. Instead, it is more likely that this likeness ofmodularity could be due to intrinsic properties of theDMN which modulate their susceptibility to TBI andAD, and perhaps even to neurodegenerative processesin general.
Mα contains primarily fronto-hippocampo-limbicconnections. For this reason, the existence of modularstructure resemblances between TBI and ADmay implythat both conditions impact intermodular connectionswithin Mα, Mβ2
, and Mβ4in ways which are substan-
tially different from how they affect the rest of theDMN. Since the three modules are distinct, however,
their existence may also indicate that, although FCwithin DMN subunits can be robust to geriatric mTBI,such robustness can manifest itself in distinct ways viamechanisms which are yet to be determined. Althoughappealing, the task of exploring such network-theoreticdifferences between DMN subunits could not be under-taken adequately here due to the small effect sizesimplied by such differences. More specifically, suchminute effect sizes require commensurately large sam-ples to avoid high probabilities for errors of type I and/orII when contrasting module properties across groups.Thus, future research should aim further to study DMNsimilarities between TBI and AD.
The properties of the Mα module summarized inFig. 1 and Fig. 2 suggest that geriatric mTBIaffects certain FCs between frontal, limbic, and
Fig. 4 Cortical maps of DMNmodules. (A)Mα (magenta) andMβ (cyan) mapped on the surface of an average brain atlas. (B) TBI-affectedbrain regions in S(TBI, AD) (see Fig. 3) whose chronic similarity to AD was predicted based on acute cognitive scores using SVMs
GeroScience (2020) 42:1411–14291422

hippocampal areas in ways which differ from thosepertaining to other DMN regions. This is perhapsunsurprising given that many frontal areas experi-ence atrophy as early as middle age [34] and thatthe frontal lobe appears to exhibit distinct trajecto-ries in TBI compared with AD [35–37]. On theother hand, although FC involving the hippocam-pus and cingulate areas is sensitive to both TBIand AD from the early stages of both conditions[38–40], their interactions within the RS DMNremain poorly understood and require further re-search. Interestingly, only very few hippocampo-cortical connectivity alterations were found to bestatistically similar across AD and mTBI (Fig. 3),despite such connections being significantly affect-ed by both conditions. This may suggest that geri-atric mTBI and AD affect this connectivity ensem-ble in different ways and that the functional abnor-malities observed in this study might be associatedwith dissimilar functional trajectories within DMNmodules during posttraumatic neurodegeneration.Here it is important to remind the reader of theaphorism according to which “absence of evidenceis not evidence of absence.” In our context, thismeans that the absence of a statistical similarityfinding between TBI and AD—as represented byblank connectivity matrix cells in Fig. 3—does notimply evidence for the absence of such similarities.Instead, there are at least two possible scenarios.The first of these involves the situation where asimilarity exists but its effect size is not largeenough for its adequately powered detection to bepossible in this sample. In the second scenario,although the FCs of both TBI participants andAD patients differ significantly from the FCs ofHCs, the former two are not significantly equiva-lent. To provide an example of this, consider thescenario where the mean FC between two regionsis 0 in HC, 0.8 in TBI, and− 0.8 in AD, and thestandard deviation of each measure is 0.01. Clear-ly, the FCs of the TBI group (0.8) and that of theAD group (− 0.8) are both significantly differentfrom that of HCs (0); nevertheless, the FCs of theTBI and AD groups differ substantially from eachother (0.8 vs. − 0.8), such that these FCs are notstatistically equivalent. This simple example high-lights the need to interpret statistical equivalentfindings carefully.
In this study, the most prominent common feature ofMα, Mβ3
, and Mβ4is the extent to which the
intermodular connections of these three modules deviatefrom normality in both mTBI and AD. Furthermore,none of these modules exhibits intramodular connectiv-ity which differs significantly fromHCs in either clinicalcondition. These findings suggest, at the very least, thatposttraumatic functional connections can be groupedaccording to their relative vulnerability to injury-related neurodegeneration. This is analogous to the sim-ilar task of grouping structural connections based ontheir vulnerability to injury, which entails mapping thestructural scaffold of the human connectome [41]. Nev-ertheless, findings like ours may be difficult to interpretfurther in the absence of connectome-wide characteriza-tions of connectivity between the DMN and the rest ofthe brain. Thus, future studies should aim to clarify howDMN subdivisions differ from the standpoint of theirresponse to TBI or AD.
There are relatively few statistical similarities be-tween TBI and AD (Fig. 3), despite the much greaternumber of significant differences between HC and TBI,as well as between HC and AD (Fig. 1 and Fig. 2). Tocontextualize this, it is important to note that the statis-tical similarities observed in this study between TBI andADwere detected only ~ 6 months after geriatric TBI ofmild severity. Presumably, injuries of greater severitycan be associated with additional significant similarities,and future research should test this hypothesis. Forexample, the severity of TBI- and AD-related digestivedisturbances may be associated with connectomic dis-ruptions which affect similar cortical areas and whichmay be associated with injury/disease severity [42–45].
It is not unlikely that the pathophysiological process-es giving rise to the relatively few observed similaritiesbetween TBI and AD continue to affect the aging brainlong after injury. Thus, the number of DMN-relatedsimilarities between TBI and AD may be proportionalto how late after injury such similarities are measuredand quantified. Specifically, if the neuropathologicalprocesses initiated by TBI continue to affect the DMNlong after injury, it is possible that TBI and AD patients’DMNs start to resemble each another more and more asthe time since injury increases. If this is the case, thenumber of statistical similarities observed here mayprovide a lower bound on the number of similaritiesbetween geriatric mTBI and AD. In such a scenario,the later fMRI recordings are acquired post-injury, the
GeroScience (2020) 42:1411–1429 1423

greater DMN degradation there should be along ADtrajectories. Whether this conjecture is valid should beinvestigated by future studies.
Neurovascular pathophysiology
The occurrence of CMBs in geriatric mTBI patients isrelevant to the spatial profile and severity of posttrau-matic WM alterations [16, 32, 46]. Previously, weshowed that the trajectories and integrities of WM fas-ciculi passing through the vicinity (penumbrae) of post-traumatic CMBs can be altered in ways which persist forat least 6 months post-injury [47, 48]. Furthermore,other studies have found that CMB count is associatedwith network alterations in patients with early AD aswell [49]. Since CMBs are associated with structuralconnectivity changes in both TBI and AD, these mani-festations of blood-brain barrier breakdown may alsomodulate functional connectivity patterns shared by TBIand AD. In the present study, however, AD patients’CMB counts were quite low, which suggests that CMB-related network changes previously observed in AD arerelatively unlikely to drive the RS FC similarities be-tween mTBI participants and AD patients describedhere. One could argue that, in ideal circumstances,(dis)similarities between HCs, mTBI patients, and ADparticipants should be studied in the absence of CMBs;this, however, is particularly challenging in older adults.For example, in geriatric TBI patients, posttraumaticCMBs are frequently co-morbid with CMBs of hyper-tensive etiology, as well as with CMBS due to cerebralamyloid angiopathy (CAA), which is also a risk factorfor AD. Because of the relatively high combined prev-alence of neurovascular disease, CAA, and hypertensionin older adults [46], studying TBI-related brain networkalterations in the absence of CMBs may be either logis-tically impractical or of limited relevance to the patho-physiological processes of the average person’s agingbrain. In other words, studying functional network al-terations in CMB-free older individuals may limit theutility of the insights gained from such studies to arelatively minor subset of the aging adult population.Although elucidating how CMBsmodulate the extent ofAD-like FC patterns in the mTBI-affected brain is be-yond our scope, this study’s inclusion of individualswith a wide range of CMB counts assists in resolvingAD-like FC trajectories in a sample whoseneurovascular profile reflects, at least to some extent,the radiological findings of aging adults with TBI and/or
AD. Future research should aim to clarify the extent towhich CMBs modulate the extent and severity of AD-like FC deviations from normality in geriatric mTBIpatients.
Comparison to prior studies
Arguably, the statistical similarities between studygroups (TBI and AD) are of greatest interest in thisstudy. Nevertheless, differences between HC and TBIand between HC and AD are also relevant because theyunderlie key comparisons between TBI and AD [50].Fortunately, the comparison of our results to those ofprevious studies strengthen the case for our own analy-sis and broadens the scientific consensus on DMN dif-ferences between (a) HC vs. TBI and (B) HC vs. AD.
Our findings are in broad agreement with those ofimportant previous studies on DMN abnormalities afterTBI. For instance, Mayer et al. [13] reported that, com-pared with mTBI, HC subjects have stronger FC be-tween the (a) anterior and posterior cingulate cortices,(b) anterior cingulate cortex and the superior frontalgyrus, (c) anterior cingulate cortex and thesupramarginal gyrus, (d) the inferior parietal lobuleand posterior parietal cortex, (e) the inferior parietallobule and the middle frontal gyrus, (f) prefrontal cortexand the superior parietal lobule, and between (g) pre-frontal cortex and the superior frontal gyrus. Our find-ings are in remarkable agreement with those of Mayeret al. (Figure 1). Furthermore, like in the present study,Johnson et al. [11] identified stronger FC in HC partic-ipants compared with TBI volunteers between posteriorcingulate cortex and the hippocampal formation. Theseauthors also found that (a) the lateral parietal lobes havesignificantly more bilateral RS FCs to the dorsolateralprefrontal cortex in HCs, that (b) mTBIs show onlyipsilateral connections between these regions, and that(c) RS FCs between medial prefrontal and lateral parie-tal cortices are primarily observed in mTBI. These threesets of findings are replicated by our own study(Figure 1).
Influential prior results on DMN differences betweenHC and AD are confirmed by ours. For example, as wedid, Greicius et al. [51] found that AD patients exhibitdeficient activity involving the hippocampus and poste-rior cingulate cortex. In AD patients, Damoiseaux et al.found stronger FCs between (a) the frontal poles andother anterior frontal regions, (b) the left superior frontalgyrus and other frontal regions, and between (c) the
GeroScience (2020) 42:1411–14291424

precunei and the frontal poles, but weaker FCs involv-ing regions like the superior andmiddle frontal gyri. Ourresults confirm the findings of Greicius et al. (Fig. 2) aswell as those of Zhang et al. [52], who found reducedRS FCs between (a) posterior cingulate cortex and thehippocampus, (b) posterior cingulate cortex and theprecuneus, and between (c) dorsolateral prefrontal cor-tex and middle temporal areas. Additionally, as we did,Zhang et al. found stronger RS FCs between theprecuneus and many dorsolateral prefrontal regions.
Equivalence testing
This study uses equivalence testing, which originates inpharmacokinetics [53]. There, marketing new drugsrequires testing whether their effectiveness isundistinguishable from that of older andmore expensivecompetitors. Here, testing whether TBI-related DMNalterations are equivalent to AD-related alterations as-sists in illustrating how TBI and AD can result in statis-tically indistinguishable patterns of DMN deviationsfrom normality (i.e., from HCs). Using equivalencetesting in studies like ours is key because attempting toestablish equivalence using statistical tests of conven-tional null hypotheses (e.g., μ1 = μ2) frequently leads toincorrect conclusions. Specifically, a significant resultafter such a test establishes a difference, whereas a non-significant one simply implies that equivalence cannotbe ruled out. Thus, the risk of wrongly inferring equiv-alence can be very high, such that proper equivalencetesting is needed instead [23]. In the current context, it isimportant to emphasize that equivalence testing wasimplemented here only for pairs of regions whose partialcorrelations ρij differed significantly from HCs in bothAD and mTBI. If this constraint had not been imposed,distinguishing normal from abnormal statistical equiva-lence patterns would not have been possible within thisstatistical inference framework.
Modularity structure
Here, DMN modules were identified from dissimilaritymatrices rather than from FC matrices, as typical offunctional connectomics studies [54]. Thus, the modulesfound in this study should be interpreted as groups ofnodes whose FCs deviate from normality in similarways, rather than as sets of nodes which are similarlyconnected to one another. The concept of deriving mod-ularity properties from dissimilarity matrices is not new
and is, in fact, the basis of multidimensional scaling(MDS)—an ordination technique for information visu-alization and dimensionality reduction which has beenused widely for decades [55]. In MDS, like here, dis-similarity matrices can be conceptualized as distancematrices whose entries are calculated using a distancefunction whose definition can be conveniently assigneddepending on the nature of the data. In this study, thedistance in question is a t score, which is a properstatistical metric defined as the standardized differencebetween two group means. This framework is univariateand therefore accommodates only onemeasure at a time,i.e., functional correlation in our case. However, shouldadditional connectivity measures (e.g., Granger causal-ity, phase locking value) or functional modalities (e.g.,electro- or magnetoencephalography) be available[56–58], this formalism could be extended to an arbi-trary number of dimensions using the (multivariate)Mahalanobis distance and/or non-Euclidian metrics,like in generalized MDS [59].
Replicability
Our findings should be replicated in larger cohorts forconfirmation and improvement of statistical estimates.Although the samples used in this study were of mod-erate size, the effects reported here reflect relativelylarge mean differences between cohorts. This is perhapsunsurprising because, across a variety of studies andmethodologies, even TBI of mild severity has beenassociated consistently with large statistical effects re-lated to anatomical and physiological measures [60].Furthermore, the mTBI participants studied here didnot have clinical findings on MRI except for sporadic,SWI-detectable CMBs; this is rare in TBI studies. Thus,the present study facilitates the comparison of TBI toAD partly due to the uniquely suitable profile of thegeriatric TBI sample involved, whose MRI profile isrelatively rare; this lends strength and uniqueness to thepresent study. Specifically, the effect sizes characterizedhere are more likely to be due to functional—rather thanto structural—pathology because the structural MRIfindings of these geriatric mTBI patients are minimal.For this reason, the large statistical effects of TBI uponthe DMN are quite likely responsible for the large effectsizes reported. This contrasts with many other neurolog-ical conditions, where FC metrics often exhibit relative-ly smaller effect sizes, such that considerably largersamples are often required to detect effects of interest
GeroScience (2020) 42:1411–1429 1425

with adequate statistical power. It also contrasts withmost other TBI studies, where gross TBI pathology onMRI findings is the norm. Nevertheless, despite theunique characteristics of our sample, further researchin a larger cohort remains necessary for replication. Thisobservation also pertains to our SVM findings, whichmay not be applicable to TBI cohorts of greater severity,even if only due to the greater heterogeneity ofmoderate-to-severe TBI relative to mTBI. Thus, ourfindings should not be interpreted as being broadlyapplicable to TBIs of any severity. Furthermore, thepredictive value of our SVM relies heavily on acuteMoCAs, whose values do not convey well the richsubtleties of posttraumatic cognitive impairment [61].Thus, future studies should aim to utilize more detaileddescriptors, preferably across all cognitive domains[62], to take better advantage of SVMs’ potential forfunctional outcome prediction. Finally, it should bementioned that replication of our findings using electro-physiological techniques like electro- and magnetoen-cephalography (EEG and MEG, respectively) [56, 63]would be very helpful in establishing the spatiotemporalparameters of the (dis)similarities observed here.
Limitations
It is important to acknowledge the possibility that thesimilarities between mTBI and AD described here mayalso be shared by mTBI with other neurodegenerativeconditions. Although exploring whether this is the caseis outside the scope of this study, future research shouldattempt to clarify whether the similarity patterns identi-fied are representative not only of mTBI similarities toAD but also of the relationship between mTBI and otherneurodegenerative conditions like Parkinson’s disease,for which TBI is also a risk factor. Furthermore, becausemany participants were onmedications for neurological,psychiatric, vascular, and/or metabolic disease whenscans were acquired, the extent to which comorbiditiesaffect the results of this study is unclear. Fortunately, theproportion of volunteers on medications for vascularand metabolic disease was approximately equal for themTBI and AD groups, such that confounds due to thesetreatments are likely to be less severe than in the sce-nario where large discrepancies between groups existed.By contrast, the proportion of subjects undergoing treat-ment involving medications for neurological/psychiatricdisease was much higher for the AD group (97%) thanin the mTBI group (62%), mostly because almost all AD
patients were taking cognition-enhancing medications.The effects of comorbidities upon AD-like FC trajecto-ries in mTBI patients are worthy of further study.
One potential limitation of FC studies like ours is thatresults can be affected by how the DMN is defined andby the cortical parcellation used for fMRI seed analysis.Here, the DMN was defined based on the Yeo delinea-tion and parcelled based on the intersection of thisdelineation with the Destrieux parcellation scheme.Nevertheless, the use of other parcellation schemes ofsimilar spatial resolution may not alter conclusions sub-stantially because the randomization analysis undertak-en yielded network modules whose anatomic coveragewas consistent. Last but not least, the equivalence mar-gin used in this study was 0.2, which is considered to berelatively conservative [23]; as the margin becomesnarrower and narrower, however, more and more hy-potheses of equivalence are rejected. Unfortunately,there is currently no consensus-based standard for the“ideal” equivalence margin which life scientists shouldutilize.
Conclusion
This study provides evidence that geriatric mTBI isassociated with DMN deviations from normalitywhich are statistically indistinguishable from thoseobserved in AD. The DMN regions affected can begrouped into modules based on their vulnerability,with striking similarities in the composition andproperties of these modules across the two neurolog-ical conditions. Multivariate regression analysis iden-tified a clear relationship between acute cognitivedeficits and chronic DMN alterations. Furthermore,SVM classifications suggested that DMN featuresmay be useful for early prognostication of the extentand sever i ty associa ted wi th post t raumat icneuropathophysiology. Nevertheless, the neurode-generative processes of TBI and AD differ substan-tially despite their potential commonalities. Thus, thesimilarities in DMN alteration trajectories shared bythese conditions and reported here may not be drivenby similar trends toward functional reorganization.Because the methodological limitations of functionalneuroimaging prevent us from a mechanistic explo-ration of this hypothesis, future research should studythe pathophysiological mechanisms shared by TBIand AD in further detail.
GeroScience (2020) 42:1411–14291426

Acknowledgments The authors thank Maria Calvillo, Lei Cao,Yu Hu, Jun H. Kim, Sean O. Mahoney, Van Ngo, Kenneth A.Rostowsky, and Shania Wang for their assistance.
Computer code availability The computer code used in thisstudy is freely available. FreeSurfer and FS-FAST are freely available(https://surfer.nmr.mgh.harvard.edu). Equivalence testing wasimplemented using freely available MATLAB software(https://www.mathworks.com/matlabcentral/fileexchange/63204).Network analysis was implemented using the freely available BrainConnectivity Toolbox (https://sites.google.com/site/bctnet/). Networkvisualizations were generated using Gephi (http://gephi.org).Regression and SVM analyses were implemented in MATLAB(http://mathworks.com) using the glmfit, fitcsvm, andpredict functions.
Authors’ contributions A.I. contributed to the study design,data analysis, and result interpretation and wrote the manuscript.A.S.M., N.N.C., N.F.C., and E.B.J. contributed to the study de-sign, data analysis, and result interpretation.
Funding information This work was supported by NIH grantR01 NS 100973 to A.I., by DoD award W81-XWH-1810413 toA.I., by a Hanson-Thorell Research Scholarship to A.I., and by theUndergraduate Research Associate Program (URAP) at the Uni-versity of Southern California. Data collection and sharing for thisproject was funded by the Alzheimer’s Disease NeuroimagingInitiative (ADNI, NIH Grant U01 AG024904) and DoD ADNI(DoD award number W81XWH-12-2-0012). ADNI is funded bythe National Institute on Aging, the National Institute of Biomed-ical Imaging and Bioengineering, and through generous contribu-tions from the following: AbbVie, Alzheimer’s Association;Alzheimer’s Drug Discovery Foundation; Araclon Biotech;BioClinica, Inc.; Biogen; Bristol-Myers Squibb Company;CereSpir, Inc.; Cogstate; Eisai Inc.; Elan Pharmaceuticals, Inc.;Eli Lilly and Company; EuroImmun; F. Hoffmann-La Roche Ltd.and its affiliated company Genentech, Inc.; Fujirebio; GEHealthcare; IXICO Ltd.; Janssen Alzheimer Immunotherapy Re-search&Development, LLC.; Johnson& Johnson PharmaceuticalResearch & Development LLC.; Lumosity; Lundbeck; Merck &Co., Inc.; Meso Scale Diagnostics, LLC.; NeuroRx Research;Neurotrack Technologies; Novartis Pharmaceuticals Corporation;Pfizer Inc.; Piramal Imaging; Servier; Takeda PharmaceuticalCompany; and Transition Therapeutics. The Canadian Institutesof Health Research is providing funds to support ADNI clinicalsites in Canada. Private sector contributions are facilitated by theFoundation for the National Institutes of Health (www.fnih.org).The grantee organization is the Northern California Institute forResearch and Education, and the study is coordinated by theAlzheimer’s Therapeutic Research Institute at the University ofSouthern California. ADNI data are disseminated by theLaboratory for Neuro Imaging at the University of SouthernCalifornia.Data availabilityMRI data acquired from HC and ADparticipants are publicly available from the ADNI database(http://adni.loni.usc.edu). For TBI participants, primary datagenerated during and/or analyzed during the current study areavailable subject to a data transfer agreement. At the request ofsome participants, their written permission is additionally requiredin a limited number of cases.
Compliance with ethical standards
Conflicts of interest The authors declare no actual or perceivedcompeting interests.
References
1. de Freitas Cardoso MG, Faleiro RM, de Paula JJ, KummerA, Caramelli P, Teixeira AL, et al. Cognitive impairmentfollowing acute mild traumatic brain injury. Front Neurol.2019;10:198.
2. Irimia A, Goh SY, Torgerson CM, Vespa P, Van Horn JD.Structural and connectomic neuroimaging for the personal-ized study of longitudinal alterations in cortical shape, thick-ness and connectivity after traumatic brain injury. JNeurosurg Sci. 2014;58(3):129–44.
3. Tripodis Y, AloscoML, Zirogiannis N, Gavett BE, ChaissonC,Martin B, et al. The effect of traumatic brain injury historywith loss of consciousness on rate of cognitive declineamong older adults with normal cognition and Alzheimer’sdisease dementia. J Alzheimers Dis. 2017;59(1):251–63.https://doi.org/10.3233/Jad-160585.
4. Griesbach GS, Masel BE, Helvie RE, Ashley MJ. Theimpact of traumatic brain injury on later life: effects onnormal aging and neurodegenerative diseases. JNeurotrauma. 2018;35(1):17–24. https://doi.org/10.1089/neu.2017.5103.
5. Gardner RC, Dams-O'Connor K, Morrissey MR, ManleyGT. Geriatric traumatic brain injury: epidemiology, out-comes, knowledge gaps, and future directions. JNeurotrauma. 2018;35:889–906. https://doi.org/10.1089/neu.2017.5371.
6. Van Horn JD, Irimia A, Torgerson CM, Bhattrai A, JacokesZ, Vespa PM. Mild cognitive impairment and structuralbrain abnormalities in a sexagenarian with a history ofchildhood traumatic brain injury. J Neurosci Res.2018;96(4):652–60. https://doi.org/10.1002/jnr.24084.
7. Faden AI, Loane DJ. Chronic Neurodegeneration after trau-matic brain injury: Alzheimer disease, chronic traumaticencephalopathy, or persistent neuroinflammation?Neurotherapeutics. 2015;12(1):143–50. https://doi.org/10.1007/s13311-014-0319-5.
8. Gardner RC, Burke JF, Nettiksimmons J, Kaup A, BarnesDE, Yaffe K. Dementia risk after traumatic brain injury vsnonbrain trauma: the role of age and severity. JAMANeurol.2014 ;71 (12 ) :1490–7 . h t t p s : / / do i . o rg /10 .1001/jamaneurol.2014.2668.
9. Gardner RC, Yaffe K. Epidemiology of mild traumatic braininjury and neurodegenerative disease. Mol Cell Neurosci.2015;66:75–80. https://doi.org/10.1016/j.mcn.2015.03.001.
10. Raichle ME. The brain’s default mode network. Annu RevNeurosci. 2015;38:433–47. https://doi.org/10.1146/annurev-neuro-071013-014030.
11. Johnson B, Zhang K, Gay M, Horovitz S, Hallett M,Sebastianelli W, et al. Alteration of brain default networkin subacute phase of injury in concussed individuals:
GeroScience (2020) 42:1411–1429 1427

resting-state fMRI study. Neuroimage. 2012;59(1):511–8.https://doi.org/10.1016/j.neuroimage.2011.07.081.
12. Lustig C, Snyder AZ, Bhakta M, O'Brien KC, McAvoy M,RaichleME, et al. Functional deactivations: change with ageand dementia of the Alzheimer type. Proc Natl Acad Sci U SA. 2003;100(24):14504–9. https://doi.org/10.1073/pnas.2235925100.
13. Mayer AR, Mannell MV, Ling J, Gasparovic C, Yeo RA.Functional connectivity in mild traumatic brain injury. HumBrain Mapp. 2011;32(11):1825–35. https://doi.org/10.1002/hbm.21151.
14. Yeo BT, Krienen FM, Sepulcre J, SabuncuMR, Lashkari D,HollinsheadM, et al. The organization of the human cerebralcortex estimated by intrinsic functional connectivity. JNeurophysiol. 2011;106(3):1125–65. https://doi.org/10.1152/jn.00338.2011.
15. Zhou Y, Milham MP, Lui YW, Miles L, Reaume J,Sodickson DK, et al. Default-mode network disruption inmild traumatic brain injury. Radiology. 2012;265(3):882–92. https://doi.org/10.1148/radiol.12120748.
16. Ir imia A, Van Horn JD, Vespa PM. Cerebralmicrohemorrhages due to traumatic brain injury and theireffects on the aging human brain. Neurobiol Aging.2018;66:158–64.
17. Petersen RC, Aisen PS, Beckett LA, Donohue MC, GamstAC, Harvey DJ, et al. Alzheimer’s Disease NeuroimagingInitiative (ADNI): clinical characterization. Neurology.2010;74(3):201–9. https://doi.org/10.1212/WNL.0b013e3181cb3e25.
18. Fan D, Chaudhari NN, Rostowsky KA, Calvillo M, Lee SK,Chowdhury NF, et al . Post- t raumatic cerebralmicrohemorrhages and their effects upon white matter con-nectivity in the aging human brain. In: ConferenceProceedings of the IEEE Engineering in Medicine andBiology Society. Venice: IEEE; 2019. p. 198–203.
19. Jack CR Jr, Bernstein MA, Fox NC, Thompson P,Alexander G, Harvey D, et al. The Alzheimer’s DiseaseNeuroimaging Initiative (ADNI): MRI methods. J MagnReson Imaging. 2008;27(4):685–91. https://doi.org/10.1002/jmri.21049.
20. Khazaee A, Ebrahimzadeh A, Babajani-Feremi A.Identifying patients with Alzheimer’s disease usingresting-state fMRI and graph theory. Clin Neurophysiol.2015;126(11):2132–41. https://doi.org/10.1016/j.clinph.2015.02.060.
21. Destrieux C, Fischl B, Dale A, Halgren E. Automaticparcellation of human cortical gyri and sulci using standardanatomical nomenclature. Neuroimage. 2010;53(1):1–15.https://doi.org/10.1016/j.neuroimage.2010.06.010.
22. Wellek S. A new approach to equivalence assessment instandard comparative bioavailability trials by means of theMann-Whitney statistic. Biometrical J. 1996;38(6):695–710.https://doi.org/10.1002/bimj.4710380608.
23. Walker E, Nowacki AS. Understanding equivalence andnoninferiority testing. J Gen Intern Med. 2011;26(2):192–6. https://doi.org/10.1007/s11606-010-1513-8.
24. Hoffelder T, Gossl R, Wellek S. Multivariate equivalencetests for use in pharmaceutical development. J BiopharmStat. 2015;25(3):417–37. https://doi.org/10.1080/10543406.2014.920344.
25. Blondel VD, Guillaume JL, Lambiotte R, Lefebvre E. Fastunfolding of communities in large networks. J Stat Mech-Theory E. 2008;2008. https://doi.org/10.1088/1742-5468/2008/10/P10008.
26. Cuthill E, McKee J. Reducing the bandwidth of sparsesymmetric matrices. New York: Twenty-fourth NationalConference of the ACM; 1969.
27. Gordon EM, Laumann TO, Adeyemo B, Huckins JF, KelleyWM, Petersen SE. Generation and evaluation of a corticalarea parcellation from resting-state correlations. CerebCortex. 2016;26(1):288–303. https://doi.org/10.1093/cercor/bhu239.
28. Irimia A, Van Horn JD. Scale-dependent variability andquantitative regimes in graph-theoretic representations ofhuman cortical networks. Brain Connect. 2016;6(2):152–63. https://doi.org/10.1089/brain.2015.0360.
29. Dice LR. Measures of the amount of ecologic associationbetween species. Ecology. 1945;26(3):297–302. https://doi.org/10.2307/1932409.
30. Rencher AC. Methods of multivariate analysis. New York:John Wiley & Sons, Inc.; 2002.
31. Matthews BW. Comparison of the predicted and observedsecondary structure of T4 phage lysozyme. BiochimBiophys Acta. 1975;405(2):442–51. https://doi.org/10.1016/0005-2795(75)90109-9.
32. Irimia A, Van Horn JD. Functional neuroimaging of trau-matic brain injury: advances and clinical utility.Neuropsychiatr Dis Treat. 2015;11:2355–65. https://doi.org/10.2147/NDT.S79174.
33. Zverova M. Alzheimer’s disease and blood-based bio-markers - potential contexts of use. Neuropsychiatr DisTreat. 2018;14:1877–82. https://doi.org/10.2147/NDT.S172285.
34. Irimia A, Torgerson CM, Goh SY, Van Horn JD. Statisticalestimation of physiological brain age as a descriptor ofsenescence rate during adulthood. Brain Imaging Behav.2015;9(4):678–89. https://doi.org/10.1007/s11682-014-9321-0.
35. Anderson CV, Bigler ED, Blatter DD. Frontal lobe lesions,diffuse damage, and neuropsychological functioning in trau-matic brain-injured patients. J Clin Exp Neuropsychol.1 9 9 5 ; 1 7 ( 6 ) : 9 0 0 – 8 . h t t p s : / / d o i . o r g / 1 0 . 1 0 8 0/01688639508402438.
36. Harris TC, de Rooij R, Kuhl E. The shrinking brain: cerebralatrophy following traumatic brain injury. Ann Biomed Eng.2019;47(9):1941–59. https://doi.org/10.1007/s10439-018-02148-2.
37. Anderson V, Jacobs R, Anderson PJ. Executive functionsand the frontal lobes: A lifespan perspective. New York NYand Oxford UK: Taylor and Francis. 2008;XXVII–XXXIII.https://brainmaster.com/software/pubs/books/Executive_Functions_and_the_Frontal_Lobes.pdf
38. Venkatesan UM, Dennis NA, Hillary FG. Chronology andchronicity of altered resting-state functional connectivityafter traumatic brain injury. J Neurotrauma. 2015;32(4):252–64. https://doi.org/10.1089/neu.2013.3318.
39. Iraji A, Benson RR, Welch RD, O'Neil BJ, Woodard JL,Ayaz SI, et al. Resting state functional connectivity in mildtraumatic brain injury at the acute stage: independent com-ponent and seed-based analyses. J Neurotrauma.
GeroScience (2020) 42:1411–14291428

2015;32(14) :1031–45. h t tps : / /do i .o rg /10 .1089/neu.2014.3610.
40. Pasquini L, Scherr M, Tahmasian M, Meng C, Myers NE,Ortner M, et al. Link between hippocampus’ raised local andeased global intrinsic connectivity in AD. AlzheimersDement. 2015;11(5):475–84. https://doi.org/10.1016/j.jalz.2014.02.007.
41. Irimia A, Van Horn JD. Systematic network lesioning re-veals the core white matter scaffold of the human brain.Front Hum Neurosci. 2014;8:51. https://doi.org/10.3389/fnhum.2014.00051.
42. Bradshaw LA, Irimia A, Sims JA, Richards WO.Biomagnetic signatures of uncoupled gastric musculature.Neurogastroenterol Motil. 2009;21(7):778–e50. https://doi.org/10.1111/j.1365-2982.2009.01265.x.
43. Irimia A, Bradshaw LA. Artifact reduction inmagnetogastrography using fast independent componentanalysis. Physiol Meas. 2005;26(6):1059–73. https://doi.org/10.1088/0967-3334/26/6/015.
44. Irimia A, Bradshaw LA. Ellipsoidal electrogastrographic for-ward modelling. Phys Med Biol. 2005;50(18):4429–44.https://doi.org/10.1088/0031-9155/50/18/012.
45. Irimia A, Richards WO, Bradshaw LA. Magnetogastrographicdetection of gastric electrical response activity in humans. PhysMed Biol. 2006;51(5):1347–60. https://doi.org/10.1088/0031-9155/51/5/022.
46. Goh SYM, Irimia A, Vespa PM, Van Horn JD. Patient-tailored multimodal neuroimaging, visualization and quan-tification of human intra-cerebral hemorrhage. Proceedingsof the SPIE Conference on Medical Imaging – PACS andImaging Informatics: Next Generation and Innovations2016;9789.
47. Maher AS, Rostowsky KA, Chowdhury NF, Irimia A.Neuroinformatics and analysis of connectomic alterationsdue to cerebral microhemorrhages in geriatric mildneurotrauma. ACM BCB. 2018;2018:165–71. https://doi.org/10.1145/3233547.3233598.
48. Rostowsky KA, Maher AS, Irimia A. Macroscale whitema t t e r a l t e r a t i on s due to t r auma t i c ce reb r a lmicrohemorrhages are revealed by diffusion tensor imaging.Front Neurol. 2018;9:948. https://doi.org/10.3389/fneur.2018.00948
49. Heringa SM, Reijmer YD, Leemans A, Koek HL, KappelleLJ, Biessels GJ, et al. Multiple microbleeds are related tocerebral network disruptions in patients with earlyAlzheimer’s disease. J Alzheimers Dis. 2014;38(1):211–21. https://doi.org/10.3233/JAD-130542.
50. Irimia A, Van Horn JD. The structural, connectomic andnetwork covariance of the human brain. Neuroimage.2 0 1 3 ; 6 6 : 4 8 9–99 . h t t p s : / / d o i . o r g / 1 0 . 1 0 1 6 / j .neuroimage.2012.10.066.
51. Greicius MD, Srivastava G, Reiss AL, Menon V. Default-mode network activity distinguishes Alzheimer’s diseasefrom healthy aging: evidence from functional MRI. ProcNatl Acad Sci U S A. 2004;101(13):4637–42. https://doi.org/10.1073/pnas.0308627101.
52. Zhang HY, Wang SJ, Liu B, Ma ZL, Yang M, Zhang ZJ,et al. Resting brain connectivity: changes during the progressof Alzheimer disease. Radiology. 2010;256(2):598–606.https://doi.org/10.1148/radiol.10091701.
53. Hauck WW, Anderson S. A new statistical procedure fortesting equivalence in two-group comparative bioavailabilitytrials. J Pharmacokinet Biopharm. 1984;12(1):83–91.https://doi.org/10.1007/bf01063612.
54. Hilger K, Fukushima M, Sporns O, Fiebach CJ. Temporalstability of functional brain modules associated with humanintelligence. Hum Brain Mapp. 2020;41(2):362–72.https://doi.org/10.1002/hbm.24807.
55. Hout MC, Papesh MH, Goldinger SD. Multidimensionalscaling. Wiley Interdiscip Rev Cogn Sci. 2013;4(1):93–103. https://doi.org/10.1002/wcs.1203.
56. IrimiaA, Goh SY, Torgerson CM, Stein NR, ChambersMC,Vespa PM, et al. Electroencephalographic inverse localiza-tion of brain activity in acute traumatic brain injury as aguide to surgery, monitoring and treatment. Clin NeurolNeurosurg. 2013;115(10):2159–65. https://doi.org/10.1016/j.clineuro.2013.08.003.
57. Irimia A, Goh SY, Torgerson CM, Chambers MC, KikinisR, Van Horn JD. Forward and inverse electroencephalo-graphic modeling in health and in acute traumatic braininjury. Clin Neurophysiol. 2013;124(11):2129–45.
58. Irimia A, Van Horn JD. Epileptogenic focus localization intreatment-resistant post-traumatic epilepsy. J Clin Neurosci.2015;22(4):627–31.
59. Bronstein AM, Bronstein MM, Kimmel R. Generalizedmultidimensional scaling: a framework for isometry-invariant partial surface matching. Proc Natl Acad Sci U SA. 2006;103(5):1168–72. https://doi.org/10.1073/pnas.0508601103.
60. GibsonDB. Effect size as the essential statistic in developingmethods for mTBI diagnosis. Front Neurol. 2015;6.https://doi.org/10.3389/fneur.2015.00126.
61. de Guise E, Alturki AY, LeBlanc J, Champoux MC,Couturier C, Lamoureux J, et al. The Montreal cognitiveassessment in persons with traumatic brain injury. ApplNeuropsychol Adult. 2014;21(2):128–35. https://doi.org/10.1080/09084282.2013.778260.
62. Calvillo M, Irimia A. Neuroimaging and psychometric as-sessment of mild cognitive impairment after traumatic braininjury. Front Psychol. 2020;11:1423.
63. Lima EA, Irimia A, Wikswo JP. The magnetic inverseproblem. In: Braginski JCA, editor. The SQUIDHandbook: Applications of SQUIDs and SQUID Systems:Wiley-VCH; 2006.
64. Lima EA, Irimia A, Wikswo JP. The magnetic inverseproblem. 2008. The SQUID Handbook, vol 2:Applications of SQUIDs and SQUID Systems. Clarke J.,Braginski AI (Eds.). Wiley-VCH, pages 139–267.
Publisher’s note Springer Nature remains neutral with regard tojurisdictional claims in published maps and institutionalaffiliations.
GeroScience (2020) 42:1411–1429 1429