acute isodense subdural hematomas - ajnr · 40 smith et al. ajnr:2, january/ february 1981 isodense...
TRANSCRIPT
William P. Smith, Jr.' Solomon Batnitzky'
Setti S. Rengachary2
Received June 25, 1980; accepted after revision September 15, 1980.
Presented at the annual meeting of the American Society of Neuroradiology, Toronto, Ontario, May 1979.
'Department of Diagnostic Radiology, University of Kansas Medical Center, Kansas Cily, KS 66103. Address reprint requests to S. Batnitzky.
2Department of Surgery, University of Kansas Medical Center, Kansas City, KS 66103 and Veterans Administration Medical Center, Kansas, City, MO 64128 .
This arti cle appears in January/ February 1981 AJNR and March 198 1 AJR. AJNR 2:37-40, January/ February 1981 0195-6108/ 81 / 0021-0037 $00.00 © American Roentgen Ray Society
Acute Isodense Subdural Hematomas: A Problem in Anemic Patients
37
Although numerous articles have appeared in the literature on chronic isodense subdural hematomas, acute isodense subdural hematomas have received little attention. An experimental model was developed that demonstrated that blood with reduced hemoglobin concentration, 8-10 g l dl, is isodense with the brain. Two anemic patients with acute isodense subdural hematomas are reported.
Isodense or isoattenuating subdural hematomas have proven to be a difficult diagnostic problem and have been the subject of numerous reports [1 -1 3]. The time that a chronic subdural collection may become isodense on computed tomography (CT) varies from 1 week to 90 days after trauma [3, 5, 8]. In most instances, it appears isodense in 2-6 weeks [6]. There has been littl e mention of isodense subdural hematomas in the acute c linica l setting. In patients with low hemoglobin leve ls, an acute subdural hematoma may be isodense from the outset. We developed an experimental model to define the rang e of hemoglobin concentration that would be isodense with the brain in the acute setting. We also encountered two anem ic patients whose hemoglobin leve ls fe ll within the experimentally derived limits of the isodense range and who had acute isodense subdural hematomas.
Materials and Methods
We initially evaluated 25 CT head scans. The average CT number of normal cortex adjacent to the inner table of the sku ll was 32-48 Hounsfield units. Gelat in was mixed wi th water in various concentration s, with ultimate density approximating this normal corti cal density . This gelatinous mixture was th en poured into a specially constructed cy lindrica l plastic phantom with nylon sampling chambers (fig . 1). The mixture was allowed to harden, thus providing a standard for visual compari son. By mi xing a constant vo lume of whole blood with progressive ly increasing amounts of norm al saline , blood samples of d ifferent hemoglobin concentrat ions were obtained. Th e hemoglobin concentrat ion was evaluated using standard capillary tube and centrifuge techniques. Hemog lobin concentrations of 8-18 g l dl were placed in the sampling chambers in the phantom and scanned.
Scans were obtained at 124 kV , 200 mA, and 9.8 sec scan time. Th e samples were immed iately scanned and measured d irect ly . When clo t retract ion occu rred, all measurements were obtained through the clot itself rather than through the serum. All scans inc lud ing the 25 normal CT scans were made on a G.E.CT IT 8800 scanner.
Results
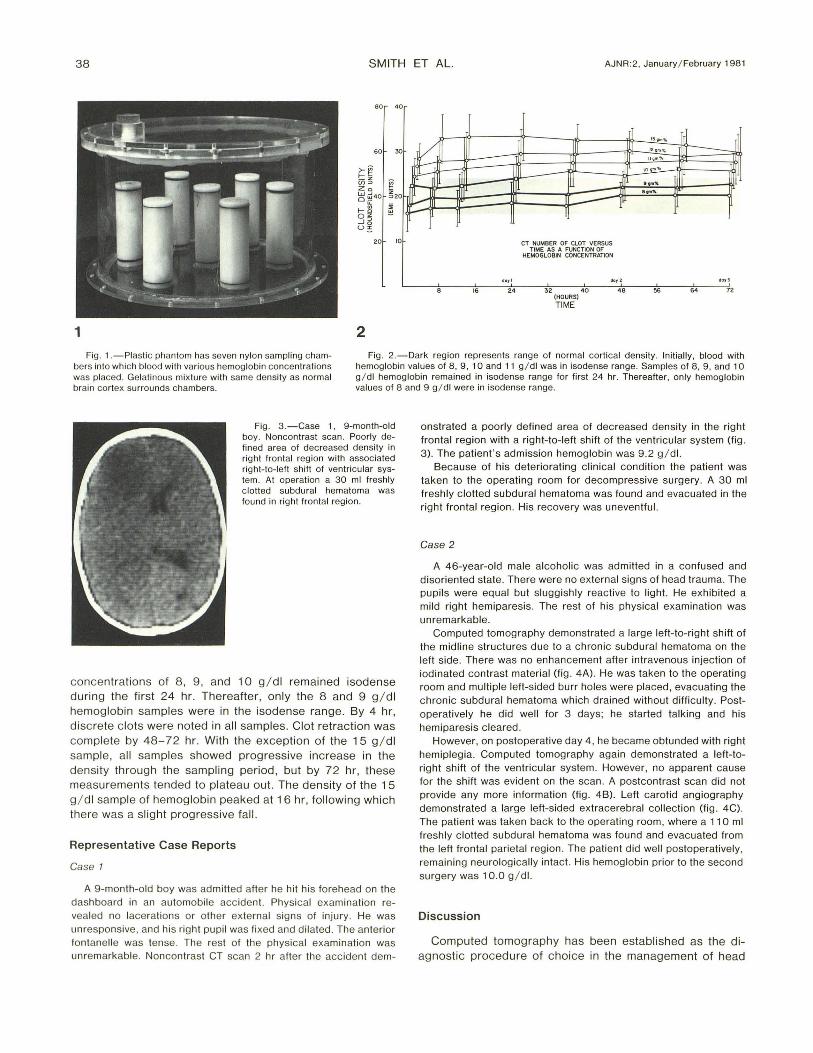
The CT unit values observed for the different concentrations of hemoglobin are shown in figure 2, where the CT number is plotted as a function of time . The dark region represents the range of normal cort ical density . Each curve represents the values obtained for particular hemoglobin concentrations. Initially at 0 hr, hemoglobin values of 8 -11 g/ dl were in the isodense range. Hemog lobin
38 SMITH ET AL. AJNR :2, January / February 1981
8 0 0
"om%
~ 12 om 'I\, -== 110m""
10 0"'''' - L.-----
60 30
..... 0
...... .... - I" -20 10 CT NUMBER OF CtnT VERSUS
TIME AS A FUNCTION OF HEMOGLOBIN CONCENTRATION
d011 110 12 doy3
16 24 32 40 48 56 64 72 (HOURS)
TIME
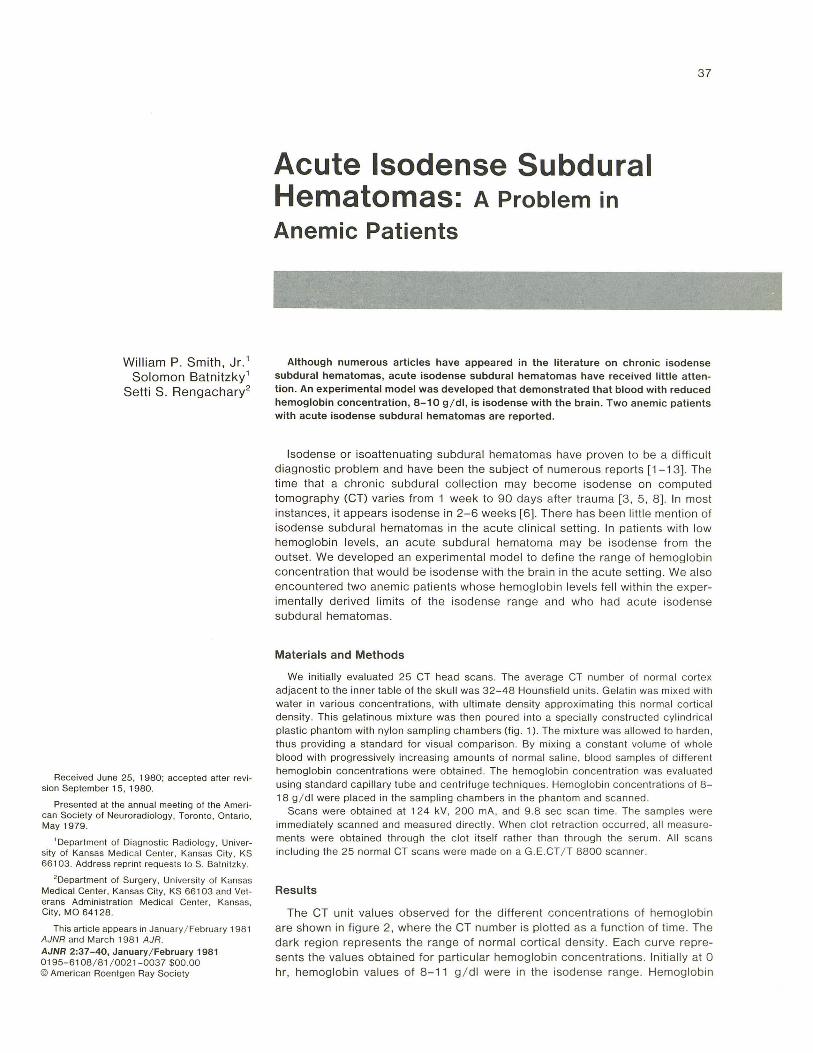
1 2 Fig. 1 .-Plaslic phantom has seven nylon sampling cham
bers inlo which blood with various hemoglobin concentrations was placed. Gelalinous mixture with same density as normal brain cortex surrounds chambers.
Fig . 2. -0ark region represents range of normal cortical density. Initially, blood with hemoglobin values of 8, g , 10 and 11 g/ dl was in isodense range. Samples of 8, 9, and 10 g/ dl hemoglobin remained in isodense range for first 24 hr. Thereafter, only hemoglobin values of 8 and 9 g / dl were in isodense range.
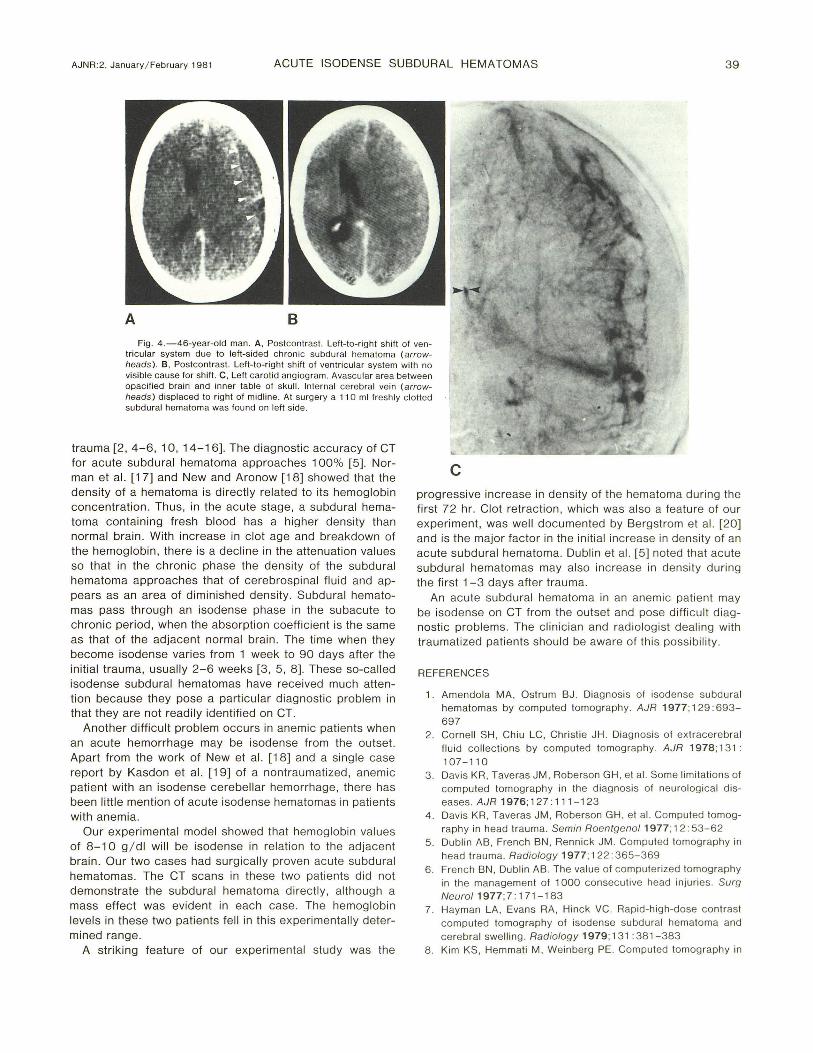
Fig . 3 .-Case 1, 9-month-old boy. Noncontrast scan . Poorly defined area of decreased density in right fronta l region with associated right-to-I eft shift of ventricular system. AI operation a 30 ml freshly c lotted subdural hematoma was found in right frontal region .
concentrations of 8, 9, and 10 g / dl remained isodense during the first 24 hr. Thereafter, only the 8 and 9 g / dl hemoglobin samples were in the isodense range. By 4 hr, disc rete c lots were noted in all samples. Clot retraction was complete by 48-72 hr. With the exception of the 15 g / dl sampl e, all samples showed progressive increase in the density through the sampling period, but by 72 hr, these measurements tended to plateau out. The density of the 15 g / dl sample of hemoglobin peaked at 16 hr, following wh ich there was a slight progressive fall.
Representative Case Reports
Case 1
A 9-month-o ld boy was admitted after he hit his forehead on the dashboard in an automobile acc ident. Physical examination revealed no lacerations or other extern al signs of injury. He was unresponsive, and his right pupil was fi xed and dilated . The anterior fontanelle was tense. The rest of th e physical examination was unremarkable. Noncontrast CT scan 2 hr after the acc ident dem-
onstrated a poorly defined area of decreased density in the right frontal region with a right-to-Ieft sh ift of the ventricular system (fig. 3). The patient's admission hemoglobin was 9.2 g / dl.
Because of his deteriorating c linical cond ition the patient was taken to the operat ing room for decompressive su rgery. A 30 ml freshly c lotted subdural hematoma was found and evacuated in the right frontal region . His recovery was uneventful.
Case 2
A 46-year-old male alcoholic was admitted in a confused and disoriented state . There were no external signs of head trauma. The pupils were equal but sluggishly reactive to light. He exhibited a mild right hemiparesis. The rest of his physical examinat ion was unremarkable.
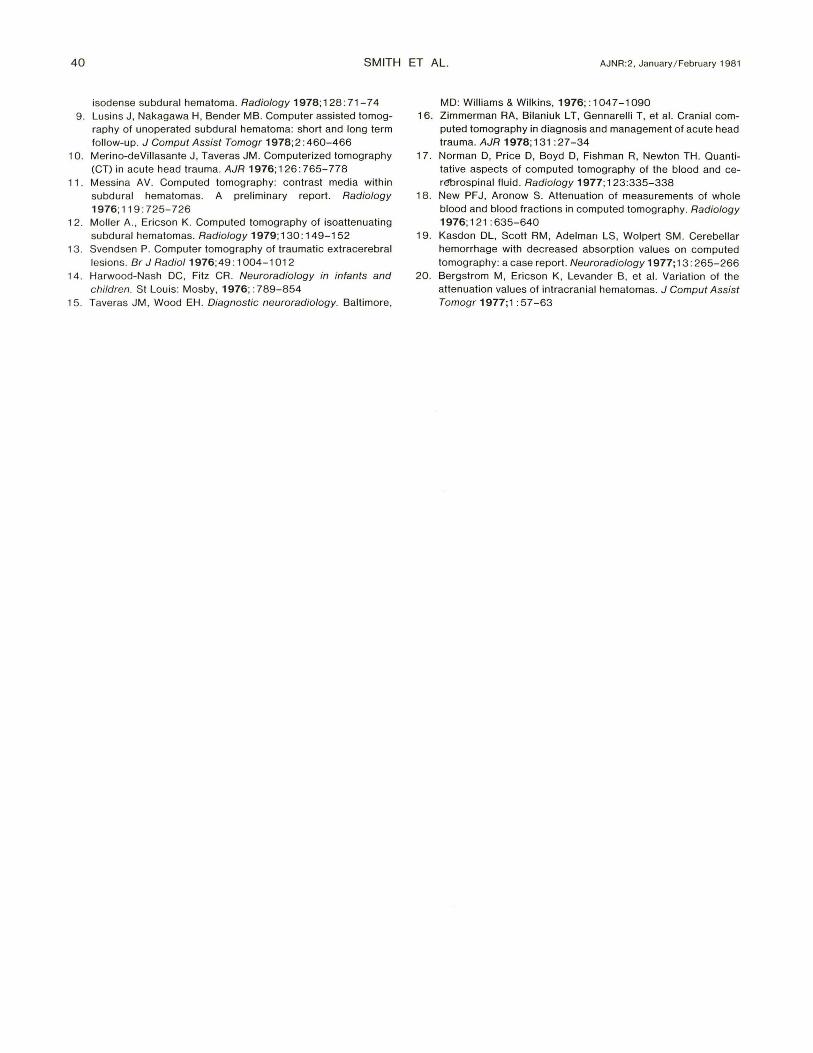
Computed tomography demonstrated a large left-to-right shift of the midline structures due to a chronic subdural hematoma on the left side. There was no enhancement after intravenous injection of iodinated contrast material (fig . 4A) . He was taken to the operating room and multiple left-sided burr holes were placed, evacuating the chronic subdural hematoma which drained without difficulty. Postoperatively he did well for 3 days; he started talk ing and his hemiparesis cleared .
However, on postoperative day 4 , he became obtunded with right hemiplegia. Computed tomography again demonstrated a left-toright shift of the ventricular system. However, no apparent cause for the shift was evident on the scan. A postcontrast scan did not provide any more information (fig. 4B). Left carotid angiography demonstrated a large left-sided extracerebral collection (fig. 4C). The patient was taken back to the operating room, where a 110 ml fresh ly c lotted subdural hematoma was found and evacuated from the left frontal parietal region . The patient did well postoperatively, remaining neurologically intact. His hemoglobin prior to the second surgery was 10.0 g / dl.
Discussion
Computed tomography has been established as the diagnostic procedure of choice in the management of head
AJNR:2, January / February 1981 ACUTE ISODENSE SUBDURAL HEMATOMAS 39
Fig . 4.-46-year-o ld man. A, Postcontrast. Left-to-right shift of ventricular system due to left-sided chronic subdural hematoma (arrowheads ). B, Postcontrast. Left-to-right shift of ventricular system with no visible cause for shift. C , Left carotid angiogram. Avascu lar area between opacified brain and inner table of skull. Internal cerebra l vein (arrowheads) disp laced to right of midline. At surgery a 11 0 ml fresh ly c lotted subdural hematoma was found on left side.
trauma [2,4-6 , 10, 14-16]. The diagnostic accuracy of CT for acute subdural hematoma approaches 100% [5]. Norman et al. [17] and New and Aronow [18] showed that the density of a hematoma is directly related to its hemoglobin concentration. Thus , in the acute stage, a subdural hematoma containing fresh blood has a higher density than normal brain . With increase in c lot age and breakdown of the hemoglobin , there is a decline in the attenuation values so that in the chron ic phase the density of the subdural hematoma approaches that of cerebrospinal flui d and appears as an area of diminished density. Subdural hematomas pass through an isodense phase in the subacute to chronic period , when the absorption coeffi cient is the same as that of the adjacent normal brain. The time when they become isodense varies from 1 week to 90 days after the initial trauma, usually 2-6 weeks [3 , 5, 8]. These so-called isodense subdural hematomas have rece ived much attention because they pose a particular diagnostic problem in that they are not readily identified on CT.
Another difficult problem occurs in anem ic patients when an acute hemorrhage may be isodense from the outset. Apart f rom the work of New et al. [1 8] and a si ngle case report by Kasdon et al. [19] of a nontraumatized, anemic patient with an isodense cerebellar hemorrhage, there has been little mention of acute isodense hematomas in patients with anemia.
Our experimental model showed that hemoglobin values of 8 -10 g / dl w ill be isodense in relation to the adjacent brain. Our two cases had surgicall y proven acute subdu ral hematomas. The CT scans in these two patients did not demonstrate the subdural hematoma directly, although a mass effect was evident in each case. The hemoglobin leve ls in these two patients fell in this experimentally determined range.
A striking feature of our experimental study was the
c progressive increase in density of the hematoma during the first 72 hr. Clot retraction , which was also a feature of our experiment, was well documented by Bergstrom et al. [20] and is the major factor in the ini tial increase in density of an acute subdural hematoma. Dublin et al. [5] noted that acute subdural hematomas may also increase in density during the first 1 -3 days after trauma.
An acute subdural hematoma in an anemic patient may be isodense on CT from the outset and pose diffi cult diagnostic problems. The cl inician and radiolog ist dealing with traumatized patients should be aware of this possibi li ty.
REFERENCES
1. Amendola MA, Ostrum BJ . Diagnosis of isodense subdural hematomas by computed tomograph y. AJR 1977; 129: 693-
697 2 . Cornell SH , Chiu LC, Christie JH . Diagnosis of ex tracerebral
fluid co ll ections by computed tomography. AJR 1978; 13 1 : 107-110
3. Davi s KR , Taveras JM, Roberson GH , et al. Some limitations of computed tomography in the diagnosis of neurologica l d iseases. AJR 1976 ;127 : 111-123
4 . Davis KR , Taveras JM , Roberson GH , et al. Computed tomograph y in head trauma. Semin Roentgenol 1977; 12: 53 - 62
5 . Dublin AB , French BN , Rennick JM . Computed tomograph y in head trauma. Radiology 1977; 122: 365- 369
6 . Frenc h BN , Dublin AB . The value of computeri zed tomography in th e management of 1000 consecutive head injuries. Surg Neuro/1977;7 : 171 - 183
7. Hayman LA, Evans RA , Hinck VC. Rapid-high-dose contrast computed tomography of isodense subdural hematoma and cerebral swelling . Radiology 1979; 13 1 : 381-383
8. Kim KS , Hemmati M , Weinberg PE. Computed tomography in
40 SMITH ET AL. AJNR:2, January / February 1981
isodense subdural hematoma. Radiology 1978; 128: 71-74 9. Lusins J, Nakagawa H, Bender MB. Computer assisted tomog
raphy of unoperated subdural hematoma: short and long term follow-up. J Comput Assist Tomogr 1978;2:460-466
10. Merino-deViliasante J, Taveras JM . Computerized tomography (CT) in acute head trauma. AJR 1976; 126: 765-778
11 . Messina AV. Computed tomography: contrast media within subdural hematomas. A preliminary report. Radiology 1976;119:725-726
12. Moller A., Ericson K. Computed tomography of isoattenuating subdural hematomas. Radiology 1979; 130: 149-152
13. Svendsen P. Computer tomography of traumatic extracerebral lesions. Br J Radiol 1976; 49 : 1 004-1 012
14. Harwood-N ash DC, Fitz CR . Neuroradiology in infants and children. St Louis: Mosby, 1976; : 789-854
15. Taveras JM , Wood EH . Diagnostic neuroradiology. Baltimore,
MD: Williams & Wilkins, 1976;: 1 047-1 090 16. Zimmerman RA, Bilaniuk L T, Gennarelli T, et al. Cranial com
puted tomography in diagnosis and management of acute head trauma. AJR 1978; 131 : 27 -34
17. Norman D, Price D, Boyd D, Fishman R, Newton TH. Quantitative aspects of computed tomography of the blood and cerebrospinal fluid. Radiology 1977; 123:335-338
18. New PFJ, Aronow S. Attenuation of measurements of whole blood and blood fractions in computed tomography. Radiology 1976;121:635-640
19. Kasdon DL, Scott RM , Adelman LS, Wolpert SM . Cerebellar hemorrhage with decreased absorption values on computed tomography: a case report. Neuroradiology 1977; 13 : 265-266
20. Bergstrom M, Ericson K, Levander B, et al. Variation of the attenuation values of intracranial hematomas. J Comput Assist Tomogr 1977;1 :57-63