ad 273 547 - dtic.mil ad 273 547 armed services ... 2 - data collection form 3 3 ... comments and...
TRANSCRIPT
UNCLASSIFIED
AD 273 547
ARMED SERVICES TECHNICAL INFORMATION AGENCYARLINGTON HALL STATIONARLINGTON 12, VIRGINIA
UNCLASSIFIED

NOTICE: When government or other drawings, speci-fications or other data are used for any purposeother than in connection with a definitely relatedgovernment procurement operation, the U. S.Government thereby incurs no responsibility, nor anyobligation whatsoever; and the fact that the Govern-ment may have formula;ed., furnished, or in any waysupplied the said drawings, specifications, or otherdata is not to be regarded by implication or other-wise as in any manner licensing the holder or anyother person or corporation, or conveying any rightsor permission to manufacture, use or sell anypatented invention that may in any way be relatedthereto.

C** PROJECT 101-43-5S
NORTH ATLANTICAIR TRAFFIC ANALYSIS:
AUGUST 25, 1961, FLIGHT DATA
FEBRUARY 1962
So FEDERAL AVIATION AGENCY*Aviation Research & Development Service
SYSTEM MANAGEMENT DIVISION
AIR TRFI0NAYI*

A REPORT
NORTH ATLANTIC AIR TRAFFIC ANALYSIS:AUGUST 25, 1961, FLIGHT DATA
PROJECT 101-43-5S
PREPARED BY:
Richard M. Warfield
FEBRUARY 1962
This report has been approved for general distribution.
Jos h D. BlattDiector, Aviation Research
and Development ServiceFederal Aviation Agency
System Management DivisionWashington 25, D. C.
I

System Management Division, Aviation Research and Development Service,Federal Aviation Agency, Washington, D. C.
NORTH ATLANTIC AIR TRAFFIC ANALYSIS: August 25, 1961, Flight Data,
by Richard M. Warfield, February 1962, 59 pages.
ABSTRACT
This report summarizes flight data for August 25, 1961, the second oftwelve monthly peak days to be analyzed in conjunction with the NorthAtlantic Region Traffic Survey being conducted by the United States FederalAviation Agency. The material presented was prepared from machinetabulations of flight plan information coded into IBM cards.
A total of 417 unduplicated flights (i. e., flights counted only once regard-less of the number of OACC's involved) flew somewhere within the NorthAtlantic Region between 0000-2359Z on August 25, 1961. Forty of theseflights were airborne at OOOOZ and 27 were airborne after 2359Z. In orderto eliminate the overlap incurred by counting both flights airborne at thebeginning as well as the end of the day, the 27 flights airborne at the endof the day were subtracted from the 417 flights to give a representativepeak day total of 390 flights. Most of the tabulations in this report are interms of these 390 flights. The distribution of these flights by ownershipand aircraft class is summarized below:
Number of Flights
Aircraft Class Civil Military TotalPiston 84 88 172Turboprop 32 13 45Turbojet 161 12 173Total 277 113 390
Figure 1 illustrates traffic flow. Flights classified relative to the NorthAtlantic Region (12 OACC I s) are summarized below:
Flight Class Flights PercentOverflights 246 59Arrivals 72 17Departures 78 19Within 8 2Round Robin 13 3Total 417 100
The peak instant for airborne activity occurred at 0424Z when 85 aircraftwere simultaneously airborne. Figure 8, page 31, shows a plot of aircraftlocations and approximate headings at the peak instant.
- ii -

c0
C4
.4o
0
.4-
0
0).-
2
TABLE OF CONTENTS
Page
Abstract.... . . . . . . . . . . . . . . . . . ii
List of Tables . . . . . . . .. .. . . . v
List of Figures . . . . . . . . . . . . . . . .. .. vi
Introduction . .. a a . .. . . * . . .a * * . 1
Scope of Atnalysis . . . . . . . . . . o . o . . . . 2
Traffic Data. , ......................... 6
Aircraft Type and Country of Ownership . . . . . 7
Traffic Flow a * 0 * * 0 * * * . . . . 0 * * * 10
True Air Speed . . . . . . . . 9 . 0 * 0 . 0. 19
Altitude . .... . . . . . . . . . .* a a o 23
Hourly Activity .... . .... . * .0 .0 00 26
Peak Activity .... . . . .. 0 * . . . 30
Meridian Crossing Analysis .. . . . .* 32
Latitudes 0 0 0 . 0 0 * . 0 0 0 .0 0. g . . 34
Altitudes * * . . .. .0 a . 0.00 0 36
Times . . . . . . . . . . 0 . .. . . . . 37
Separation . .0. . .0. . . . . . . . .. . 38
Appendix: Data Processing . . . . .. . . . . . . . 48
- iv -

LIST OF TABLES
Page
Table 1 - Monthly Summary of Daily Flights 5
2 - Country of Ownership 8
3 - Aircraft Type 9
4 - Traffic Flow 14
5 - True Air Speed 20
6 - True Air Speed/Altitude Relationship 22
7 - Altitude 24
8 - Hourly Entries and Exits 27
9 - Instantaneous Airborne Counts 28
10 - Peak Aircraft Count 30
11 - Meridian Crossing Latitudes 34
12 - Meridian Crossing Altitudes 36
13 - Meridian Crossing Times 37
14a - Time Separation (All Flights) 38
14b - Time Separation (Eastbound Flights) 40
14c - Time Separation (Westbound Flights) 41
14d - Time Separation (Altitudes 31,000 42
feet and above)
14e - Time Separation (Altitudes less than 4331,000 feet)
SV -

LIST OF FIGURES
Page
Figure 1 - North Atlantic Traffic Flow iii
2 - Data Collection Form 3
3 - Eastbound Flow 12
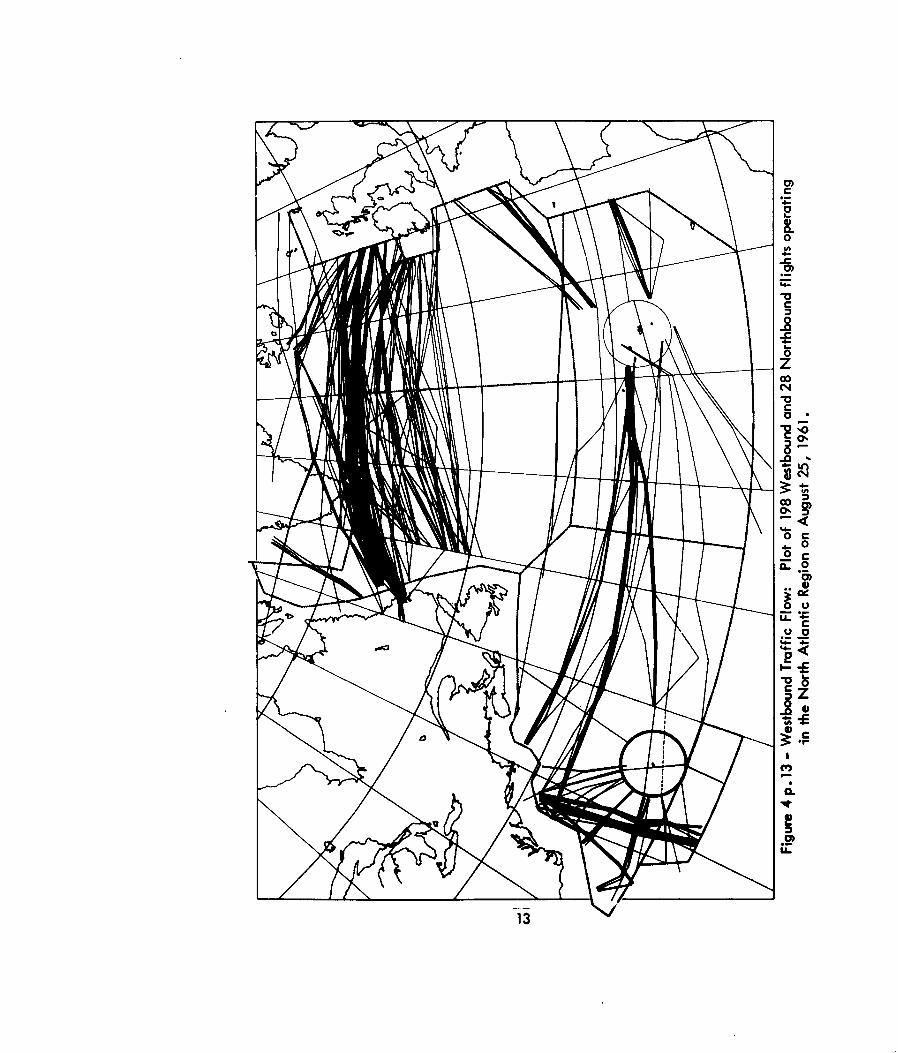
4 - We stbound Flow 13
5 - True Air Speed 21
6 - Cruise Altitudes 25
7 - Instantaneous Airborne Count 29
8 - Peak Instant Aircraft Locations 31
9 - Meridian Crossings 35
10 - Time Separation 39
1 la - Flight Separation (200 W, Meridian- 4433,000 ft. Flight Level)
llb- Flight Separation (300 W, Meridian- 4533,000 ft. Flight Level)
11c - Flight Separation (400 W Meridian- 4633,000 ft. Flight Level)
lIld- Flight Separation (50 W Meridian- 4733,000 ft. Flight Level)
12 - Flight Data Worksheet - IBM Card 49Format
-vi-
I
INTRODUCTION
The results in this report were derived from the August 1961traffic data collected in the North Atlantic Region Traffic Survey.This survey is being conducted by the Federal Aviation Agency asa joint project between the Air Traffic Service and the AviationResearch and Development Service. The coordination and collectionof peak day flight plan data from the 12 participating Oceanic AreaControl Centers is being accomplished under the direction of Cmdr.Clinton H. Mundt, USN, Air Traffic Service. Analysis of the dataand preparation of forecasts of air traffic activity in the NorthAtlantic Region is being undertaken by the Aviation Research andDevelopment Service.
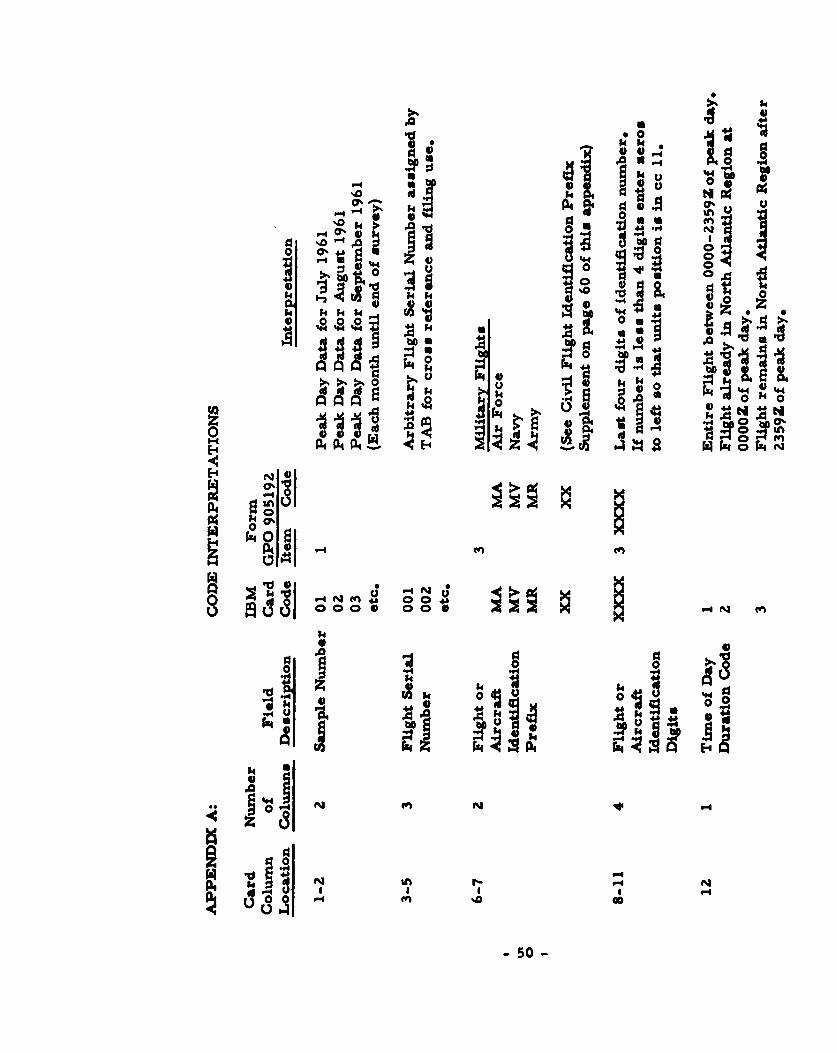
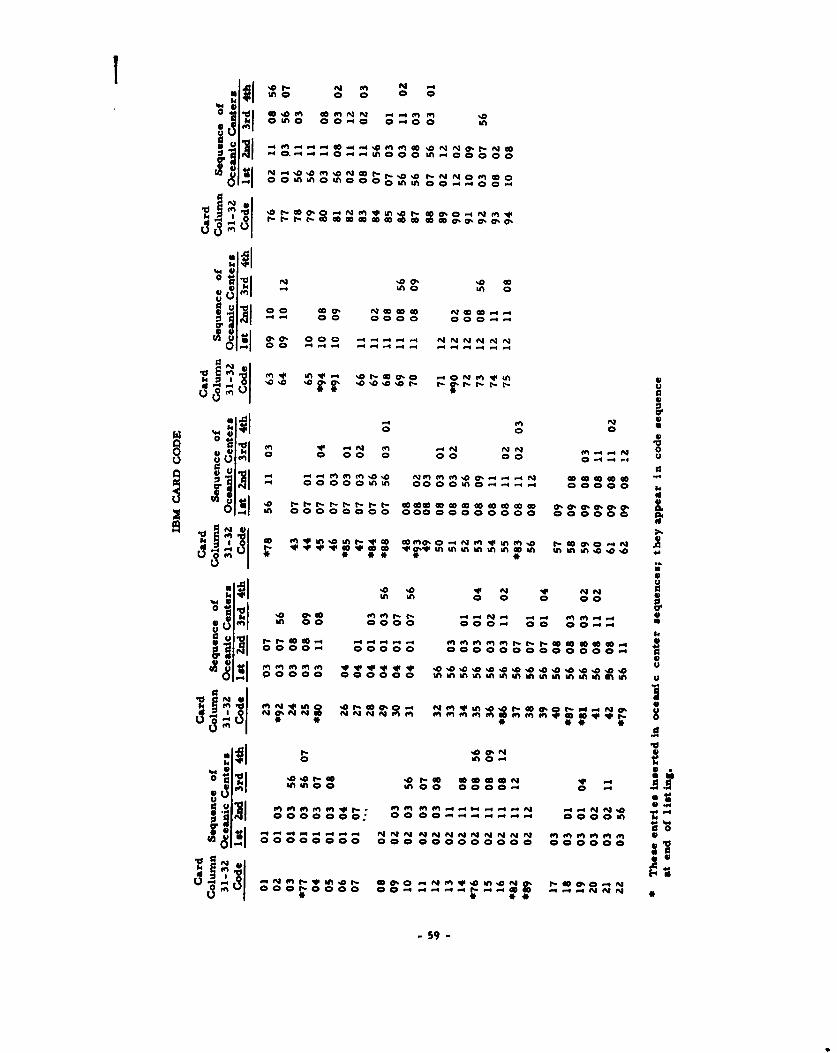
The material presented was prepared by Mr. R. M. Warfieldfrom machine tabulations of flight plan information which has beencoded into IBM cards. A description of code interpretations andcard format is included as an appendix to this report. This reportis exploratory in nature in that this data and additional data as itbecomes available will receive further analysis and processing.Comments and criticisms of this report and suggestions regardingfuture analysis are invited.
SCOPE OF ANALYSIS
Data Sources
Data on flights for the peak North Atlantic Region traffic dayeach month beginning with July 1961 is being collected from eachof the twelve Oceanic Area Control Centers (OACC's) listed below:
1. Bermuda OACC, Bermuda Islands2. Bodo OACC, Bodo, Norway3. Gander OACC, Gander, Newfoundland4. Goose OACC, Goose, Canada5. New York OACC, New York, N.Y.6. Prestwick OACC, Prestwick, Scotland7. Reykjavik OACC, Reykjavik, Iceland8. Santa Maria OACC, Santa Maria, Azores9. Shannon OACC, Shannon, Ireland
10. Stavanger OACC, Stavanger, Norway11. Sondrestrom OACC, Greenland12. Thule OACC, Greenland
The traffic data in this report pertains to the August 1961 peakday flights. It was prepared largely from machine tabulations of IBMcards containing coded flight plan data for the 36-hour period, includingthe peak day (August 25, 1961), and six hours prior to and six hoursfollowing the peak day, reported on data collection form Number GPO905192 (see Figure 2, page 3) for each flight in each OACC and forwardedto the United States Federal Aviation Agency for processing. A descrip-tion of code interpretations and card format is included in Appendix Aof this report.
Selection of August 25, 1961, as the peak day for August 1961 wasmade from an inspection of the daily traffic count summary of OACCactivity shown in Table 1 on page 5. Daily oceanic traffic counts bycivil and military flights are reported to the United States Federal IAviation Agency's Message Center, Washington, D.C., by each OceanicArea Control Center at the end of each month. On the basis of thesemessage reports FAA designates the peak day and each OACC fills out [an individual flight data form indicated in the previous paragraph.
-2-

1 -i -u'A _U.~.~ ,!L. U
'wU.
Co _
Z Iu 4
am ~ I Of O
04 sea *~
0
QLi IHii HIIEu Ii
*K B! U.
3 Piz 49 0: C;I
Traffic Activity Measurements
This report summarizes data developed on the followingmeasures of traffic activity:
1. Aircraft Type2. Aircraft Ownership3. Traffic Flow4. True Air Speed5. Altitude6. Hourly Activity7. Peak Activity8. Meridian Crossing Latitudes9. Time Separation
Method of Data Processing
The forms for each flight were assembled separately bystapling the forms from each OACC reporting the flight in chrono-logical order. The forms were then edited for consistency andcompleteness and each flight recoded onto a worksheet and sub-sequently punched into IBM cards. A copy of the worksheet anda description of the code interpretations and IBM card format areincluded in Appendix A, page 48.
Deficiencies and Limitations
The matching of flight forms from different OACCs presentedsome difficulties. Careful processing and editing of forms did notentirely eliminate ambiguity since the 36-hour reporting periodoverlaps three days and many flight identifications are repeated ona daily basis so that the exact date a flight occurred was in doubtin some cases. Participating OACC s have been requested to enterthe day of month in Item I of reporting form strictly consistent withthe entrance recording center fix time (GMT) of Item 9 to minimizefuture trouble. On the whole, the quality and legibility of thereporting was excellent. This report does not contain airspacereservation data.
-4-

ROOML AVIAIS AGWWC
lable 1 - NONTN ATLANTIC N1I11 TRAFFIC SUIVEY-MONTNLY SIMUARY-AILY FLIIINTS
-17- 13+ I I L L L. L L L L L L L L .L L L I .,. .t " '
37" 25 39 29 32 A 35+ I ) z"1 5 3 2 7 0 5 7 01 6 5 46 U 32 2k 66
- 6U u Ui 2 8 6 0 0 tl 8 3 U 6 3 3 1. 61 9 5 11 VU 7 15 1 2 4 81,6 I 78 80 0
2
. ' I I
S1 8 6 2 25 39 21 2 37 4 31 33 30 34 '507 57 10 14735 8011. '
1 11 1 1J 1 1 2 2V 15026 1 .61 127 3in 26 1. 150. 1. 160 2 10MA 1
3 48913 253150 U 2 2337 35 4 635172722 23 57 6 637 281 A 23, 11W55 55 "179"
16 18 71751 lkl8 1 61 1 72 91 1 M 2871M 9 .183 0 197 193 1 6 14 37 158:6170112172M IN25 2 15573,
49 16378 671 61 41 26263 Al A1 29 2 35 291 L.61 4 29 321U254 52,74.a7 6 3 74.197c
4 1 1 3 2 1 1 8 n U 11 U U 1 0 U 1 6 1, 9 21 3 U 2 5 1l 1 32 . 14 20 U 1 1 6 1 2 3 9 21 0 . 0 .0 1
63 761 9 6 93 6' 6 7 3 16 81. ?0 3 650 47 59 66 661 92 836 57 o1 43 9 1798,
h! g372 1 9 62 60 63 25 51 56 92 64 6326566.1 96 9 8 90 1 1 324 227 82 86 697 21 !2 I.2151,3717 26 5 62 6 2 8 36 58 5 52 60 0 33 39 69 63 1675 0. 6516 8 76 67 51 235.
S 27 2155 181U5 1 7 2 819110 1 02U8 316 119 108 83129172171 1166175 17 17 1 353 150 91 1753786'c 2 . h 21 21 3, 3_ 5 W 2. 1. 1 3 5 1 1. 0 0 0 1. 0 6 11 2 01 5 2 3 2 7. 3 81.'
- 1 d 2 0 . 1 2 1 J 0 0 0 0 0 0 0 1 0 0 01 0 0 0 1 0 0 0 5 1"- I 9 2 8 5 3 1 3 5 1 1 0 0 0 51 0 6 11 2 0 5 3 3 2 7 8 91'
1- V.3 UP 17 j3 151. 11.1.A 131. 253 1J279 1 261. 913154 166 357 162179 I57 2381US 1591162 179 164 170 3591 )O,170 _781.894 cLn .6 L23 2271 27141 0 3.43231.3 57.4351 31235250 54.31 4.24.31 42142556 1 29
-9 , ,+ ,11K 1 -182 91h 1M209 21 191 203 179 2 11209218 13 2 20918 20P20210 303 95 220201 213 215 220 6153 I
2A 31 23 2 32 231 21 17 26 26 28 16 17 29 18 29 25 35 19 2 23 171 31 27 31 23 1 21 16 31 7301'
?5 2--22 9 ill 7 3556 3240 391.0 .6 381633161221.4281.71.9137 3729 321.231.l 62U.76.
91 63 61 62 66 6' 53 2 . 6 0 55 66 65 56 75 58 51 31 2516 836 471 52 166 3 509 31 60'
1521 Ull VA 7n3715 33 151 135 4 26 9 116 U6.15 50.11561US 15,9581361501_53 155171 .70 W 691 MIL61761 1761.818i
- 2.',3135 5 2. 25 40335125135 3737 3a1.8292,43353 28 4537 1913427 35 381.6 .61088ON
-M J IJ&2 ~173 M ~27 1821 2M 188 lf N20 197201M189 178 1"8192 1931204 196 180 1"9222 222'5906'
10166 467f 8668 52 8? 70 85 8791618 9883 8191799"1165 688182 5 12578:3 8535 67 M79 97 7 7792 1 1679. 3960810678167 9.60
__85 - 2 _3 _9 2 112 1 . 3 3 1 3301 32 73'1 1 3 1 191 12 _ 2 3 7 6 1. 7 1. 71 8 0 158,
_U33 1 11913 7 3 7 81I 9 1 2 0 20 1 32 12 1 .2521 08 169 63
-- - - - - - - - - - - 0 - - - 0 0 .+-,--?
;'2
S7. 3 2 h 3 2 2 l 2 3 1 2 3 1 I 3 1 1 7 3
31 J2 23 1 1 19 n _ . 4 6 2 2, 20 21 2 7221.31. 722 61.21202 2 2633
...... j2IJ j u s" 2AJZ 33,2l7 1_ 7 5 679U 91 538 1 32 767 10 71927"
a- 3 J J 6i 31 3 X 6131 _34 21 1 2 8 2 6 13t 1 2 75 561. 0 1 2963
9h 2i 1 2 1 3.123 2 1.2332 1. _ 870,8
TRAFFIC DATA
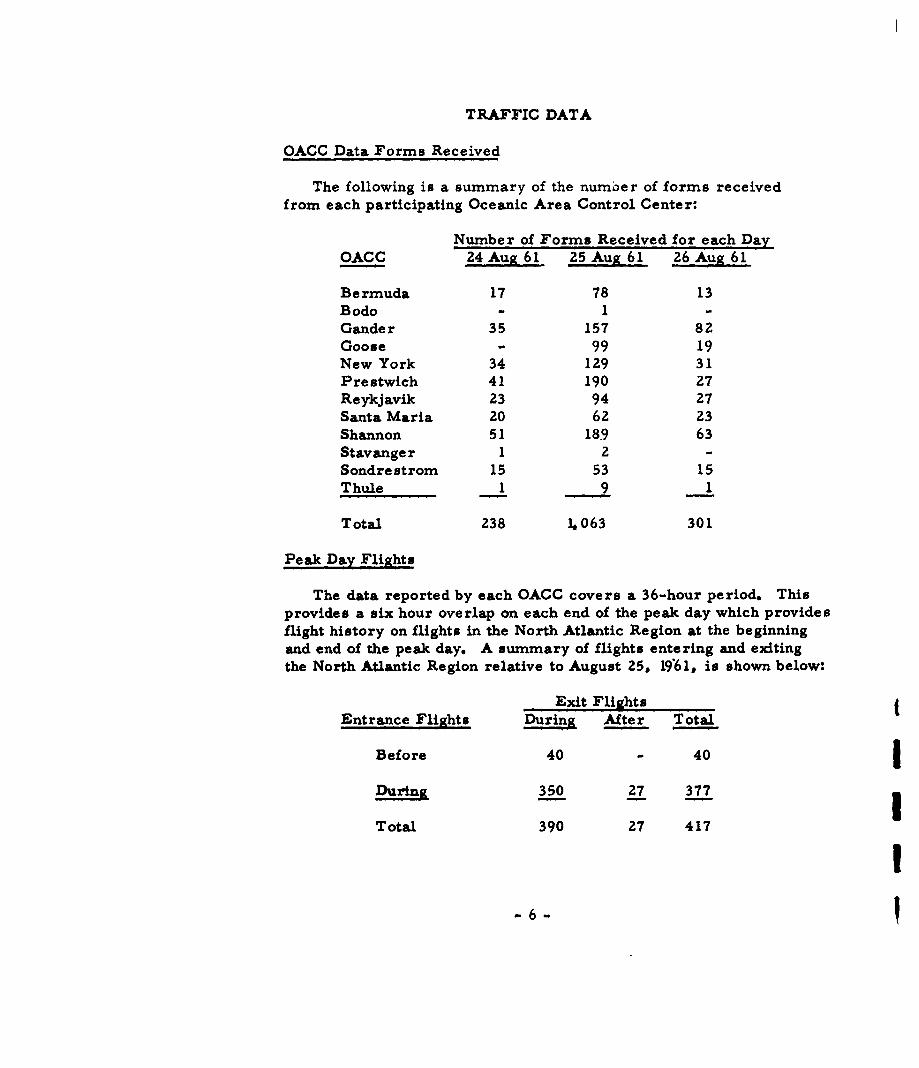
OACC Data Forms Received
The following is a summary of the number of forms receivedfrom each participating Oceanic Area Control Center:
Number of Forms Received for each DayOACC 24 Aug 61 25 Aug 61 26 Aug 61
Bermuda 17 78 13Bodo - 1 -
Gander 35 157 82Goose - 99 19New York 34 129 31Prestwich 41 190 27Reykjavik 23 94 27Santa Maria 20 62 23Shannon 51 18.9 63Stavanger 1 2 -Sondrestrom 15 53 15Thule 1 9 1
Total 238 1,063 301
Peak Day Flights
The data reported by each OACC covers a 36-hour period. Thisprovides a six hour overlap on each end of the peak day which providesflight history on flights in the North Atlantic Region at the beginningand end of the peak day. A summary of flights entering and exitingthe North Atlantic Region relative to August 25, 19"61, is shown below:
Exit Flights
Entrance Flights During After Total
Before 40 - 40
During 350 27 377
Total 390 27 417
-6

In this report, the 390 exit flights were used as representativeof a peak day. This was done to eliminate the overlap incurred bycounting both flights in the area at the beginning as well as flightsin the area at the end of the day. If the entrance flights ( 377 inthis case) had been larger than exit flights it would have been usedto represent the peak day.
Country of Ownership
Table 2, page 8, shows the distribution by country, civil ormilitary ownership and aircraft class.
Aircraft Types
Aircraft types for the peak day are summarized by aircraftand ownership class in Table 3j page 9.
I
I

",I LA %D (7% LA en 0> Q% 00 LA Ln '04 't q4 '14 en N N N - '- -..4- N V 4 4- l$0N
93 o 4mA-4 r
4,1-
U 0r$4 -4
q4mb
0-4
0 r-1-%0-N
0 [
N 0-4 000000000000000000000000 e
N..N 0 00 0 0 .40 - 0 - 0
C4 ;4 ;4 (
to ,4 -O 0 '0 0 0 CO 0 r 0 0 -000 C> 0 '0 0-4 000-4000 4 LA
%0N
-4-
g,
04 -4 1 04 $4 U ) 4.
(0v
0 0~2U4(U~~'
boUZ.4Z ±~~<U-0Cd-8-

Table 3 - AIRCRAFT TYPE: Distribution by AircraftClass and Type by Ownership for Flights inthe North Atlantic Region on August 25, 1961
SUMMARY
Ownership ClassAircraft Class Civil Military Total
Piston 84 88 172Turboprop 32 13 45Turbojet 161 12 173Total 277 113 390
PistonCivil Flights045 1DC3 2 TurbopropDC4 6 Civil FlightsDC6B 60DC6B 10 BRTA 27DC7 12 CL
D07B 4 V7DC7C 11 V170 2
D7 l2V180 2DC7 12 Total 32L049 23L649 3Total 8Mil. Flights
Mil. Flights C133 13B50 1C118 25C119 2C121 10 TurbojetC123 I Civil Flights
C124 15C131 3 B707 88
C54 4 B720 3
C97 4 DC8 66
HAST 1 DH04 4KC97 3 Total 161
P2V 1P5M 1 Mil. FlightsR4D 1RSD 1 B47 9R51) 1R7V 1 B66 1
T29 2 MJB 1
UF2 1 VCTR 1
Wvz 11 Total 12
Total 88
-9-
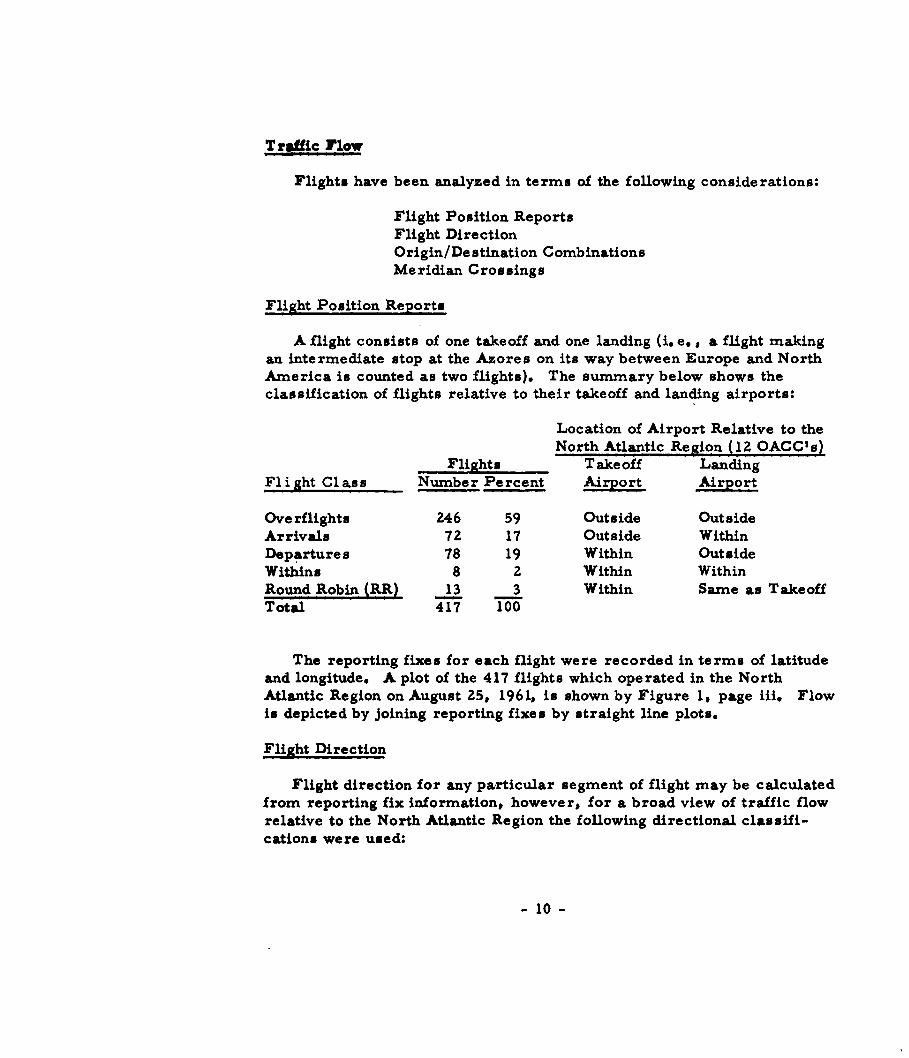
Traffic Flow
Flights have been analyzed in terms of the following considerations:
Flight Position ReportsFlight DirectionOrigin/ De stination CombinationsMeridian Crossings
Flight Position Reports
A flight consists of one takeoff and one landing (i.e., a flight makingan intermediate stop at the Azores on its way between Europe and NorthAmerica is counted as two flights). The summary below shows theclassification of flights relative to their takeoff and landing airports:
Location of Airport Relative to theNorth Atlantic Region (12 OACC's)
Flights Takeoff LandingF1 i ght Cl ass Number Percent Airport Airport
Ove rflights 246 59 Outside OutsideArrivals 72 17 Outside WithinDepartures 78 19 Within OutsideWithins 8 2 Within WithinRound Robin (RR) 13 3 Within Same as TakeoffTotal 417 100
The reporting fixes for each flight were recorded in terms of latitudeand longitude. A plot of the 417 flights which operated in the NorthAtlantic Region on August 25, 1961, is shown by Figure 1, page iii. Flowis depicted by joining reporting fixes by straight line plots.
Flight Direction
Flight direction for any particular segment of flight may be calculatedfrom reporting fix information, however, for a broad view of traffic flowrelative to the North Atlantic Region the following directional classifi-cations were used:
- 10 -

Landing AirportTakeoff Bar- Green- Ice- No. So.Airport Azores muda Europe land land Amer. Amer.
Azores RR West East North North West WestBermuda East RR East North North West SouthEurope 1/ West West RR West West West WestGreenland South South East RR East We st SouthIceland South South East We st RR West South
No. Amer. 2/ East East East East East RR SouthSo. Amer. 3/ East North East North North North RR
1/ Including North Africa2/ Including U. S. . Canada, Alaska and Newfoundland3/ Including Caribbean Island and Latin America
A summary of the directional classifications for the flights in the NorthAtlantic Region on August 25, 1961, is shown below:
FlightsFlight Direction Number Percent
Eastbound 146 35Westbound 198 47Northbound 28 7Southbound 3Z 8Round Robin 13 3Total 417 100
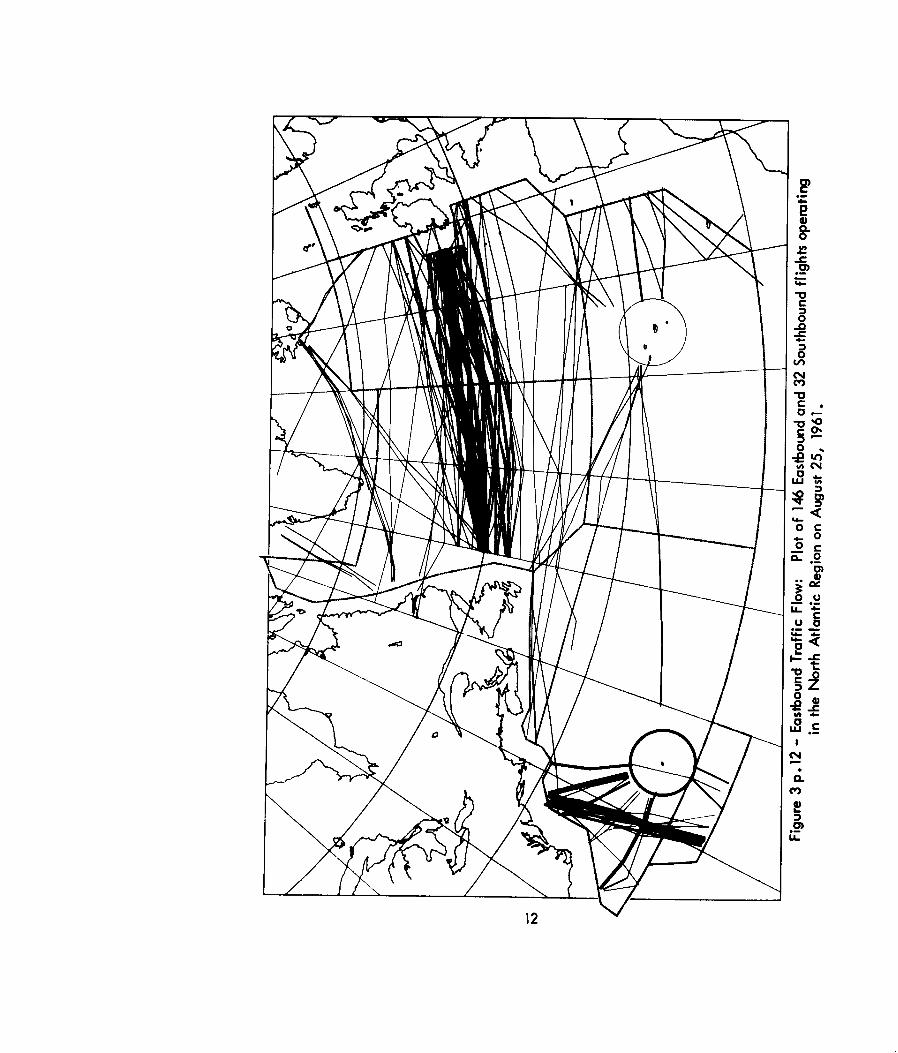
Figure 3, page 12, shows a plot of Eastbound and Southbound flights;Figure 4, page 13, shows a similar plot for Westbound and Northboundflights.
Origin/De stination Combinations
Table 4, page 14, lists the origin (takeoff) and destination (landing) air-ports for the 417 flights which operated in the North Atlantic Region on
August 25, 1961.
Meridian Crossings
The eastbound and westbound traffic flow across the 200 W, 300 W, 400 Wand 500 W longitude meridians has been analyzed in some detail. The method
of analysis and results are contained in pages 32-47, inclusive.
- 11 -
0~
_0
0)
-0
0(AC4
0
-a O0 '.
0
-0~
0)
000
'4-
F.
00
.,. 0-o
0)dt4)
00
z
130

Table 4 - TRAFFIC FLOW: Origin/Destination Combinationsby Aircraft Operating in and through Oceanic Centersof the North Atlantic Region on August 25, 1961
Location LocationIdentifier * Flights Identifier * FlightsOrig. /Dest. Civil Mil. Total Orig. /Desat. Civil Mil. Total
BGSF-BGSF Z 1 3 CYJT-BIKF I I" CYQX 1 1 " EDAF 1 1" EHAM 1 1 " EGPK 3 3
EKCH 1 1 " LFPO 2 2KDOV 1 1 " MXKF 1 1KFMH 1 1 1 7 8KLAX 1 1
6 3 9 CYQX-EDDF 1 11 1
BGTL-BGSF 1 1" CYYR 1 1 CYQY-EINN 1 1
2 2 1 1
BIKF-BIKF 6 6 CYUL-EDDF 1 1
"1 CYAR I I EGLL 1 1" CYQX 1 1 EGPK 3 3" CYUL 2 2 EHAM 1 1" CYYR I I LFPO 1 1" KIDL 1 1 LIMC 1 1
4 8 12 LPAZ 1 19 9
BIRK-EGLL 1 1EGPF 1 1 CYYQ-BGTL 1 1ELLX 1 1 1 1
3 3CYYR-BGSF 2 2
CYAR-BIKF 2 2 " BGTL 2 2" LPLA 1 1 " BIKF 1 1
3 3 BIRK 3 3
EGXJ 1 1CYEG-BGSF 1 1 " EHAM I I
1 1 5 5 10
CYFB-EGLL I I CYYZ-EGLL 1 I1 1 T 1
CYHZ-LKPR I I EBBR-CYUL 1 11 I " KIDL I 1
2 2
-14-

Table 4 - TRAFFIC FLOW: (continued)
Location LocationI de ntifie r *F1 ights I dentifie r *FlightsOrigo /De at, Civil MUl, Total Orig. /De at. Civil MUl. Total
EDAF-LPLA 3 3 EGPK-KBOS 1 13 3 KDTW 1 1
KIDL 3 3EDAR-LPLaA 1 1 12 6 181 1
EGUA-KLNK I 1EDD.F-KBOS 1 1 1 1KIDL 2 2KWRI 1 1 EGUN-LPLA 3 37 4 3 3
EDDK-KIDL 11 EGVA-KLKC 2 211 T 2
EGCC-CYUL 1 1 EGVI-KLCK 2 21 1 2 2
EGLL-BIKF 1 1 EGVN-BIKF 1 1ifBIRK 1 1 itKPSM 1 1ofCYUL 3 3 2 2itCYWG 1 1CYYR 1 1 EGYM-EGYM 1 1KBOS 3 3 1 1KIDL 9 9KPHL 1 1 EHAM-BGSF 1 1
20o 20 BIKF 1 1CYUL 3 3EGOA-EGOA 1 1 KBOS 1 1
1 1 KIDL 2 28 8EGPF-BIRK 1 1
1 1 EINN-CYQM 2 21CYQX 7 7EGPK-BIKF 2 2 :1 CYUL 2 211CYAR 1 1 "CYYR 3 3ItCYJT 4 4 "KDTW I IofCYUL 3 3 "KIDL 11 11ofCYWG 1 1I KWRI 1 1ofCYYT 1 1 27 27toCYYZ I 1
- 15
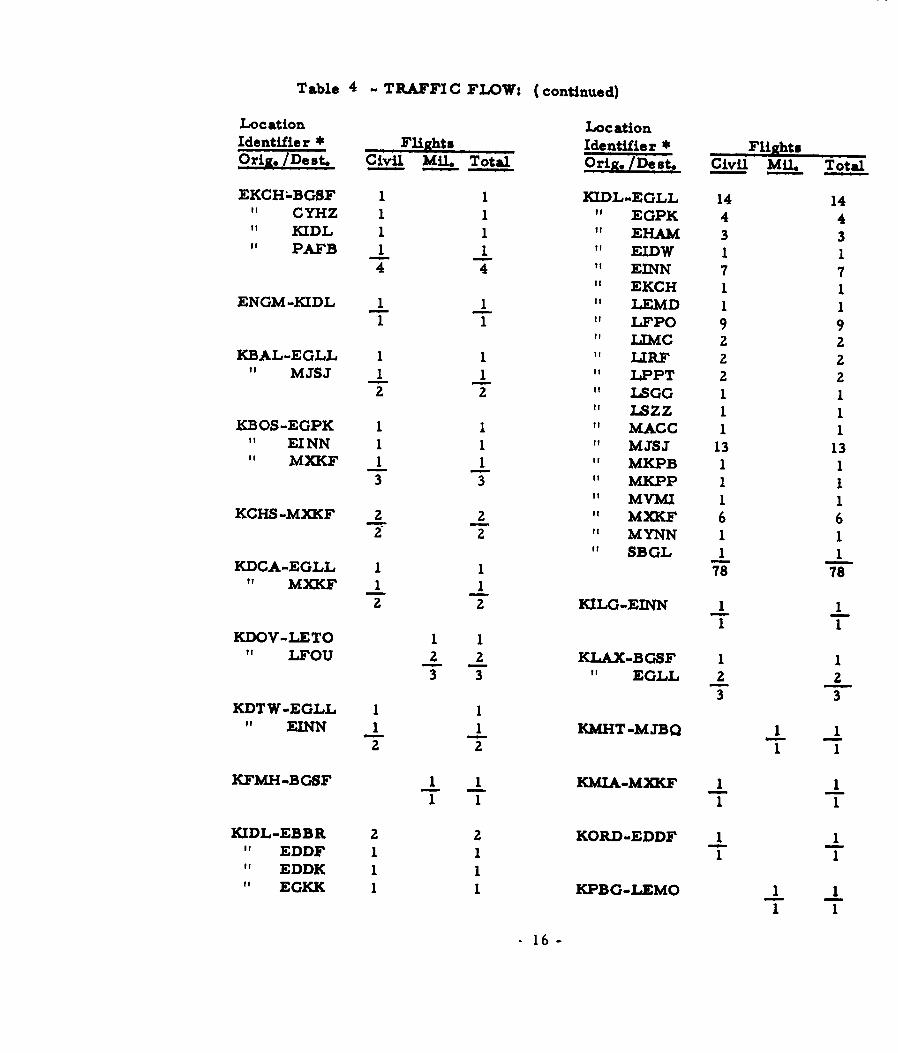
Table 4 - TL4.FFIC FLOW: (continued)
Location LocationIdentifier *Flights Identifier *FlightsOrig. /Des. Civil Mil. Total Orig. /Dest.. Civil Mi. Total
EKCH-.BGSF 1 1 KIDL-EGLL 14 1411CYHZ 1 1 11 EGPK 4 4
KCIDL 1 1 it EHAM 3 3PA.t 1 if EIDW 1 1
4 4 "ZINN 77itEKCH I
ENGM-KIDL 1 1it LEMD 1 11 1"LFPO 9 9
"12MG 2 21KBAL-EGLL 1 1 "LRF 2 2
MJSJ 1 1 "LIPPT 2 22 2 "LSGG 1 1
it 1SZZ 1 1KBOS-EGPK 1 1 "MACC 1 1
ZINN 1 1 "MJSJ 13 13MXF 1 1 "MKPB 1 1
3 3 " MKPP 1 1MYMI 1 1
KCHS-MXKF 2 2 "mimy 6 62 2 MYNN 1 1
SBGL I IK.DCA-EGLL 1 1 78 78
it MXKF 1 12 2 KILG-EINN 1 1
1 1KDOV-LETO 1 1
LFOU 2 2 KLAX-BGSF 1 13 3 it ZOLL 2 2
3 3KDTW-EGLL 1 1
it ZINN 1 1 KMHT-MJBQ 1 12 2 1 1
KFMH-BGSF 1 1 KMIA-MXKF 1 11 1 1 1
KIDL-EBBR 2 2 KORD-EDDF 1 1ofEDDF 1 1 IitEDDK 1 1ffEGXK 1 1 KPBG-LEMO I 1
1 716 -
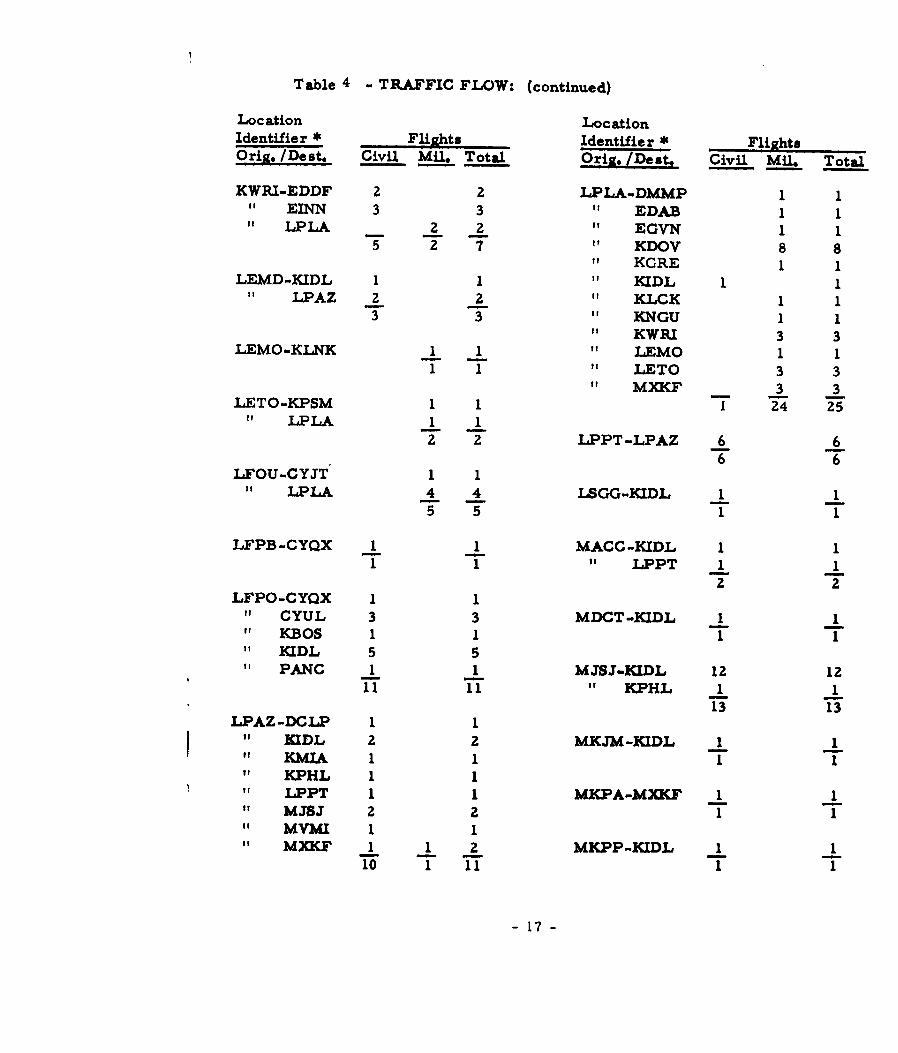
Table 4 - TRAFFIC FLOW: (continued)
Location LocationIdentifier * Flights Identifier * FlightsOrig. /Dest. Civil Mil. Total Orig. /Dest. Civil Mil. Total
KWRI-EDDF 2 2 LPLA-DMMP 1 1EINN 3 3 " EDAB 1 1LPLA 2 2 EGVN 1 1
5 2 7 " KDOV 8 8KGRE 1 1
LEMD-KIDL 1 1 KIDL 1 1" LPAZ 2 2 KLCK 1 1
3 3 KNGU 1 1KWRI 3 3
LEMO-KLNK 1 1 LEMO 1 11 1 LETO 3 3
MXKF 3 3LETO-KPSM 1 1 7 24 25
LPLA 1 12 2 LPPT-LPAZ 6 6
6 6LFOU-CYJT 1 1" LPLA 4 4 LSGG-KIDL 1 1
5 5 1 1
LFPB-CYQX I I MACC-KIDL I IT T " LPPT 1 1
2 2LFPO-CYQX 1 1" CYUL 3 3 MDCT-KIDL 1 1" KBOS 1 1 1 1" KIDL 5 5
PANC 1 1 MJSJ-KIDL 12 1211 11 " KPHL 1 1
13 13LPAZ-DCLP 1 1
1 1 1IDL 2 2 MK3M-KIDL 1 1KMA 11 11
" KPHL 1 I" LPPT 1 1 MKPA-MXKF 1 1
MJsJ 2 2 1 1MYMI 1 1
" MXKF 1 1 2 MKPP-KIDL 1 110 1 11 1 1
- 17 -
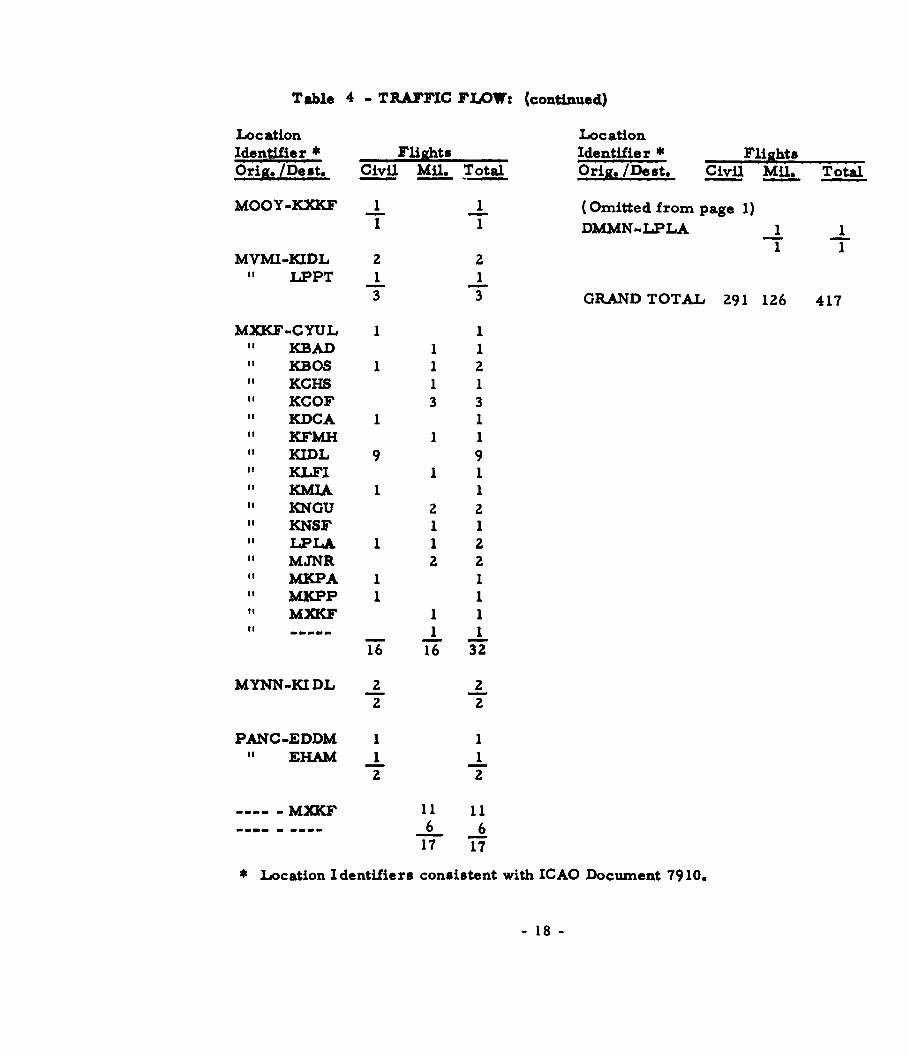
Table 4 -TRAFFrIC FLOW: (continued)
Location LocationIdentifier *Flights Identifier *FlightsOris. /Deut. Civil Mil. Total Orig. /Dest. Civil Mil. Total
MOOY-KXKF 1 1 (Omitted from page 1)1 1 DMMN-.LPLA
MVMI-KIDL 2 2It LPPT 1 1
3 3 GRAND TOTAL 291 126 417
MXKF-CYUL 1 1It KBAD 1 1It KBOS 1 1 2S KCHS 1 1" COF 3 3
KDCA 1 1K.FM 1 1
If KIL 9 9" KLFI 1 1
KMIA 1 1KNGU 2 2KNSE' 1 1LAPLA 1 1 2
" M3TNR 2 2MKPA 1 1M'K.PP I I
MXK I I
16 16 32
MYNN-KIDL 2 22 2
PANC-EDDM 1 1" EHAM 1 1
2 2
-mXKF 11 116 6
17 17
*Location Identifiers consistent with ICAO Document 7910.
- 18 -

True Air Speed
Table 5, and Figure 5, pages 20 and 21, show thedistribution of true air speed (knots) by aircraft classand owner for flights in the North Atlantic Region onAugust 25, 1961. Speeds are those reported by thefirst oceanic area control center to exercise controlover the flight.
True Air Speed/Altitude Relationship
Table 6, page 22, shows a joint plot of the true airspeed and assigned flight level relationship taken atthe 20 0 W, 30 0 W, 400 W and 50 0 W longitude meridians.
- 19 -

Table 5 - TRUE AIRSPEED: Distribution of Cruise Speeds(TAB-Knots) by Aircraft Class and Owner for Flightsin the North Atlantic Region on August 25, 1961
TAS Piston Turboprop Turbojet Total Total Grand(knots) Civ Mil Total Civ Mil Total Civ Mil Total Civ Mil Total
150-159 0 2 2 0 0 0 0 0 0 0 2 2160-169 2 1 3 0 0 0 0 0 0 2 1 3
170-179 4 8 12 0 0 0 0 0 0 4 8 12
180-189 2 6 8 0 0 0 0 0 0 2 6 8190-199 1 8 9 0 0 0 0 0 0 1 8 9200-209 0 19 19 0 0 0 0 0 0 0 19 19210-219 0 4 4 0 0 0 0 0 0 0 4 4
220-229 6 17 23 1 0 1 0 0 0 7 17 24230-239 17 7 24 1 0 1 0 0 0 18 7 25240-249 19 15 34 0 0 0 0 0 0 19 15 34250-259 11 1 12 0 0 0 0 0 0 11 1 12260-269 12 0 12 0 13 13 0 0 0 12 13 25270-279 8 0 8 2 0 2 0 0 0 10 0 10280-289 2 0 2 0 0 0 0 0 0 2 0 2290-299 0 0 0 2 0 2 0 0 0 2 0 2
300-309 0 0 0 1 0 1 0 0 0 1 0 1
310-319 0 0 0 11 0 11 0 0 0 11 0 11320-329 0 0 0 9 0 9 0 0 0 9 0 9330-339 0 0 0 4 0 4 0 0 0 4 0 4340-349 0 0 0 1 0 1 0 0 0 1 0 1350-359 0 0 0 0 0 0 0 0 0 0 0 0
360-369 0 0 0 0 0 0 0 0 0 0 0 0370-379 0 0 0 0 0 0 0 0 0 0 0 0
380-389 0 0 0 0 0 0 0 0 0 0 0 0390-399 0 0 0 0 0 0 0 0 0 0 0 0400-409 0 0 0 0 0 0 0 0 0 0 0 0410-419 0 0 0 0 0 0 0 0 0 0 0 0420-429 0 0 0 0 0 0 2 3 5 2 3 5430-439 0 0 0 0 0 0 2 6 8 2 6 8440-449 0 0 0 0 0 0 2 0 2 2 0 2450-459 0 0 0 0 0 0 6 2 8 6 2 8460-469 0 0 0 0 0 0 26 0 26 26 0 26470-479 0 0 0 0 0 0 47 0 47 47 0 47480-489 0 0 0 0 0 0 55 0 55 55 0 55490-499 0 0 0 0 0 0 19 1 20 19 1 20500-509 0 0 0 0 0 0 1 0 1 1 0 1510-519 0 0 0 0 0 0 1 0 1 1 0 1
Total 84 88 172 32 13 45 161 12 173 277 113 390
- 20 -

rVT
I ,D.
vw*.r 102IN
-4-

0 a* 1 . -rN MN CI . .N, r ,'
N - 'o f
NI I N
I-
~ 0 0 II 13 L% (, m 4
o o t~~-
- In r- c,
13V~ r . -
U, In
.0oL N r-0O0. o 1
El I -
o'I- 0'0 0 -

Altitude
Table 7 and Figure 6, pages 24 and 25, show the distributionof assigned flight levels (at entry fixes) for flights in the NorthAtlantic Region on August 25, 1961, by aircraft and ownershipclass.
Altitude Changes
Altitude changes between reporting fixes (flight leg) aresummarised below:
Flight Legs * Number of Levels Changed
Type of Change Number Percent 1 2 3 4 5 6 7 8
Climb 136 8 33 79 5 9 1 8 - 1
Descent 20 1 3 9 - 3 2 - 2 1No Change 1,576 91Total 1,732 100
* These 1,732 flight legs represent 417 flights.
First Flight Level Request
A summary of altitude assignment in terms of first flight levelrequested by OACC's exercising departure control is shown below:
Difference in FlightLevels between Request
Assignment with Flights and AssignmentRespect to Request Number Percent 1 2 3 4 5 or more
Less 28 12 5 16 1 4 2More 23 9 11 8 - 1 3
Identical 192 79T otal 243 100
- 23 -

Table 7 - ALTITUDE: Distribution of Assigned FlightAltitudes (Entry Fixes) for Flights in theNorth Atlantic Region on August 25, 1961
Flt.Level Piston Turboprop Turbojet Total Total Grand(000') Civ Mil Total Civ Mil Total Civ Mil Total Civ Mil Total
4 - 1 1 - -- - - 1 1
5 3 3 - 3 36 - 3 3 - 3 37 1 2 3 1 2 38 6 18 24 6 18 249 4 13 17 - - - - - 4 13 17
10 10 12 22 - - 10 12 22
11 4 8 12 - - 4 8 1212 14 3 17 14 3 1713 13 1 14 13 1 1414 7 4 11 - 1 1 - - - 7 5 1215 8 1 9 1 2 3 - - - 9 3 1216 4 7 11 3 1 4 - - - 7 8 1517 5 9 14 2 - 2 - - - 7 9 1618 2 3 5 1 5 6 - - - 3 8 1119 4 4 5 2 7 - - m 9 2 1120 1 - 1 7 1 8 - - - 8 1 921 1 1 6 - 6 - - - 7 - 722 - - 4 1 5 - - - 4 1 523 -- 1 - 1 - - - 1 - 124 - - - 1 - 1 - - - 1 -1
25 - -- - - - - - -
26 - - - - 1 - 1 1 127 - - 5 - 5 5 - 528 - - - - 9 2 11 9 2 11
29 - - - 1 - 1 11 1 12 12 1 1330 - - - - - - - - - - - -
31 - - - - 37 4 41 37 4 4132 - - - - - - - - - -
33 - 35 1 36 35 1 3634 - - - - - -35 - 35 1 36 35 1 3636 - - - - - - - - - - -
37 - - 22 - 22 22 - 22 j38 - - - - - - - - - - - -
39 - - - - - - 5 1 6 5 1640 - - - - - - I.
41 - 1 2 3 1 23Total 84 88 172 32 13 45 161 12 173 277 113 390
; 24 -

Figure 6 -ALTITUDE: Distribution of Assigned Flight Levels50(Entry, Fixeu4 for Fliht. in the North Atlantic Region
40 *-
30
4)
0
2 5 .. . . . . . .. . . . .
10 20 30u40 so 6
25

Hourly Activit y
Table 8 shows the distributi on of entry times at thefirst oceanic area fix and the distribution of exit timesat the l ast oceanic area fix f or fl i ghts i n t he NorthAtlantic Region on August 25, 1961.
Instantaneous Airborne Counts
Instantaneous airborne counts (IAC) were developedfrom the above entry and exit times. Table 9 and Figure 7,pages 28 and 29, show the IAC in the North Atlantic Regionon August 25, 1961, at the beginning of each hour.
Peak Activity
Inspection of the busy hours on a minute by minute basisrevealed that a peak IAC of 85 aircraft for the day occurred
at 0424 Zebra. Table 10 and Figure 8, pages 30 and 31,respectively, show the location and altitude distributionby flight direction and ownership class of airborne aircraftat the peak instant.
-!II
-26-- Z6 -

0 OV"#MOV - t-,#.e Na nw I
Cal8 I I I I I N ~ N - I I
-I I6 0 r I D V I n cc V tNN - 0 o n * N N 0 , N Ga
I" - -N -NN N In m I- I 0 N
o 1 I n I o I " I n I n n - I n I n m t . m I n a V r I I
-ee-N IN - N N4N .
.- m IN 1N - N INN V~- I.N j tn OI
I" I- m N " I I - N3 In 'I 'na In co o* a ! aa'c. ,"N -N o
.- l v ov"N% nm na L ct ot
0 0~
zi . .. .. I.I I I - I I - I I I .1 I mfl N1 a
Ze o N I - .-' do I4 aA 6 0 N In A N In In -,0 In In
N In N N-- -- - -N--N -- tI
CP t.N a mI I I a I m% I- I c0 t - I Im
Nm 10 v "N I N 10 N mA v4* 1 m m- .
~ 0 A
I-a In a, m IA A c In N In m m 1 0 0 In N
- N N - -
Zi N I I I I I I I I I * 1 - I In m " I I~ N
In ai a N, I0 r. *0 0IN NI m- vi In - 1 . a
~~~~l~~- 0r0 N~-N *,e0-.o-AII a a
- 27-

~~4 ' ~ ~te mv t- 0 0 0 l~N04 .
E-a
n N' - CO t- 4' 0 00 N ~ M' 40 4' N ~ N N. N .4 44' 'I m
N40.
U 00
a4
ioZ .4 MN N N -4 N N.- m NN o. II .Ia 4.I 4 I m00
.. 4~~ ~ ~ ~ ~ -414- 4 - 0-4- - 4- 4 i
01 ON
0 v incoiN mi nM -
Ir NN n in N N I ma N I In in I I m m I f
uJ 14
4
Ii t t
r- $' in *~ N 3 v a, 04 N *~ I. a a -. ' 1- t-j a
in 0.
a '--o m i a -Q I A0 N m .O4 in * t- c 0% 0-t N1 hac oc o C - 4 -1. .4 -4-4.4 N 0F
- 28 -
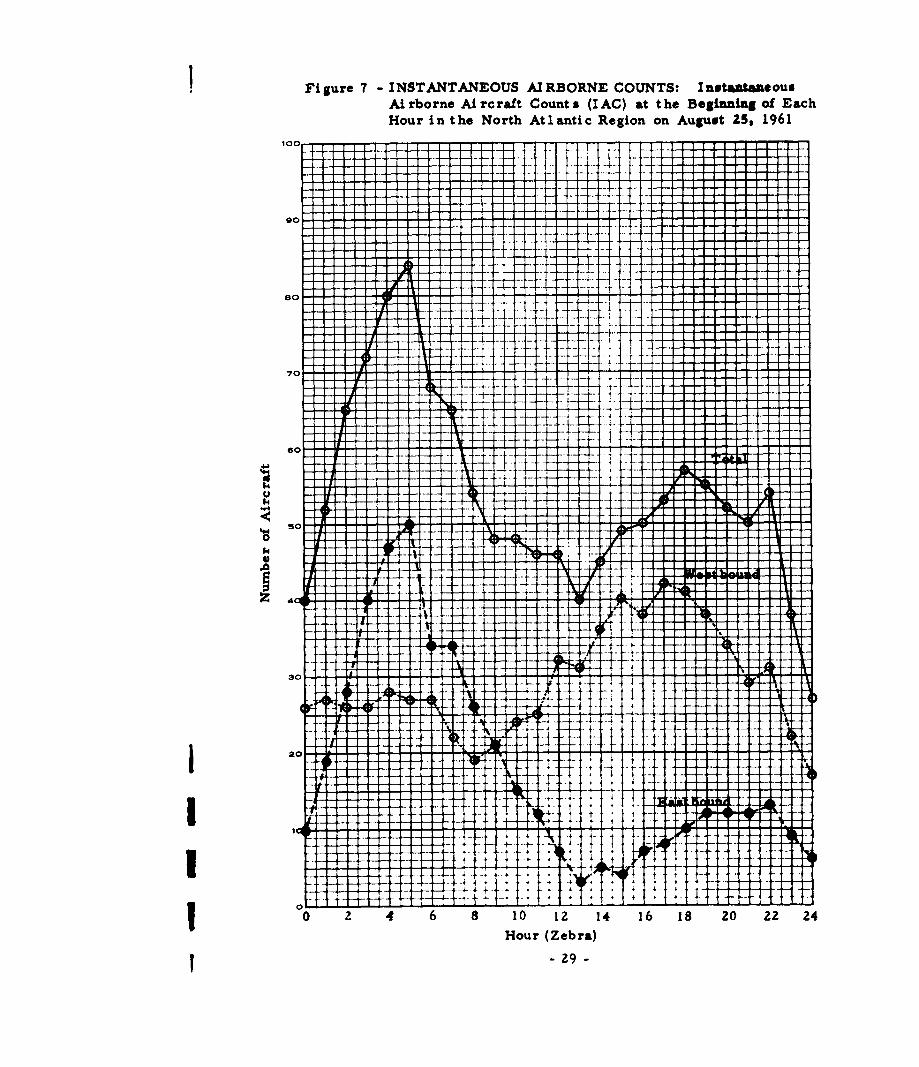
I Figure 7 -INSTANTANEOUS AIRBORNE COUNTS: InstaataasousAirborne Aircraft Countsa (I AC) at the Beginning of EachHour i n t he North Atl1anti c Region on August 25, 1961
00
II
I I-t
47 -24-9-

Table 10 -PEAK AIRCRAFT COUNT: Distribution ofAssigned Flight Levels for Aircraft Air-borne at the Peak Traffic Instant (0424 Zebra)in the North Atlantic Region on August 25,1961, by Ownership and Flight Direction
Fit. Number of FlightsLevel Civil Military Total(0001) East West Total East West Total East West Total
6 - 1 -... 1 1
8 - 3 3 - 5 5 - 8 89 1 - 1 2 - 2 3 - 3
10 - 2 2 - 2 2 - 4 411 - - - 2 - 2 2 - 212 u 6 6 - - - 6 613 2 - 2 - - - 2 - 214 - 2 2 - - - 2 215 2 - 2 1 - 1 3 - 316 - - - 1 1 - 1 117 1 - 1 4 1 5 5 1 618 - 1 1 - - - - 1 119 2 - 2 - - - 2 - 220 - 2 2 - - - 2 221 1 - 1 - - - 1 - 122 - 3 3 - - - - 3 323 2 - 2 1 - 1 3 - 324 - 1 1 - - - - 1 125 - - - - - - - -26 - - - - - - - - -27 2 - 2 - - - 2 - 228 - - - - - - - - -29 1 - 1 1 - 1 2 - 230 - - - - - - - - -31 3 1 4 - - - 3 1 432 - - - - - -33 10 - 10 - - - 10 - 1034 - - - - - -35 3 3 6 - - - 3 3 636 - - - - - -37 8 - 8 - - . 8 - 838 .- - - -39 2 - 2 - - - - 2
Total 40 25 65 11 9 20 51 34 85
- 30 -

0*
40r
31 us
Meridian Crossing Analysis
An analysis of traffic at the 200 W, 300 W, 400 Wand 500 W longitude meridian crossings was made interms of the following:
Crossing Latitude
Altitude
Time
Separation
Meridian Crossing Latitudes
Table 11 and Figure 9, pages 34 and 35, show thedistribution of crossing latitudes at the 200 W, 300 W,400 W and 500 W longitude meridians for flights in theNorth Atlantic Region on August 25, 1961. Only flightscrossing the particular meridian between 0000-2359Zebra on August 25, 1961, were counted so that in somecases a flight is not included in all four meridian tables.Also, flights landing at intermediate stops such as theAzores and Iceland may not have crossed all four meri-dians.
Meridian Crossing Altitudes
Table 12, page 36, shows the distribution of assignedflight levels for aircraft crossing the selected meridianson August 25, 1961. by flight direction. The busiest flightlevel for all meridians was 33,000 feet.
- 32 -
Meridian Crossing Times
Table 13, page 37, shows the distribution of meridian
crossing times for flights in the North Atlantic Region onAugust 25, 1961, by flight direction. Traffic shows amarked peaking effect in terms of flight direction.
Flight Separation
Table 14 and Figure 10, pages 38 thru 43, show timeinterval separations between successive flights at the sameflight level crossing reporting meridians with less than two-degree latitude separation (lateral minimum) by flightdirection. Each flight that crossed a selected meridian wasinspected in turn. The time interval between its crossingand the next flight at the same altitude with less than two-degrees latitude separation was recorded. If no such flightfollowed on the peak day, no entry was made.
Figures lla thru lld, pages 44-47, show flight separa-
tion in terms of reporting times and fix latitudes for flightscrossing the 200 W, 300 W, 400 W, and 500 W longitudemeridians at the 33, 000 feet flight level in the North AtlanticRegion on August 25, 1961. Eastbound flights are repre-sented by arrows pointing to the right; Westbound flights
are represented by arrows pointing to the left. Actualcrossing time is'represented by the left hand end of theplotted 30 minute interval (i. e., Eastbound flights by thetail of the arrow and Westbound flights by the head).
A comparison of separation intervals at the busiest
flight level with all flight levels is shown below:
Time Interval 33,0001 Al levels
(minutes) Number Percent Number Percent30-39 1s 14.2 59 11.740-49 12 11.3 59 11.750-59 20 18.9 45 8.960-69 12 11.3 39 7.770-79 9 8.5 21 4.180-89 7 6.6 24 4.7Tot. under 90 75 70.8 247 48.8
Over 90 31 29.2 258 5142
Grand Total 106 100.0 505 100.0
- 33 -
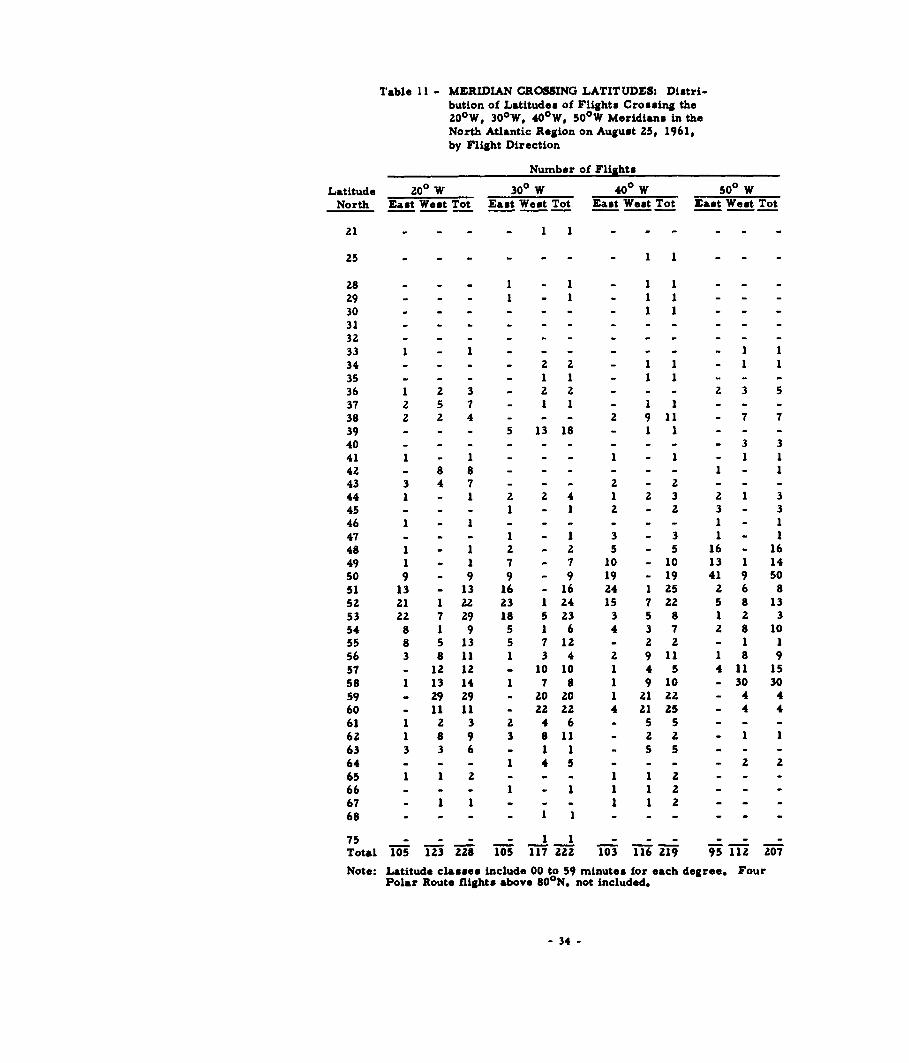
Table 11 - MERIDIAN CROSSING LATITUDES: Distri-bution of Latitudes of Flights Crossing the20°W, 300W, 40°W, 50°W Meridians in theNorth Atlantic Region on August 25, 1961,
by Flight Direction
Number of Flights
Latitude 20 0 W 300 W 400 W 50 ° WNorth East West Tot East West Tot East West Tot East West Tot
21 - 1 1 - -
25 - - 1 1 - -
28 - - 1 1 - 1 1 -
29 - -1 1 - 1 1 - -
30 . ... 1 1 - -
31 . ... . .. .32 -.. . .. .
33 1 - 1 . . . . .. 1 134 - - - 2 2 - 1 1 - 1 135 - - - 1 1 - 1 1 - - -
36 1 2 3 - 2 2 - - 2 3 537 2 5 7 - 1 1 - 1 1 - - -
38 2 2 4 - - - 2 9 11 - 7 739 - - - 5 13 18 - 1 1 - - -40 - - - - - - - - 3 341 1 - 1 - - - 1 1 - 1 142 - 8 8 -. . . 1 - 143 3 4 7 - - - 2 - - - -
44 1 - 1 2 2 4 1 2 3 2 1 345 - - - 1 - 1 2 - z 3 - 346 1 - 1 - - - - - - 1 - 147 - - - I - 1 3 - 3 1 - 148 1 - 1 2 - 2 5 - 5 16 - 1649 1 - 1 7 - 7 10 -10 13 1 1450 9 - 9 9 - 9 19 -19 41 9 5051 13 - 13 16 - 16 24 1 25 2 6 852 21 1 22 23 1 24 15 7 22 5 8 1353 22 7 29 18 5 23 3 5 8 1 2 354 8 1 9 5 1 6 4 3 7 2 8 1055 8 5 13 5 7 12 - 2 2 - 1 156 3 8 11 1 3 4 2 9 11 1 8 957 - 12 12 - 10 10 1 4 5 4 11 1558 1 13 14 1 7 8 1 9 10 - 30 3059 - 29 29 - 20 20 1 212 2 - 4 460 - 11 11 - 22 22 4 212 5 - 4 461 1 2 3 2 4 6 - 5 5 - - -
62 1 8 9 3 8 11 - 2 2 - 1 163 3 3 6 - 1 1 - 5 5 - - -64 - - - 1 4 5 - - - - 2 265 1 1 2 - - - 1 1 2 - - -
66 - - - 1 - 1 1 1 2 - - -
67 - 1 1 - - - 1 1 2 - - -68 - - - - 1 - -
75 - - - - 1 1 . - -Total 105 123 28 105 117 222 103 116 219 95 112 207
Note: Latitude classes include 00 to 59 minutes for each degree. Four
Polar Route flights above 80°N. not included.
- 34 -

5-5_S40114
0 C
zsC
35b

Table 12 - MERIDIAN CROSSING ALTITUDES: Distri-bution of Assigned Flight Levels for AircraftCrossing the 20°W, 30°W, 400 W, 50°WMeridians in the North Atlantic Region onAugust 25, 1961, by Flight Direction
Flt. Number of Flights
Level 200 W 30 0 W 40 0 W 50 w(0001) East West Tot East West Tot East West Tot East West Tot
5 1 - 1 - - - - - - - - -
6 - 2 2 - 1 1 . . . . 1 1
8 - 7 7 - 9 9 - 8 8 - 9 99 4 - 4 2 - 2 2 - 2 3 - 3
10 - 11 11 - 9 9 - 10 10 - 9 911 4 - 4 5 - 5 7 - 7 7 - 712 - 10 10 - 8 8 - 8 8 - 8 813 6 - 6 6 - 6 10 - 10 7 - 714 - 7 7 - 7 7 - 8 8 - 7 715 8 - 8 8 - 8 6 - 6 7 - 716 - 4 4 - 2 2 - 2 2 - 3 317 9 - 9 9 - 9 6 - 6 5 - 518 - 4 4 - 5 5 - 6 6 - 3 319 6 - 6 6 - 6 8 - 8 7 - 720 - 7 7 - 3 3 - 2 2 - 3 321 4 - 4 8 - 8 7 - 7 4 - 422 - 5 5 - 6 6 - 3 3 - 1 123 6 - 6 2 - 2 1 - 1 - - -24 - 1 1 - 1 1 - 3 3 - 5 525 - - - - - - - - - -
26 - - - - - - 1 127 1 - 1 - - - - -
28 - 6 6 - 6 6 - 5 5 - 2 229 3 - 3 4 - 4 5 - 5 5 1 630 - - - - - -. - - - - -31 3 23 26 4 20 24 4 12 16 4 8 12
H24 93i322 1234 21 1334221 123434 - - - - - - - - - -
35 6 21 27 6 21 27 6 24 30 7 26 3336 - - - - - - - - - - - -
37 14 5 19 17 6 23 14 7 21 12 7 1938 - - - - - - - - - - -
39 4 1 5 4 1 5 4 5 9 3 6 (
40 - - - - - - - - - - -
41 2 - 2 2 - 2 2 - 2 z - 2
Total 105 123 228 105 117 222 103 116 219 95 112 207
Note: Four Polar Route Flights (three at 33,000' and one at 35,000')not included.
- 36-

Table 13 - MERIDIAN CROSSING TIMES: Hourly Distri-butions of Aircraft Crossing Times at the 20 0 W.30°W, 40°W, 50 0 W Meridian Crossings forFlights in the North Atlantic Region on August 25,1961, by Flight Direction
Number of Flights
Hour 20 W 30 W 400 W 500 W(Zebra) East West Tot East West Tot East West Tot East West Tot
00 1 5 6 2 1 3 3 4 7 9 2 1101 2 10 12 5 3 8 8 1 9 10 3 1302 6 4 10 6 8 14 13 1 14 12 3 1503 7 5 12 17 6 23 14 8 22 12 1 1304 16 3 19 15 6 21 8 6 14 9 2 1105 11 3 14 9 3 12 11 6 17 6 7 1306 9 - 9 6 6 12 7 4 11 9 7 1607 8 1 9 9 - 9 9 4 13 5 3 808 10 2 12 6 2 8 4 3 7 - 3 309 5 5 10 5 4 9 2 2 4 4 3 710 3 5 8 4 3 7 4 2 6 2 3 511 8 2 10 1 4 5 2 3 5 1 1 212 - 5 5 1 5 6 1 8 9 - 3 313 3 10 13 3 6 9 - 4 4 - 4 414 2 9 11 - 7 7 - 10 10 2 4 615 - 8 8 - 10 10 - 6 6 1 14 1516 - 4 4 - 6 6 3 8 11 2 7 917 - 11 11 1 10 11 3 7 10 5 8 1318 1 5 6 5 7 12 3 9 12 4 6 1019 6 10 16 3 5 8 3 7 10 1 12 1320 1 3 4 3 6 9 3 4 7 - 5 521 3 2 5 2 2 4 - 7 7 1 7 822 1 5 6 1 3 4 2 1 3 - 3 323 2 6 8 1 4 5 - 1 1 - 1 1
Total 105 123 228 105 117 222 103 116 219 95 112 207
Note: Four Polar Route Flights Crossing above 80 0 N Latitude notincluded.
- 37 -

Table 14a - TIME SEPARATION (All Flight@): Distribution of TimeIntervals Between Successive Flights at the Same Flight
Level Crossing Reporting Meridians with Less Than Two-Degrees Latitude Separation in the North Atlantic Regionon August 25, 1961
MeridianTime 0 o 0 0
Interval 20 W 30 W 40 W 50 W Total(minutes) #W ;70 #W #
30- 39 18 13.5 12 9.4 12 9.9 17 13.8 59 11.7
40- 49 12 9.0 13 10.2 15 12.4 19 15.4 59 11.7
50- 59 12 9.0 14 10.9 11 9.1 8 6.5 45 8.960- 69 10 7.5 8 6.2 10 8.3 11 8.9 39 7.770- 79 5 3.8 4 3.1 6 4.9 6 4.9 21 4.1
80- 89 5 3.8 8 6.2 6 4.9 5 4.1 24 4.790- 99 6 4.5 1 0.8 1 0.8 4 3.3 12 2.4
100-109 8 6.0 2 1.6 1 0.8 4 3.3 15 3.0110-119 7 5.3 10 7.8 4 3.3 4 3.3 25 4.9120-129 6 4.5 3 2.3 5 4.1 4 3.3 18 3.5130-139 - - 2 1. 6 2 1.7 2 1.6 6 1.2140-149 1 0.7 2 1.6 3 2.5 - - 6 1.2150-159 1 0.7 3 2.3 - - 2 1. 6 6 1.2160-169 1 0.7 - - 1 0.8 1 0.8 3 0.6170-179 1 0.7 5 3.9 4 3.3 2 1.6 12 2.4180-189 7 5.3 2 1.6 5 4.1 2 1.6 16 3.2190-199 4 3.0 3 2.3 2 1 - 1.6 11 2.2
200-209 - - 4 3.1 4 3.3 - - 8 1.6210-219 1 0.7 - - - - - 1 0.2220-229 1 0.7 1 0.8 1 0.8 - 3 0.6230-239 - - 2 1.6 1 0.8 1 0.8 4 0.84 hrs* 2 1.5 5 3.9 10 8.3 8 6.5 25 4.95 hrs 3 2.3 8 6.2 4 3.3 2 1.6 17 3.36hrs 5 3.8 3 2.3 2 1.7 3 2.5 13 2.67 hrs 1 0.7 - - 1 0.8 2 1.6 4 0.88 hr - - 1 0.8 - - 2 1.6 3 0.69 hr. 5 3.8 1 0.8 2 1.7 1 0.8 9 1.8
10 hrs - - - - 1 0.8 3 2.5 4 0.811 hre 1 0.8 2 1.6 2.5 - - 6 1.212 hrs 1 0.8 - - 2 1.7 2 1.6 5 1.013 hrs - - 1 0.8 2 1.7 2 1.6 5 1.014 hr. - 2 1.6 - - 2 0.415 hr. 1 0.8 - - 1 0.8 2 0.416hr. 1 0.8 3 2.3 3 2.5 7 1.417 hro 3 2.3 - - - - 3 0.6 -18 hrs 2 1.5 1 0.8 - - 3 0.6
19 hrs - - 1 0.8 - 1 0.220 hrs - - - - - -
21 hrs 2 1.5 1 0.8 - 3 0.622 hrs - - - - - -
23 hra - - - - - -
Total 133 100.0 128 100.0 121 100.0 123 100.0 505 100.0
* Hourly intervals measured 00 to 59 minutes inclusive.
- 38 -

Figure 10 - TIMLE SEPARATION: Percentage Distribution of Time Intervals(10 minute) Between Successive Flights at the Same FlightLevel and Crossing Selected Reporting Meridians with LessThan Two-Degrees Latitude Separation, North Atlantic Region,
10 ----
0
15 tII
10
15
'~10
10
15
10
0 Zh 2hr3hr4r7 ine Between successive Flights
- 39-

Table 14b - TIME SEPARATION (Eastbound Flights): Distribution ofTime Intervals Between Successive Flights at the Sane
Flight Level Crossing Reporting Meridians with Less ThanTwo-Degrees Latitude Separation in the North AtlanticRegion on August 25, 1961
MeridianTime 0 0 0
Interval 20 W 30 W 40 W 50 W Total(minutes) I W ~ W- I~I % V W0# %
30- 39 7 11.7 5 8.8 8 14.5 12 20.0 32 13.840- 49 4 6.7 7 12.3 10 18.2 10 16.7 31 13.450- 59 7 11.6 7 12.3 5 9.1 3 5.0 22 9.560- 69 2 3.3 2 3.5 3 5.5 5 8.3 12 5.270- 79 2 3.3 2 3.5 3 5.5 2 3.3 9 3.980- 89 3 5.0 4 7.0 1 1.8 2 3.3 10 4.390- 99 4 6.7 - - 1 1.8 3 5.0 8 3.5
100-109 6 10.0 2 3.5 1 1.8 2 3.3 11 4.7110-119 4 6.7 5 8.8 2 3.7 2 3.3 13 5.6120-129 2 3.3 - - 3 5.5 2 3.3 7 3.0130-139 - - 2 3.5 1 1.8 2 3.3 5 2.2 I140-149 - - 1 1.8 1 1.8 - - 2 0.9
150-159 - - 2 3.5 - - 1 1.7 3 1.3160-169 - - - - 1 1.8 - - 1 0.4
170-179 1 1.7 2 3.5 - - - - 3 1.3180-189 5 8.3 - - 2 3.7 1 1.7 8 3.5
190-199 3 5.0 - - - - 1 1.7 4 1.7
200-209 - - 3 5.3 3 5.5 - - 6 2.6210-219 1 1.7 - - - - - 1 0.4220-229 - - - - 1 1.8 - - 1 0.4
230-239 - - 1 1.8 - - - - 1 0.4
4hrs* 2 3.3 2 3.5 2 3.6 2 3.3 8 3.55hrs 2 3.3 4 7.0 2 3.6 - - 8 3.5
6hrs 2 3.3 1 1.8 1 1.8 2 3.3 6 2.67 hr. - - - - - - - - - -
8 hrs - - - 1 1.7 1 0.4
9 hrs - - - - 1 1.7 1 0.4
10 hre - - - 1 1.8 3 5.0 4 1.7
11 hre - - - 1 1.8 - - 1 0.4
12 hr. - - - 1 1.7 1 0.4
13 hre - - - 2 3.6 1 1.7 3 1.3
14 hr. - - 1 1.7 - - - - 1 0.4 i15 hrs ... .. .. ..
16 hre 1 1.7 2 3.5 - - 1 1.7 4 1.7
17 hrs 1 1.7 - - - - - - 1 0.4
18 hrs 1 1.7 1 1.7 - - - - 2 0.9
19 hrs - - 1 1.7 - - - - 1 0.4 I20 hr. - - - - - - - - - -
21 hrs - - - - - - - - - -
22 hrs - - - - - - - - - -
23 hrs . |
Total 60 100.0 57 100.0 55 100.0 60 100.0 232 100.0
Hourly intervals measured 00 to 59 minutes inclusive.
4- 40 -

Table 14c - TIME SEPARATION (Westbound Flights) t Distribution ofTime Intervals Between Successive Flights at the SameFlight Level Crossing Reporting Meridians with Less ThanTwo-Degrees Latitude Separation in the North AtlanticRegion on August 25, 1961
MeridianTime 0 o o W
Interval 20 W 30 W 40 W 50 W Total(minutes) # % # % # % # % # %
30- 39 11 15.1 7 9.9 4 6. 1 5 7.9 27 9.940- 49 8 10.9 6 8.5 5 7.6 9 14.2 28 10.350- 59 5 6.8 7 9.9 6 9.1 5 7.9 23 8.460- 69 8 11.0 6 8.5 7 10.6 6 9.5 27 9.970- 79 3 4.1 2 2.8 3 4.6 4 6.3 12 4.480- 89 2 2.7 4 5.6 5 7.6 3 4.7 14 5.190- 99 2 2.7 1 1.4 - - 1 1.6 4 1.5
100-109 2 2.7 - - - - 2 3.2 4 1.5110-119 3 4.1 5 7.1 2 3.0 2 3.2 12 4.4120-129 4 5.5 3 4.2 2 3.0 2 3.2 11 4.0130-139 - - - 1 1.5 - - 1 0.4140-149 1 1.4 1 1.4 2 3.0 - - 4 1.5150-159 1 1.4 1 1.4 - - 1 1.6 3 1.1160-169 1 1.4 - - - - 1 1.6 2 0.7170-179 - - 3 4.2 4 6.1 2 3.2 9 3.3180-189 2 2.7 2 2.8 3 4.6 1 1. 6 8 2.9190-199 1 1.4 3 4.2 2 3.0 1 1.6 7 2.6200-209 - - 1 1.4 1 1.5 - - 2 0.7210-219 - - - - - - - - -
220-229 1 1.4 1 1.4 - - - - 2 0.7230-239 - - 1 1.4 1 1.5 1 1.6 3 1. 14hrs - - 3 4.2 8 12.2 6 9.5 17 6.25 hra 1 1.4 4 5.7 2 3.0 2 3.2 9 3.36hro 3 4.1 2 2.8 1 1.5 1 1.6 7 2.67 hrs 1 1.4 - - 1 1.5 2 3.2 4 1.58 hrs - - 1 1.4 - - 1 1.6 2 0.79 hrs 5 6.8 1 1.4 2 3.0 - - 8 2.9
10 hrs - - - - - - - - -
I Ihrs 1 1.4 Z 2.8 2 3.0 - - 5 1.812 hrs 1 1.4 - - 2 3.0 1 1.6 4 1.513 hrs - - 1 1.4 - - 1 1.6 2 0.714 hrs - - 1 1.4 - - - - 1 0.415 hrs 1 1.4 - - - - 1 1.6 2 0.716hrs - - 1 1.4 - - 2 3.2 3 1.117 hrs 2 2.7 - - - - - - 2 0.718 hrs 1 1.4 .- - 1 0.419 hrs - - - - -
20 hrs - - - -
21 hrs 2 2.7 1 1.4 - - - 3 1.122 hrs - - - - - -
23 hrs - - - - -
Total 73 100.0 71 100.0 66 100.0 63 100.0 273 100.0
* Hourly intervals measured 00 to 59 minutes inclusive.
-41 -

Table 14d - TIME SEPARATION (Altitudes 31,000 Feet and Above):Distribution of Time Intervals B4tween Successive Flightsat the Same Flight Level Crossing Reporting Meridianswith Less Than Two-Degrees Latitude Separation in theNorth Atlantic Region on August 25, 1961
MeridianTime
Interval 20 W 30 W 40 W 50 W Total(minutes) foW # W 0W #W % %#
30- 39 12 14.5 9 11.0 8 10.4 12 15.0 41 12.740- 49 9 10.9 12 14.7 13 16.8 14 17.5 48 14.950- 59 12 14.5 12 14.7 9 11.7 7 8.8 40 12.460- 69 5 6.0 8 9.8 9 11.7 10 12.5 32 9.970- 79 4 4.8 3 3.7 5 6.5 4 5.0 16 5.080- 89 3 3.6 4 4.9 2 2.6 3 3.8 12 3.790- 99 5 6.0 - - 1 1.3 3 3.8 9 2.8
100-109 3 3.6 - - - 3 3.8 6 1.9110-119 6 7.3 10 12.2 4 5.2 3 3.8 23 7.1120-129 5 6.0 3 3.7 5 6.5 2 2.5 15 4.7130-139 - - 1 1.2 1 1.3 2 2.5 4 1.3140-149 1 1.2 1 1.2 2 2.6 - - 4 1.3150-159 - - - - - - - - - -
160-169 1 1.2 - - - - 1 1.2 2 o.6170-179 1 1.2 1 1.2 2 2.6 2 2.5 6 1.9180-189. 4 4.8 2 2.4 3 3.9 1 1.2 10 3.1190-199 4 4.8 - - 2 2.6 1 1.2 7 2.2200-209 - - 2 2.4 2 2.6 - - 4 1.3210-219 1 1.2 - - - - - - 1 0.3220-229 2 2.4 1 1.2 - - - - 3 0.9230-239 - - 2 2.4 - - - - 2 o.64 hrs* 1 1.2 2 2.4 4 5.2 3 3.8 10 3.15hra 1 1.2 3 3.7 1 1.3 1 1.2 6 1.96hrs 1 1.2 1 1.2 1 1.3 1 1.2 4 1.37 hrs - - - - - - 1 1.2 1 0.38 hrs - - 1 1.2 - - 1 1.2 2 0.69 hrs - - - - - - 1 1.2 1 0.3
10 hrs - - - - - - - - - -
11 hrs 1 1.2 1 1.2 1 1.3 - - 3 0.912 hrs 1 1.2 - - 1 1.3 2 2.5 4 1.213 hrs - - - - 1 1.3 1 1.3 2 0.614 hrs - - 2 2.4 - - - - 2 o.615 hrs - - - - - - 1 1.3 1 0.316 hrs - - - . .17 hrs - - -.. .18 hrs - -. .19 hrs - - 1 1.2 - - - 1 0.320 hrs - - - - - -21 hrs - - - -
22 r - - - -h... .23 hr - - - - - -
Total 83 100.0 82 100.0 77 100.0 80 100.0 322 100.0
* Hourly Intervals measured 00 to 59 minutes inclusive.
- 42 -
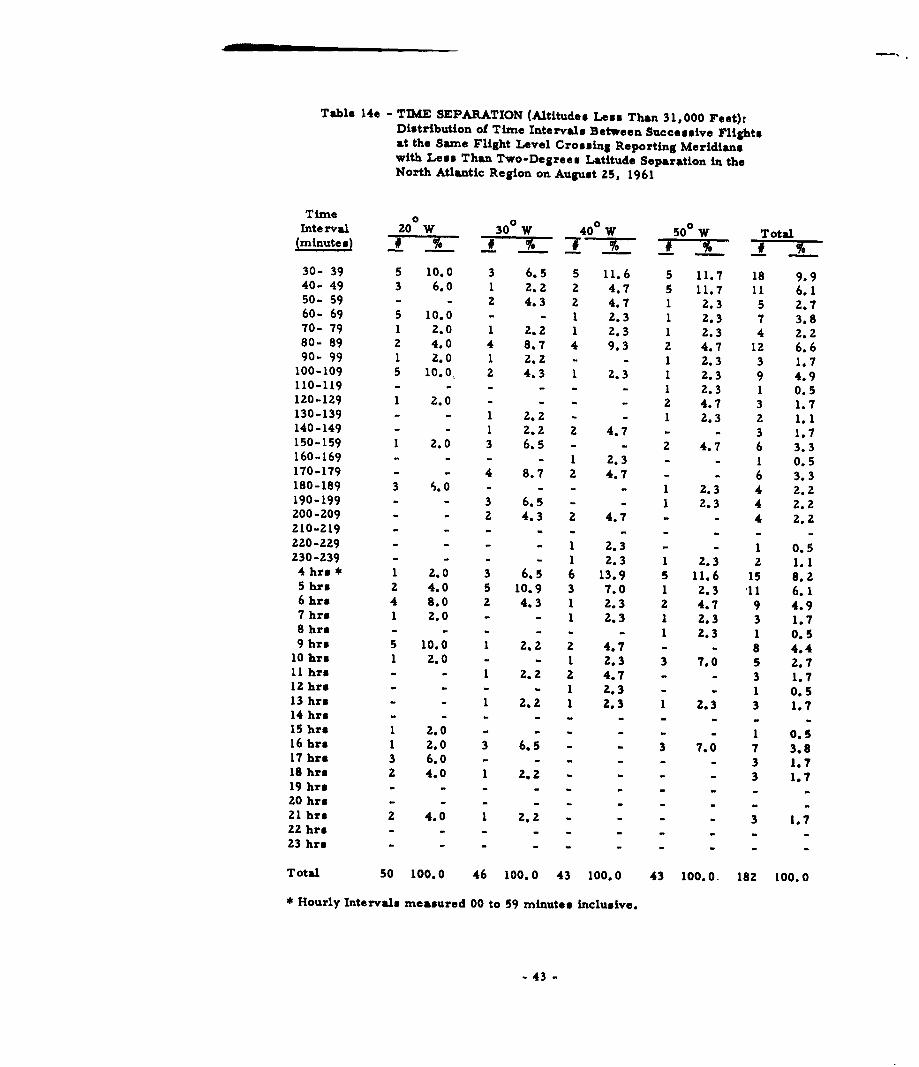
Table 14e - TIME SEPARATION (Altitudes Less Than 31,000 Feet):Distribution of Time Intervals Between Successive Flightsat the Same Flight Level Crosing Reporting Meridianswith Iess Than Two-Degrees Latitude Separation in theNorth Atlantic Region on August 25, 1961
Time o 0 0Interval 20 W 30 W 40 W so W Total
(minute) s ~ T W %~ T# % T--1 -30- 39 5 10.0 3 6.5 5 11.6 5 11.7 18 9.940- 49 3 6.0 1 2.2 2 4.7 5 11.7 11 6.150- 59 - - 2 4.3 2 4.7 1 2.3 5 2.760- 69 5 10.0 - - 1 2.3 1 2.3 7 3.870- 79 1 2.0 1 2.2 1 2.3 1 2.3 4 2.280- 89 2 4.0 4 8.7 4 9.3 2 4.7 12 6.690- 99 1 2.0 1 2.2 - - 1 2.3 3 1.7
100-109 5 10.0 2 4.3 1 2.3 1 2.3 9 4.9110-119 - - - - - 1 2.3 1 0.5120-129 1 2.0 - - - 2 4.7 3 1.7130-139 - - 1 2.2 - - 1 2.3 2 1.1140-149 - - 1 2.2 2 4.7 - - 3 1.7150-159 1 2.0 3 6.5 - - 2 4.7 6 3.3160-169 - - - - 1 2.3 - - 1 0.5170-179 - - 4 8.7 2 4.7 - - 6 3.3180-189 3 6.0 - - - - 1 2.3 4 2.2190-199 - - 3 6.5 - - 1 2.3 4 2.2200-209 - 2 4.3 2 4.7 - - 4 2.2210-219 - - - - - - -220-229 - 1 2.3 - - 1 0.5230-239 - - - 1 2.3 1 2.3 2 1. 14 hrs 1 2.0 3 6.5 6 13.9 5 11.6 15 8.25 hra 2 4.0 5 10.9 3 7.0 1 2.3 '11 6. 16hrs 4 8.0 2 4.3 1 2.3 2 4.7 9 4.97 hra 1 2.0 - - 1 2.3 1 2.3 3 1.78 hrs - - - - - - 1 2.3 1 0.59 hrs 5 10.0 1 2.2 2 4.7 - - 8 4.4
10 hrs 1 2.0 - - 1 2.3 3 7.0 5 2.711 hro - 1 2.2 2 4.7 - - 3 1.712 hr - - - 1 2.3 - - 1 0.513 hrs - 1 2,2 1 2.3 1 2.3 3 1.714hrs - - - - - - - -15 hre 1 2.0 - - - - - - 1 0.516 hre 1 2.0 3 6.5 - - 3 7.0 7 3.817 hra 3 6.0 - - - - - - 3 1.718 hrs 2 4.0 1 2.2 - - - 3 1.719 hrs - - - - - -20r - - - -h. ..21 hre 2 4.0 1 2,2 . . . . 3 1.722 hr- - - - - - -23 hr - - - - -
Total 50 100.0 46 100.0 43 100.0 43 100.0. 182 100.0
* Hourly Intervals measured 00 to 59 minutes inclusive.
- 43 -

Figure 11I& -FLIGHT SEPARATION: Distribution of Reporting Times andFix Latitudes for Flights Crossing the 20 0 W Meridian at the33, 000 Feet Flight Level in the North Atlantic Region onAugust 25, 1961 (Eastbound.e ; Westbound e.)
on 56~IMMr
8. 58
54
52r..T
48
46
0 2 4 8 10 12 14 16 is 20 22 24 kReporting Time (Zebra)
- 44-

Figure 1 lb -FLIGHT SEPARATION: Distribution of Reporting Times andFix Latitudes for Flights Crossing the 30 0 W Meridian at the33, 000 Feet Flight Level in the North Atlantic Region onAugust 25, 1961 (Eastbound. -m We stbound -a-)
641 1 1.1 L . 1 17
60 u"Ni m
58 1 1 1 1 1 1
56m~oyWI
.4 58
0 1
z
52
50
48
46
440 2 4 6 8 10 12 14 16 18 20 22 24
Reporting Time (Zebra)- 4S -

jigure I ic IPLIGHT SEPARATION: Distribution of Reporting Times andFrix Latitudes for Frlights Crossing the 40 0 W Meridian at the33. 000 Feet Flight Level in the North Atlantic Region onAugust 25, 1961 (Eastbound -0- Westbound .. )
64 L I I I I1 1 1
-S
f I
50
54
44
-46

Figure Ild -FLIGHiT SEPARATION: Distribution of Reporting Times andFix Latitudes for Flights Crossing the 500 W Meridian at the33, 000 Feet Flight Level in the North Atlantic Region on
64August, 25, 1961 (Eastbound.. Westbound -e-
62 1 1 1 1 1 1 1
60 ~ tt] f
62
* 540
54'
52
(14
481 . . . . ..
46
2 4 8 10 12 14 16 18 z0 22 24
Reporting Time (Zebra)
- 47-

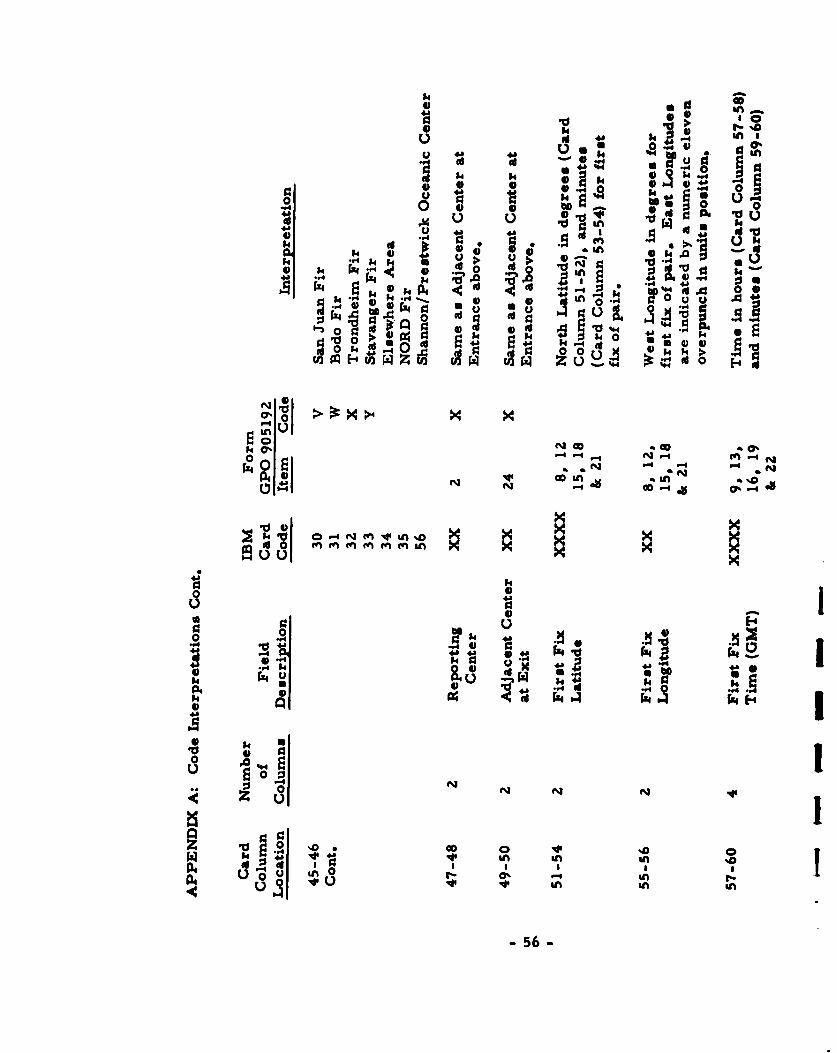
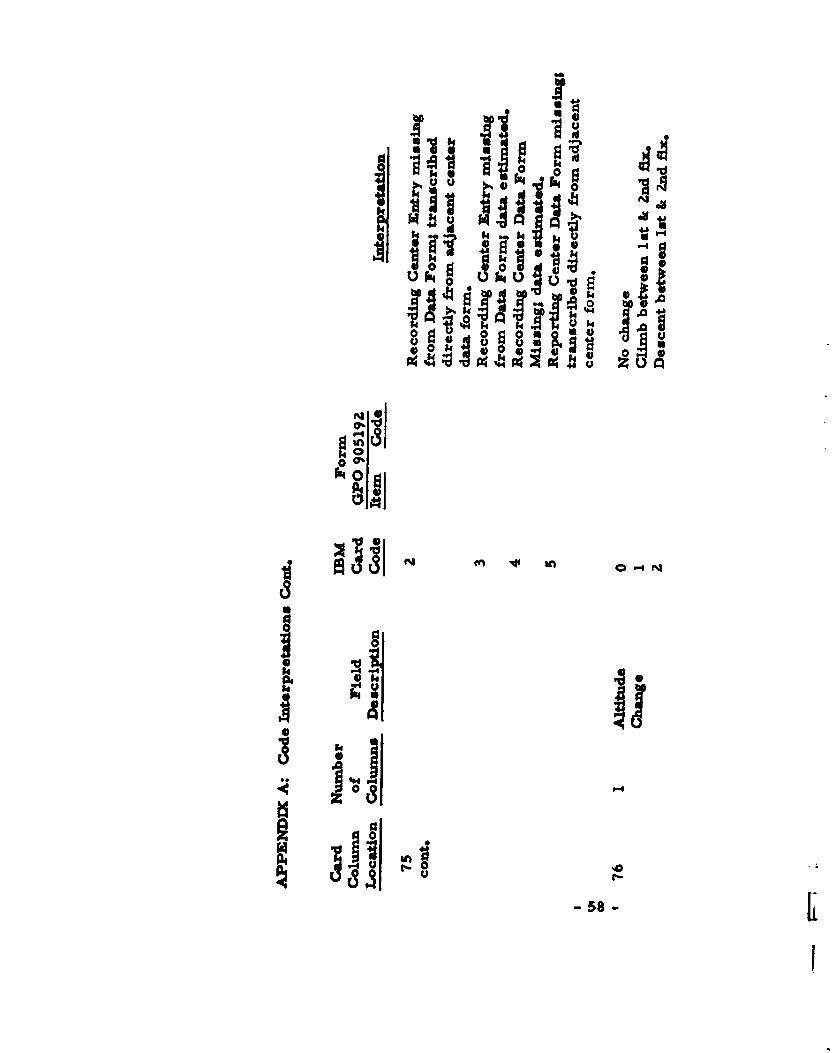
APPENDIX A: DATA PROCESSING
This appendix includes the flight data worksheet and IBMcard format for the North Atlantic Region Traffic SurveyData included in this report. Original Data Collection FormsGPO 905192 ( see Figure 2, page 3) were filled out in accord-ance with "I nstructions and Alpha-Numeric Codes for NorthAtlantic Region Traffic Survey Data Recording Form" pre-pared by Analysis Branch, Bureau of Air Traffic Management,Washington, D. C.
An IBM card is prepared for each leg of a flight. A legis the portion of flight between two successive reporting fixes.A worksheetp Figure 12, is completed for each flight. Entriesin card columns 1 thru 37 are identical for all legs of a flight.Entries in card columns 38 thru 76 are made for each leg withina flight. The total number of lego (IBM Cards) for each flightis recorded in card columns 41 and 42; the sequence of flightlegs is recorded in card columns 43 and 44. When the IBMcards are punched each card contains information in cardcolumns 1 thru 76.
- 48 -

u r
NN
9 04
oG
z N*
0
0 N
143
o in
','
II
1 'a
-4
.4
444
0'.-~0
vu ,
0 p- 0z1 0
W4 W 4
Uk .45
k 0 a 4
0004
EAE
4-A
coo 0 -9-
0 0.44
$04
54
545 -

I0
0
14. 0
14) -4 : 0)5 9 0 dt
4 4-1 4j C 0 04-4(d)rk-4k C ".4E be. 7-, 9
*I*44 4)~
-do -401 0 0 NNZN
d U,
o~4

I$44A-
0O 4.1
o 4)a% r
.5 .- 40
4.1 0, 00
.0 ~~~ 0 0 2- $
4. 0 0 P40
0 0 .- 14 V 0 41 -1 m
$40 cx00 0 I
;4U xNNN (Vl~s -j~X x0x ~ 6~ x
00t
0 4.1
U 44)
- 00 .
P4 be o.-
0 0
4 r.000 00w$ .0.4*'&
'U A
0 N
52-

0114, u.:
00
1-4 0o40 Jod 4)fzX4
0 v ) 4
od to10)44J .. 4 4-4o4 4) o . -
4. bZ4 4 b o-et -
. 1 4 4) -4 .-1 ,"
0 0 r0
o 00 04 4 r
a~~~ ~ ~ 43 4 -r 300-

4f
U1 00-0 4 .2 4A aA .0
+0 4 4 *"-
0 .4 so u:I :4 -
4r,14 Q 48@ 0 .5 u o
-4 84 4.-40
00
0 40 N41bebeeU 0be be to :000 '448 k.
r-4 > 00
41 0% **
0 0~
P4 0'
0
414
0d
484
01 0 014 -4 40
8 44 4 k4 8
r-4 a 0 4.1 4q U
'4 1 0,
0 S 41j84 N -
0
'.0- V
-54-

Iu00
k 40 r co 0 1U U-
o 4 3 o4) 4) co0-
N4 ) 150 ''04 A0>
-4 0 -
41 'o40V 4 ;
1-4
4.' 04) a
04
u ;
4))4.4'
04) 4
-5
4j 6. W4 in4 . r4 u a I a4& % O ..E 0
14 4 M
0 4 4 4 bk 0
0 Q 54 h-0. a. 00
U * - , U 05414 Ul d
14 a 4
.0 -". Z i, T
~zuZ 0'~':u .
o' Ne- W-
Cy- l :> x X
0
0 'N lb
01 x
o 4*".4 "14* .4*4
4*4 01 44
0k 4* f 4
00
42 . 0
4j vI '~ In In ind~ V- ,oU ua -VI an
4' v n in
-56-

4j 4-b
0 U4~ .
4J 044): *
Vz rz4 4A $4
"4 r44).4 48 48
to 4A 4
0 0
04 48O4 ) 1
-O' 40 OD ft 30 V o
~o I 5 -N r4. 4 N -4 -4 M r NmC;~ r: N ft N - .N -4 N
r- co -4 -4-4
xx x
0
0 44) r-oq9
$4 .q 0 0 ~ 04
v ;
0- N 1' N
Z4 -4 u jN 0 O
US Ooo .o to '040 &
90
-57 -
4k d
N .~~44 g P4
t84*ka
a0 0 oIJUCP-4
1.0,
Ni nO a 06
08U~5:I
k ome0 C 0 -. 0 in
c.0f 4 0f N "4 4 -l*t1'C04L .0 000-- i 0-0 0L
N -44.40' 10 m ~ 0 N 0 t- N0 0DIN O M
fn a - - 0 m fn 004~ 40
o r- r f-r w m m w '0 0 00 a '0,a 0,
0 a a,' 1~O a N 00 00.-.0 0 o'0 00 -444-- N NNo
t0 0 p 00 _ 4q .4 . 4P4- N P44N 4
~ 14 l t0- a- 0 --4 0N 4lm 1
84144 0
0 4I0
In C .-I441
1m m4 m o -4 o C, ao Go GoOc0 41 0 0 00 L t 0 00044-
-A 0 0000 00 al 00 04304.i 0 00 P00'0 t- 1 00 0 0 0 0 t- r . . . . t-in eloo
00000000000o
*-o 4f w - o4 0M'-4n.,n n (4nww, 10 ' .No A
'0 '0 V Nm N N
t- t- '0 @0 -4.4mf"m4 n.- -4 0 do co m. -n 00 000 000, 00 00 ,-
w 00 00000mmmmmmmt ul
04 " n 4mkn 0, '0- 0 ff" i4 4n ' 'Dro 0. '.4 N 0.'U~~If 0"'N f" MNN v 00 0 1 t I'U~~~I 41 ev .0441 4
$4In 0 1On to-lo s00 10 0004 0-NO4u
.
OCcocco:. c 000-.-.i-4.. 000C c s i
in- NNNNNNNN NNN N N
-59-

APPENDI X A: Civil Fliight Identification Prefix
Part I - Alphabetical by Code
Code Owner
AA American Airlines, Inc. (USA)AB Empreoa do Transportess Aerovias Brasil. S.A. (Brazil)AC Aerovias Nacionales do Colombia# S.A. AVIA.NCA (Colombia)AF Air France (.France)AG Guest Aerovias Mexico, S.A. (Mexico)Al Air India Airlines (India)AX Alaska Coastal Airlines (USA)AM Aeronaves de Mexico, S.A. (Mexico)AR Aerolineas Argentia FAMA (Argentina)AS AlaskaAirlines, Inc. (USA)AW Airwork Limited (U. K.)AZ Alitalia-Liiee Aeree Ital Lane (Italy)
BA British Overseas Airways Corp. BOAC (U.K.)INX Braniff International Airways$ Inc. (USA)BW B ritish Wesmt I ndian Airways, Ltd. BWI A (U.KX.)
CA Capital Airlines, Inc. (USA)CB Caribbean Atlantic Airlines. Inc. (USA)cc Ll oyd Ae rreo Col ombiana (Colombia)CF General Aviation (Canada)CH California Hawaiian (Non-Scheduled) (USA)CI Cinta. Chilean Airlines ( Chil e)CO Continental Air Linesa, Inc. (USA)CP Canadian Pacific Airlines, Ltd. CPAL (Canada)
CU Companla Cubana, do Aviacion. S. A. (Cuba)CZ Cuba Aeropostal, S.A. (Cuba)
DL Delta Air Lines, Inc. (USA)DO Compazaia Dominicans. do Aviacion, S. A. ODA (Dominican Republic)
EA Eastern Air Lines, Inc. (USA)EQ Eagle Airways of Britain (U.K.)EM Quantas Empire Airways (Australia)
ES Ellis Air Lines (USA)
TI 3rlugfelag I slands (I celand)
FT Flying T ige r Airlinesa ( USA)
- 60-

APPENDIX A: Part I (continued)
Code Owne r
GL Great Lake m (Non Scheduled) (USA)
GU Empress Guatemalteca de Aviacion AVIATECA (Guatemala)
HP Aerovia. Panama (Panama)
IB Iberta Lineas Aereas de Espana, S.A. (Spain)IN Aerlinte Eireann Tta (Ireland)I U Inter Continental Airline. (USA)
TL Japan Airl ines Co., Ltd. (Japan)
KL KLM Royal Dutch Airlines (Netherlands)
LA Lines Aerea Nacional de Chiles LAN (Chile)LH Deutsche Lufthansa Aktiengesellschaft (Germany)LL Loftleidir H. F. - I celandic Airlines (Iceland)LM Lineas Aereas Mexicanas, S. A. (Mexico)LR Lineas Ae ream Costaricenses, S. A. LA.SCA (Costa, Rica)LV Linea, Aeropostal Venezolana LAY (Venezuela)LY El Al Israel Airlines, Ltd. (Israel)
MA Military, Air Force (USA)MC Maritime Central Airways (Caa~ada)ME Mackey Airlines, Inc. (USA)MR Military, Army (USA)MV Military, Navy (USA)V ix Compania Mexican& de Aviacion, S. A. CMA (Mexico)
NA National Airlines, Inc. (USA)NC Northern Consolidated Airlines* Inc. (USA)NE Northeast Airlines, Inc. (USA)NI Lineas Aereas do Nicarague, S.A. (Nicaragua)NO North Central Airlines, Inc. (USA)NN Non-Scheduled (USA)NW Northwest Airlines, Inc. (USA)NX General Aviation (USA)
ON Overseas National (USA)
_ 61 -

APPENDI XA: Part I (continued)
Code Owne r
PA Pan American World Airways System (USA)PC Pacific Airlines, Inc. (USA)PG Pan American-Grance Airways, Inc. (USA)PK Pakistan Int. Airlines (Pakistan)PN Pacific Northern Airlines, Inc. (USA)PR President Airlines, Inc. (USA)PW Pacific Western Airlines, Ltd. (Canada)
QA Aerovias' "Q", SA (Cuba)
RD Riddle Airlines (USA)RG Empresa de Viacao Aerea Rio Grandense VARIG (Brazil)RN Rutas Aereas Nacionales, S.A. RANSA (Venezuela)RV Reeve Aleutian Airways, Inc. (USA)
SB Seaboard and Western Airlines (USA)SK Scandinavian Airlines System SAS (Scandinavia)SN Societe Anonyme Belge d' Exploitation de la Navigation Aerienne
SABENA (Belgium)SR Sw 4ss Air Transport Co. , Ltd. (Switzerland)SU A-roflot (USSR)
TA TACA International Airlines, S.A. (El Salvador)TC Trans-Canada Air Lines TCA (Canada)TN Trans-Atl antic (Non-Scheduled)TO Transcontinental S.A. de Transportes (Argentia)TP Transportes Aereos (Portugal)TR Trans Caribbean Airways (USA)TW Trans World Airlines, Inc. (USA)TX Transportes Aereos Nacionales, S.A. TAN (Honduras)TZ Aero Transportes, S.A. ATSA (Mexico)
UA United Air Lines, Inc. (USA)UR Uraba Medellin and Central Airways, Inc. (USA)US United States Overseas Airlines, Inc.
VE Ae rovias Venezolanas, S.A. AVENSA (Venezuela)
WA Western Air Lines, Inc. (USA)WE Wien Alaska Airlines (USA)
- 62 -
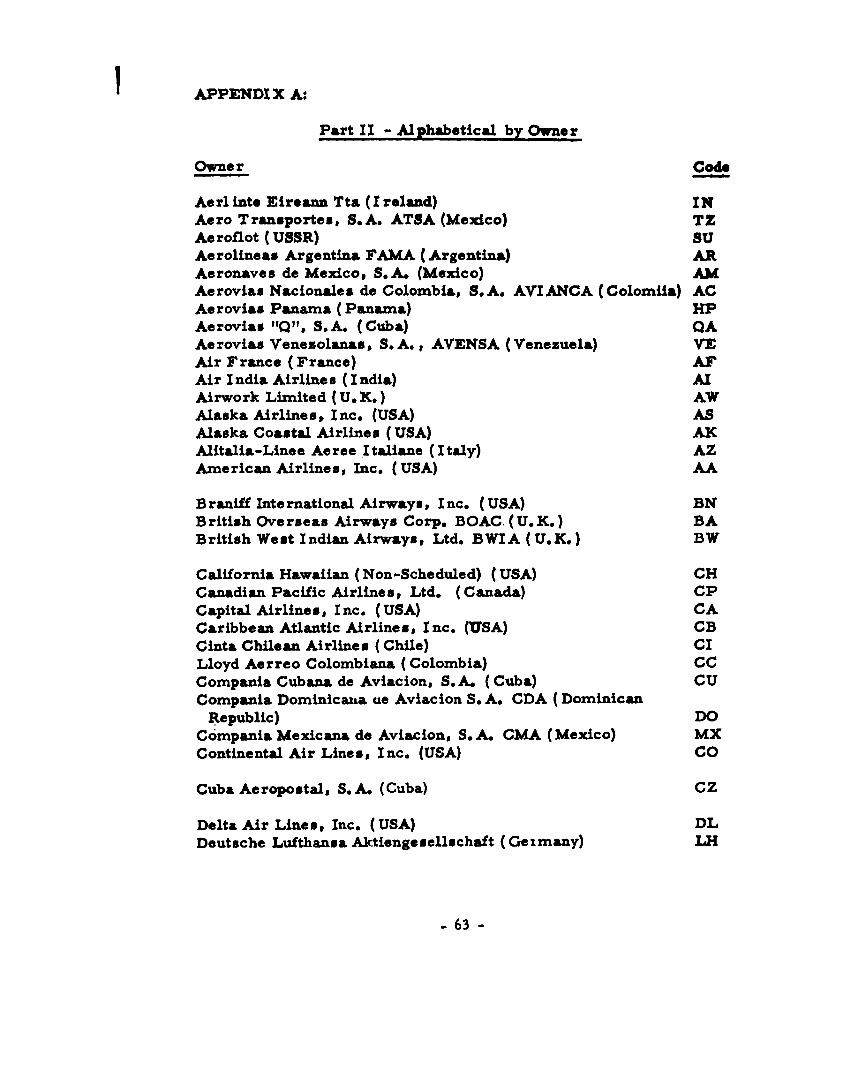
APPENDIX A:
Part II - Alphabetical by Owner
Owne r Code
Ae ri into Eireann Tta (I reland) INAero Transportes, S.A. ATSA (Mexico) TZAeroflot (USSR) SUAerolinoas Argentina FAMA (Argentina) ARAeronaves de Mexico, S. A. (Mexico) AMAe rovias Naclonalesa do Colombia, S. A. A"IANCA (Colomiia) ACAerovias Panama (Panama) HPAerovias 'IQ", S.A. (Cuba) QAAe rovias Venezolanas, S. A.,s AVENSA (Venezuela) VEAir France (France) ATAir India Airline a (India) AlAirwork Limited (U.K.) AWAlaska Airlineso, Inc. (USA) ASAlaska Coastal Airlines (USA) AXAlitalia-Linee Acree.Italiane (Italy) AZAmerican Airlines, Inc. (USA) AA
Braniff International Airways, Inc. (USA) ENBritish Ove rseas Airways Corp. BOAC. (U.K.) BABritish West Indian Airways, Ltd. EWIA (U.K.) BW
California Hawaiian (Non-Scheduled) (USA) CHCanadian Pacific Airlines, Ltd. (Canada) CPCapital Airlines, Inc. (USA) CACaribbean Atlantic Airlines, Inc. (USA) CECinta Chilean Airlines (Chile) CILloyd Aerreo Colombiana (Colombia) ccCompania Cubana, de Aviacion, S.A. (Cuba) CUCompania Dominicana ue Aviacion S. A. CDA (Dominican
Republic) DOCompania Mexicana de Aviacion, S. A. CMA (Mexico) MXContinental Air Lines, Inc. (USA) CO
Cuba Ae ropostal, S. A. (Cuba) CZ
Delta Air Lines, Inc. (USA) DL
Deutsche Lufthansa Aktiengesellschaft (Ge irany) Lii
- 63 -
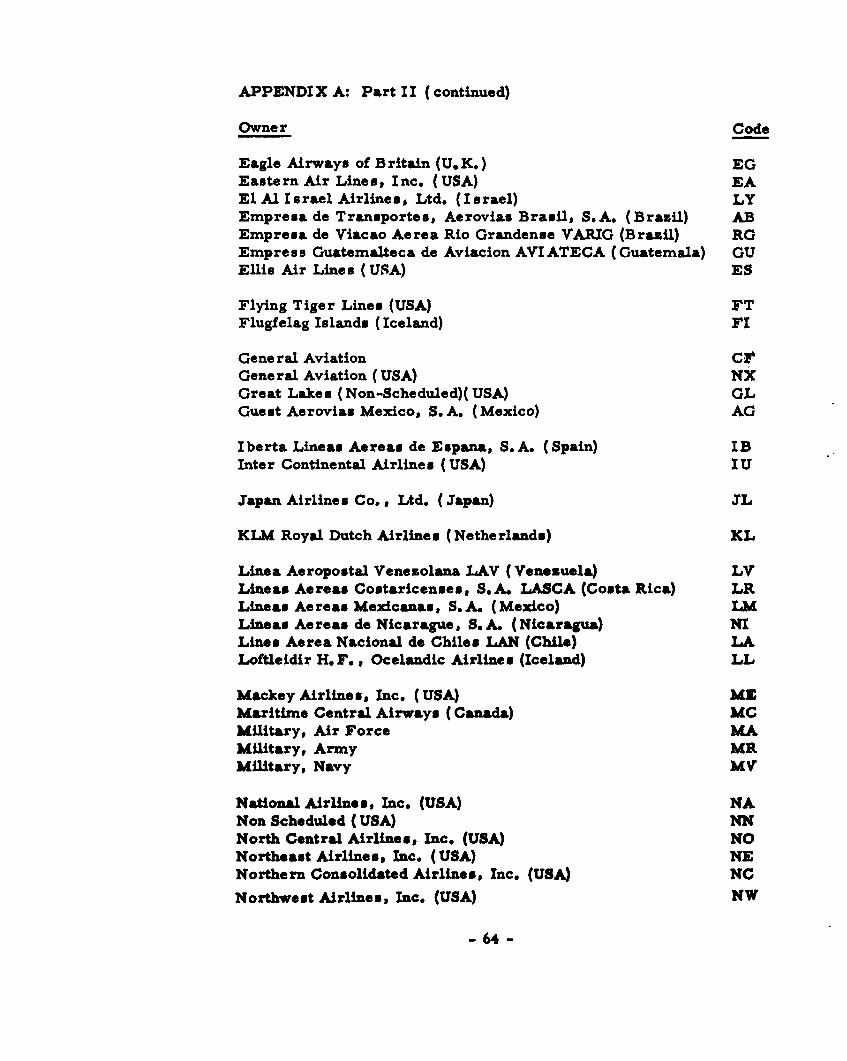
APPENDIX A: Part II (continued)
Owner Code
Eagle Airways of Britain (U.K.) EGEastern Air Lines, Inc. (USA) EAEl Al I s rael Airlines, Ltd. (I a rael) LYEmpresa de Transportes, Aerovias Brasil, S.A. (Brazil) ABEmpresa de Viacao Aerea Rio Grandense VARIG (Brazil) RGEmpress Guatemalteca de Aviacion AVIATECA (Guatemala) GUEllis Air Lines (USA) ES
Flying Tiger Lines (USA) FTFlugfelag Islands (Iceland) FI
General Aviation ClGeneral Aviation (USA) NXGreat Lakes (Non-Scheduled)(USA) GLGuest Aerovias Mexico, S.A. (Mexico) AG
Iberta Lineas Aereas de Espana, S. A. (Spain) IBInter Continental Airlines (USA) IU
Japan Airlines Co., Ltd. (Japan) 3L
KLM Royal Dutch Airlines (Netherlands) KL
Linea Aeropostal Venezolana LAV (Venezuela) LVLineas Aereas Costaricenses, S.A. LASCA (Costa Rica) LRLineas Aereas Mexicanas, S.A. (Mexico) LMLineas Aereas de Nicarague, S.,. (Nicaragua) NILines Aerea Nacional de Chiles LAN (Chile) LALoftleldir H. F., Ocelandic Airlines (Iceland) LL
Mackey Airlines, Inc. (USA) MEMaritime Central Airways (Canada) MCMilitary, Air Force MAMilitary, Army MRMilitary, Navy MV
National Airlines, Inc. (USA) NANon Scheduled (USA) NNNorth Central Airlines, Inc. (USA) NONortheast Airlines, Inc. (USA) NENorthern Consolidated Airlines, Inc. (USA) NC
Northwest Airlines, Inc. (USA) NW
- 64 -

APPENDIX A: Part fl (continued)
Owner Code
Overseas National (USA) ON
Pacific Airlines, Inc. (USA) PCPacific Northern Airlines, Inc. (USA) PNPacific Western Airlines, Ltd. (Canada) PWPakistan Int. Airlines (Pakistan) PKPan American-Grance Airways, Inc. (USA) PGPan American World Airways System (USA) PAPresident Airlines, Inc. (USA) PR
Quantas Empire Airways (Australia) EM
Reeve Aleutian Airways, Inc. (USA) RVRiddle Airlines (USA) RDRutas Aereas Nacionales, S.A. RANSA (Venezuela) RN
Seaboard and Western Airlines (USA) SBScandinavian Airlines System SAS (Scandinavia) SKSociete Anonyme Beige d'Exploitation do la Navigation
Aerienne SABENA (Belgium) SNSwiss Air Transport Co., Ltd. (Switzerland) SR
TACA International Airlines, S.A. (El Salvador) TATrans-Atlantic (Non-Scheduled) (USA) TNTrans-Canada Air Lines TCA (Canada) TCTrans Caribbean Airways (USA) TRTranscontinental S.A. de Transportes (Argentia) TOTransportes Aereas Portuguese, S.A. R. L. (Portugal) TPTransportes Aeros Nacionales, S.A. TAN (Honduras) TXTrans World Airlines, Inc. (USA) TW
United Air Lines, Inc. (USA) UAUraba Medellin and Central Airways, Inc. (USA) URUnited States Overseas Airlines, Inc. US
Western Air Lines, Inc. (USA) WAWien Alaska Airlines (USA) WE
- 65 -