ad 274' 904 - defense technical information center 274'_904 armed services ... report was...
TRANSCRIPT

JTNCLASSI FI ED
AD 274'_904
ARMED SERVICES TECHNICAL INFORMATION AGENCYARLINGTON HALL STATIONARLINGTON 12, VIRGINIAw
UNCLASSIFIED
NOTICE: When government or other drawings, speci-fications or other data are used for any purposeother than in connection with a definitely relatedgovernment procurement operation, the U. S.Government thereby incurs no responsibility, nor anyobligation whatsoever; and the fact that the Govern-ment may have formulated, furnished, or in any waysupplied the said drawings, specifications, or otherdata is not to be regarded by implication or other-wise as in any manner licensing the holder or anyother person or corporation, or conveying any rightsor permission to manufacture, use or sell anypatented invention that may in any way be relatedthereto.
1 ASl-Tl)R-62-2(67
FLIGHT VIBRATION SURVEY OF C-130A AIRCRAFTCHARLES E. THIOMt!AS
., '$ "I'I.TECINICALI I)(CUMINTAIRY REPORT()~l No. :\SI).TI)R.-62,206T
C)
M.AIIR 1962
I)1P, CT/Ii.\T OF )1- N( ;INXi-'," ElI N{; TEST.A\.RION,\UT|ICAiL SYSTEIMS D)IVISIO}N
.. lit FO{RCE1. SYSTEMS C'O}MMAND\VI(:IT~',V'TI S)XAIR I:FRCE, BA\SE, 0)1110

FOREWORD
This technical report was prepared in the Environmental Criteria Br-ncb,Environmental Division, Directorate of Engineering Test, Deputy for Test ann Sup-port, under Project 1309, Task 130906. The Project Engineer on this survey wasMr. Charles E. Thomas of the Environmental Criteria Branch. The survey czv-ered by this technical report is one of a series conducted on operational aircraftbythe Environmental Criteria Branch. The flights discussed in this report occur:-ed
during the period extending from December 1956 to June 1957. The informatioiobtained from this effort was submitted as raw data to the requesting agency upt ncompletion of the tests, and is now being presented in a formal report for the pexr-p-se of wider distribution.

ABSTRACT
A C-130A aircraft, SN 53-3133, was surveyed at Wright-Patterson AirForce Base, Ohio to determine the vibration environment existing throughout thevehicle under all flight conditions expected in service. Approximately 50, 700 datapoints were obtained from 21 separate locations on the vehicle during five testflights. The data. obta.ned in this survey were evaluated to determine the idequacyof vibration test requirements for aircraft equipment as contained In SpecificationNo. MIl-E- 5272C. The data indicated that the vibration testing requirements ofthat specification were more than adequate with the exception of the very lightpieces of equipment which are attached to the fuselage sidewalls in the vicinity ofthe prop plane.
PUBLICATION REVIEW
This report has been reviewed and is approved.
FOR THE COMMANDER:
GER RC HColonel, USAFAssIt Deputy Commander/Test and Support
it

Prepared by:
CHARLES E. THOMASProject Engineer
Concurred in:
LOUIS SCHAFFERColonel, USAFDirector of Engineering TestDeputy for Test and Support
Concurred in:
e bnica1 DirectorDeputy for Test and Support
Approved by:
GEORGE A. KIRSCHColonel, USAFAss't Deputy Commander/Test avid Support

TABLE OF CONTENTS
Section Page
i Introduction ............................................ 1
II Discussion ............................................. 1
A. Description of the C-130A Aircraft ................... 1
B. Test Instrumentation ................................ Z
C. Test Procedure ..................................... 2
D. Data Processing .................................... Z
E. Presentation of Data ................................ 3
III Results ................................................ 3
IV Conclusions ............................................ 4
Appendix A ............................................ 5

LIST OF ILLUSTRATIONS
FigureEM
1 Schematic Presentation of Pickup Locations ............. 5
2 Graphic Presentation of Frequency Response of MB Type124 Vibration Pickup ............. o .................... 6
3 Photograph of Automatic Tape Playback and AnalysisSystem Equipment ................................... .6
4 Graphic Presentation of Analysis of 100 cps One Volt
Square Wave ........................ . 10
5 Aircraft Configuration Depicting Seven Structural Zones ... 14
Summary Plots for Structural Zones
6 Location: Forward Quarter of Fuselage .,................. is
7 Location: Center Half of Fuselage .... ................. 15
8 Location: Aft Quarter of Fuselage ...................... 15
9 Location: Outer One-Third of Wing ............. 15
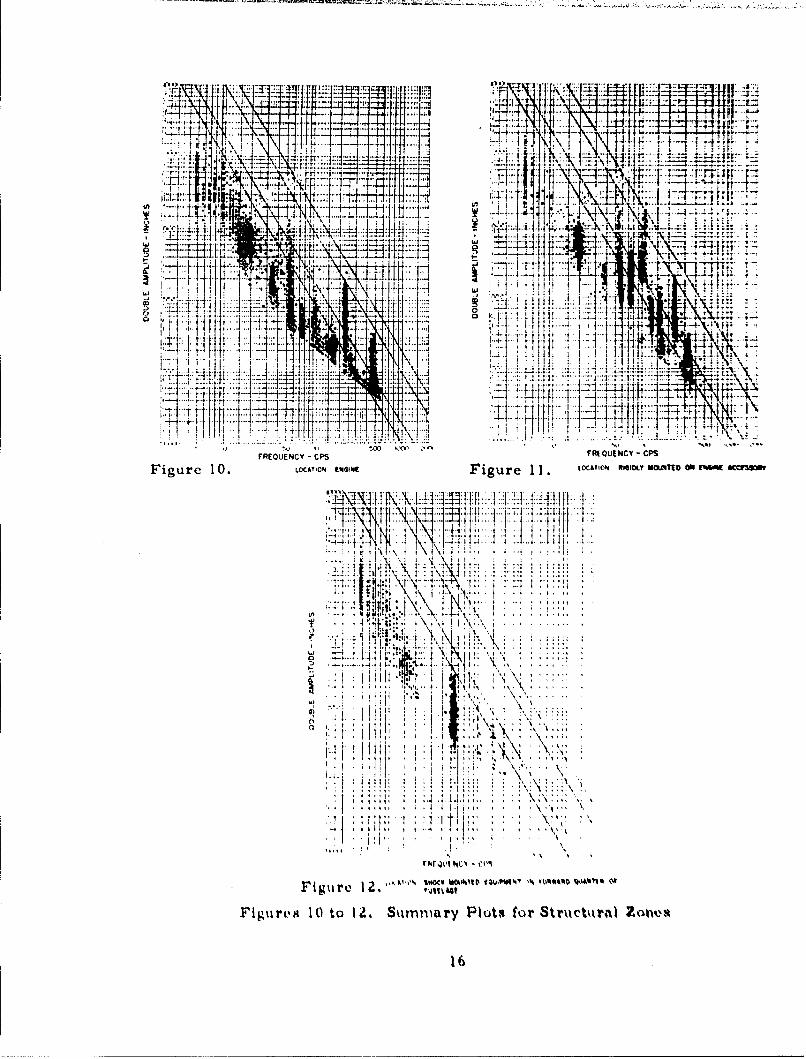
10 Location: Engine.................................... 16
11 Location: Rigidly Mounted on Engine Accessory Section ,, 16
12 Location: Shock Mounted Equipment in Forward Quartetof Fuselage ............... t.............. .16
Summary Plots for Clusters of Two or Three Pickups
13 Location: Structure of Rt. Wing TI
14 Location: Floor of Crew Compartment - F.S, 165
15 Location: Lower Left Side of Pilot's Instrument Panel -FS, 93..,. ... so , , , , , , , , , ,, , , , , , , , , % s%
16 Location: Structure of k'orward End of Cargo Dock -Sta. D-1 FlS, a5 ,, ,,,, ,,, , ,,' ?

LIST OF ILLUSTRATIONS
Figure Page
17 Location: Structure of Equipment Rack - F.S. 245 ........ 18
18 Location: Structure of Equipment Rack - F.S. 230 ........ 18
19 Location: Structure of Main Bulkhead in Radar Comp't(Left Side) ............................................ is
20 Location: Structure of Mid-Center of Cargo Deck T. D. -Sta. D-12, F.S. 480 ............................... 18
21 Location: Structure of Aft-Center of Cargo Deck T.D. -Sta. D-23, F.S. 690 ................................... 19
22 Location: Structure of Aft-Wing Spar - F.S. 597 .......... 19
23 Location: Structure of Equip. Rack Top-Center of CargoCompartment - F.S. 440 ............................... 19
24 Location: Structure of Center of Aft Section - F.S. 1000... 19
25 Location: Forward End of Comp. Section on #4 Engine .... 20
26 Location: Turbine Section of #4 Engine .................. 20
27 Location: Brush'Band on G.E. D.C. Gen. on #4 Engine ... 20
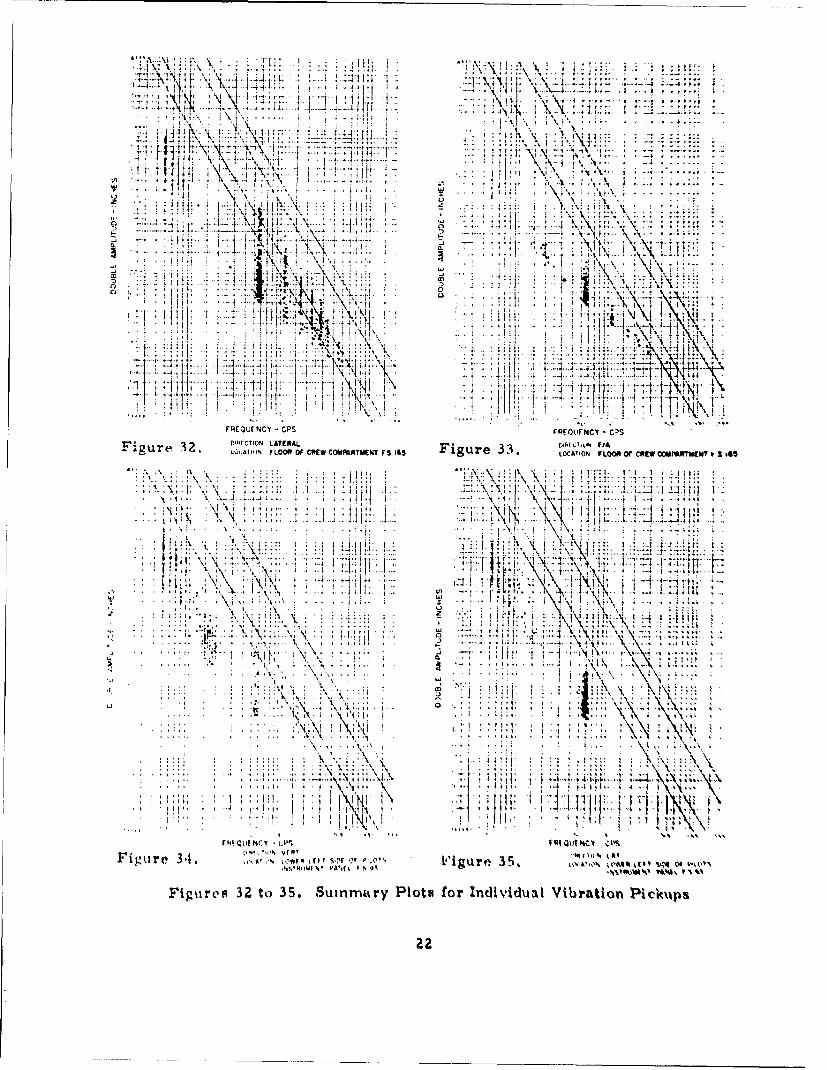
Summary Plots for Individual Vibration Pickups
28 Direction: Vert.; Location: Structure of Rt. Wing Tip .... 21
29 Direction: Lat.; Location: Structure of Rt. Wing Tip •... al
30 Direction: F/A; Location: Structure of Rt, Wing Tip..... al
31 Direction: Vert.; Location: Floor of Crew Compartment -
32 Direction: Lat,; Location: Floor of Crew CompartmentF.S. 165t. . . , , , , . , , , , , , , , , , , , , , , a
33 Direction, F/A; Location: Floor of Crew Cornpartmet-FS 165, ,

LIST OF ILLUSTRATIONS
FigurePage
34 Direction: Vert.; Location: Lower Left Side of Pilot'sInst. Panel - F.S. 93 ................................... zz
35 Direction: Lat.; Location: Lower Left Side of Pilot'sInst. Panel - F.S. 93 .................................. zz
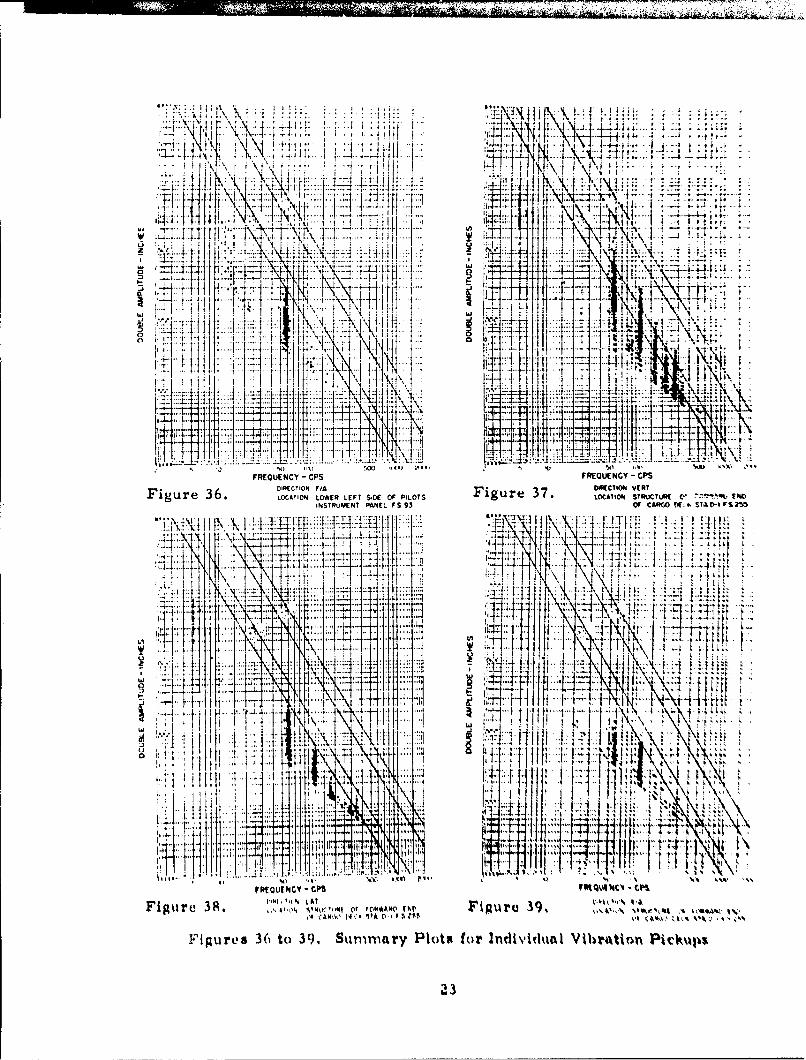
36 Direction: F/A; Location: Lower Left Side of Pilot'sInst. Panel - F.S. 93 ....................... ....... ...
37 Direction: Vert.; Location: Structure of Forward End ofCargo Deck- Sta. D-l, F.S. 255 ........................ 23
38 Direction: Lat.; Location: Structure of Forward End ofCargo Deck - Sta. D-l, F.S. 255 ........................ 23
39 Direction: F/A; Location: Structure of Forward End ofCargo Deck- Sta. D-1, F.S. 255 ........................ Z3
40 Direction: Vert.; Location: Structure of Equip. Rack -F.S. 245 ............................................. 24
41 Direction: Lat.; Location: Structure of Equip. Rack -F.S. 245 ...................... ............................. 24
42 Direction: F/A; Location: Structure of Equip. Rack -F.S. 245 ... ........................................ .. . 24
43 Direction: Vert.; Location: Structure of Equip. Rack -F S. 230 . ........ ......................... .......... 4
44 Direction: Lat.; Location: Structure of Equip. Rack -F .S. 230* ..... . . . . .. . . . . .. . . ........... as
45 Direction: F/A; Location: Structure of Equip. Rac'k-F .S. 230 .... . . . . . . .. . . . . . ..........t.,... as
46 Direction: Vert.; Location: Structure of Main bulkhead IraRadar Comp't (Left Side) ... ,,,,,,, .... , 5
47 Direction: Lat,; Location: Structure of Main Bulkheatd inRadar Cormp't (Left Side),% .. ,,,
'Tit

LIST OF ILLUSTRATIONS
Figure Page
48 Direction: F/A; Location: Structure of Main Bulkhead inRadar Comp't (Left Side) ............................... Z6
49 Direction: Lat.; Location: Structure of Left Side of A/CFuselage - F.S. 360 - 6 ft. above Floor .................. 26
50 Direction: Lat.; Location: Structure of Left Side of A/CFuselage - T.S. 360 - 4 ft. above Floor .................. Z6
51 Direction: Lat.; Location: Structure of Left Side of A/CFuselage - F.S. 360 - -2 ft. above Floor .................. 26
52 Direction: Lat.; Location: Structure of Left Side of A/CFuselage - F.S. 390 - 6 ft. above Floor .................. Z7
53 Direction: Lat.; Location: Structure of Left Side of A/CFuselage - F.S. 390 - 4 ft. above Floor .................. 27
54 Direction: Lat. ; Location: Structure of Left Side of A/CFuselage - F.S. 390 - 2 ft. above Floor .................. 27
55 Direction: Vert.; Location: Structure of Mid-Center ofCargo Deck T.D. - Sta. D-12, F.S. 480 .................. 27
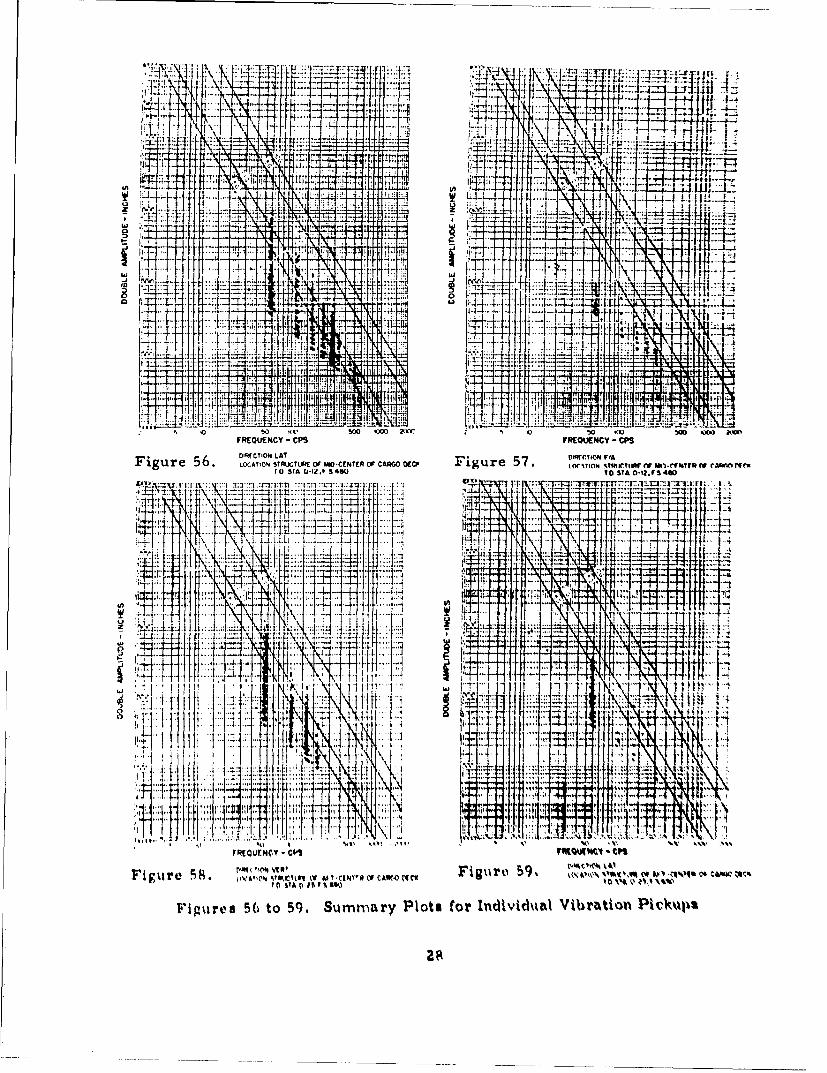
56 Direction: Lat.; Location: Structure of Mid-Center ofCargo DeckT. D. - Sta. D-12, F.S. 480 ................
57 Direction: F/A; Location: Structure of Mid-Center ofCargo Deck T. D. - Sta. D-12 FS. 480 ...............
58 Direction: Vert.; Location: Structure of Aft-Center ofCargo Deck T D. -Sta. D-5 F,S. 690, A.ft.....t. .. f
59 Direction: Lat.; Location: Stru:ture of Aft-Center ofCargo Deck T.D. - Sta. D-25, F,S, 690, .......... ,,,, %
tO Direction- F/A; Location%, Structure of Aft-Center ofCargo Deck T. D. - Sta. D-25, F,S. 690..,,,,,,,, % 9
61 Direction: Vert, Location: Structure of Aft Wing Spar -F,S, 9. , .
Vittt

LIST OF ILLUSTRATIONS
Figure
62 Direction: Lat.; Location: Structure of Aft Wing Spar -F.S. 597 .............................................. 29
63 Direction- F/A; Location: Structure of Aft Wing Spar -F.S. 597 ............ ........................ ........ Z9
64 Direction: Vert.; Location: Structure of Equip. Rack Top-Center of Cargo Comp't -F.S. 440...................... -
65 Direction: Lat.; Location: Structure of Equip. Rack Top-Center of Cargo Comp't - F.S. 440 ...................... 3 0
66 Direction: F/A; Location: Structure of Equip. Rack Top-Center of Cargo Comp't - F.S. 440 ...................... 30
67 Direction: Vert.; Location: Structure, Center of AftSection - F.S. 1000 .................................... 10
68 Direction: Lat.; Location: Structure, Center of AftSection - F.S. 1000 .................................... 31
69 Direction: F/A; Location: Structure, Center of AftSection - F.S. 1000 ...................................... 31
70 Direction: Vert.; Location: Forward End of Comp. Sectionon #4 Engine ................................. ....... 31
71 Direction: Lat.; Location: Forward End of Comp. Sectiun
on #4 Engine .......................................... 31
72 Direction: Vert.; Location: Turbine Section of 04 Engine,. 3a
73 Direction: Lat.; Location: Turbine Section of 04 Engine.. .
74 Direction: Vert.; Location: Brushl andonG.E, D,C,. Gen.on #4 Engine .. . . , . .. . .. , .. . , ..
7 1; Dirtction: Lat,; Location: Brush Band on G,E. DC, Gn,on 04 Engine la

LIST OF TABLES
Table
I C-130A General Specfication Data........................2Z
II Pickup Locations ......................................... 6
III Flight Conditions for C-130A ............. 0...........0...
IV Specifications for Davies Laboratories Model 502 Magnetic
Tape Playback and Model 510 Automatic Analyzer ............ 9
V Summary of Informnation onIBM Cards ...................... 1Z
VTj Code for Structural Zone of Aircraft ....................... 13
it

SECTION I
INTRODUCTION
One of the major problems in the design, application, testing, and use ofairborne equipment is the lack of sufficient data to define the actual dynamic envir-onment in which the vehicle equipment must operate. In most cases this lack o-0data has resulted in either (1) overdesigning the equipment, with its attendant e-'ces-sive development costs, time, specimen size, and weight, or (2) underdesigningthe equipment with a resulting lack of reliability and limited service life. Toacquire the needed information, the Environmental Criteria Branch, EnvironmentalDivision, Directorate of Engineering Test, Deputy for Test and Support, hae i!.C-mented a comprehensive data acquisition program aimed at obtaining vibratiin "taon all available aircraft and missiles.
This is one of a series of reports which present vibration data measuredon the structure cf aircraft and missiles. The primary objective of these reportsis the dissemination of important dynamics data to those concerned with developingairborne accessories. These data can be used as the basis for preparing designand testing specifications, estimating environments on air vehicles in the "drawing-board" stage, establishing optimum locations and installation practices, etc. Thedata in this report have been interpreted only with respect to the specific vehicle ofthis study, i.e., C-130A, and no attempt has been made to assimilate this infor-ration with existing data on other similar vehicles or to present complete explan-ations of all the vibration phenomena involved. Reports will be published later tointerpret the data and to draw comprehenaive conclusions concerning vibration gen-eration, propagation, structural response characteristics, and the like. However,the test instrumentation, procedures, and data reduction methods are covered inconsiderable detail in this report.
SECTION II
DISCUSSION
A. Description of the C-130A Aircraft
The C-130A is a high-wing, all metal construction, medium-range, land-based monoplane. It was designed and built by Lockh eed Aircraft Corp, Marietta,Georgia. The mission of the airplane is to provide rapid transportation of persqm-nel or cargo fur delivery by parachute or by landing,
The airplane is powered by four Allison T56-A-IA tuxrboprop, cs tant-speed engines which operate at a speed of 13, 820 RPM, Each engine is vated &t3750 shp and drives a 3-blade, 15-ft. diameter, electro hydraulic, constant-peeir propeller through a 1Z. 5 to I reduction ratio gearbox, Table I pre me-A
the principal dinenslons of the C-130A aircraft,
Vanusrtpt released Dy the eathor 14 February 196P for paJbtiq&o an ekiAuD reclinical Uooumesttary Report.
1

TABLE I
C-!3CA CflNERAL SPECIFICATION DATA
Wing Epan 132 feet 7 inchesLength 95 feet 2 inchesHeight 38 feet 4 inchesStabilizer Span 52 feet 8 inchesDesign Gross Weight 108, 000 pounds
B. Test Instrumentation
The test instrumentation comprised the following: (1) forty-eight MBManufacturing Co. Type 124 velocity pickups, (2) one Davies Laboratories, Inc.Model 501, 14-channel magnetic tape recorder, and (3) a remotely cont.rolledpickup selector switch. The pickups were attached to the aircraft structure andengines at twenty-one points of interest. Thirty-six of the pickups were mountedin groups of three and oriented to sense vibration along each of the three majoraxes of the aircraft. Six of the pickups were mounted in pairs and oriented tosense vibration in the vertical and lateral directions. The remaining six pick-ups were mounted individually on the sidewall at various stations and heights tosense vibration in the lateral direction. The locations are shown in Figure I,Appendix A which presents a more detailed description of the instrumentation.
C. Test Procedure
Five flights were made during this survey. Vibration records wereobtained during all of the normal conditions expected in service, such as taxi,ground runup, takeoff, climb, straight and level flight (at various altitudes, air-speeds, and power settings), descent, landing, and landing roll. Magnetic taperecordings were obtained from all test pickups for each of the specified test con-ditions. A reel of recorded magnetic tape data consisted of approximately 90data samples, each having, generally, a length of 75 inches and covering a periodof 5 seconds. Further information concerning the test procedure is contained inAppendix A.
D. Data Processing
The reels of recorded data were edited in the laboratory, Then, each
data sample, which includeR twelve channels of tebt data, was spliced into anendless loop. Next, each loop was placed on a Davies Model 502 tape playbacksystem. Then, a narrow bandwidth (10 cycles per second) analybis w4as conductetl
simultaneoutly on six of the twelve data channels of the loop and the analyseddata were recorded on six modified Brown strip chart recorders in the form ofa continuous spectrum of frequency (cps) versus transducer voltaRe (rms), Thisprucedure was repeated to analyze and record the analysed data of the other iX
data channels of the loop. The analyzer used is a heterodyne typo, Davies %l4, I
51li,

The data points of interest were then extracted from the strip chartrecording, tabulated, and punched into IBM cards. Corresponding decks of",vias-ter" cards which contain detailed descriptive information Loncerning pickup loca-
tion, flight test conditions, and source and order of vibration were also produced.Next, the raw data together with the formula for computing double amplitude ininches and acceleration in g units and the appropriate descriptive information or.the "master" cards were fed to an ERA I1O3A computer. The completed datacards were then sorted into the desired order and the data were plotted by anautomatic plotter having IBM card input capabilities.
E. Presentation of Data
The plots contained in this report are: (1) summary plots for each indiv-idual pickup for all of the flight test conditions, (2) summary plots for each clus-ter of pickups (2 or 3) at any given test point, and (3) summary plots for struc-tural "zones" for all of the flight test conditions. These types of data presenta-tion have proven satisfactory for use in establishing specification requirementsand in estimating vibration environments in other similar vehicles. However,in instances where more detailed analysis of the vibration characteristics isrequired, graphs could be prepared to show variations of many parameters affect-ing the vibration conditions in the vehicle. For example, graphs can be madeshowing variation of vibration as a function of the following parameters: (l)iL-aic-ated airspeed, (2) altitude, (3) power, (4) flight condition, (5) propeller order,etc. Plots of this type can be furnished if requested. A more detailed descrip-tion of data handling procedures, data analysis, and presentation methods is con-tained in Appendix A.
SECTION III
RESU LTS
Approximately 50, 700 data points were obtained during the five testflights which comprised this survey. As expected and as shown by the graphspresented in Appendix A, the data are of the discrete frequency type. The don-inant source of these frequencies is the propeller. However, in the case of thepickups mounted on the engine, vibration frequencies dua to engine and access-ory unbalance occurred constantly.
The frequencies produced by the propeller, both those due to propellerunbalance and to the blade passage past the fuselage, were observed over thefrequency range of 15 to 500 cps. Only the fundament,,l of the propeller unjah-ance was dettctedr; howevr, blade passage frequencies ranging from the tjNnata-untal up through the ninth order depending upon tho structural aont, wer
detected. The intensity of the, fuselage vibration dute to the propller is getsiin the nren adjncent to the rt.,rpellers, and diminishvs as the dstance from the

propellers increases in either direction. The maximum vibratory acceleration(approximately ±22 g) occurred on the fuselage sidewall at a frequency of ZZ0 cpswhich corresponds to the fourth order of the blade passage frequency.
The vibration proe'zced by the engines was also of the discrete frequencytype. Only the first order (230 cps) and second order (460 cps) of the enginevibration were measured. The vibratory acceleration levels were generallybelow +5 g. The first and second orders of vibration due to propeller unbalanceand the first and second orders of the propeller blade passage frequency werealso observed on the engine.
The test data indicated that the following overall vibration test envelopewould be satisfactory for equipment used on the C-130 aircraft:
5 to 8 cps - .15 in. double amplitude8 to 22 cps - +. 5 g Vibratory acceleration
22 to 70 cps - .02 double amplitude70 to 500 cps - +5 g vibratory acceleration
However, this overall vibration envelope would require modificationswhen applied to the following items of equipment: (1) those rigidly mounted to anengine accessory and (2) those attached to the sidewall of the fuselage in the cen-ter half.
Modifications to overall vibration envelope for equipment rigidly mountedto an engine accessory:
22 to 110 cps - .02 double amplitude110 to 500 cps - +5 g vibratory acceleration
Modifications to overall vibratio, -nvelope for equipment attached to thesidewall of the fuselage in the center half.
5 to 10 cps - .15 in. double amplitude10 to 22 cps - tl g vibratory acceleration22 to 70 cpm - .04 in. double amplitude70 to 140 cps - +10 g vibratory acceleration
140 to 220 cps - . Olin. double tmplitude220 to 500 cps - +10 g vibratory acceleration
SECTION IV
CONCLUSIONS
The resonant frequency of any vibration Isolators used should be in the20-to 30-cps frequency band to have satisfactory operation and aer\vice life Andto avoid resonant excitation.
4

APPENDIX A
Instrumentation
Forty-eight MB Type 124 velocity pickups were mounted in clusters(2 or 3) and Individually at 21 separate test points on the aircraft engine andstructure. The locations are summarized in Table II and shown in Figure 1. TheType 124 velocity pickup has the following characteristics:
Nominal sensitivity - 96.4 mv(rms) per inch per sec. (rmf',
U sable frequency range - 5 to 2000 cpsTemperature range - -65 to 2500 F
40440C
4034C
4001C 4045-C4O407" ?OC ~ ~ ~ f 01
0S
406 4024 4067
401,019
404 4037C 4C 0)I
Flgttro 1. St'hen'tic Pri' ~tnt;%tik tn f Pickiij Lovatiowi

TA13LE 11
PIC KI' P 10CAT IONISVIiD Location Diretioo PUID ti,., .- ri
91 Struct,. I Rt. Wir& Ti~n Vert 2's Structure of Loft Sid4.-' AX Loat0z Lot Vog.101. -V.S. .490 1. ft. Lz"~0if FiA Mo~r
0,4 Vl 0 I of Cc.-. C' .npo.,t-r.t - Ve-rt 20 Struc.ture -f Left Sid. .f A/C ".1Os V.S. Its. Lt F ... Iag. - V.S. 190 4 it. bo.-06, V/A Floor
0, L.-, L.-ft Sid, 14 Pilt'. ?o-t. Vert 21 Strcture~ of Loft Side- of A/C Lot0" P- roo F.5. 91 "t P,.g - V.5. P 0 Z ft. t-../10 V/A Vie,-
10 St,,uot-, 0f kor.rd End. 0i Vert ZO Strucoture ,f 0114-Crot.-? c Cargo Vert11 C.rg, Dl-k1 - St.. D-1,. VS. ZO'. Lot Z9 Dl-k T.D. - St.. D,.12. F.S. 4110 Loat
lzVIA 30VIA
it Stoc of Equip. Rack Ve.rt i: Structure of Aft-t,-nt.., If Cor 5 o V, ft4 P.S. 24 "ot 42 D.rI. T. 0. - St.. 0-Z%. FS. t90 1-atis. FA itV/A
I#' Structure ,fEquip. Rack Vert 44 Structur, 1 Aft Wing0 Spar. - Vr7 V.S. 250 Lot is V.S. '.97 Lo'
Y!VA 3,, VIA
,It~.o M-~ HuoI1h-o4 in R.4., Vert 17 Structure- of Equip. Rick Iop . er20 . tpt Lft t4. Lo 8 C.rit, r of Cargo~ C-o.t - F.S. lot
V/A 19 440 V/A
40 Structure. Center.. I Aft 5.-oti-, Verz1 St-mt,.-t lfoIft Sid, of A/C "ot 41 V.S. 11,00 Loat
--lx V.S. 160' h ft. .1 v. 4.2 VIA
41 VFo-w.f VEnd , f Corep. Scott,, VerI Si,,r- f I .-ft Si, .1 A/C Lot 4 4 n,. o1* V.4 4o -4 4ni ft. .1,
Fl .r 4s. T-,,,o. S-otin of *4 En,,,iVert
24 St,-t-r I 1.-ft 4,.f. I AiC tIK ..1. 4i.h4t, If.-ush flod -n C... D.C. Cc.-on * V.-rt
Fl- . 47 04 Engine. ft
A typical response curve is shown in Figure 2. The three -position mounting blocksused to attach the pickups to the vehicle structure have no resonances below 500 cps.
110 100 1000FREQUENCV C P 5
Figtire'2 Fritqt'ncy Rit.!sjirlefo.v ut N111 Typo' 124 Vibratio 11Ali
6

A Davies Model 501, 14-channel magnetic tape recorder was used torecord the outputs of the vibration pickups. The recorder, complete with con-trol box and shock mount, and the pickup selector switch were installed in 'henose section of the aircraft. The 26-to 28-volt DC power, required for opera-tion of the recorder a.-d the selector switch, was obtained from the aircraft'sDC system. The recorder was preset for a recording time of five seconds. TheModel 501 recorder is an FM type having the following characteristics: (I, FMcarrier frequency of 10 KC, (2) intelligence frequency response of 3 to +300 cos,(3) dynamic recording range of 45 db, (4) tape speed of 15 inches per second,(5) total rccordig time of approximately eight minutes, (6) weight of 55 lbs.,and (7) overall dimensions, including shockmount, of 10-1/2 x 11 x 21 inches.The twelve data channels have an input impedance in excess of 100, 000 ohms.The thirteenth channel has an input attenuation of approximately 45 to 1 and isdesigned for direct connection to the engine tachometer generator. The four-teenth channel is used to record the output from an internal, 10 KC. crystal-con-tt.lled oscillator. This channel is used during tape playback to control the play-back speed by means of a servo, and it is also utilized in the electronic compen-sation of the tape playback and analysis system. Tht recorder uses 1-3/4-inchwide magnetic tape in 400-to 600-foot reels.
TABLE III
FLUIGHT CONDiTO'%, FOP C- I 0A
FhLht Alt t,,. %RPM IAS A!t . 10' P. I.. A HIP
Grund Runu| q7-O0 0 0 Cq.90 S2-1 I I
Orrm,,nd RunupW/On, ,r.Ah*. 0 u i. in2 0 0 9, 12-I00
'ralrni f 100 ISO 0 q1 I it
Ch . 100 ISO 2 1 t.?
Troop D .. t' r. m 01 10 |010 S SN 0,
Straight And I.-..l 100 140 S 21 1
Crui.,.. W/On- or
MWr, F.gin.. (lt 00 1411 ,
Nmrniai Deit-rnt 41 1 4% 4
NV,,r.I| D., -t
W/Sp-, I .r.,
Ilunriihg H,h 'ii t+t)
T.t, 1*., 0 0 41 I I
T , hd, I110 W) %i 41 t
*Ii,,ucr I.,..v Angh,
Test Procedure
Five test flights were flown (uring this survey, A summary of tht testconditions is shown in Table IlI, The test plan was based on requiremn ts ofinterested laboratories at ASD and on information nbtainod frorc, USA f(light W-4

pilots. Data were obtained during all of the normal operational configurationsexpected of the aircraft. Test conditions were also established which permittedthe evaluation of variables, such as altitudc, indicated airspeed, engine thrustat constant airspeeds and altitudes, and the effects of using the speed brakesgear and other control surfaces at various airspeeds. Prior to each flight, theest pilot was thoroughly briefed on the desired flight test conditicns and was
given the appropriate flight test data card. As soon as the desired flight testcondition was attained, the output of each of the 48 pickups was recorded in suc-cessive groups of 12 each by means of a remotely controlled selector switch. Thcnumber of data samples acquired during the five test flights totaled 1477. Thereels of recorded data were sent to the laboratory for analysis.
Data Processing
The reels of tape were edited and each five-second record (data sarnplejwas spliced into a continuous loop and properly labeled. These records wereanalyzed by means of a Davies Model 510 automatic analyzer. which was used inconjunction with a Davies Model 502 magnetic tape playback system. The com-plete playback and analysis system is shown in Figure 3.
Figi re 3. Automnntic Tape Playback and Analysis qkQit mtM

The Model 502 magnetic tape playback system had been modified to pro-vide playback at eitber 15 or 3C inches per second. The tape playback contains aservo-control system which permits playback of the tape within very close toler-ances of its originally recorded speed. During playback the output from all f:)ur-teen tracks is fed simultaneously into the fourteen FM playback discrimirators.The output signal from each of the twelve data channels is a 1 to I reproductionof the original analog signal.
An important feature of the playback system, i.e., electronic compen-sation, should be discussed briefly at this point. During the data recording pro-cess, the input of the fourteenth channel is the voltage from a very stable, 10 Kr,crystal -controlled, reference irequency oscillator contained within the recorder.During playback, a portion of this 10 KC signal is fed into a standard FM dis-criminator channel. Assuming there were no wow and flutter during playback,the output voltage from this pirticular discriminator, i.e., the fourteenth chan-nel. would be zero'. Therefore, if any voltage is obtained from th's channel dur-ing playback, it is an "error" voltage produced by wow and flutter. This "error"voltage with its phase shifted 180 degrees is fed simultaneously into the outputstage of each of the twelve data channels. In this manner, the extraneous volt-ages due to wow and flutter are eliminated from the signal output of the data chan-ncls. Prior to playback of data, each of the data channels is adjusted for optimumcance-llation (approximately 40 db). Hence, an overall dynamic range of 45 db(record through playback) can be maintained consistently. Table IV contains asummary of facts pertinent to the Davies Model 502 magnetic tape playback .yya-t .m and the Davies Model 510 automatic wave analyzer.
TAIII.E IV
SPECIFICATIONS FOR DAVIES I.A11OEATORIESMODEL, 0Z MAGNETIC TAPE III.AYiIAC.KAND MODE. SI0 AUTOMATIC ANAI.YZER
F'r-piwvo n .. ize I .-p" to 2, 000 t~psl
F'r,.qu.ciiv Avtiorvy 0.2 p. from S to 40 , p.0. Yr frotm 40 to 2. 000 .p.
fil-'at V ,Itdig' It.,t.ge 1. 0 v.it wr 10 %-lt, Itl. ii. itigl(2-l~i ~% wittch)
fritl 12 i M t
IIro t, Iito\ 4 o I 1t , ,,,i, I \
MoloIr flrtlt o 'I~~ 111w I lillimi'~ ,
It ~ ~ ~ Ma1vll *,rvl 'SivI it .iii. . s l fr*0.fill t, Idl ' w km
I.ii III i .I Itoh.
1 11, 1" i

The Davies Model 510 automatic analyzer is a constant-bindwidth, heter-odyne analyzer complete with motor-driven, variable frequency oscillator. Thesystem has six separate analyzers and can analyze six data channels simultan-eously. Both the oscillator scanning rate and analyzer bandwidth are adjustableover the following limits: (1) ecan rate 0.3 to 3.0 cps/sec. and (2) bandwidth Ito 40 cps. The output of the six wave analyzer channels was fed into six modifiedBrown strip chart recorders. A continuous spectrum plot of frequency (cps) vsvoltage (rms) was produced by the strip chart recorders. The chart speed isservo-controlled and can be varied from 0.08 to 13. 5 inches per minute. Thevoltage was plotted on a logarithmic scale and the time required for full-scaledeflection, i.e., zero to one volt, was approximately two seconds. A sampleanalysis of a 100-cps square wave is shown in Figure 4.
ANALYSIS OF 100 CPS
ONE VOLT SQUARE WAVE :_lBW = 10 CPS . , 1
NOTE: THEORETICAL VALUES OFPEAKS ARE INDICATED [L
OI L
FREQUENCY CPSFigure 4. Analysis of I00 cps One Volt Square Wave
In selecting the bandwidth to be used in an analysis of this type, the tol-lowing nist be consideredt (1) the frequency resolution desired, (2) the rate ofscan, (3) the length of the data sample, (4) the time available for data analysis,(5) the quantity of data to be analyzed, (6) the type of data beingl aalyltet, and (7)the type of presentation of the curnpleted data, Based on a consideration of thesevariables, a barndwidth of ton cycles ,)er second was selected for those 'malysea,
10
Following the harmonic analysis, the Brown strip chart recordings wereedited and the voltage peaks of interest were marked. Each of these peaks con-stitutes a data point. The corresponding values of frequency and voltage for eachof these peaks were tabulated, and subsequently punched into IBM cards. Eachdata point goes on a separate card. Then these cards were proccssed throughthe ERA 1103A computer at the rate of ninety cards per minute. Prior to pro-cessing each set or flight of data cards through the computer, a series of threesets of "master" cards was made and fed into the computer. These sets of "rms-ter" cards are:
(1) The "Flight Condition Masters"; these contain all of the necessaryflight parameters, i.e., altitude, IAS, power, etc., associated witheach of the data cards. This information is ,btained from the fligIttest data card.
(2) The "Pickup Location Masters"; these contain the informationrequired to identify each data point of each channel and record numberwith a particular pickup.
(3) The "Source and Order Masters"; these contain sufficient informa-tion to identify specific vibration frequencies with known orders of engineand propeller unbalance and also blade passage frequencies of the prop-eller or rotor blades, as the case may be.
As the data cards are processed, a new and complete "answer" cardhaving the following information is produced: (1) the computed values of doubleamplitude in inches, acceleration in g's, log of frequency, log of double ampli-tude, and log of acceleration, (2) all of the data on the original data card, and (3)all of the appropriate data obtained from the "Master" cards. The order and limitsof the information in the final analysis are shown in Table V.
After th-' computations were completed, all of the data cards were arrangedin the desired sequence by means of an IBM sorter. Then a multi-copy IBM listingwas made of all data. These listings were used in detail studies of the data and inchecking the accuracy cf the completed graphs.
Automatic plotters utilizing IBM card input produced the graphs of fre-quency in cycles per second vs. vibratory double amplitude in inches. The plottingrate ranged from 30 to 60 points per minute. Thc three types of graphs plotted are"
(1) Summary plots (all test conditions) for each individual vibration pickup,
(2) Summary plots for each cluster of pickups (2 or 3),
(3) Summary plots for each structural zone.
Each of the three types of graphs has all the appropriate data obtainedfrom the five flightc. No plots were made to indicate the effects of variables, NuXhas power, altitude, IAS, etc.; however, such pltts can be 0htained upnu requi, t,

TABLE V
SUMMARY OF INFORMATION ON IBM CARDS
Card Column =Categor
I - 2 0 - 99 Pickup Location
3 - 4 1 - 31 Day
5 -6 1 - 12 Month
7 - 8 1 - 24 Time
9 - 10 1 - 12 Channel Number
II - 12 0 - 99 Record Number
13 - 16 0 - 2000 Frequency in cls
17 - 20 0 - .9999 Voltage
21 - 23 0 - 285 Engine Speed
24 - 26 0 - 999 IAS in Knots
27 - 28 0 - 60 Altitude in 1000 feet
29 - 30 1 - 12 Source
11 - 32 0 - 24 Order
33 - 34 1 - 63 Flight Condition
35 - 36 N.A. Blank
37 - 41 0 - .9999 Double Amplitude in Inches
42 - 45 0 - 99.99 Acceleration in g
46 - 50 N. A. Log of Frequency
51 - 55 N. A. Log of Double Amplitude
r6 - 60 N. A. Log of Acceleration
t -162 0 - 45 Aircraft I.D. Number
63- 65 0 - 100 Man. Pro,.. -- In, lgPo-.er Lever Angle in Degrees
- 68 0 - 150 Percent of Rated il. P.Percent of Rated Thrust
(W * 70 1 - 27 Structural '.one
71 - No N.A. Plank
The Type 1 graphs permit a detailed study of the vibration charactert stiesalong a single axis at a particular location in the test vehicle,
The Type 2 graphs present the overall vibration environnent, measuredunder all test conditions, at each of the test points where 2 or 3 pickmps weremlunted in a cluster,
1a

The Type 3 graphs show the overall vibration environment for a structuralzone, e.g., front quarter of the fuselage. The structure of the test vehicle hasbeen arbitrarily divided into nine major areas. Each of these major areas l. Lbeen further subdivided into the following three categories: (1) vehicle structure,(2) rigidl7 mounted equipment, and (3) shock mounted equipment. A complete !st-ing of these structural zones is contained in Table VI. A diagram of seven of thlnine major areas is shown in Figure 5.
TABLE VI
CODE FOR STRUCTURAL ZONE OF A/C
Code Nr Structural Zone
0I Forward Ouarter of Fuselage
02 Center "^If of Fuselage
03 Aft Quarter of Fueelage
04 Vert. & Horli.-.ab. Incl. Rudder &g Elevators
0S Outer one-third of Wing
06 Inner two-thirds of Wing
07 Engine
08 Rigidly Mounted Equipment in Forward Quarter of Fuselage
09 Rigidly Mounted Equipmr." in Center Half of Fuselage
30 Rigidly lounted Equipmsent in Aft Quarter of Fuselage
II Rigidly Mounted Equipment In Vert. & llonri. S.lab.Teete f,ddl. e fevatn s
12 Rigidly Mounted Equipment in Outer one-third of Wing
I I Rigidly Mounted Equipment in Inner two-thirds of Wing
14 Rigidly Mounted Equipment in Engine
I; Shoc.k N.oontrd Equipment in Forward Quarter of Fuselage
16 Shock Mounted Equipmetst in Center Half of Fuselage
17 Shock Mounted Equipment in Aft Quarter mf Fuselage
is Shock Mounted Equipment in Vert. & Hore. Stab.Intl. Rudder & Elevators
19 Shock Mounted EI'uIp"'ots Ita Outer one-tlird of WP,.g
20 Shock Mounted Equipment in Inner two-thirds of i tng
21 Shock Mounted :qutprnjnt in Engin.
2.2 Engine Accessory Section
21 Mailn Rotor Transms..ion Case
24 Rigidly Mounted on E'nglne Arcessory Sertion
Rigidly Mounted ou Ma4in Rtor Trantnisstin r4s
16 Shock Mmintd or Engine Accessory Section
27 Shoek Mounted on Main iotor To'anetisiltn rase
Ali graphs are log-log (3 x 5 cycle) plots of frequency vs, vibratory ltbleamplitude. As Indicated previously, the logs of frequency, double amplitude, aldacceleration were determined during the computation phase of data retdctht, Themo
13

computations are necessary for the automatic plotting of frequency va,. double amp-litude on a log-log scale. For the standard automatic plotters available can notaccept linear input and then plot on a log scale. Therefore, by using the properscale factors, the logarithms :f the desired variables can be fed to any standardplotter to produce log-log plots of the original data. On these graphs of frequencyvs. double amplitude, levels of vibratory acceleration appear as straight lines ofconstant slope. Reference lines having values of!+0.5, +1.0, +5.0, and +10.0 gare included on all graphs. This arrangement permits simultaneous readings ofdouble amplitude and acceleration at any given frequency.
ZONE 7
ZONE 5
ZONESO
ZONE~ I000000 0
ZONE 6
ZONE 3
LEGENDI. FORWARD QUARTER OF FUSELAGE
ZONE 5 2. CENTER HALF OF FUSELAGEZN 3. AFT QUARTER OF FUSELAGE
4 VERT. & HORIZ. STAB. INCL,RUDDER & ELEVATORS
5 OUTER ONE-THIRDOF WING6 INNER TWO - THIRDS OF WING
ZONE Z 7 ENGINE
Figurv 5. Aircraft Configuration Depicting Seven Struictural Zones
A more detailed description of the data reduction processes used to reducetht. vibration dtita is contuined in WADC TN 59-44, ASTIA Donent Nr, AD2104?8,dAtttd Ft'bruary 1951), which to titled, "Data Redction Tochniques for Flight VYtrk-tioi Mtasure'mtnts."
1 ~1

J j .
F RI -Q E C - I C P I Q I Y -C 'Figure~~~~~~~~~~~~~~~ 6.~ WAONFRADQATR0FUEAE
Fgr7. LCTIO ETR\L0 rFI
oC)A.
T-
* 'It
a:,
I/lt
1) 4'
Nk V R*m1,N \ -
F ig tir e , IY 10 AF
*UNr C o i ntF g r 9,, *I% I m v % t
Figurc 6 0o9 u m r lt orS r ~ i a oj-,
- ~ ~ r a i~ ~% .L ..a .. .... a...... +*.-b. . . ~... ...
i. "t"- ThH - V!Im 4 +..... . .. !P ,; ,.. , +..I+zt... ..AT _ _t l._
_ -r
.. A. *• *-i
• .- Mt
tiiti' . ..7 h \ 1 4 t ,. ,n..vi iI ... . . . ,,..
" r .4.jk. !, ':--!! tt:L Itp!!;!q I:! I 4 -!.I! , , I . l t.. I .... + t
414
..... j .' II fi\:".\ Lx t ut ,. B. I . .. H ... .
I;;:
~7 w
.. . , |. . , \ + ,I.. . . .. . .
, I, : .. ' I ! \' I:: :
Fi ur 1 .' A 'C ',',I l f,,," W ', ' 'UNR''" 4Nt60
Figurlesl 10 to 12, Sutmmalry Plots for Structural ZotwR ,
16

N* 4- 49 .3. 1- I
(4 -. 4-~ 4 -l
4 11 A
'6 1
I. ::t : Is 173. --4:
'4 I:1 I . . .
9.,UNC -9l,9f .Y*O - 9ETC~ AEA ,+FAFE U C p
U D.IR9C,9O -VE WA ; 'N Az4*1
F igure 13 . L&.A~i.' SR *9A9 E OF RIH WIGTPF g r 4 OA,4 t FC Ot-_1&
to~ ~ ~ ~~~~~~~~~~~~F k",SrrviyPos o 1~tr 'fTw ~T~e'Pvp
A1

~Jj k__
it t ~r9 :~.i 'e;
"T"T. .
--z4 1.- Ai~* 1
II! ___7
J-%
IT , .... .
t P
FREQUENCY - CPS FREQUENCY - CPS
Figure 17. LOAINS"UEO rAUVNT PACK VS245 Figure 18. LnAT-0
4 STRCTRI'F VWT PACK FS 3
90: 14 T-1t *'9
* V \~. I 4d 4IL': if I *
~dU . f
ifA
.111.
Figur' 19 7 to 2. Su' r Plo fo CO A4l40O iurter 20, Two or Thre %iV4
,IVA 000.? I i IIIN -41 1 14 4184% A

L
I ,m
. Ll 1.. 1
FREQUENCY CPS FE pc ~Figure 2 1 LOCATION4 STRMTLAE OFFT CENTER OF CARGO F'igure 22. DYi'I 110 VERT'. LAI~. VlA
'jx
V41 I Nt. V W
F g re, 2. '" , "' "A
C" 'a0 c* 40Fi.
.1219

1A V: ~ *~
f 141AI~~ ~ j?
PS61E CY - C SFR ~ r c - A X .
Figue 25 ~ ~Figue 26 LOC~ A"
It. 7
~10NOFREQENC cp FRQUECY CP
L JA
IN
t r Q0it4CY -CI
Figure 27. I
Figures 25 to 27. Summary Plots for Clusters of Two or Three Pickups
a0

~~fu 41r: I
- -4
4~ 1t:v
F0ur x28. !1-TIO VETCL I igr
It' t
Fiur 28 tT. ~"C:tIETONLTE
,-7:
t i l t * t t ' t t t t i t h I t
''Z I
k:gu re 30, "" '04SNCUCc 114,W06Il Figure 31, MC"" 4
Figures 28 to 31, Suimmary Plots for Individtual Vibration Picmpa
T i; N .~
Ni N\'7:'
:7 . ..... ..... Ll - V .,... ..........
4.
A~~A !-:.:I ~ ** ""
I N<
ftj4, z!l -.
Xf::~ i N__
X 44 4 3 1 1
T' I A 6I2
Fi u e 3\.0 A . 0 pLF ..S,rt ,* 1 4 A
YITVA4k l 1V gu e 35 ~ x 1 l0 k(*1 I1 V4(00 4K%1 *% 4%%
Figues 2 t 35.Sum aryPlot fo Inividal ibrtionPlc\%p
41 22
~+-4
~y
.~ If ~ LT
z ~z - J .V I -thV7
if I
Ii
T1-'r
Figur 36. Fiu T3 OAO TUT
0i I'Al rt1kFRQEC CP FRQENY- P
IYIIN F/ DIRECTIONVERT
f. :,r 7...1Id. '~ 41
~' '14
I:
5t l w h% IS~ ' a
F igure~ 38. , ' N~~0~O Fipire 39,
Figuresu 36 to 39, Summary Plots for 1djvI~jkaI Vrition pjkj

1 7V
U~T
I; Ii~2 T24 *Z
fl4-4-44
z r~~fpj'-F T]JI 4.+4. 7.H
4-V
:H: 7 -7
-. -T
FREOLUENCY - CPS tQOLINC - CS
Fig ure 40.~ ~ 'Z'ACVR9.FIQ~ A. Fl gure 413. Dt(?O L WA
LOCATIONs STUC0 R to 43, PEN Rum ACy PFS t 2 o5 LOCATIONa~ TRUCTUoRE OfEMI N P- S Z

.:
7 ""F :71 t'i1,4;v
3 -i w~~JA~
j~ili ii
4' '7
fLM
FREgureC 44 CPS .V WOiF i u e 4 L CTICP4 LT FREQUENCY CPSLOCATION S.RUCTURE or rou'uiE RACK FS50 Figure 45. LOCATION STRUCTURE OF EQUIPMENT At FS 230
Ii If~L HiI p 1f
I~ HI
r4. I.
'V \ 1. 1 . '
-1.-I~~~ j' IT ~jj
FREQUENCY - CPSc cFigure 46. r(NNSRCU .FMAIN PULWCA Figu re 47, 1-0W
F'igures 44 to 41. Summary Pluts for Individual Vibration Pick~jp

Vi\ T::qq
tf~r;q %['_ r
'P jJ~±4j~H71--1_
--4
TA ~ 1'g :.2 1114V t.A'~!,::TT
* j44
___~~~~ -0_ 1 j
VR(QENC - CS F~OUECY CT
Figur 48LRcUEO ANgLHFO-Fgr TUT
t U4II~ I))OTLOEFO
[FL~~~~ '' .l :i. 4 i!
"44
T T.
FREQUEN~C - CSFEUNY-CP
Figures 48. LCTO 51,CUR OFm ar PlotsLXA Fgre 49c~ LOCAO STbRTR tO LET IO / UE 13

*i! d.
. I .. -
I ,1~ I.I\.N -.!: ;i
-:%; Nl':. V: 4' 7
i11~ ii.. I ..I.
l.. t I JP214 .
.1! ' FREUENC CPSI 0
Wc) '00f)
10f
FRAEOUENC -LOOS FREQUENCY - CMG-,47TN -TflvT rt0N LAT
ig ire l:, 4&:,TI . .rECT tE C F LfT ritt O F A/C FU ELAGE F S 90 Figure 53. L WCA 11ON STR T URE F EFT SA A fC IF 3s
:J: -4; 41 111 E.mA
'1:1
-_i: I f
I ~ ~ 'I I 3Al 1v~2~
r4 I\ j .I
.4 :I\
" "A' 'L%,
F igtlr vs' 5 6 to 55. Sim in iary P lot s for ln dli tl ia V ib r ati m Pic j v
'o '41
J.. -T".
C. \Jf1 7L
allid10 500~ IOWa , 45 o mkw2v
FREQUENCY -CPS FREQUENCY - CMS
Figure 56. LOATINRCTUR OFr I&-CENTER OFCARGO DECo F igure 57. k NII STTO W ̂ mr TQ WC fC10 31A I-2. 3 4W TO S?& O-12.rS4eO
. H .. . P r !11 TJ; .I: w
-4 L I 'l
I. A: j U
.7 7
'7:7~
TmI~I~
Ig~t~ *r
FREOUENCl P VMt"uIf -It
Figure 58. 1,00 1?frLMR1 I .CgNIQ cir CRom rqc Fig0iw 59. 01,~ R%1 c
Figures 56 to 59. Summary Plots for Individ\%al Vb ro Pickups

-t- +'.i {ij_4 I\t~~-
IT II t
I~~4 .4[ f~
X.4
Figur 60=,Fr:7NFA.. £ DACIN.R
Tb 4T A 25 FS 9'
.1 4_ jfl' 6
I~~~~\ A± '' 4J1fiw. AI .. D0
TDt SI D-251 69041 _- _ 1
T_ Z

j .
7.4 VpZ- 7 ~
0U::i .3a ILL- i_jI. CV-K ~ 3 ~
FR-4NC 4- CP tlQENY-
44 4
.... ;0 IM 5 IL I 5 0FRQEC -CPS .A FREQUENCY -CP
, HI4q!.* z [.:.L. ,.., P'
* I ~* T'
X:]::::
* .. . . lt*T
0 30

V,,
UZ A
0. 4 ~. 4~ F ! _ ~ T
FRCEC P FEUNY C'
*'it 1''':jt.j
Fi u e 6 . LCAINRCUE.4 CENTE OFATlT0!C.FiL 9.~
a4 , . I Ii1 I :
J.
FRI wlif NCY CP1 AN
Fgr'70. "N~ I W ,, ,~ 00 J Figxi r 7 1 WW (**VA
Fipires 68M to 71. Sm-ntwiry Plots fo)r Intividual Vibrtiont IN.%p

to I~ ~fIJ ..' p
to 7~ =ii7
.. Z.
2L HT, I %IT I; 7
TIT T !!
FREtQUNCY -CPFRQE Y-CS
toI IW T' I Ill
it~ ~~~~~~~~~~~1 j 2t 5 umayPoafo nihu:lVh~~~

0%0
4.4
3-6 "00 46.
C4 SC 40~" V.
P. 4; 00 ;jI4S
..-
:34. 0~ 0 L. 10 ,"".- U4 a4 4 - A '4
6j 634.4
$ 01 04 AU4 S'a 'W, 4040
0 . 0 0p * ' 4 4 0 3
S..a S. .930 -4 0
30 0.
to9S 12 4 41
Sj (4 .6 .00 6a. 4 644.0 4.04 44. 0.40414
*E -oi u
4 .444
.1I
On 4* 0C 10 *I. 14
- Q k
440 Z
, 0 0 's I
0 1 04.4 dl 0I
0 4
fu
0- 0 A4 co