ad-754 792 research on molecular lasers george … · ad-754 792 research on molecular lasers...
TRANSCRIPT

AD-754 792
RESEARCH ON MOLECULAR LASERS
George J. Wolga, et al
Cornell University
Prepared for :
Office of Naval Research Advanced Research Projects Agency
30 September 1972
DISTRIBUTED BY:
DOT! National Technical Information Service U. S. DEPARTMENT OF COMMERCE 5285 Port Royal Road, Springfield Va. 22151

DISCLAIMER NOTICE
THIS DOCUMENT IS THE BEST
QUALITY AVAILABLE.
COPY FURNISHED CONTAINED
A SIGNIFICANT NUMBER OF
PAGES WHICH DO NOT
REPRODUCE LEGIBLY.

Q
LABORATORY OF PLASMA STUDIES
.- n D ("
<< JAN 26 19« 11 111 I
I! U LD Lt. -1 :!-..:
Reproduced by
NATIONAL TECHNICAL INFORMATION SERVICE
U S Department of Commerce Springfield VA 22151
C
CORNELL UNIVERSITY ITHACA, NEW YORK
\£

Unclassified S**oinl\ ( l.i^Mfu .itii>n
DOCUMENT CONTROL DATA • K & D •frfurltr . (.IN ^i/ll ..(im ot in/.-. i,.,.h- ../ ..>.sff..i f ,.„ ; »mfc-afci«! .wwmfciWwi MI, .1 w cut »1 •/ «Nu, Mh
I 0***blt<A tlHIi AC1'.;!. /i'up/xT.ifi ,rtlU.<rj
Coi-ncll. University Ithaca, NY 1A850
I •.' 1 OHI TITLt
Study of Molecular Lasers
■•"•'■'" '• yii 1 ■ i/^sMriKii
^a.mi'OHi SLCui.itr CL*:,i,>r ir.A not
Unclassified
NA
4 UCSCRiPTivE NOTES (Tiiir of ro/>ur( .mi/,iiic/iisivf dales)
Annual Report - 1972 V *u IHORI5I fulfil mi..1 , nudtllc initial, lull nut ir)
George J. Wolga
Simon H. Bauer
Ross A. McFarlane
Donald Turcotte
T. A. Cool
0 REPORT DATE
September 30, 1972 IK. CONTRACT OR GRANT NO.
N00014-67-A-0077-0006 *). PROJEC T NO.
d.
la. TOTAL NO. ft-- PASSa
2M. lb. NO. OF REPS
2 »«. ORIGINATOR'S REPORT NUMBERIS)
NA
»h. O'HER REPORT NOISI (Any other numbers Mac may 6* •..*.'n«'i* Irn9 tcportj m
NA 10. DISTRIBUTION STATEMENT
f II. SUPPLC.MENTARV NOTES
,
19. AOSTRACT
12. SPONSORING MILITARY ACTIVITY
Office of Naval Research
Research concerning molecular and chemical lasers was conducted in the following are^s:
1. Measurement of V*V and V-tR,f rates anong hydrogen hallde molecules and the tempera- ture dependence of the energy transfer rates previously determined for HF, DP, HF/CO2 DF/CO2 systems.
2. Studies on rapid subsonic gas mixing with emphasis on turbulence to enhance cap d mixing,
3. Vibratlonal relaxation studies of C02(00el) in the pressure range 1-100 atm. 4. TEA HBr chemical laser studies. 5. EPR study of reaction rates in the NO + F2 dossoclatlve reaction. 6. Chemical laser studies of the i'eactlon of atomic oxygen and acetylene including the
determination of V+V energy transfer proLabilities 7. Studies of the partition of exothermlclty in the CS2-O2 chemical laser system. 8. Experimental study of the relaxation of CO2(020) and HF(v - 1) by collisions with
H and F atoms.
DD.f.rJ473 "'^ " S/N 0101-007-üni1
Unclassified
Si-c-urity Cl.i<;;;i(ir.iti<>n
!
.

RESEARCH ON MOLECULAR LASERS
Annual Report - November 1, 1972
Cornell University
Ithaca, New York 14850
f
D ■ ■ :- ^
! 1
Sponsored by:
: \
■ JAN - i ■•
'-•
Advanced Research Projects Agency
ARPA Order No. 660

-Unclaaalfled, Sicuiily Ctiissiflr.ition
Ktv wontis
Molecular Lasers
Chemical Lasers
Vlbrational Relaxation
Energy Transfer
Rapid Gas Mixing
Chemical Reaction Rates
Vibrational Energy Transfer
DD .FrJ473 ««ACK) S/N OIOI•107-65:1
»lOLI V/T
LINI: n
KOI I. W 1
l IM. (
KOI. I v. I
Unclassified Socutiiy cliKHiflrattnn A-3I40J

INDEX
Report Summary
I. Vlbratlonal Energy Transfer and De-excitation In the HF-HC1, HF-HBr, HF-HI and HF-DF Syatems
II. Rapid Gas Mixing Studies
Laminar Measurements
Turbulent Measurenants
III. Vlbrational Relaxation
A. High Pressure Relaxation in C02(0081)
1. HBr Chemical Laser Studies
B. Vibrational Relaxation and Chemical Reactions
IV. Chemical Laser Studies and Rate Determination
A. EPR Study of the NO + F, Reaction
B. Vibrational Excitation in the CS.-O. Laser Reaction
C. Studies of the O-C.H. Reaction
V. Molecular Relaxation via Atomic Collisions
A. Atomic Relaxation of HF(v - 1)
B. Atomic Relaxation of CO-COnO)
C. Atomic Relaxation of CO.COO0!)
1
20
22
24
32
32
32
33
36
36
50
100
141
141
147
147
/

ANNUAL REPORT
Reporting Period
1 October 1971 - 30 September 1972
1. ARPA Order
2. Program Code Number
3. Name of Contractor
4. Effective Date of Contract
5. Contract Expiration Date
6. Amount of Contract for Current Period
7. Contract Number
8. Principal Investigator
9. Telephone Number
10. Project Scientists
11. Title of Work
660
0173-7-006252
Cornell University
1 October 1968
30 September 1972
$187,500.
N00014-67-A-0077-0006
Prof. G. J. Wolga
(607) 256-3962
Prof. S. H. Bauer (607) 256-4028
Prof. T. A. Cool (607) 256-3512
Prof. R. A. McFarlane (607) 256-4075
Prof. D. L. Turcotte (607) 256-4026
RESEARCH ON MOLECULAR LASERS
Sponsored by
ADVANCED RESEARCH PROJECTS AGENCY
ARPA Order No. 660
The views and conclusions contained in this document are those of the authors and should not be interpreted as necessarily representing the official policies, either expressed or implied, of the Advanced Research Projects Agency or the U. S. Government.

REPORT SUMMARY
During the period 1 October, 1971 - 30 September, 1972, the ongoing
program concentrated on a number of research areas that were felt to be
of significant and basic importance to the successful development of
chemical and molecular laser technology. The principal areas of effort
were: measurement of V -> V and V -»■ R,T rates among hydrogen hallde
molecules and the temperature dependence of the energy transfer rates
previously determined for the HF, DF, HF/C02, DF/CO. systems; studies in
rapid subsonic mixing with emphasis on the use of turbulence to enhance
rapid mixing; vlbrational relaxation studies of C0_(00ol) in the pressure
range 1-100 atra.; TEA HBr chemical laser studies; EPR study of reaction
rates in the NO + F- dissociative reaction; chemical laser studies of
the reaction of atomic oxygp.a and acetylene including the determination
of V-V energy transfer probabilities between CO molecules; studies of
the partition of exothermlcity in the CS--0- chemical laser system;
experimental study of the relaxation of 00,(020) and HF(v - 1) by
collisions with H and F atoms.
In all cases the primary method of study was the execution of
laboratory experiments designed to provide quantitative results followed
by appropriate integration with theory. A detailed statement of results
and state of progress will be found In Sections 1 through 5 of this report.
This research is motivated by the mutual Interest of the sponsor and
contractor in chemical lasers as efficient sources of coherent optical
emission. Emphasis is placed upon the development of new and efficient
lasers operating at welengths not previously available, and upon the
-1-
■
' /

-ii-
basic processes that underlie all molecular lasers. The processes
quantitatively studied included vibrational energy exchange and relaxa-
tion processes, rates of chemical reactions, vibrational distributions
resulting from important chemical laser reactions and rapid gas mixing
processes.

I. "Vlbratlonal Energy Transfer and De-excitation in the HF-HC1. HF-HBr.
HF-HI and HF-DF Systems" (T. A. Cool)
Several reaction schemes employed in present cw HF chemical lasers lead
to the formation of vibrationally excited HF in the presence of HC1, HBr, HI
and DF. We have measured several key rates for energy transfer and deactiva-
tion for such chemical laser systems at temperatures of 300 and 350oK. Tha
large rates for these processes can be attributed to energy transfer to rota-
tion under the influence of strong attractive (hydrogen bonding) intermolecular
forces. The energy transfer processes studied during the past year are given
below and the rate constants are summarized in Table I.
k e
HF(v = 1) + HCl(v - 0) -j* HF(v = 0) + HCl(v = 1) (la) ri2 U HF(v HF(v » 0) + HCl(v = 0) (lb)
k' e
HCl(v = 1) + HF(v.= 0) -»• HCl(v = 0) + HF(v = 1) (2s)
|k21 U HCl(v = 0) + HF(v = 0) (2b)
k
HF(v = 1) + HBr(v - 0) -»■ HF(v = 0) + HBr(v - 1) (3a)
|k12 HF(v = 0) + HBr(v = 0) (3b)
(4a)
(Ab)
HF(v = 1) + HI(v - 0) -► HF(v - 0) + HI(v ■ 1) (5a)
Ike2 U. HF(v - 0) + HI(v = 2)
HBr(v = 1) + HF(v - 0)
k; ♦ HBr(v
L* HBr(v
kel
- 0)
' 0)
+ HF(v
+ HF(v
- 1)
- 0)
lk12 '-♦ HF(v
(5b)
HF(v - 0) + HI(v - 0) (5c)
-1-
• /

-2- i
k i el HI(v = 1) + HF(v = 0) -> HI(v = 0) + HF(v = 1) (6a)
Ik21 «-> HI(v = 0) + HF(v = 0) (6b)
HI(v = 2) + HF(v = 0) -> HI(v = 1) + Hf(v = 1) Ik* |k2l "^ HI(v = 1) + HF(v =
|k42 •-> HI(v = 0) + HF(v ■
^ HI(v = 0) 4
(6c)
0) (6d>
l) ^
riF(v = 0) (6f)
k . e
HF(v = 1) + DF(v = 0) ^ HF(v = 0) + DF(v = 1) (7a)
|k12 ^ IiF(v = 0) + DF(
DF(v = 1) + HF(v = 0) U DF(V = 0) + HF(v =
(V = 0) (7b)
|k21 ^ DF(v = 0) +
(8a)
DF(v = 0) + HF(v = 0) (8b)
It is believed that all of the above processes involve large changes in
rotational quantum number. This is suggested by the large values of the rate
constants despite the generally large vibrational energy defects for the above
processes. Moreover, it is apparent from the data that the k' values are too e
large to be explained unless energy transfer to rotation is important in mini-
mizing the magnitude of the overall internal energy defect. Thus, the above
rates are actually an aggregation of vibration rotation transitions, e.g.,
HX(v = 1, J^ + HY(v = 0, J2) ■*• HX(v = 0, J^) + HY(v - 0, JJ (9)
» t
where, in general, Jj 1* ^ + 1 and J, j» J + 1.
A paper concerning the above work will be presented at a forthcoming ACS
meeting in January; additional work completed during the current contract year
has been published [J. Chem. Phys., 56, 5863-5878 (1972)] and is included in
the Appendix to this report.

-3-
TABLE I: MEASURED RATES
System
HF-HC1
Temperature (0K)
300oK
Rate Constants ,in4 -1 . -I. (10 sec torr )
k + k.. = 2.9 + 0.3 e 12 —
k + k. = 2.15 + 0.3 e zl -
350oK k + k10 = 2.1 + 0.3 e 12 —
k + k0 - 1.55 + 0.1
HF-HBr 300oK k + k.. - 0.8 + 0.1 e 12 —
k + k01 = 1.5 + 0.2
350ok k + k.. = 0.25 + 0.05 e 12 —
k + k,. - 1.1 + 0.2
HF-HI 300oK kel + ke2 + k12 = 0-55 ± -^
kel + k21 - 1-9 i ^
350oK kel + ke2 + k12 " 0•3 - 0'05
kel + k21 ~ l** - 0•2
HF-DF 300oK k + k10 - 13.6 + 0.A e 12 —
k + k.. - 4.7 + 0.3 e zi -■
350oK kQ + ki'> " 9.8 + 0.3 e 12 —
k + k. - 3.4 + 0.4 e 21 —

m primca jrum.
THE JOURNAL OF CHEMICAL PHYSICS VOLUME 56, NUMBER 12 15 JUNE I » J J
Vibrational Energy Transfer and De-excitation in the HF, DF, HF-0O2, and DF-CO, Systems*
RONALD R. SIEPHENSI AND TEKRIIX A. COOL
Departmml of Thermai f n,t>i"-'in, and Lahoratory of Plasma Studies, Cornell Vnhenity, Ithaca, New York 14350
(Received 28 December 1971)
The luer excited tiuor«sen .c method hu been employed to determine the key rite consents for energy transf- r and deactivation prjcesjes in the HF, DF, HF-COj, »nd DF-CO, chemical laser systems at a temperature of JWK. The self-deactivation rale» for HF(»-1) and DF(»-1) molecules by ground state molecule» were found to be kHr-nr = S2S±0.3OXW see-'-ton-1 and *nf DF = 2 0±0.2X10⁴ jec-1- lorr"1, respectively. The mewured rate» of V—V transfer from HF(»-1) and DF(»-1) to the COi(00»l) state were kH, co,- il tv ixiW sec-'-torr"1 and *Df-co,= 17 5i2 ^X H»« sec-'-torr"'. The respective deactivation rate» of COj(00,l) by ground state HF and DF were determined to be *COI-HF = 3 6±0 3X 10« sec-'-torr' and icoi-DP "UMMM lO'sec-'-torr-'. The large rate» for th«e processes can be attributed to energy transfer to rotation under the influence of a sizable attractive (hydrogen bonded) intermolecular potential well and enhanced repulsion at close range.
I. INTRODUCTION
Much progress has been achieve«! recently in the development of continuous-wave (cw) chemical lasers despite a serious lack of understanding of the mechan- isms of those vibrational energy transfer processes which play major roles in chemical laser operation.1-* Present HF and DF cw chemical lasers have operated under conditions of partial inveision because the rate of redistribution of vibrational energy exceeds the com- bined rate at which gas mixing and chemical reaction proceed. Under such conditions the antecedent excita- tion process to stimulated emi«-' " fc a given mole- cule is more likely to b' vibrational t. ergy transfer than direct specific excita 'on by chemical reaction. In the DF-CO, and HF CO, "transfer"« chemical lasers, vibrational energy transfer provides a means for the nonthermal energy release of chemical reaction to be eftictively utiii/u-d as laser output from loUlly in- verted CO,.7
Prior to the completion of the present work, reliable data were avail.ible for the self-dcaclivation of HF as reported by Airey and Fried,' and more recently by Solomon et al* and Bott and Cohen.10 No data were available, however, concerning the rate of vibrational deactivation of DF or the rates for the important processes by which vibrational energy is transferred from HF and DF to the CO^OO0!) upper laser level. Moreover, the rates for the vibrational deactivation of CO^OO0!) molecules by collisions with HF and DF molecules were unknown although the results of con- current rate measurements are now available."
We have used the laser excited fluorescence method" to determine the rate constants for these key processes al 350oK, a typical temperature for chemical laser operation. The experimental results for HF and DF vibrational deactivation exhibit good qualitative agree- ment with the vibration-rotation theory of Shin, when the effects of strong attractive interactions are con- sidcred.,,»"b
5863
The rates of vibrational energy transfer from HF and P \o CO» are too large to be accounted for with presen. «pproximate theories. Interpretation of the results presented here suggests that the magnitude of these rates may be explained in terms of a hydrogen bonded attractive intermolecular potential well for HF-COj and DF-COj collision pairs which leads to enhanced repulsion at close ranges. A successful theory must necessarily allow a major portion of the difference in vibrational energy between initial and final states to be taken up as rotational motion of the collision partners.
The previously measured rate of vibration to vibra- tion (F-»K) transfer between D,(r= 1) and CO^OO»!) states" is shown to be satisfactorily described when the vibrational energy resonance defect is converted into rotational motion of D» under the interaction of the quadrupole moment of deuterium and the asymmetric- stietching transition dipole moment of CO,.
Deactivation rates for the CO^OO"!) vibrational stale by HF and DF arc fast and appear to exhibit the efTects of a strong attractive interaction and vibia- t:on-rolation energy tran ier.
II. EXPERIMENTAL APPARATUS AND TECHNIQUES
A. Laser Source and Absorption Cell
The small scale transverse flow cw chemical laser and the heated absorption cell used for the present measure- ments have been described elsewhere." Laser operation was based upon the continuous mixing of F atoms and F, with H, and D,.1' The chopper modulated output of this device consisted of triangular pulses of 4 jisec FWHM with a repetition frequency that was variable between 400 and 2500 Hz. The total pulse energy was typically 4 MJ; 50% of the pulse energy was present in the 1—»0 band transitions. The standard deviation in pulse height was less than 5%; the cw laser output was
'

-5-
58W STEPHENS AND T COOL
r-»■ Diffusion Pump -"
-Argon
-(& - -^ -Air
»- Pump Fic. I. Schematic diaRram of ga? handling apparatus.
stable lo 1 part in 20 in the 2 min intervals during which fluorescence data were recorded.
A fixed cell temperature of J50±2oK was chosen for all of the work reported here. At the partial pressures of IIF and DF used (0.05 to 1.0 torr) the dimer con- centrations in HF and DF are less than S ppm in equilibrium at this temperature.16 The cell temperature was monitored with a stainless steel jacketed thermo- couple placed in direct contact with the gas within the absorption cell. The thermocouple junction was located near the center of the detector field of view about 2.5 mm outside of the path of the laser beam and about 1 mm away from the nearest wall surface.
Cell pressures were measured with a 0-10 torr MKS capacitance manometer which was accurate to within 0.1%. The calibration of the manometer electronics package supplied by the manufacturer was confirmed with a digital voltmeter capable of an accuracy of 1 part in 10s. The total cell pressure was always greater than 10 torr to prevent excessive diffusion of vibra- tionally excited species to the cell walls.
The gas sample was mixed and preheated before entering the heated cell. This was accomplished by injecting room temperature HF (DF) and CO» through needle valves into a heated argon flow. The combined flow passed along aim length of heated stainless steel tube of 4 mm bore with a mean residence time exceeding 1.5 sec to provide adequate mixing and equilibration before entering the cell. The heated cell was designed to provide a laminar flow without rccirculation or separation in the cell region within the detector field of view. Typical gas flow rales through the cell were 0.020 mM/sec. A mean residence time within the cell was 0.2 sec. Mean cell flow velocities were 20 cm/sec.
These flcv rales were sufficient to minimize the effects of surface reactions in causing adsorption or contamin- ation of the HF or DF gas samples at the cell pressures and temperatures employed in these studies. The flow velocities were low enough, however, to avoid con- vective effects which would lead to an apparent shorten- ing of the fluorescence lifetime because of the sweeping of excited molecules outside of the detector field of view.
The field of view of the detector included a sample region extending approximately 2 cm along the laser optical axis from the beam entrance window (most of the signal originated from the region nearest the entrance window). Narrow band interference filters were placed between the detector and cell to eliminate the scattered P-branch HF or DF laser radiation. Fillers for DF with ■ peak transmission of 60% for a pass band located between the 1% transmission limits of 3.228 and 3.423 microns were used; for HF, filters with a peak transmission of 75% at 2.47 n and 1% transmission limits at 2.27 and 2.64 microns were used. These filler.-, passed mo^l of the fluorescence on the R branches for the (r= l-*0) HF and DF bands. Fluorescence from the COJOWI) level was sampled through fillers with 75% peak transmission at 4.3 M
and a FWHM of 0.4 p. The absorbed laser pulse energies were about three
orders of magnitude below the values reported by other investigators in single pulse experiments.817 The frac- tion of HF (DF) molecules excited did not exceed 0.01 and thus no special precautions were necessary to prevent excessive sample heating or excitation of the second vibralional level of HF (DF) by the laser pulses.
B. Gas Handling and Impurities
The present gas handling system shown schematically in Fig. 1 was similar to thai employed by Airey and Fried.' Those portions of the system exposed to HF were of stainless steel (except the aluminum absorption cell) and were carefully passivaled to insure repro- ducible results. The absorption cell and HF handling system were exposed to 100 torr of HF for 24 h. The distillation cylinders (C, and C) were additionally exposed to 900 torr of HF for one week. The entire system (including argon and COj handling portions) was pumped down to well below lO-3 torr and baked out at QO'C for several days. After this the leak rate at room temperature foi the entire system of 1.5 liter volume was not detectable (less than lO"' torr/h). A leak rate of 5X10-» torr/h was measured for the 0.1 liter volume absorption cell and connecting lines.
The absorption cell and connecting lines were then brought up to the operating temperature of 350°K and a flow of 10 torr argon and 1 torr of HF was maintained for several hours. This resulted in an increased out- gassing rate which stabilized at a value of about 0.01 torr/min. No further significant change from this out-

-6-
ENERGY TRANSFER IX HF, DP, HF-CO,, AND DF-CO, 5865
gassing rate waa observed in the entire series of experi- ments on HF. When all HF data were recorded, the system was prepared again according to the above procedures before any DF data were taken; similar leak/outgassing rates were measured for DF.
The major impurities (in parts per million) cf the gases used in this study were as follows: argon: Mathe- son UHP (02<2, NK4, C0,<1, H20<3); COs: Air Products Research Grade (Oj+N^lO, rO<10, CH4=!.i. H^)<1.5); HF: Air Products CP Grade, typical analysis (H-SiF.^O, SO2 = 40, H2=300); DF: Matheson CP grade, typical analysis (98% min- imum purity, HF<2%), The HF and DF as actually supplied contained about 20% H2 and D2, respectively.
Additional purification of gases was accomplished as follows. A dry-ice cold trap (see Fig. 1) was employed in the argon flow to minimize the water vapor impurity. The HF and DF were purified to remove H2 (D2) and HjO (D20) according to the method of Airey and Fried.8 With this procedure a 5 liter sample of HF(DF) gas was admitted to the distillation cylinder (d of Fig. 1) and was solidified at 770K. Gaseous H2 (D2) was then removed by pumping the distillation cylinder to below 0.010 torr. The cylinder was then allowed to warm to 1950K and a trap to trap distillation between cylinder C| and 1 second cylinder C« cooled to 770K was performed at least twice before data were taken. In each stage of the distillation the last 5% of the original sample was discarded; the empty cylinder was baked out under vacuum at 90oC for 24 h before the next distillation. No detectable difference was ob- served between fluorescence trices taken after six dist Hations and those taken after two distillations.
Tie procedure used for establishing a given absorp- tion cell gas compo.siiion w;is U follows. First the argon flow rate w.->s set to give the desired argon cell pressure (usually 10 ton) as indicated by the capacitance manometer M. Under these condition« choked flow existed through both valves V2 and Vj; the pressure ratio across these valves always exceeded 10:1 and 15:1, respectively. The manometer was then balanced by opening valve Vi to admit a reference air flow and by adjustment of Vi until the null position for the manometer diaphragm was established. This balance wa« stable to within ab 10p during the 3-4 min period of a typical run. Absolute argon pressures were obtained to within 1% with pressure gauge G (Wallace and Tiernan, 0-20, or O-100 torr) after corrections for any capacitance manometer imbalance were made.
A given partial pressure of COj was then established within the cell when V4 was opened and adjusted to give the desired pressure increase as indicated by the manometer M. In a similar fashion a desired pressure of HF (DF) was finally admitted by means of valve V5. The flows through valves Vt and V5 wore always choked. The partial pressure of CO) could be maintained to within ±10^ at the lower ran^e of
hHF(».|)
i.T,
? coi,{io*u
17 cOjCon)
HflyQ) OFfv-O)
CtyOO*!)
CO^KTO) C(£(02T)|(43,«
ceyexm
Fie. 2. Vibrational energy level diagram which illustrates the laser excited fluorescence transitions in HF, DF, and CO».
pressures employed or ±2% at the higher pressures used. For HF(DF) the corresponding accuracies of partial pressure settings were ±20/i or ±5%.
After the run, valves V4 and V» were turned off separately and the pressure changes indicated by the manometer were recorded. These values were in agree- ment with the initially recorded pressures to the ac- curacies stated above; an average of the initial and final values was usually used in data reduction. The sum of HF(DF) and CC)2 partial pressures was monitored with the capacitance manometer throughout the run. Occasionally a drift in pressure would occur during a run which was clearly outside the above stated error limits; such runs were terminated and the fluorescence rJata discarded.
C. Instrumentation for Fluorescence Detection
The electronics instrumentation employed for this work has already been described.14 The ouput of the indium antimonide PV detector was amplified and used to drive either a P.A.R. Model CW-1 boxcar integrator, or Model TDH-9 waveform eductor. The time bases for both inslruments were determined to within 0.5^,' with a 100 kHz crystal calibrator. The scanning circuit-, of the boxcar integrator/waveform eductor were triggered by a phototransistor synchronized to the laser pulse. The time origin for the fluorescence traces coincided with the neak of the laser pulse and could be determined to within ±0.5 jisec.
Each fluorescence trace represented the average of as many as 300 000 separate events. Before signal averag- ing, the signal to noise (S/N) ratios ranged from a high of 3/1 for C02 fluorescence from the DF-C02 system to about 1/30 for DF fluorescence from the DF and DF-COo systems. All of the HF data n.id most of the DF data were taken with the boxcar integrator, which provided an improvement in the S/X ratio by factors ranging from 30 to 80. The weaker DF fluorescence from the DF and DF-C02 sys' -ms (owing to the rela- tively long spontaneous emission lifetime of DF com- pared with both HF and C02)
1S usually required use of the waveform eductor which gave an improvement in S/N ratio by a factor exceeding 350. After signal

-7-
5866 STKPHENS AND T. A. COOL
averaging, the S/'X ratio of these data generally ranged f.om 10/1 to 100/1.
During the 2 min time period of a typical run, the base line of the fluorescence trace was usually constant to within 3%; all data which exhibited base line shifts of more than 5% were discarded. The observation that data taken with the waveform eductor were in excel- lent agreement with those data taken with the boxcar integrator confirmed that the stability of the laser output during a given run was adequate for the present measurements.
UI. EXPERIMENTAL RESULTS
A. Vibrational Energy Transfer Processes
The processes of importance in describing the present measurements of vibrational relaxation in DF and mixtures of DF and COa are the following (refer to the energy level diagram of Fig. 2):
vibration to rotation {V-+R) energy transfer in DF:
h* DF(e-l,/i')+DF(»-0,/I')-»I>F(»-0)/i)
+DF(r=0)72) + A^=2907cm-1 (1)
(where AE is the vibrational energy difTcrcnce between initial and final states);
vibration to vibration (F—>V) transfer between DF and CO»:
*, DF(i= l)7')+CO2(0000) f^ DF(i>=017)+COs(0a'l)
*.' +A£=558cm-'; (2)
dc-excitalion of the upper CO2 laser level by DF through n.tramolecular vibrational energy transfer in COj and energy transfer to rotation in DF:
CO»(000l)+DF(»=0,y')— CO2(n«'0)
+DF(t=0)y);
intramolecular energy transfer in COj:
(3)
(4) C0|(W1)+M -* COs(»»m'0),+M
(where the species M is either CO2 or argon, with the respective rate constants *ioe and ku,0);
vibration to translation {V—*T) dcactivation of DF by argon (V—*T deactivation of DF and HF by COj is assumed negligible under the conditions of the present experiments.):
kba'
DF(r= 1)+Ar -♦ DF(t;=0)+Ar; (5)
fluorescence from the DF(ii=l-»0) fundamental band
»v, DF(i.= l)->DF(r=0)+A^,Ay-±l) (6)
and fluorescence from the CO1.[(000l)-*(00n0)]4..V band
CCMOO0!) — aMWOH/w», A7= ±1. (7)
In Processes (l)-(3) only certain assignments of the rotational quantum numbers will not require a large energy transfer to translational motion. For present purposes we will consider the above rate constants as total rates summed over all rotational quantum number combinations which provide an appreciable conliibution. It is assumed that equilibrium exists for rotational states within a given vibrational level.
It has been proposed7 that the coupling of vibrational energy between HF(y= 1) and CXMOO"!) levels may involve the participation of an intermediate CO2 state in contrast to the direct coupling of Process (2) indicated for the DF-CO2 system by the present ex- perimental results." Therefore, in the HF-COj case one must consider both the direct (oupling processes
*. HF(i = l,7') + CO2(00"0)-»HF(i'=0,7)
+ CO2(0O0l)+^=1609 011-' (2)
and the alternate processes
km HF(t.= l)+CO2(0{y0) ^ HF(j;=0)+CO2(10«'l)
+A£=242cm-1 (2') or
HF(r= D+CCMOCO) ^ HF(i)=0)+COj(02»l) ku
+A£=349cm-1 (2') and
kn CO!!(lÜn) + CO2(00l,0) -»CO2(10(,0)+CO2(00l'l)
+A£=-21cm-1 (2") or
^21
CO2(02nl)+COJ(00(,0) -♦ CO2(0200)+CO,(00l,l)
4-A£--26cm-'. (2")
Processes analogous to those of Eqs. (1) and (3)-(7) also apply to the HF and HF-CO- systems. For the HF-CO2 system we must consider the additional fluorescences of the "hot" bands"
CO2C(10fll), ((anHOW», (02«0)]I.n+K
A/=±l. (8)
Processes (8) present a major experimental difficulty in the determination of which of the coupling mechan- isms (2) or (2') and (2") gives rise to the observed f L-rescence in the 4.3^ region. Recent high resolution absorption measurements'0 indicate that the matrix elements for these bands a.e at least as large as that
/

-8-
I..V-
(7)
the irge lent 5 as :iim ible for
ml nay CO. (2) ex-
:;isc iscs
(i)
n
-,')
i")
n 17) the Pal
S)
'in
sit
ENERGY TRANS1ER IN HF, DF. HF-CO,, AND DF-CO,
for the CO3[(0Ü0l)-+(00ü0)] band of Process (7). Thus, since fluorescence from the bands associated with both Processes (7) and (8; would lie within the 7; pass band of the 4.3/x interference filter used here, we * have no means in the present experiments to distinguish T; between the alternate coupling mechanisms. „*
5867
B. Self-Deactivation of HF and DF
1. Vibralional Deaclivalion oj DF{v=\) by DF{v=0)
Fluorescence from the fundamental v= 1—»0 band of DF was observed from mixtures of DF with argon. The intensity of this fluoiescenc was proportional to the
'\
\
H ■h
100 200 300 Time, iju sec)
400
100 300 400
Time, (M sec)
FIG. 3. A: Decay of DF(r=l)-*DF(»=0) fluorescence from the mixture: DF = 0.305 torr, argon = 9.97 torr, at 3490K. B: Semilogarithmic graph of a smooth curve fitted to the data of Fig. 3A.
DF(i;= 1) concentration given by the expression
CDF(i.= l)]/[DF]o=exp(-//r)) (9)
where [DF]o is the initial DF("/= 1) population pro- duced by absorption from the D F laser pulse, and
ipT)~1*km-tvXav+hor-AfXA,+ iprn)-*. (10)
Here p is the total pressure of the gas mixture; r h the relaxation time, T,, is the total radiative lifetime cf the »" 1 state of DF,S and Xm and XA, are the respective mole fractions of DF and argon.
Figure 3A shows a typical DF fluorescence trace; such DF relaxation data always exhibited a single exponential time constant m is illustrated for the data of Fig. 3A Ly the semilogarithmic plot of Fig. 3B.
— r.o
t- 0,5 a.
r 1 1 r
• ■ 10 lorr o>90n
i i i '
O» 100 lorr orgon A -
.. *- ^Sm •
•.
• ^ ■
*^r
e£—± 1 1_ 1_ I . i 006 Olj
Fio. 4. Observed DF fluorescence deca\- rates for DF-argon mixtures at 3S00K as a function of DF mole fraction.
Figure 4 contains ill of the fluorescence decay data taken for mixtures of DF and argon. Here values of (^T)
-1 obtained from the slopes of semilogarithmic
plots of the data for each run are plotted against the mole fraction of DF in the conventional manner. Most of the data were taken for an argon partial pressure of 10 torr; however, a few points were taken at an argon pressure of 100 torr to establish the location of the intercept of the data with the ordinate. Since the intercept of Fig. 4 is at the origin within experime.-lal uncertainty," the neglect of the last two terms of Eq. (10) is justifiable in agreement with analogous findings from other studies of hydrogen halides.8"« The DF partial pressures of Fig. 4 range from 0.05 torr to 1.05 torr. This range was selected because fluorescence
X
'/VX'Wv
10 2030405060708090 Time. Oi sec)
40 50 60 Time, (iistc)
Fic. 5. A: Decay of HF(v-I)-.HF(i=0) fluorescence from the mixture: HF-0.465 torr, argon-9.75 torr, at 351°K. B: Semilogarithmic graph of a smooth curve fitted to the data of Fig. 5.\.

-9-
5868 R . ST E P H E N S A N D T CO 0 1.
• « 10 to'f Qfqon
O • 100 lorr attjon
Vic. 6. Observed HF fluoresrenre decay rates for HI'-argon mixtures at 350°K as a (unttion of HF mole fraction.
signals were significantly weaker at iiigher and lower pressures. In addition, at somewhat higher pressures the accuracy of measurement would be limited by the time response of our apparatus; at lower pressures the partial pressure determination? would be less certain. The data of Fig. 4 give ^=/!;DF-DF=2.0±0.2X10
4
sec" '•tonr' at .150°K.
2. jribralional Deaclhalion of IIF{v= 1) by nF[v-())
Fluorescence from the 2.7ß v— 1—+0 band of HF was observed and analyzed for mixtures of HF with argon in a manner similar to that discussed for DF. Single exponential decays such as shown in Figs. 5A and SB were observed for all data. Figure 6 shows the relaxation times for all of the HF fluorescence data as a function of the mole fraction of HF. The smaller scatter of these data compared to those of Fig. 4 probably reflects the shorter radiative lifetime of HF18 which affords a better Cuorescencc S/X ratio than was achieved for DF (compare Figs. 3A and 5A). Most of the data were taken at a 10 torr argon pressure with HF partial pressures ranging from 0.05 to 1.06 torr; a few ad- ditional traces were recorded for 100 lorr of argon and HF pressures from 0.10 to 0.35 torr to confirm the negligible effect of Process (5) compared with Process (1) as was demonstrated for DF with Fig. 4." The slopp of the linear fit to the data of Fig. 6 gives the self■ dcictivation rate of HF as ÄI1I.=*HF-HF = 5.25± .30X10* sec-'-ton-1 at 350oK. Our rate constant is about 44% below the deactivation rate for HF previ ously measured by Airey and Fried.8 Since the gas handling and purification procedures followed by the two groups were virtually identical, it is difficult to account for this discrepancy which is somewhat outside our assigned error limits.
C. Measurements of Vibrational Energy T.ansfer in the HF-COs and DF-COj Systei is
/. Energy Transfer in DF-COt Mixtures
Fluorescence was obseived from mixtures of DF and CO» in argon on both the (»= 1—>0) band of DF and
from the 4.3^ (OCl-^OCW) band of CO:. It was thus possible to monitor the concentrations of both the DF(j)=l) and CO2(00,,l) molecules following the DF laser pulse. The lime dependence of these concentra- tions is given by the solutions of the rate equations corresponding to the processes of Eqs. (l)-(7). The solutions are given by the sum of two exponential terms":
[DF(t.= l)]/[DFjo=[(,\1-a1)/(XI-,\2)]
Xexp(--X20+C(oi-XJ)/(X1---X2)]e\p(--X10, (11)
[C02(00«l)]/[DF]o=C(X1-aI)(ai-X2)/A1(X1-X2)]
X[e.xp(-X20-e.xp(-X10], (12)
where ai//'=^a-Yr.F+^Arco2+^AVAr+(/'T,1)-1, and
bi/p*'k,'Xo,, and
where
and 'h/p - MTcoi
loaii' (13)
V^=(^'+*io)A'nF+*ioe^co1+*1o',XAr+(/>r„)-'.
In Eq. (13) the square root term is always positive and Xi corresponds to the + sign. It can readily be seen that Xi and X2 are positive; XI>öI and X2<a1.
12
The rate constant k, for the transfer of vibrational energy from DF to CO2 by Process (2) can be de- termined most easily from observations of DF(ti- 1) fluorescence under conditions of small concentrations of DF. In the limiting case when the concentration of DF is sufficiently small, Eq. (11) reduces to the simp' form of Eq. (9), where now the relaxation lime is given by the expression
ipT)-i = kbaXuF+kJCmi+kbaaXAt+{prri)-K (14)
Only the first two terms on the rhs of (14) are needed to interpret the data since, as before, the last two terms are of negligible magnitude (thus, in the discussion of the DF-COj and HF-COj systems, the reference
I.S -
1 1
A./p •
I T
^
10 - \.
■
Oft .> s'
0 JJ- 0
_ J.... .1 rr.." ~\—1- -v.— 02 04 , OS
Xco. OS 10
I-'io. 7. Observed DK fluorescence decay rstes for Dt'-Cd- argon mixtures at 350'K. at a function of the reductd mole fraciion of CO,; -Yco.'-AWfA'Dr+Jfco,).

-10-
EKERGY TRANSFER IN HF, DF, HF-CO,, AND DF-CO, 5869
pressure p is the sum of only the COj and DF (HF) partial pressures). Figure 7 shows relaxation rate data (solid points) for various values of Xcoi's(^co,)/ (XDF+XCO.) ranging from 0.46 to 0.84 (the open data points and the dashed lines of Fig. 7 are discussed at the end of this section). These data exhibited a well de- fined single exponential behavior and (^T)
l values were obtained from semi logarithmic plots in a manner similar to that discussed in connection with Figs. 3A and 3B. Extrapolation of these data with the solid line of Fig. 7 to the value Xco,'^ 1 vie ds a value for the rate constant for V-+V transfer from DF(v=l) to CO|{00»1) of *i=1.75±0.25X10⁵ sec-'-torr1. [The solid line of Fig, 7 is not simply a reasonable fit to the data shown, but a'so has a slope constrained by the values of k,' and kio as will become apparent after some further discussion.]
Equation (12) describes the rise and subsequent decay of CCMOO0!) concentration. The rate constant ky, for the de-excitation of CCMOO0!) by DF(* = 0) was measured from examination of CCMOO0!) fluor- escence for times sufficiently long aftei tV initiating laser pulse that the decay of CCMOO0!) population could be accurately described by the single exponential term exp(-X20 appearing in Eq. (12). That is, when exp(-X50»exp(-M), then {rf-^^/p. When X,
o
100 200 300 400 Time, (xsec)
-i_ _i 500 600
o
T
B
0 JL_ _1-
100 200 300 400 500
Tim«,
Fio. 8. A: Decay of CO^OÖ1!) —((WO)] fluorescence during the latter stages of relaxation for the mixiure: Dl-0.340 torr, CO2-0.720 torr, argon = 9.91 torr, at 351°K. B: Semiloganthmic graph of a smooth curve fitt«! to the data of Fig. 8A.
Fio 9. ObservcJ CO» fluorescence decay rates for the latter stages of relp-xation for DF-COi-argon mixture» »« 35() * ■• • function of the reduced mole fraction of DF; XDF -ADF/(A nr-|- Xcot)-
was computed with the Eqs. (13), the terms *»,• and (^r,,)-1 were again dropped; the term kuf has a small value*3 of 50 sec-'-torr-1 and was also neglected; the value of Tri is long enough18 that the last term appearing in the expression for ftj can usually be neglected with- out appreciable error.24
A representative CCMOO0!) fluorescence trace (Fig. 8A) was used to construct Fig. 8B, which illustrates the linear time dependence of the logarithm of fluorescence intensity observed for all DF-CO, mixtures during the latter stages of relaxation. Figure 9 shows the observed dependence of (pr)-* values determined from such plots upon the ratio XDF', where XDF'**{XDF)/ {XDF+XCO,), for all of the CO2 fluorescence data The cell compositions were systematically chosen to cover the partial pressure ranges for DF from 0.05 to 1.0 torr, for CO« from 0.05 to 10.0 torr, and for argon from 10 to 20 torr.
The value for the rate constant kw may be deduced from the data of Fig. 9. In Eqs. (13) the rateronstanl *,„' is known to be 335 sec-'-torr-' at 350°^; the values of ft*, and ke have been given above. Detailed balancing provides the relalionship k.'=-k, c.\p(- 55S hc/kT); where, as has been stated, *. and k,' are over-all rate constants (summed on J and /') and rotational equilibrium at the temperature T is assumed. Use of these rate constants and the relationship, (pT)~1=^t/p, for three different assumed values for *io leads to the curves shown with the data of Fig. 9. The solid curve has been drawn for the value *io= 1.9X 10⁴ sec-'-torr1. The upper and lower dashed curves are for Aio= 2.3X10* sec-'-torr' and 1.5X10» sec-'-torr', respectively; these curves represent reasonable upper and lower bounds on itio when the data of Fig. 9 and the error limits on *„ k,', k*,, and *»' are considered. Thus, we find the value for the rate of de-excitation of the upper laser level of CO» by DF to be fc»-IJ^MKIO* sec-'-torr' at 3509K.
The foregoing determination of the rate constants kia, kt, ant km for the processes of Eqs. (l)-(3) has been facilitated by the examination of certain ex-

-11-
5870 K . I< . S T E P H E N S AND T . A . COOL
100
Q
150 200 250
Time, VlO. 10. Semilogarithmic graph of the 1)1' llunresceuce relaxa-
tion for the mixture: DI'-O.SIO torr, C(Jj = 0.110 torr, argon- 9.72 torr. The fluorescence is resolvable into the sum of two exponential decay terms. The slow decay time (T=108 HSCC) is determined from a straight line fit to the data of the latter s'.ages of relaxation. The difference lietween this line and the DF iliorcs- cence observed early in the relaxation yields a second st aight line with a decay time r- 28.8 pscc.
perimental conditions for which the fluorescence signals may be represented as single exponential decays. It is appropriate to now verify that the use of the rate constant values thus determined docs in fact pernit an accurate description of the observed fluorescence traces throughout the entire accessible range of experimental parameters. Figure 10 shows a semilogarithmic plot of DF(»= 1) fluorescence data from a trace taken for the composition: DF: 0.51 torr, COj: 0.11 torr, and argon: 9.72 torr. Here a double exponential behavior is clearly resolvable. From Fig. 10 we measure directly the values: \i/p~ 5.6X10* sec-'-torr"' and X,/^=1.SX 104 sec",<torr'. These values may be compared with calculated values based upon the measured rate constants and Eq. (13) of Xi/^«= 6.2X 10« sec-'-torr-1
and \t/P= I.ÖXIO4 sec"'•tori-'. A further illustration of the good agreement between
experimental fluorescence traces and calculated fluor- escence behavior is given in Figs. 11 A, 11B. and 11C. These traces were all taken for essentially the same gas composition. In order to adequately resolve both early and late time behavior of the CO» fluorescence. Figs. 11A and 11B were taken for identical conditions but were recorded with differing time bases. Figure 11C gives the corresponding DF fluorescence decay. The curves shown with the data were calculated f'om Eqs. (11)-(13) with the rate constants quoted above and were normalized to the experimental traces. Not all of the fluorescence traces showed the excellent
agreement with calculations illustrated in Fig». 11A- 11C; however, in every case the agreement was within the uncertainty associated with the data point scatter of Figs. 4, 7, and 9.
In concluding this section, we must confirm the validity of the extrapolation made in Fig. 7 in the de- termination of the rate constant k, from DF fluor- escence data. The extrapolation was based on the fact that single exponential behavior was observed for the solid points of Fig. 7, and upon the observation that as Xcot tends toward unity (XDT'-*0) the rhs of Eq. (11) approaches the single term: exp(—ajf). We are now in a position to show that the solid line of P"ig. 7 is correctly drawn within narrow limits. Since the solid data points of Fig. 7 represent single ex- ponential decays, these (^T)-1 values must correspond to either h/p or h/p of Eqs. (11) and (12). The upper and lower dashed lines of Fig. 7 show the re- spective variations with ..V<;<1,' of the values of h/p and Xz/p calculated from our rate constant values and Eq. (13). The right-hand portion of the upper dashed line coincides with the solid curve drawn to determine k,. A direct comparison v'th experiment is provided
300 100 200 T(me, Cusec)
400 500
Colcuiaied
10 20 30 40 50 60 Time, (/itec)
^ ^5 &>
FIG. 11. Observed and calculated DF and COi fluorescence iroro a DF-COi-argon mi.-ture at 350*K. A: COi fluorescence on a long time scale for the mixture: DF-0.290 torr, Cut» 0.105 torr, argon-19.7 torr. B: COi fluorescence on a short time scale for the tame enditions as in A). C: DF fluorescence for the mixture: DF-0.305 toir, CO,-0.loS torr, argon-20.0 torr.

-12-
ENERGY TRANSFER IN HF, DE, HE-CO,, ANT DE-CO, 5871
from two DP' fluorescence traces which exhibited clear1 y resolvable double exponential behavior. The two pairs of open data points of Fig. 7 give the \i/p and \i/p values obtained from these traces in the manner illustrated in Fig. 10 (which was drawn from one of the two DF traces). The upper two data points are in agreement with both the calculated \i/p curve and the other DF fluorescence data (solid points); the lower two points show good agreement with the calculated \tlp curve and hence also with the COj fluorescence data of Fig. 9 (the solid curve of Fig. 9 is the \i/p curve of Fig. 7). We note further that the open data points serve to confirm the Xcot=Q in- tercepts of the calculated dashed curves rather well. That is, in the limit as Xco.^O the value, of \i/p and "Kt/p are the quantities k.'+kv, and kb,, respectively; here again the data are consistent with the rate con- stant values.
2. Energy Transfer in HF-COt Mixtures
Rate equations for the processes of Eqs. (l)-(8) were solved26 to provide expressions for the temporal variations in HF(r=l) and CXMOO0!) populations. In contrast to the DF-COz case where only the direct coupling model (DCM) was considered, an inter- mediate state model (ISM) with the alternate coupling scheme of Eqs. (2') and (2") was considered in ad- dition to the DCM for the HF-CO» case. Though the detailed expressions are too lengthy to be usefully in- cluded here, one may apprehend that because the Processes (2") are quite fast (less than 50 collisions)87
compared to the measured rate of coupling from HF(i'=l) to CO^OO11!) states (about 200 collisions), the temporal variations of the HF(D= 1) and CXVOCl) populations difur little from thos' predicted by the DCM expressions (11) and (12) of the last section. More precisely, this is true if the inequalities k*j,+ ^2O»^'M :|rid k-n [-lciu'»kt,2 ure r-itisfieil, where h;, kv,, and kn have been defined in Eqs. (2') and (2") and *2o and k^ arc total rate constants for deactivation of the intermediate CO2(100l) or CO,(0201) states by ground stale HF and CO», respectively. The second of these inequalities probably holds, as stated above; however, it is not certain that the tirst inequality is satisfied since ^o is unknown (^o cannot be much larger than 1^ since the HF-COj laser i: known to be capable of reasonably tfiicient performance").
Over a very small range of experimental parameters, i.e., when .XVO2«.VHI-, there are differences in the initial increases of COj(00ol) population predicted by the two models, as Fig. 12 illustrates. Two theo- rcticil curves arc given in Fig. 12 which are solutions to the rate equations for the DCM and ISM assump- tions, respectively; the curves have been calculated with the measured rate constants of this section. A small correction for the finite width of the laser pulse has been accounted for by the introduction of a source
10 20
Time, (>is<c)
Eio. 12. Calculated initial rise in the COi(OO'l) population (at low CO, concentration) for two different HF-CO, coupling mechanisms (see text) compared with observed CO, fluorescence at SSCK from the mixture: Ht =-0.630 torr, CO,-0.050 torr, and argon =-10.0 torr. Calculated curves have been normalized to the peak fluorescence; the temporal profile of the laser excita- tion pulse is also shown.
term into the rate equations having a time profile similar to that shown in Fig. 12. In the absence of better information we have assumed *2o=*io and *2oe = £io'. The rate constant for Process (2") was taken to be k*\= 10* sec_l-torr-1 which corresponds to about 10 collisions. The rise in fluorescence intensity- predicted with the ISM exhibits a significant lag with respect to both the variation predicted with the DCM and the experimental fluorescence tra:e. The fact that the experimental data and the prediction based on the DCM are in excellent agreement does not imply that the ISM is invalid since we must account for the potential existence of fluorescence fr .m the CO»(10nl) or CO2(020l) stales superimposed upon that detected from the CO^OO0!) state. Because the strengths of the "hot" bands at 4.3 ß [Eq. (8)] are comparable to that of the fundamental COj^OCO-^OCO)] band, no measurable diflcrences in the temporal variations of the aggregate 4.3 ß fluorescences are predicted by the two models under the present experimental conditions. Thus until an experiment is performed with enough fluorescence intensity to permit the resolution of rota- tional components of the CO:[(OO,)1)-»(O0)O)] band and the identification of the fluorescence (if any) from intermediate states, an unfortunate ambiguity must remain in the V—*V coupling mechanism between HF and CO*. (See "Second Note Added in Proof" at end of paper.)
The fluorescence data for the HF-COi system are adequately descrioed by the equations:
[HF(t= l)]/[HF](,= cxp(-<i10, (IT)
[CO1*]/[HF]c)-[aj/(«l-67)Xexp(-*.../)-exp(.i10]1
where (12')

-13-
5872 R. R. STEPHENS AND T. A. COOL
i i i i 1 i i i r
0.2 0 4 06 1.0
Fic. 13. Observed UK fluorescence decay rates for HI"-COj-Ar mixtures at 350CK as a funclion of the reduced mole fraction of CO»; Xcot^Xcoi/Wnr+Xcoi)-
and
h/P - k»X«t I *»•*«>,+ftw-^A» I • {prn)"». (»')
Here ft* is interpreted as the rate constant k, with the DCM, or as the rate constant ä-W with the ISM its- sumption. These equations are consistent with the neglect of k,' compared with k, (or the DCM, and also apply for the ISM as a consequence of the foregoing considerations. COj* denotes those states which g.ve rise to fluorescence within the pass band of the CO» filters. Since it is expected that itji»*«, then sufficiently late in the fluorescence decay period CO»* will represent only the CO»(00»1) state with either the ISM or DCM assumptions. 1 his circumstance permits the determin- ation of the rate constant ku.
The procedure for rate constant determination from the fluorescence data for the HF-COj system was similar to that already discussed for the DF-COj case. The HF(»= 1) fluorescence from HF-COi mixtures always exhibited a single exponential decay. Relaxation times for these data are given in Fig. 13 as a function of the quantity XCC,'={XCO,)/{XHF+ Xcot). Gas compositions consisted of 10 torr argon with selected partial pressures for HF and CO« in the respective ranges from 0.04 to 0.41 torr and 0.04 to 1.30 torr. The solid line fit to these data (Fig. 13) gives a value for the Xco,'= 1 intercept of (pr)'1** 3.7±0.3X10« sec-'-torr-1; according to Eq. (IT) this value is the rate constant k*. We note that the left- hand intercept of the solid line of Fig. 13 at Xco/^O is (^r)-'»5.25*0.4X10« sec-'-torr"1 which is in excellent agreement with the value of ku for the self- dcactivai ion rate of HF already discussed. This agree- ment and the linearity of the solid curve of Fig. 13 is exactly the behavior predicted by Eq. (IT).
The rate constant *io for deactivation of CO^OWl) by HF was determined by examination of the late time behavior of the 4.3M fluorescence which exhibited a single exponential decay. Relaxation times for the COi fluorescence data are given in Figs. 14A and 14B for mixtures of HF and COt and HF, COi, and argon.
respectively. Taken together these data cover the entire range of Xwf'm (-YHFO/C-VUF+ACO,) 'rom zcr0
to unity. The left-hand intercept {XHF'=0) of Fig. 14A gives a value of (/>T}~, = 350±50 scc-'-torr"1 in good agreement with the known value" for the rate constant kuf. The straight solid lines of Figs. 14A and 14B represent a reasonable fit to all of the data, drawn to give less weight to the relatively less reliable (pr)'1
values obtained for XHF'>0.S. A value of (^T)_1 = 3.6±0.3X10* sec-1 • torr"'= *IO is obtained for .YIIF'= t.
Figures 15A, 15B, and 15C, taken under nearly identical cell conditions, illustrate the close correspond- ence between the fall of the HF fluorescence and the rise of the COj fluorescence in agreement with the predic- tions of Eqs. (11') and (12').
The measured rate constants and the corresponding values of pr are summarized in Table I for all of the processes studied here.
IV. DISCUSSION
A. Vibrational Deactivation of HF and DF
Vibrational relaxation data for HF at high temper- atures have recently become available. Bott and Cohen10 and Solomon et al* have performed independent
U 'r a
1 1 ■ * *i W'
■ A
• ■■I < •
y
1 1
1—
002 004
X' 0 0« 00» 0 10
Hf
-i 1 1 1 1 1 i i r
10
Flo. 14. Observed CO» fluomccoce relaxation time* for the latter ttaget of relaxation from HF-Cd mixture*. A: No argon present, COi at either 10 or 100 torr; and HF preHure* from 0.05 to 108 torr. B: Argon pressure-10 ton; COipreMuret from 0.05 to 2.0 torr; and HF preuures from 0.05 toO.W torr.

-14-
BNEROY TRANSFER IN HF, DF, HF-COt, AND DF-CO,
TABU I. Summary of rate measurements at 350°K.
5873
Kale constant Pr Pnein WsecrMorr1) (/isec-atm)
DF(F= 1) +DF(r = 0)—2DF(r-0) *-2.0.-t0.2 0.066 HF(t = l)+HF(»-0)-.2HF(«-0) *-5.2S±0 30 o.o?; DF(i-1) +CO,(00«0)-»DF(»-0) +CO,(00»1) i-ir.as :2.s i*.007i HF^-lj+CO.COO«)—HF(t-0)+COj(00»l) *--3.7±0 3 0.036 CO,(00Pl)+DF(t-0)-COJ(m»<0)+DF(«-0) *-1.9±0.4 0.069 CO,{WH) +HF(r-0)-«CO,(»i;»,0) +HF(»-0) *=3.6±0.3 0.037
■r llic iri;i)n .005 Inim
studies of the vibrational relaxation of HF behind incident shock waves in the temperature range 1400- 400CPK. These data and the value for HF deactivation at 350oK given by Airey and Fried' are shown in Fig. 16, along with the HF and DF deactivation rates of the present work, plotted in the custotiary Landau- Teller fashion with ^T as a function of r_1". The shock tube data agree closely and both sets give a linear variation in pr with T'-"3 for temperatures above 1400oK. The values of pr at 350°K. arc much lower than
MO
Time. (^*ec)
c
u ; 0 K) 20 30 40 bO 60 70 80 90
Time, (/j$ec)
FIG 15. Observed and calculated HF and CO, fluorescence from an HF-COj-arf;nn mixture at 350°K. The calculated curves have hern normali/ed to the fluorescence trace«. A: Cd fluores- cence on a long time scale for the mixture: HF —0.195 torr, COi — 0 360 torr, argon-9.90 torr. 1) CO] fluorescence on a short time scale for the same conditions as in A. C; HF fluoretcencc for the mixture: HF-Ü 200 torr, COi-0.360 torr. trgon-10.0 torr
the high temperalui», ia—, ind'" "tivc of the effects of a strong attractive HF-HF n .action which has a predominant influence on ene |y transfer for kT<&E where AE is the attractive p. ential well depth. The magnitude of the low temper I lure rates, and the fact that the DF-DF deactivation rate is less than half that for HF-HF deactivation, is conclusive evidence that nearly all of the initial vibrational energy is converted into rotational rather than t-anslational energy of the collision pair in agreement with earlier results for HCi and DCl presented by Chen and Moore."
The qualitative features of the HF and DF relaxation data can be understood in terms of an approximate classical calculation of vibrational deactivation offered by Shin.u» In recognition of the importance of energy transfer from vibration to rotation for molecules having small moments of inertia so that rotational velocities can exceed translational velocities," Shin has modeled HX-HX (X = F, Cl, Br, I) collisions in terms of the interaction between a rotation-averaged vibrator molecule (breathing sphere) and a rigid rotator inolcful;.'31' The strong hydrogen bonding interaction which is expected to be a predominant feature in the encounters between HF (DF) molecules and to * lesser extent for HCI and Hür collision pairs is ac counted for in an approximate manner by considering the attractive interaction between two ideal dipoles. Despite the questionable validity of the model as a representation of the actual interaction at close range, and the several approximations necessary for a mathe-
n?o?<? Temp«ralur«.(*K)
«x» «oo too -T
Fio. 16 l.andau-Teller plots of the selfdeactivation times for HF and DF at 1 aim pressure.

5874
-15-
R. K. STEPHENS AND T C O O L
matically tractii'jlc analvsis, tlic Shin tluory provides results that agree verv well wilh txpcrimcntal data for the HF, HC1, DC1,' HBr, and HI molcculrs.1,'"b
It appears that the major cffett of the attractive forces is confined to the acceleration produced by the at- tractive potential which results in a significantly enhancea repulsion at close range.^,' Tor this reason, a rather inexact modeling of the attractive interaction is apparently sufficient to adequately represent existing experimental observationr."
The solid curves shown with the cxperiniental data of Fig. 16 are the calculated results given by Shin in Ref. 13(a). The calculated curves exhibit the correct qualitative variation of pr with temperature, and the predicted values of pr are certainly of the correct magnitude. The quantitative differences between ex- periment and theory should not be regarded too «rriously at present in view of the approximate nature o! the theory and the itncvftainty in lome ol tin physical parameters that euer the calculation. Bott •ltd Cohen have indicntcd that a good fit with the high temperature shock tube data can be obtained with a somewhat smaller value of the Lennard-Jones param- eter than the value a = 3 \ used by Shin.10
The value for the ratio of relaxation times, TDFAIIF, obtained in the present work is 2.6 at JSC^K; this is perhaps significantly different from the ratio TDF/riiF = 7.6 calculated by Shin.l,• Unfortunately no other data are presently available concerning vibrational re- laxation in I)K, high temperature shock tube data arc needed for a more precise comparison with calculated values.
B. Vibration-Vibration Energy Transfer from HF and DF to COj
Perhaps the most interesting observation of the present study was the extremely rapid rate of coupling of vibrational energy from DF to CO;; the measured rate, *>= 17.5i2.5X104 sec^'-torr-1, corresponds to only about 40 collisions, one of the fastest rates of in- termolecular V—*V transfer yet measured.10 The magnitude of this rate is inexplicable in terms of existing theories of V—*V transfer because of the large over-all vibrational resonance defect (558 cm-1) for Process (2). Because the observed rise in COj(000l) fluorescence exactly matched the decay in DF(tJ= 1) fluorescence as discussed in the last section, and since coupling by means of an intermediate state in CO] is not plausible in this case," there can be little doubt that the direct coupling process of Eq. (2) is correct.
Moore and co-workers" have measured both the forward and backward rates for the analogous V-*V coupling between HCI and COt and verified that the direct coupling process
HCI(t-1.7')+CO,(0<W)-HCI(p-0>y)
+CO,(00l,l)+AE=537cm-,, (15)
is correct and only m|uires about 80 collisions {k- 9.4X10⁴ sPc-'-lorr1) at -SOO'K. They also determined that the corresponding process foi V—*V coupling between HI and COj, wilh A/i= —119 cm-1, requires about 60 collisions; /1;=12.6X104 sec^-torr-1, as de- termined from the reverse rate at 300oK.
As mentioned in the last section, a clear choice be- tween the alternate mechanisms for V—*V coupling between HF and COi [Processes (2) and (2')] could not be made on the basis of the present experimental results. Nevertheless, the rate of V—fV transfer from HF to CO» was determined to be * = 3.7X10⁴ sec"1- torr"1 at 350oK which corresponds to about 200 collisions. No data [A'o/e added in proof: Data on these systems have recently been reported; see H. L. Chen, J. Chem. Phys. 55, 5557 (1971).] appear to be avail- able for the rates of coupling to COj from HBr, DBr, DC1, and Df; however, it is of sone interest to consider the process
D^-.-l.yO-rCO^OOO)—D,(J= ),7)-fCOI(00I'l)
+ ^•=641 cm"1. (16)
The reported rate for this procc 'S,'1 k= 104 sec-'^iorr-' at 300oK, corresponds to ab/ut 1500 collisions; the relatively slow rate reflects a different mechanism for V—*V transfer in this case as will be discussed in the following.
For comparison with experiment, calculations of V-*V transfer rates for the HF-CO,, DF-COi, HC1- CO», HI-COi, and Dj-COi systems have been per- formed" within the framework of the theory of V—*V transfer by multipole moment interactions discussed by Sharma and Brau." The primary contribution to the over-all rate of transfer comes from the first non- vanishing term in the multipole moment expansion in each case; i.e., dipole-dipole transition moment interactions in all except the Dr-COf case which has a rate determined by the interaction of quadrupole and dipole transition moments of D« and COj, respectively.
A description of these calculations is given in the Appendix. The calculated V—*V transfer probabilities are given in Column 8 of Table II for comparison with the experimental probabilities of Column 9. The cal- culated energy transfer probabilities are several orders of magnitude too small in every instance except for the Dj-COt case, which is in excellent agreement with ex- periment.
Considering first the HF-CO,, DF-CO,, HC1-CO,, and HI-COi systems, we note that only certain pairs of vibration-rotation transitions correspond to values of u less than 15 cm-1, where w is the amount of energy that must go into translational motion. A given pair of allowed vibration-rotation transitions can give a large contribution to the over-all probability of transfer only when w<lS cm-1 for the dipole-dipole case, provided that the in tial state populations are not too

-
«I
"S ■es
lc-
je-
ng ild tal )m -i.
00
in, iil-
»r, cr
0)
•'' he- im he
of 'I- :r-
Ir
M to in- in nt
lv, he
th
I».
r-.
t,
'O
-16-
ENERGY TRANSFER IN HF, DE, HE-CO., AND DE-CO, 5875
TABLE II. Comparison of experimental V-*V transfer probabilities with values calculated with multipole moment interaction theory.
Squared vibrationai matrix elements*
Molecular system
(OK?.'" I Dl' l(«.'l(?i(',|o>l' AC (lO^esu'-cm1) (cm"')
»LJ"
(A) T
CK) P,d Pthnnt'
HE-CO,' HF(l-*0):97» DE-CO, DF(l-»0):70' HCl-CO, HC1(1-*0):451 HI-CO, HI(l-O):0.I6k
COilfm»- CotiOCfO)- COC(00»0)- CO.[((XW)-
►(10»1)]: 13» >(00»1)]:950'' >(00«l) 3:950» ►(00'1)]:9SO''
242 558 537
-119
3.45 3.45 3.60 4.01
350 350 300 300
6.7X10-« 0.30 0.26 1.23X10-'
1.7X10-* i.oxio-« 1.1X10-» 2. OX 10-«
4.9X1»-« 2.4X1^ 1.3X10-« 1.76X10-»
Dr-CO,
l<olO,<'Mi>|« (10-Mesu'-cm*)
D,; 0,(6): 2.76"
l<llol«|0>|« (lO-^esu'-cm»)
COlC((XW))-»(00»l)::950'' 641 3.67 300 4.7Xir« 6.7Xl(r«-
• The notation of Ref. 33 is adopted here. » Vibrationai energy difference between band centers.
' »LJ- (<ri+<r,)/2 is the Lennard-Jones colUsion diameter, calculated from data in J. O. Herschfelder, C. E. Curtis, and R. B Bird Molecular Theory of Cases and Liquids (Wiley, New York, 1954), pp. 597.1200. For HF and DF a value of a.=3.0 A has been adopted [see Ref. 13(a)]. K
d P, denotes the theoretical probability for exact resonance (see Ref. 34). • Calculations of Ref. 32 (see Appendix).
'The process HF(»-l)+CO,(Ö(W)-*HF(s-0)+CO,(02«l)+Aüf-342 cm"' can be neglected by comparison owing to the larger resonance defect and the smaller CO, matrix element for this process.
« R. J. Lovell and W. F. Herget, J. Opt. See. Am. 52, 1374 (1962J. » H. Statz, C. L. Tang, and G. F. Koster, J. Appl. Phys. 37, 4278 (1966). 1 See Ref. 18.
I W. S. Benedict, R. Herman, and G. E. Moore, J. Chem. Phys. 26,1671 (1957); R. A. Toth. R. H. Hunt, and E. K. Plyler. J. Mol. Spectry. 35,110 (1970). . ' '■'
k W. Benesch, J. Chem. Phys. 39, 1048 (1963).
' Calculation is based on matrix elements for the 0,(5), 0.(6), and 0,(7) transitions in deuterium obtained by extrapolation from the results for hydrogen given by O. Karl and J. D. Poll. J. Chem. Phys. 46, 2944 (1967) and T. C. James, J. Mol. Spectry. 32, 512 (1969); the value given is for the O, (6) transition. ■ Reference 12.
small. In the HF-COj calculation, for example, the P{6) transition in HF combines with a large fraction of the allowed CO2(0000)->COj(100l) vibration-rota- tion transitions ,0 give values of t<i<15 cm-1. However, the population of the /'«S rotational state is only about 1/13 of the total HF(»= 1) population at 350oK; unfortunately because of the large rotational spacing of HF, other possible P and R branch transi- tions correspond to larger values of w and thus the total calculated probability of transfer is small. The large effect attributable to the fact that u values greatly exceed 15 cm"1 for the DF-COj and HCl-CO, systems can be ascertained by comparison of Column 8 with the probabilities of Column 7 which have been cal- culated with the totally unrealistic assumption of exact resonance34; i.e. 01 = 0 for all possible transitions.
It is clear from the results of Table II that the long range multipole interaction theory cannot explain V-*V transfer in the HF-C02, DF-CO», HCl-COj, and HI-CO2 systems. There are other examples of V-*V transfer processes that do not agree with existing theory, as discussed by Stephenson and Moore.'5
Just as in the cases cited by these authors, conventional
theories of V-*V transfer of the "SSH type'"4 based upon transitions caused primarily by short range re- pulsive forces are also quite inadequate in the present case. As is well known, these theories predict transfei probabilities many orders of magnitude too low at the present temperatures for processes with resonance defects as large as are considered here.
One source of the difficulty in reconciling the present experimental data with theoretical analysis seems clear. A successful theory must necessarily allow the major portion of the vibrationai energy defect between initial and final stales to be taken up as rotational motion of the collision partners. The rotational selection rules which are a feature of the long range multipole interaction calculation do not permit this in general when the rota- tional energy level spacings are large. Even though consideration of interactions between higher moments and extension of the calculations to higher orders of perturbation theory should provide some increase in the theoretical values, it is unreasonable to expect them to even remotely approach the large experimental rates. We are thus led to abandon the long range interaction small-perturbation approach as an ex-

5876
>» 10
o a
o E H >
o I
-17-
R . R. STEPHENS A N D T COOL
■Experiment (Moore) -TOTOI Probobilily
Orthodeuterium
?.
-4 101
200 -L ±
800 400 600 Temperature, CK)
Fie. 17. Comparison of the rakulatcd probability for V—*V transfer between Dj and CO» (Ref. .12) with experiment (Ref. 12).
planation for the HF-CO,, DF-CO2, HC1-C0,, and HI-COi data. Happily, however, the DJ-COJ case is another story.
bhamu has cxplaimd dcwtivallon of f'O^ut'O) IJ\ HJ and Dj in terms of a dipole-quadrupole interaction.38
Kolker57 has offered a similar calculation for the de- activation of COji'OO0!) by Hj. Calculations^ sum- marized in the Appendix indicate that the observed probability for Process (16) (sec Table II) can be also satisfactorily explained in terms of an interaction between the dipolc transition moment for the asym- metric ctrelch of COj and a quadrupole transition moment of Dj which permits energy transfer by means of the following processes:
0,(1,= l)y=3)+CO2(00n0)-»D,(t = 0,7=5)
+ CO,(0001H A/^lOlcm-', (16')
D.(tf=liy = 4)+CO2(00,,0)-»D,(r=0,y = 6)
+ COj(000l)+A£=-20cm-1, (16")
D,(t=l,/=5) + CO,(Oa,0)-D,(t-=0,y=7)
+ CO,(000l)+A£=-14icm-1. (16'")
The temperature dependence of the calculated Dj-CO» V—*V transfer probability is given in Fig. 17. The lower curve indicates the contribution to the total probability of transfer made by Process (16"). The probability for transfer decreases markedly for temperatures below 300oK because of the reduced population in the 7 = 4 rotational level of D*. At higher temperatures the probability decreases with increasing temperature as is characteristic of weak attractive interactions. The good agreement with experiment at 300oK is encouraging since there are no "adjustable parameters" in the theory.
It should be noted that the mechanism proposed by Moore el al.u for the Dj to COj V-*V process, i.e., ZMc= l)+CO,(0(«))-+D,(f=0)+CO,(011l) followed by CO,(01,1)+CC(001,0)-*CO,(01I0)+CO,(00I11) is
unlikely within the frunu-work of the multipole moment inleraction theory bccimsc of the strongly forbidden nature of the n).'(00"0)-»CÜ2(011l) transition.31'
An important conclusion to be diawn from the foregoing diseusMon can be best illustrated by com- parison of Hi) DF-COj and D2-C02 cases. The dif- ferences in the rotational velocities and energy level ; pacings are not large enough to account for the sig- nificantly greater V—*V transfer rate for the DF-CO2 system with simply the recognition that most of the vibrational energy defect must be converted to rota- tional motion; this conversion is clearly accomplished by different mechanisms in the two cases. The apparent success of the weak long range interaction hypothesis for the Dj-COs system and the inapplicability of this assumption for the DF COj system suggests that in the latter case a strong attractive interaction is involved. This interaction causes a strongly enhanced repulsion at short range which results in a violation of the rota- tional selection rules.
A seanli ol ihe liter.ilun. reveals several references to possible complex formatiün in HF-COj and liCl -CO2 gas mixtures.40^43 Measurements of microwave ab- sorption near lli' far infrared rotational lines of HCI and HBr give evidence of sufficiently strong attractive interactions between HCI-CO2 and HBr-COj collision pairs to cause a violation of the rotational selection rules.40 Similar data exist for HF-CO2 mixtures.41
Mixtures of HCI and HBr with nonpolar gases such as He or H2 do not show similar effects.40 Values for the apparent binding energies of HF-CO2 and HCl-COj complexes have been given as 3.5 and 2.5 kcal/mole, respectively.45
In view of the above, and since it is known that the COj molecule possesses an electron charge distribution strongly localized in the vicinity of the oxygen atoms,44
it is probable that the hydrogen bonded configurations
F—H • • • 0=C=-0, F—D • • • 0=C=0
CI—H..-0=C=0, and Br—H.-.O=C=0
are influential in vibrational energy transfer processes. It is doubtful, however, that the hydrogen bonding energies exceed 2-4 kcal/mole in contrast with the
TABLE III. Probability for deactivation of COi(0O>l).
r Molecular system CK) ^••Ml
CO,-HF 350 4.75XIO-> COj-DF 350 2. S5X10-« COHJ. 300 2.41X10⁻⁴' co,-r>.. 300 2.88X10-« • CO.-HCI 300 5.6X10⁻⁴b
• Reference 38. '• Reference 31.

-18-
ENERGV TRANSFER IN HF. DF, HF-CO,, AND DF-CO, 5877
relatively large (6.8 kcal/mo»Vi bonding in HF pairs. Since the dipole moments bcr .ui progressively smaller in the sequence IMS, 108, 0.80. mi 0.42 D for DF, HCi, HBr, and HI, respectivel , the case for the existence of a hydrogen bonded MI-COi configuration is not quite as convincing in the absence of experi- mental data. Notice, however, lhat since the vibra- tional resonance defects for energy transfer from each of these molecules to CO» decreasie in the sequenr 558, 537, 210, and —119 cm-1, a compensating effect exists to explain the large rate of V—*V transfer from HI to CO,.
C. DeactivatioD of 00,(00°!) by HF and DF
Here again because of the possibility of relatively strong attractive interactions we expect relatively large probabilities fur deactivation in comparison with H, and D,, as Table III illustrates. Because the rates for deactivation for HF and DF arc both large and since the probability for deactivation by HF exceeds that for DF, vibration-rotation transfer is indicated; however, conclusions are riifficult to draw when the CO,(«»»'0) states are not defined.
Preliminary results indicate an inverse temperature dependence for the deactivation probability of CC»(00D1) by HFtf; if this result is confirmed with more careful measurements, it would 'end to support the hypothesis that attractive influences are important in the deactivation of CO, by HF and DF, The deactiva- tion rate of COjfOO0!) in collisions with H,, D,, and HD increases with increasing temperatures1*; therefore a strong attractive interaction is not a feature of the intermolecular potentials in these cases.
I'ntil maw d;'.ta Cfmcerning deactivation of the CO,(00*1) level by other hydrogen and deuterium halides become available, if is difficult to generalize. However, the rctativcK smnll value of the proUihility for deactivation by HCI compared with that by DF (see Table III) is quite likely the effect of the weaker intermolecular attractive potential for the HCI-CO, case since the similarity of the energy levels in HCI and DF would argue against a change in mechanism between the two cases.
V. CONCLUSIONS
(1) All three types of vibrational energy transfer processes studied here have large rates near room temperature which can be attributed to energy transfer to rotation under the influence of a sizable attractive intermolecular potential well and enhanced repulsion at close range.
(2) The approximations inherent in the first order perturbation theory of multipole moment interactions are invalid for treatment of the energy transfers to aMOO"!) from HX(r=l) and DX(t.= l) molecules.
(3) The vibrational energy transfer from D,(i'= 1)
to CO,(00*1) can be explained in terms of a quad- rupole-dipole interaction at long range which causes a significant transfer to rotation of orthodeuterium at room temperature.
(4) A hydrogen bonding interaction between HF or DF and CO, is suggested here to account for the rapid transfer rates for the HF-CO, and DF-CO, systems. A similar mechanism is believed to occur in HX-HX deactivation.'" Since CO, has no permanent dipole moment, the approximation made by Shin1** in treat- ing the HX-HX interaction as one between ideal dipoles will not account for the HX CO, results and may be questionable in the HX-HX case as well. Nevertheless, Shin's results agree well with experiment for HX and DX deactivation.
Second Note Added in Proof: W. H. Green and J. K. Hancock have recently employed a filter cell to deter mine that the contribution of the hot bands to the total fluorescence is negligible for the conditions of Fig. 12. We may therefore conclude from the data of Fig. 12 that the coupling of vibrational energy from HF to CO, occurs by the direct process of Eq. (2). We thank them for their timely interest in the resolu- tion of this important question.
ACKNOWLEDGMENTS
We wish to thank John C. Ketshenstein for setting up the computer programs and Garry L. Schott for a useful suggestion.
APPENDIX
The probability for vibrational energy transfer from a molecule 1 to a molecule 2 under the interaction of the respective mullipoles U and /, can be written
P(#u, D- T. fUd/U») (AA(«U. ">. n)* )t,»:ii',)i> \<
+ au
-J" {P„„{b,o,,T))J>db\, (Al) «•u J
where /(ji) and /(;,) are the rotational distribution functions for molecules 1 and 2 with initial rotational quantum numbers ji and j,. The summation includes all of the respective allowed choices of initial and final rotational quantum numbers ji—*ji' and jt—*jn for molecules 1 and 2. The velocity averaged probability (/>„,,(*, «, ?))„ is defined in'Eq. (13) of Ref. 33.
The integration over impact parameter b of Eq. (Al) follows the approximation of J. Fiutak and J. Van Kranendonk [Can. J. Phys. 41, 21 (1963)] which those authors have referred to as "Case II." This ap- proximation is necessary because the constant velocity trajectory assumption becomes invalid for close collisions, (6<ffLi); Expression (Al) leads to a some- what overestimated value for the over-all probability of transfer.*,■4•

-19-
5878 R. R. STEPHENS AND T. A. COOL
The parameters which enter the computer calcula- tion of (Puitib, «, T))* are given in Table II; the notation used here is the same as that of Ref. 33.
• Su|)i>ortrd by the Advanced Research Projects Agency under OXR contract N00014-67-A-0077-OÜ06, by «he U.S. Air Force OOice of Scientific Research under Grant Af OSR 70-1952, and by the National Aeronautics and Space Administration under Grant NGL 33 010064
t NSK Trainee, present address: Hughes Research Laboratories, Malibu, Calif.
I D. j. Spencer, H. Mirels, T. A. Jacobs, and R. W. F. Gross, Appl. Phys. Letters 16, 235 (1970).
• T. A. Cool, R. R. Stephens, and J. A. Shirley, J. Appl. Phys. 41,4038(1970).
C. Wittig, J. C. Hauler, and P. D. Colencn, Nature 226, S45 (1970).
4 J A. Glaze, J. Finii, and VV. F. Krupke, Appl. Phys. Letters 18. 173 (1971).
: 1. ... iMeinrer, Intern. J. Chem. Kinetics 2, 335 (1970). ■The ten "chemical laser" refers to the fact that the laser
pumping requires conversion of the energy release of chemical reactions into the specific (nonthermal) vibrational er tatior. of reaction products LK. E. Shuler, Appl. Opt.Suppl.2,1 ,65)]. The term "transfer cAemical laser" distinguishes those terns for which a vibrational energy transfer process from a product molecule to another molecule (e.g., CO,) is requisite to laser operation.
' T. A. Cool, T. J. Falk, and R. R. Stephens, Appl. Phys. Letters 15,318(1969).
' J. R. Aircy and S. F. Fried, Chern. Phys. Letters 8, 23 (1971). • W. C. Solomon, J. A. Blauer, F. C. Jaye, and J. G. Hnat,
Intern. J. Chem. Kinetics 3. 215 (1971). ■ J. F. Bott and N. Cohen, J. Chem. Phys. 55, 5124 (1971). ■ R. S. Chang, R. A. McFarlane, and G J. Wolga, J. Chem.
Phys. 6, 667 (1972). "C B. Moore, Fluorescence, edited by C. G. Guilbault (Dekker,
New York, 1967), pp. 133-198. "(») H. K. Shin, Chem. Phys. Letters 10, 81 (1971); (b)
H. K. Shin, J. Phys. Chem. 75, 1079 (1971). " R. R. Stephens and T. A. Cooy Rev. Sei. Instr. 42, 1489
(1971). II An rf discharge was used for partial dissociation of Fi (instead
of SF« as described in Ref. 14); further details are given in Ref. 26. '• G. T. Armstrong and R. S. Jcssup, J. Res. Natl. Bur. Std.
64A, 49(1960). "H. L. Chen and C. ». Moore, J Chtm. Phys. 54, 4072
(1971). '• The radiative lifetime of the COj(OO'l) state is approximately
2.4 nmr fp Wibcr, R. J. Holm, ami S. S. IVnner, J. Chom Phys 20, IS20 (19St)l K J. I..A.1I Mtd W. F. ll<r-.t [J. flpi. Soc. Am. 52, 1374 (1962)] have given a value for the dipole derivative of HF of Mi— 1.5X lO"18 esu and a value for the square of the transition dipole moment of | Äj1;'-0.97X10"" esu'-cm" for HF. The square of the transition dipole moment for DF may be estimated from the relationship |/Wl'-(MiO'Ä./u,, if we assume that Mi is the same for both HF and DF, this leads to the estimate | R,1i,-7Xirs» esu'-cm« for DF. The radiative lifetimes corresponding to the above matrix elements are about 5.5 and 19 msec, rcsjiectively.
"The measured rate of V-*V transfer from DF to COt cor-
responds to only about 40 collisions; the creation of an inter- mediate state, e.g.. DF(»-l)+COl(0000)—DF(»-0) + CO,(01'l)+A£--73 cm"', followed by the process CO,(01'l)+CO,((XW))-*CO,(01'0)+COi(00»l) seems unlikely {«cause of the smallness of the matrix element associated with theCO,(00»0)-«CO,(01,l) transition. ■ R Oberley, K. N. Rao, Y. H. Hahn, and T. K. McCubbin,
J. Mol. Spectry. 25, 138 (19.3). 11 An estimate of the highest possible intercept of the ordinate
of Fig. 4 for A'DF—»0 consistent with 5% error estimates on the 100 torr argon data points leads to the bound: *»a*<100 sec-'- torr"1. The same bound on the HF-argon deactivation rate, *».*< 100 sec-'-torr-1, was obtained from the HF daa of Fig 6.
" C. T. Bowman and D. J. Seery, J. Chem. Phys. 50, IMM (1969).
»J. T. Yardley and C. B. Moore, J. Chem. Phys. 4«, 4491 (1967).
" If the observed relaxation times r exceeded 50 pace, then corrections were made to the decay times for the effect of the 2.4 msec spontaneous emission lifetime.
" J C. Stephenson and C. B. Moore, J Chem. Phys. 52, 2333 (1970).
M R. R. Stephens, Ph.D. thesis, Cornell University. " Near resonant processes of this type in COt are known to be
fast. Examples are the processes CO,(l0»0)+CO»(0(W)-» 2CO,(01l0)-(-A/i--Sl cm», and CO,(0?0)+CO,(00«0)-» 2COi (0110)-|-AA--49 enr1 which require about 50 collisions [C. K. Rhodes, M. J. Kellv, and A. lavan, I. Chem. Phys. 48, 5730(1968)].
»J. A. Shirley, R. N. Sileo, R. R. Stephens, and T. A. Cool. "Purely chemical laser operation in the HF, DF, HF-COi and DF-CO/ systems," AIAA Paper No. 7i-27, AIAA 9th Aerospace Sciences Meeting, New York, 25-27 January 1971.
»C. B. Moore, J. Chem. Phys. 43, 2979 (1965). "Note that the measured rate is over 4 times faster than the
value estimated indirectly by N. G. Basov et at., Appl. Opt. 10, 814(1971).
" H. L. Chen, J. C. Stephenson, and C. B. Moore, Chem. Phys. Letters2, 593 (1968).
"T. .*. Cool and J. C. Kcrshenstein. "Vibrational Energy Transfer between Dt and CO." (unpublished).
" R. D. Sharma and C. A. Brau, J. Chem. Phys. 50, 924 (1969).
"J. C. Stephenson, R. E. Wood, and C. B. Moore, J. Chem. Phys. 48, 4760 (1968).
UK. F. Herzfeld and T. A. Litovitz, Absorption and Dispersion of Ultrasonic Waves (Academic. New York, 1959), Chap. 7.
" R. D. Sharma. I. Chem. Phys. 50, 919 (1969). "H J. Kolkcr, Chem. Phys. Letters 10, 498 (1967). UJ. Stephenson, R. £. Wood, and C. B. Moore, J. Chem. Phys.
54,3097(1971). " S. S Pcnnrr, Qiianlilalive Molecular Sprclroscopy and Cos
RrnktbUla (Addison Wcslev, RendiiiK, Mass., 1959), p. 152. «A. ;V Maryott and G. Birnbaum, J. Chem. Phys. 47, 3200
(1967). 41M. R. Atwood, H. Vu, and B. Vodar, Spectrochim. Acta A23,
553(1967). 41S. Bratoz and M. L. Martin, J. Chem. Phys. 42, 1051 (1965). 41T. G. Burke and D. F. Smith, J. Mol. Spectry- 3,381 (1967). 44 J. E. Lennard-Jones, J. Chem. Pliys. 20, 1024 (1952). 4* Unpublished data (this laboratory). 44 C. J. Gray and J. Van Kranendonk, Can. J. Phys 44, 2411
(1966).
■ /

II. Rapid Gas Mixing Studies (D. Turcotte)
In most chemical lasers the reactants are mixed and then react
spontaneously. The mixing procest Introduoss a mixing time which may
or may not be shorter than the characteristic time for the chemical
reaction. In order to get the expected performance from a chemical
laser the mixing time should be of the same order as the chemical reaction
time. The failure of several chemical lasers to perfonn up to the expected
power levels has been blamed in part on Inadequate mixing.
Rapid mixing may be achieved by decreasing the mixing scale. However
the design of very small Injectors is expensive and may In fact be
impossible for large devices. For small Injectors mixing is expected to be
laminar and the laminar theory of mixing Is well developed. One method of
providing more rapid mixing is to introduce turbulence. It is known that
turbulent mixing may be orders of magnitude more rapid than laminar mixing.
Turbulence may be produced simply by using Injectors which are sufficiently
large to produce turbulent eddies or the turbulence may be introduced
artificially by using grids upstream of the mixing region. No adequate
theory exists for turbulent mixing and very few experiments have been carried
out on turbulent mixing at low pressures.
In order to study mixing at low pressures a mixing wind tunnel has
been designed and built. The mixing tunnel is illustrated in Figure 1.
The plenum chamber of the wind tunnel is divided into two parts by a splitter
plate. The two gases that are to be mixed are metered into the two plenum
chambers. All experiments used helium and argon. The splitter plate ends
-20-

-21-
with a sharp edge at the beginning of the constant area mixing section. The
mixing section has a 3/8" by 3/4" cross section and is 4" long. The mixing
section exhausts into a plenum which is maintained at a low pressure by a
vacuum pump. Just upstream of the mixing region grids of various size wires
could be placed to induce turbulence.
Flow velocities were obtained using a pitot probe. The pltot probe
was also used to obtain the variation in static pressure across the
mixing zone. Concentration profiles were obtained using a sampling probe.
Gas samples extracted from the mixing region were analyzed using a thermal
conductivity cell. This cell is illustrated in Figure 2. The cell contains
four heated, thin resistance wires. The sampled gas passes over two of
the wires while a reference gas (in this case argon) passes over the two
remaining wires. The four wires comprise a bridge circuit which measures
the difference in the voltage drop between a wire in the reference gas and
a wire in the sampled gas. This voltage difference AV i» related to the
thermal conductivities k of the two gases by
'T ■c fr- - J—r) "■> ^ ref sample J
where C is a constant that is evaluated by calibration. With the probe
sampling pure helium the two thermal conductivities are known, AV it
measured, and C is determined. Using this value of C, AV is measured
across the mixing zone and the thermal conductivity profile is determined.
The dependence of thermal conductivity on the relative ratios of helium and
argon is known so that the concentration profile is then determined. A
complete schematic diagram is shown in Figure 3.
S. Chapman and T. G. Cowling. The Mathematical Theory of Non-Uniform Gases (Cambridge, 1960).

-22-
Laminar Measurements
For the constant velocity (u), laminar mixing of helium and argon
it is expected that the molal concentration of helium, c , will satisfy He
the equation
9CHe „ ^H.
where x is measured along the channel and y is measured across it with
DHeA the l)inary diffusion coefficient for the mixing of helium and argon.
Since mixing occurs only in the central part of the channel it is appropriate
to apply the boundary conditions c ->■ 0 as /->•-» and cu -♦• 1 as He He
y -»• + ». The solution of eq. (1) that satisfies these boundary conditions is
cHe-i[l + erf(f {^M] (3) HeA
Three measured concentration profiles are given in Figure 4. These were
obtained at x ■ 5.2 cm. Velocities of 100 and 200 m/sec and pressures of
20 and 30 torr were considered. The measurements are compared with the
profile given in eq. (2) using the accepted value for D , HeA
2 DHeA ■ 17.8 cm /sec for p - 30 torr. The agreement between theory and
experiment is reasonably good.
The most significant result of the laminar measurements is not
illustrated In the above analysis. The observed center line for mixing is
given in Table 1 for the three cases considered. With equal velocities
of helium and argon about 60% of the channel Is filled with argon. If
equal amounts of argon and helium were metered into the channel, it was
found that the velocity of the helium would be nearly

-23-
Table 1
pressure torr
velocity m/s
fraction of filled with
channel argon
"A - 'He
* "He ^
30 100 0.605 1.35
30 200 0.575 1.27
20 200 0.622 1.22
twice as large as the velocity of argon and that about two-thirds of the
channel would be filled with argon. The thickness of the mixing region in
this situation would be about one-half that observed for constant velocity
mixing.
In order to investigate this peculiar behavior the static pressure
was measured across the mixing zone. If the variation in static pressure
across the zone is a significant fraction of i pu u then an influence
of mixing on flow is to be expected. In Table 1 the measured values of
2 ^A " PHe^ PHe u are «iven for the three cases. It is seen that this
ratio is in fact of order unity so that it is not surprising that the mixing
Induced pressure gradient has a significant effect on the flow.
This lateral pressure gradient is clearly a deviation from Ideal mixing.
"n ideal mixing the interaction forces between the two gases are equal and
opposite as they mix so that a symmetric mixing profile is obtained as
shown in Figure 4. However the argon being heavier than helium has a
greater Inertia. In the rapid mixing studies considered here this Inertia
is significant and the slowness •£ the argon to move into the helium
results in the higher pressure In the argon which is measured here. To
date a qjantitatlve theory has not been developed.

-24-
Turbulent Measurements
In order to study the Influence of turbulence on mixing, screens
were placed across the flow at the entrance to the mixing section. The
results for two screens are shown In Figure 5. These measurements were
carried out with p - 30 torr, u - 100 m/s, and x - 5.2 sec. The screens
had wire diameters of 0.012 in. and 0.018 in. For the finer screen the
concentration in helium-rich mixtures was unaffected but a turbulent
enhancement of mixing is noted for the argon-rich mixtures. This difference
can be explained by th« different densities for argon and helium and the
resultant differences in Reynolds number based on screen wire diameter.
The Reynolds number for the screen in argon is a factor of ten larger than
the Reynolds number for the screen in helium. For the coarser screen no
additional mixing is observed in the argon but the mixing in the helium
is now as effective as in the argon. Apparently the transition Reynolds
number for the screen in helium has now been exceeded and turbulence
is being produced.
It should be noted that the pressure drop across the screen in the
argon is much greater than the pressure drop in the helium. This is
because the pressure drop is proportional to pu . Because of this
effect the helium may be accelerated through the screen relative to the
argon and a "jet" effect obtained, thereby inhibiting mixirg. It is
necessary that turbulence be introducad before mixing takes place to
prevent this effect.
In Figure 6 the development of the turbulent mixing is shown.
Mixing profiles at the three measuring stations are compared with the
laminar measurement at x - 5.2 cm and the laminar theory. These

-25-
results are for the 0.012 in. screen. It should be noted that the Increase
In mixing observed In this figure is In addition to the spread of the laminar
mixing profile.
In conclusion two important results have been obtained:
(1) Turbulence can be Introduced to enhance mixing at low pressures.
(2) Transverse pressure gradients heretofore neglecter can strongly
influence relative velocities of the mixing gas streams and
thereby inhibit mixing. Care must be taken to prevent this
erract. If a simple Jet of a low molocular weight gas is
introduced into a high molecular weight gas the transverse
pressure effect will accelerate the low molecular w«ight Jet
thereby reducing the mixing predicted by the usual laminar
theory by a factor of two to three.
I

I o
8
o o o
J H
Q.
> I
-26-

I 5 • mmm
>
Ü
g Ü O e I
CVJ
-27-
• /

-28-
■ /

-29- Figure 4

D
D
0 D
D
o o o 00
c c (D O c O <D
0) c&<&
ü CO CM 00 o ÖQ z OO
O <J D
D
l^Q D O CD
D
x
O
D<1
a
Ö
nOO
<ä
%
c5^
CO
(VI CM
CM
I
CD l
CM 00 i
X to 9)
3 I
-30-

—KM
X
X <
o 0) (A
O o
V
0 " " " — XXX
1 I I I x a < o
a Ox
i
«
-31-
I
Fiaure 6 <ll<0
i

III. Vtbratlonal Relaxation
A. High Pressure Relaxation In COjCOOl) (Wolga)
1. HBr Chemical Laser Studies
The object of this program Is to determine the relaxation time of
C02(00ol) due to collisions with CO., N-, He, etc., In the pressure range
1-100 atm-. and at temperatures up to 600oK. The experimental plan Is to
use laser Induced fluorescence from the C0-(00ol) state with laser pumping
by v - 2 ■*• 1 transitions in the HBr chemical laser. In the process of
developing an HBr Jaser with adequate performance as a pump source for
this «xj iment extensive studies were carried out to study beneficial
additives if any, and possibly improved H atom sources. The latter study
was motivated by the fact that the chain propagating step in the
Hj + Br« chemical reaction, Br + H. -► HBr + H, is endothermic by
16.7 K cal/mole, is very slow, and does not therefore contribute to the
reaction within the short time of the chemical laser pulse. A detailed
discussion of our studies of H atom sources for pulsed, electrical discharge
initiated hydrogen hallde chemical lasers, and of our design and construction
of a powerful HBr chemical laser with substantial emission at A.2 p was
Included in our Semi Annual Report for 1972 and will not be repeated here.
2. The remainder of the past contract year was devoted to completing
preparations for the measurement of the high pressure V-T relaxation of CO,(00ol).
The HBr laser yields pulses of several microsecond duration. Since the C0_
fluorescence will be monitored in this experiment it is necessary that the
exciting laser pulse be short compared to the V-T relaxation time of CO..
We plan to employ an electrooptic shutter to select a portion of the HBr laser
-32-

-33-
pulse, external to the laser cavity thereby achieving the required short,
variable pumping pulse. An electrooptlc shutter has been designed and
constructed. It uses m (110) oriented, 40 mm long single crystal slab
of GaAs that Is electroded transverse to the optical path through the
crystal on 110 faces. An appropriate trlggerable, high voltage source
was purchased to drive the GaAs crystal. The GaAs crystal operates In
conjunction with a Ge slab analyzer to divert a selected portion of the
output laser pulse.
An optical cell was designed and constructed for carrying out the
laser Induced fluorescence measurement. The cell Is capable of operating
from good vacuum conditions to an overpressure of 100 atmospheres. Its
design is compatible with installation in a dewar for experiments at
low temperatures and it can be externally heated as well. The path
length within the cell is made variable to accommodate the very short
absorption lengths to be expected at high pressures. A schematic drawing
of the cell is shown in the figure.
At the time this report was in preparation experiments were in progress.
B. Vibrational Relaxation and Chemical Reactions (Bauer)
During the past summer we undertook a concerted effort to assemble and
test several computer programs for modeling chemically reacting systems
which V-T and V-V processes are specifically Included. While such programs
•re available in many other laboratories we have not been able to obtain
sufficiently detailed statements to permit their direct use on our IBM 360-65
computer. Another drawback (besides the problem of adaptation) is the
length and consequent excessive cost of running these computer programs in

-34-
ÜJ ü
Hl cc (0 (0 ÜJ QC QL
CD

-35-
in our installation. During July-September a modified Runga-Kutta
integration scheme for multiple, concurrent, first order non-linear
differential equations was set up and tested on tvo reactions:
IF2+N0] and[CS2+02 (lOX dissociated) ]. This program incorporates
(a) the Treanor modifications for rapid convergence (b) reverse steps
for all reactions, (c) V-T relaxation processes, and (d) the option
of running the system either isothermally or adiabatically, at constant
pressure, to simulate rapid flow or shock conditions. In addition, a
program developed by Professor E. R. Fisher (Wayne State University)
has been adopted for our computer. This includes subroutines for calculating
V-V transition probabilities, and their incorporation into the kinetic
scheme. More important, to permit integration »f "stiff" equations
(when fast rates of destruction approach fast rates of production, such
that the system enters a steady state condition) the program switches
from integration of differential equations to the solution of algebraic
equations (Keneshea tec.inique). This program is currently being tested
on an artificial model, the dissociation of hydrogen at room temperature
initiated by exciting 1% of the molecules to the v - 1 state.

IV. Chemical Laser Studies and Rate Determination
A. EPR Study of the NO + F, Reaction (G. J. Wolga)
The chemical decomposition of F2 by reaction with NO has been
extensively employed In the purely chemical, DF/HF - C0?, transfer
studies by Cool, Falk and others. Until now, «-he rates for the
primary reaction NO—^NOF + F and the secondary reaction
F + NO *.NOF have been taken from the work of Rapp & Johnson(1)
who used visible emission studies of light emitted from a dilute
diffusion flame together with extensive analysis to deduce these
rates. These authors stated that the interpretation of their results
was somewhat ambiguous. Since both NO and F are paramagnetic, their
concercrations may be followed quantitatively in a flow system using EPR
absorption measurements. We have done this by fitting a fast-flow mining
system to an x-band EPR spectrometer and thereby measuring the growth
of F concentration and the decay of NO concentration as a function of
reaction time. The analysis of our results is entirely straightforward since
the experiment is a simple one. A calibrated flow of NO is established
upstream of the microwave cavity. A calibrated flow of F, is injected
into the NO stream and the F and NO concentrations are monitored
as a function of position downstream of the injection position. With a
constant flow speed a conversion of downstream position to time of
reaction is easily made.
The rates we have determined in this study are:
Donald Rapp and Harold S. Johnson, J. Chem. Phys. 33, No. 3. 695 (Sept., 1960). —
-36-
■ /

-37-
o 3 k. ■ 2.6 x 10* cm /mole sec
k2 - 1.1 x 1Ö17 cm6/mole2 sec
The details concerning the experiment and the rate determinations are
discussed more fully in the accompanying manuscript. It is clear from our
work that mathematical modeling studies of the DF - C02 laser utilizing
the NO + F2 -^ NOP + F reaction as a source of F atoms must use the
rates determined in this work rather than those of Rapp & Johnson.

-38-
REACTION KINETICS OF N0+F2 - FNO+F AND
F+NO+M -v FNO+M USING EPR DETECTION
by
E. S. Mooberry and G. J. Wolga
Laboratory of Plasma Studies
and
School of Electrical Engineering
July 1972
Cornell University
Ithaca, New York 14850
This research was supported by the Advanced Research Projects Agency
of the Department of Defense and was monitored by ONR under Contract
No. N00014-67-A-0077-.0006. Use of the central facilities of the Cornell Materials Science is acknowledged.

-39-
ABSTRACT
The reactions of nitric oxide with fluorine molecules and fluorine
atoms were studied using EPR detection. The two rate constants determined
1 9 3 are: the reaction NO + F2 —-* FNO + F, k1 = Z.6 x 10 cm /mole sec; and
for the reaction NO + F + M —^ FNO + M, k2 = 1.1 x 1017 cm6/mole2 sec.

-40-
REACTION KINETICS OF N0+F2 -> FNO+F AND
F+NO+M * FNO+M USING EPR DETECTION
by
E. S. Mooberry and G. J. Wolga
Laboratory of Plasma Studies
and
School of Electrical Engineering
Cornell University, Ithaca, New York
Because of the Interest In the reaction
kl F2 + NO + FNO + F (1)
as a fluorine atom source for chemical lasers the rate constants for reac-
tion (1) and also the succeeding step
k2 F + NO + M -^ FNO + M (2)
were measured. The reactions above have been studied previously by Rapp and 2
Johnston using the dilute diffusion flame method. At 2980K the rate con- 10 3
stant for reaction (1) was determined to b^ 4.y x 10 cm /mole sec. In an
effort to check this value a study by EPR detection was undertaken.
The experimental setup was similar in design to that of Uestenberg and
DeKaas" utilizing a fixed EPR cavity and movable Injector. Reaction (1)
was studied by measuring the decay of [NO] with time under the condition
[NO]< [F2] <[HeJ.Good logarithmic decay plots of [NO] were found. See
Fig. 1. Table I gives the data for several determinations of k,. The
fluorine atom concentration was also monitored by EPR detection and found to
increase linearly with time for reaction distances up to ^O cm. The [F]
was found to correspond to the loss of [NO] down the reaction tube so that
-1-

-41-
for small distances the effect of reaction (2) was small, see Fig. 2.
Reaction (2) was studied by discharging [F»] in a sidearm and measuring the
F atom decay as a function of distance down the reaction tube under the
flow conditions: [Fp], [F] <[NO]< [He]. Table II gives the operating condi-
tions and the values for k^ that were calculated from the logarithmic decay
of F atoms as plotted in Fig. 3.
As reaction (2) is 55.4 kcal, exothermic it is assumed to be a three
body reaction. The rate constant for the three body reaction tr Cl atoms
16 6 2 4 with NO has a similar rate in Helium of 3 x 10 cm /mole sec. The
reactions of 0 and H atoms with NO are three body and have rates of the
order of 1016 also5,6.
A third reaction must be considered and that is the three body recombin-
ation of fluorine atoms:
F + F + M -•■ F2 + M (3)
where M Is He or the wall. This reaction was found to be negligible under
the present experimental conditions. The microwave discharge
cavity was placed at several positions along the reaction tube while
flowing a mixture of F« with excess helium at a pressure of ca. 1 torr. No
measureable difference In the EPR fluorine atom signal height was found at
different distances from +he cavity. This contrasts with the fast recom-
binat'on found for chlorine atoms with uncoated quartz tubing.
The rate constants for the reaction of fluorine with nitric oxide have g
been measured in the present work. The value of k-j was found to be 2.6 x 10
cc/mole sec which is more than an order of magnitude lower than the pre-
vious result. The present value of k. was determined by loss of NO in the
I

-42-
reaction and by the production of F atoms and therefore should be a
reliable Indication of the reaction rate. On the other hand the present
determination of k« is somewhat more uncertain. The measured value
determined from the direct reaction of F with NO when used in the computer
analysis of the Fg + NO reaction data leads to a prediction of about half
the fluorine atom production actually observed. The value of 8 x 10 cc/mole
sec seems reasonable on comparison with the other NO reactions mentioned
previously. Using these considerations the value of 8 x 10 cc/mole sec
should probably be considered only as an upper limit. Further study will
be undertaken to clarify the second reaction rate.
. /

-43-
REFERENCES
1. T. A. Cool and R. P. Stephens, J. Chem. Phys. 51_, 5175 (1969).
2. 0. Rapp and H. S. Johnston, J. Chem. Phys. 33, 695 (1960).
3. A. A. Westenberg and N. DeHaas, J. Chem. Phys. 46, 490 (1967).
4. T. R. Clark, M. A. A. Clyne and D. H. Stedtran, Trans. Faraday
Soc. 62, 3354 (1966).
5. F. S. Klein and J. T. Herron, J. Chem. Phys. 41.» 1285 (1964).
6. M. A. A. Clyne and B. A. Thrush, Proc. Roy. Soc. (London), A275,
559 (1963).
7. S. W. Rabideau, H. G. Hecht and W. B. Lewis, 4th International
Symposium on Magnetic Resonance, Rehovot and Jerusalem, Israel
Aug. 23-31 (1971).

DA-
TABLE I
Summary of Measurements of the Rate Coefficient
k1 for F2 + NO -► FNO + F 298K
Pressure mm
Velocity cm/sec
[F2] 3 moles/cm cnr/rlole sec
0.60 1190 5.9 x 10"9 3.0 x 10⁹
1.00 1770 6.5 2.6
1.00 1840 8.2 3.0
0.83 1460 10.6 2.0
ave = 2.6 +0.5 x 10⁹

-45-
TABLE II
Summary of Measurements of the Rate Coefficient k2 for F + NO + M ♦■ FNO + M 298K
Pressure mm
Velocity cm/sec
[NO] , moles/cm
1.0 1950 4.4 x 10"9
1.3 2520 5.9
1.3 2600 8.2
3 k2[M] [M] 3 k2 , cm /mole sec moles/cm cm /mole e sec
8.1 x 10⁹ 5.9 x 10"8 1.4 x 10¹⁷
8.4 7.6 x 10"8 1.1 x 10¹⁷
7.9 7.6 x 10"8 1.0 x 10¹⁷
ave = 1.1 x 10¹⁷
/

-46-
FIGURE CAPTIONS
Figure 1. Plots of ln[N0]/[N0]o vs. time. (1) Velocity = 1770 cm/sec,
P = 1.0 torr. [N0]o = 3.2 x 10"9 mole/cm3, [F2] » 6.5 x 10"
9
mole/ctn3. (2) Velocity = 1840 cm/sec, P = 1.0 torr, [NO] 3
3.2 x 10"9 mole/cm3. [F2] = 8.2 x 10"9 mole/cm3.
Figure 2. Plot of [F] vs. time. Velocity = 1930 cm/sec, P ■ .92 torr,
[F2] = 5.9 x 10"9 mole/cm3, [N0]o = 3.0 x 10"
9 mole/cm3.
Absolute F atom concentration determined by comparison of line
"d" of atomic fluorine with line "E" of molecular oxygen .
Figure 3. Plot of [F] vs. time for the reaction F + NO -»■ FN0. Velocity =
1950 cm/sec, P = 1.0 torr, [NO] = 4.4 x 10"9 mole/cm3, [F] = -9 3
1.35 x 10 mole/cm assuming complete dissociation of F« by
microwave discharge.

-47-
If) CVJ
o CM
c o Ü Q> W
IO • ^^B
E *-*
O <D E h-
m
ooco • • • -oo
• o
CD • O
• • o o
ro •
O CM • o
0(0N)/(0N) U|
Figure 1.

-A8-
o
OOCDNCDinsi- rocvi —
£UJO/S9|OIJU 0|oi x (J)
Figure 2.

-49-
I.OQ 0.9 0.8 0.7 0.6
0.5 o
iT 0.4
u- 0.3
0.2-
0.1
\o
i i 5 10 15
Time (millisecond) 20
Figure 3.

-50-
B. Vlbrational Excitation in the CS.-O- Laser Reaction (S. H. Bauer)
The major portion of our study of a pulse initiated chemical CO
laser, based on the CS. + 0- reaction, has been completed and the results
summarized in the appended manuscript. This has been somewhat revised and
submitted for publication in the Journal of Physical Chemistry. The two
salient features derived in this investigation are: (a) Deduced the nascent
(v) C0V vibratlonal distribution, as described below, and concluded that in
a pulse Initiated system, such as developed here, there appear to be two
mechanisms which generate CO , one identified with the reaction
(v) CS + 0 ->■ CO + S, and another as yet undetermined process; (b) Established
the fact that the initiating electrical discharge produces vlbratlonally
(w) , excited CS [w - 0,1,2,3,4], which are long lived species.
In our Investigations laslng was initiated by a fractional ys pulse
discharge in flowing CS2 + 02 + He mixtures, maintained at about
3 torr. Two types of cavities were used; one with two spherical mirrors
and the other with a grating for wavelength selection. In the first
configuration we determined the optimum discharge voltage to maximize laser
power. When the Impressed voltage was higher than the optimum, CS and 0

-51-
were directly involved in the lasing reaction. When the discharge voltage
was lower, a chain reaction was the principal mechanism for lasing. In
the tuned cavity, the measured T 's (intervals between termination of the
discharge and initiation of lasing) followed a characteristic sequence;
the minimum delay (' 10 us) occurred for the 12 ->■ 11 transition, with
longer times for higher and low vibrational states. The recorded delay
sequence was explained on the basis of the initially generated distribution
of vibrationally excited CO. The relative populations were also estimated
from chemiluminescence intensities recorded under conditions identical to
laser operation but in the absence of mirrors; these are: <? -I..,.l& ■
0.13/0.30/0.49/0.72/1.00/1.03/0.90/0.80/0.71/0.62/0.65/0.61/0.57/0.60/0.91/
1.20/2.10, In general agreement with the laser delay measurements. While
this distribution is close to that reported from other laboratories for
v > 8, there is a significant differenct for the v £ 7 range, in that our
data show that substantial fractions are also generated in the low v states.
To date we have demonstrated that the rates of production of total CO
and that of destruction of total CS are approximately exponential and have
about the same rate constant (Fig. a). Our current efforts are directed
at obtaining more data on the CS2 + 0. system via time dependent UV emission
and UV absorption spectra, to ascertain the fate of Cs'W' species, and to
exploit the computer modeling programs, described in IIIB, for checking the
proposed mechanisms.
In a preliminary communication from this laboratory [M. C. Lin and S. H.
Bauer, Chemical Physics Letters, 7_. 223 (1970)] we stated that mixtures of
C302 + 02 Produce inverted arv' populations, and do läse when subjected to a
pulse discharge. We have now initiated a detailed study of this system.
■ /

-52-
analogous to that concluded for the CS2 + 02 pair. In the first stage of
the program shall to develop a synthetic procedure for generating abundant
quantities of C^ in pure form and at acceptable yields. Concurrently
we shall test for lasing under cw conditions by utilizing Professor McFarlane's
1 Kw microwave generator for producing copious levels of dissociated oxygen.
Our primary objective is to measure the nascent distribution of Cc/V^
produced in C^ + 02 + He mixtures when subjected to a pulse discharge.

-53-
LASING ACTION AND THE
RELATIVE POPULATIONS OF VIBRATIONALLY EXCITED CO PRODUCED
t
m PULSE-DISCHARGED CS„ + 0„ + He MIXTURES 2 2
S. Tsuchiya , N. Nielsen and S. H. Bauer
Department of Chemistry, Cornell University, Ithaca, New York 14850
ABSTOACT
Lasing was initiated by a fractional us pulse discharge (»15 Kv) in flowing
CS + O + He mixtures, maintained at about 3 torr. Two types of cavities were 2 2
tested; one with two spherical mirrors and the other with a grating for wavelength
selection. In the first configuration we determined the optimum discharge voltage to
maximize laser power. When the Impressed voltage was higher than the optimum, CS
and O generated by fragmentation of the CS and O were directly involved in the lasing
reaction. When the discharge voltage was lower, a chain reaction was the principal
mechanism for lasing. In the tuned cavity, the measured r.'s (intervals between d
termination of the discharge and initiation of lasing) followed a characteristic sequence;
the minimum delay («10 jxs) occurred for the 12 — 11 transition, with longer times for
higher and lower vibrational states. The recorded delay sequence was explained on
the basis of the initially generated distribution of vibrationally excited CO. The relative
populations were also estimated from chemiluminescence intensities recorded under
conditions identical to laser operation but in the absence of mirrors; these are:
O /..../«),= 0.13/0.30/0.49/0.72/1.00/1.03/0.90/0.80/0.71/0.62/0.65/0.61/0.57/ 17 1
0.60/0.91/1.20/2.10, in general agreement with the laser delay measurements. While
Permanent Address: Department of Pure and Applied Science, University of Tokyo
l ■

-54-
this distribution is close to that reported from other laboratories for v > 8,
there is a significant difference for the v< 7 range, in that our data show that
substantial fractions are also generated in the low v states.

-55-
INTRODUCTION
The reaction between carbon disulfide and oxygen which, under suitable conditions,
generates inverted populations of vibrationally excited CO, has many intriguing aspects.
While this process has been investigated assiduously during the past five years, and a
concensus has been reached regarding the two principal reactions:
kl CS + O - CS s SO (1)
cs + o —s-*- cciv)-! S (2)
as yet there has been no complete Identification of all the steps which do occur, nor has
any detailed study been made of the lifetimes and concentrations of intermediates in the
chain which must be present in the flai ic laser . Only a few quantitative measurements
(2-5) of the reaction rates have been published . For computer modeling of CS -O lasers
It Is essential to establish the partition of vibrational energy among the wide range of
states as initially produced in reaction (2). We have no knowledge of any proposed 3-
center potential energy surface for the S/C/O system nor of trajectory calculations on
such a surface which would provide from a theoretical analysis some Inkling of how the
exothermlcity is distributed in the product species.
In this manuscript we report on the deduction of the vibrational population distribution
for the nascent species from measurements of delay times for lasing (T), at specified
frequencies, subsequent to Initiation of the reaction by a pulsed electrical discharge.
We have also measured relative chemilumlnescence intensities under conditions Identical
to the above but In the absence of cavity mirrors. In the meantime the reports by
Hancock and Smitlr * ' provided complimentary data on this distribution, based on

-56-
thcir measurod chemiluminesccnce intensities in a rapid flow apparatus, in which oxygen a
atoms produced by/microwave discharge were mixed with carbon disulfide. Dawson and
Tanr suggested corrections to Hancock and Smith's initial distribution. The results
of these investigations are compared with ours. Also, we made preliminary measurements
on CS level populations via UV absorption spectra. While these data are as yet qualitative,
their implication regarding the mechanism are unexpected and significant.
APPARATUS
I.R. The configuration used for the/investigations is shown schematically in
Fig. 1. The laser tube is 1 m long, 2.54 cm in diameter. Two aluminum ring
electrodes are placed at each end, and between them the charge from a capacitor
(0.01 jiF) is released through an ignitron (WL -7703), which is triggered at a rate of the
6 Hz. The current pulse width depends on the pressure and composition of/gas, as well
as the voltage; shorter pulse-widths and larger peak curients result from higher discharge
voltages. A typical combination has a half-width of 0.3 jitsec, a peak current of 550A in
a mixture consisting of 0.05 torr CS , 0.35 torr O , and 3.8 torr He, for a discharge
voltage of 15 kV.
Fine needle valves (vernier settings) were used to control the flow of each gas. The
flow rates were calibrated by measuring the rate of decline of pressure in a vessel of
known volume. Most of the experiments were done with mixtures of CS 0.015 ~ 0.05 torr, m
02 0.01 ~ 0.8 torr, and He 2 ~ 3 torr, and a linear flow velocity of b m/sec.
first. Two types of cavities were tested. In the/two gold coated spherical Ge mirrors with
a radius of 4 m were used. The mirrors were placed 1.5 m apart, and one had an
uncoated hole in the center of 0.75 mm diameter, for coupling out the laser emission. The

-57-
total power generated in the laser was monitored by a Au doped Ge. detector through a
tilted NaCjP plate with rough surfaces used for auenuauon, and an l.R, filter having a
flat response between 4.1 ~ 5.6 fi. The ouipui from the detector passed through an FET
impedance reducer, and was displayed on an oscilloscope (Tekironix 535). For dispersed
wavelength studies, an l.R. grating monochromator, Perkin-Elmer e8G, with a Bausch- grating
Lomb, 15Ü u/mm/ blazed at 6jLt,and a Au doped Ge detector (Santa Barbara Research
Lab, 70R) were used. The monochromator was calibrated by measuring several lines
of a low pressure mercury lamp in high orders. The wavelength response of the mono-
chromator and detector system was calibrated by recording the emission of a Nernst
glower lamp whose temperature was measured with an optical pyrometer, assuming the
emissivity was constant over the 0.65a - 5/iregion. In order to measure integrated power
the vertical signal output from the oscilloscope was passed through a pulse stretcher in
which the signal was integrated by a 0.47^ F capacitor through a Ge diode, and lead to the input of a lock-in
amplifier (PAR Model 120); the reference signal was synchronized with the trigger
pulse that initiated the discharge. The accuracy of response of the look-in amplifier
output was compared with the total power obtained by integration of the laser pulse as
displayed on the oscilloscope. The proportionality between the two measured outputs
was good except for very weak laser signals.
In the second arrangement a wavelength controlled cavity was used. A grating
(Bausch and Lomb, 300 i/mm, blazed at 3.5 jU) was set at one end, replacing the totally
reflecting spherical mirror. The measuring system remained the same as for the con-
ventional cavity. Since the laser transitions of CO are close to each other, it was difficult
to isolate a single transition by tuning the grating. Most of the tuned laser lines were
accompanied by 2 or 3 weak satellite lines. Usually, an effort was made to reduce the

-58-
inlensity of these satellite linen to less than 10% of the main oscillating lines. Thus,
cascading due to stimulated transitions had little effect on the measured delay limes of
the laser pulses.
The fundamental CO emission was measured from one end of the laser tube
The Brewster angle window was replaced with a NaCjf
window set perpendicular to the axis of the tube. The arrangement of the discharge
pulse was the same as in the former case. The sigi.jl from the monochromator was
sampled with a Boxcar integrator, PAR 10, for a duration of 2.5 fisec, using a constant
preset delay time after the discharge. The monochrorrra'or was scanned very slowly over the
wavelength region that covers the CO fundamental region, 4.5 to 5.b ß. Thus the
emission spectrum of CO at a given delay time could be obtained. The method used to
estimate the vibrational population from the recorded spectrum will be described later.
EXPERIMENTAL RESULTS
Laser with a Conventional Cavity
Figures 2a and 2b are oscilloscope records of the laser pulses. These clearly
show definite delays after initiation by the discharge. In the O^rich case, the
laser power peaks very rapidly and then decreases in an oscillatory manner. In
contrast, for low O content, the laser pulse delays are longer, and the m
pulses attain their maximum more gradually. Low discharge voltages
and excess O. show pulse shapes very similar to the case of low 02 m
content. Thus, two types of pulse shapes were found: one for high discharge
voltage and O -rich mixtures, and the other for low discharge voltages and either
. /

-59- 7
low or high Og content. This suggests that two iasing mechanisms are operative,
possibly differing in detail; this is supported by expe/iments on the dependence of the
laser power on the discharge voltage, the measured dtUy for Using onset, and the
laser spectrum.
The oscillations of the laser pulse may be related to radially propagaiing acoustic
waves. The oscillating period does not depend on the discharge voltage. However, the
addition of He to the system, while maintaining constantCS andO content, results in a
reduction of the period of oscillation as well as its amplitude. The latter fact can be
explained by the higher sound velocity and the more homogeneous discharge when
additional He was present in the system. Figure 3 shows changes in the shape of the
laser output pulse with increasing Ho pressures.
The dependence of the integrated laser power on the discharge voltage and O
concentration is shown in Figure 4. There is an optimum in the discharge voltage for
maximizing the laser power. This voltage depends on the O content of the system;
the lesser O^ the higher the optimum voltage. If it is assumed that there is an optimum
discharge voltage for the formation of CS from CS and that the concentration of O atoms
increases with the discharge voltage, the above result is understandable.
For high discharge voltages the laser power Increases monotonically with CS , as does
the optimum discharge voltage. This Is reasonable, because a larger amount of energy
is required to decompose the CS to CS. The overall effect of added He is small.
With increasing He pressure, the optimum discharge voltage for laser power shifts
slightly to the high side, but the power does not change. Apparently, the He atoms act
as decelerators for the electrons. The shift of the optimum discharge voltage was
also observed when the size of the discharge capacitor was changed. With 0,01 JJF,

-60-
a mixture of 0.016 torr CS + 0.68 torr O + 1.7 torr He produces peak power at 9.5 kV;
with a 0.003G /iF capacitor, the peak power for the same gas mixture was observed at
14.5 kV. Both cases have almost the same electrical energy: 0.45 and 0.36 J,
respectively.
The delay times for the initiation of laser pulses are determined by the discharge
voltage as well as the CS and O concentrations. As shown in Figure 5, the dependence
is complex. This is not unexpected since the nature of the discharge depends on the
amount of CS and O present. The composition factor is apparent in the case of low
voltage discharges (6 ~ 9 kV); a small increase of O or CS reduces the laser delay
times but a large increase reverses the trend. While on one hand higher pressures
decelerate the electrons, on the other, they provide more abundant sources for CS or
O. In the high voltage discharges the plasma electrons retain sufficient energy to
dissociate O and CS so that small changes in O or CS. content do not produce
significant changes in the plasma state. In this respect, some information can be
obtained from measurement of the current pulses. For voltages higher than 10 kV,
the half-width is generally constant, at about 0.3 fisec, and is not affected by small
changes in CS or O content. However, for discharge voltages below 10 kV the
half-width is larger, and an increase in CS or O produces an increase in the half- Lt dt
width. This implies that the addition of CS or O to the system reduces the discharge
peak current, i.e., the resistance of the discharge gas is larger. Therefore, when the
system has sufficient discharge energy, the extent of dissociation is proportional
to the CS and O content, and the lasing process is accelerated. Prom Figures ,
it appears that the inverse of the delay time (r) is proportional to the O and CS
concentrations when the discharge voltage is 13~ 15 kV:

-61-
I/T « ics2J [02]
Ninety vibration-roiaiion transitions were found; rht-se were asfe)gnt-d to various
transitions from v - 14—13 to v ; 2— 1. These spectra were taken for a gas mixture
consisting of 0.017 torr CS + 0.6ö torr O + 1.7 lorr He; the discharge voltages were
7,9, and 12 kV. In the 7 kV discharges, the recorded laser transitions were mostly
P(16) ~ P(ll) of v - 14—13 to v =4—3 vibrational transitions. The spectrum initiated
by 12 kV discharges shows P(19) ~ Pil4) of v = 13—12 to v - 6—5 transitions. The
spectrum produced with a 9 kV discharge exhibits chardcteristics of both the low and
high voltage discharges. Possibly the higher J transitions are favored for the higher
voltage discharges because the corresponding rotational temperatures of the system
are higher. In Figure 6, the sums of intensities of the various rotational transitions
for each vibrational transition are plotted vs (v—v-1). Maxima appear at v =111—10
and v - 9—8 for the high and low voltage discharges, respectively. This suggests
that for the higher voltage discharges there is a larger contribution to the emitted
Intensity from chemical pumping in contrast io secondary effects, such as collisional
or stimulated transitions.
The lasing mechanism in this system is complex because three factors strongly
interact to generate the observed population distribution among the lasing levels: the
many chemical reactions (with some rates dependent on the states of vibrational excitation
of the reactants), collisional relaxation, and stimulated optical transitions. Below,
(v) we shall describe the result of CO spontaneous emission measurements, from
which it is evident that collisional relaxation is & dominant factor in determining the
intensities of lasing at the low vibrational transitions. The pulse
shape for a specified vibration/rotation transition is essentially

•
-62-
10
the same as the one for the total power, and a distinct cascading phenomenon, such as
(7) reported by Patel is not seen. The sequence of delay times for each vibration-
rotation laser pulse were also measured (see below) using the tuned cavity. These are
significantly different from observations made with a conventional cavity.
In summary, two types of voltage dependent lasing behavior were fo md. In high voltage
discharges the laser pulses are short, high vibrational and high J transitions are
favored, and the laser power decreases with increasing discharge voltage. In low
voltage discharges the delay times for the laser pulse are long, as is the duration of
lasing, and the power increases with increasing discharge voltage. The optimum laser
power can be obtained at an intermediate discharge voltage that depends on the CS
and 02 content. The discharge voltage for optimum lasing is higher with increasing
CS and decreasing O . However, the dependence on CS, is more sensitive than on O . * ^ 2 2
When the Og content is fairly high the optimum laser power is almost directly
proportional to the CS content. 2
Laser with Tuned Cavity
In order to eliminate the effect of stimulated transitions, oscillations for specific
rotation-vibration transitions were selected in the p;.vity with the aid of a grating.
These measurements were carried out moätly with 15 kV dischargts because the former
experiments suggested that under high voltage conditions the specus produced by the
discharge contributed directly to lasing.
Typical oscilloscope traces that show a sequence of delay times for lasing, as these
depend on the vibrational transition, for the selected rotational transition P(10), are
reproduced in Fig. 7 . Each transition starts with a sharp rise in laser output at a
distinct delay time r ^ .(J). The graphs in Fig. 8 show the dependence of r (J) v,v -i v,v-l '

-63-
11
on v—(v-1), and indicate the effect of added CO to the mixture. Also shown are the
estimated termination times for the corresponding iaser pulses. V, :s evident that the
addition of a small amount of CO has little effect on T ,(«!) for the initiation of lasine v,v-i e,
for v a 9, but produces progressively increasing delays, up to about a factor of two,
for the lower v's, down to v = 5. Depending on the CO content the intensities for the
lower transitions diminish. At a partial pressure of CO half of that of the initial CS 2
(0.04 torr) the effect is marked. Added CO also reduces »he duration of lasing for
transition from levels lower than v = 9 (Fig. 8 )thus accounting for the decrease in
measured total integrated intensities at P(9) for each vibraiional transition; the effect
is marked for transitions from vS 9, as shown in Fig. 9 . The decrement is monotonic
with the amount of gas added. This effect will be discussed further below.
At our operating pressures translation and rotation should be in equilibrium. To
estimate the rotational temperature, a small amount of HCi' was introduced to serve as
a tracer radiator. Then the relative emitted intensiües of rotational lines R(Ü) -« R(6)
of the fundamental vibrational band for HCf were observed. The HCi was at a partial
pressure of 0.14 torr, for a total operating pressure of 3.b torr. The deduced
temperatures were 440 and 450 K at 11.5 and 26,5 ^tsec, respectively, after a discharge
pulse with 15 kV. Correction for self-absorption was made by the method of
Ladenburg and Levy . These values are lower limits, because the added HC£ extracted
some part of the discharge energy. However, this temperature was used for the
analysis of the delay data and the CO fluorescence results. Considering the accuracy of
data and the approximations made, a temperature change of 5ü0K does not lead to
significantly different conclusions.

-64-
12
Measurement of Spontaneous Emission
The emission spectra at the CO fundamental were recorded
at selected delay times after the discharge pulse to establish the time
dependence of the population distribution for each vibrational level. The emission was
too weak to permit measurement of individual rotation-vibration lines, and the higher
vibrational transitions overlap appreciably. The monochromator slits were set so
that the equivalent triangular slit function had a width of 2.9 cm"1 at half-height, with
this low resolution the chemiluminescent spectrum appears as a smooth function
(except for noise). The spectrum was scanned slowly (^ 1 fim/hr,).
DATA REDUCTION
A computer program was written to calculate the expectod spectra for various
assumed distributions for comparison with the spectra recorded at the specified delay
times. The intensity of a vibration-rotation line (v», J'^v", J") for a diatomic
molecule is given by
4
I(V,J'-.v"fJ") = ^v'JV" J'^jVv'v" expf-B'JWJ'-^hc/kT] '3 O v' ' *
WV.VM ^rot v
where w,,^v,rj„ is the wave number of the lin«; cü,^,, is the wave number of the band
origin; Sj is the rotational transition matrix [S » (j'+i) for a P branch and S =J' J
for an R-branch line]; F is the vibration-rotation interaction factor; A is the v'v"
spontaneous emission coefficient for the vibrational transition (v'-v")- N is the
population in the upper vibrational level, and Q^ is the rotational partition function.
A rotational temperature of 450° was assumed. The wave numbers for the lines
were calculated from the molecular constants given by Mantz. et.al.(9)i values for

-65- 13
Ayiy. and Fj were given by Fisher1 and by Toth, et.al.(11), respectively. First, the
contribution from each vibrational transition to the observed intensity was calculated
when the monochromator was set at the wave number u^, using a triangular slit function
UCV.w.) = ^I^'J'-v-J")^,^), (4)
J'
where Nv, = 1 and v" = (v'-l). Since the slit width is much wider than the Dqppler line
width, the spectrometer transmission factor is the magnitude of the normalized slit function
at the line frequency. The summation was taken over the 90 P- and R-branch lines.
The observed intensity record was then represented by
I(aV = I^V,^) Nv, . (5) v'
The best set of relative Nv,'s that reproduces the observed Ifc^'s [which were measured at -1 ,
4 cm intervals over the rarge 2219-1691 cm"JJ was sought by a least square procedure
for v' = 1 ~ 17. The deduced sets of N^s were graphically smoothed. Figure 10 shows
three examples of the o'.served and calculated spectra.
The principal sources of inaccuracy in the above procedure are lack of a precise
rotational temperature, absorption by water vapor in the region of the higher vibrational
transitions, and overlap of the CO emission by that of OCS. The first was readUy checked
by recalculation, using 400 and 500oK as trial temperatures. The changes in the resulting
distributions were less than 10%. Regarding interference by water, the monochromator
was flushed with dry N2, while the light path of about 30 cm from the laser tube to
the spectrometer slit was lett open to the air. Absorption by water was slearly indicated.
Therefore, our deduced distribution at the high vibrational states v = 12 - 17 may be
somewhat underestimated. With respect to OCS absorption, Hancock and Smith(5) in their
study of the O + CS2 system found that emission by OCS did overlap the CO fundamentals

-66- M
However, we found that when a cell 10 cm in length filled with OCS at 1 torr was placed
in front of the entrance slit of the monochromator, no change in the spectrum was
observed. Hancock and Smith suggested that at most 1.5% of the CS is converted to
OCS in O rich mixtures. If the excitation of OCS is due to collisions with CO, 10 m
collisions require about 40 ßsec. Since the pressure of CO cannot exceed the initial
pressure of CS , which in these experiments is less than 0.05 torr, CO starts at zero and
increases exponentially following the initiation discharge pulse, at a rate of order
4 -1 (12) 10 sec . Hancock and Smith showed that the V-V collision probability between
CO in levels of v = 7 ~ 4 and OCS was of the order of 10" , but the above estimate of
the collision number include', collisions with CO in any state. Therefore, the contribution
of OCS emission to the spectrum cannot be large during the first 100 ^tsec after the
discharge. Were excited OCS generated directly, an overestimate of CO population at
v = 5 ~ 3 may occur depending on the rate of OCS formation.
In Fig. 11 the deduced relative population distributions (normalized to unity at v = 13)
are shown as a function of the delay time after the discharge pulse. At a delay of 23 /isec
a peak in the population appears at v = 11 or 12 and a minimum population occurs at v = 4.
As the delay time increases, the peak shifts to lower v values and the distribution becomes
more Boltzmann-like. Figure 11 also shows the initial distribution estimated
by graphical linear extrapolation to t = 0, together with the recent results of Hancock,
Morley and Smith.(6)
To obtain the rate of formation of CO, the observed relative populations in levels
v = 1 to v = 17 were summed; this is shown in Fig. 12. However, the population in the
v = 0 level ca not be observed by any emission measurement, and the relaxation process

-67-
15
produces a significant amount of CO in the ground state during the latter stages.
Therefore, we were forced to estimate CO(v=0) by a linear extrapolation from the
higher levels; this is subject to considerable uncertainty. The estimated total CO was
also plotted in Fig. 12 . The carbon monoxide accumulates exponentially as a function
of time,
[CO] ~ (l-e'1*) (6)
4 -1 where k = 2.3 x 10 sec , when the initial pressures of He, O , and CS are 3.1, 0.75,
and 0.046 torr, respectively and the discharge voltage is 15 kV. It is interesting to note
that the rate of decrease of [CS], as measured via absorption in the UV, follows a decay
(13) rate that closely parallels the growth of CO. Two types of the relaxation processes
deactivate the excited CO, V-V and V-T energ> transfers. The former is a near-resonant
exchange with a small amount of energy (equal to the anharmonicity defect) transferred
to the translational motion. This process very efficiently modifies the Initial distribution
(v) of CO generated in the reaction. However, the V-V process does not change the total
number of vibrational quanta produced by the reaction. In contrast, when V-T energy
transfers occur, the total number of quanta are reduced. The average number of
vibrational quanta for CO is estimated to be 6.0, which corresponds to 42% of the exo-
(v) thermicity of the pumping reaction: CS + O — CO + S. This average number of
quanta is retained during the first 60 usec after the discharge, and then gradually
decreases. Thus, prior to OO^isec, V-T relaxation is not as important as V-V relaxation,
which dominates. The decrement rate for the number of vibrational quanta after 60 jusec
3 -1 is about 4 x 10 sec , which is much larger than the spontaneous emission rate for
2 -1 v = 6—5 (1.61 x 10 sec ). V-T relaxation of CO in collisions with He or O is very
slow at room temperature, and therefore, the CO is efficiently deactivated either at the
walls of the tube or by collision with the active species such as O, S or CS.

-68-
16
Interpretation of r 's
As shown above, the total CO concentration increases exponentially to an equilibrium
value. Before relaxation processes become dominant the population of level v may be
expressed by Nv -^Nd-e* ), (7)
where N is the final concentration of CO, and<f> =k /Ek , the fraction of production V V y V
channeled to that level. The distribution of CO changes rapidly due to V -V relaxation
as shown in Fig. 11. For these experiments the partial pressure of CS was 0.05 torr,
and this limits the amount of CO that can be produced. An upper bound for the collision
5 -1 frequency between CO molecules is 4 x 10 sec ; this is an overestimate since CO
Increases gradually during the initial period of the reaction and reaches its maximum
value only when all the CS is converted. We recorded delay times of less than 20 ßsec, it
except for the lower vibrational transitions. The latter are involved in V-V relaxation,
because the addition of a small amount of CO affects significantly their delay times.
Hence laser pulses from 14—13 to 7—6 can be interpreted in terms of the initially
generated vibrational distribution. For these,collisional or radiative deactivation
processes other than the V-V relaxation cannot make an appreciable contribution since
the average vibration quanta of CO are conserved in the system during the first 60 jisec
after the discharge.
To deduce population ratios for adjacent levels from laser delay data an additional
assumption was made, that the loss in the laser cavity is independent of a small
change in the grating angle, which in the range of 7 . The theoretical gain for a P-
branch transition, (v,J-l)— (v-l,J) is:

-69-
17
0 3 4A 8ff c A ,
-.....,« ^ 3kT(2irkT /m)2 v,v-l
x J[N B exp f-F (J-l) ~] - N ,8 , exo f«P .(J) 7-=, } 1 (8) 1 v v L v kT v-1 v-1 ^ v-1 kT x '
where A ,= transition matrix element for v — (v-1) v,v-l
N - molecule density of CO in level v
m = mass of CO
T ■ translational » rotational temperature
2 2 P (J) = rotational term value for vibrational level v = B J(J+1)-D JfJ+l) v v v
For a sequence of transitions (v, J-l) — (v-l,J), with J fixed, the time dependent relative
gain after the discharge pulse, may be written in terms Eq. (7),
a .(J^const-A Jl-e"^) • pP B exP{'F (J-l)—}-p B , expf-F .(J)*-}]. (9) v,v-l v,v-l l v v v kT v-1 v-1 ^ v-1 kT * '
In the limiting case, as t —«,
oft \\n \in
a ,(J)-const.A f^o B exp{-F (J-l)-r;} - (p B , exp f-F ,(J) ~}I, (10) v,v-l v,v-ll^v v L v kT v-1 v-1 L v-1 kT^' x '
This is the maximum gain were the chemically produced excited species not to make
transitions to lower levels. Equation (9) simplifies to
«v^-l^'^v-l^X1-6^- <9,>
Laser oscillations start when the gain exceeds the cavity loss. Therefore, the delay
time T , (J) may be defined by v,v-l '
Tv,v-l(J)S'(lAMn[1■(L/av.v-l(J)), • (11)
where L is the loss in the cavity (equal to a at threshold). When a value for k is
available it is more convenient to work with the equation.

-JO-
IS
T AJ) » L/a" AJ) (12) v,v-l v,v-l x '
where T ,(J) s i - expf-kr ,(J)]. When relative values for adj.icentw 's are v,v-l v,v-l ^v
available one may compare T ,(J) with that of T , „(J): v,v-l v-l,v-2
lie lie T (J) A (0 /co ,)B expf-F (Jl)r--}-B .expf-F ,(J)rrr}
v-l.v-2v / v.v-1 v^v vvl/ v ^ v kT v'i V"1 kT Tv,v-l(J) Av-l,v-2 B .expC-F ,,(J-l)~) -((p J(p JB oexp{-F .(J)™] ' v-1 v-1 kT V--2 v--l v-2 *■ v-2 kT
Thus, once a population ratio for one pair of adjacent vibrational levels is specified,
the population ratios for other pairs may be derived.
Additional information on population ratios may be derived from the dependence of
T 1(J) on J. From Eqs. (10) and (12), the following relation is obtained for a fixed
vibrational transition at different J's ;
1/Tv. v-i(J) - ^ - ir1 i^exp < fFv-i^Fv(J'1)] iP • <14> ^v V
Relative values of l/T r (J) for P(3) to P(22) of the 12—11 transition for a range of v, v -i
population ratios ^/p at T = 450 K are plotted vs J in Fig. 13. Superposed on these XX x«
A 1
are l/T , from observed TS for k-^ 2.»6 x 10 sec . Although there is considerable v,v-l
scatter, on comparing the experimental points with the calculated curves best agree-
ment is indicated for (P11^0..o) in the range of 0.8 ~ 0.9. This range is consistent with XX XA
the value of 0.68 derived from the CO spontaneous emission measurements.
To estimate population ratios for this range of (0,,/01.,)'s, Eq. (13) was applied, XX Ifa
assuming 0.80, 0.85, and 0.90. The results are shown in Table I. They are
compared with the relative population distributions deduced from the spontaneous
emission measurements obtained in this laboratory and those reported by Harjock,
(13)

-71-
19
Morley, and Smith . The assumption «^/^ = 0.8 gives a population ratio for
KP/Vg) which »s negative; this is physically unacceptable. However, for
((pl/P12) = 0-85~ 0-9 the relative populations derived from the r values are in general
agreement with those from the spontaneous emission measurements, except for the
low v's, 7 ~ 5. As shown in Fig. 8 , for transitioas lower than 8 - 7 the
relatively long delay is significantly affected by added CO. Hence it is not valid to
assume that the population of levels lower than v - 8 are predominantly determined by
the chemical production step at a time when the laser begins to oscillate at these
transitions.
We may now compare the gain calculated from the distribution based on the
spontaneous emission measurements with the laser delay data shown in Fig. 8 . Though
fluorescence distributions have been recorded for only 5 different times after the
discharge, and these are not sufficient to permit unravelling of the entire history of the
gain for each rotation-vibration transition, reasonable estimates of the gam-time
relation can be made using eq. 8, since Nv is now a known function of time. The results
are plotted in Fig. 14a,b. The P(9) transitions of 13 -* 12 to 5 - 4 have positive gains
which initially increase with time, attain maxima and then decrease to negative values.
The gain for the 8 - 7 transition remains positive for the longest time, while that for
9 - 8 is largest. The gains for the 4 - 3 and 3 - 2 transitions are negativ 3 initially;
these increase to a positive value before decreasing again to become negative. From
Figs. 8 and 9, the maximum power appears at 10 - 9 and the laser duration is longest
for 8 - 7. Also, a short lasing duration was found for the higher transitions along with
short delay times, while the 4 - 3 and 3 - 2 transitions have long delay times.

-72-
20
DISCUSSION
Reaction Mcchanism
The data summarized in the preceding section suggest that the mechanisms for the
high and low voltage discharges differ to some extent. When the discharge voltage is
high the electrical energy is sufficient to dissociate most of the CS and the O , so that
an inverted CO population and hence lasing occur directly, i.e.,
e rCS ■:• S ft) CS -«• < y ' 2 LCS ■!- S - 102 kcal
(ii) O — O -!- O ~ 119 kcal
(iii) CS -:• O - COiV) + S •!• 85 kcal
The recently redetermined value for the heat of dissociation of CS , as measured by B
(14) Okabe , was used. In contrast, during low voltage discharges an inverted CO
population occurs subsequent to the initiation of a chain reaction. The principal steps
in the sequence are:
(ii) o2 ^ O + O
(v) (iii) CS + O — CO1 ' + S + o5kcal
(iv) O + CS - CS + SO -: 21.0 kcal ■
(v) S + O — SO + O + 5.6 kcal
(vi) SO v O -~ SO ♦ O + 12.5 kcal
(vii) O + CS - OCS + S + 54 kcal
(viii) S + CS - CS + S - 2.0 kcal
(ix) CS + O - OCS + O ■« 39.0 kcal
(x) SO + O + M — SO + M + 131.9 kcal
of these (vi), (viii),(ix) and (x) are of lesser importance; the chain is prorogated via (v).
. /

-73-
21
The argument for two types of initiation processes is supported by our observations of CS
absorption in the ultraviolet. Subsequent to a high voltage discharge the concentration of
CS decays exponentially approaching a constant value, while after a low voltage discharge
(13) the concentration of CS remains almost constant for more than one msec. The
latter indicates that CS is a reaction intermediate which attains a stationary state con-
centration, whereas in the former case, the deca> rate of CS agrees with the observed
Increasing rate of production of CO. Also, an optimum discharge voltage to generate
CS in |CS -:• He) mixtures was found, and this corresponds to the observed optimum
discharge voltage for laser power production. Apparomly, when discharge voltages
greater than the optimum are used CS decomposes to give species other than CS. The
experimental results on CS momionng in the UV and computer calculations of the reaction
kinetics will be presented in a later report.
(15) Recently, Rosenwaks and Yatsiv suggested that the reaction
(xi) CS* + O - CO(V) + SO + 91 kcal
contributes substantially to population inversion. Our observations of CS indicate that
a rapid reaction between CS and O does not occur since the concentration of CS (v-0.. .4) I
remains constant long after the end of the CO formation period, even with O present s
in excess. That the life-time of CS produced by the flash photolysis was not affected
by the presence of O was also reported by Callear ). The low probability for
(5i reaction (xi) was also discussed by Hancock and Smith '.
Comparison with Other Experiments
The only published data on the delay sequence for CO lasmg are those of Gregg and
(17) Thomas . They observed laser pulses in Hash photolyzed CS 0 mixtures using a
cavity with a grating and a rotating mirror and found two minima in delay times, those
associated with 13—12 and 10—9 transitions. This lead »hem to the conclusion that the

-74- 22
(v) CO was produced chemically as well as by collisions with electronically excited SO .
The latter part of their conclusion is in question. Hancock and Smith(i8) found only a
weak CO emission associated with the slow recombination reaction. SO + O - SO* 2'
Also, our observation of the correlation between the CS and CO concentrations shows
that the main source of CO is the reaction between CS and O. However. Gregg and Thomas'
T's are roughly in agreement with our results, except for our finding one minimum in the
delay time sequence at 12 — 11.
Literature reports on the effect of added CO on laser power suggest that the manner
of excitation may be an important factor. Pollack(,l9) who initialed lasing in [CS -K) +He]
mixtures by flash photolysis, and Arnold and Kimbel!(,20) who used -n axial spark discharge,
found that the addition of CO to the mixture decreased the output power. On the other
hand, Suart, Arnold and Kimbell(2l) observed enhanced lasing when ihey added cold CO
to a CS2/He flow, and mixed It with discharged oxygen; the same result was reported by
(21a) Foster . They attributed this effect to an increase in the population inversion
density through selective depopulation by V-V exchange of the lower vibrational states
produced via chemical excitation, by the ground state carbon monoxide. Similarly,
(22) Jeffers reported a factor of two increase in power in a transverse flow configuration
when he added CO to the CS flow and subsequently mixed these with discharged
[02 + Hö], A positive effect due to carbon monoxide was also reported by Searlea and
(23) Djeu in a CSg/Og flame laser. Our experimental configuration is similar to that
used by Arnold and Kimbell and we found that the addition of CO to the mixture resulted
in a decrease of laser power both in grating tuned and in conventional cavities.
Figures 9 and 15 show the results for the former and the latter cases, respectively. In
these experiments the added CO might be excited by the pulsed discharge, but the
population In the higher levels would be smaller t' in in the ground state by several
orders of magnitude. This is suggested by experiment and by theoretical predictions(24,25)

-75- 23
Our observations on the effect of added CO may be qualitatively correlated to the sub-
stantial production of CO(V^7) via reaction (iii). For an initial distribution such as
shown in Figure 11 the chemically unexcited diluent merely raises the relative popu-
lation in the low v states to produce a distribution with a shallow minimum, one that
resembles a somewhat relaxed system. This accelerates relaxation to an equilibrium
state and accounts for the observed shortening of laser duration for each transition,
as shown in Figure 8. Ml
Recent measurements of relative rates for (iii) by Hancock, Morley and Smith f.nd
by Foster^21^ provide no information for vibratlonal levels v < 6-, where their data
overlap ours the agreement is good, particularly with the latter, n view of the assigned
error limits. H.M.&S. made two types of measurements. In one tLey estimated the
stationary distribution of CO(V) in a flowing [CS2 + O] mixture. The recorded light
Intensities were interpreted in terms of specific chemical excitation rates, using the
relative spontaneous emission intensities and colllsional relaxation rates. They
indicated the possible presence of large errors in the rates for v< 7, because the latter
were given by the difference between deactivating rates of CO from v to lower levels,
and from higher levels to v. In their second method they directly monitored the popu-
lation of excited CO(V) in flash-photolyzed [CS2 + 02 + Ar] mixtures, using the CO cw
laser lines 20 — 19 to 5 -* 4 transitions as a light source. Though the concentration of
CO Is of the order of 10"3 torr, the observed distribution at 50 fisec after the flash is
determined by both the chemical production rate and V-V relaxation. Extrapolation to
zero time shows <p and a. m 0. In our measurements of CO emission the scanning time 4 5
of the monochromator, which required 2 hrs. to cover the CO fundamental region,
limits the integration time of the signal, and the signal-to-noise ratio is not as good as
desired for the v. ^ak bands. The lovw transitions, with small radiative transition

-76- 24
probabilities, do not overlap each other as much as do the higher transitions. In any case
the observed spectrum is quite different from the one calculated using the distribution
given by Hancock, et.al., as seen from Fig. 10(c). In this respect, an interesting analysis
was presented by Dawson and Tam( ' who calculated the stationary vibrational state
distribution of CO, including chemical formation of CO in each level, V-V and V-T
energy transfers, spontaneous radiation loss, and removal of CO by pumping. They could
explain the two sets of experimental CO distributions reported by Hancock and Smith' '
by using the initial formation rates proposed by Hancock, Morley and Smith^. However,
the results of Arnold, et.al. which requhed a distribution with a large rate of CO
formation was difficult to simulate without assuming CO formation in the low levels.
Since the distribution with a high formation rate of CO should be more sensitive to the
form of the Initial distribution of CO, this conclusion supports the Initial formation rates
(V) of CO given by our experiments. Note that the analysis by Dawson and Tam was
made on the basis of calculated V-V rates according to the modified SSH theory, which
leads to rates for the low v levels that are smaller by a factor of about 6, than
those of Hancock and Smith, or the ones estimated from the Sharma-Brau theory. There-
fore, the conclusion derived by Dawson and Tam requires further analysis.
When the chemical reaction is initiated by a discharge the initial conditions may
differ significantly from those la (O + CS ) flow systems. We acsumed that the plasma
state disappeared within about 1 ßsec, since the half-widfh of the current pulse was
about 0.3 ^sec. However, ionic or electronically excited species with lifetimes longer
than 0.3 jisec might contribute to the formation of CO by reactions, such as
CS+ + O — CO + S+; CS+ + O — CO+ + S, or CS* +0 — CO + SO, etc. ■
Vibrational states of CO in up to v = 17 were seen in the present system. The
relative populations at v = 13 - 17 agree well with those based on the flash-photolyzed

-77- 25
(CS + O ) mixtures as reported by Hancock, et.al. Using the new value for the
heat of formation of CS^ \ the exothermicity for (iii) is 84.6 kcal/mole; this permits
excitation to v = 15. However, as suggested by Hancock, et.al., CS is also vibrationally
excited since CS In levels v = 0 ~ 4 were dettected in our U.V. absorption experiments
with a vibrational temperature of about 12000OK( '. If the vibrational energy of the CS
can be converted to that of CO, CS(v=4) can supply 14.6 kcal extra and the v = 16 level
for CO can be reached.
SUMMARY
(1) In the pulse initiated [CS + O + He] laser system there is an optimum discharge
voltage for maximizing laser power. The optimum voltage is higher for mixtures lean
in O and rich in CS„. The maximum power of the laser is proportional to the CS content 2 2 ■
in O -rich mixtures.
(2) When the discharge voltage is higher than the optimum, CS and O are generated
by dissociation of the reactants in the discharge, and these are directly involved In the
lasing reaction [O + CS — CO + SJ. When the discharge voltage is low, a chain
reaction is initiated.
(3) The delay sequence of laser pulses for each vibrational transition was recorded
using a grating cavity. The minimum delay occurs for the 12 — 11 transition, with
longer delays for both the higher and lower states.
(4) The time-resolved emission spectra of CO[v — v-l] fundamentals were observed
(v) in order to deduce the vibrational distribution of chemically generated CO . The
distribution at 23 jisec subsequent to the discharge pulse shows a maximum at v = 12,
a minimum at v = 4, and a population that increases toward lower v.
(5) The relative population for each vibrational level In v = 14 ~ 5 was calculated
from the laser delay data; the results were found to be consistent with those obtained
1

-78-
from the CO spontaneous emission measurements. Also, from the time-history of
the vibrational distribution one can predict qualitatively the power and the duration of
the lasing pulse for each vibrational transition. These agree with observations.
(v) (6) The shape of the normalized nascent CO population distribution [Fig. II]
suggests the presence of two mechanisms for the generation of vibratlonally excited
ly) CO, but it is not known which reactions other than [O + CS — CO + S] contribute to
the populations in these lower levels for pulse-discharged [CS + O + He] mixtures. 2 Z
ACKNOWLEDGEMENTS
This work was supported by the Advanced Research Projects Agency of the
Department of Defense and monitored by the Office of Naval Research under Contract
No. N00014-67-A-0077-0006.

-79-
27
REFERENCES
1. H. S. Pilloff, S. K. Searles and N. Djeu, Appl. Phys. Letters, _19, 9 (1971).
2. A. B. Callear and I.W.M. Smith, Nature, 213, 382 (1967).
3. A. A. Westenberg and N. cfeHaas, J. Chem. Phys. 50, 'O? (1969).
4. I.W.M. Smith, Trans. Faraday Stc, 64, 378 (i96ö).
5. G. Hancock and I.W.M. Smith, Trans, Faraday Soc., 67, 2586 (1^71).
6. G. Hancock, :. Morley and I.W.M. Smith, Chem. Phys. Letters, 12, 193 (1971).
7. C.K.N. Patel, Phys. Rev., m, 71 (1966).
8. R. Ladenburg and S. Levy, Z. Physik, 65, 185 (1930).
9. A. W. Mantz , E.R. Nichols, B. D. Alpert and K. N A&o, J. Mol. Spectres.,
35, 325 (1970).
10. G. Abraham and E. R. Fisher, Report from Wayne State University, RIES 71-39,
October 1971.
11. R. A. Toth, R. H. Hunt, and E. K. Plyler, J. Mol. Spectres., 32, 85 (1969).
12. G. Hancock and I.W.M. Smith, Appl. Optics, 10, 1827 (1971).
13. Our unpublished work.
14. H. Okabe, J. Chem. Phys., 56, 4381 (1972).
15. S. Rosenwaks and S. Yatsiv, Chem. Phys. Letters, 9, 266 (1971).
16. A. B. Callear, Proc. Roy. Soc, A276, 401 (1963).
17. D. W. Gregg and S. J. Thomas, J. Appl. Phys., 39, 4399 (1968).
18. G. Hancock and I.W.M. Smith, Chem. Phys. Letters, 3, 573 (1969).
19. M. A. Pollack, Appl. Phys. Letters, 8, 237 (1966).
20. S. J. Arnold and G. H. Kimbell, Appl. Phys. Letters, 15, 351 (1969).
21. R.D. Suart, S.J. Arnold and G.H. Kimbell, Chem. Phys. Letters, 7, 337 (1970).
21a. K. D. Foster, J. Chem. Phys. 57, 2451 (1972).

-80- 28
22. W. Q. Jeffers, Appl. Phys. Letters, 17, 67 (1970).
23. S. K. Searles and N. Djeu, Chem. Phys. Letters, 12, 53 (1971).
24. J. W. Rich and H. M. Thompson, Appl. Phys. Letters, 19, 3 (1971).
25. W. Q. Jeffers and C. E. Wiswall, IEEE J. QE, QE-7. 407 (1971).
26. P. H. Dawson and W. G. Tamm, Can. J. Phys., 50, 889 (1972).
27. R. D. Suart, P. H. Dawson and G. H. Kimbell, J. App. Phys., 43, 1022 (1972).

-81-
TABLE I
Relative Populations of CO Vibration.'»! Levels
Laser Delay Measurements Assumed
^11^12 0.9
17
16
15
14
13
12
11
10
9
8
7
6
5
4
3
2
1
0 /p (p v-1 v \
1.07
0.93
0.90
0.88
0.89
0.88
0.87
0.90
0.89
0.87
0.93
1.00
0.93
0.81
0.75
0.66
0.58
0.50
0.45
0.39
0.35
0.85 0.8
*v-l *V P.
1.06 0.51 1.02
^v-1 vv
0.90 1.00
0.85 0.90
0.83 0.77
0.81 0.64
0.78 0.51
0.73 0.40
0.72 0.29
0.60 0.17
0.29 0.05
0.015
0.87
0.80
0.75
0.69
0.55
0.18
-2.9
P.
IR Emission Measurements
this work Hancock, et.al. (b)
«P.
0.98
1.00
0.87
0.70
0.52
0.36
0.20
0.036
0.13
0.30
0.49
0.72
1.00
1.03
0.90
0.80
0.71
0.62
0.65
0.61
0.57
0.60
0.91
120
2.10
(a) Derived from O + CS system
(t Derived from flash-photolyzed CS + O 2 2
<P (a)
1.00
0.87
0.80
0.66
0.61
0.27
~0.06
<P
0.18
0.32
~0.2 0.58
0.64 0.90
1.00
0.85
0.65
0.55
0.41
0.32
0.17
0.05
. /

-82-
LEGENDS FOR FIGURES
Figure 1. Schematic for tuned laser intensity measurements.
Figure 2. Signal profiles as a function of discharge voltage and O content.
Time progresses from left to right.
(a) Abscissa 200 jusec/cm; ordinate 0.2 V/cm.
(b) Abscissa 100^sec/cm; ordinate 0.2 V/cm.
Figure 3. Signal profiles as a function of He content.
Figure 4. Integrated power dependence on O partial pressure.
Figure 5. Dependence of delay times on operating conditions.
Figure 6. Integrated laser power outpul^as a function of vibrational level,
normalized to peak value; CS2 0.017 torr + O 0.68 torr + He 1.7 torr.
Figure 7. Change of time delay for initiation of P(19) laser pulse, as a function
of vibrational level (abscissa: 20 ^sec/div; ordinate for v = 13 ^ 12
through v = 6 — 5 transitions: 0.01, 0.05, 0.05, 0.02 V/div.)
Figure 8. Time history of P(9) lasing line, for no added CO (a); 0.016 torr CO
added (b); 0.032 torr CO added (c).
Figure 9. Dependr nee of Integrated power for P(9) on vlbrational transition and
the amount of added CO. [Conditions same as in Figure 8. J
Figure 10. Observed (O) vs calculated (T) [via eq. 5] superposed spectral intensities
of CO spontaneous emissions: 0.045 torr CS + 0.76 torr O +3,0 torr He; 2 2
15 kV discharge; (a) 23 ßsec, (b) 148 jitsec after the discharge pulse,
(c) calculated spectrum on the basis of Hancock, Morley and Smith
distribution.
Figure 11. Normalized vibrational population at selected delay times.

-83-
Figure 12. Total population, total excited state population, totil vibrational quanta
(v) and average quanta per CO , as a function of time. The experimental
data are from Figure 11.
Figure 13. Dependence of l/T,. ,,(J) onp ratio. The observed (O) were normalized 12-»11
to the calculated curves at P(ll).
Figure 14. Relative gain vs time after initiation, measured at P{9) for various
v—(v-1). Derived from e^)erimental data. Fig. 11.
Figure 15. Dependence of total integrated power on the amount of CO added,
for various discharge voltages.

-84-
(For total power measurement) JPrcT
ifOSL , Trap &
Au-Ge(p PumP
, , cjai.R. filterj
gas mixture Manometer*—I |
JFiitefT ^o—U^i . K7703
AW^ Amp L!^^—^( 1 k H '
Grating or mirror
I, R.« Filter Au-Ge
Mono chromator
PE 88G
0 Trigger».
Gate»-
-• Signal
Vert out
i Pulse Stretcher
H.V. Supply H.V. Trigger
Pulse Generator
6 Hz
Oscillator
»Signal Ref i
Lock-in-amplif ier
PAR 120
Speedomax recorder
1 mv span
FIGURE 1. Schematic for Tuned Laser Intensity Measurements

-85-
discharge Voltage
7Kv FIGURE 2a
CS2 0.018 torr
10 O 0.037 torr
He 1.86 torr
13 Total 1.91 torr
Reproduced from §Km best available copy- ^g^
Discharge Voltage
7Kv
10
12
cs2
02 He
FIGURE 2b
C.018 torr
0.36 torr
1.73 torr
Total 2.16 torr

-86-
FIGURE 3
0.02 torr
0.85 torr
0 torr
20Hs/div
10 Kv
(b)
cs?,
0.02 torr
0* 0.6 torr
He 3.1 torr
20ps/div
10 Kv
Reproduced from best available copy.
ms *■ i ■,■■■-■, ,
.-■ ;.J,,.,Jl,V.-"->--i^*'-'<»' .ik,%lbi*. y'
(c)
c^ 0.02 torr
02 0.6 torr
He 6.6 torr
20/is/div
12 Kv

-87-
Pressures (torr)
CS2 02 He
0 *l A «2
.017
.017 .68 1.69 .35 1.75
D «3 • «4 ▲ 5 •
•
• o
oo
00
00 0
0 .18 1.76 .11 1.81 ,018 1.82
8 9 10 II 12 13 14 15 Voltage (kV)
Fig. 4 Integrated power dependence on 02 partial pressure.
1

t -88-
100
0) Q
10
02 0.86 He 1.7
I
CS2 0.034 torr he 2.4
Discharge Voltages
7KV
o-o 9
N^ 15
I Discharge Voltage
1 CS2 Dependence O2 Dependence
I 1 1 1 i mi 1 1 II N ".' 0.01 .02 .04 .07 0.1 0.2 0.4 0.7 1.0
Partial Pressure of Ggor CSg (torr)
Fig. 5 Dependence of delay times on operating conditions.
/■'
. /

-89- I
10
"5) 9 >
o 8 0)
CC 7 -i 0 ^*M^ 3 6
i > • > 5
Q.
Kl^4 ii >* 3 ■» 0) c 2 0)
Ä I-
O 12 KY ■ 9 kV A 7 kV
(O W 3 O <J> 00 N i I T I I I I
^- ro cvi — O <j) (D
40 lO ^ tO CM ^
I I I I I I N «0 IO ^ "> ^
Transition: v-^lv-l)
Fig 6 Integrated Laser power-output as a function of vibrational level, normalized to peak value; CS2 0.017 torr + O2 0.68 torr + He 1.7 torr.

-90-
P(10)
13-12
12-11
10—9
6-5
FIGURE 7. Change of time delay for initiation of P(ll')
laser pulse, as a function of vibrational
level (abscissa.: 20^s/div; ordinate for
v = 13—12 through v = 6—5 transitions:
0.01, 0.05, 0.05, 0.02 v'div).

-91-tL
14-13
13-12
12-11
11-10
10-9
9-8
^ 8-7 T 7-6 >
6-5 f > 5-4
4-3
3-2
2-1
1-0
initiation of laser pulse
end of laser pulse
.032 torr-^
.016 torr with CO
without CO
CSz 0.04 torr O2 0.81 torr He 3.2 torr
0.0
x 40 80 120 160 200 240 280
Delay in^isec
FIGURE 8. Time history of P(9) lasing line, for no added CO(a); 0.016 torr CO added (b); 0.032 torr CO added (c).
- / ■

-92-
14-13
13-12
12-11
11-10
10-9
C 9-8|-
> 8-7
i7-6h 6-5
5-4
4-3
3-2
2-1
- -^
"^ ■^ •^^ ̂
^^S^fc.
-
.032 torr
r—
^^^ •
- (c)^
s' r (b>'' withCO^-^
*'' s^*^ *
(*y ^without CO
j
i i I i i i J 1 i 1 i 1 i
100 200 300 400 500 600 700
Power (orb. units )-•*
FIGURE 9, Dependence of integrated power for P(9) on vibrational transition and the amount of added CO. [Conditions same as in Figure 12].

• I
I '
(0) vs Calcu g. 10
Observed Inlensitiqs for assumed
ated (t!
. ' 1 Population D istr butions
i H
I
: i
i i
i i
! i
'c)
*► i
i ,
i I
! i I
i '
: I
J..
I I
I .il
I ! I !
ii
" \\
■ 1
• r . j
I b)
i i i ■
i .-
el
■A
i i
S i
i i
i i
-1
4 i
i i i »
JIJ
.1 .
I I
a),
j i
i
'. !- I I
tit Kill
Reproduced from fln best available copy, giy

-94-
5.72 Fig. ii Normalized vibrational
population at selected delay times. [Experimental conditions are the same as in Fig. 15] .
c o
3 Q.
£
N
S 2
Extrapolated to fO j/slmetti
i i LJL I I I I I I 2 3 4 5 6 7 8 9 10 II 12 13 14 15 16 17

-95-
200
150
en
Total population
Total excited state population
Total Quanta
Mean Quanta
7
6 a>
248 -J
100 200 Ti me (/is) After Initiating Pulse
Fig.i2 Experimental data from Fig. 15
J I 300
5 o (/)
4 3 o
c 2 5
3 ■ o i c
o a>

♦ 0
II
-96-
>
x O I -
(T> CONlDiO
ddddd
.t
0) w 0)
O
C '5
0) > w. 0) 0)
JO o
— ^ <u
c O TJ
3 o
' O CSI o
0)
O O
o ^ C 0) Q) IM
IB S! 0) o O c
J
d»
— O <^ co |v. co ip sr rq CM — --ddööooooo
(r)11-31!/1
. /

-97-
lOOi-
200 300
Fig. 14a Relative gain ys time after initiation , measured at P(9) for various v-Hv-l) Derived from experimental data , Fig. 15

-98-
lOOn
c O O
5—4
4—3
/Msec i 300
Fig. i4b Relative gain ys time cfter initiation, measured at P(9) for various v-*(v-l) Derived from experimental data , Fig. 15

-99-
o ooo
^j COOO
■ oa<i«
0) Wfl) oo I
cc/s
cc
/s
0 o
OJ O 0 diricvi
^v
i_J \ I I I L J L
IO
ro
CM |>
— 2 o >
o>
00
OOOOOOOOOOQ O 0> 00 N 0) ^ ^ ro CM —
0)
c o
go a o o 1
(P9Z!|DUJJ0U) JSMOd lopi

-100-
C. Studies of the 0 - C-H. Reaction (R. A. M-Farlane) 2_2 _
The reaction of atomr oxygen with acetylene can lead to the production
of vlbratlonally excited carbon monoxide via either or both of the following
reactions.
0 + C-H» -► CH- + CO* + 51 kcal/mole (D
0 + CH. -*■ CO* + 2H + 71 kcal/mole (2) 2
It has been the purpose of oui studies during the past period to determine
whether as a result of the reactions a population Inversion exists between
vlbratlonally excited levels of the CO ground electronic state. A chemical
laser based on this reaction and operating In the 5 u spectral region would
have significant advantages over present systems In regard to fuel costs
and greatly simplified handling of both fuel and reaction products.
Our report for the previous period described the atomic oxygen source
using a 1 kw, c.w. magnetron and described our measurements on atom
concentration available for our studies of the above reactions. The
accomplishments of the present period are discussed In detail In the
accompanying papers which have been published or submitted for publica-
tion.
Measurements of Vlbratlonal Population Distribution
Following the Injection of acetylene Into the fast flowing stream
of atomic oxygen (typically 10 mole/sec) observation was made of
the first overtone emission from the chemically formed carbon monoxide
in the spectral range 2.3 - 2.8 microns. Scans were made using a one-half
• ;

-101-
meter monochrometer equipped with a room temperature ^bS cell and the
system sensitivity was measured using a 600oK blackbody source.
A computer program was set up to produce a synthetic spectrum using
as Input parameters the vlbrational populations and the ^c.atlonal
temperature. The program Included the spectroscoplc constants of the CO
molecule, the system sensitivity and the spectroscoplc slit function. The
input parameters were adjusted to give a synthetic spectrum which
matched the observed scan and by this means it was possible to determine
the relative populations of levels v - 2 to v ■ 14 under a wide variety
of reaction conditions. With the large amount of Helium diluent used the
rotational temperature was typically though not always very close to
300oK.
At low fuel levels corresponding to low concentrations of chemically
formed CO, a near Boltrman distribution of population was observed correspond-
ing to a vlbrational temperature of approximately 8000oK. As the fuel level was
Increased the effect of the Treanor pumping mechanism became apparent
whereby low vlbratloaal levels were found to have a local vibrational
temperature of 3500oK and the higher vibrational levels, v - 5 to v - 14
a local vibrational temperature as high as 14000oK. This latter value
is typical of that found in electrically excited CO lasers and is adequate
to provide a partial inversion on P branch transitions of J > 20.
Studies were mace of the effect on the vibrational population of
adding cold CO premlxed with the C H fuel. The process
CO(v-O) + C0(v) -►CO(l) + CO(v-l) (3)

-102-
can be expected to dramatically modify the distribution where the probability
for this one quantum exchange is large. At a temperature of 300oK this
probability is largest for small v and peaks near v - 3 - 4. The addition
of 0.1 torr cold CO resulted In a very high but positive local vibrational
temperature for levels v =* 5 and v = 6 while the addition of 0.2 torr cold
CO resulted in a total vibrational Inversion for levels v ■ 5 to v - 7.
There are therefore two different regimes in which the oxygen-acetylene
reaction could be employed for laser purposes.
1. High fuel condition - taking advantage of Treanor pumping
to populate high v levels.
2. Preferential V-V relaxation of lower vibrational levels in a
time short compared with V-T processes.
/

VDIIMIU- 14. nitmbot ClllMKAl. I'llYSKS LIFTERS 1 July 1972
TOTALLY INVERTED VIBRATIONAL POPULATION OF CO FORMED IN THE REACTION OF OXYGEN WITH ACETYLENE t
School oj Electrical hngi:
Y.S. LIU, R.A. McFARLANE and G.J. WOLGA 'ring, Laboratory oj Plasma Studies and Materials Science Center. Cornell University.
Ithaca, New York 14850, USA
Received 15 March 1972
Infrared dicmiluminescence Irom the reaction o! atomic oxygen with acetylene was -itudied tor CO laser applica- tion. A totally inverted vibrational population between c = 5 and v = 7 was obtained by preferentially relaxing the lower vibrational levels with added cold CO. Treanor pumping at high fuel flows was also observed.
In this letter we report the first observation of a to- tally inverted vibrational population distribution in carbon monoxide formed in the chemical reaction ot" oxygen with acetylene. It is apparent from the results that this reaction is potentially valuable for use in CO laser applications.
The primary reactions are [ 1)
0 + C2H2 -»CO + CHj + 51 kcal/mole,
0 + CH2 -► CO + 2H + 71 kcal/mole (1)
for low fuel flows. These reactioi.: are sufficiently en- ergetic to permit the excitation of vibrational levels in CO up to v= 14. Previous studies [2j have found that as a consequence of the anharmonic nature of the mo- lecular potential the relative populations in higher vi- brational levels can be increased through intramolecular V-V energy transfer, producing a highly non-Boltzmann distribution. In the present work, advantage is taken of the V-V energy-transfer process
CO(v) + CO(v=0) - COiv- 1) + CO(i'= 1) + Av.
Calculations [2,31 of the probability 01 this process
f Research supported by the Advanced Research Projects Agency and monitored by ONR under Contract N000I4-67- A-0077-0006, and also through the Materials Science Center, Cornell University.
show that it peaks between v=4 and v=b for tempera- tures between 300 and 700oK, decreasing only slight- ly as resonance is approached with decreasing v and falling off much more rapidly at higher values of v. It has been possible therefore with the addition of cold CO to the reaction to significantly depress the popula- tions of levels i» < 5 and provide a total vibrational in- version between v=S and i'=7.
Using a fast flow system, IR chemiluminescence of CO* was measured in the fundamental and the first overtone emission regions. Atomic oxygen at flow rates in excess of 10"4 mole/sec was produced in a micro- wave discharge, the concentration being established by titration with N02. Acetylene wi.s injected radially in- to a teflon reaction tube 3/8 inch i.d. and 18 inches long. The system was pumped with a 100 c.f.m. blow- er backed by a model I397B Welch mechanical pump. A linear flow speed of greater than 80 m/sec in the mixing zone was measured under typical cofiditions.
Emission from the reaction products was monitored through NaCI windows in the side wall of the reaction tube. A silicon lens focused the light from a small re- gion in the reaction zone, through a chopper, onto the entrance slit of a 1/2 meter Jarrell-Ash Dbert mono- chromator, equipped with a 105 1/mm grating blazed at 8.6 microns in first order. A room-temperature PbS photoconductive detector was used for the overtone measurements and a liquid-nitrogen cooled Au-Ge de- tector for observations in the fundamental region. The
559
-IPS

Volume 14, number 5 CHEMICAL PHYSICS LETTERS 1 July 1972
detector output signal was amplified by a Keithley Model 103 low-noise amplifier and a Princeton Applied Research Model JB-5 lock-in amplifier. Spectra were recorded on a linear strip chart recorder. The entire optical path was Hushed with dry nitrogen to minimize .ibsorption by atmospheric carbon dioxide and water vapour.
A broad-band emission of substantial intensity throughout the region of the CO fundamental made it difficult to determine the vibrational populations from the fundamental emission. The first overtone emission spectrum between 2.3 and 2.8 microns was distinct however and permitted the deiermination of the rela- tive population distribution by a method described by Karl et al. (4). A computer is used to generate a simu- lated spectrum to compare with the experimental scans. It accounts for the instrumental sensitivity vari- ation as a function of wavelength, the spectral slit width, the tinstein A coefficient of each upper level and the molecular spectroscopic constants. The rota- tional temperature and the relative population of each vibrational level are adjusted to obtain a match be- tween the synthetic spectrum and the experimental scan.
Fig. I shows the vibrational population distribution of CO* at a time approximately 100 microseconds after injection of the acetylene. The distribution did not alter appreciably for observations made several centimeters downstream. An addition of cold CO [5] to the fuel dramatically modifies the vibrational dis- tribution leading to a total vibrational inversion wit i 0 2 torr CO added to the acetylene. The data have jeen plotted taking account of relative signal levels under different conditions of added cold CO. The data is clearly consistent with the peak in the V-V exchange probability predicted to be near ^=5 although no at- teii, ,5t has yet been made to set up a comprehensive motel which includes reactant mixing, the detailed chemistry, V- V and V-T relaxation and radiative decay. Our observations at fuel Hows six times that of fig. 1 but without the addition of cold CO show clear- ly the effects of V- V pumping predicted by Treanor et al. (2|. The vibrational temperature of approximate- ly 8000oK which characterizes the Boltzmann distribu- tion of population at very low fuel levels becomes mod- ified at high fuel levels. A local vibrational tempera- ture of approximately .^SOO^K was determined for levels i'=2, to i»"4, while for levels v=b to v= 14 popu- lations were characteristic of a I4ü00
OK vibrational
temperature. This latter value is typical of electrically 561)
I o
o i-
CD
(£ t-
c ,0.1
o < _i
2 UJ >
_ \ \
.01
1
\\ o
^
_i i I I I 1_ ^L 2 3 4 9 6 7 8 9 10 II 12 13
VIBRATIONAL LEVEL
li)!. 1. Relative vibrational population distribution of CO*. Pressures: C2 H2 0.05 lorr. Oj 0.68 torr. He 1.67 torr. Temperature rrot = 150°K, IC2H2) = 0.2i X 10-4
mole/sec, |Ö| = 1.7 X 10 4 mole/sec. c Without addi- tion^i cold CO. n 0,05 torr additional cold CO, A 0.1 ton additional cold CO • 0,2 torr additional cold CO,
excited CO lasers which operate under conditions of partial inversion.
It is apparent that both modes of operation are po- tentially useful for CO laser application. Since the re- action rate of oxygen with acetylene is greater than that for the reaction of oxygen with carbon monoxide the above results also suggest a free burning flame laser in which a mixture of acetylene and carbon mon- oxide is burned in an oxygen atmosphere.
References
111 D.M. Creek, CM Melliar-Smith and N. Jonathan. J. Chem. Soc. A(1970)6t6.
|2| C.E. Treanor. J.W. Rich and R.G. Reh• 1, J. Chem. Phjs, 4811968) 1728.
|3| W.Q. Jelfcrs :ind J.I). Kelley. J. Chem Phys. 55 (1971» 4433.
|4| G, Karl. P, Krausand J.C, Polanyi. J, Chem, Phys, 46(1967) 224,
(51 G, Hancock and I,W,M, Smith. Appl, Opt, 10(1971)1827.
/?'/

-105-
Measurement of V-V Energy Tranafer Probabilities In CO-CO Collisions
The population data obtained upon the addition of cold CO to the
system were used to determine the V-V energy exchange probabilities of
process (3) for excited vlbratlonal levels v " 3 to v ■ 9. Under the
conditions of the experiment the volumetric pumping rate greatly exceeded
all other loss processes for a given vlbratlonal level population. This
permits the series of coupled steady state equations describing the
population densities to be uncoupled and the collislonal deactivatlon
rate due to added cold CO to be determined separately for each vlbratlonal
level. The detailed analysis Is discussed In an appended paper.
Ret- lonably good agreement Is obtained with data reported by Hancock
and Smith in studies of the CSj-O- reaction and under very different
flow conditions. The "Fast Flow \pproxlmation" used in the present study
substantially simplifies the analysis of the data and avoids uncontrolled
wall effects and others which would complicate the interpretation.
Calculations were made, following the work of Caledonia and Ceater,
of the V-V exchange probabilities for single quantum exchange in collision.
Both long and short range interactions are Included in the calculation and
data is now available over a sufficiently wide range of vibrarional levels
tu indicate that both contributions are required to correctly describe the
collislonal process. Good agreement was obtained with our experimental
measurements and those of Hancock and Smith.
A Time-Dependent Solution of the Kinetic Equations for the Vlbratlonal Populations
For the system under study it is necejsary to provide some redistributicn
of vlbratlonal energy in the carbon monoxide before conditions of total or

-106-
partlal Inversion maintain. This process is a dynamic one and for laser
applications it is necessary to know at what time optimum population
conditions occur. A computer solution was obtained for the coupled
equations describing the population densities for each vibrational level
ss a function of time. This is discussed in detail in an appended paper.
The mixing and chemistry are assumed to be very rapid and the model
includes all single quantum V-V energy exchanges, V-T energy exchange
and spontaneous radiative decay.
The results of calculations demonstrate the preferential deactivation
of low v levels discussed above as well as the Treanor pumping of high v
levels. In generr.l it is found that the populitions relax through a series
of non Bolczmann distributions and at long times the populations do indeed
approach a Boltzmann distribution.
Using as initial conditions those for the experiments on the effect
of adding cold CO to the fuel, it was possible to reproduce the observations
that 0.1 torr added cold CO gives an increased but positive local vibrational
temperature while 0.2 torr leads to a total vibrational inversion.
The computation was used to study the time development of CO population
using results for the initial population distribution from the CS2-02 reaction
determined by Hancock and Smith and by Tsuchiya, Nielsen and Bauer. Only
preliminary calculations have been made to date but it is clear from
comparing them with the experimental time development data reported by
the Cornell group, that substantial populations in v » 0 and v - 1 are
needed to reasonably simulate the time development found. The modeling for
this system described in the appended paper shows an overall time development
which is somewhat too slow compared to experiment and appears to underestimate
the magnitude of Treanor pumping which is operative.
•

-107-
To accurately describe any of the systems where the computation might be
applied it is clearly desirable to include chemical reactions as time
dependent contributors to the populations. Using known or estimated
reaction rates this represents a trivial extension of the present program.
Recent calculations of multiple quantum V-V processes by Dillon and
Stephenson will be included in future computations.
Continuing Activity
In addition to the elaboration of the computation discussed above
work is in progress to set up a laser Iased on the O-C2H2 reaction and to
carry out parametric studies of its performance. To this end we have:
a) Begun the installation of a 2000 cfm. blower system to provide
an order of magnitude increase in pumping capacity over that
now being ustd. This will be used to permit operation of a
transverse flow laser system.
b) Constructed a c.w., grating tuned CO laser for diagnostic
studies of both the present linear flow system and the
planned transverse flow system.
c) Constructed an electronic system for differential gain and
loss measurements on any chemical laser system of interest.
Two pyroelectric detectors are employed and normalization
circuitry is provided to eliminate errors resulting from
probe laser power fluctuations.

-108-
Measurement of V-V Energy Transfer Probabilities in CO-CO Collisions Following the Reaction
of Oxygen with Acetylene.
Y. S. Liu* Department of Applied Physics and Materials
Science Center, Cornell University Ithaca, NY 14850
R. A. McFarlane and G. J. Wolga School of Electrical Engineering and Materials
Science Center, Cornell University Ithaca, NY 14850
* Now at General Electric Research and Development Center, Schenectady, N.Y., 12301.
J
Research supported by the Advanced Research Projects Agency and monitored by ONR under Contract N00014-67-A-0077-00006 and also through the Materials Science Center, Cornell University.

-109-
Meajuretnent of V-V Energy Transfer Probabilities in CO-CO Collisions Following the Reaction
of Oxygen with Acetylene.
Y. S. Liu, R. A. McFarlane and G. J. Wolga
Abstract
Infrared chemiluminescence has been studied from vibrationally
excited CO formed in t'ie reaction of oxygen with acetylene. By
monitoring the first overtone emission at various levels of added
cold CO in a fast-flow system, we were able to determine the V-V
energy transfer probabilities p ' _ .. for 3 £ v £ 9. The
analysis is greatly simplified by using a fast-flow approximation
in which the volumetric pumping rate greatly exceeds the removal
rate for other loss processes. The results are compared with
previously reported data and with the probabilities determined
theoretically where both long and short range interaction potentials
are Included.
ii

-110-
INTR0DUCTI0N
In recent years studies of inter- and intra- molecular energy
transfer in diatomic molecules have been motivated by interest in
chemical lasers. Various experimental methods have been employed to
measure the rates of vibrational energy transfer which occur upon
collision. Among them I.R. chemiluminescence has been exploited
most extensively. The method has been successfully applied by Polanyi
and his co-workers to determine the relative rate constants for the
production of specific energy levels of the product molecule in hydrogen
halide reactions and many others. More recently, the quenching of I.R.
chemiluminescence has been used by Hancock and Smith to measure the
rates of de-excitation of vibrationally excited CO by ground state CO
and other molecules. They observed the I.R. chemiluminescence from
vibrationally excited CO formed in the reaction of oxygen and carbon
disulfide and studied the quenching of the CO first overtone spectrum
upon the addition of various gases.
There are two times that have to be considered in I.R. chemiluminescence
experiments: the spontaneous radiative lifetime T and the col- spont.
lisional de-activation time T ,,, . of the molecule. The former is collision
characterized by the spontaneous transition probabilities A , ; the
latter depends on the collisional de-activation probability and on the
density. For the vibrationally excited CO molecule, the spontaneous -3
radiative lifetire is on the order of 10 seconds. A pressure of a few
Torr is required for feha collisional de-activation time to be of the
same order.
Chemiluminescence experiments are frequently carried out using a
low flow condition set by a relatively small capacity pump. The low
pressure required is established by moving only a small amount of
material. In the low flow system, however, undesirable and unavoidable
experimental problems such as the de-excitation due to surface effects,
the cascading process from the vibrationally excited states and the
spatial inhomogeneity of the species have to be taken into account.
These can greatly affect the accuracy of rate determinations based on

-111-
I.R. measurements and can lengthen the analysis of the experimental
results.
In view of these difficulties encountered in the conventional
I.R. chemiluminescence experiments using the low flow condition, it
appears more appropriate to operate I.R. chemiluminescence experiments
at a high flow rate. The pressure can be reduced by increasing the
volumetric pumping rate. The "Fast Flow" condition is satisfied by
carefully choosing the experimental parameters such that the volumetric
pumping rate Is made much faster than the spontaneous radiative rate
and collisional deactivation rates. Under these conditions, using
the appropriate approximations, the master rate equations can be
de-coupled and solved in a very simply way. The approach is hence called
the "Fast Flow Approximation".
The vibrational energy exchange probabilities measured in the (2)
present work are compared with those obtained by Hancock and Smith
in an I.R. quenching chemiluminescence experiment and with theoretical
values calculated by including both long-range dlpole-dlpole interactions
and the short range repulsive Interactions. Reasonably good agreement
is obtained between the present values and those reported by Hancock
and Smith. This is particularly satisfying in view of the very great
experimental differences in the two determinations. Both sets of
data are also in good agreement with the calculated V-V energy exchange
probabilities.
THE EXPERIMENT
(3) Vlbrationally excited CO is produced in the primary reactions:v '
0 + C2H2 ^ CO* + CH2 + 51 Kcal/mole
(1)
0 + CH- V CO* + 2H + 71 Kcal/mole

-112-
The exothermiclty of the reactions is sufficient to produce vibrationally
excited CO* up to v • 1A. In the present work chemiluminescence of CO*
was measured In the first overtone emission bands between 2.3 and 2.8
microns as shown in Figure 1(a). The spectra were monitored as different
amounts of cold CO were added to the acetylene and injected into the
mixing zone. The addition of cold CO affects not only the overall
intensity of the spectrum but changes the intensity distribution as
well. This latter effect is caused by the preferential deactivation
of the lower vibrational levels of the vibrationally excited CO
molecules. Figures 1(b) and 1(c) show two spectra recorded at different
levels of added cold CO.
The experimental apparatus is shown in Figure 2. Atomic oxygen at
a flow rate of 10~ mole/sec was produced in a microwave discharge. The
oxygen concentration was determined by titration with I^. Acetylene
was injected radially through small orifices into a teflon reaction tube
3/8 inch i.d. and 18 inches long. Precautions were taken in choosing
the dimensions to assure that the low pressure and fast flow conditions
were satisfield. The system was pumped with a 100 cfm blowc-r backed by
a moder 1397B Welch pump. A linear flow speed of 83 m/sec in the mixing
zone was measured under normal operating condition.
The infrared emission was observed in a direction transverse to the
flow. The observations were made through a side window at various
positions along the flow downstream from the mixing point. The infrared
emission was focussed with a silicon lens through a chopper onto the
entrance slit of a Jarrell-Ash 1/2 meter Ebert monochromator. A room
temperature PbS detector was used. The signal was amplified by a
Keithley Model 103 low noise amplifier and processed through a Princeton
Applied Research Model JB-5 lock-in-amplifier phase locked at a reference
frequency set by the light chopper. The spectra were recorded on a
Hewlett-Packard dual-pen strip chart recorder. The spectrometer employed
a grating with 105 lines/mm blazed at 8.6 microns in first order. The
optical path internal and external to the spectrometer was flushed with
dry nitrogen to avoid the atmospheric water vapor absorption which overlaps
strongly with the CO fundamental and somewhat less with the overtone.

-113-
The vlbratlonal population distributions were determined by a
computer simulation method introduced by Karl, Kruss and Polanyl .
A spectrum can be synthesized to match the experimental scan with
vlbratlonal populations and the rotational temperature as the input
parameters and using the molecular and spectroscopic constants, the
frequencies of transition and the instrumental characteristics. A
preliminary discussion of the determination of the vlbratlonal
populations for the present system has been reported . In the
present work we will describe the determination of the V-V energy
exchange probability for the process
C0(0) + CO(v) -»• C0(1) + C0(v - 1) + AE (2)
using the vlbratlonal population data of reference (5).
A STEADY STATE SOLUTION FOR VIBRATIONAL POPULATIONS USING THE FAST-FLOW
APPROXIMATION
The steady state master equation for the population densities N v
of the vlbratlonal level v can be expressed as
max
0 - 7- N - R + ) {A + K rxl}N dt v v £_ v + n,v v + n,v- J v + n n-1
(3)
-{I [Av.v - n + Kv,v - n^ > + % + %*. n-1
The positive term represents the total production rate of the
population density into vlbratlonal level v. The negative term
describes he rate of removal of molecules from the vlbratlonal level v.
The notation is as follows:
Rv is the chemical production rate that produces population in
the vlbratlonal level v. Aviv 1« the spontaneous radiative rate of the transition from
v' to v.

-114-
Kv,v Is the colllsional deactlvr ,AJR rate at which a molecule
Is moved from the state v' to the state v.
[X] Is the concentration of molectle X that causes deactlvatlon.
Only CO is included in the following analysis.
Kw is the total rate of deactivation by .sin face "ecombination
and diffusion.
K is the volumetric pumping rate.
The master equation can be simplified with the following
approximations.
(1) The Fast Flow Approximation
K v + n.vtX]' Av + n.v* Kw * < Kp
o» T v ♦ n,v v + l,v v + 2,v
n-1
ti v + n,v v ♦ l,y n-1
(4) R - constant v
The first approximation is valid if the volumetric pumping rate is much
faster than the spontaneous radiative rate, the collisional deactivation
rate and diffusion rate. The second and the third assumptions imply that
the spontaneous radiation is confined in the fundamental and the first
overtone emissions and collisional energy transfer is a single quantum
exchange process. Further, we assume that the reaction rate is not
affected by the addition of another gas.
With these approximations, the steady state master equation
without and with cold CO can be written as.

-115-
TT N 0 - R + iA 3t v v V + l.v + Kv + l.v W>
N; + l + Av + 2.v< + 2
" {Av.v - 1 + Av.v - 2 + Kv,v - 1 W + Kp + Kw} N°
0 " äl Nv- Rv + ^ ., 1)V + Kv + lv [Q]}Nv + ! + Av + 2)VNv + 2
{Av.v - 1 + Av,v - ? + Kv,v - 1^^ + Kp + K„} Nv
where
[q] is the concentration of CO formed in the reaction.
[Q] is the concentration of CO added. [Q] » [q] .
Nv i8 the concentration of vibrational population in level v
without additional cold CO.
Nv is the concentration of vibrational population in level v with
the additional cold CO.
If we subtract and rearrange the two equations and keep the significant
terms, we obtain
If the left-hand side is plotted against the magnitude of the bracket on the
right-hand side using the measured values of N and N0 and the values
[Q] of the additional cold CO, Kv + ^^ can be determined. The
concentration of CO formed in the reaction [q ] , is determined using the
known reaction rate constant and the known concentrations of oxygen and
acetylene. It is estimated as [q] - 5.4 x ID"10 mole/cm3. Together with
the values of Kp and Av + ^^ the values of the brackets in Equation (7)
can be determined for each vibrational level v. The results are shown in
Figure 3 for the vibrational levels v - 2,4, and 8. The deactivation
rat» constant Kv + 1 v can be determined from the slope.
(7)

-116-
The V-V energy transfer probabilities of the process (I) can be
determined from the measured values of the de-actlvatlon rate constants.
pO.l + Kv.v - 1 v'v " 1 ZC0 - CO '
1A -1 -3 The CO-CO collision frequency is calculated to lit 1.86 x 1C mole cm
sec at a temperature of 300oK.
.0.1 Our determinations of K , and P ,Jk , are summarized in v,v - 1 v,v - 1 .2.
Table 1. Also shown are the data reported by Hancock and Smith from
their measurements on the quenching of CO chemiluminescence resulting from
the reaction of oxygen and carbon disulfldle.
CALCULATION OF THE VIBRATIONAL ENERGY TRANSFER PROBABILITIES
The V-V energy transfer probabilities for the process
C0(0) + C0(v) + C0(1) + C0(v - 1) + AE
must be calculated Including both long range and short range interaction
potentials. In general the V-V energy transfer in CO-CO collisions can be
resonant or highly non-resonant depending on the energy levels involved. No
single theory can adequately explain the energy transfer mechanism. The
short range interaction from the molecular repulsive potential has been
treated by Rapp et al. and the long range Interaction due to molecular
multipole moments has been treated by Sharma and Brau . Detailed
calculations Including both contributions to the transition probability have (8) (9)
been reported by Jeffers and Kelly and by Caledonia and Center .
Figure 4 shows the measured V-V exchange probabilities compared to our
calculated values based on the formulation of Caledonia and Center. The
experimental data supports the notion that both long and short range
interactions must be part of an accurate description of the V-V energy
exchange process.
DISCUSSION AND CONCLUSION
The "Fast-Flow" approximation used in the determination of V-V
energy exchange probabilities results in a substantial simplification of
the system of simultaneous equations which describe the steady state

-117-
vibratlonal population distribution. Diffusion and wall deactlvation
processes can be made Insignificant compared to the volumetric pumping
rate as can collisional processes other than those of Interest. For
example under the conditions of the experiment deactlvation of vibrationally
excited CO by oxygen or helium is estimated to be 10 times smaller
than by the added cold CO. Deactlvation by water formed during the
combustion of acetylene is difficult to estimate. Since the formation
of water probably occurs in a reaction step subsequent to the primary
steps leading to CO* it appears likely that V-V and to fiome extent V-T
equilibration will take place before the appearance of a substantial
amount of water.
Knowledge of the time development of the vibrational populations,
particularly a population inversion, is critical for the application of this
reaction in a chemical laser. A time-dependent solution of the kinetic
equations of the vibrational populations has been carried out And will be
discussed in another paper . The solution includes all single
vibrational quantum exchange collisions between levels v • 0 to v - 14,
V-T and spontaneous radiative pro .esses. The computation agrees with the
data of reference (5) that under the conditions of the experiment 0.2 Torr
added cold CO can give rise to a total vibrational population inversion while
0.1 Torr added cold CO can increase local vibrational temperatures but
fails to produce an inversion. The computation also indicates that for
the CS.-O system a substantial amount of CO in the v ■ 0 level is required
in addition to the initial distributions reported'2^ v11' in order to
approximate the observed time dependence of the distribLtions for this
system^ \
. /

-118-
REFERENCEL
(1) Polanyi, J.C., J. Chem. Phys. 34, 3A7, 1961.
(2) Hancock, G., and Smith I.W.M., App. Opt. 10, 1827, 1971.
(3) Clough, P.N., Schwartz, S.E. and Thrush, B.A., Proc. Roy. Soc.
London, A 317, 575, 1970.
(4) Karl, G., Kruss, P., and Polanyi, J.C., J. Chem. Phys. 46, 224, 1967.
(5) Liu, Y.S., McFarlane, R.A. and Wolga, G.J., Chem. Phys. Letter 14,
559, 1972.
(6) Sharma, R.D. and Brau, CA., J. Chem. Phys. 50, 924, 1969.
(7) Rapp, D. and Englander-Gordon, P., J. Chem. Phys. 40, 573, 1964.
(8) Jeffers, W.Q. and Kelly, J.D., J. Chem. Phys. 55, 4433, 1971.
(9) Caledonia, G.E. and Center, R.E., AVCO Research Report 364,
September 1971.
(10) Liu, Y.S. , McFarlane, R.A., and Wolga, G.J.(ln preparation).
(11) Tsuchlya, S., Nielsen, N. and Bauer, S.H., Third Conference on
Chemical and Molecular Lasers, St. Louis, Mo., May 1-3, 1972.
.

-119-
FIGURE CAPTIONS
FIGURE 1 CO first overtone spectrum showing the effect of adding
cold CO.
FIGURE 2 A scheaatic diagram of the experimental setup.
TABLE 1. V-V energy transfer probabilities P ' - and the values
of the de-activation rate constants K , of CO-CO collisions.
FIGURE 3 Determination of the de-activatlon rate constant K v,v-l
FIGURE A. -iollisional V-V energy transfer probabilities of CO. The
measured data Is compared with a theoretical calculation
vhlch includes both long range and short range interactions
at T - 300OK.
10

-120-
t- V- o O O)
o Q) O CJ V)
H <u E ui o ^j-
c K. b 'o k. o . Z) ^ .6
8 t
or
= 0
.05 t
.6
7 to
rr
UJ 'o X
lO
Q. N II
O wT -J — r—i <M
ii x " < II ••J: CJ CJ <J> h- . (M o o x o • O o CLQ.Q. J- i—i i—X
o o
o o
Z) o: h- o Lü O. CO
o ? CO Q !< LÜ U-
O UJ 2 I- o o Q: U.
> UJ o
01
IU X F CO
o O X O CO
«2 h.
AJ.ISN3XNI 3AI.LVn3il
;v-
■ /

-121-
Q.
UJ if)
-J
UJ
Ul 0- >< UJ
u
Lu o
<
CO <
o Ü
<
UJ X o 0)
<' * E • • O
4M
o- »— w i f (0 3 1 Q, <J-/ o> o
12 n w
I D
etec
tii
PC
Det
ec
•
1 i \ i Win
do
pp
er
Op
tica
(P
bS
•
s i (DJS | J^: o
i E i » S; i - ... .
5 S
]Öl! — ^ o b CJ « x
1 ^ \ i
oin Jo
1
Ü to c o C) -I -» w o. ^uT O ->>
<\
\
o >» gse >JZ< h- C (O
o i
\N Z Ä c tC \ ~ > o \ \ \ 0> ■
X k 8,&
PA
R
Lo
ck-i
n
Am
p.
•■
Ü \ \ — rl CJ \\ QO
O -ft-L \> §1 V^ o » •
1 : \ J 1° 1 1 f-
T3 •*- \— »- O o o •
o V-^A 2 i üO: a) J
8 O
0) k.
3 3 «— a. i.
0J 3 Q, O <
-14-

-122-
ToUc I
V-V ENERGY TRANSFER PROBABILITIES Pv°^ AND VALUES OF
THE DE-ACTIVATION RATE CONSTANTS Kv/ v , OF
CO (0) + CO (v) — CO (1) + CO(v-l)
RESULTS
VlBRATIONAL LEVEL PRESENT RESULTS
V,V-1 rv,V-l
UNCOCK S SMITH'S1
V K VJV-J.
p o,i 'v,v-l
3 2./|5(-12) 8.5(-3) « _
4 1.8^(-12) 6.2(-3) 210(-12)* 6.7(-3) 5 1.19(-12) ^0(-3) 1.3(-12) ^3(-3) 6 8.67(-13) 2.9(-3) 5.3(-13) 2.1(-3) 7 5.2(-13) 1.7if(-3) 3.f}(-13) 1.15(-3) 8 3.62(-13) 1.21(-3) 1.77(-13) 5.9(^) 9 2.38(-13) 8.06(^) 1.13(-13) 3.8(-4)
i 6. HANCOCK fi I.W.N. SMITH, APPL. OPT., 10, 1827, 1971 # 2.0(-12) = 2.0 x lO"12 CM3 - MOLECULE"1 - SEC"1
-3 -
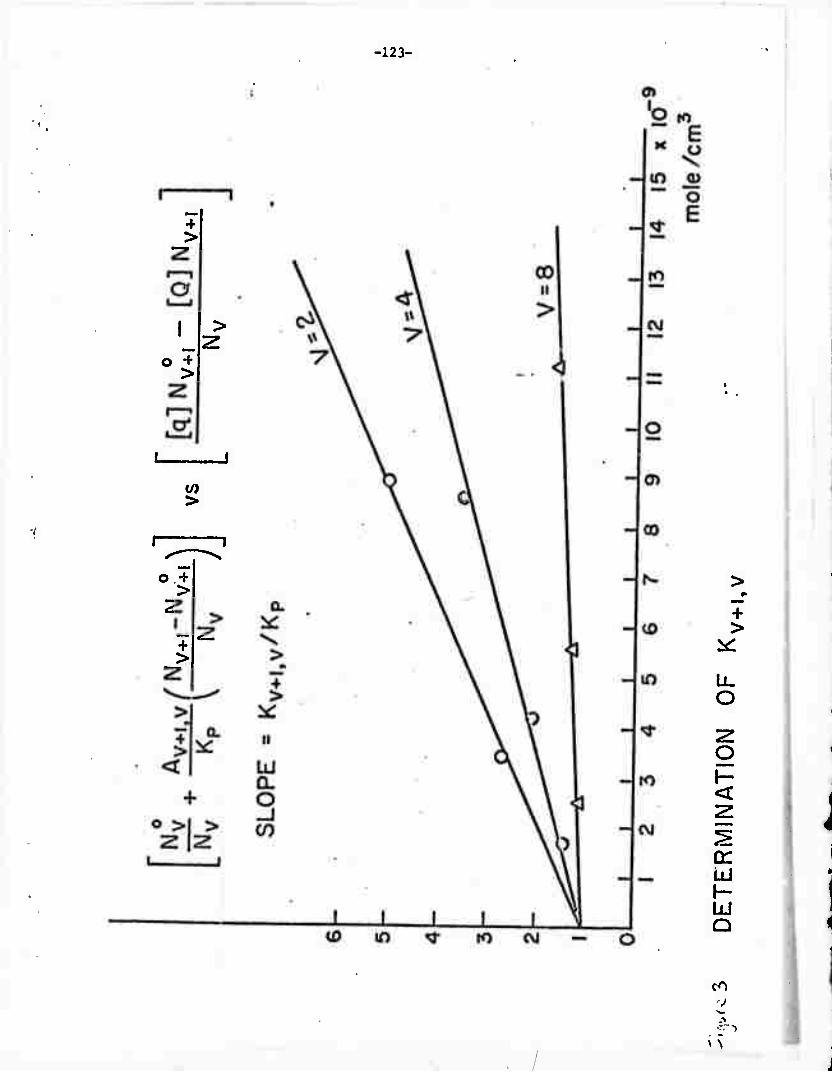
-123-
4 >
> 2
O + >
1 1
s 1 "1
o + >
+ >
+ >
y. O
o <
o: LÜ I- LÜ Q
\ \

•
-12A-
10
10
-r. 10
^ift^re 4"
PRESENT RESULTS
G.HANCOCK & I.W.SMITH'S RESULTS
X X X X 2 3 4 5 6 7 8 9 10 II 12 13 14
COLLISIONAL V-V ENERGY TRANSFER PROBABILITIES OP CO.
THE SOLID LINE IS THE THEORETICAL CALCULATION INCLUDING
BOTH LONG RANGE AND SHORT RANGE INTERACTIONS AT T = 300oK
17 - .

-125-
A Study of the Dynamic Behavior of the Vibrational
Population Relaxation in Carbon Monoxide
by
Yung S. Liu
Department of Applied Physics and Materials Science Center
Cornell University, Ithaca, NY 14850
and
R. A. McFarlane and G. J. Wolga
School of Electrical Engineering and Materials Science Center
Cornell University, Ithaca, NY 14850
* Now at General Electric Research and Development Center. Schenectady, NY 12301.
Research supported by the Advanced Research Projects Agency and Monitored by ONR under Contract N00014-67-A-0077-00006, and also through the Materials Science Center, Cornell University
J

-126-
ABSTRACT
The dynamic behavior of a relaxing CO-He mixture has been
studied. The time evolution of the non-equilibrium vibrational
population distribution was obtain 3d by numerically integrating the
master equations for the vibrational population including Vibrational-
Vibrational, (V-V), Vibrational-Tra^ national, (V-T), and the
spontaneous decay processes. The result shows the characteristic
relaxation through the V-V energy transfer of an anharmonic molecule.
The results show good agreement with the experimental data from
chemilumLiescence experiments in the following two reactions
(i) O + C2H2 -» CO* + CH2 + 51 Kcal/mole; O + CH2 -♦ CO* + 2H +
71 Kcal/mole; and (ii) O + CS, -» CO + CS, O + CS -♦ CO + S +
75 Kcal/mole.
i
11

-127-
INTRODUCTION:
Studies of the vibrational energy distribution of an anharmonic
molecule in non-equilibrium states have received increasing attention
in recent years. This is true not only because of the relative simplicity
of the system for the study of the relaxation mechanisms in a diatomic
molecule, but also because of its importance of the understanding of the
molecular kinetics in a chemical or molecular laser system, and for
the improvement of the performance of such laser systems.
Recently, the I. R. chemiluminescence method has been successfully
applied to study the vibational population distribution of the product .(12 3) molecules in exithermic reactions.y * * 'it has been observed that the
products are frequently in highly vibrationally excited states following
the reaction, and then relax through a rapid V-V energy transfer process.
Studies of I. R. chemiluminescence provide information on the vibrational
energy distribution at various stages of the relaxation during a kinetic
process. However, due to the complexity of the kinetics involved, there
has not been a comprehensive study of the dynamic behavior of the
vibrational relaxation mechanism in a diatomic molecular system.
MODELING OF THE RELAXATION PROCESS
In this work, we report a successful modeling scheme for study of
the time-dependent behavior of the vibrational energy transfer in a relaxing
CO-He mixture. The set of master equations for the vibrational popu-
lation has been numerically integrated by the Runge-Kutta-Treanor (4)
method. The time evolution of the vibrational population thus
obtained shows good agreement with our data measured experimentally
from the I. R. chemiluminescence of the excited CO produced in the (5) exothermic reaction of oxygen with acetylene. We have been able
both experimentally and computationally to demonstrate that a total
inversion of the vibrational population occurs as a consequence of the
preferential de-activation of low vibrational levels due to the presence
of an excess amount of ground state CO. We have also applied this
modeling method to examine the vibrational population data recently
1.

-128-
reported by Tsuchiya et al.( 'in a chemiluminescence experiment on
a pvilse-discharged CS2/02/He system. The results show a reasonably
satisfactory agreement although some discrepancy exists as to th«; overall
relaxation rate. The time-dependent solution of the vibrational popu-
lation was obtained numerically by solving the set of master equations
for the vibrational population including V-V, V-T and the spontaneous
radiative process with a given set of the initial populations experimentally
determined from chemiluminescence data.
The master equzMon we have used for the vibratioral population of
the level V is:
■ft-^K« = ZCO-CO
" YK,K-1NK + YK+\ ,KNK + 1 " YK,K+1 NK] I + ZCO-HeNHE[UK-lfK
NK-l
- UK.K-1NK +UK+1,K NK+1 " UK.K+1NK] + AK+2.KNK+2+AK+1.KNK + 1
AKfK-lNK ' ^K-Z^K , (1)
where IV, N. are the population densities for levels K and j at time t.
pK, K-l .s ixie v_v energy transfer probability in the CO-CO collisional j» j +1
process; CO(j) + CO(K) -* CO(j+l) + CO(K-l) + AE.
2.

-129-
(7) This probability was calculated by combining the Sharma-Brau theory*
and that of Rapp to include both long-range and short-range interactions.
The measured probability has recently been reported1 * ' ' by several
workers and the results show good agreement with the calculated values (12 13)
thus obtained for the room temperature case. * YK K_j and UK K_j
are the V-T energy transfer probabilities in CO-CO and CO-He collisions
at room temperature, and the values employed were calculated from SSH
theory. Zco co and zco-He are t^e collisioiial frequencies for CO-CO and CO-He collisions. Nco(t) is the concentration of CO at time t.
NTT is that of He. A.. K , and AK „? ai,e the spontaneous radiative
rates of the level K to levels K-l and K-2 respectively. In the above
equation, only a single quantum exchange is included in the V-V exchange
process. The set of equations (1) for the vibrational levels V = 0 to V= 14 (4)
has been integrated numerically by the Runge-Kutta-Treanor method.
This numerical integration technique has been widely applied for solving
coupled non-linear differential equations such as are found in modeling
coupled chemical reactions.
Figure (1) shows the vibrational population distribution of CO*
measured experimentally from the chemiluminescence data from excited
CO formed in the oxygen-acetylene reaction. * The vibrational
population was determined from the first overtone chemiluminescence
spectrum between 2. 3 and 2. 8 microns by using a computer simulation
method first described by Karl, et al. A numerical method is used
to generate a simulated spectrum to compare with the experimental scans.
It takes into account the instrumental sensitivity variation as a function
of wavelength, the spectral slit width, the Einstein A coefficient of each
upper level and the molecular and spectroscopic constants. The rotational
temperature and the relative population of each vibrational level are
adjusted to obtain a match between the synthetic spectrum and the
experimental scan. More detailed discussion of this procedure was (5) reported previously. The figure shows the non-equilibrium relative
vibrational population distribution of CO* at a time approximately 100 microseconds after the injection of the acetylene into the atomic
3.

-130-
oxygen stream. The addition of cnld CO to the fuel dramatically
modified the vibrational distribution. Preferential de-activation of the
lower vibrational levels leads to a total inversion of the vibrational popu- lation with 0.2 Torr Co added to the acetylene. The data have been
plotted taking account of the relative signal levels under different
conditions of added cold CO. It is seen from the curve that as a
consequence of the anharmonic nature of the molecular potential, the process
CO(0 ) + CO(V) -tCOCl) + CO(V-l) + AE
has a maximum transfer probability between V = 4 and V = 6 and decreases
rapidly at higher values of V. With the addition of cold CO to the reaction,
it has therefore been possible to significantly depress the populations
of levels V < 5 and produce a vibrational population inversion.
Figure 2(a) shows the calculated time-evolution of the vibrational
population model for the cviditions shown in Figure 1 in the presence of
0.2 Torr cold CO. The initial vibrational population was taken from the
experimental data^ ' and was a nearly-Boltzmann distribution similar
to the top curve shown in Figure 1. The system was assumed to be isothermal
at a temperature 300 K and no attempt was made to model the mixing
mechanism in the flow. The populations are seen to be changing more
rapidly for vibrational levels V < 8 and a total inversion occurs at a
time about 150 microseconds after the collisional relaxation begins.
The populations relax through a series of non-Boltzmann distributions
with the high vibrational levels over-populated. As the relaxation time
reaches 1 millisecond, a Boltzmann distribution appears for level V < 8.
This is shown in Figure 2(b).
Figure 3(a) shows the time-evolution of the vibrational population
with the same conditions except the added cold CO was changed to 0.1
Torr. It is seen from the curves that the vibrational population changes
moderately during the relaxation process but a total inversion does not
appear in this case. The population curve corresponding to 162.9 usec
after the start of relaxation shows very good agreement with the curve (A)
4.

-131-
in Figure 1. Figure 3(b) shows the long-time behavior for this case
Figure 4 shows the experimental results of a study of the relative
populations of vibrationally excited CO produced in a pulse-discharged
CS2 + O2 + He mixture as reported recently by Tsuchiya et al.' * They
deduced the relative populations from the chemiluminescence of CO* at
selected delay times after the discharge pulse which initiated the reaction and
established the time dependence of the population for each level. A
modeled time-evolution of the vibrational populations for this case
is shown in Figure 5. The two figures show a similarity of the time-
dependent behavior of the relative vibrational populations. However, some
discrepancies exist. First, the computed relaxation process appears
slower than that determined experimentally. Since in our model, only
V-V exchange by CO-CO collisions, V-T exchange by CO-CO, and CO-He
collisions and the spontaneous radiative decay were considered, any other
de-activation processes will speed the relaxation. However, our modeling
scheme does provide a method to verify some experimental conditions
assumed. Second, in our model, initial populations for the ground level
and the first level must be determined by extrapolating from the
populations in the adjacent levels assuming that a nearly Boltzmann
distribution exists for these low levels. Since it is not possible to
determine the population for the lowest level by a chemiluminescence
experiment, the question of how these lowest levels are populated in the
nascent species in these two types of reaction has not yet been solved.
Failure to include a substantial V = 0 population from the CS - O reaction
in the calculation resulted in a time development very different from that
observed experimentally.
DISCUSSION;
Our results for the time-dependent behavior of the vibrational
populations have shown a rather satisfactory agreement with the
experimental data presently available from chemiluminescence experiments.
The model includes V-V and V-T processes and radiative decay in a
relaxing CO-He mixture. It is a rather simple one, and the numerical
5.

-132-
integration technique we employed is straightforward. The agreement
with the experimental data suggests that this modeling scheme is widely-
applicable to general kinetic problems in other diatomic molecular laser
systems. It can be elaborated with more complicated relaxation
mechanisms, namely, multiquantum vibrational exchange, chemical
reactions, fluid mixing, and stimulated emission to model the kinetics
of a transverse-flow chemical laser system which is of particular current interest.
ACKNOWLEDGMENT;
The authors wish to thank Dr. S. H. Bauer for providing the
experimental data of the time-dependent vibrational population of CO*
produced in a pulse-discharged CS2 + 02+ He mixture. We wish to thank
Dr. D. Edelson of the Bell Telephone Laboratories for valuable discussions
on the numerical integration problem. The program was initially provided
by D. Cameron, and his able assistance is also acknowledged.
6.

-133-
REFERENCES;
1. Polanyi, J.C., J. Chem. Phy. 31, 1388, 1959.
2. Polanyi, J.C., and Charters, P.E., Dis. Faraday, Soc, 33,
107, 1962.
3. Polanyi, J. C, App. Opt. 10, 1717, 1971.
4. Treanor, C.E., Cornell Aeronautical Lab. Report No. AG-1729-A-4,
1964.
5. Liu, Y.S., McFarlane, R.A., and Wolga, G. J., Chem. Phys.
Letters 14, 559, 1972.
6. Tsuchiya, S., Nielson, N., and Bauer, S.H. - to be published.
7. Sharma, R.D. and Brau, CA., J. Chem. Phys. 50, 924, 1969.
8. Rapp, D. and Englander-Gordon, P., J. Chem. Phys. 40,573, 1964.
9. Liu, Y.S., McFarlane, R. A. and Wolga, G. J., presented to 3rd
Conference on Chemical and Molecular Lasers, St. Louis, U.S.A.
1972.
10. Liu, Y.S., McFarlane, R. A, and Wolga, G. J. - to Lt pullished.
11. Hancock, G. and Smith, I. W.M., App. Opt. 10, 1827, 1971.
12. Jeffers, W.Q. and Kelly, J.D., J. Chem. Phys. 55, 4433, 1971.
13. Liu, Y.S., Ph.D. Thesis, Cornell University, 1972.
14. Schwartz, R.N., Slawsky, Z. and Herzfeld, K., J. Chem. Phys. 20,
1951, 1952.
15. Karl, G., Kruss, P. and Polanyi, J. C, J. Chem. Phys. 46,
224, 1967.
16. Creek, D.M., Melliar-Smith, C.M. and Jonathan, N., J. Chem.
Soc. (A) 646, 1970.
7.

-134-
FIGURE CAPTIONS:
FIGURE 1 Relative vibrational population diatribution of CO''.
Pressures: C2H2 0.05 Torr, 02 0.68 Torr. He; 1.67
Torr. Temperature Trot=300oK. [C^] = 0.25 x 10
mole/sec. [0]= 1.7 x 10"4 mole/sec. o without
additional cold CO. a 0. 05 Torr additional cold CO.
A 0.1 Torr additional cold CO. «0.2 Torr additional
cold CO.
-4
FIGURE 2(a) The time evolution of the vibrational population of a
relaxing CO-He mixture in the presence of 0. 2 Torr cold
CO. The partial pressure of He is 1. 70 Torr: that of
CO is 0.25 Torr. T = 300oK. The calculation includes
V-V, V-T and radiative decay processes.
FIGURE 2(b) The long-time behavior of 2(a).
FIGURE 3(a) The time evoluation of the vibrational population of a
relaxing CO-He mixture in the presence of 0. 1 Torr
cold CO. The partial pressure of He is 1. 70 Torr; that
of CO is 0. 15 Torr. T = 300oK. The calculation includes
V-V, V-T and radiative decay processes.
FIGURE (b) The long-time behavior of 3(a).
FIGURE 4
FIGURE 5.
Vibration population distribution of CO* produced in pulsed-
discharged CS2 + 02 + He mixtures. The time-
dependence of the population is determined by the delay time
The partial pressure of CS2 is 0.045 Torr; that of 02 is
0. 76 Torr and He is 3. 0 Torr. 15 KV discharge. Data taken from Tsuchiya, et al. (6)
Calculated time - evolution of the vibrational populations
for the experiment of Figure 4.
8.
i

I
E Ü
o o E
!
I0"9r
10 rlO
:-
10 HI
io-,2L-
SHORT-TIME BEHAVIOR
0 I
t =0
12.88//. sec
21.31 JLL sec
8l.43yjxsec
O 149.8 fi sec
A
D
o
2 3 4 5 6 7 8 9 10 II f2 13 14 VIBRATIONAL LEVEL

ro E o
O E
10 r9
10 rIO
LONG-TIME BEHAVIOR
• t = 0 0 178.6 ^sec
A 304.9/i.sec
D 1.320 msec
\
I 2 3 4 5 6 7 8 9 10 II 12 13 14 ilr VIBRATIONAL LEVEL
/"

SHORT-TIME BEHAVIOR
10
o t = 0 D 2l.3lyL/.sec A 162.9 yLtsec
; s
2 3 /37 4 5 6 7 8 9 10 II
VIBRATIONAL LEVEL 12 13 14
i

23 456789 10 /3^ VIBRATIONAL LEVEL
I 12 13 14

-139-
V. k. k. o o o
lO
ONO d dro
cooi
. o o tu >« £ -p 0 S 3 O »- c
01 •*. to 0 ö 2 H o o
o - _l (J> <
Nouvnndod aaznvwaoN
^
^ ^.a
Z7 ^//
</> irt </> «> v>
m ro co oo oo CM ID CD "* 'l'
— CM
o a <] • ■
o o o
10 <r to O NO d dto N NO}
W) OI u
^P" tx^pjr .*
" •' X
.*$
^/
V
\
Q
i 0
X
lO o
NOIiVlfldOd 3AliV13«
m
3 a m TJ C o c <u
m. a)
o 3
a Q
(0
(M - _l
UJ >
O w - -J
< CD Z
g
to Q: m
w

-140-
NOIlVlfldOd a3znviAiaoN
o <> o o o V <u «> in « « u>
d :l d- E b
o co S iri
CVJ
to oo o>
o 0>
<J—
* < a o o o
(
if / & <// a.M • </ or
(^o/aioui^ix) NOIiVindOd IVNOIIVdaiA
CM
IO
CM
1

-141-
V« Molecular Relaxation ^la Atomic Collisions
Three studies are currently in progress to measure atcm collision
Induced vibrational relaxation in important molecular laser systems.
The r.ollisional processes being studied are:
HP(v - 1) + X -► HF(v - 0) + X + AE ; X - H.F
C02(0n0) + X ^ CO2(000) + X + AE ; X - O.N.H.F
C02(00ol) + X -^ C02(nm ) + X + AE ; X - H.F.O.N
A. Atomic Relaxation of HF(v - 1) (G. J. Wolga)
At the time of submission of our Semi-Armi *1 Report for 1972 we discussed
the status of this experiment. In this report we shall complete the descrip-
tion of the experiment which is now in progress.
The capacitance diaphragm pressure gauge has proven to be very useful
and reliable. In the following figures we show a schematic drawing of the
gauge and typical calibration runs. The gauge is constructed from materials
(Telfon, PVC, Monel) that are corrosion resistant and no difficulty is
anticipated in applying it to our work with HF, F2, etc.
The HF, v - 1 »■ 0 pump laser was redesigned and significantly improved.
We now obtain approximately 20-30 milli Joules/pulse on the v - 1 -► 0
transition. This will be more than adequate for our experimental needs.
The fluorescence cell was designed and constructed. A schematic drawing
of the cell is attached as a figure. The cell design stressed use -f construc-
tion materials that could withstand the corrosive gases and maintenance of
a good filling factor for the pump radiation and good optical coupling for

•142-
-• CAJON ULTRA-TORR FITTING
DIAPHRAGM (STAINLESS STEEL OR NICKEL1
BRASS ELECTRODE CAJON ULTRA-TORR FITTING
CAPACITANCE MANOMETER
o4VDC
RCA 3NI28
Mqi k ilOO/xh _LC2
;iooA
». TO BUFFER AMPLIFIER AND FREQUENCY COUNTER
=i=c ^•dr [q^Ci* C"] C - CAPACITANCE MANOMETER C|» C2 ■ 100 pf
CLAPP OSCILLATOR

u ^
CO 2 < a:
(O UJ E 0-
ÜL < <
UJ UJ
UJ o: UJ
(0 u. Q
CO CO w UJ > _l
>- Ü
i z UJ
To O O
o UJ Q: u.
so:
< o
g L
O o
o 0>
o 00
o
tr o
o t UJ
o to •o <0
UJ QC 0.
0 i
^ E U- U-
o CM
-o
i
0> 00
ZHIM Nl ADN3n03äd -in-
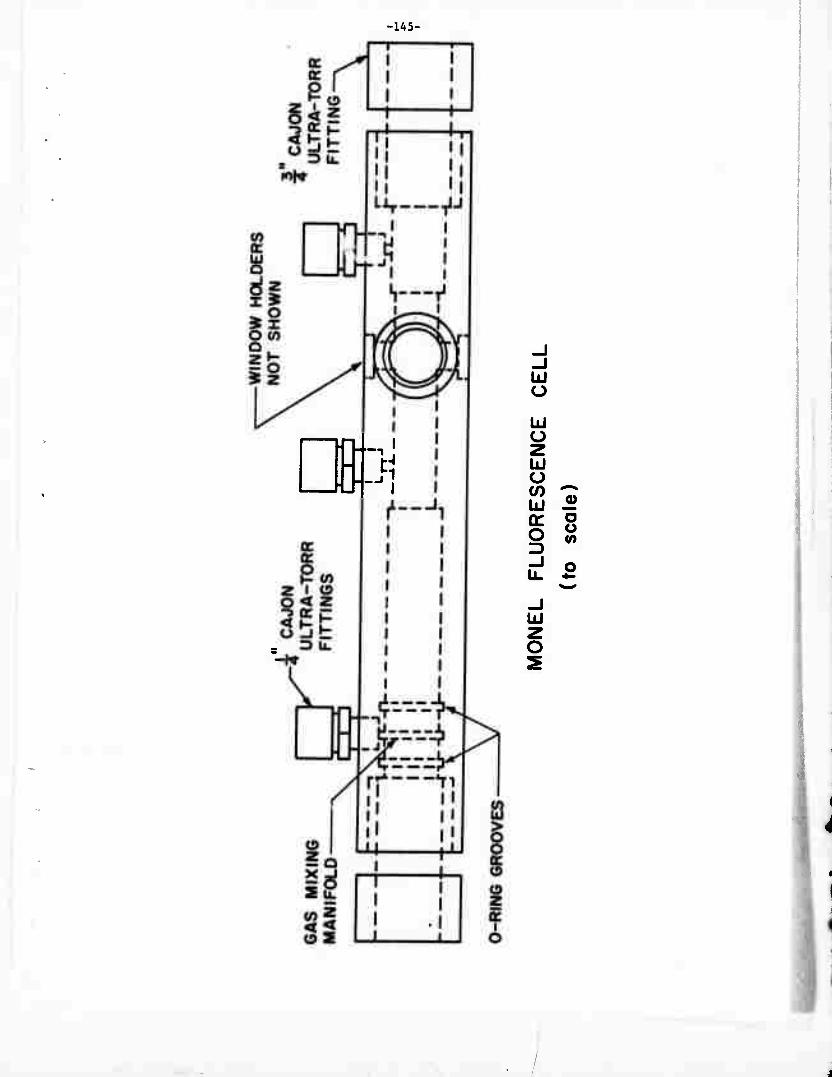
-1A5-
L ™-)i
-
ÜJ o Lü O z ÜJ Ü CO ÜJ (T O
o o tn
UJ

-146-
0)
2
Lü
3 o
(0
o o
o V)

-147-
detection of fluorescence.
We have made studies of the atom wall recombination rate for H atoms
in our flow system. Knowledge of this loss mode for H Is essential to the
quantitative studies we have undertaken.
At the time of preparation of this report, experiments studying the
process HF(v - 1) + H -»- HF(v - 0) + H + AE were in progress.
B, Atomic Relaxation of CO2(0n0) (S. H. Bauer)
Construction of a high power TEA CO» laser is nearly completed. We
plan to use this unit for simultaneous irradiation of CO.-M mixtures with
4.2 ym (HBr laser) and 10.6 or 9.6 ym (CO- laser) pulses in order to obtain
(concurrently) substantial populations of C02 molecules in the (00°!) and
(02o0) or (10o0) states and to measure the fluorescence lifetimes at
4.2 ym and 15.5-16.5 um. These decay times will permit us to obtain
transition probabilities for the various collisional vibrational deexcitation
steps, at selected cell temperatures, with specified colliders (M). Indeed,
we anticipate eventually to go over to flow cells for measuring the relative
efficiencies of atomic relaxers.
C. Atomic Relaxation of C02(00ol) (G. J. Wolga)
A parallel experiment to that of part A has been set up to study the
process C02(00ol) + X ->C02(nm ) + X + AE ; X - H,F,0,N . A second
EPR apparatus for measuring atom concentrations is in operation. The pump
laser for the laser induced fluorescence studies will be shared with the
HF deactlvation experiment except that it will be operated as an HBr chemical
i