ad-a279 450 5 o · dept. of chemistry university of oregon eugene, or 97403 abstract: the optical...
TRANSCRIPT

.0i' is rfI1Mated '0 J-ltf g 41C I %WfOuf 'f0Creo .inclCuding the little 101 f4%4w.q.N IU .Es.ealfO..nqe SX-9OM ,oa t e5 O el n . e. .'nq its.011. n O vto, Yation Send~ coWTWtflntn fliq.'d.E. this buiden estimate or" an th.; e0DEt Of hisOd,(,Ng Ih. I1, ih/•.0,nlqo" 'Se•_0uaIe' , S ,t c .e... O.rcclOrdte fo' ,nIo.,at,on Opealonl ,nd Re"-OUl. 1.1 I, frrsnAD-A279 450 O. and ot icqeo ement anudqel. PafpewOlk Rfeducion ProjKt (0' j4-0160). W*s*h•ton. Di 20•43
111111111 a r2REPORT DATE 3. REPORT TYPE AND DATES COVERED13 May 1994 Technical 6/93-5/94
4. ILLS UU D..I 5. NUMBERS
Surface Second Harmonic Studies of Si(111)/Electrolyte ONR N00014089-J-1261and Si(111)/Si02 /Electrolyte Interfaces
_ _. ... _R&T Code 41310386. AUTHOR(S)
P. R. Fischer, J. L. Daschbach and G. L. Richmond
7. PERFORMING ORGANIZATION NAME(S) AND ADORESS(ES) 8. PERFORMING ORGANIZATION
Department of Chemistry REPORT NUMBER
1253 University of Oregon ONR Technical ReportEugene, OR 97403 #9
9. SPONSORING/ MONITORING AGENCY NAME(S) AND ADDRESS(ES) 10. SPONSORING /MONITORING
Office of Naval Research Attn: Dr. Peter Schmidt AGENCY REPORT NUMBER
Chemistry Program800 North Quincy St. DArlington, VA 22217-5000 E-- .
11. SUPPLEMENTARY NOTES
12a. DISTRIBUTION /AVAILABILITY STATEMENT 12Ub-D1STRIBUTION CODE
Approved for public release: distribution unlimited
13. ABSTRACT (Maximum 200 words)
The optical second harmonic (SH) response from Si(1ll) electrode surfaces has beenstudied and has been found to be highly potential dependent. For both H-terminatedSi(111) surfaces in NJ 4 F, and oxide covered surfaces biased in H2 SO4 , the phase
and the amplitude display a potential dependence which we attribute to field effect.within the semiconductor space-charge region and at the surface of the Si(111)electrode. The studies are the first to demonstrate that for Si(111O/oxide samplesthe potential dependence in the SH phase can be correlated with oxide thickness,as demonstrated by examining samples of 0-40 Rngstrom thickness.
94-15029I11111 11111111llll 1tll lil lll "* • 0S,- 105
14. SUBJECT TERMS 1S. NUMBER OF PAGES15
Si(111)/oxide electrodes; electrochemistry 16. PRICE CODE
17. SECURITY CLASSIFICATION 18. SECURITY CLASSIFICATION 19. SECURITY CLASSIFICATION 20. LIMITATION OF ABSTRACTOF REPORT OF THIS PAGE OF ABSTRACT
Unclassified Unclassified Unclassified
1,SN 7540-01-280-5500 Standard Form 298 (Rev 2-89)
P11c,111be by ANSI Sid 139-18196 102
OFFICE OF NAVAL RESEARCH
Grant N00014-89-J- 1261
R&T Code 4131038
Technical Report no. 9
"Surface Second Harmonic Studies of Si(111)/Electrolyte and
Si(111)/SiOJElectrolyte Interfaces"
by
P.R. Fischer, J.L. Daschbach, and G. L. Richmond
Submitted to Chemical Physics Letter,
Deptartment of Chemistry1253 University of Oregon
Eugene, OR 97403
May 1994
Reproduction in whole, or in part, is permitted for any purpose of the United StatesGovernment.
This document has been approved for public release and sale; its distribution isunlimited.
SURFACE SECOND HARMONIC STUDIES OF Si(l I 1)/ELECTROLYTE AND
Si(fl 1)/SiO2/ELECTROLYTE INTERFACES
P. R. Fischer, J. L. Daschbach and G.L. Richmond
Dept. of Chemistry
University of OregonEugene, OR 97403
Abstract:
The optical second harmonic (SH) response from Si(1 11) electrode surfaces has
been studied and has been found to be highly potential dependent. For both H-terminated
Si(l 11) surfaces in NH4F, and oxide covered surfaces biased in H2SO4, the phase and the
amplitude display a potential dependence which we attribute to field effects within the
semiconductor space-charge region and at the surface of the Si(l 11) electrode. The studies
are the first to demonstrate that for Si(l 11)/oxide samples, the potential dependence in the
SH phase can be correlated with oxide thickness, as demonstrated by examining samples of
0-40 ,A thickness.
oCoession For
INTIS SWA&\ DTIC TA•5 0 !ujnamioced 0Jastit ou&tion- -
BY
At-tt&..ijtV GodesVail Vor
Dist 8
I. INTRODUCTION 2
Although Si/electrolyte and Si/SiO2/electrolyte interfaces have been extensively
investigated, many issues regarding the structural, electronic and electrochemical
properties of these interfaces remain of interest. Understanding the nature of these
interfaces has much technological relevance. In recent years significant progress has been
made in characterizing the Si/electrolyte interface with FT-IR experiments,l, 2 UHV
transfer experiments, 3 and STM4, 5, 6, 7 and AFM 8 imaging by taking advantage of the
relative stability of Si surfaces prepared in a hydrogen terminated state. However, these
probes are inapplicable for measuring the Si/SiO2 interface once several overlayers of SiO2
are present. In this letter we report the results of the first surface second harmonic
generation (SHG) study which explicitly probes the properties of the Si/Si02 electrolyte
interface as a function of oxide thickness. The results are compared with the potential
dependent response for H-terminated Si surfaces. Because of the inherent surface
sensitivity of SHG, it is a useful probe of interfacial regions, particularly buried interfaces
which are difficult to probe by other techniques. 9 Although SHG and sum frequency
generation (SFG) have been used in many studies to examine Si(1 11) in UHV10, 11 and in
air 12, 13 application to Si/electrolyte and Si/SiO2/electrolyte interfaces have been almost
nonexistent. Of the two earlier electrochemical studies reported in this area,14, 15 both
were performed prior to recent advances in surface preparation procedures and neither
have involved the polarization and surface orientation experiments necessary to understand
the origin of the potential dependent response as has been done here.
The most striking result is the strong potential dependence that we observe in the
relative phase of the SH response, as measured with rotational anisotropy experiments, 1 6
from both the H-terminated surfaces and surfaces with oxides. We attribute the potential
dependence for both the predominately H-terminated and the oxide covered surface to the
change in the static field at the surface and within the space-charge region (SCR) of the
semiconductor. In the presence of the insulating oxide layer, the potential dependence can
be interpreted in terms of a screening of the portion of the applied dc field. The work

demonstrates that such phase measurements provide a new means of characterizing the 3
properties of the space charge region and the field drop across the insulating oxide layer.
The ability to observe potential dependence and its origin has been questionable up to this
point because of the relatively large bulk response from semiconductors. A recent report
has investigated the effect of the depletion layer electric field on the SHG response from
GaAs(001) under UHV conditions but this study was limited to a smaller range of electric
fields than reported here and was performed only on native surfaces. 17
IH. THEORETICAL CONSIDERATIONS
When a potential is applied across a semiconductor/electrolyte interface, the second
harmonic response can be written asc c 1 2 + 2 s2 ) +2ISH P ('+ Ac) I (1)
where P corresponds to the linear Fresnel factors, Xis2) and .,(2) are the surface and bulk
susceptibilities, 13A4b is the effective cubic nonlinearity arising from the static field
which includes all terms that vary linearly with field strength. 18 Ab is the potential drop
across the semiconductor space charge region and is proportional to the difference between
the applied (Eapp) and the flatband (Efb) potential. When the SH response is dominated by
the cubic nonlinearity term, the observed potential dependence should be parabolic with a
minimum near the flatband potential. Such behavior has been observed in numerous
studies of metal/electrolyte systems. Under conditions where the surface and/or bulk
quadratic nonlinearities dominate, parabolic potential dependence with a minimum shifted
from flatband would be observed.
By judicious choice of input and output polarizations, and by monitoring the
variation in the SH response as the cubic sample is rotated azimuthally, a detailed analysis
of the relative contribution from the various tensor elements, Xijk, can be performed. 1 3
The observed angular variation (rotational anisotropy) can be related to the overall
symmetry of the surface atomic structure. The intensity of this azimuthal dependcice for a

(111) surface and the input and output polarizations used here can be described by the 4
phenomenological equations 19
l(2cz)p~p la (-") + c(3)cos(3ý) 12 (2)
I(2o)p,s - bIO )sin(3)) 12 (3)
where the azimuthal angle ) is defined as the angle between the [211] direction and the
projection of the incident wavevector parallel to the surface. The subscripts p and s denote
the beam polarizations for the fundamental and second harmonic respectively. The
isotropic coefficient a (-*), and the anisotropic coefficients, bW) and c(3), contain both the
Fresnel coefficients as well as the material susceptibility elements. The isotropic
coefficient, often discussed as the out-of-plane response, contains the three independent
surface tensor elements X.,, X., and Xi- (i=x,y) as well as the bulk elements ý and y.
The anisotropic coefficients contain the in-plane X. surface tensor element and bulk
element t. Because the experiments conducted under both p-input and output polarizations
(Eq. 2) involve an interference between a(**)and c(3) the fits to the data provide information
about the relative magnitude and phase of these two terms. For the potential dependent
measurements, X(3) has the same form as X() as a result of the applied field being parallelijkl ijk
to the surface normal about which the sample is rotated.
MI. EXPERIMENTAL METHODS
The optical measurements employ the fundamental output from a 10 Hz Nd:YAG
laser producing 10 nsec pulses which illuminate the surface at a 32" incident angle. Pulses
of -0.3 J/cm2 were used which is below the damage threshold for silicon. The optics,
detection instrumentation and electrochemical cell are similar to that described
previously.2 0 The silicon wafers are n-doped with phosphorus with a resistivity of 3.0 to
6.5 fl-cm which represents a defect doping density of -1015 cm-3 . The 0.66-0.71 mm
thick samples are degreased by ultrasonification in separate baths of methylene chloride,
acetone, and methanol and dried with nitrogen. The back of the wafer is etched for one
minute in 48% hydrofluoric acid to remove the native oxide and then mounted on Ga-In

eutectic that has been placed on an embedded copper contact in a Kel-F shaft. A mask 5
containing an embedded acid resistant fluorocarbon o-ring is used to seal the surface from
the electrolyte.
The silicon wafer is prepared by etching in buffered NH4 F solution which is known
to leave the surface in a H-terminated state. 2 This is followed by immersion in 0.1 M
NH4 F if a hydrogen terminated surface is to be maintained, or in 0.1 M H2 SO 4 if an oxide
is to be grown. Oxides are grown on the Si samples photoanodically by the stepwise
increase in potential from the flatband to a final potential of +5.0 V while keeping the
anodic current below 30gA/cm2 . A HeNe laser is used for illumination. Thicknesses of
the oxides are determined by a combination of ellipsometry, photocurrent measurements,
and etch-back times. All potentials are referenced to the saturated calomel electrode
(SCE). Flatband potentials are determined by photocurrent transients.
IV. RESULTS AND DISCUSSION
Figure 1 shows the rotational anisotropy in the SH response with p,p polarization
for a Si(1 11) surface studied in NH4F (Fig. 1(a)) and H2S04 (Fig. 1(b)) at potentials near
flatband, -0.65 V and -0.6 V respectively. Both samples were etched for 3 min. in 2.0 M
NH 4F at pH 4.5 to produce a H-terminated surface prior to immersion. The three-fold
symmetry expected of this (111) surface of a cubic lattice is observed in both solutions.
The results for the surface in NH4F gives a phase angle for c(3)/a(•) of 25 ± 55. Previous
studies suggest that this surface in NH4F should remain predominately H-terminated when
potentiostated near the flatband. 2 , It should also be relatively free of any photogenerated
surface oxides since in fluoride containing electrolytes, the dissolution of this oxide should
compete with the photo-oxidation process. The response from the same surface studied in
H2 SO 4 is similar but the phase angle fluctuates between 300 - 60). The flatband potential
also varies slightly in time. We attribute both variations to photogenerated surface species
which can store charge at the interface. From photocurrent measurements we estimate the
amount of photogenerated species to be less than 3 ML.
The potential dependence of a Si(O 11) surface in 0.1 M NH4F has been examined 6
between -0.65 V (flatband) and +1.0 V. The experiments have been conducted at ý = 30'
so as to isolate the potential dependence in the isotropic and anisotropic contributions. As
shown in Figure 2(a), both the isotropic and anisotropic response are found to have a
parabolic potential dependence with a higher overall signal level from the latter. The
isotropic response which would most readily couple to the applied static field has a
minimum near +0.26 V, =900 mV from the flatband potential. This field can couple to a
depth of the space charge region, which for this surface biased at +0.3 V is on the order of
1200 nm. The anisotropic in-plane response has a minimum near +1.6V, even further
away from flatband. In H2SO 4 the minima for the isotropic and anisotropic responses are
also shifted from flatband.
The fact that the minimum signal does not occur at the flatband for the isotropic or
anisotropic response in either solution suggests that terms other than j A4) in Eq. 1 must
be contributing. j2 is the likely factor considering that the penetration depth of the light
is on the order of 1 cm, considerably deeper than the SCR. Previous studies in air have
determined that the SH contribution from the surface and the bulk of Si(1 11) are of similar
magnitude. 1 3 Further evidence for the importance of the bulk response comes from the
observation that when Si(1 11) surfaces are roughened by etching in 48% HF prior to
introduction into the NH4F, the rotational anisotropies for the roughened and unroughened
samples are quite similar. There is no evidence of an isotropic response from a disordered
silicon surface superimposed on the response from the crystalline lattice. The intensity of
the overall response is however slightly larger in the roughened case, suggesting that i(2)S
is not insignificant. Analysis of the response in Fig. 2(a) based on Eq. 1 indicates that the
sum of (i(2) + 1(')) is at least of comparable magnitude to the contribution from
In earlier work it was assumed that the electrode polarization was absolute with
respect to zero applied potential (flatband) and a model of quadratic dependence of the
SHG with applied potential was found to fit the data. 15 Although the flatband was not
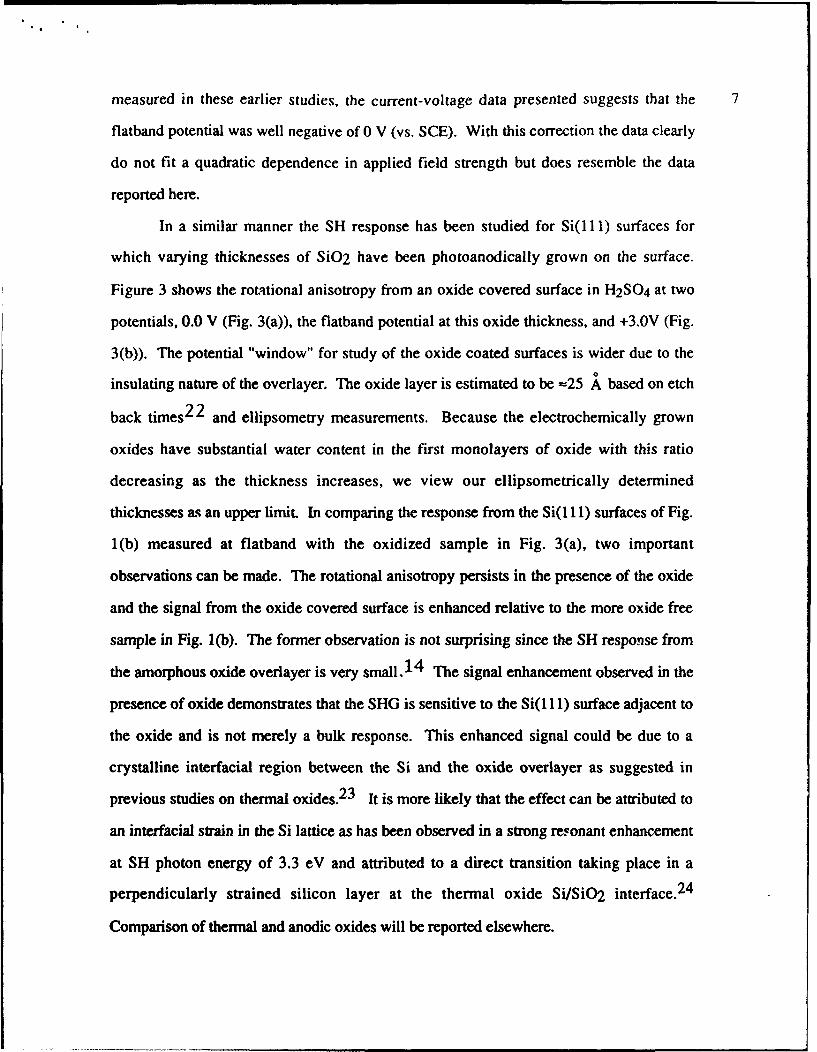
measured in these earlier studies, the current-voltage data presented suggests that the 7
flatband potential was well negative of 0 V (vs. SCE). With this correction the data clearly
do not fit a quadratic dependence in applied field strength but does resemble the data
reported here.
In a similar manner the SH response has been studied for Si(l 11) surfaces for
which varying thicknesses of SiO2 have been photoanodically grown on the surface.
Figure 3 shows the rotational anisotropy from an oxide covered surface in H2 SO4 at two
potentials, 0.0 V (Fig. 3(a)), the flatband potential at this oxide thickness, and +3.OV (Fig.
3(b)). The potential "window" for study of the oxide coated surfaces is wider due to the
insulating nature of the overlayer. The oxide layer is estimated to be =25 A based on etch
back times2 2 and ellipsometry measurements. Because the electrochemically grown
oxides have substantial water content in the first monolayers of oxide with this ratio
decreasing as the thickness increases, we view our ellipsometrically determined
thicknesses as an upper limit. In comparing the response from the Si(1 11) surfaces of Fig.
l(b) measured at flatband with the oxidized sample in Fig. 3(a), two important
observations can be made. The rotational anisotropy persists in the presence of the oxide
and the signal from the oxide covered surface is enhanced relative to the more oxide free
sample in Fig. 1(b). The former observation is not surprising since the SH response from
the amorphous oxide overlayer is very small. 14 The signal enhancement observed in the
presence of oxide demonstrates that the SHG is sensitive to the Si(1 11) surface adjacent to
the oxide and is not merely a bulk response. This enhanced signal could be due to a
crystalline interfacial region between the Si and the oxide overlayer as suggested in
previous studies on thermal oxides.2 3 It is more likely that the effect can be attributed to
an interfacial strain in the Si lattice as has been observed in a strong resonant enhancement
at SH photon energy of 3.3 eV and attributed to a direct transition taking place in a
perpendicularly strained silicon layer at the thermal oxide Si/SiO2 interface. 24
Comparison of thermal and anodic oxides will be reported elsewhere.
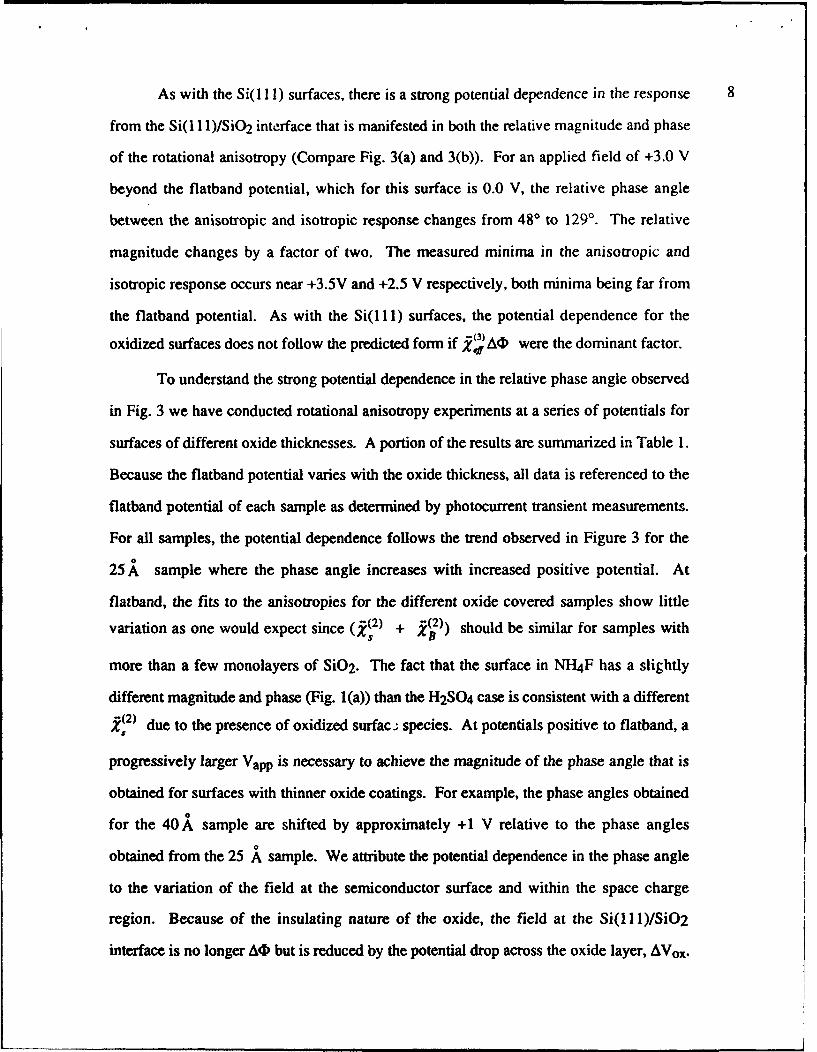
As with the Si( 111) surfaces, there is a strong potential dependence in the response 8
from the Si(l 1 1)/SiO2 interface that is manifested in both the relative magnitude and phase
of the rotational anisotropy (Compare Fig. 3(a) and 3(b)). For an applied field of +3.0 V
beyond the flatband potential, which for this surface is 0.0 V, the relative phase angle
between the anisotropic and isotropic response changes from 480 to 129'. The relative
magnitude changes by a factor of two. The measured minima in the anisotropic and
isotropic response occurs near +3.5V and +2.5 V respectively, both minima being far from
the flatband potential. As with the Si(l 11) surfaces, the potential dependence for the
oxidized surfaces does not follow the predicted form if •,'AD were the dominant factor.
To understand the strong potential dependence in the relative phase angle observed
in Fig. 3 we have conducted rotational anisotropy experiments at a series of potentials for
surfaces of different oxide thicknesses. A portion of the results are summarized in Table 1.
Because the flatband potential varies with the oxide thickness, all data is referenced to the
flatband potential of each sample as determined by photocurrent transient measurements.
For all samples, the potential dependence follows the trend observed in Figure 3 for the
25 A sample where the phase angle increases with increased positive potential. At
flatband, the fits to the anisotropies for the different oxide covered samples show little
variation as one would expect since (i(2) + 1(2)) should be similar for samples with
more than a few monolayers of SiO2 . The fact that the surface in NH4 F has a slightly
different magnitude and phase (Fig. 1(a)) than the H2SO4 case is consistent with a different,(2) due to the presence of oxidized surfac , species. At potentials positive to flatband, a
progressively larger Vapp is necessary to achieve the magnitude of the phase angle that is
obtained for surfaces with thinner oxide coatings. For example, the phase angles obtained
for the 40 A sample are shifted by approximately +1 V relative to the phase angles
obtained from the 25 A sample. We attribute the potential dependence in the phase angle
to the variation of the field at the semiconductor surface and within the space charge
region. Because of the insulating nature of the oxide, the field at the Si(1 11)/SiO2
interface is no longer A4 but is reduced by the potential drop across the oxide layer, AVox.
This would suggest, for example, that the additional 15 A, of oxide on the surface screens
approximately IV of the overall applied field relative to the 25,A sample. Later
publications will address in more detail the correlation between phase and amplitude
changes in the SH response with oxide thickness, doping density, and oxide composition.
In summary, SHG studies of hydrogen terminated Si( 111) electrode surfaces and
Si(l1l)/SiO2 electrode surfaces of varied oxide thickness have been examined to
determine the origin of the nonlinear response. The potential dependence from the initially
prepared H-terminated surfaces in NH4 F suggests that the potential independent bulk
response is significant in contrast to previous studies 14 ' 1 5 which have described the
response solely in terms of the field dependent third order term. For oxidized surfaces the
response from the Si(1 11)/SiO 2 interfacial region is highly sensitive to the band bending
conditions in the semiconductor and the insulating nature of the oxide overlayer. The
studies show the sensitivity of SHG to the electrostatic properties of the Si/SiO2 electrolyte
interface and demonstrate the utility of extending this method to semiconductor electrode
surfaces. Studies are underway to provide a more quantitative comparison between oxide
properties and the potential dependent response for these surfaces.
Acknowledgments:
Funding from the National Science Foundation (CHE 8451346) is gratefully
acknowledged.

Figure Captions 10
Figure 1. Rotational anistropy from Si(I 11) for p-input and p-output polarizations. (a)
Si( 111) in 0.1 M NH4F biased at the flatband potential of -0.65 V. Best fit of Eq. 3
to the data yields c(3)/a(-) = 2.2c" 1% (b) Si(11) in 0.1 M 1'2SO4 biased at the
flatband potential of -0.6 V; c(3)/a" = 1.7ei44.
Figure 2. Potential dependence in the isotropic a(-) and anisotropic response c(3 ) for
Si(1 11) prepared in a H-terminated state and biased in 0.1 M NH4 F. The isotropic
response was monitored with p-polarized incident light and p-polarized SHG with ý
= 300. The anisotropic response was monitored with p-polanized incident light and
s-polarized output light at • = 300.
Figure 3. Rotational anisotropy in the p-input and p-output SH response from an oxidized
Si(1 11) sample in 0.1 M H2SO4 with approximately 25 A of SiO2. (a) At 0.0 V
(flatband), with c(3)la- = 2.3ei48"; (b) At +3.0 V, c 3 )la- = 4.7ei129 ".
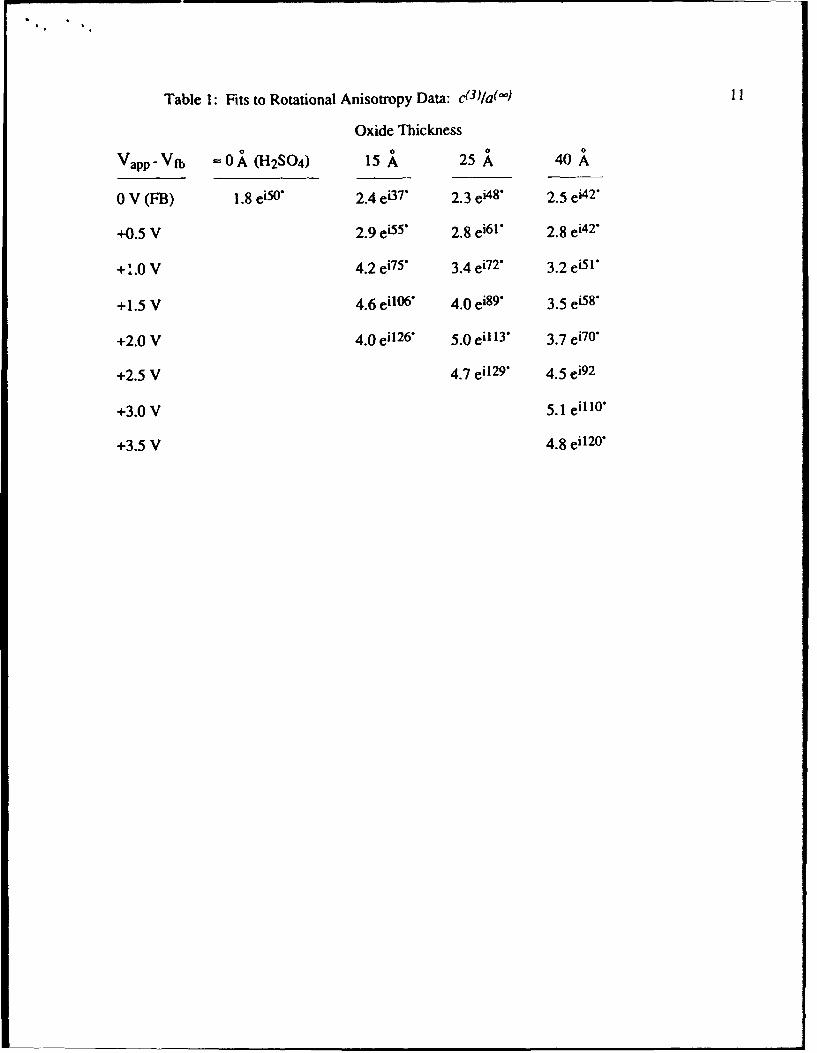
Table 1: Fits to Rotational Anisotropy Data: c(3)/a(-) 11
Oxide Thickness
Vapp-Vfb -0 A (H 2SO 4) 15 , 25 , 40 A-
0 V (FB) 1.8 ei50 " 2.4 ei37" 2.3 ei4 8 " 2.5 ei42"
+0.5 V 2.9 ei55 " 2.8 ei61 " 2.8 ei4 2 "
+L.0 V 4.2 e075' 3.4 ei7 2" 3.2 e05 1*
+1.5 V 4.6 ei106" 4.0 ei89 " 3.5 e058
+2.0 V 4.0 ei126* 5.0 eil 13" 3.7 ei70 "
+2.5 V 4.7 e' 129 4.5 ei92
+3.0 V 5.1 eill0"
+3.5 V 4.8 ei120*
References: 12
1. P. Jakob, Y.J. Chabal, K. Ragahavachari, R.S. Becker and A.J. Becker, Surface Science
275 (1992) 407.
2. G.S. Higashi, Y.J. Chabal, G.W. Trucks and K. Raghavachari, Appl. Phys. Lett. 56
(1990) 656.
3. H.J. Lewerenz and T. Bitzer, J. Electrochem. Soc. 139 (1992) L21.
4. G.S. Higashi, R.S. Becker, Y.J. Chabal and A.J. Becker, Appl. Phys. Lett. 58 (1991)
1656.
5. H.E. Hessel, A. Feltz, M. Reiter, U. Memmert and R.J. Behm, Chem. Phys. Lett. 186
(1991) 275.
u. M. Szklarczyk, A. Gonzalez-Martin, 0. Velev and J.0. Bockris, Surface Science 237
(1990) 305.
7. R. Houbertz, U. Memmert and R.J. Behm, Appl. Phys. Lett. 62 (1993) 2516.
8. Y. Kim and C.M. Lieber, J. Am. Chem. Soc. 113 (1991) 2333.
9. G.L. Richmond, J.M. Robinson and V.L. Shannon, Prog. in Surf. Sci. 28 (1988) 1.10. T.F. Heinz, M.M.T. Loy and W.A. Thompson, Phys. Rev. Lett. 54 (1985) 63.11. T.F. Heinz, M.M.T. Loy and W.A. Thompson, J. Vac. Sci. Technol. B 3 (1985) 1467.
12. H.W.K. Tom, T.F. Heinz and Y.R. Shen, Phys. Rev. Lett. 51 (1983) 1983.
13. H.W.K. Tom, Ph.D. Dissertation University of California, Berkeley,1984.
14. O.A. Aktsipetrov and E.D. Mishina, Phys. DokI. Akad. Nauk SSSR 274 (1984) 62.
15. C.H. Lee, R.K. Chang and N. Bloembergen, Phys. Rev. Lem. 18 (1967) 167.
16. H.W.K. Tom, T.F. Heinz and Y.R. Shen, Phys. Rev. Let. 51 (1983) 198?.
17. J. Qi, M.S. Yeganeh, I. Koltover, A.G. Yodh and W.M. Theis, Phys. Rev. Lett. 71
(1993) 633.
18. P. Guyot-Sionnest and A. Tadjeddine, J. Chem. Phys. 92 (1990) 734
19. J.E. Sipe, D.J. Moss and H.M. van Driel, Phys. Rev. B 35 (1987) 1129.
20. D.A. Koos, V.L. Shannon and G.L. Richmond, J. Phys. Chem. 94 (1990) 2091.
21. L.M. Peter, D.J. Blackwood and S. Pons, J. Electroanal. Chem. 294 (1990) 111.
22. H.J. Lewerenz, Electrochim. Acta 37 (1992) 847.
23. L.L. Kulyuk, D.A. Shutov, E.E. Strumban and O.A. Aktsipetrov, J. Opt. Soc. Am. B:
Opt. Phys. 8 (1991) 1766.
24. W. Daum, H.-J. Krause, U. Reichel and H. Ibach, Phys. Rev. Lett. 71 (1993) 1234.

2.5 f
2.0 a08
__• 1.5
c8: 1.0
_ 0.50 0
>, 0.02.5
cQ- b)A-,- 2.0
T- 1.5U)
1.0
0.5
0.00 60 120 180 240 300 360
Rotation angle
I- "3

1.0
c Id
(f 0.5ci
--
I
0.0t -0.5 0.0 0.5 1.0
FB Potential (V vs. SCE)

5
a)w
4
3
2 0
00 0c-, I
0 b
c•
0 60 120 180 240 300 360
Rotation angle
F;