ada 428748
DESCRIPTION
adaTRANSCRIPT
Nicole T. VuHua ZhuEdward D. OwuorMark E. HugginsVicky L. WhiteArvind K. ChaturvediDennis V. CanfieldJames E. Whinnery
Civil Aerospace Medical InstituteFederal Aviation AdministrationOklahoma City, OK 73125
January 2004
Final Report
This document is available to the publicthrough the National Technical InformationService, Springfield, Virginia 22161.
Office of Aerospace MedicineWashington, DC 20591
Isolation of RNA From Peripheral Blood Cells: A Validation Study for Molecular Diagnostics by Microarray and Kinetic RT-PCR Assays Application in Aerospace Medicine
DOT/FAA/AM-04/1
ö U.S. Department of Transportation
Federal Aviation Administration

NOTICE
This document is disseminated under the sponsorship ofthe U.S. Department of Transportation in the interest ofinformation exchange. The United States Government
assumes no liability for the contents thereof.

i
Technical Report Documentation Page 1. Report No. 2. Government Accession No. 3. Recipient's Catalog No.
���������������� � � �4. Title and Subtitle 5. Report Date
���������������������������������������������������������������������������������������������������������������������������������������������������������������������
�������������
7. Author(s) 8. Performing Organization Report No.
��������������������������������������������������������������������������������������9. Performing Organization Name and Address 10. Work Unit No. (TRAIS)
11. Contract or Grant No.
�����������������������������������������������������������������������������12. Sponsoring Agency name and Address 13. Type of Report and Period Covered
�������������������������������������������������������������������������������������������������������������� 14. Sponsoring Agency Code
15. Supplemental Notes
���������������������������������������������������������������������16. Abstract
��������������������������������������������������������������������������������������������������������������������������������������������������������������������������������������������������������������������������������������������������������������������������������������������������������������������������������������������������������������������������������������������������������������������������������������������������������������������������������������������������������������������������������������������������������������������������������������������������������������������������������������������������������������������������������������������������������������������������������������������������������������������������������������������������������������������������������������������������������������������������������������������������������������������������������������������������������������������������������������������������������������������������������������������������������������������������������������������������������������������������������������������������������������������������������������������������������������������������������������������������������������������������������������������������������������������������������������������������������������������������������������������������������������°��������������������������������������������������������������������������������������������������������������������������������β������������������������������������������������������°���������������������������������������������������������������������������������������������������������������������������������������������������������������������������������������������������������������������������������������������������������������������������������������������������������������������������������������������������������������
17. Key Words 18. Distribution Statement
����������������������������������������������������������������������������������������������������������������������������������������������������
�������������������������������������������������������������������������������������������������������������������
Security Classif. (of this report) 20. Security Classif. (of this page) 21. No. of Pages 22. Price
������������� ������������� ���Form DOT F 1700.7 (8-72) Reproduction of completed page authorized


1
ISOLATION OF RNA FROM PERIPHERAL BLOOD CELLS: A VALIDATION STUDY FOR MOLECULAR DIAGNOSTICS BY MICROARRAY AND
KINETIC RT-PCR ASSAYS APPLICATION IN AEROSPACE MEDICINE
INTRODUCTION
Extraction of cellular RNA is a critical step in the search for molecular information pertinent to gene expression. Expression profile studies in clinical diag-nostic settings often involve samples collected in the field and at different time points, thereby requiring effective methods for collection, transportation, stor-age, and isolation of RNA to maintain the integrity of expression profiles. Human whole blood is a practical source of RNA for analysis of environmental exposure, performance evaluation, and pathogenesis of diseases because blood constituents maintain homeostasis, effect immunity and inflammation (1), or function as mediators in stress signaling (2-3) and in cellular communication of vascular associated tissues including those of the central nervous system (4-7). However, whole blood is a chal-lenging tissue, since RNA information primarily resides in the small number of circulating blood leukocytes (8). Leukocytes comprise only 0.1% of the blood cellular fraction with approximately 5% of erythrocytes being in different stages of maturation and, therefore, having preformed mRNAs (9). Thus, isolation strategies using whole blood should recognize the limited quantities of useful RNA that must be protected from the hostile leukocyte ribonucleases, in addition to the abundance of preformed mRNA in reticulocytes, high protein con-tent, and transcriptional activation of cells during sample processing in vitro. The challenges are how to preserve valid gene expression profiles from sample collection to isolation and how to maximize RNA yields and purity for sensitive downstream analyses. While different uses of nucleic acids have motivated many different ways for mRNA enrichment, the efficiency of these methods has not been determined for expression profiling of human whole blood. This report presents data demonstrating that the collection, treatment, and storage of collected blood samples can affect subsequent RNA isolation and analysis. Further, this report shows that total RNA isolated from human whole blood using the modified procedure of PAXgene Blood RNA reagent kit is suit-able for gene expression analysis by cDNA microarray and kinetic RT-PCR assays.
MATERIALS AND METHODS
All reagents and supplies were sterile, nucleases free, and of molecular biology grade.
Sample CollectionHuman whole blood was obtained from fully informed
volunteer donors with the assistance of the Oklahoma Blood Institute (Oklahoma City, OK). Blood specimens were collected using a Safety-Lok Blood Collection Set (Becton Dickinson, Franklin Lakes, NJ) directly into PAXgene Blood RNA Tubes (Qiagen Inc., Valencia, CA) that contain a proprietary mixture of chemical ad-ditives for rupturing blood cells and stabilizing cellular RNA (10). The first 2-mL of blood was collected into an EDTA-coated Vacutainer Plus tube (Becton Dickinson, Franklin Lakes, NJ) as a discard sample. A total of 50-mL whole blood was collected from each of the 4 donors using quantitative phlebotomy technique. Samples were gently mixed at room temperature (RT) on a hematology/chemistry mixer (Fisher Scientific, Pittsburgh, PA) for at least 2 hours to ensure complete cell lysis and inactivation of ribonucleases prior to isolation of total RNA.
To investigate the effects of storage temperature and aging of samples on RNA recovery, blood samples from the same subject were pooled into a single batch, and then each 18-mL portion of blood solution (≈ 5 mL whole blood + additive solution) was transferred to a sterile 50-mL polypropylene tube (Becton Dickinson, Franklin Lakes, NJ). Sample aliquots were stored at either room temperature (RT) or 4°C for up to 10 days and were processed for RNA isolation at different time intervals (i.e., fresh, 24, 48, 72, 120, and 240 h).
Isolation of Total RNA from Human Whole BloodTotal RNA was isolated according to the PAXgene™
protocol (11) with simple modifications. The nucleic acids were concentrated at 3000 × g in the Eppendorf 5810R (Brinkmann Instruments Inc., Westbury, NY) for 15 min with subsequent removal of the supernatant by aspiration. Each sample had 60 µL proteinase-K applied to it after the addition of standard volumes of suspension buffer (BR1) and binding buffer (BR2). Protein digestion

2 3
was carried out at 55°C for 20 min in a heat block with occasional vortex to ensure mixing. The digested mixture was centrifuged at 10,000 × g for 10 min to collect the supernatant. Following the separation of nucleic acids by affinity column, genomic DNA was digested with RNAse-free DNAse I directly on the column prior to elution. Contaminating salts and cellular impurities were removed by successive washing, and the RNA was eluted twice in 40 µL each of elution buffer (BR5). RNA yield and purity were first determined by UV scan (200–400 nm) using Ultrospec 4300 Pro (Amersham Biosciences Corp., Piscataway, NJ), with RNA integrity evaluated by electrophoresing 10 µL of each RNA sample (≈ 0.3-1.0 µg) from a denaturing gel-loading solution (formaldehyde/formamide/EtBr) on 1.2 % agarose gel in 1× MOPS running buffer (pH 7.00). Electrophoresis was performed at 60 V (110 mA) for 1.5 h using the FB650 DC power source (Fisher Biotech, Pittsburgh, PA). Im-ages of the developed gels were acquired by the Typhoon 9210 (Amersham Biosciences Corp., Piscataway, NJ) at a resolution of 100 µm and 600-V PMT. Selected RNA samples from the refrigerated group were next analyzed by RT-PCR and array hybridization.
Reverse Transcription and Quantitation in Real-Time PCR (RT-QPCR)
To determine the performance of isolated total RNA in RT-PCR, aliquots of total RNA were amplified us-ing specific primers corresponding to regions of human β-actin and cyclophilin genes, according to the protocol previously developed in our laboratory (12). Briefly, RT was performed with 0.6 µg total RNA and the MMLV reverse transcription system using random primers (Invit-rogen, Carlsbad, CA). Platinum Taq DNA polymerase (Invitrogen, Carlsbad, CA) and Taqman® PDAR probe technology (Applied Biosystems, Foster City, CA) were employed in PCR assay of 5 µL RT products using the Smart Cycler (Cephied, Sunnyvale, CA) with real-time detection capability. Cyclophilin and β-actin were du-ally labeled with TET/BHQ-1 (Biosource International, Camarillo, CA) and FAM/TAMRA (Applied Biosystems, Foster City, CA), respectively. Plasmid DNAs with cloned PCR products of β-actin or cyclophilin were used to construct calibration curves for quantitation of the gene transcripts. The plasmids were prepared using pCRII-TOPO vector and TOPO TA cloning technology (In-vitrogen, Carlsbad, CA).
Microarray HybridizationTo investigate the effects of storage at 4°C on gene
expression profiles, the total RNA isolated from blood samples of one subject was converted to fluorescent-labeled
cDNA using the modified and optimized BD Atlas Smart Fluorescent Probe Amplification protocol with random primers (13). Cy3-labeled cDNAs were generated for RNA isolated fresh and 72 h-aged blood samples, while Cy5-labeled cDNAs were generated for RNA isolated from blood samples after 24 and 240 h storage. The probes were hybridized, via dual labeling scheme to the Atlas Glass Trial Microarray (BD Biosciences, Palo Alto, CA) that includes 92 human gene targets and 8 control targets. Images of hybridized arrays were obtained with the Typhoon 9210 Multi-Modal Imager (Amersham Biosciences Corp., Piscataway, NJ) at the set PMT of 750 V. Image analysis was performed in ArrayVision (Imaging Research Inc., St. Catharines, Canada) and SigmaPlot (SPSS Inc., Chicago, IL).
RESULTS AND DISCUSSIONS
RNA IsolationAccess to RNA requires both cell lysis and inactiva-
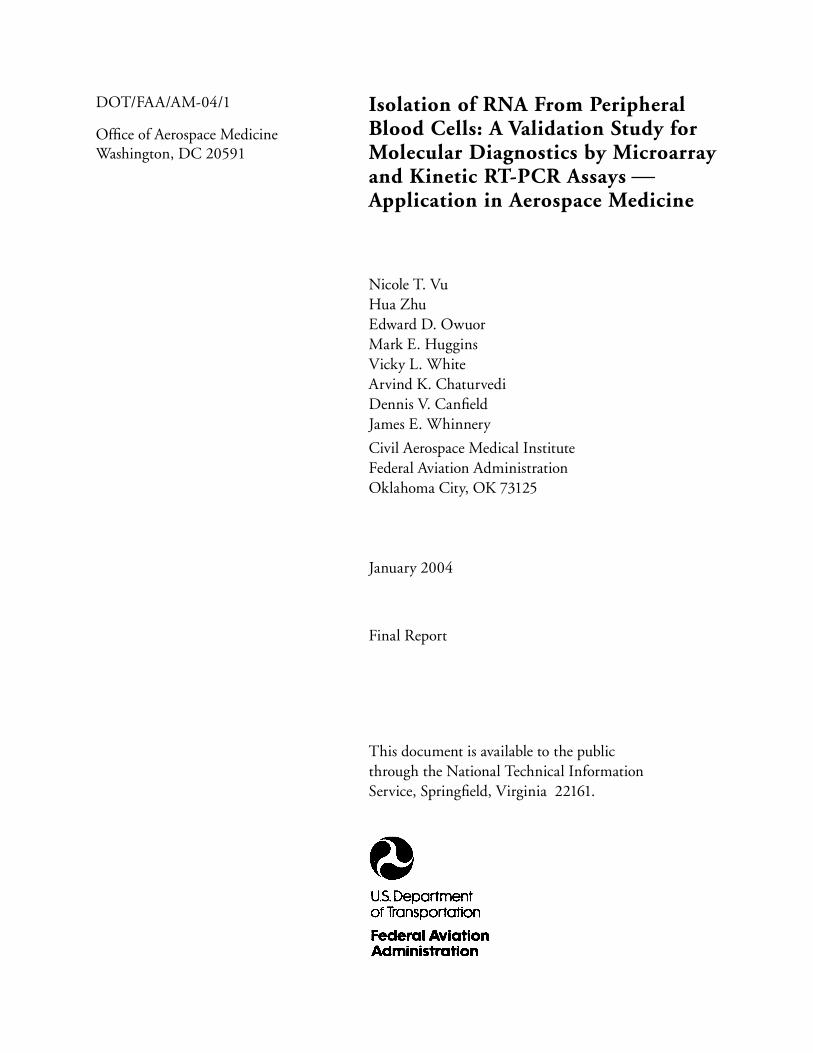
tion of cellular nucleases during isolation; hence, rigorous denaturing lysis conditions are imperative for obtaining intact RNA (14). Since human whole blood has a high protein content that can reduce extraction efficiency, protocols involving protease digestion should be em-ployed to remove protein contaminants, in addition to increasing RNA yield with greater purity (15). Classical methods using organic solvents can adversely affect the yield and quality of RNA due to the presence of trace phenol and are relatively inefficient for recovery of minute RNA quantities in peripheral blood (16-18). The PAX-gene protocol provides reagents for rapid stabilization of cellular RNA during sample collection, along with reagents for removal of hemoglobin and plasma proteins and, therefore, has potential for producing high quality RNA from blood. Preliminary investigation indicated that simple modifications to the PAXgene RNA isolation protocol, enabling 5-mL whole blood to be processed in a single tube, resulted in saving time and reagents, with no significant change in RNA recovery. The yield of RNA from peripheral blood leukocytes acutely depends on the physiologic state of the donor, reflecting the dynamic shift in circulating white blood cell fraction with subsequent wide-ranging variability on RNA constituents and their yields (9,19). Typically, the amount of RNA isolated in this study was 3 – 10 µg from 5-mL whole blood with a high purity ratio ranging from 1.9 to 2.1, except for RNA from samples that had passed 72 h storage at RT (Table 1). Illustrated in Figure 1 are changes in A
260 over
the elapsed time up to 10 d for samples stored at RT and 4°C. Although the entrapment of nucleic acids in a whitish film of lipids, proteins, or carbohydrates may
2 3
������������������������������������������������������������������������������������������������������
����������������������������������������
������������������
������ ������������ ���������������������� ������������ ���������������������� ������������ ���������������������� ������������ ����������������������� ������������ ����������������������� ������������ ������������
����������� ������������ ����������������������� ������������ ����������������������� ������������ ������������������������ ������������ ������������������������ ������������ ������������
���������������������������������������������������������������������������������������������������������������������������������������������������������������������������������������������������������������������������������������������������������������������������������������������������
Elapsed Time (day)
0 2 4 6 8 10 12
Abs
orba
nce
(A26
0)
0.0
0.2
0.4
0.6
0.8
1.0
RTRefrigeration
Figure 1: Changes in absorbance A260 for RNA isolated from human whole blood stored in PAXgene Blood Tubes for up to 10 d at room temperature (RT) and 4°C (Refrigeration). RNAs from freshly collected blood samples were isolated on Day 0 and served as reference for all subsequent comparisons. Lines are median A260 values (n = 3).

4 5
have contributed to low A260
values in some samples, the median A
260 values for the refrigerated group were
not significantly different from that for freshly isolated RNA samples (Friedman; p = 0.494). However, there was notable decline in A
260 within the RT group, start-
ing on the third d of storage, suggesting that peak RNA degradation occurred during this period at RT. Further analysis revealed that average RNA yields were consider-ably reduced by the 10th d (Dunnett’s; p < 0.05) and significantly different from average yields obtained from samples stored at 4°C (Bonferroni; p = 0.006). Accord-ingly, blood samples could be maintained for up to 72 h at RT in PAXgene reagents with negligible RNA loss; refrigeration delayed RNA breakdown for a much longer time. To be consistent with such effects, even though contrary to manufacturer’s information, it is therefore
prudent to keep blood samples at 4°C if RNA isolation is not promptly performed following sample collection in the PAXgene system of preservatives.
Following gel electrophoresis and depending on the tissue types, total RNA isolated from human tissues should produce a diffuse smear between 0.5 and 12 kb, with 2 bright 28S and 18S rRNA bands at approximately 4.5 and 1.9 kb, respectively. The ratio of the intensities of 28S to 18S rRNA bands should be ≈ 2:1 (11,14,20). Displayed in Figure 2 is a typical image of molecular weight distribution on 1.2% agarose gel for RNA puri-fied using the PAXgene system protocol. In examining electrophoresis data, the RNA samples exhibited banding patterns characteristic of RNA isolated from human blood. The 2 rRNA bands were within the expected ratio, no extra fragments were observed, and there were no signs
� � � ���� � � ���� � � ���� � � ��
� � � ��� � � ��� � � ��� � � ��� � � ��� � � ��� � � ��� �������� � ��
� ����� � ���� ���� � ���� ����� � ���� ������� � ��� ������� � ��� ������� � ��
� ������� � ��� ������� � ��� ������� � ��� ������� � ��� ������� � ��� ������� � ��
������� ��� ���� �������� ������ ��� ������������� ���� ���������������� �������� ��������� ��� ������ ���� ����� �� ������ ��������������������� ������������������������ ������� �������������������������������������������������������������������������������������� ���� ����������������� �����������������������������������������������������������������������������������������������������������������������������������������������������������������������������������������������������������������������������������������������
4 5
of genomic DNA contamination. As a result, it was judged that most samples were indeed composed of intact RNA and appeared to be comparable in quality, especially for samples stored at 4°C.
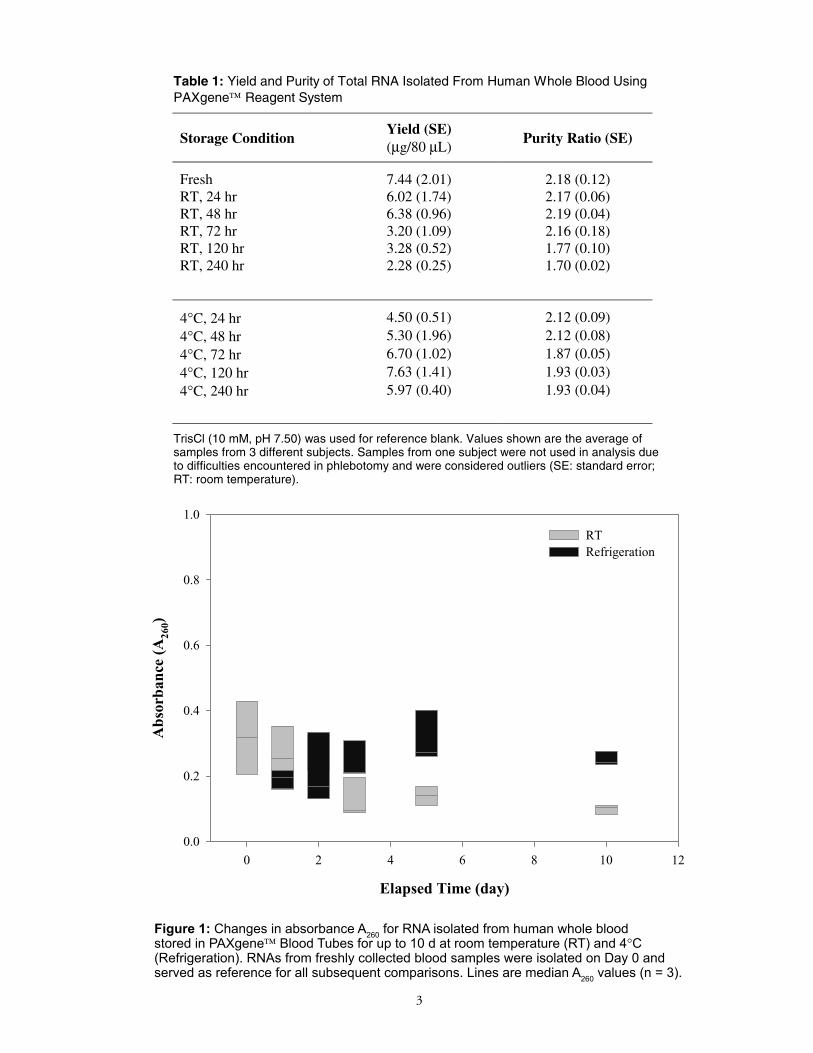
RT-PCRThe isolated RNA was tested by RT-PCR using primer
pairs designed to amplify a segment of the β-actin or cy-clophilin gene. Both β-actin and cyclophilin genes encode proteins that are essential for basal cellular activities and, therefore, are constitutively expressed in most cells (21-23). Amplification was easily accomplished with 0.6 µg total RNA isolated from fresh and stored human blood. Concentrations of β-actin (number of actin molecules) at cycle threshold (C
t) were determined from the external
calibration curve with log concentration values varied from 6.94 to 6.88, respectively, for fresh and 10-d aged
�������������������������������������������������������������������������������������������������������������������������������������������������������������������������� �������������� ���� ������ ����� ���� ��� ������� ������ �������� ����������������������������� ������ ��������� ���� ������ ���� ���� ����� ���������� ��� �������������������������������������������
�������������������
���
�������������������������
��������
blood samples (Figure 3). The β-actin concentration ratio was 0.87, which was slightly biased toward fresh blood sample, though not considered significant. Cyclophilin in the same RNA samples produced similar results, with inconsequential changes in C
t
and log concentration values after 10 d storage. The resultant cyclophilin concentration ratio was 0.91, suggesting modest deviation in the number of cy-clophilin mRNA transcripts that were isolated from fresh and stored blood samples. Although analysis by amplification is dependent on the relative abun-dance and the stability of the RNA molecule (24), nevertheless, the RT-PCR data, collectively with the electrophoresis and the spectrophotometric results, constitute an indication of negligible damage to total RNA during the 10 d storage at 4°C in PAXgene reagent system.
6 7
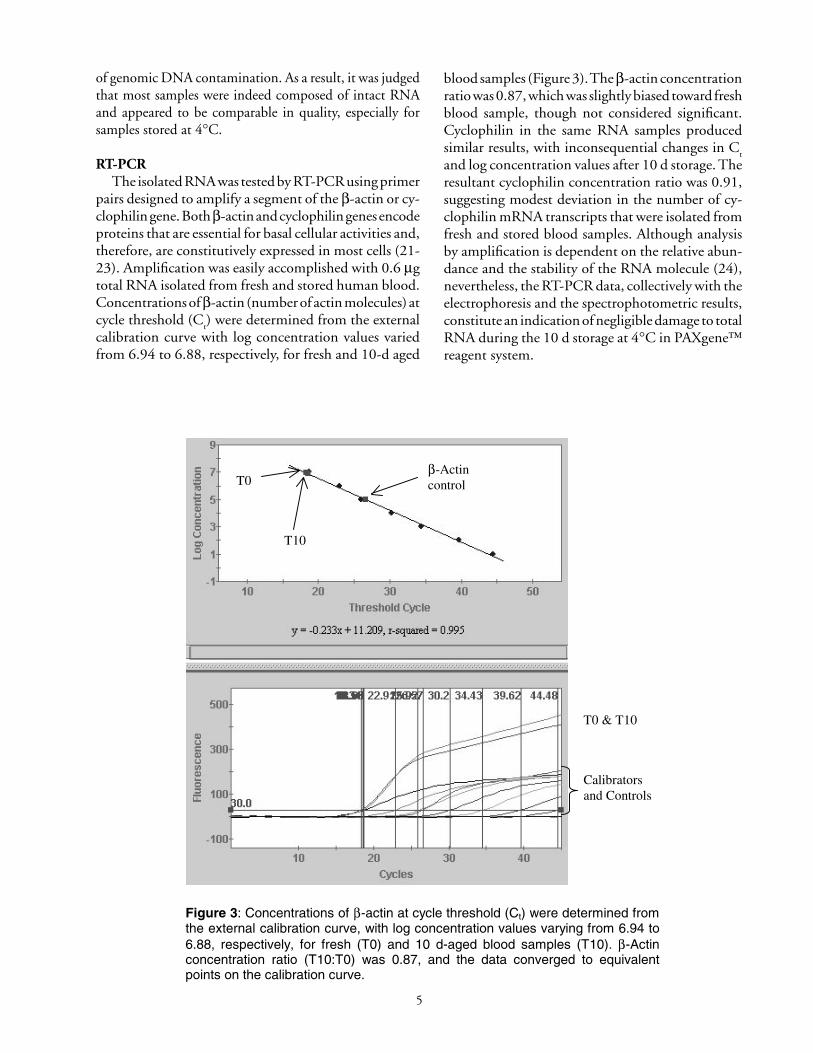
Microarray HybridizationThe Ratio-Average Intensity (RI) plot for data points
representing signals produced from intact RNAs on the tested cDNA microarray is illustrated in Figure 4. The intensity ratios for all array elements were based on volume intensity values, which had been background-subtracted, Cy3/Cy5-normalized, and artifact-removed using the ana-lytical algorithm in ArrayVision. Further normalization based on average intensity for blank elements from the respective arrays allowed pair-wise comparison among the hybridized samples. The derived intensity ratios entailed relative expression levels and were plotted in SigmaPlot as a function of log-transformed mean intensity for each gene spot (25-26). Here, log intensity ratios for hybridized cDNA probes produced by 24-, 72-, and 240-h refrigerated blood samples (i.e., T1, T3, and
T10, respectively) were established with a sample from freshly collected blood (T0) as a common reference. The convergence of data points to a tight line corresponding to intensity ratios of ≈ 1:1 indicates that signal intensities were essentially equivalent for these mRNAs, particularly data points representing extracted RNA from T1 blood sample. However, four genes (M65062, S62045, L34339, D13510) in the T1 and T10 samples deviated negatively from the reference sample as their log intensity ratios ranged from -0.973 to -1.539. Yet, T0 and T3 samples performed similarly in hybridization. This inconsistency in the observed data could reflect the fact that aging of samples was not the only factor that could contribute to the differential detection of these gene elements. It has been recognized that the Smart Fluorescent Probe Amplification using random primers maintains
21
Geometric Mean Intensity [Log(T0*T1*T3*T10)
0.25]
5.8 6.0 6.2 6.4 6.6 6.8 7.0 7.2
Log
Int
ensi
ty R
atio
-2
-1
0
1
2T3 v.s. T0
T10 v.s. T0
T1 v.s. T0
Figure 4: Reproducibility of mRNA profile by microarray hybridization analysis of selected gene targets using Atlas Glass Trial Microarrays. The data points for 96 array targets were correlated for all samples tested. cDNA probes were generated for RNA isolated from fresh (T0) and 72 h-stored blood (T3) samples by labeling with Cy3, while Cy5 was used to label cDNAs from 24 h (T1) and 240 h (T10) blood samples. Cy3- and Cy5-labeled probes were hybridized together on the same array. The optimized SMART Fluorescent Probe Amplification Protocol was employed using random primers.
6 7
representation of relative gene expression but can also in-troduce a slight ratio bias in hybridization signals (27-29). Alternatively, as was discussed in the study conducted in this laboratory (13), faithful replication of gene expression profiles was achieved with gene specific primers used in the probe synthesis procedure of the Smart protocol. Whereas disparity in hybridized signals remains to be verified by quantitative RT-PCR, preliminary analysis by Bonferroni procedure revealed insignificant differences (p > 0.05) between fresh and refrigerated blood samples at all time points. Thus, in spite of the fact that 4 % of the array elements were anti-correlated in a few instances of hybridization, the results from this study demonstrate acceptable reproducibility of the expression profiles using the PAXgene reagent systems and the described methods of sample collection and preservation.
SUMMARY
Human whole blood is an essential source of nucleic acids for clinical investigation, since it is readily accessible and rich in molecular information. However, blood is a challenging tissue for RNA isolation and the establish-ment of a suitable method for collection of experimental samples. All of these procedural steps need to be carefully verified to ensure validity of the experimental data when using blood as a sample source. We evaluated a simple modification of the established protocol that provides a convenient and reliable method for the purification of RNA from fresh human whole blood. A real-time RT-PCR assay was employed to determine RNA quality after isolation, along with microarray hybridization to assess the maintenance of gene expression patterns. The isolated total RNA using PAXgene system of reagents was of high purity and demonstrated excellent performance in RT-PCR and hybridization analyses. This report vali-dated the use of PAXgene blood collection tubes and RNA isolation reagents for purification of RNA from limited amounts of fresh and stored whole blood col-lected in human performance studies, specifically in the examination of acute alcohol effects on performance. It is anticipated that this methodology will ultimately en-able the characterization of molecular markers related to performance impairment for application in aerospace accident investigation and prevention.
REFERENCES
1. J.J. Oppenheimer, F.W. Ruscetti, C.R. Faltynek. 1987. Interleukins and interferons, pp. 82-95. In D.P. Stiles, J.D. Stobo, J.V. Wells (Eds.), Basic and Clinical Immunology, 6th ed. Los Altos, CA: Appleton & Lange.
2. D.L. Mann. 2003. Stress-activated cytokines and the heart: From adaptation to maladaptation. Annu Rev Physiol 65:81-101.
3. M.O. Kurrer, M. Kopf, J.M. Penninger, U. Eriks-son. 2002. Cytokines that regulate autoimmune myocarditis. Swiss Med Wkly 132:408-13.
4. S. Rivest. 1999. What is the cellular source of prostaglandins in the brain in response to systemic inflammation? Facts and controversies. Molecular Psych 4:501-7.
5. S. Laccroix , S. Rivest. 1998. Effect of acute sys-temic inflammatory response and cytokines on the transcription of the genes encoding cyclooxygenase enzymes (COX-1 and COX-2) in the rat brain. J. Neurochem 70:452-66.
6. C. Rivier. 1993. Neuroendocrine effects of cytokines in the rat. Rev Neuro Sci 4:223-37.
7. H. Anisman, Z. Merali. 2002. Cytokines, stress, and depressive illness. Brain Behav Immun 16(5):513-24.
8. D. Kephart, H. Shenoi. 1998. Molecular diagnos-tics: Isolation and analysis of RNA from human blood. In Promega Notes 68:23-6. Promega Cor-poration, Madison, WI.
9. D.A. Nelson, F.R. Pady. 1979. Hematopoiesis, p. 918-63. In J.B. Henry (Ed.), Clinical Diagnosis and Management, Vol I, 16th ed. West Washington Square, PA: W.B. Saunders.
10. PAXgene Blood RNA Tubes, package insert. 2001. PreAnalytiX GmbH, Hom-brechtikon, CH.
11. PAXgene™ Blood RNA Kit Handbook. 2001. PreAnalytiX GmbH, Hombrechtikon, CH.

8
12. H. Zhu, N.T. Vu, E.D. Owuor, M.E. Huggins, V.L. White, A.K. Chaturvedi, D.V. Canfield, J.E. Whinnery. Expression measurement by kinetic RT-PCR: Absolute determination of gene transcripts with cloned plasmid as internal standard for vali-dating differential expression of environmentally responsive genes. Office of Aerospace Medicine, Department of Transportation, Federal Aviation Administration. (In press).
13. E.D. Owuor, N.T. Vu, H. Zhu, M. E. Huggins, V. L. White, A.K. Chaturvedi, D.V. Canfield, J.E. Whinnery. Optimization of SMART probe syn-thesis for hybridization analysis by microarray using human bloodapplication to studies of human performance in aerospace environment. Office of Aerospace Medicine, Department of Transporta-tion, Federal Aviation Administration. (In press).
14. J. Sambrook, E.G. Fritsch, T. Maniatis (Eds.) 1989. Molecular Cloning: A Laboratory Manual, 2nd ed. Cold Spring Harbor, NY: Cold Spring Harbor Laboratory Press.
15. H.C. Birnboim. 1992. Extraction of high molecular weight RNA and DNA from cultured mammalian cells. Methods Enzymol 216:154-60.
16. T.M. Stulnig, A. Amberger. 1994. Exposing con-taminating phenol in nucleic acid preparations. Biotechniques 16(3):402-4.
17. M. Hiesinger, D. Löffert, C. Ritt, U. Oelmüller. 2001. The effects of phenol on nucleic acid prepara-tion and downstream applications. Qiagen News 5:23-26. Valencia, CA: Qiagen Inc.
18. W.M. Freeman, S.J. Walker, K.E. Vrana. 1999. Quantitative RT-PCR: pitfalls and potential. Bio-techniques 26:112-25.
19. A. Alizadeh, M. Eisen, D. Botstein, P.O. Brown, L.M. Staudt. 1998. Probing lymphocyte biology by genomic-scale gene expression analysis. J Clin Immol 18(6): 373-9.
20. J. Yan, B. Zhumabayeva, M. Herrler. 2002. BD Premium total RNA contains virtually no genomic DNA, an important factor in RNA quality. Clo-netechniques XVII (4):8-9. Palo Alto, CA: BD BioSciences Clontech.
21. T. Suzuku, P.J. Higgins, D.R. Crawford. 2000. Control selection for RNA quantitation. Biotech-niques 29:332-7.
22. H. Zhong, J.W. Simons. 1999. Direct comparison of GAPDH, β-Actin, Cyclophilin and 28S rRNA as internal standards for quantifying RNA levels under hypoxia. Biochem Biophys Res Comm 259:523-6.
23. O. Thellin, W. Zorzi, B. Lakaye, B.D. Borman, B. Coumans, G. Hennen, T. Grisar, A. Igout, E. Heinen. 1999. Housekeeping genes as internal standards: use and limits. J Biotech 75:291-5.
24. S.A. Bustin. 2002. Quantitation of mRNA us-ing real-time reverse transcription PCR (RT-PCR): trends and problems. J Mol Endocrinol 29:23-39.
25. J. Quackenbush. 2001. Computational analysis of microarray data. Nat Rev Genet 2:418-27.
26. J. Quackenbush. 2002. Microarray data normaliza-tion and transformation. Nat Genet (suppl.) 32:496-501.
27. L.G. Puskás, A. Zvara, L. Hackler Jr., P.V. Hum-melen. 2002. RNA amplification results in re-producible microarray data with slight ratio bias. Biotechniques 32:1330-40.
28. D. Seth, M.D. Gorrell, P.H. McGuinness, M.A. Leo, C.S. Lieber, G.W. McCaughan, P.S. Haber. 2003. SMART amplification maintains representa-tion of relative gene expression: quantitative valida-tion by real time PCR and application to studies of alcoholic liver disease in primates. J Biochem Biophys Methods 55:53-66.
29. J. Wang, L. Hu, S.R. Hamilton, K.R. Coombes, W. Zhang. 2003. RNA Amplification Strategies for cDNA Microarray Experiments. Biotechniques 34:394-400.