ada perceived disability claims: a decision-tree analysis
TRANSCRIPT

ADA Perceived Disability Claims: A Decision-Tree Analysis
William R. Draper • Carolyn E. Hawley •
Brian T. McMahon • Christine A. Reid •
Lara A. Barbir
� Springer Science+Business Media New York 2013
Abstract Introduction The purpose of this study is to
examine the possible interactions of predictor variables
pertaining to perceived disability claims contained in a
large governmental database. Specifically, it is a retro-
spective analysis of US Equal Employment Opportunity
Commission (EEOC) data for the entire population of
workplace discrimination claims based on the ‘‘regarded as
disabled’’ prong of the Americans with Disabilities Act
(ADA) definition of disability. Methods The study utilized
records extracted from a ‘‘master database’’ of over two
million charges of workplace discrimination in the Inte-
grated Mission System of the EEOC. This database
includes all ADA-related discrimination allegations filed
from July 26, 1992 through December 31, 2008. Chi
squared automatic interaction detection (CHAID) was
employed to analyze interaction effects of relevant vari-
ables, such as issue (grievance) and industry type. The
research question addressed by CHAID is: What combi-
nation of factors are associated with merit outcomes for
people making ADA EEOC allegations who are ‘‘regarded
as’’ having disabilities? Results The CHAID analysis
shows how merit outcome is predicted by the interaction of
relevant variables. Issue was found to be the most promi-
nent variable in determining merit outcome, followed by
industry type, but the picture is made more complex by
qualifications regarding age and race data. Although dis-
charge was the most frequent grievance among charging
parties in the perceived disability group, its merit outcome
was significantly less than that for the leading factor of
hiring.
Keywords Americans with Disabilities Act �Discrimination in Employment Act � Disabled
persons � Employment discrimination � Disability
discrimination
Purpose
The Americans with Disabilities Act of 1990 (ADA) con-
tains a three-pronged definition of ‘‘disability:’’ that which
is current and documented, that which is historical (‘‘record
of disability’’), and that which is perceived (‘‘regarded as
disabled’’). In the context of workplace discrimination
(Title I of the ADA), the third prong refers to the per-
spective of employers, especially exaggerated views of an
impairment, which elevates it to disability status. Such
misperceptions can lead to unfair and unlawful personnel
practices in any of 43 areas such as hiring, termination,
reasonable accommodation, harassment, or the terms and
conditions of employment. These employer activities are
collectively known as ‘‘issues.’’
Most ‘‘regarded as’’ allegations do not involve the
simple presence or absence of an actual impairment. More
common is an actual but not-substantial impairment, the
seriousness of which may be exaggerated by the employer
to the extent that the worker’s ability to safely perform the
essential functions of the job is brought into question. This
is infrequently a calculated lack of animus, but more often
a subtle misperception rooted in commonly held stereo-
types regarding certain impairments [1]. These ‘‘innocent
mistakes’’ are well documented in literature pertaining to
stigma theory (the stigmatization of an individual or group
W. R. Draper � C. E. Hawley (&) � B. T. McMahon �C. A. Reid � L. A. Barbir
Department of Rehabilitation Counseling, Virginia
Commonwealth University, PO Box 980330,
Richmond, VA 23298, USA
e-mail: [email protected]
123
J Occup Rehabil
DOI 10.1007/s10926-013-9464-7

based on an attribute, such as a disability) [2–7] and causal
attribution theory (the assignment of judgments, justified or
not, to observed behavior, i.e. ‘‘once disabled always dis-
abled’’) [1, 8–18]. Such models may provide an under-
standing of personnel actions that result in disability-based
discrimination, but not an excuse. All personnel actions
related to the existence or consequence of disability are,
under ADA, unlawful.
A previous study of compared allegations of perceived
discrimination (REGAS N = 34,222, the target group)
with those of the first prong of the definition; i.e., current
and documented disability (DOCDIS N = 338,861, the
comparison group) [11]. Many variables were studied but
the fourth research question, which tested differences in the
all-important outcome variable of ‘‘merit resolution,’’ led
to findings that provided the impetus for the present study.
‘‘Merit’’ refers to the outcome of investigations by the
Equal Employment Opportunity Commission (EEOC)
regarding the validity of each allegation. This was the
finding [11, p. 8]
The fourth research question addresses how the cases
were resolved. Here again, there were differences:
merit resolutions for REGAS proportionately excee-
ded those for DOCDIS by a statistically significant
margin (26.2 vs. 22.5 %):X2 (13, N = 377,580 =
637.383); p \ .001; d = .08. The largest effect sizes
(d) for the variables studied were as follows: 0.23 for
issue, 0.18 for census region, 0.12 for race, and 0.11
for industry type (NAICS code).
This significantly higher merit rate was a high impact
finding. First, it provided evidence for the assertion that
this ‘‘alternative prong’’ is an important aspect of work-
place discrimination. Not only did ‘‘regarded as’’ alle-
gations total in the tens of thousands, but they involved a
higher proportion of actual discrimination (vs. perceived
discrimination) than the first prong. In the ‘‘run-up’’ to
the ADA Amendments Act of 2008, employers openly
challenged the veracity of alternative prongs as unnec-
essary and confusing. However, Draper, Reid, and
McMahon [11] demonstrated that at least the third
alternative prong ‘‘has legs,’’ and the alternative prongs
were preserved and affirmed in the Amendments. Thus,
the authors set forth in this study to develop a still clearer
understanding of what drives merit relative to ‘‘regarded
as’’ allegations.
What follows is a decision tree analysis using the
Chi square automatic interaction detector (CHAID) to
determine which variables influenced the mutually
exclusive outcomes of merit (an EEOC conclusion that
discrimination has occurred) vs. non-merit (an EEOC
conclusion that evidence is insufficient to reach a con-
clusion that discrimination has occurred). In simple
terms, this study attempts to identify the ‘‘drivers’’ of
EEOC resolutions.
Methods
The present study is a retrospective analysis of EEOC data
found in its Integrated Mission System (IMS). This anal-
ysis does not involve sampling. The IMS includes the
entire population of reported allegations involving the
‘‘regarded as disabled’’ prong of the ADA definition of
disability. With nearly 3 million allegations, the IMS
includes all ADA-related discrimination allegations filed
from July 26, 1992 through December 31, 2008. The unit
of study is the individual allegation. Confidentiality was
protected through purging identifying information from the
data. Only allegations related to ADA title I employment
provisions were included, and allegations were excluded if
filed on the basis of other employment statutes, or if
investigated by entities other than the EEOC. Only closed
allegations were extracted so that the outcome of each
investigation was known.
Exactly 34,222 allegations were filed under people
whose disability status was defined by the third prong:
perceived disabilities. For each allegation, the following
data were available:
• Age of charging party (CP): (B29; 30–39; 40–49;
50–59; C60)
• Gender of CP
• Race/Ethnicity of CP (Black, Hispanic, White, Asian,
Mixed Ethnicity, other)
• Issue (nature of the discrimination alleged; e.g., hiring,
termination, harassment, etc.)
• Size of company (i.e., number employed: 15–100;
100–200; 201–500; 500?)
• Employer industry (BLS/NAICS categories: transporta-
tion/warehousing; health care/social assistance, etc.)
• Outcome of EEOC investigation (merit or non-merit
resolution/closure)
The research question addressed was: what combination
of factors (variables) are associated with merit outcomes of
allegations of disability-based workplace discrimination
under ADA filed by charging parties on the basis of per-
ceived (‘‘regarded as’’) disability status?
Data Analysis
A decision-tree analysis is a graphic, tree-like classification
model that investigates multi-level interactions. In this
study, it was used to identify and rank order those predictor
variables which influence the dichotomous dependent
variable of merit vs. non-merit outcome. CHAID is a
J Occup Rehabil
123

non-parametric exploratory decision-tree technique useful
for extracting meaningful patterns of information from
large databases; it also prioritizes groups of homogeneous
allegations, or end groups, on the basis of their contribution
to the dichotomous outcome variable of merit resolution
[19]. The end groups are shown on the classification tree as
‘‘nodes.’’ With this method, combinations of variables
serving as predictors of merit outcome for the cases are
tested individually [20]. Apart from its graphical depiction
of variable interactions, this technique has the added
advantage of not being limited by the distributional
assumptions required by traditional methods. The require-
ment is that the dependent variable must be dichotomous.
The software used is SPSS Answer Tree 3.1 (SPSS, Inc.,
2002). This technique has been widely used in the National
EEOC ADA Research Project to further our understanding
of high prevalence ADA discrimination issues such as
hiring [19], harassment [21], and discharge [22].
Specifically, CHAID first establishes an independent
variable, which serves as an optimal predictor, one
according to which the data are subdivided [23]. Then, Chi
square significance levels are used to determine maximal
explanatory value in terms of variance of the dependent
variable. Each subgroup is re-analyzed independently, and
the process continues until there are no longer any signif-
icant Chi square values available [24]. The resulting clas-
sification tree provides a graphic, hierarchical display of
variable interactions. The CHAID decision tree analysis is
performed in order to examine the interaction of multiple
significant variables, thus yielding information of more
complexity than a standard Chi square analysis.
Results
Claimant and industry demographics are provided in
Tables 1 and 2. Figures 1 and 2 depict the CHAID decision
tree, which graphically depicts the influences of the various
independent variables on the dependent variable of merit
outcome (closure).
Conclusively, the most significant variable predictive of
merit resolution found was issue (v2 = 58.08, df = 8,
p = 0.000). Issue is the nature of the allegation filed with
the EEOC. The two issues that were most predictive of
merit outcome were prohibited medical inquiry (Node 8,
62.5 %, N = 512) and testing (Node 7, 50.0 %, N = 82).
However, these issues involved a small number of allega-
tions and were not influenced by other variables.
Issue is, in turn, driven by the variable of industry type.
Since the purpose of the study was to examine the inter-
action effects of the predictor variables on the dependent
variable of merit outcome, Fig. 1 depicts which clusters of
variables (as CHAID nodes of information) emerge as
Table 1 Charging party and employer demographics
Variables Frequency Percentage
Gender
Male 20,637 53.8
Female 17,723 46.2
Ethnicity
African American 6,582 20.8
Hispanic 2,265 7.2
Other 2,945 9.3
Caucasian 19,878 62.8
Age
B29 3,381 9.4
30–39 8,769 24.4
40–49 12,462 34.7
50–59 8,413 23.4
60C 2,939 8.2
Industry
Agriculture 264 1.0
Mining and construction 1,136 4.2
Manufacturing 6,050 22.3
Transportation and utilities 3,090 11.4
Wholesale and retail trade 3,672 13.5
Financial, insurance, real estate 1,248 4.6
Services 8,963 33.0
Public administration 2,753 10.1
Employer size
15–100 12,710 34.5
101–200 4,368 11.9
201–500 4,326 11.8
500? 15,407 41.9
Issues (grievance)
Discharge 14,282 36.9
Reasonable accommodation 3,161 8.2
Harassment 2,507 6.5
Terms/conditions 3,684 9.5
Hiring 3,601 9.3
Discipline 1,174 3.0
Promotion 851 2.2
Wages 887 2.3
Suspension 8,572 22.1
*The other category includes Native Americans, Asians, and mixed
race individuals
Table 2 Merit closure status
Frequency Percentage
Non merit 28,567 73.8
Merit 10,152 26.2
Total 38,719 100.0
J Occup Rehabil
123

significant predictors and with which other variables they
interact.
Qualification standards (Node 6). Allegations of this
issue had a merit resolution rate of 38.8 % (2.9 % of total
allegations for perceived disability). Industry type served
as the second most significant predictor of merit closure,
yielding two industry clusters. Within the issue of qualifi-
cation standards, mining, manufacturing and construction
(Node 25) had a greater predictive value for merit outcome
than did the group comprising services, transportation/
utilities, public administration and finance (Node 24) (46.9
vs. 30.3 %) (v2 = 32.7, df = 1, p = 0.00). There was no
further branching of the CHAID tree from either of these
nodes; that is, no further interactive information of any
significance was found by the program. However, three
additional issues contributed heavily to the higher merit
rate for ‘‘regarded as’’ and they yielded interactive infor-
mation about additional variables.
Hiring and reinstatement (Node 3). These allegations
(11.6 % of total) had a merit resolution rate of 34.3 %.
Industry type, in turn, drove this high issue merit rate, led
by manufacturing/agriculture (39.8 % in turn driven by CP
race), transportation/utilities/public administration/finance
(31.3 % in turn driven by CP age), and other services
(26.8 %).
Demotion and job assignment (Node 4). These allega-
tions (4.3 % of total) had a merit resolution rate of 29.8 %.
Industry type again drove this high issue merit rate, led by
other services/transportation/utilities/public administration
(25 % in turn driven by CP race) and finance/insurance/real
estate/construction (34.8 % in turn driven by issues).
Terms and conditions/early retirement (Node 1). These
allegations (26.9 % of total) had a merit resolution rate of
26.6 %. Industry type again drove this high Issue merit
rate, led by transportation/utilities/mining/construction
(29.3 %), wholesale/retail/manufacturing (26.7 %); other
services/finance/real estate (24.4 % in turn driven by gen-
der), and public administration/agriculture (20.3 % driven
in turn by race).
It is noted that although they did not elevate the merit
rate for ‘‘regarded as’’ allegations, discharge and suspen-
sion (40.2 % of all ‘‘regarded as’’ allegations and a merit
rate of 22.7 %) and harassment and discipline (12.2 % of
all ‘‘regarded as’’ allegations and a merit rate of 20.9 %)
provided a firm floor of support close to but not signifi-
cantly lower than the merit rate of 22.5 % for the first
Node 1Category % n#0 73.4 7649#1 26.6 2779
Total 26.9 10428
Node 2 Category % n#0 77.3 12015 #1 22.7 3536
Total 40.2 15551
Node 3 Category % n#0 65.7 2951#1 34.3 1540
Total 11.6 4491
Node 0 Category % n# 0 73.8 28567# 1 26.2 10152
Total (100) 38719
Node 10 Category % n#0 75.6 1995#1 24.4 643
Total 6.8 2638
Node 11Category % n#0 70.7 3010#1 29.3 1249
Total 11.0 4259
Node 12Cat. % n#0 79.7 709#1 20.3 181
Total 2.3 890
Node 16Category % n#0 73.7 3587#1 26.3 1282
Total 12.6 4869
Node 15Category % n#0 77.8 3575#1 22.2 1022
Total 11.9 4597
Node 14Category % n#0 79.8 4853#1 20.2 1232
Total 15.7 6085
Node 17Category % n#0 73.2 719#1 26.8 263
Total 2.5 982
Node 18Category % n#0 68.7 959#1 31.3 437
Total 3.6 1396
Node 26Category % n#0 73.6 1185#1 26.4 426
Total 4.2 1611
Node 27Category % n#0 78.9 810#1 21.1 217
Total 2.7 1027
Node 28Category % n#0 77.6 547#1 22.4 158
Total 1.8 705
Node 30Category % n#0 82.2 1654#1 17.8 359
Total 5.2 2013
Node 31Category % n#0 78.6 3199#1 21.4 873
Total 10.5 4072
Node 33Category % n#0 78.9 2933#1 21.1 783
Total 9.6 3716
Node 19Category % n#0 60.2 1273#1 39.8 840
Total 5.5 2113
Node 13Category % n#0 73.3 1935#1 26.7 706
Total 6.8 2641
Node 29Category % n#0 87.6 162#1 12.4 23
Total 0.5 185
Node 32Category % n#0 72.9 642#1 27.1 239
Total 2.3 881
Node 34Category % n#0 65.7 592
#1 34.3 309Total 2.3 901
Node 35Category % n#0 74.1 367#1 25.9 128
Total 1.3 495
Node 37Category % n#0 57.4 746#1 42.6 553
Total 3.4 1299
Node 36Category % n#0 64.7 527#1 35.3 287
Total 2.1 814
Terms&C/EarlyRetireIncv
AsAmer;White;Hisp
Other;mssg
Mfg; AgricTrans/Ut;PubAdm;FinanServices<missing>Wh/Ret;Mfg;Mng;CnstSvcs;Trans/Util;PubAdm&cWholesa;Ret;MfgPubAdmin;AgricTrans/Util;Mining;Constr; ,<missing>
Svcs;Finan;RealEst
Hiring/ReinstatementDischarge/Suspension
Issue categoryAdj. P-value=0.000 Chi-sq.=58.088,
df=8
MERIT CLS
AsAmer;Other;Hisp
White;<mssg>
<=29;60+
40s;50s;30s
<=29;50s;60+;30s
Male 40s;<missg>
AsAmer;Hisp;<missg>
White;Other
Industry categoryp=0.00, ChiSq=40.7,df=3
Industry categoryp=0.00,ChiSq=57.9,df=2
Industry categoryp=0.00,ChiSq=58.0,df=2
CPSEXp=0.006;ChSq=9.6;df=1
4RACEcatp=0.04;ChSq=9.0;df=1
4RACEcatp=0.015;ChSq=10.8;df=1
AGErangep=0.003;ChSq=15.1;df=1
AGErange p=0.036;ChSq=10.5;df=11
4RACEcatp=0.012;ChSq=11.1;df=1
Fem;<mssg
Fig. 1 Split view of left branch
J Occup Rehabil
123
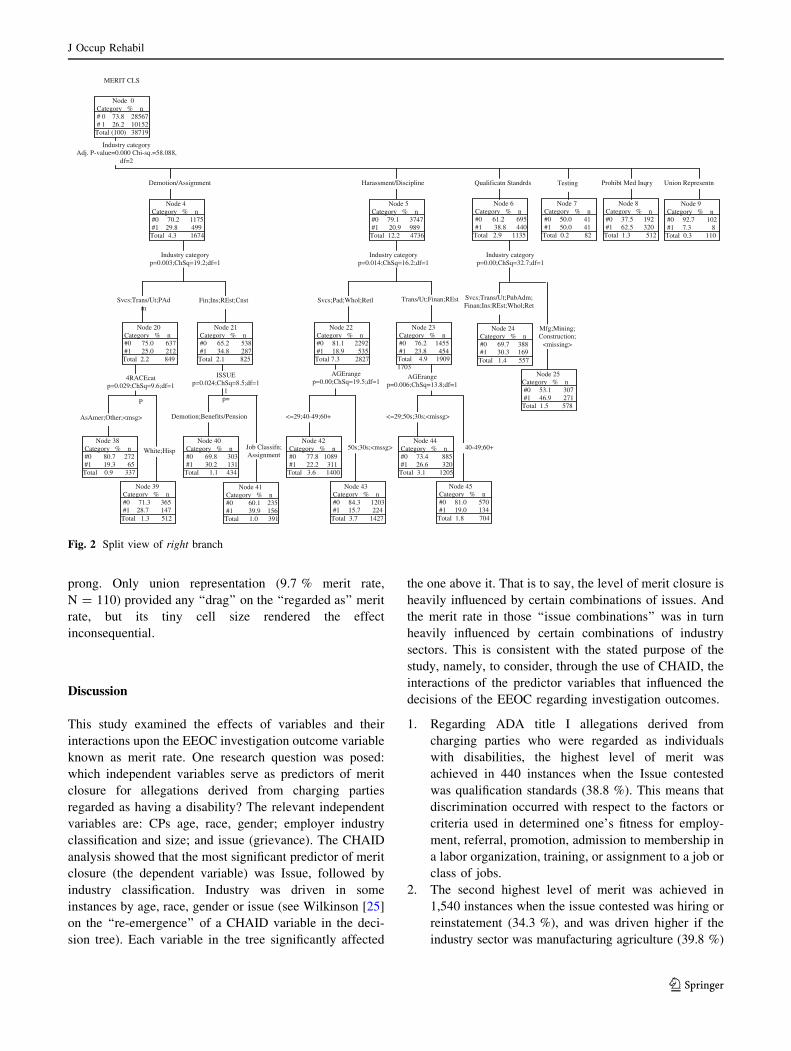
prong. Only union representation (9.7 % merit rate,
N = 110) provided any ‘‘drag’’ on the ‘‘regarded as’’ merit
rate, but its tiny cell size rendered the effect
inconsequential.
Discussion
This study examined the effects of variables and their
interactions upon the EEOC investigation outcome variable
known as merit rate. One research question was posed:
which independent variables serve as predictors of merit
closure for allegations derived from charging parties
regarded as having a disability? The relevant independent
variables are: CPs age, race, gender; employer industry
classification and size; and issue (grievance). The CHAID
analysis showed that the most significant predictor of merit
closure (the dependent variable) was Issue, followed by
industry classification. Industry was driven in some
instances by age, race, gender or issue (see Wilkinson [25]
on the ‘‘re-emergence’’ of a CHAID variable in the deci-
sion tree). Each variable in the tree significantly affected
the one above it. That is to say, the level of merit closure is
heavily influenced by certain combinations of issues. And
the merit rate in those ‘‘issue combinations’’ was in turn
heavily influenced by certain combinations of industry
sectors. This is consistent with the stated purpose of the
study, namely, to consider, through the use of CHAID, the
interactions of the predictor variables that influenced the
decisions of the EEOC regarding investigation outcomes.
1. Regarding ADA title I allegations derived from
charging parties who were regarded as individuals
with disabilities, the highest level of merit was
achieved in 440 instances when the Issue contested
was qualification standards (38.8 %). This means that
discrimination occurred with respect to the factors or
criteria used in determined one’s fitness for employ-
ment, referral, promotion, admission to membership in
a labor organization, training, or assignment to a job or
class of jobs.
2. The second highest level of merit was achieved in
1,540 instances when the issue contested was hiring or
reinstatement (34.3 %), and was driven higher if the
industry sector was manufacturing agriculture (39.8 %)
Node 4Category % n#0 70.2 1175#1 29.8 499
Total 4.3 1674
Node 5Category % n#0 79.1 3747#1 20.9 989
Total 12.2 4736
Node 0 Category % n# 0 73.8 28567# 1 26.2 10152
Total (100) 38719
Node 20Category % n#0 75.0 637#1 25.0 212
Total 2.2 849
Node 23Category % n#0 76.2 1455#1 23.8 454
Total 4.9 19091703
Node 22Category % n#0 81.1 2292#1 18.9 535
Total 7.3 2827
Node 6Category % n#0 61.2 695#1 38.8 440
Total 2.9 1135
Node 7Category % n#0 50.0 41#1 50.0 41
Total 0.2 82
Node 38Category % n#0 80.7 272#1 19.3 65
Total 0.9 337
Node 39Category % n#0 71.3 365#1 28.7 147
Total 1.3 512
Node 40Category % n#0 69.8 303#1 30.2 131
Total 1.1 434
Node 42Category % n#0 77.8 1089#1 22.2 311
Total 3.6 1400
Node 43Category % n#0 84.3 1203#1 15.7 224
Total 3.7 1427
Node 45Category % n#0 81.0 570#1 19.0 134
Total 1.8 704
Node 8Category % n#0 37.5 192#1 62.5 320
Total 1.3 512
Node 21Category % n#0 65.2 538#1 34.8 287
Total 2.1 825
Node 41Category % n#0 60.1 235#1 39.9 156
Total 1.0 391
Node 44Category % n#0 73.4 885#1 26.6 320
Total 3.1 1205
Node 24Category % n#0 69.7 388#1 30.3 169
Total 1.4 557
Node 25Category % n#0 53.1 307#1 46.9 271
Total 1.5 578
Node 9Category % n#0 92.7 102#1 7.3 8
Total 0.3 110
Union RepresentnProhibt Med InqryTestingQualificatn Standrds
Svcs;Trans/Ut;PubAdm;Finan;Ins:REst;Whol;Ret
Mfg;Mining;Construction;
<missing>
Industry categoryp=0.00;ChSq=32.7;df=1
Demotion/Assignment Harassment/Discipline
Industry categoryp=0.003;ChSq=19.2;df=1
Industry categoryp=0.014;ChSq=16.2;df=1
Industry categoryAdj. P-value=0.000 Chi-sq.=58.088,
df=2
MERIT CLS
Trans/Ut;Finan;REstSvcs;Pad;Whol;RetlFin;Ins;REst;CnstSvcs;Trans/Ut;PAdm
AGErangep=0.006;ChSq=13.8;df=1
AGErangep=0.00;ChSq=19.5;df=1
ISSUEp=0.024;ChSq=8.5;df=1
1p=
4RACEcatp=0.029;ChSq=9.6;df=1
P
Demotion;Benefits/Pension
Job Classifn;Assignment
<=29;40-49;60+
50s;30s;<mssg>
<=29;50s;30s;<missg>
40-49;60+White;Hisp
AsAmer;Other;<msg>
Fig. 2 Split view of right branch
J Occup Rehabil
123

and, higher still, if the CP was white or other race
(42.6 %).
3. The third highest level of merit was achieved in 499
instances when the Issue contested was demotion or
job assignment (29.8 %), and was driven higher if the
industry sector was finance, insurance, real estate or
construction (34.8 %) and the issue was job classifi-
cation or assignment (39.9 %).
4. The fourth highest level of merit was achieved in 2,779
instances when the issue contested was retirement or
the terms/conditions of employment (26.6 %), and was
driven higher if the industry sector was transportation,
utilities, mining or construction (29.3 %), or whole-
sale, retail, or manufacturing (26.9 %).
Other industry sectors shared a baseline merit rate
consistent with the first prong, or were very low but too
small to have much effect upon ‘‘regarded as’’ merit (union
representation). It is curious that the most prevalent issues
in the entire IMS as well as the ‘‘regarded as’’ cohort
(termination, failure to accommodate, and harassment) do
not distinguish themselves in the ‘‘regarded as’’ CHAID
findings as drivers of merit. This demonstrates that when it
comes to merit resolution, the alternative prong of
‘‘regarded as’’ has a unique role in the implementation of
ADA and the wisdom of Congress, for its inclusion in the
Act is affirmed.
Conclusions
The authors followed up on a single finding of interest in
previous studies, which examined the nature and scope of
workplace discrimination in America involving charging
parties who filed allegations that they were ‘‘regarded as’’
individuals with disabilities, a special status afforded pro-
tections in the ADA by an expanded definition of the term
‘‘disability.’’ Specifically, we have endeavored to explore
the circumstances surrounding an EEOC finding of merit
(actual discrimination) when such cases are concluded as
opposed to a routine allegation that does not rise to the
level of discrimination. In this study we have asked and
answered the question of ‘‘What influences merit out-
comes?’’ by applying a CHAID analysis to the universe of
34,222 closed investigations. The first clear conclusion was
that merit rates increased markedly when a handful of
specific issues were contested: qualification standards,
hiring, reinstatement, demotion, job assignment, retire-
ment, or the terms/conditions of employment. These rates
were driven even higher in a handful of industry sectors,
depending upon the issue involved: manufacturing, mining,
construction, agriculture, wholesale, retail, transportation,
utilities, finance, insurance, real estate, and other services.
Employers in these industries who receive notification that
a ‘‘regarded as’’ allegation has been received should
understand that their prospects for prevailing in the
investigation can be markedly reduced if the aforemen-
tioned issues are contested. Furthermore, some pre-emptive
training about ‘‘regarded as’’ and other alternative prong
definitions is readily available at low cost from the
National Network of ADA Centers and their affiliates.
Guidance of this nature may mitigate the frequency of such
allegations or expedite their mediation and internal reso-
lution when they arise.
It is also apparent that the ‘‘regarded as’’ prong expands
the reach of the ADA far beyond the disability community
in terms of coverage. Indeed, these 34,222 allegations
likely derived from Americans with minimal impairments
or no disability whatsoever. Such individuals are less likely
to be ADA literate and, moreover, are even less likely to
understand that they have ADA protections when mistak-
enly ‘‘regarded as,’’ and thus the third prong is offering an
above average level of effectiveness as a remedy if mea-
sured by its merit rate. No ADA architect envisioned that
‘‘regarded as disabled’’ claims would rise in number to
become nearly 10 % of all ADA files. None anticipated a
merit rate higher than that of the first prong. Yet that is
precisely what has occurred, and we now have a better
understanding of the issues and industries involved in
actual findings of ‘‘regarded as’’ discrimination. The find-
ings highlight the need for ADA training for all Americans
(with or without disabilities), to encourage self-advocacy,
potentially modifying behaviors of employers and reducing
future allegations.
A limitation of this study is the lack of information in
the database about disability type for the alternate prongs.
Potentially revealing and useful future research could
emerge if we better understood the perceived disability
type in ‘‘regarded as’’ claims. For example, concerning the
most frequent issue, discharge, it would be useful to know
how cognitive errors regarding disability inform the deci-
sion to terminate an employee.
Acknowledgments This project was approved by Virginia Com-
monwealth University’s Internal Review Board, #HM11303.
Conflict of interest The authors Draper, Hawley, McMahon, Reid
and Barbir declare no conflict of interest.
References
1. Travis MA. Perceived disabilities, social cognition, and ‘‘inno-
cent mistakes’’. Vanderbilt Law Rev. 2002;55:481.
2. An S, Roessler RT, McMahon BT. Workplace discrimination and
Americans with psychiatric disabilities: a comparative study.
Rehabil Couns Bull. 2011;55(1):7–19. doi:10.1177/00343552114
10704.
J Occup Rehabil
123
3. Bishop M, Stenhoff DM, Bradley KD, Allen CA. The differential
effect of epilepsy labels on employer perceptions: report of a pilot
study. Epilepsy Behav. 2007;11:351–6. doi:10.1016/j.yebeh.
2007.06.010.
4. Courtwright AM. Justice, stigma, and the new epidemiology of
health disparities. Bioethics. 2009;23:90–6. doi:10.1111/j.1467-
8519.2008.00717.x.
5. Dalgin RS, Gilbride D. Perspectives of people with psychiatric
disabilities on employment disclosure. Psychiatr Rehab J.
2003;26(3):306–10.
6. Goffman E. Stigma: notes on the management of spoiled identity.
Englewood Cliffs: Prentice Hall; 1963.
7. Scambler G. Health-related stigma. Sociol Health Illn.
2009;31(3):441–55. doi:10.1111/j.1467-9566.2009.01161.x.
8. Blair IV. Malleability of automatic stereotypes and prejudice.
Pers Soc Psychol Rev. 2002;6(3):242–61. doi:10.1207/S153279
57PSPR0603_8.
9. Brown JO. Some thoughts about social perception and employ-
ment discrimination law. Emory Law J. 1997;46:1487–97.
10. Dasgupta N, Greenwald AG. On the malleability of automatic
attitudes: combatting automatic prejudice with images of admired
and disliked individuals. J Pers Soc Psychol. 2001;81(5):800–14.
11. Draper WR, Reid CA, McMahon BT. Workplace discrimination
and the perception of disability. Rehab Coun Bull. 2011;
55(1):29–37. doi:10.1177/0034355210392792.
12. Greenwald AG, McGhee DE, Schwartz JL. Measuring the indi-
vidual differences in implicit cognition: the implicit association
test. J Pers Soc Psychol. 1998;74(6):1464–80.
13. Hewstone M. Causal attribution: From cognitive processes to
collective beliefs. Oxford: Blackwell; 1989.
14. Kawakami K, Dovidio JF, Moll J, Hermsen S, Russin A. Just say
no (to stereotyping): effects of training in the negation of ster-
eotypic associations on stereotypic activation. J Pers Soc Psychol.
2000;78(5):871–88.
15. Larson D. Unconsciously regarded as disabled: implicit bias and
the regarded-as prong of the ADA. UCLA Law Rev.
2008;56:451.
16. Rudman LA, Ashmore RD, Gary ML. ‘‘Unlearning’’ automatic
biases: the malleability of implicit prejudice and stereotypes.
J Pers Soc Psychol. 2001;81(5):856–68.
17. Shean G. A critical look at the assumptions of cognitive therapy.
Psychiatry. 2001;64(2):158–64.
18. Tversky A, Kahneman D. Judgment under uncertainty: heuristics
and biases. Science. 1974;185(4157):1124–31.
19. McMahon BT, Hurley JE, Chan F, Rumrill PD, Roessler R.
Drivers of hiring discrimination for individuals with disabilities.
J Occup Rehabil. 2008;18(2):122–32. doi:10.1007/s10926-008-
9133-4.
20. Chan F, Cheing G, Chan J, Rosenthal DA, Chromister J. Pre-
dicting employment outcomes of rehabilitation clients with
orthopedic disabilities: a CHAID analysis. Disabil Rehabil.
2006;28(5):257–70. doi:10.1080/09638280500158307.
21. Shaw LR, Chan F, McMahon BT. Inter sectionality and disability
harassment: the interactive effects of disability, race, age, and
gender. Rehabil Couns Bull. 2012;55(2):82–91. doi:10.1177/
0034355211431167.
22. Hurley JE. Merit determinants of ADA title I. allegations
involving discharge: implications for human resource manage-
ment and development. Adv Dev Hum Res. 2010;12(4):466–83.
23. Kass GV. An exploratory technique for investigating large
quantities of categorical data. Appl Statistics. 1980;29(2):119–27.
24. Hawley CE, Diaz S, Reid CA. Healthcare employees’ progression
through disability benefits. Work. 2009;34(1):53–66. doi:10.
3233/WOR-2009-0902.
25. Wilkinson L. Text structured data analysis: AID, CHAID and
CART. Conference presentation; 1992. http://www.cs.uic.edu/
*wilkinson/Publications/c&rtrees.pdf.
J Occup Rehabil
123