ada west district - statistical service accra... · iii preface and acknowledgement no meaningful...
TRANSCRIPT

ADA WEST DISTRICT

ii
Copyright (c) 2014 Ghana Statistical Service

iii
PREFACE AND ACKNOWLEDGEMENT
No meaningful developmental activity can be undertaken without taking into account the
characteristics of the population for whom the activity is targeted. The size of the population
and its spatial distribution, growth and change over time, in addition to its socio-economic
characteristics are all important in development planning.
A population census is the most important source of data on the size, composition, growth
and distribution of a country’s population at the national and sub-national levels. Data from
the 2010 Population and Housing Census (PHC) will serve as reference for equitable
distribution of national resources and government services, including the allocation of
government funds among various regions, districts and other sub-national populations to
education, health and other social services.
The Ghana Statistical Service (GSS) is delighted to provide data users, especially the
Metropolitan, Municipal and District Assemblies, with district-level analytical reports based
on the 2010 PHC data to facilitate their planning and decision-making.
The District Analytical Report for the Ada West District is one of the 216 district census
reports aimed at making data available to planners and decision makers at the district level. In
addition to presenting the district profile, the report discusses the social and economic
dimensions of demographic variables and their implications for policy formulation, planning
and interventions. The conclusions and recommendations drawn from the district report are
expected to serve as a basis for improving the quality of life of Ghanaians through evidence-
based decision-making, monitoring and evaluation of developmental goals and intervention
programmes.
For ease of accessibility to the census data, the district report and other census reports
produced by the GSS will be disseminated widely in both print and electronic formats. The
report will also be posted on the GSS website: www.statsghana.gov.gh.
The GSS wishes to express its profound gratitude to the Government of Ghana for providing
the required resources for the conduct of the 2010 PHC. While appreciating the contribution
of our Development Partners (DPs) towards the successful implementation of the Census, we
wish to specifically acknowledge the Department for Foreign Affairs, Trade and
Development (DFATD) formerly the Canadian International Development Agency (CIDA)
and the Danish International Development Agency (DANIDA) for providing resources for
the preparation of all the 216 district reports. Our gratitude also goes to the Metropolitan,
Municipal and District Assemblies, the Ministry of Local Government, Consultant Guides,
Consultant Editors, Project Steering Committee members and their respective institutions for
their invaluable support during the report writing exercise. Finally, we wish to thank all the
report writers, including the GSS staff who contributed to the preparation of the reports, for
their dedication and diligence in ensuring the timely and successful completion of the district
census reports.
Dr. Philomena Nyarko
Government Statistician

iv
TABLE OF CONTENTS
PREFACE AND ACKNOWLEDGEMENT ........................................................................iii
LIST OF TABLES .................................................................................................................. vi
LIST OF FIGURES ............................................................................................................... vii
ACRONYMS AND ABBREVIATIONS .............................................................................viii
EXECUTIVE SUMMARY ..................................................................................................... x
CHAPTER ONE: INTRODUCTION ................................................................................... 1 1.1 Introduction ................................................................................................................. 1
1.2 Physical Features ......................................................................................................... 1 1.3 Political Administration .............................................................................................. 3
1.4 Social and Cultural Structure ...................................................................................... 3 1.5 Economy...................................................................................................................... 3 1.6 Census Methodology, Concepts and Definitions ........................................................ 4 1.7 Organization of the Report ........................................................................................ 14
CHAPTER TWO: DEMOGRAPHIC CHARACTERISTICS ......................................... 15 2.1 Introduction ............................................................................................................... 15 2.2 Population Size and Distribution .............................................................................. 15
2.3 Age-Sex Structure ..................................................................................................... 17 2.4 Fertility, Mortality and Migration ............................................................................. 18
CHAPTER THREE: SOCIAL CHARACTERISTICS .................................................... 23 3.1 Introduction ............................................................................................................... 23 3.2 Household Size, Composition and Structure............................................................. 23
3.3 Marital Status ............................................................................................................ 25
3.4 Marital Status by Sex and Level of Education .......................................................... 27 3.5 Marital Status and Economic Activity ...................................................................... 28 3.6 Nationality ................................................................................................................. 29
3.7 Religious Affiliation .................................................................................................. 29 3.8 Literacy and Education.............................................................................................. 29
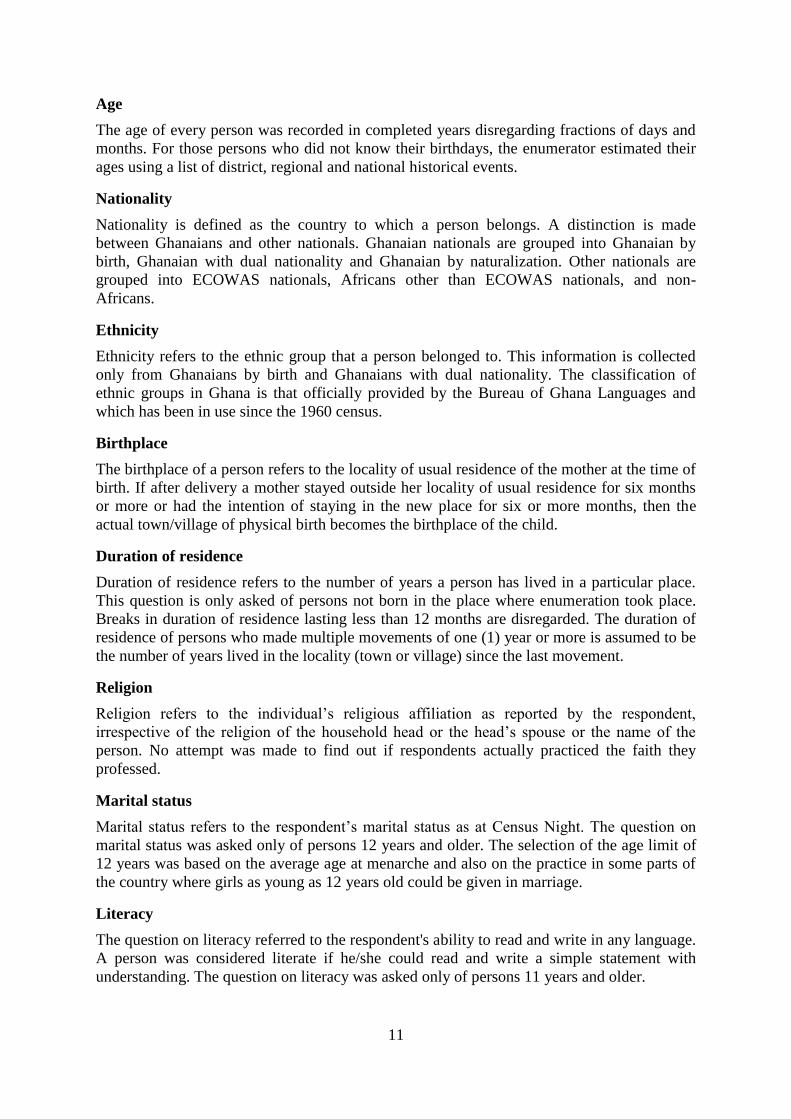
3.9 School Attendance and Level of Education .............................................................. 32
CHAPTER FOUR: ECONOMIC CHARACTERISTICS ............................................... 34 4.1 Introduction ............................................................................................................... 34
4.2 Economic Activity Status .......................................................................................... 34 4.3 Occupation ................................................................................................................ 36
4.4 Industry...................................................................................................................... 37 4.5 Employment Status ................................................................................................... 38
4.6 Employment Sector ................................................................................................... 39
CHAPTER FIVE: INFORMATION COMMUNICATION TECHNOLOGY .............. 40 5.1 Introduction ............................................................................................................... 40 5.2 Mobile Phone Ownership .......................................................................................... 40 5.3 Internet Facility Usage .............................................................................................. 40
5.4 Households Ownership of Desktop/Laptop Computers ............................................ 41
CHAPTER SIX: DISABILITY ........................................................................................... 42 6.1 Introduction ............................................................................................................... 42

v
6.2 Population and Disability .......................................................................................... 42
6.3 Type of Disability...................................................................................................... 42 6.4 Distribution by type of locality ................................................................................. 43 6.5 Disability and Activity .............................................................................................. 43
6.6 Disability, Education and Literacy ............................................................................ 45
CHAPTER SEVEN: AGRICULTURE ACTIVITIES ...................................................... 46 7.1 Introduction ............................................................................................................... 46 7.2 Households in Agriculture ........................................................................................ 46 7.3 Types of Farming ...................................................................................................... 46
CHAPTER EIGHT: HOUSING CONDITIONS ............................................................... 48 8.1 Introduction ............................................................................................................... 48 8.2 Housing Stock ........................................................................................................... 48 8.3 Type of Dwelling, Holding and Tenancy Arrangement ............................................ 49
8.4 Construction Materials .............................................................................................. 51 8.5 Room Occupancy ...................................................................................................... 53 8.6 Access to Utilities and Household Facilities ............................................................. 54 8.7 Main Source of Water for Drinking and Other Domestic Use .................................. 56
8.8 Toilet and Bathing Facilities ..................................................................................... 58 8.9 Method of Waste Disposal ........................................................................................ 59
CHAPTER NINE: SUMMARY OF KEY FINDINGS AND POLICY
IMPLICATIONS ................................................................................ 61 9.1 Introduction ............................................................................................................... 61 9.2 Demographic Characteristics ................................................................................... 61
9.3 Social Characteristics ................................................................................................ 62 9.4 Economic Characteristics .......................................................................................... 63
9.5 Information Communications Technology ............................................................... 65
9.6 Disability ................................................................................................................... 66
9.7 Agricultural Activity ................................................................................................. 67 9.8 Housing Conditions ................................................................................................... 68
REFERENCES ....................................................................................................................... 72
APPENDICES ........................................................................................................................ 74
LIST OF CONTRIBUTORS ................................................................................................ 78

vi
LIST OF TABLES
Table 2.1a: Population by age, sex and type of locality .......................................................... 16
Table 2.1b: Age dependency ratio ........................................................................................... 18
Table 2.2: Reported total fertility rate, general fertility rate and crude birth rate ................... 19
by district, Greater Accra Region .......................................................................... 19
Table 2.3: Female population 12 years and older by age, children ever born, ....................... 19
children surviving and sex of child ........................................................................ 19
Table 2.4: Total population, deaths in households and crude death rate by District .............. 21
Table 2.5: Birthplace by duration of residence of migrants .................................................... 22
Table 3.1: Household size by type of locality ......................................................................... 23
Table 3.2: Household population by composition and sex ..................................................... 24
Table 3.3: Household population by structure and sex ........................................................... 24
Table 3.4: Persons 12 years and older by sex, age-group and marital status .......................... 26
Table 3.5: Persons 12 years and older by sex, marital status and level of education ............. 27
Table 3.6: Persons 12 years and older by sex, marital status and economic activity status ... 28
Table 3.7: Population by nationality and sex .......................................................................... 29
Table 3.8: Population by religious affiliation and sex ............................................................ 29
Table 3.9: Population 11 years and older by sex, age and literacy status ............................... 31
Table 3.10:Population 3 years and older by level of education, school attendance and sex ... 33
Table 4.1: Population 15 years and older by activity status and sex ...................................... 35
Table 4.2: Economic activity status of population 15 years and older by sex and age .......... 36
Table 4.3: Employed population 15 years and older by occupation and sex .......................... 37
Table 4.4: Employed population 15 years and older by Industry and Sex ............................. 38
Table 4.5: Employed population 15 years and older by employment status and sex ............. 39
Table 4.6: Employed population 15 years and older by employment sector and sex ............. 39
Table 5.1: Population 12 years and older by mobile phone ownership, internet facility
usage, and sex ........................................................................................................ 41
Table 5.2: Households having desktop/laptop computers, fixed telephone lines and sex
of head .................................................................................................................... 41
Table 6.1: Population by type of locality, disability type and sex .......................................... 42
Table 6.2: Persons 15 years and older with disability by economic activity status and sex ... 44
Table 6.3: Population 3 years and older by sex, disability type and level of education ......... 45
Table 7.1: Households by agricultural activities and locality ................................................. 46
Table 7.2: Distribution of livestock and keepers .................................................................... 47
Table 8.1: Stock of houses and households by type of locality .............................................. 49
Table 8.2: Ownership status of dwelling by sex of household head and type of locality ....... 50
Table 8.3: Type of occupied dwelling unit by sex of household head and type of locality ... 51
Table 8.4: Main construction material for outer wall of dwelling unit by type of locality .... 52
Table 8.5: Main construction materials for the floor of dwelling unit by type of locality ..... 52
Table 8.6: Main construction material for roofing of dwelling unit by type of locality ......... 53
Table 8.7: Household size and number of sleeping rooms occupied in dwelling unit ........... 54
Table 8.8: Main source of lighting of dwelling unit by type of locality ................................. 54

vii
Table 8.9: Main source of cooking fuel, and cooking space used by households .................. 55
Table 8.10: Main source of water of dwelling unit for drinking and other ............................. 57
domestic purposes ................................................................................................. 57
Table 8.11: Bathing facility and toilet facilities used by household ........................................ 58
Table 8.12: Method of rubbish and liquid waste disposal by households ............................... 60
Table A1: Household composition by type of locality .......................................................... 74
Table A2: Population 3 years and older by sex, disability type and level of education ........ 75
Table A3: Population by sex, number households and number of houses in the 20 largest
communities ......................................................................................................... 76
Table A4: Population by age group in the 20 largest communities ....................................... 77
LIST OF FIGURES
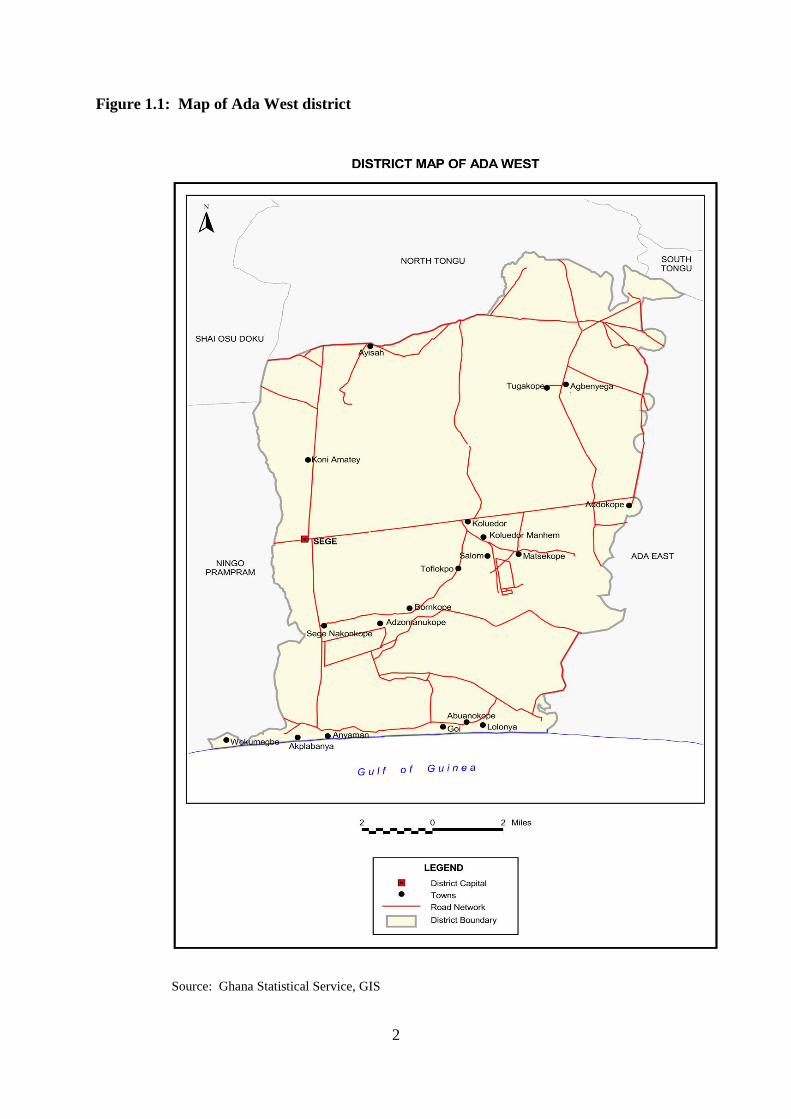
Figure 1.1: Map of Ada West district ....................................................................................... 2
Figure 2.1: Age-sex structure of the population ..................................................................... 17
Figure 2.2: Reported age specific death rates by sex .............................................................. 20
Figure 3.1: Marital status of persons 12 years and older ........................................................ 25
Figure 3.2: Literacy status of persons 11 years and older by sex ........................................... 30
Figure 3.3: Population 3 years and older by school attendance and sex ................................. 32
viii
ACRONYMS AND ABBREVIATIONS
AGI Association of Ghanaian Industries
AIDS Acquired Immune Deficiency Syndrome
ASCII American Standard Code for Information Interchange
CEB Children Ever Born
CIDA Canadian International Development Agency
CS Children Surviving
CEDAW Convention on Elimination of All forms of Discrimination
CERSGIS Centre for Remote Sensing and Geographic Information Survey
CHIPS Community Health Planning Services
CWIQ Core Welfare Indicator Questionnaire
DANIDA Danish International Development Agency
DFID Department for International Development
ECOWAS Economic Community of West African States
EMIS Education Management Information System
EA Enumeration Area
EU European Union
fCUBE Free Compulsory Universal Basic Education
GETFund Ghana Education Trust Fund
GREDA Ghana Real Estate Developers Association
GDP Gross Domestic product
GSS Ghana Statistical Service
GSDP Ghana Statistics Development Plan
GPS Global Positioning System
GPRTU Ghana Private Road Transport Union
GES Ghana Education Service
GDHS Ghana Demography Health Survey
HIV Human Immune Virus
ISCO International Standard Classification of Occupation
ISIC International Standard Classification of Industry
ICU International Communication Union
ICT Information Communication Technology
ISSER Institute of Statistical Social and Economic Research
JSS Junior Secondary School
JHS Junior High School
SSS Senior Secondary School
SHS Senior High School
LEAP Livelihood Empowerment against Poverty Programme
LESDEP Local Enterprise and Skills Development

ix
LISGIS Liberia Institute of Statistics and Geo-Information Services
MMDAs Metropolitan, Municipal and District Assemblies
MDGs Millennium Development Goals
MER Migration Effectiveness Ratio
MOE Ministry of Education
MICS Multiple Indicator Cluster Survey
MOFA Ministry of Food and Agriculture
MOTI Ministry of Trade and Industry
NCA National Communication Authority
NCPEC The National Census Publicity and Evaluation Committee
NCTAC National Census Technical Advisory Committee
NIPORT National Institute of Population Research and Training
NHIS National Health Insurance Scheme
ICT4AD National ICT for Accelerated Development Policy
NDPC National Development Planning Commission
NGOs Non-governmental Organisations
OIC Opportunities Industrialisation Centre
PHC Population and Housing Census
PPP Public-Private Partnerships
PNDC Provisional National Council
PAS Population Analysis Spreadsheet
PES Post Enumeration Survey
PWDs Persons with disabilities
PASEX Population Analysis System
PES Post Enumeration Survey
SADA Savanna Accelerated Development Authority
SAP Structural Adjustment Programme
UNICEF United Nations International Children’s Education Fund
UN United Nations
UNDP United Nations Development Programme
UNFPA United Nations Population Fund
WHO World Health Organization
W.C Water Closet

x
EXECUTIVE SUMMARY
Introduction
The district census report is the first of its kind since the first post-independence census was
conducted in 1960. The report provides basic information about the district. It gives a brief
background of the district, describing its physical features, political and administrative
structure, socio-cultural structure and economy. Using data from the 2010 Population and
Housing Census (2010 PHC), the report discusses the population characteristics of the district,
fertility, mortality, migration, marital status, literacy and education, economic activity status,
occupation, employment; Information Communication Technology (ICT), disability,
agricultural activities and housing conditions of the district. The key findings of the analysis are
as follows (references are to the relevant sections of the report):
Population size, structure and composition
The population of Ada West District according to the 2010 Population and Housing Census is
59,124 representing 1.5 percent of the region’s total population. Males constitute 48.3 percent
and females represent 51.7 percent. About 70 percent (70.3 %) of the population reside in rural
localities. The District has a sex ratio (number males per 100 females) of 93.6. The youth
population (population less than 15 years) in the district account for 42.8 percent of the
population depicting a broad base population pyramid which tapers off with a small number of
elderly persons (population aged 60 years and older) 6. 7 percent. The total age dependency
ratio (dependent population to population in the working age) for the District is 90.6, the age
dependency ratio for males is higher (95.4) than that of females (.86.3).
Fertility, mortality and migration
The Total Fertility Rate (TFR) for the District is 4.0. The General Fertility Rate (GFR) is 115.3
births per 1000 women aged 15-49 years which is the highest for the region. The Crude Birth
Rate (CBR) is 27.8 per 1000 population. The Crude Death Rate (CDR) for the district is 6.5 per
1000. Majority of migrants (54.0%) living in the District were born in another region in Ghana.
For migrants born in another region, those born in Volta (15.6%) form the majority followed by
Eastern (11.1%) and Ashanti (3.5%) regions
Household Size, composition and structure
The District has a household population of 57,746 with a total number of 11.642 households.
The average household size in the District is 5.1 persons. Children constitute the largest
proportion of households and accounts for 40.7 followed by Grandchildren 14.4 percent
respectively. Spouses form about 7.8 percent of households. Nuclear households (head,
spouse(s) and children) constitute 21.5 percent of the total number of households in the district.
Marital status
About four in ten (44.2%)) of the population aged 12 years and older are married, 41.4
percent have never married, 5.5 percent are widowed, 2.7 percent are separated, and 4.2
percent are in consensual unions. . By age 25-29 years, more than half of females (66.6%)
%) are married compared to a little over one-third of males (41.7%). At age 65 and above,
widowed females account for as high as 58.0 percent while widowed males account for only
13.3 percent. Among the married, 45.0 percent have no education while half of those
divorced (50.6%) and separated (50.0%) of the never married have never been to school.
About 8 out of 10 of the married population (82.8%)) are employed, 2.8 percent are
xi
unemployed and 14.4 percent are economically not active. A greater proportion of those who
have never married (62.5%) are economically not active with 3.5 percent unemployed.
Nationality
The proportion of Ghanaians by birth in the district is 95.6 percent. Those who have
naturalized constitute 0.6 percent and the non-Ghanaian population in the district is less than
2 per cent.
Literacy and education
Of the population 11 years and above, 68.5 percent are literate and 31.5 percent are non-
literate. The proportion of literate males is higher (78.6 %) than that of females (59.5 %).
About five out of ten people (58.6%) indicated they could read and write both English and a
Ghanaian language (s). Of the population aged 3 years and above (23,354) in the district,
29.9 percent have never attended school, 40.3 percent are currently attending and 29.7
percent have attended in the past.
Economic activity status
A little over Seventy percent (73.0%) of the population aged 15 years and older are
economically active while 27.0 per cent are economically not active. Of the economically
active population, 95.8 percent are employed while 4.2 0 percent are unemployed. For those
who are economically not active, a larger percentage of them are students (58.8 %), (15.2 %)
perform household duties and 12.5 percent are too old/young to work. Five out of ten
(51.6%) have worked before, seeking work and available while 48.4 are unemployed and are
seeking work for the first time.
Occupation
Of the employed population, about 42.1 percent are engaged as skilled agricultural, forestry
and fishery workers, 18.6 percent in craft and related trade. 17.4 percent are engaged as
service and sales workers whiles 8.3 percent are engaged as assemblers. .
Employment status and sector
Of the population 15 years and older, 60.5 percent are self-employed without employees,
14.2 percent are contributing family workers and employees respectively. 1.8 percent are
apprentice and 4.4 percent are casual workers. Overall, men constitute the highest proportion
in each employment category except for self – employed without employee(s) and
contributing family worker as well as apprentices. The private informal sector is the largest
employer in the district, employing 89.6 percent of the population followed by the private
formal with 5.7 percent.
Information Communication Technology
Of the population 12 years and above, 44.3 percent have mobile phones. Men who own
mobile phones constitute 52.6 percent as compared to 37.1 percent of females. About five
percent (4.5 %) of the population 12 years and older use internet facilities in the district. Only
498 households representing 4.3 percent of the total households in the district have
desktop/laptop computers.
Disability
About 2.2 percent of the district’s total population have one form of disability or the other.
The proportion of the female population with disability is slightly higher (2.3%) than males

xii
(2.0%). The types of disability in the district include sight, hearing, speech, physical,
intellect, and emotion. Persons with sight and physical disability recorded the highest of
31.4 percent each respectively, followed by emotional disability (19.4). About 4.6 percent of
the population with disability are in the urban localities. There are more males with sight
disability compare to their female counterparts in both urban and rural localities. Of the
population disabled, 46.2 percent have never been to school.
Agriculture
About fifty-eight percent of households in the district engaged in agriculture. In the rural
localities, it is 63.5 percent compared to 43.4 percent in urban localities. The dominant
agricultural activities of households engage in agriculture is crop farming (48.1%). Over half
(57.4%) of agricultural households engage in crop farming.
Housing
The housing stock of Ada West t District is 6,826 representing. The average population per
house is 8.7 and the average household size is 5.1. The population per house in urban areas
(10.2) is higher than in rural areas (8.1).
Type, tenancy arrangement and ownership of dwelling units
Over half (62.4 %) of all dwelling units in the district are compound houses; 26.4 percent are
separate houses and 4.3 percent are semi-detached houses. A little above sixty percent (63.6
%) of the dwelling units in the district are owned by members of the household; 21.0
percent are owned by relative who is not a member of the household, 12.4 are owned by other
private individuals; and only 0.8 percent are owned by public or government. Less than one
percent (0.3 %) of the dwelling units is owned through mortgage schemes.
Material for construction of outer wall, floor and roof
The main construction material for outer walls of dwelling units in the district is cement
block/concretes accounting for 68.6 percent with mud brick/earth constituting 27.7 percent of
outer walls of dwelling units in the district. Cement (87.7 %) and mud/earth (10.3 %) are the
two main materials used in the construction of floors of dwelling units in the district. Metal
sheets and slate/asbestos are the main roofing material (52.6 %) and (25.0 %) respectively for
dwelling units in the district.
Room occupancy
One room constitutes the highest percentage (85.9%) of sleeping rooms occupied by
households in housing units in the district. About 4.4 percent of households with 10 or more
members occupy single rooms.
Utilities and household facilities
The three main sources of lighting in dwelling units in the district are electricity (66.0%),
kerosene lamp (27.2%) and flashlight/torch (5.0%).). The main source of fuel for cooking for
most households in the district is charcoal (55.2%). The proportion for urban (69.0%) is
higher than that of rural (49.2%). The four main sources of water in the district are public
tap/standpipe (63.1%), Pipe – borne outside dwelling (19.9%), and sachet water (7.2).
Majority of the households in the district representing 58.4 percent do not have toilet
facilities followed by public toilet (W.C, KVIP, pit, pan, etc.) (18.5%). Eleven percent of the
households in the district also use KVIP. About four out of ten households (37.2%) use
xiii
shared open cubicle bathrooms whiles 25.8 percent of households in the district share
separate bathrooms in the same house and 17.8 percent use own bathroom for exclusive use.
Waste disposal
The most widely method of solid waste disposal is by public dump (open space) accounting
for 39.4 percent of the households within the district. About three in ten households (29.7)
dump their solid waste by burning while 10.5 percent dumped their solid waste
indiscriminately whereas house to house waste collection accounts for 9.6 percent. For liquid
waste disposal, throwing waste onto the compound (50.1%) and onto the street (34.2%) are
the two most common methods used by households in the district.

1
CHAPTER ONE
INTRODUCTION
1.1 Introduction
The Ada West District was carved out of the former Dangbe East District in the Greater
Accra Region. It was established in 2012 by Legislative Instrument (LI. 2029) with its capital
at Sege. The District shares boundaries with North Tongu District to the North, Ada East
District and Ningo Prampram to the East and West respectively. It is bounded to the South by
the Gulf of Guinea which stretches from Akplabanya to Goi. It is approximately 80
Kilometers from Accra, the regional capital.
1.2 Physical Features
The total land size of the district is about 323.721 square kilometers and forms approximately
10 percent of the total land size of the Greater Accra Region. The District forms part of the
central portions of the Accra plains. The relief is generally gentle and undulating, a low plain
with heights not exceeding 60 meters (200 ft.) above sea level. The prominent relief features
include the Anyamam boulders rising about 240 meters (800 ft.) above sea level. These
boulders are scattered irregularly over the sea.
The Ada West District is encapsulated by the south-eastern coastal plains of Ghana which is
one of the hottest parts of the country. Temperatures are high throughout the year and range
between 23°C and 28°C. A maximum temperature of 33°C is normally attainable during the
hot season. Rainfall is generally heavy during the major seasons between March and
September. The average rainfall is about 750 millimeters. The area is however very dry
during the harmattan season when there is no rainfall at all. Humidity is about 60 percent
high, due to its proximity to the sea, the Volta River and other water bodies. Daily
evaporation rates range from 5.4 - 6.8 millimetres. The relatively high temperatures help in
the quick crystallization of salt for the salt industry.
The vegetation is basically the coastal savannah type, characterized by short savannah grass
and interspersed with shrubs and short trees. Along the coast, there are stretches of coconut
trees and patches of coconut groves which combine to give the area a classic look. A few
strands of mangrove trees such as the Angor mangrove can also be found around the Songhor
Lagoon and the tributaries of the Volta River where the soil is waterlogged and salty.
The general drainage pattern of the Ada West District can be described as dendritic with
some of the streams taking their sources from the Volta River. Water bodies such as
Anyamam, Akplabanya, and Sege, among others spring up with increased and decreased
capacities in the wet and dry seasons respectively.
The greater portion of the District is underlain by tertiary and recent deposits. A small
section of the northern and eastern parts (between Afiadenyigba and Sege) fall under the
Dahomean complex rocks of Precambrian age. The recent unconsolidated sand, clay and
gravel occur in the deltaic areas of the Volta River as well as in the areas surrounding the
Songhor Lagoon.
2
Figure 1.1: Map of Ada West district
Source: Ghana Statistical Service, GIS

3
1.3 Political Administration
The General Assembly of the Ada West District Assembly is made up of 21 members,
comprising two females and 19 males. 15 members are elected; six are Government
Appointees, one District Chief Executive (DCE) and a Member of Parliament for the Sege
Constituency. There are eight sub-structures which are made up of two Area Councils.
1.4 Social and Cultural Structure
1.4.1 The origin of the indigenous people
The Ada people are the Dangme-speaking people who migrated into modern Ghana from east
of the Volta River in the fourteenth century. The patrilineal descent system, where the male
line is used for recruitment into the lineage or succession inheritance is the type practiced by
the indigenous people.
According to oral history, the Adas are believed to have migrated from Tagologo near Shai-
Osodoku in the Dangme West District. They are extremely interspersed with the Ewe clan
known as the Kudzragbe family. The people of Ada are called Dangmeli and they speak
Dangme as their local dialect.
1.4.2 The Traditional Political System
The Traditional political head of the Adas’ (Okorli) is the paramount chief (matse). The next
in command is the clan head (Wetsoyi) followed by the Chiefs (Asafoatseme). Every village
is affiliated to a clan and in each of these clans is a sub-chief who is a subject to the
Asafoatseme. There are also hamlets headed by headmen who preside over the people on
behalf of the sub-chiefs.
The Ada nation was originally made up of eight clans namely; Adibiawe, Lomobiawe,
Tekperbiawe, Dangmebiawe, Kabiawe, Ohuewem, Korgbor and Kudjragbe. Later, Kabiawe
was divided into three separate clans, i.e. Kabiawe-tsu, Kabiawe-yumu and Kabiawe-Kponor.
1.4.3 Festivals
The Asafotufiam is the main festival of the people of Ada which they usually celebrate
annually in the first week of August. The festival serves as a remembrance of the forefathers
who fought the war in their quest to migrate to their present location. The festival brings all
the indigenes of Ada for the week-long festivity to make merry and re-unite families among
others.
1.5 Economy
The natural environment of the district to a large extent dictates the economic activities that
go on there. Salt mining provides employment for a large number of the population
particularly in areas where the resource exists. The District mostly gains its revenue from the
commodity.
The district is however predominantly an agricultural one making farming a major economic
activity. Apart from the natural environment a contributory factor to this is due to the fact that
the majority of the population lives in rural settlements. Crops farmed are mainly cassava,
maize and among others. Vegetables like tomatoes, onions, shallots, garden eggs, pepper,
carrots, and okra. Fruits such as water melon also feature predominantly to sustain the

4
livelihood of farmers. There is one rural bank, a few micro finance organizations and a
Cooperative Union in the district.
1.5.1 Tourism
The district does not immediately benefit from a tourism industry but the potentials are
limitless. The mother district, Dangbe East, abounded in tourist attractions mostly situated
along the shoreline. Unfortunately all of these attractions now belong to the Dangbe East
District. The Ada west district has a coastline that stretches from Goi to Akplabanya and has
the potential of being developed to attract tourists from all over the world like its sister
district does.
1.5.2 Health
The district has three health centers, one each in Sege, Bornikope and Anyamam. There are
also eight health facilities and 5 CHPS compounds spread through the district
1.5.3 Education
There are currently forty five (45) basic schools, (primary and Junior High Schools), few
kindergartens, one (1) Senior High Technical School. Also few school infrastructural projects
currently are under construction in the district. Source: Ghana Education Directorate.
1.6 Census Methodology, Concepts and Definitions
1.6.1 Introduction
Ghana Statistical Service (GSS) was guided by the principle of international comparability
and the need to obtain accurate information in the 2010 Population and Housing Census
(2010 PHC). The Census was, therefore, conducted using all the essential features of a
modern census as contained in the United Nations Principles and Recommendations for
countries taking part in the 2010 Round of Population and Housing Censuses.
Experience from previous post independence censuses of Ghana (1960, 1970, 1984 and 2000)
was taken into consideration in developing the methodologies for conducting the 2010 PHC.
The primary objective of the 2010 PHC was to provide information on the number,
distribution and social, economic and demographic characteristics of the population of Ghana
necessary to facilitate the socio-economic development of the country.
1.6.2 Pre-enumeration activities
Development of census project document and work plans
A large scale statistical operation, such as the 2010 Population and Housing Census required
meticulous planning for its successful implementation. A working group of the Ghana
Statistical Service prepared the census project document with the assistance of two
consultants. The document contains the rationale and objectives of the census, census
organisation, a work plan as well as a budget. The project document was launched in
November 2008 as part of the Ghana Statistics Development Plan (GSDP) and reviewed in
November 2009.
Census secretariat and committees
A well-structured management and supervisory framework that outlines the responsibilities
of the various stakeholders is essential for the effective implementation of a population and
housing census. To implement the 2010 PHC, a National Census Secretariat was set up in

5
January 2008 and comprised professional and technical staff of GSS as well as staff of other
Ministries, Departments and Agencies (MDAs) seconded to GSS. The Census Secretariat was
primarily responsible for the day-to-day planning and implementation of the census activities.
The Secretariat had seven units, namely; census administration, cartography, recruitment and
training, publicity and education, field operations and logistics management, data processing,
and data analysis and dissemination.
The Census Secretariat was initially headed by an acting Census Coordinator engaged by the
United Nations Population Fund (UNFPA) in 2008 to support GSS in the planning of the
Census. In 2009, the Census Secretariat was re-organised with the Government Statistician
as the National Chief Census Officer and overall Coordinator, assisted by a Census
Management Team and a Census Coordinating Team. The Census Management Team had
oversight responsibility for the implementation of the Census. It also had the responsibility of
taking critical decisions on the census in consultation with other national committees. The
Census Coordinating Team, on the other hand, was responsible for the day-to-day
implementation of the Census programme.
A number of census committees were also set up at both national and sub-national levels to
provide guidance and assistance with respect to resource mobilization and technical advice.
At the national level, the committees were the National Census Steering Committee (NCSC),
the National Census Technical Advisory Committee (NCTAC) and the National Census
Publicity and Education Committee (NCPEC). At the regional and district levels, the
committees were the Regional Census Implementation Committee and the District Census
Implementation Committee, respectively.
The Regional and District Census Implementation Committees were inter-sectoral in their
composition. Members of the Committees were mainly from decentralized departments with
the Regional and District Coordinating Directors chairing the Regional Census
Implementation Committee and District Census Implementation Committee, respectively.
The Committees contributed to the planning of district, community and locality level
activities in areas of publicity and field operations. They supported the Regional and District
Census Officers in the recruitment and training of field personnel (enumerators and
supervisors), as well as mobilizing logistical support for the census.
Selection of census topics
The topics selected for the 2010 Population and Housing Census were based on
recommendations contained in the UN Principles and Recommendations for 2010 Round of
Population and Housing Censuses and the African Addendum to that document as well as the
needs of data users. All the core topics recommended at the global level, i.e., geographical
and internal migration characteristics, international migration, household characteristics,
demographic and social characteristics such as age, date of birth, sex, and marital status,
fertility and mortality, educational and economic characteristics, issues relating to disability
and housing conditions and amenities were included in the census.
Some topics that were not considered core by the UN recommendations but which were
found to be of great interest and importance to Ghana and were, therefore, included in the
2010 PHC are religion, ethnicity, employment sector and place of work, agricultural activity,
as well as housing topics, such as, type of dwelling, materials for outer wall, floor and roof,
tenure/holding arrangement, number of sleeping rooms, cooking fuel, cooking space and
Information Communication Technology (ICT).

6
Census mapping
A timely and well implemented census mapping is pivotal to the success of any population
and housing census. Mapping delineates the country into enumeration areas to facilitate
smooth enumeration of the population. The updating of the 2000 Census Enumeration Area
(EA) maps started in the last quarter of 2007 with the acquisition of topographic sheets of all
indices from the Survey and Mapping Division of the Lands Commission. In addition, digital
sheets were also procured for the Geographical Information System Unit.
The Cartography Unit of the Census Secretariat collaborated with the Survey and Mapping
Division of the Lands Commission and the Centre for Remote Sensing and Geographic
Information Services (CERSGIS) of the Department of Geography and Resource
Development, University of Ghana, to determine the viability of migrating from analog to
digital mapping for the 2010 PHC, as recommended in the 2000 PHC Administrative Report.
Field cartographic work started in March 2008 and was completed in February 2010.
Development of questionnaire and manuals
For effective data collection, there is the need to design appropriate documents to solicit the
required information from respondents. GSS consulted widely with main data users in the
process of the questionnaire development. Data users including MDAs, research institutions,
civil society organisations and development partners were given the opportunity to indicate
the type of questions they wanted to be included in the census questionnaire.
Documents developed for the census included the questionnaire and manuals, and field
operation documents. The field operation documents included Enumerator’s Visitation
Record Book, Supervisor’s Record Book, and other operational control forms. These record
books served as operational and quality control tools to assist enumerators and supervisors to
control and monitor their field duties respectively.
Pre-tests and trial census
It is internationally recognized that an essential element in census planning is the pre-testing
of the questionnaire and related instructions. The objective of the pre-test is to test the
questionnaire, the definition of its concepts and the instructions for filling out the
questionnaire.
The census questionnaire was pre-tested twice in the course of its development. The first pre-
test was carried out in March 2009 to find out the suitability of the questions and the
instructions provided. It also tested the adequacy and completeness of the responses and how
respondents understood the questions. The second pre-test was done in 10 selected
enumeration areas in August, 2009. The objective of the second pre-test was to examine the
sequence of the questions, test the new questions, such as, date of birth and migration, and
assess how the introduction of ‘date of birth’ could help to reduce ‘age heaping’. With regard
to questions on fertility, the pre-tests sought to find out the difference, if any, between proxy
responses and responses by the respondents themselves. Both pre-tests were carried in the
Greater Accra Region. Experience from the pre-tests was used to improve the final census
questionnaire.
A trial census which is a dress rehearsal of all the activities and procedures that are planned
for the main census was carried out in October/November 2009. These included recruitment
and training, distribution of census materials, administration of the questionnaire and other
census forms, enumeration of the various categories of the population (household,

7
institutional and floating population), and data processing. The trial census was held in six
selected districts across the country namely; Saboba (Northern Region), Chereponi (Northern
Region), Sene (Brong Ahafo Region), Bia (Western Region), Awutu Senya (Central Region),
and Osu Klottey Sub-Metro (Greater Accra Region). A number of factors were considered in
selecting the trial census districts. These included: administrative boundary issues, ecological
zone, and accessibility, enumeration of floating population/outdoor-sleepers, fast growing
areas, institutional population, and enumeration areas with scattered settlements.
The trial census provided GSS with an opportunity to assess its plans and procedures as well
as the state of preparedness for the conduct of the 2010 PHC. The common errors found
during editing of the completed questionnaires resulted in modifications to the census
questionnaire, enumerator manuals and other documents. The results of the trial census
assisted GSS to arrive at technically sound decisions on the ideal number of persons per
questionnaire, number of persons in the household roster, migration questions, placement of
the mortality question, serial numbering of houses/housing structures and method of
collection of information on community facilities. Lessons learnt from the trial census also
guided the planning of the recruitment process, the procedures for training of census field
staff and the publicity and education interventions.
1.6.3 Census enumeration
Method of enumeration and field work
All post- independence censuses (1960, 1970, 1984, and 2000) conducted in Ghana used the
de facto method of enumeration where people are enumerated at where they were on census
night and not where they usually reside. The same method was adopted for the 2010 PHC.
The de facto count is preferred because it provides a simple and straight forward way of
counting the population since it is based on a physical fact of presence and can hardly be
misinterpreted. It is thought that the method also minimizes the risks of under-enumeration
and over enumeration. The canvasser method, which involves trained field personnel visiting
houses and households identified in their respective enumeration areas, was adopted for the
2010 PHC.
The main census enumeration involved the canvassing of all categories of the population by
trained enumerators, using questionnaires prepared and tested during the pre-enumeration
phase. Specific arrangements were made for the coverage of special population groups, such
as the homeless and the floating population. The fieldwork began on 21st September 2010
with the identification of EA boundaries, listing of structures, enumeration of institutional
population and floating population.
The week preceding the Census Night was used by field personnel to list houses and other
structures in their enumeration areas. Enumerators were also mobilized to enumerate
residents/inmates of institutions, such as, schools and prisons. They returned to the
institutions during the enumeration period to reconcile the information they obtained from
individuals and also to cross out names of those who were absent from the institutions on
Census Night. Out-door sleepers (floating population) were also enumerated on the Census
Night.
Enumeration of the household population started on Monday, 27th
September, 2010.
Enumerators visited houses, compounds and structures in their enumeration areas and started
enumerating all households including visitors who spent the Census Night in the households.
Enumeration was carried out in the order in which houses/structures were listed and where

8
the members of the household were absent, the enumerator left a call-back-card indicating
when he/she would come back to enumerate the household. The enumeration process took off
smoothly with enumerators poised on completing their assignments on schedule since many
of them were teachers and had to return to school. However, many enumerators ran short of
questionnaires after a few days’ work.
Enumeration resumed in all districts when the questionnaire shortage was resolved and by
17th
October, 2010, enumeration was completed in most districts. Enumerators who had
finished their work were mobilized to assist in the enumeration of localities that were yet to
be enumerated in some regional capitals and other fast growing areas. Flooded areas and
other inaccessible localities were also enumerated after the end of the official enumeration
period. Because some enumeration areas in fast growing cities and towns, such as, Accra
Metropolitan Area, Kumasi, Kasoa and Techiman were not properly demarcated and some
were characterized by large EAs, some enumerators were unable to complete their assigned
tasks within the stipulated time.
1.6.4 Post enumeration survey
In line with United Nations recommendations, GSS conducted a Post Enumeration Survey
(PES) in April, 2011 to check content and coverage error. The PES was also to serve as an
important tool in providing feedback regarding operational matters such as concepts and
procedures in order to help improve future census operations. The PES field work was
carried out for 21 days in April 2011 and was closely monitored and supervised to ensure
quality output. The main findings of the PES were that:
97.0 percent of all household residents who were in the country on Census Night (26th
September, 2010) were enumerated.
1.3 percent of the population was erroneously included in the census.
Regional differentials are observed. Upper East region recorded the highest coverage
rate of 98.2 percent while the Volta region had the lowest coverage rate of 95.7
percent.
Males (3.3%) were more likely than females (2.8%) to be omitted in the census. The
coverage rate for males was 96.7 percent and the coverage rate for females was 97.2
percent. Also, the coverage rates (94.1%) for those within the 20-29 and 30-39 age
groups are relatively lower compared to the coverage rates of the other age groups.
There was a high rate of agreement between the 2010 PHC data and the PES data for
sex (98.8%), marital status (94.6%), relationship to head of household (90.5%) and
age (83.0%).
1.6.5 Release and dissemination of results
The provisional results of the census were released in February 2011 and the final results in
May 2012. A National Analytical report, six thematic reports, a Census Atlas, 10 Regional
Reports and a report on Demographic, Social, Economic and Housing were prepared and
disseminated in 2013.

9
1.6.6 Concepts and definitions
Introduction
The 2010 Population and Housing Census of Ghana followed the essential concepts and
definitions of a modern Population and Housing Census as recommended by the United
Nations (UN). It is important that the concepts, definitions and recommendations are adhered
to since they form the basis upon which Ghana could compare her data with that of other
countries.
The concepts and definitions in this report cover all sections of the 2010 Population and
Housing Census questionnaires (PHC1A and PHC1B). The sections were: geographical
location of the population, Household and Non-household population, Literacy and
Education, Emigration, Demographic and Economic Characteristics, Disability, Information
Communication Technology (ICT), Fertility, Mortality, Agricultural Activity and Housing
Conditions.
The concepts and definitions are provided to facilitate understanding and use of the data
presented in this report. Users are therefore advised to use the results of the census within the
context of these concepts and definitions.
Region
There were ten (10) administrative regions in Ghana during the 2010 Population and Housing
Census as they were in 1984 and 2000.
District
In 1988, Ghana changed from the local authority system of administration to the district
assembly system. In that year, the then existing 140 local authorities were demarcated into
110 districts. In 2004, 28 new districts were created; this increased the number of districts in
the country to 138. In 2008, 32 additional districts were created bringing the total number of
districts to 170. The 2010 Population and Housing Census was conducted in these 170
administrative districts (these are made-up of 164 districts/municipals and 6 metropolitan
areas). In 2012, 46 new districts were created to bring the total number of districts to 216.
There was urgent need for data for the 46 newly created districts for planning and decision-
making. To meet this demand, the 2010 Census data was re-programmed into 216 districts
after carrying out additional fieldwork and consultations with stakeholders in the districts
affected by the creation of the new districts.
Locality
A locality was defined as a distinct population cluster (also designated as inhabited place,
populated centre, settlement) which has a NAME or LOCALLY RECOGNISED STATUS. It
included fishing hamlets, mining camps, ranches, farms, market towns, villages, towns, cities
and many other types of population clusters, which meet the above criteria. There were two
main types of localities, rural and urban. As in previous censuses, the classification of
localities into ‘urban’ and ‘rural’ was based on population size. Localities with 5,000 or more
persons were classified as urban while localities with less than 5,000 persons were classified
as rural.

10
Population
The 2010 Census was a “de facto” count and each person present in Ghana, irrespective of
nationality, was enumerated at the place where he/she spent the midnight of 26th September
2010.
Household
A household was defined as a person or a group of persons, who lived together in the same
house or compound and shared the same house-keeping arrangements. In general, a
household consisted of a man, his wife, children and some other relatives or a house help who
may be living with them. However, it is important to remember that members of a household
are not necessarily related (by blood or marriage) because non-relatives (e.g. house helps)
may form part of a household.
Head of household
The household head was defined as a male or female member of the household recognised as
such by the other household members. The head of household is generally the person who has
economic and social responsibility for the household. All relationships are defined with
reference to the head.
Household and Non-household population
Household population comprised of all persons who spent the census night in a household
setting. All persons who did not spend the census night in a household setting (except
otherwise stated) were classified as non-household population. Persons who spent census
night in any of the under listed institutions and locations were classified as non-household
population:
(a) Educational Institutions
(b) Children's and old people’s homes
(c) Hospitals and healing centres
(d) Hotels
(e) Prisons
(f) Service barracks
(g) Soldiers on field exercise
(h) Floating Population: The following are examples of persons in this category:
i. All persons who slept in lorry parks, markets, in front of stores and offices, public
bathrooms, petrol filling stations, railway stations, verandas, pavements, and all such
places which are not houses or compounds.
ii. Hunting and fishing camps.
iii. Beggars and vagrants (mentally sick or otherwise).
11
Age
The age of every person was recorded in completed years disregarding fractions of days and
months. For those persons who did not know their birthdays, the enumerator estimated their
ages using a list of district, regional and national historical events.
Nationality
Nationality is defined as the country to which a person belongs. A distinction is made
between Ghanaians and other nationals. Ghanaian nationals are grouped into Ghanaian by
birth, Ghanaian with dual nationality and Ghanaian by naturalization. Other nationals are
grouped into ECOWAS nationals, Africans other than ECOWAS nationals, and non-
Africans.
Ethnicity
Ethnicity refers to the ethnic group that a person belonged to. This information is collected
only from Ghanaians by birth and Ghanaians with dual nationality. The classification of
ethnic groups in Ghana is that officially provided by the Bureau of Ghana Languages and
which has been in use since the 1960 census.
Birthplace
The birthplace of a person refers to the locality of usual residence of the mother at the time of
birth. If after delivery a mother stayed outside her locality of usual residence for six months
or more or had the intention of staying in the new place for six or more months, then the
actual town/village of physical birth becomes the birthplace of the child.
Duration of residence
Duration of residence refers to the number of years a person has lived in a particular place.
This question is only asked of persons not born in the place where enumeration took place.
Breaks in duration of residence lasting less than 12 months are disregarded. The duration of
residence of persons who made multiple movements of one (1) year or more is assumed to be
the number of years lived in the locality (town or village) since the last movement.
Religion
Religion refers to the individual’s religious affiliation as reported by the respondent,
irrespective of the religion of the household head or the head’s spouse or the name of the
person. No attempt was made to find out if respondents actually practiced the faith they
professed.
Marital status
Marital status refers to the respondent’s marital status as at Census Night. The question on
marital status was asked only of persons 12 years and older. The selection of the age limit of
12 years was based on the average age at menarche and also on the practice in some parts of
the country where girls as young as 12 years old could be given in marriage.
Literacy
The question on literacy referred to the respondent's ability to read and write in any language.
A person was considered literate if he/she could read and write a simple statement with
understanding. The question on literacy was asked only of persons 11 years and older.

12
Education
School Attendance
Data was collected on school attendance for all persons three (3) years and older. School
attendance refers to whether a person has ever attended, was currently attending or has never
attended school. In the census, school meant an educational institution where a person
received at least four hours of formal education.
Although the lower age limit of formal education is six years for primary one, eligibility for
the school attendance question was lowered to three years because pre-school education has
become an important phenomenon in the country.
Level of education
Level of education refers to the highest level of formal school that a person ever attended or
was attending. This information was obtained for persons 3 years and older.
Activity status
Activity status refers to economic or non-economic activity of respondents during the 7 days
preceding census night. Information on type of activity was collected on persons 5 years and
older. A person was regarded as economically active if he/she:
a. Worked for pay or profit or family gain for at least 1 hour within the 7 days preceding
Census Night. This included persons who were in paid employment or self-
employment or contributing family workers.
b. Did not work, but had jobs to return to.
c. Were unemployed.
The economically not active were persons who did not work and were not seeking for work.
They were classified by reasons for not being economically active. Economically not active
persons included homemakers, students, retired persons, the disabled and persons who were
unable to work due to their age or ill-health.
Occupation
This referred to the type of work the person was engaged in at the establishment where he/she
worked. This was asked only of persons 5 years and older who worked 7 days before the
census night, and those who did not work but had a job to return to as well as those
unemployed who had worked before. All persons who worked during the 7 days before the
census night were classified by the kind of work they were engaged in. The emphasis was on
the work the person did during the reference period and not what he/she was trained to do.
For those who did not work but had a job to return to, their occupation was the job they
would go back to after the period of absence. Also, for persons who had worked before and
were seeking for work and available for work, their occupation was on the last work they did
before becoming unemployed. If a person was engaged in more than one occupation, only the
main one was considered.
Industry
Industry referred to the type of product produced or service rendered at the respondent’s work
place. Information was collected only on the main product produced or service rendered in
the establishment during the reference period.

13
Employment status
Employment status refers to the status of a person in the establishment where he/she currently
works or previously worked. Eight employment status categories were provided: employee,
self-employed without employees, self-employed with employees, casual worker,
contributing family worker, apprentice, domestic employee (house help). Persons who could
not be classified under any of the above categories were classified as “other”.
Employment sector
This refers to the sector in which a person worked. The employment sectors covered in the
census were public, private formal, private informal, semi-public/parastatal, NGOs and
international organizations.
Disability
Persons with disability were defined as those who were unable to or were restricted in the
performance of specific tasks/activities due to loss of function of some part of the body as a
result of impairment or malformation. Information was collected on persons with visual/sight
impairment, hearing impairment, mental retardation, emotional or behavioural disorders and
other physical challenges.
Information Communication Technology (ICT)
ICT questions were asked for both individuals and households. Persons having mobile
phones refer to respondents 12 years and older who owned mobile phones (irrespective of the
number of mobile phones owned by each person). Persons using internet facility refers to
those who had access to internet facility at home, internet cafe, on mobile phone or other
mobile device. Internet access is assumed to be not only via computer, but also by mobile
phones, PDA, game machine and digital television.
Households having Personal Computers/Laptops refer to households who own
desktops/laptop computers. The fixed telephone line refers to a telephone line connecting a
customer’s terminal equipment (e.g. telephone set, facsimile machine) to the public switch
telephone network.
Fertility
Two types of fertility data were collected: lifetime fertility and current fertility. Lifetime
fertility refers to the total number of live births that females 12 years and older had ever had
during their life time. Current fertility refers to the number of live births that females 12-54
years old had in the 12 months preceding the Census Night.
Mortality
Mortality refers to all deaths that occurred in the household during the 12 months preceding
the Census Night. The report presents information on deaths due to accidents, violence,
homicide and suicide. In addition, data were collected on pregnancy-related deaths of
females 12-54 years.
Agriculture
The census sought information on household members who are engaged in agricultural
activities, including the cultivation of crops or tree planting, rearing of livestock or breeding
of fish for sale or family consumption. Information was also collected on their farms, types of
crops and number and type of livestock.

14
Housing conditions and facilities
The UN recommended definition of a house as “a structurally separate and independent place
of abode such that a person or group of persons can isolate themselves from the hazards of
climate such as storms and the sun’’ was adopted. The definition, therefore, covered any type
of shelter used as living quarters, such as separate houses, semi-detached houses,
flats/apartments, compound houses, huts, tents, kiosks and containers. Living quarters or
dwelling units refer to a specific area or space occupied by a particular household and
therefore need not necessarily be the same as the house of which the dwelling unit may be a
part.
Information collected on housing conditions included the type of dwelling unit, main
construction materials for walls, floor and roof, holding/tenure arrangement, ownership type,
type of lighting, source of water supply and toilet facilities. Data was also collected on
method of disposal of solid and liquid waste.
1.7 Organization of the Report
The report consists of nine chapters. Chapter one provides basic information about the
district. It gives a brief background of the district, describing its physical features, political
and administrative structure, social and cultural structure, economy and the methodology and
concepts used in the report. Chapter two discusses the population size, composition and age
structure. It further discusses the migratory pattern in the district as well as fertility and
mortality.
In chapter three, the focus is on household size, composition and headship as well as the
marital characteristics and nationality of the inhabitants of the district. The chapter also
discusses the religious affiliations and the educational statuses of the members of the district.
Chapter four focuses on economic characteristics such as economic activity status,
occupation, industries and the employment status and sectors that the people are employed.
Information Communication Technology (ICT) is discussed in chapter five. It analyses
mobile phone ownership, internet use and ownership of desktop/laptop computers while
chapter six is devoted to Persons living with disabilities (PWDs) and their socio-demographic
characteristics. Chapter seven concentrates on the agricultural activities of the households,
describing the types of farming activities, livestock rearing and numbers of livestock reared.
In chapter eight, housing conditions such as housing stock, type of dwelling and construction
materials, room occupancy, holding and tenancy, lighting and cooking facilities, bathing and
toilet facilities, waste disposal and source of water for drinking or for other domestic use in
the district are discussed and analysed in detail. The final chapter, Chapter nine presents the
summary of findings and conclusions. It also discusses the policy implications of the findings
for the district.

15
CHAPTER TWO
DEMOGRAPHIC CHARACTERISTICS
2.1 Introduction
The demography of an area is the characteristics and statistics of its human population
especially its size, growth, density, distribution, and statistics regarding birth, marriage,
disease and death. It is essential that for the purpose of development, the demographic
characteristics of the district be fully understood for effective policy decision making. This
chapter discusses the population size, composition and age-sex structure, nationality, birth
place, ethnicity, fertility, mortality and migration related to the district.
2.2 Population Size and Distribution
Table 2.1a: shows the number and proportion of males and females in each age group. This
structure can have a considerable impact on the population’s social and economic situation.
The table also shows the number and proportion of each age group living in urban and rural
localities. The total population of the district was 59,124. Of this total population, 28,579
constituting (48.3%) are males and 30,545 (51.7%) are females. The age group with the
highest population is 0-4, with a proportion of 16.0%, followed by 5-9 age group, 14.1%, 10-
14, 12.7% and 15-19, 11.4% in that order. The age group 95 years and older has the lowest
population with a proportion of 0.1 percent. The table further shows that the sex ratio for the
district is 93.6 which means that for every 100 female populations, there are approximately
94 males in the population. The age group with the highest sex ratio (109.3) is 15-19 years
and that with the lowest sex ratio (31.4) is the 95 years and older age group.
The trend of the male and female populations of the districts follows a trend similar to that of
the total population with the highest proportions belonging to the groups in the younger years
and the lowest proportions belonging to the older age groups. The male age group with the
highest proportion of the total male population is the 0-4 age group with 16.8 percent and that
of the female is also the 0-4 age group with 15.3 percent. Both males and females
individually have the 95 years and older age groups contributing the lowest to their total
populations with the male being 0.04 percent and the female being 0.1 percent.
A higher proportion of the population in the district live in rural areas (70.3%) compared to
those in the urban areas (29.7%). The proportion of the population of the different age groups
living in both rural and urban localities is quite proportional to the population of those age
groups. The highest proportion of those living in both rural and urban localities is highest for
the 0-4 age group with 15.8 percent and 16.0 percent for urban and rural localities
respectively and lowest for the 95 years and older age group with both the urban and rural
localities each having 0.1 percent.

16
Table 2.1a: Population by age, sex and type of locality
Sex
Type of locality
Both Sexes
Male
Female
Sex
ratio Urban
Rural
Age Group Number Percent Number Percent Number Percent Number Percent Number Percent All Ages 59,124 100.0
28,579 100.0
30,545 100.0 93.6
17,555 100.0
41,569 100.0
0 - 4 9,453 16.0
4,787 16.8
4,666 15.3 102.6
2,782 15.8
6,671 16.0 5 - 9 8,308 14.1
4,244 14.9
4,064 13.3 104.4
2,528 14.4
5,780 13.9
10 - 14 7,537 12.7
3,837 13.4
3,700 12.1 103.7
2,356 13.4
5,181 12.5 15 - 19 6,717 11.4
3,507 12.3
3,210 10.5 109.3
2,091 11.9
4,626 11.1
20 - 24 5,276 8.9
2,536 8.9
2,740 9.0 92.6
1,550 8.8
3,726 9.0 25 - 29 4,391 7.4
2,008 7.0
2,383 7.8 84.3
1,292 7.4
3,099 7.5
30 - 34 3,533 6.0
1,639 5.7
1,894 6.2 86.5
1,060 6.0
2,473 5.9 35 - 39 2,937 5.0
1,322 4.6
1,615 5.3 81.9
884 5.0
2,053 4.9
40 - 44 2,411 4.1
1,083 3.8
1,328 4.3 81.6
729 4.2
1,682 4.0 45 - 49 1,906 3.2
840 2.9
1,066 3.5 78.8
559 3.2
1,347 3.2
50 - 54 1,642 2.8
680 2.4
962 3.1 70.7
471 2.7
1,171 2.8 55 - 59 1,098 1.9
508 1.8
590 1.9 86.1
299 1.7
799 1.9
60 - 64 1,105 1.9
501 1.8
604 2.0 82.9
294 1.7
811 2.0 65 - 69 724 1.2
316 1.1
408 1.3 77.5
180 1.0
544 1.3
70 - 74 859 1.5
342 1.2
517 1.7 66.2
213 1.2
646 1.6 75 - 79 453 0.8
168 0.6
285 0.9 58.9
92 0.5
361 0.9
80 - 84 394 0.7
145 0.5
249 0.8 58.2
83 0.5
311 0.7 85 - 89 187 0.3
59 0.2
128 0.4 46.1
48 0.3
139 0.3
90 - 94 147 0.2
46 0.2
101 0.3 45.5
33 0.2
114 0.3 95 + 46 0.1 11 0.0 35 0.1 31.4 11 0.1 35 0.1
Source: Ghana Statistical Service, 2010 Population and Housing Census

17
2.3 Age-Sex Structure
The age structure of the district shows a broad base that gradually declines with increasing
age as in Figure 2.1. The broad base of the population pyramid indicates that the population
of the district is very young. This means that many resources are needed for the provision of
schools, health care facilities and employment opportunities for the youth.
Figure 2.1: Age-sex structure of the population
Source: Ghana Statistical Service, 2010 Population and Housing Census
2.3.1 Age dependency ratio
Table 2.1b reveals that the district has an age-dependency ratio of 90.6. This means that
averagely for every 100 people aged 15-64 years, there are 90 people depending on them for
their existence. The child dependency ratio (81.6) is much higher than the old age
dependency ratio (9.1). The age dependency ratio for the urban localities is 90.2, lower than
that of the rural localities (90.8) The table further shows that slightly more than half (52.5%)
of the population are aged 15-64 years, while 42.8 percent and 4.8 percent are aged 0-14
years and 65 years and older respectively.
6,000 4,000 2,000 0 2,000 4,000 6,000
0-4
5-9
10-14
15-19
20-24
25-29
30-34
35-39
40-44
45-49
50-54
55-59
60-64
65-69
70-74
75-79
80-84
85+
Population
Age
Male Female

18
Table 2.1b: Age dependency ratio
Age Group
Sex Type of locality
Both Sexes
Male
Female
Urban
Rural
N % N % N % N % N %
All Ages 59,124 100.0
28,579 100.0
30,545 100.0
17,555 100.0
41,569 100.0
0-14 25,298 42.8
12,868 45.0
12,430 40.7
7,666 43.7
17,632 42.4
15-64 31,016 52.5
14,624 51.2
16,392 53.7
9,229 52.6
21,787 52.4
65+ 2,810 4.8
1,087 3.8
1,723 5.6
660 3.8
2,150 5.2
Age-
dependency
ratio 90.6 95.4 86.3 90.2 90.8
Source: Ghana Statistical Service, 2010 Population and Housing Census
2.4 Fertility, Mortality and Migration
Migration is the geographic movement of people across a specified boundary for the purpose
of establishing a new permanent or semi-permanent residence. Along with fertility and
mortality, migration is a component of population change.
The aspects of fertility, mortality and migration covered by the Ghana 2010 PHC that are
relevant for socioeconomic planning and policy adoption in the district are examined in this
chapter.
2.4.1 Fertility
Fertility refers to the number of live births women have. It is directly determined by a number
of factors that, in turn, are affected by a great many social, cultural, economic, health, and
other environmental factors.
Current fertility data (births in the last twelve months to women aged 15-49 years) have been
used to estimate age specific fertility rates, total fertility rates, general fertility rates and crude
birth rates for all the districts in the Greater Accra Region. Table 2.2 indicates the reported
total fertility rate (TFR), which is the average number of children that would be born to a
woman by the time she ended child bearing if she were to pass through all her child bearing
years conforming to the age-specific fertility rates of a given year, is 4.0 which is the highest
amongst all the districts in the region and much higher than the regional average of 2.6.
The general fertility rate (GFR), the number of live births per 1,000 women ages 15-49 in a
given year follows a similar trend with the district having the highest in the region with 115.3
compared with the regional of 75.7. (Table 2.2)
The crude birth rate (CBR), the number of live births per 1,000 populations in a given year
for the district per Table 2.2 is 27.8, slightly behind Ga South Municipal with the highest of
31.8 but still higher than the regional average of 22.7

19
Table 2.2: Reported total fertility rate, general fertility rate and crude birth rate
by district
District Population
Number of
women 15-
49 years
Number
of births
in last 12
months
Total
Fertility
Rate
*General
Fertility
Rate
**Crude
Birth
Rate
All Districts 4,010,054 1,203,838 91,077
2.6 75.7 22.7
Ga South Municipal 411,377 117,377 13,078
3.9 111.4 31.8
Ga West Municipal 219,788 64,817 5,783
2.9 89.2 26.3
Ga East Municipal 147,742 44,036 3,703
2.8 84.1 25.1
Accra Metropolis 1,665,086 514,523 32,770
2.2 63.7 19.7
Adenta Municipal 78,215 23,158 2,033
2.7 87.8 26
Ledzokuku/Krowor Municipal 227,932 69,038 4,990
2.4 72.3 21.9
Ashaiman Municipal 190,972 57,936 4,489
2.6 77.5 23.5
Tema Metropolis 292,773 89,924 6,138
2.3 68.3 21
Shai Osudoku 51,913 13,269 1,222
3 92.1 23.5
Ada East 71,671 17,576 1,817
3.5 103.4 25.4
Ga Central Municipal 117,220 34,365 3,193
3.1 92.9 27.2
La Dade Kotopon Municipal 183,528 56,845 3,466
2 61 18.9
La Nkwantanang Madina
Municipal 111,926 35,055 2,514
2.5 71.7 22.5
Kpone Katamanso 109,864 32,751 2,681
2.6 81.9 24.4
Ningo Prampram 70,923 18,932 1,558
2.8 82.3 22
Ada West 59,124 14,236 1,642 4 115.3 27.8 Source: Ghana Statistical Service, 2010 Population and Housing Census
Note: * Number of live births per 1,000 women aged 15-49 years
** Number of live births per 1,000 population
Table 2.3 shows the female population 12 years and older by age, children ever born, children
surviving and sex of child. The data shows that mean children ever born to females 12 years
and older is 2.9 and mean children surviving is 2.5. The table further shows that the mean
children ever born is virtual zero at age 12-14 and it is 6.7 at age 60 years and older.
Table 2.3: Female population 12 years and older by age, children ever born,
children surviving and sex of child
Age
Female
Population
Children Ever Born (CEB) Children Surviving (CS)
Both
sexes Male
Female
Mean
CEB
Both
sexes Male
Female
Mean
CS
All ages 20,334 58,783 29,315 29,468 2.9 49,904 24,629 25,275 2.5
12 - 14 2,219 18 8 10 0.0 16 6 10 0.0
15 - 19 3,210 528 275 253 0.2 456 223 233 0.1
20 - 24 2,740 2,716 1,361 1,355 1.0 2,502 1,227 1,275 0.9
25 - 29 2,383 4,842 2,428 2,414 2.0 4,472 2,225 2,247 1.9
30 - 34 1,894 6,105 3,082 3,023 3.2 5,617 2,802 2,815 3.0
35 - 39 1,615 6,902 3,503 3,399 4.3 6,278 3,182 3,096 3.9
40 - 44 1,328 6,803 3,364 3,439 5.1 6,129 3,002 3,127 4.6
45 - 49 1,066 5,965 2,988 2,977 5.6 5,248 2,613 2,635 4.9
50 - 54 962 5,697 2,879 2,818 5.9 4,794 2,395 2,399 5.0
55 - 59 590 3,660 1,772 1,888 6.2 3,079 1,470 1,609 5.2
60 + 2,327 15,547 7,655 7,892 6.7 11,313 5,484 5,829 4.9 Source: Ghana Statistical Service, 2010 Population and Housing Census

20
2.4.2 Mortality
The death rate of females is higher than males from age 0 to about age 34. The death rates for
males at ages 35 to 64 higher compared the females. However, female death rates assume
higher proportions from age 65 years and older.
Crude death rate is the number of deaths per 1,000 population in a given year. Table 2.4
reveals that, the computed death rate of the district is 6.5 the third highest in the region, is
higher than the crude death rate of the region (4.3 per 1,000 population). The crude death rate
of the district is the third highest in the region.
Figure 2.2: Reported age specific death rates by sex
Source: Ghana Statistical Service, 2010 Population and Housing Census
Crude death rate is the number of deaths per 1000 population in a given year. Table 2.4
reveals that, the computed death rate of the district is 6.5 the third highest in the region, is
higher than the crude death rate of the region (4.3 per 1,000 population). The crude death rate
of the district is the third highest in the region.
0.01
0.00 0.00 0.00 0.00
0.00 0.01
0.01 0.01
0.01 0.01
0.02
0.03
0.00
0.03
0.01
0.00 0.00 0.00 0.00
0.00
0.01
0.01
0.01
0.01
0.00
0.01 0.01
0.02
0.04
0.00
0.01
0.01
0.02
0.02
0.03
0.03
0.04
0.04
0.05
Under5
5-9 10-14 15-19 20-24 25-29 30-34 35-39 40-44 45-49 50-54 55-59 60-64 65-69 70+
Dea
th r
ate
Age
Male
Female

21
Table 2.4: Total population, deaths in households and crude death rate
by District
District Total
Population Deaths in
households *Crude
death rate All Districts 4,010,054 17,363 4.3 Ga South Municipal 411,377 1,739 4.2 Ga West Municipal 219,788 727 3.3 Ga East Municipal 147,742 504 3.4 Accra Metropolis 1,665,086 7,276 4.4 Adenta Municipal 78,215 265 3.4 Ledzokuku/Krowor Municipal 227,932 818 3.6 Ashaiman Municipal 190,972 738 3.9 Tema Metropolis 292,773 1,300 4.4 Shai Osudoku 51,913 318 6.1 Ada East 71,671 742 10.4 Ga Central Municipal 117,220 360 3.1 La Dade Kotopon Municipal 183,528 807 4.4 La Nkwantanang Madina Municipal 111,926 395 3.5 Kpone Katamanso 109,864 441 4 Ningo Prampram 70,923 550 7.8 Ada West 59,124 383 6.5
Source: Ghana Statistical Service, 2010 Population and Housing Census
2.4.3 Migration
Table 2.4 shows the birthplace of migrants and the duration of residence in the district. For
the purpose of this analysis, migrants are defined as persons born outside the district but were
enumerated in the district. The total number of migrants (15,283) forms 25.8 percent of the
total population enumerated in the district. The data shows that the highest proportion of the
migrants, (28.8%) in the district have stayed for 1-4 years.
Of the total number of migrants, more than half (54.0%) were born elsewhere (that is, outside
the locality of enumeration) but in the Greater Accra Region. Amongst those born in the
Greater Accra Region, 18.3 percent have resided for less than one year, 27.7 percent have
resided between one and four years, and 17.5% and 20.0% have lived in the district for 10-19
years and over 20 years. .
With regards to migrants who were born in another region, those from Volta (15.6%)
constitute the highest proportion, with majority (34.0%) staying for 1-4 years. This is
followed by Eastern region (11.1%) with the highest proportion of the population 30.5
percent also residing in the district for 1- 4 years. Less than five percent (4.6%) of the
migrants were born outside the country.

22
Table 2.5: Birthplace by duration of residence of migrants
Duration of residence (%)
Birthplace Number
Less than
1 year
1-4
years
5-9
years
10-19
years
20+
years
Total 15,283 18.5 28.8 16.8 16.9 18.9
Born elsewhere in the region 8,256 18.3 27.7 16.4 17.5 20.0
Born elsewhere in another region:
Western 215 17.7 30.7 14.0 17.2 20.5
Central 478 15.7 30.3 19.2 15.7 19.0
Greater Accra - 0.0 0.0 0.0 0.0 0.0
Volta 2,383 18.9 34.0 18.5 14.7 13.8
Eastern 1,704 14.7 30.5 15.4 15.6 23.8
Ashanti 573 20.1 30.2 14.7 17.3 17.8
Brong Ahafo 487 26.1 26.3 15.6 16.0 16.0
Northern 281 21.7 21.7 19.9 14.9 21.7
Upper East 130 30.0 16.9 20.8 18.5 13.8
Upper West 79 26.6 26.6 5.1 13.9 27.8
Outside Ghana 697 19.7 25.0 20.9 21.8 12.6 Source: Ghana Statistical Service, 2010 Population and Housing Census

23
CHAPTER THREE
SOCIAL CHARACTERISTICS
3.1 Introduction
The welfare of a geographical scope and its inhabitants can be better understood in terms of
its social characteristics. This chapter analyses some household characteristics such as the
composition and structure, nationality, marital Status, religious affiliation, literacy and
education. Data on these social characteristics is needed for planning social services in
health, education and housing.
3.2 Household Size, Composition and Structure
3.2.1 Household size
Table 3.1 reveals that the total population in households in the District is 57,746. The average
household size (5.1) in the District is higher than the regional average of 3.9. Table 3.1 also
reveals that the average household size in rural areas (5.1) is higher compared to households
in the urban areas (5.0).
Table 3.1: Household size by type of locality
Categories Total
country Region
District
Total Urban Rural
Total household population 24,076,327 3,888,512
57,746 17,206 40,540
Number of households 5,467,054 1,036,370
11,642 3,522 8,120
Average household size 4.5 3.9 5.1 5.0 5.1 Source: Ghana Statistical Service, 2010 Population and Housing Census
3.2.2 Household composition
Table 3.2 shows the relationship of household members and their sex. The highest proportion
of the household members is children (40.7%), followed by the heads (20.2%) then
grandchildren (14.4%). Other relatives in the household and spouses constitute 9.2 percent
and 7.8 percent of the household composition. The data shows a higher proportion of males
(23.8%) than females (16.7%) are of heads. It is observed that slightly over two-fifths
(43.1%) of children are male compared to their female counterparts of 38.5 percent.

24
Table 3.2: Household population by composition and sex
Household composition Total Male Female
Number Percent Number Percent Number Percent
Total 57,746 100.0
27,848 100.0
29,898 100.0
Head 11,642 20.2
6,638 23.8
5,004 16.7
Spouse (wife/husband) 4,479 7.8
446 1.6
4,033 13.5
Child (son/daughter) 23,507 40.7
11,992 43.1
11,515 38.5
Parent/Parent in-law 440 0.8
79 0.3
361 1.2
Son/Daughter in-law 336 0.6
103 0.4
233 0.8
Grandchild 8,298 14.4
4,044 14.5
4,254 14.2
Brother/Sister 2,057 3.6
1,080 3.9
977 3.3
Step child 618 1.1
308 1.1
310 1.0
Adopted/Foster child 319 0.6
137 0.5
182 0.6
Other relative 5,287 9.2
2,574 9.2
2,713 9.1
Non-relative 763 1.3 447 1.6 316 1.1 Source: Ghana Statistical Service, 2010 Population and Housing Census
3.2.3 Household structure
The Household structure is determined by the people living together in one unit and their
relationship to the head of household. Majority of the household population live in extended
family household (63.1%) than nuclear family households (36.9%). Table 3.3 also shows that
26.8 percent of households in the district comprise of single parents living with their
extended families and 21.5 percent of the households are nuclear family made up of head,
spouse(s) and children only. One-fifth (20.5%) of the households are also made up of the
extended family comprising of the head, spouse(s), children and relatives of the head.
There is more female single parent extended structure 29.7 percent than males 23.7 percent in
the district. On the other hand, there are more males with nuclear family (Head, spouse(s) &
children and extended family (Head spouse(s) children& Head’s relatives, 23% and 21.4%
compared to females 19.7 percent in each case.
Table 3.3: Household population by structure and sex
Household structure
Total Male Female
Number Percent Number Percent Number Percent
Total 57,746 100.0
27,848 100.0
29,898 100.0
Nuclear family 21,324 36.9
10,874 39
10,450 34.9
Head only 1,783 3.1
1,264 4.5
519 1.7
Head and a spouse only 594 1.0
299 1.1
295 1.0
Nuclear (Head, spouse(s) & children) 12,398 21.5
6,496 23.3
5,902 19.7
Single parent Nuclear 6,549 11.3
2,815 10.1
3,734 12.5
Extended family 36,422 63.1
16,974 61
19,448 65.1
Extended (Head, spouse(s), children
& Head's relatives) 11,835 20.5
5,946 21.4
5,889 19.7
Extended & non-relatives 876 1.5
449 1.6
427 1.4
Head spouse(s) and other
composition 1,709 3
855 3.1
854 2.9
Single parent Extended 15,469 26.8
6,592 23.7
8,877 29.7
Single parent Extended & non-
relatives 864 1.5
366 1.3
498 1.7
Head and other composition but no
spouse 5,669 9.8 2,766 9.9 2,903 9.7 Source: Ghana Statistical Service, 2010 Population and Housing Census

25
3.3 Marital Status
This section presents information on the marital status of persons 12 years and older, by sex
and age group. The distribution of marital status has implications on the size and distribution
of households, as well as the demand for housing units and residential related services. The
data show that 44.2 percent of the population 12 years and older are married and 41.4 percent
have never been married. In addition, 5.5 percent of the population are widowed, 4.2 percent
in informal/consensual unions while 2.7 percent and 1.9 percent are separated or divorced.
Figure 3.1: Marital status of persons 12 years and older
Source: Ghana Statistical Service, 2010 Population and Housing Census
In terms of age, younger people are more likely than older people to remain single. On the
other hand, older people are more likely than the younger ones to be married, divorced or
separated. The 35-39 and 40-44 age groups have the highest proportions (about 79 percent) of
the married population. The proportion of those who have never married decreases with age
from 94.9 percent for the 12-14 age groups to about 3.0 percent for those aged 65 years and
older.
The proportions of the married population increase with age from 4.7 percent for the 12-14
age groups to 70.6 percent for the 50-54 age group and decreases thereafter, to about 46.7
percent for those aged 65years and older.
Both the male and female populations follow similar trends. It is observed however, that
males (51.0%) are more likely than females (33.0%) to be never married. On the contrary,
more females (47.3%), compared to males (40.8%) are likely to be married. The proportions
of females who are married are higher than their male counterparts between ages 15 and 34
years. Furthermore, there are more females 33.3 percent than 13.3 percent of males who are
widowed.
Never married
41.4%
Informal/
Consensual
union/Living
together
4.2%
Married
44.2%
Separated
2.7%
Divorced
1.9%
Widowed
5.5%

26
Table 3.4: Persons 12 years and older by sex, age-group and marital status
Sex/Age-
group Number Total
Never
married
Informal/
Consensual
union/Living
together Married Separated Divorced Widowed
Both Sexes
Total 38,259
100.0 41.4 4.2 44.2 2.7 1.9 5.5
12 - 14 4,433
100.0 94.9 0.4 4.7 0.0 0.0 0.0
15 - 19 6,717
100.0 88.9 2.7 7.7 0.5 0.1 0.1
20 - 24 5,276
100.0 59.6 8.1 30.1 1.5 0.3 0.5
25 - 29 4,391
100.0 33.0 7.9 55.2 2.4 0.9 0.6
30 - 34 3,533
100.0 14.6 6.0 73.3 3.1 1.8 1.3
35 - 39 2,937
100.0 6.9 5.8 78.8 3.6 2.3 2.6
40 - 44 2,411
100.0 4.5 4.2 79.1 4.7 4.0 3.6
45 - 49 1,906
100.0 4.0 3.1 76.8 5.0 4.9 6.2
50 - 54 1,642
100.0 3.0 1.6 70.6 7.0 5.5 12.3
55 - 59 1,098
100.0 1.7 1.4 68.6 6.8 6.6 14.8
60 - 64 1,105
100.0 3.2 1.3 62.5 6.7 5.8 20.5
65+ 2,810
100.0 3.0 0.9 46.7 4.3 4.4 40.7
Male
Total 17,925
100.0 51.0 3.3 40.8 1.9 1.5 1.5
12 - 14 2,214
100.0 94.0 0.5 5.6 0.0 0.0 0.0
15 - 19 3,507
100.0 95.2 0.7 4.0 0.1 0.0 0.0
20 - 24 2,536
100.0 80.0 4.8 14.2 0.8 0.2 0.1
25 - 29 2,008
100.0 48.7 7.4 41.7 1.6 0.2 0.3
30 - 34 1,639
100.0 22.1 6.4 68.2 1.6 1.2 0.4
35 - 39 1,322
100.0 10.4 5.2 79.0 2.6 1.9 0.8
40 - 44 1,083
100.0 7.0 3.4 81.9 3.3 3.2 1.1
45 - 49 840
100.0 4.9 3.2 82.9 4.6 2.9 1.5
50 - 54 680
100.0 4.3 1.6 80.3 5.1 4.4 4.3
55 - 59 508
100.0 2.6 1.8 80.9 5.3 5.3 4.1
60 - 64 501
100.0 3.4 1.8 77.8 5.2 6.6 5.2
65+ 1,087
100.0 4.2 1.3 70.3 5.7 5.2 13.3
Female
Total 20,334
100.0 33.0 5.0 47.3 3.3 2.3 9.1
12 - 14 2,219
100.0 95.8 0.3 3.9 0.0 0.0 0.0
15 - 19 3,210
100.0 81.9 5.0 11.8 1.0 0.1 0.2
20 - 24 2,740
100.0 40.6 11.1 44.9 2.1 0.5 0.8
25 - 29 2,383
100.0 19.8 8.4 66.6 3.0 1.4 0.9
30 - 34 1,894
100.0 8.1 5.6 77.6 4.3 2.3 2.1
35 - 39 1,615
100.0 4.1 6.3 78.6 4.3 2.7 4.0
40 - 44 1,328
100.0 2.4 4.8 76.7 5.8 4.7 5.6
45 - 49 1,066
100.0 3.3 3.0 72.0 5.3 6.5 9.9
50 - 54 962
100.0 2.1 1.7 63.7 8.3 6.2 18.0
55 - 59 590
100.0 1.0 1.0 58.0 8.1 7.8 24.1
60 - 64 604
100.0 3.0 0.8 49.8 7.9 5.1 33.3
65+ 1,723 100.0 2.1 0.7 31.8 3.4 4.0 58.0 Source: Ghana Statistical Service, 2010 Population and Housing Census

27
3.4 Marital Status by Sex and Level of Education
Table 3.5 shows that about one-third (32.3%) of the population have no education, 54.5
percent have education up to the basic level and only 13.1 percent have secondary or higher
education. Compared with the other groups, relatively high proportions (13.2%) of those who
have never married have secondary school, 2.6% have post middle/secondary
certificate/diploma and 1.2% has attained tertiary level education.
For those who are married, 44.7 percent have basic education, 5.0 percent have secondary
education, while 2.4 percent and 1.4 percent have post middle /secondary certificate/diploma
and tertiary education. The level of educational attainment appears to reduce as the levels
increase. Significant proportions of the married 45.0%, the widowed (78.0%), the divorced
(50.6%) and the separated (50.0%) have no education.
The distribution in terms of sex shows more married males with basic and secondary
education (54.1% and 11.2%) than their female counterparts (39.8% and 3.0%). In addition,
54.2 percent of married females have no education while it is 26.1 percent for males. The
data shows relatively higher proportions of males than females at all levels of education in
terms of the marital categories.
Table 3.5: Persons 12 years and older by sex, marital status and level of education
Sex/Marital status Number
All
levels
No
Education Basic1
Secon-
dary2
Voc/
Tech/
Comm
Post middle/
secondary
certificate/
diploma3 Tertiary
4
Both Sexes
Total 38,259 100.0
32.3 54.5 8.2 1.3 2.4 1.2
Never married 15,854 100.0
10.4 71.3 13.2 1.3 2.6 1.2
Informal/Consensual
union/Living together 1,597 100.0
33.8 53.7 7.3 1.5 2.5 1.1
Married 16,928 100.0
45.0 44.7 5.0 1.5 2.4 1.4
Separated 1,022 100.0
50.0 43.5 2.9 1.0 2.0 0.6
Divorced 735 100.0
50.6 41.2 3.3 1.9 1.4 1.6
Widowed 2,123 100.0
78.0 18.4 1.3 0.7 1.3 0.2
Male
Total 17,925 100.0
21.8 60.3 11.0 1.8 3.3 1.8
Never married 9,148 100.0
9.9 70.1 14.2 1.5 2.9 1.5
Informal/Consensual
union/Living together 586 100.0
26.1 54.1 11.6 2.6 3.8 1.9
Married 7,316 100.0
32.8 51.1 7.7 2.2 3.8 2.3
Separated 341 100.0
45.5 45.7 4.7 0.9 3.2 0.0
Divorced 260 100.0
44.6 43.1 4.6 3.5 1.9 2.3
Widowed 274 100.0
66.4 27.0 1.8 0.4 2.9 1.5
Female
Total 20,334 100.0
41.5 49.5 5.8 0.9 1.6 0.7
Never married 6,706 100.0
11.2 73.0 11.7 1.1 2.2 0.9
Informal/Consensual
union/Living together 1,011 100.0
38.3 53.5 4.8 0.9 1.8 0.7
Married 9,612 100.0
54.2 39.8 3.0 0.9 1.4 0.7
Separated 681 100.0
52.3 42.4 2.1 1.0 1.3 0.9
Divorced 475 100.0
53.9 40.2 2.5 1.1 1.1 1.3
Widowed 1,849 100.0 79.8 17.1 1.2 0.7 1.1 0.1
Source: Ghana Statistical Service, 2010 Population and Housing Census

28
3.5 Marital Status and Economic Activity
Table 3.6 shows that the majority of those who are economically not active (59.4%) have
never married. Only 11.1 percent of the population in that group are married. In contrast, 86.4
percent of the employed are married while 37.7 percent of them have never been married.
The highest proportion of the unemployed (4.9%) is reported among those in
Informal/Consensual union/Living together while the least proportion 1.0 percent of the
unemployed are widowed.
There are more males who have never been married (40.8%) than females who have never
been married (33.6 %) and employed. A similar trend occurs in the unemployed group. In the
Economic not active group however, the proportion of males who have never been married is
56.3 percent, less than the 63.7 percent for females. The males who are employed and
married are 88.6 percent and the proportion is 84.7 percent for their female counterparts.
Males and females who are married and economically not active constitute 9.6% and 12.2%
of the population.
Table 3.6: Persons 12 years and older by sex, marital status and economic
activity status
Total Employed Unemployed
Economically not
active
Sex/Marital status Number Percent Number Percent Number Percent Number Percent
Both Sexes
Total 38,259 100.0
24,601 64.3
1,028 2.7
12,630 33.0
Never married 15,854 100.0
5,982 37.7
452 2.9
9,420 59.4
Informal/Consensual
union/Living together 1,597 100.0
1,273 79.7
78 4.9
246 15.4
Married 16,928 100.0
14,623 86.4
434 2.6
1,871 11.1
Separated 1,022 100.0
862 84.3
24 2.3
136 13.3
Divorced 735 100.0
573 78.0
19 2.6
143 19.5
Widowed 2,123 100.0
1,288 60.7
21 1.0
814 38.3
Male
Total 17,925 100.0
11,374 63.5
435 2.4
6,116 34.1
Never married 9,148 100.0
3,728 40.8
271 3.0
5,149 56.3
Informal/Consensual
union/Living together 586 100.0
507 86.5
16 2.7
63 10.8
Married 7,316 100.0
6,483 88.6
133 1.8
700 9.6
Separated 341 100.0
280 82.1
5 1.5
56 16.4
Divorced 260 100.0
214 82.3
4 1.5
42 16.2
Widowed 274 100.0
162 59.1
6 2.2
106 38.7
Female
Total 20,334 100.0
13,227 65.0
593 2.9
6,514 32.0
Never married 6,706 100.0
2,254 33.6
181 2.7
4,271 63.7
Informal/Consensual
union/Living together 1,011 100.0
766 75.8
62 6.1
183 18.1
Married 9,612 100.0
8,140 84.7
301 3.1
1,171 12.2
Separated 681 100.0
582 85.5
19 2.8
80 11.7
Divorced 475 100.0
359 75.6
15 3.2
101 21.3
Widowed 1,849 100.0 1,126 60.9 15 0.8 708 38.3
Source: Ghana Statistical Service, 2010 Population and Housing Census

29
3.6 Nationality
Table 3.7 shows that 95.6 percent of the population enumerated in the district are Ghanaian
by birth, 1.9 percent have dual nationality, and 0.6% Ghanaian by naturalization. 0ne percent
is of the population is if ECOWAS origin, while 0.5% and 0.4% of the population are
Africans other than ECOWAS and other foreign nationals. Similar trends are observed for
both the male and female populations.
Table 3.7: Population by nationality and sex
Both sexes Male Female
Nationality Number Percent Number Percent Number Percent
Total 59,124 100.0
28,579 100.0
30,545 100.0
Ghanaian by birth 56,522 95.6
27,315 95.6
29,207 95.6
Dual nationality (Ghanaian &
Other) 1,109 1.9
514 1.8
595 1.9
Ghanaian by naturalisation 357 0.6
162 0.6
195 0.6
ECOWAS 578 1.0
307 1.1
271 0.9
African other than ECOWAS 294 0.5
162 0.6
132 0.4
Other 264 0.4 119 0.4 145 0.5 Source: Ghana Statistical Service, 2010 Population and Housing Census
3.7 Religious Affiliation
As shown in Table 3.8, majority (88.3%) are Christians followed by those with no religion
(4.9%) and Islam (4.8%). Among the population who profess to be Christians, those who
belong to the Pentecostal/Charismatic group (60.8%) are in the majority followed by the
Protestants (16.2%) and other Christians 9.6%. Whereas males are more likely to belong to
the Protestant group 16.6% and 15.9% than females, females 62.6% are also more likely to
belong to the Pentecostal/Charismatic group than males 58.8%.
Table 3.8: Population by religious affiliation and sex
Religion
Both sexes Male Female
Number Percent Number Percent Number Percent
Total 59,124 100.0
28,579 100.0
30,545 100.0 No religion 2,878 4.9
1,695 5.9
1,183 3.9
Catholic 998 1.7
522 1.8
476 1.6 Protestants (Anglican
Lutheran etc.) 9,597 16.2
4,734 16.6
4,863 15.9
Pentecostal/Charismatic 35,926 60.8
16,805 58.8
19,121 62.6 Other Christian 5,677 9.6
2,792 9.8
2,885 9.4
Islam 2,828 4.8
1,453 5.1
1,375 4.5 Traditionalist 858 1.5
417 1.5
441 1.4
Other 362 0.6 161 0.6 201 0.7 Source: Ghana Statistical Service, 2010 Population and Housing Census
3.8 Literacy and Education
Education is an important aspect of the development of every society. It is the process of
acquiring knowledge, skills, values and attitudes to fully develop individual capacities for the
well-being of the society. There is a relationship between education, human resource
development and economic growth (United Nations Development Program, 2011). Countries

30
therefore place emphasis on educational policies in designing their plans to accelerate
development.
Figure 3.1 shows the population 11 years and older by literacy status. Literacy is defined as
the ability to read and write with understanding in a particular language. The results show
that 68.5 percent of the population is literate and 31.5 percent are not literate. A higher
proportion of males are literate (78.6%) than females (59.5%).
Figure 3.2: Literacy status of persons 11 years and older by sex
Source: Ghana Statistical Service, 2010 Population and Housing Census
Of the literate population, 58.6 percent are literate in English and Ghanaian Language while
36.0 percent are literate in English language only and 36.0% literate in English only. Only 4.0
percent of the population is literate in Ghanaian Language a small proportion 0.9% and 0.5%
of the population also literate in English/French & Ghanaian language and English & French.
Two-fifths (40.5%) of females compared to 32.0 percent of males are literate in English only.
A relatively higher proportion of males (63.0%) than females (53.5%) are literate in both
English and Ghanaian language. The data shows that the proportions of the population literate
in English and Ghanaian language increases from age group 11-14 (47.7%) to 69.5% in age
group 60-64. On the other hand, the proportion of those literate in English only record a
steady decline from 47.2% in age group 11-14 to 22.2% in age group 60-64.
31.5
21.4
40.5
68.5
78.6
59.5
0.0
10.0
20.0
30.0
40.0
50.0
60.0
70.0
80.0
90.0
Both sexes Male Female
Percent
Not literate
Literate

31
Table 3.9: Population 11 years and older by sex, age and literacy status
Age group
None
(not
literate) Literate Total
English
only
Ghanaian
language
only
English
and
Ghanaian
language
English
and
French
English,
French and
Ghanaian
language
Both sexes
Total 12,499 27,146 100.0 36.0 4.0 58.6 0.5 0.9
11-14 566 5,253 100.0 47.2 3.6 47.7 0.3 1.2
15-19 690 6,027 100.0 36.5 2.2 59.3 0.5 1.4
20-24 1,031 4,245 100.0 34.6 2.7 62.1 0.3 0.4
25-29 1,272 3,119 100.0 35.5 3.5 59.5 0.8 0.6
30-34 1,222 2,311 100.0 33.1 4.6 61.3 0.6 0.4
35-39 1,282 1,655 100.0 31.3 6.3 61.6 0.3 0.5
40-44 1,204 1,207 100.0 30.3 9.0 59.4 0.7 0.6
45-49 907 999 100.0 28.1 6.1 64.6 0.5 0.7
50-54 860 782 100.0 25.6 7.3 66.0 0.6 0.5
55-59 564 534 100.0 26.4 7.1 64.4 0.9 1.1
60-64 682 423 100.0 22.2 5.4 69.5 1.2 1.7
65+ 2,219 591 100.0 24.7 7.8 65.8 0.8 0.8
Male
Total 4,003 14,674 100.0 32.1 3.4 63.0 0.6 0.9
11-14 321 2,645 100.0 44.3 2.9 51.3 0.4 1.2
15-19 277 3,230 100.0 34.5 2.3 60.8 0.6 1.8
20-24 300 2,236 100.0 30.7 2.1 66.4 0.3 0.4
25-29 401 1,607 100.0 31.5 2.5 64.3 1.1 0.6
30-34 363 1,276 100.0 28.1 4.9 65.9 0.7 0.4
35-39 371 951 100.0 25.2 4.3 69.7 0.3 0.4
40-44 358 725 100.0 26.5 7.7 65.0 0.6 0.3
45-49 269 571 100.0 24.7 3.3 70.8 0.7 0.5
50-54 245 435 100.0 22.5 6.2 70.1 0.7 0.5
55-59 174 334 100.0 23.1 4.8 69.8 0.9 1.5
60-64 214 287 100.0 16.4 4.5 76.3 1.4 1.4
65+ 710 377 100.0 21.0 6.4 70.6 1.1 1.1
Female
Total 8,496 12,472 100.0 40.5 4.7 53.5 0.4 0.8
11-14 245 2,608 100.0 50.2 4.3 44.1 0.2 1.2
15-19 413 2,797 100.0 38.8 2.1 57.6 0.5 1.0
20-24 731 2,009 100.0 38.8 3.3 57.3 0.2 0.4
25-29 871 1,512 100.0 39.8 4.6 54.4 0.5 0.7
30-34 859 1,035 100.0 39.3 4.2 55.7 0.4 0.5
35-39 911 704 100.0 39.5 9.1 50.6 0.3 0.6
40-44 846 482 100.0 36.1 11.0 51.0 0.8 1.0
45-49 638 428 100.0 32.7 9.8 56.3 0.2 0.9
50-54 615 347 100.0 29.4 8.6 60.8 0.6 0.6
55-59 390 200 100.0 32.0 11.0 55.5 1.0 0.5
60-64 468 136 100.0 34.6 7.4 55.1 0.7 2.2
65+ 1,509 214 100.0 31.3 10.3 57.5 0.5 0.5 Source: Ghana Statistical Service, 2010 Population and Housing Census

32
3.9 School Attendance and Level of Education
This section provides information on school attendance of the population 3 years and older.
About 30 percent of the population 3 years and older has no formal education. The proportion
of females who have never attended school is 36.7 percent and males is 22.6 percent.
Concerning those who are currently attending school, the proportion of males (44.5%) is
higher than females (36.5%). Similarly, higher proportion of males (32.9%) than females
(26.8%) has attended school in the past.
Figure 3.3: Population 3 years and older by school attendance and sex
Source: Ghana Statistical Service, 2010 Population and Housing Census
Table 3.10 gives the educational level of the population in the district who are 3 years and
older. It describes the educational characteristics of persons who attended school in the past
and those currently attending. More than half (51.4%) of the population currently attending
school are at the primary level while 16.5 percent are at the JHS/JSS level. Only 1.3 percent
of them are at the tertiary level.
Of those who have attended school in the past, about one-third (32.2%) and 29.4 percent have
had JSS/JHS and Primary school education respectively. Furthermore, more females 34.2
percent and 35.6 percent have attended Primary and JHS/JSS compared to males 25.3 percent
and 29.2 percent. Higher proportions of males 9.7 percent and 6.4 percent than females 6.9
percent and 3.5 percent have completed their secondary and tertiary education.
29.9
22.6
36.7
40.3
44.5
36.5
29.7
32.9
26.8
0.0
5.0
10.0
15.0
20.0
25.0
30.0
35.0
40.0
45.0
50.0
Total Male Female
Percent
Neverattended
Attendingnow
Attended inthe past
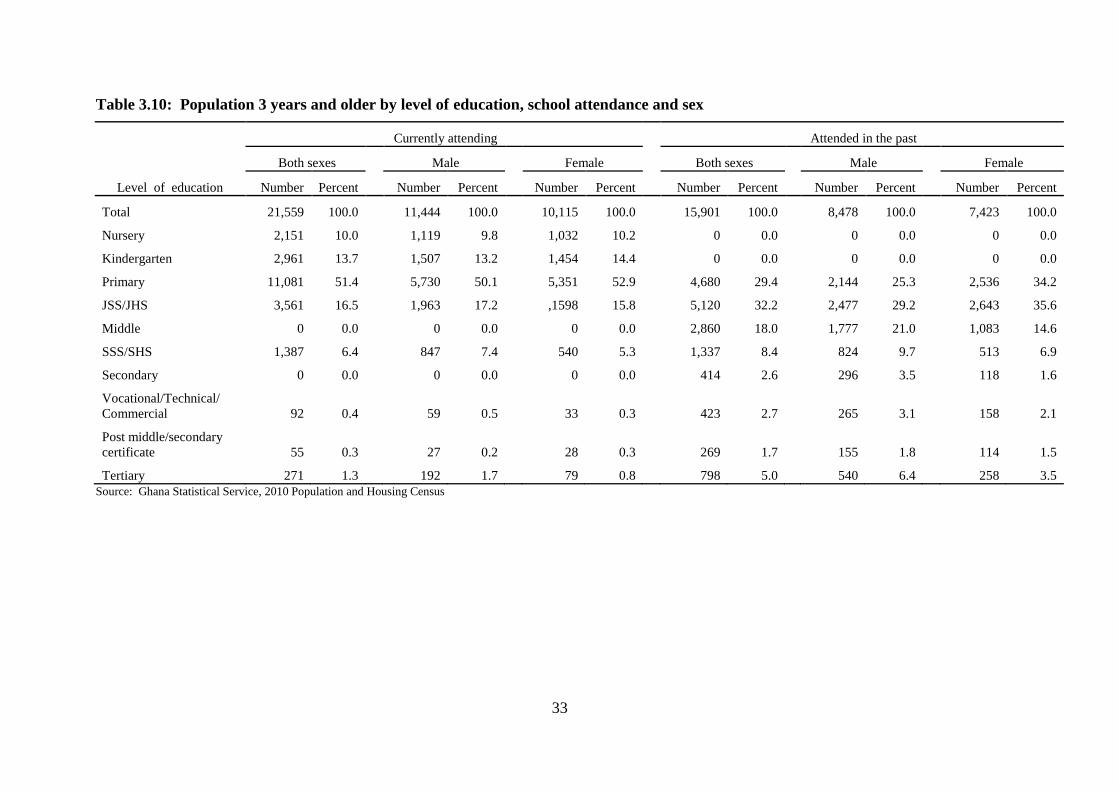
33
Table 3.10: Population 3 years and older by level of education, school attendance and sex
Currently attending Attended in the past
Both sexes
Male
Female
Both sexes
Male
Female
Level of education Number Percent Number Percent Number Percent Number Percent Number Percent Number Percent
Total 21,559 100.0
11,444 100.0
10,115 100.0
15,901 100.0
8,478 100.0
7,423 100.0
Nursery 2,151 10.0
1,119 9.8
1,032 10.2
0 0.0
0 0.0
0 0.0
Kindergarten 2,961 13.7
1,507 13.2
1,454 14.4
0 0.0
0 0.0
0 0.0
Primary 11,081 51.4
5,730 50.1
5,351 52.9
4,680 29.4
2,144 25.3
2,536 34.2
JSS/JHS 3,561 16.5
1,963 17.2
,1598 15.8
5,120 32.2
2,477 29.2
2,643 35.6
Middle 0 0.0
0 0.0
0 0.0
2,860 18.0
1,777 21.0
1,083 14.6
SSS/SHS 1,387 6.4
847 7.4
540 5.3
1,337 8.4
824 9.7
513 6.9
Secondary 0 0.0
0 0.0
0 0.0
414 2.6
296 3.5
118 1.6
Vocational/Technical/
Commercial 92 0.4
59 0.5
33 0.3
423 2.7
265 3.1
158 2.1
Post middle/secondary
certificate 55 0.3
27 0.2
28 0.3
269 1.7
155 1.8
114 1.5
Tertiary 271 1.3 192 1.7 79 0.8 798 5.0 540 6.4 258 3.5
Source: Ghana Statistical Service, 2010 Population and Housing Census

34
CHAPTER FOUR
ECONOMIC CHARACTERISTICS
4.1 Introduction
The economic characteristics of any population are important for development planning and
other purposes. The overall development of a country is based on the production of goods and
services. Critical to the production process is the human resource of the country. Although all
persons irrespective of age and sex consume these goods and services, only the section of the
total population in employment produces these goods and services.
The economic characteristics of a population also help in examining population and
development interrelationship so that appropriate policies can be adopted. Population and
development interrelationship has been a major area of research and policy concern in
developing countries, including Ghana. Rapid population increase compound with economic
stagnation and associated unemployment problems
It is against this background that the economic characteristics of the population of the Ada
West District are examined in this chapter. The areas of focus include economic activity
status, employment status and employment sector of the total population in the district. All of
the characteristics are examined with respect to age, sex and residential status which are
background characteristics that determine the economic activity and employment status of
individuals and population subgroups.
4.2 Economic Activity Status
Table 4.1 shows that 73.0 percent of the population aged 15 years and over in Ada West is
economically active and 27.0 percent is economically not active. Of those economically
active, 95.8 percent of them are employed and 4.2 percent unemployed.
A higher proportion of females (73.9%) is economically active than males (71.8%); however
96.1 percent of the economically active males are employed while 95.6 percent of males are
employed. The economically not active males are 28.2 percent of the population and that of
the female is 26.1 percent.

35
Table 4.1: Population 15 years and older by activity status and sex
Activity status
Total Male Female
Number Percent Number Percent Number Percent
Total 33,826 100.0
15,711 100.0
18,115 100.0
Economically active 24,679 73.0
11,287 71.8
13,392 73.9
Employed 23,654 95.8
10,852 96.1
12,802 95.6
Worked 22,233 94
10,256 94.5
11,977 93.6
Did not work but had job to go
back to 1,370 5.8
569 5.2
801 6.3
Did voluntary work without pay 51 0.2
27 0.2
24 0.2
Unemployed 1,025 4.2
435 3.9
590 4.4
Worked before, seeking work
and available 529 51.6
187 43.0
342 58.0
Seeking work for the first time
and available 496 48.4
248 57
248 42.0
Economically not active 9,147 27.0
4,424 28.2
4,723 26.1
Did home duties (household
chore) 1,392 15.2
315 7.1
1,077 22.8
Full time education 5,375 58.8
3,219 72.8
2,156 45.6
Pensioner/Retired 150 1.6
100 2.3
50 1.1
Disabled/Sick 580 6.3
228 5.2
352 7.5
Too old/young 1,141 12.5
342 7.7
799 16.9
Other 509 5.6 220 5.0 289 6.1
Source: Ghana Statistical Service, 2010 Population and Housing Census
Table 4.2 shows that the age group that contributes the greatest to employment is the 45-49
age group (93.8%) with much lower proportions found in very early and late ages, 15-19
(30.9%) and 65 + (54.8%). The 20-24 age groups have the highest proportion of
unemployment (5.3%) while 60+ has the lowest of 0.5 percent. The trend of the economically
not active is the reverse of the employed with the figures being highest for the early and late
ages, 15-19 (66.6%), 60+ (44.7%), and lowest proportion 4.7% recorded for 45-49 age group
About seventy percent (69.1%) of the male population aged 15 years and older is employed
with the 45-49 age group constituting the highest proportion (96.3%) of the employed. Again,
2.8 percent of the male population is unemployed and 28.2 percent economically not active.
The female population aged 15 years and older has 70.7 percent being employed. The 45-49
age groups constitute the highest proportion (91.8%) of the female population while the 15-
19 age groups report the lowest proportion of 33.0 percent. In addition, 3.3 percent of the
females are unemployed while 26.1 are economically not active (Table 4.2)

36
Table 4.2: Economic activity status of population 15 years and older by sex and age
Age group
All Status Employed Unemployed Economically not
active
Number Percent Number Percent Number Percent Number Percent
Both Sexes
Total 33,826 100.0
23,654 69.9
1,025 3.0
9,147 27.0
15-19 6,717 100.0
2,078 30.9
167 2.5
4,472 66.6
20-24 5,276 100.0
3,244 61.5
277 5.3
1,755 33.3
25-29 4,391 100.0
3,611 82.2
211 4.8
569 13.0
30-34 3,533 100.0
3,174 89.8
114 3.2
245 6.9
35-39 2,937 100.0
2,691 91.6
79 2.7
167 5.7
40-44 2,411 100.0
2,218 92.0
49 2.0
144 6.0
45-49 1,906 100.0
1,788 93.8
29 1.5
89 4.7
50-54 1,642 100.0
1,478 90.0
29 1.8
135 8.2
55-59 1,098 100.0
959 87.3
20 1.8
119 10.8
60-64 1,105 100.0
874 79.1
36 3.3
195 17.6
65+ 2,810 100.0
1,539 54.8
14 0.5
1,257 44.7
Male
Total 15,711 100.0
10,852 69.1
435 2.8
4,424 28.2
15-19 3,507 100.0
1,020 29.1
76 2.2
2,411 68.7
20-24 2,536 100.0
1,431 56.4
122 4.8
983 38.8
25-29 2,008 100.0
1,645 81.9
92 4.6
271 13.5
30-34 1,639 100.0
1,517 92.6
40 2.4
82 5.0
35-39 1,322 100.0
1,250 94.6
23 1.7
49 3.7
40-44 1,083 100.0
1,006 92.9
26 2.4
51 4.7
45-49 840 100.0
809 96.3
12 1.4
19 2.3
50-54 680 100.0
628 92.4
9 1.3
43 6.3
55-59 508 100.0
460 90.6
7 1.4
41 8.1
60-64 501 100.0
412 82.2
21 4.2
68 13.6
65+ 1,087 100.0
674 62.0
7 0.6
406 37.4
Female
Total 18,115 100.0
12,802 70.7
590 3.3
4,723 26.1
15-19 3,210 100.0
1,058 33.0
91 2.8
2,061 64.2
20-24 2,740 100.0
1,813 66.2
155 5.7
772 28.2
25-29 2,383 100.0
1,966 82.5
119 5.0
298 12.5
30-34 1,894 100.0
1,657 87.5
74 3.9
163 8.6
35-39 1,615 100.0
1,441 89.2
56 3.5
118 7.3
40-44 1,328 100.0
1,212 91.3
23 1.7
93 7.0
45-49 1,066 100.0
979 91.8
17 1.6
70 6.6
50-54 962 100.0
850 88.4
20 2.1
92 9.6
55-59 590 100.0
499 84.6
13 2.2
78 13.2
60-64 604 100.0
462 76.5
15 2.5
127 21.0
65+ 1,723 100.0
865 50.2
7 0.4
851 49.4
Source: Ghana Statistical Service, 2010 Population and Housing Census
4.3 Occupation
Table 4.3 shows that skilled agriculture, forestry and fishery and Craft and related trades
employ the largest (60.7%) of the employed population with the former contributing 42.1
percent and the later 18.6 percent. Service and sales workers are the third highest
proportionally with 17.4 percent. Clerical support workers are the least proportionally with
0.7 percent.

37
The proportion of males in skilled agriculture, forestry and fishery (54.8%) is higher than the
proportion of females in the same category (31.4%). However, for the Service and Sales
workers group, the proportion of females is 26.0 percent which far exceeds that of the males
(7.3%). Clerical support workers employ the least proportion of males (0.9%) whiles
Technicians and associate professionals employ the least proportion of the females (0.4%).
Table 4.3: Employed population 15 years and older by occupation and sex
Occupation Both sexes Male Female
Number Percent Number Percent Number Percent
Total 23,654 100.0
10,852 100.0
12,802 100.0 Managers 403 1.7
175 1.6
228 1.8
Professionals 884 3.7
550 5.1
334 2.6 Technicians and associate
professionals 248 1.0
197 1.8
51 0.4 Clerical support workers 165 0.7
101 0.9
64 0.5
Service and sales workers 4,124 17.4
793 7.3
3,331 26.0 Skilled agricultural forestry
and fishery workers 9,964 42.1
5,948 54.8
4,016 31.4 Craft and related trades
workers 4,409 18.6
1,283 11.8
3,126 24.4 Plant and machine operators
and assemblers 1,966 8.3
1,270 11.7
696 5.4 Elementary occupations 1,485 6.3
532 4.9
953 7.4
Other occupations 6 0.0 3 0.0 3 0.0 Source: Ghana Statistical Service, 2010 Population and Housing Census
4.4 Industry
Table 4.4 shows that almost three quarters (72.5%) of the employed population in the district
aged 15 years and over work in the Agriculture forestry and fishing industry, Manufacturing
industry and Wholesale and retail; repair of motor vehicles and motorcycles industry with
each industry contributing 42.5 percent, 15.8 percent and 14.1 percent respectively. The
Information and communication and Financial and insurance activities industries both
employ low figures of 0.3 percent for both sexes. Other industries such as the Electricity gas
stream and air conditioning supply industry and Real estate activities industry contribute
insignificant proportions to the employed population in the district.
Although the proportions of both the male and female employed population 15 years and over
is highest in Agriculture forestry and fishing industry, the male proportion is higher (55.4%)
than the female (31.6%). The proportion of females (23.8%) who work in manufacturing is
significantly higher than their male counterparts (6.5%). There is also a larger proportion of
males (6.2%) than females (0.2%) working in Transportation and Storage. There are almost
equal proportions of males and females in Mining and Quarrying and equal proportions for
both sexes in Human Health and Social Work activities.

38
Table 4.4: Employed population 15 years and older by Industry and Sex
Industry
Both sexes
Male
Female
Number Percent Number Percent Number Percent
Total 23,654 100.0
10,852 100.0
12,802 100.0
Agriculture forestry and fishing 10,056 42.5
6,016 55.4
4,040 31.6
Mining and quarrying 1,693 7.2
789 7.3
904 7.1
Manufacturing 3,744 15.8
702 6.5
3,042 23.8
Electricity gas stream and air
conditioning supply 6 0.0
6 0.1
0 0.0
Water supply; sewerage waste
management and remediation activities 72 0.3
36 0.3
36 0.3
Construction 415 1.8
412 3.8
3 0.0
Wholesale and retail; repair of motor
vehicles and motorcycles 3,346 14.1
860 7.9
2,486 19.4
Transportation and storage 693 2.9
670 6.2
23 0.2
Accommodation and food service
activities 1,366 5.8
118 1.1
1,248 9.7
Information and communication 66 0.3
50 0.5
16 0.1
Financial and insurance activities 69 0.3
45 0.4
24 0.2
Real estate activities 9 0.0
9 0.1
0 0.0
Professional scientific and technical
activities 107 0.5
68 0.6
39 0.3
Administrative and support service
activities 117 0.5
95 0.9
22 0.2
Public administration and defence;
compulsory social security 125 0.5
95 0.9
30 0.2
Education 667 2.8
399 3.7
268 2.1
Human health and social work activities 140 0.6
64 0.6
76 0.6
Arts entertainment and recreation 97 0.4
86 0.8
11 0.1
Other service activities 718 3.0
279 2.6
439 3.4
Activities of households as employers;
undifferentiated goods - and services -
producing activities of households for
own use
137 0.6
44 0.4
93 0.7
Activities of extraterritorial
organizations and bodies 11 0.0
9 0.1
2 0.0 Source: Ghana Statistical Service, 2010 Population and Housing Census
4.5 Employment Status
Table 4.5 shows the population of persons 15 years and older by their employment status and
sex. According to Table 4.5, 60.5 percent of the employed are self-employed (without
employees) and this forms the highest proportion of the employed. Employees and
Contributing Family Workers both have equal proportions of 14.2 percent. Apprentices make
up 1.8 percent of the employment sector whiles the Domestic Employee (house help) group
are 0.5 percent of the employment sector.
The proportion that is self-employed (without employees) for the females (67.0%) exceed
that of the males (52.8%). The proportion of females who are “contributing family workers”
(16.2%) also exceeds that of males (11.8%). On the contrary, while 22.3percent of the

39
employed males are employees, while only 7.4 percent of the employed females are
employees. The proportions are generally low for both sexes in areas such as Apprentice and
Domestic Employee (House help)
Table 4.5: Employed population 15 years and older by employment status and sex
Employment Sector
Both sexes Male Female
Number Percent Number Percent Number Percent
Total 23,654 100.0
10,852 100.0
12,802 100.0
Employee 3,366 14.2
2,424 22.3
942 7.4
Self-employed without employee(s) 14,309 60.5
5,726 52.8
8,583 67.0
Self-employed with employee(s) 1,017 4.3
547 5.0
470 3.7
Casual worker 1,041 4.4
656 6.0
385 3.0
Contributing family worker 3,348 14.2
1,279 11.8
2,069 16.2
Apprentice 417 1.8
158 1.5
259 2.0
Domestic employee (House help) 123 0.5
43 0.4
80 0.6
Other 33 0.1 19 0.2 14 0.1 Source: Ghana Statistical Service, 2010 Population and Housing Census
4.6 Employment Sector
Table 4.6 provides information on employed population 15 years and older by employment
sector. The table shows that the Private Informal employs 89.6 percent of the population,
followed by the private formal sector 5.7 percent and the Public (Government sector) which
employs only 4.1 percent of the population.
The table further indicates that for the employed male population, 84.7 works in the private
informal sector but there are a higher proportion of employed females (93.7%) in the same
sector. The proportions for the Public (Government) and Private Formal are higher for males,
5.6 percent and 8.7 percent than for females, 2.9 percent and 3.1 percent respectively.
Table 4.6: Employed population 15 years and older by employment sector and sex
Employment Sector Both sexes Male Female
Number Percent Number Percent Number Percent Total 23,654 100.0
10,852 100.0
12,802 100.0
Public (Government) 981 4.1
606 5.6
375 2.9
Private Formal 1,339 5.7
939 8.7
400 3.1
Private Informal 21,190 89.6
9,190 84.7
12,000 93.7
Semi-Public/Parastatal 37 0.2
33 0.3
4 0.0
NGOs (Local and International) 93 0.4
73 0.7
20 0.2
Other International
Organizations 14 0.1
11 0.1
3 0.0
Source: Ghana Statistical Service, 2010 Population and Housing Census

40
CHAPTER FIVE
INFORMATION COMMUNICATION TECHNOLOGY
5.1 Introduction
Information Communication Technology is essential in increasing people’s knowledge and
awareness of what is taking place around them even at the global level. The world is now
linked together with advanced communication technology and access to information is
through the computer, mobile phone and internet facilities which are fast becoming essential
for living a meaningful life.
Information Communication Technologies (ICT) have become important tools in today’s
knowledge-based information society and economy. This role of ICT in an emerging
economy such as Ghana’s, has been widely recognized at various levels. The recognition is
reflected in actions such as the development and deployment of a national ICT infrastructure,
institutional and regulatory framework for managing the sector, promoting the use of ICT in
all sectors of the economy, implementing e-governance in all government institutions and the
construction of a National Data Centers as well as Regional Innovation Centers.
Information Communication Technology (ICT) development has been under discussion and
consideration at all levels of interaction and study including districts, in recent times. This is
due to the fact that information acquisition and dissemination is a global concern and needs
some attention.
This chapter provides information on the ownership, usage, and accessibility of ICT facilities
including mobile phones, desktop/laptop computers, and internet access among others.
5.2 Mobile Phone Ownership
The Table 5.1 shows the population 12 years and older in terms of mobile phone ownership,
internet facility usage, and sex. The Table shows that 44.3 percent of the population above 12
years and older own mobile phones. This is less than half of the population of the population
own mobile phones. The proportion of males who own mobile phone form 52.6 percent and
females is 37.1 percent. This shows that males are more likely to own mobile phones than
females.
5.3 Internet Facility Usage
Only 4.5 percent of the population aged 12 years and above use internet facility in the
District. The proportion of males constitutes 6.7 percent of internet facility users and females
are 2.5 percent.

41
Table 5.1: Population 12 years and older by mobile phone ownership,
internet facility usage, and sex
Population 12 years
and older
Population having
mobile phone
Population using
internet facility
Sex Number Percent Number Percent Number Percent
Total 38,259 100.0
16,967 44.3
1,708 4.5
Male 17,925 100.0
9,426 52.6
1,200 3.1
Female 20,334 100.0 7,541 37.1 508 1.3 Source: Ghana Statistical Service, 2010 Population and Housing Census
5.4 Households Ownership of Desktop/Laptop Computers
Table 5.2 depicts households in terms of ownership of desktop/laptop computers and the sex
of the household head. According to the Table, only 4.3 percent households have desktop/
laptop. Male-headed household is twice (5.5%) more likely to use desktop/laptop computers
households headed by females (2.7%).
Table 5.2: Households having desktop/laptop computers
and sex of head
Number of
households
Household having
desktop/laptop
computers Sex of
household head
Number Percent Number Percent
Total 11,642 100.0
498 4.3
Male 6,638 100.0
363 5.5
Female 5,004 100.0 135 2.7 Source: Ghana Statistical Service, 2010 Population and Housing Census
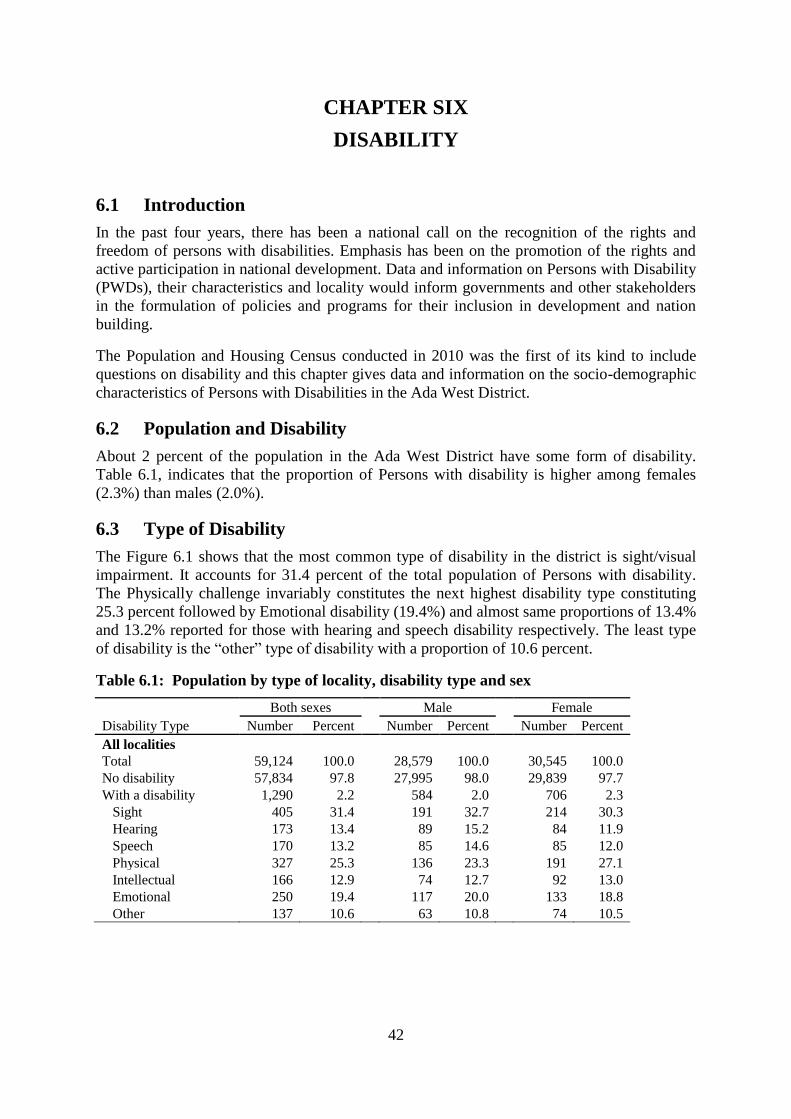
42
CHAPTER SIX
DISABILITY
6.1 Introduction
In the past four years, there has been a national call on the recognition of the rights and
freedom of persons with disabilities. Emphasis has been on the promotion of the rights and
active participation in national development. Data and information on Persons with Disability
(PWDs), their characteristics and locality would inform governments and other stakeholders
in the formulation of policies and programs for their inclusion in development and nation
building.
The Population and Housing Census conducted in 2010 was the first of its kind to include
questions on disability and this chapter gives data and information on the socio-demographic
characteristics of Persons with Disabilities in the Ada West District.
6.2 Population and Disability
About 2 percent of the population in the Ada West District have some form of disability.
Table 6.1, indicates that the proportion of Persons with disability is higher among females
(2.3%) than males (2.0%).
6.3 Type of Disability
The Figure 6.1 shows that the most common type of disability in the district is sight/visual
impairment. It accounts for 31.4 percent of the total population of Persons with disability.
The Physically challenge invariably constitutes the next highest disability type constituting
25.3 percent followed by Emotional disability (19.4%) and almost same proportions of 13.4%
and 13.2% reported for those with hearing and speech disability respectively. The least type
of disability is the “other” type of disability with a proportion of 10.6 percent.
Table 6.1: Population by type of locality, disability type and sex
Disability Type
Both sexes Male Female
Number Percent Number Percent Number Percent
All localities
Total 59,124 100.0
28,579 100.0
30,545 100.0
No disability 57,834 97.8
27,995 98.0
29,839 97.7
With a disability 1,290 2.2
584 2.0
706 2.3
Sight 405 31.4
191 32.7
214 30.3
Hearing 173 13.4
89 15.2
84 11.9
Speech 170 13.2
85 14.6
85 12.0
Physical 327 25.3
136 23.3
191 27.1
Intellectual 166 12.9
74 12.7
92 13.0
Emotional 250 19.4
117 20.0
133 18.8
Other 137 10.6
63 10.8
74 10.5
43
Table 6.1: Population by type of locality, disability type and sex (Cont’d)
Disability Type
Both sexes Male Female
Number Percent Number Percent Number Percent
Urban
Total 17,555 100.0
8,388 100.0
9,167 100.0
No disability 17,186 97.9
8,211 97.9
8,975 97.9
With a disability 369 2.1
177 2.1
192 2.1
Sight 93 25.2
45 25.4
48 25.0
Hearing 56 15.2
30 16.9
26 13.5
Speech 53 14.4
25 14.1
28 14.6
Physical 77 20.9
37 20.9
40 20.8
Intellectual 39 10.6
13 7.3
26 13.5
Emotional 101 27.4
44 24.9
57 29.7
Other 29 7.9
17 9.6
12 6.3
Rural
Total 41,569 100.0
20,191 100.0
21,378 100.0
No disability 40,648 97.8
19,784 98.0
20,864 97.6
With a disability 921 2.2
407 2.0
514 2.4
Sight 312 33.9
146 35.9
166 32.3
Hearing 117 12.7
59 14.5
58 11.3
Speech 117 12.7
60 14.7
57 11.1
Physical 250 27.1
99 24.3
151 29.4
Intellectual 127 13.8
61 15.0
66 12.8
Emotional 149 16.2
73 17.9
76 14.8
Other 108 11.7 46 11.3 62 12.1 Source: Ghana Statistical Service, 2010 Population and Housing Census
6.4 Distribution by type of locality
There is a close proportional difference between urban and rural persons with disability
populations in the district (Table 6.1). In the urban locality, 2.1 percent of persons are with
disability, while it is 2.2 percent in the rural areas. Furthermore, 25.2 percent of the sight
disability lives in urban areas, whilst 33.9 percent live in rural areas. For the physically
challenged, 27.1 percent of PWDs live in rural communities, and 20.9 percent live in the
urban localities. There is a disparity in the disability type and type of locality for all the
disability types in the district.
6.5 Disability and Activity
Table 6.2 depicts the economic activity status of Persons with disability aged 15 years and
older. In the Ada West District, Persons with disability who are employed constitute 46.4
percent, 2.9 percent are unemployed, and 50.7 percent of them are economically not active.
Persons with emotional problems form 55.7 percent of the persons with disability who are
employed, 3.4 percent are unemployed, and 40.9 percent economically not active. This is
followed by sight/visual impairment with a proportions in the labor force (48 4%), the
unemployed (2.5%) and the economically not active (49.0%). The intellectual disorders in the
labor force invariably form 22.6 percent, with unemployment 3.0 percent, and economically
not active 74.4 percent.
In addition, the proportion of employed males who have disability (46.7%) is just a little
higher than that of the females (46.2%). The proportion of unemployed females who are
disabled (2.7%) is lower than that of males (3.2%); and for persons with disability in the

44
economically not active class, the proportion with disability is 37.7 percent for females, and
45.6 percent for males.
Table 6.2: Persons 15 years and older with disability by economic activity
status and sex
Both
Sexes/Disability
type
All Status Employed Unemployed
Economically Not
Active
Number Percent Number Percent Number Percent Number Percent
Both Sexes
Total 33,826 100.0
23,654 69.9
1,025 3.0
9,147 27.0
No disability 32,757 100.0
23,158 70.7
994 3.0
8,605 26.3
With a disability 1,069 100.0
496 46.4
31 2.9
542 50.7
Sight 353 100.0
171 48.4
9 2.5
173 49.0
Hearing 145 100.0
64 44.1
6 4.1
75 51.7
Speech 114 100.0
47 41.2
2 1.8
65 57.0
Physical 291 100.0
84 28.9
7 2.4
200 68.7
Intellectual 133 100.0
30 22.6
4 3.0
99 74.4
Emotional 203 100.0
113 55.7
7 3.4
83 40.9
Other 115 100.0
42 36.5
9 7.8
64 55.7
Male
Total 15,711 100.0
10,852 69.1
435 2.8
4,424 28.2
No disability 15,242 100.0
10,633 69.8
420 2.8
4,189 27.5
With a disability 469 100.0
219 46.7
15 3.2
235 50.1
Sight 169 100.0
87 51.5
5 3.0
77 45.6
Hearing 71 100.0
33 46.5
2 2.8
36 50.7
Speech 53 100.0
19 35.8
0 0.0
34 64.2
Physical 119 100.0
35 29.4
3 2.5
81 68.1
Intellectual 54 100.0
11 20.4
3 5.6
40 74.1
Emotional 89 100.0
43 48.3
6 6.7
40 44.9
Other 49 100.0
14 28.6
4 8.2
31 63.3
Female
Total 18,115 100.0
12,802 70.7
590 3.3
4,723 26.1
No disability 17,515 100.0
12,525 71.5
574 3.3
4,416 25.2
With a disability 600 100.0
277 46.2
16 2.7
307 51.2
Sight 184 100.0
84 45.7
4 2.2
96 52.2
Hearing 74 100.0
31 41.9
4 5.4
39 52.7
Speech 61 100.0
28 45.9
2 3.3
31 50.8
Physical 172 100.0
49 28.5
4 2.3
119 69.2
Intellectual 79 100.0
19 24.1
1 1.3
59 74.7
Emotional 114 100.0
70 61.4
1 0.9
43 37.7
Other 66 100.0 28 42.4 5 7.6 33 50.0 Source: Ghana Statistical Service, 2010 Population and Housing Census

45
6.6 Disability, Education and Literacy
This section takes a look at the educational level of the population 3 years and older in terms
of disability status, disability type, if any, and sex. The educational level attained is
comparatively low for people with disability. About 30 percent of the population with
disability have no education and slightly more than half (51.1%) have up to only basic
education. Those with secondary or higher education constitute only 9.4 percent.
The proportion of females with disability who have never attended school (36.7%) is 14.1
percent higher than males (22.6%) with disability. On the other hand, a higher proportion of
males have attained basic education (54.8%) compared with their females counterparts
(47.7%). Again, males with disability are more likely to attain secondary or higher education
(12.5%) than females (6.6%).
Table 6.3: Population 3 years and older by sex, disability type and level of education
Sex/Disability
type
Number
Percent
Total Never
Pre-
Prim Basic
Sec/SHS
and higher Total Never
Pre-
Prim Basic
Sec/SHS
and higher
Both Sexes
Total 53,459 15,999 5,112 27,302 5,046
100.0 29.9 9.6 51.1 9.4
No disability 52,197 15,351 5,080 26,821 4,945
100.0 29.4 9.7 51.4 9.5
With a disability 1,262 648 32 481 101
100.0 51.3 2.5 38.1 8.0
Sight 395 219 11 123 42
100.0 55.4 2.8 31.1 10.6
Hearing 172 98 3 64 7
100.0 57.0 1.7 37.2 4.1
Speech 162 103 3 51 5
100.0 63.6 1.9 31.5 3.1
Physical 321 182 3 114 22
100.0 56.7 0.9 35.5 6.9
Intellectual 163 98 2 54 9
100.0 60.1 1.2 33.1 5.5
Emotional 244 91 8 129 16
100.0 37.3 3.3 52.9 6.6
Other 135 65 8 48 14
100.0 48.1 5.9 35.6 10.4
Male
Total 25,734 5,812 2,626 14,091 3,205
100.0 22.6 10.2 54.8 12.5
No disability 25,163 5,602 2,610 13,808 3,143
100.0 22.3 10.4 54.9 12.5
With a disability 571 210 16 283 62
100.0 36.8 2.8 49.6 10.9
Sight 184 79 2 79 24
100.0 42.9 1.1 42.9 13.0
Hearing 89 39 2 44 4
100.0 43.8 2.2 49.4 4.5
Speech 82 44 3 32 3
100.0 53.7 3.7 39.0 3.7
Physical 133 49 2 64 18
100.0 36.8 1.5 48.1 13.5
Intellectual 72 30 2 33 7
100.0 41.7 2.8 45.8 9.7
Emotional 114 34 4 63 13
100.0 29.8 3.5 55.3 11.4
Other 62 21 7 28 6
100.0 33.9 11.3 45.2 9.7
Female
Total 27,725 10,187 2,486 13,211 1,841
100.0 36.7 9.0 47.7 6.6
No disability 27,034 9,749 2,470 13,013 1,802
100.0 36.1 9.1 48.1 6.7
With a disability 691 438 16 198 39
100.0 63.4 2.3 28.7 5.6
Sight 211 140 9 44 18
100.0 66.4 4.3 20.9 8.5
Hearing 83 59 1 20 3
100.0 71.1 1.2 24.1 3.6
Speech 80 59 0 19 2
100.0 73.8 0.0 23.8 2.5
Physical 188 133 1 50 4
100.0 70.7 0.5 26.6 2.1
Intellectual 91 68 0 21 2
100.0 74.7 0.0 23.1 2.2
Emotional 130 57 4 66 3
100.0 43.8 3.1 50.8 2.3
Other 73 44 1 20 8 100.0 60.3 1.4 27.4 11.0
Source: Ghana Statistical Service, 2010 Population and Housing Census

46
CHAPTER SEVEN
AGRICULTURE ACTIVITIES
7.1 Introduction
The major economic activity in the district is agriculture-57.5 percent (6,689) of households
in the district are engaged in Agriculture. Table 7.1 shows that 77.1 percent of the households
engaged in Agriculture are from the rural areas, and the remaining 22.9 percent are from the
urban locality. The district is agrarian; therefore the need to provide information on the
various agricultural activities and the characteristics of persons engaged in it. This chapter
provides information on the various agricultural activities including crop farming, tree
growing, livestock rearing and fish farming.
7.2 Households in Agriculture
Table 7.1 provides Information on households engaged in agricultural activities and their
locality type. Agriculture activities have been grouped into four (4) categories - Crop
farming, Tree planting, Livestock Rearing and Fish farming. About 48 percent of the
households engaged in agriculture are into crop farming, and 36.5 percent are into livestock
rearing. This means that crop farming is the dominant agricultural activity in the district, with
a higher proportion in the rural areas (57.4%) than in urban areas (26.6%). Households
engaged in livestock farming is 36.5 percent.
Table 7.1: Households by agricultural activities and locality
Total Urban Rural
Agricultural activities Number Percent Number Percent Number Percent
Total Households 11,642 100.0
3,522 100.0
8,120 100.0 Households engages in Agriculture 6,689 57.5
1,529 43.4
5,160 63.5
Crop Farming 5,598 48.1
936 26.6
4,662 57.4
Tree Farming 15 0.1
2 0.1
13 0.2
Livestock Rearing 4,245 36.5
1,085 30.8
3,160 38.9
Fish Farming 4 0.0 1 0.0 3 0.0 Source: Ghana Statistical Service, 2010 Population and Housing Census
7.3 Types of Farming
The Table 7.2 gives the distribution of livestock and keepers in the district. The highest
proportion of livestock is chicken (40.8%). This is followed by goat with 20.7 percent then
cattle (13.9%) and guinea fowl (8.3%) whiles sheep constitute 6.2 percent, of livestock
animals, pig’s forms 4.9 percent of livestock animals.
The Table also shows that 38.2 percent of the keepers are keepers of chicken, 32.9 percent for
goat, 6.3 percent and 6.0 percent for sheep and cattle respectively, and also 5.6 percent, 5.2
percent for pig and guinea fowl respectively. The average animal per keeper is 16 for
chicken, an indication that chicken keeping is widely distributed in the district. That of snail
is 400 animals per keeper, cattle is 34, and marine fish 50 per keeper.

47
Table 7.2: Distribution of livestock and keepers
All Livestock
Animals Keepers Average
Animal per
Keeper Number Percent Number Percent Total 103,161 100.0
7,096 100.0 15
Beehives 136 0.1
5 0.1 27 Cattle 14,294 13.9
424 6.0 34
Chicken 42,047 40.8
2,710 38.2 16 Dove 452 0.4
15 0.2 30
Duck 2,616 2.5
203 2.9 13 Goat 21,402 20.7
2,333 32.9 9
Grass-cutter 34 0.0
3 0.0 11 Guinea fowl 8,526 8.3
368 5.2 23
Ostrich 83 0.1
8 0.1 10 Pig 5,020 4.9
396 5.6 13
Rabbit 131 0.1
21 0.3 6 Sheep 6,354 6.2
446 6.3 14
Silk worm 119 0.1
8 0.1 15 Snail 400 0.4
1 0.0 400
Turkey 710 0.7
79 1.1 9 Other 717 0.7
72 1.0 10
Fish farming 60 0.1
2 0.0 30 Inland fishing 10 0.0
1 0.0 10
Marine fishing 50 0.0 1 0.0 50 Source: Ghana Statistical Service, 2010 Population and Housing Census

48
CHAPTER EIGHT
HOUSING CONDITIONS
8.1 Introduction
Population increase has been rapid while economic growth has been slow or stagnant in many
developing countries especially in Africa. This has led to deficits in the supply of facilities
such as housing. The situation is not that different in the Ada West District just as in any
other district in Ghana and for that matter West Africa. The 2010 Ghana Population and
Housing Census is the second national census, following the 2000 census, which included a
comprehensive housing census. The two censuses provided an official count of all structures
(permanent and temporary) within the nation. Among the issues covered were the number of
occupied and unoccupied dwelling units, the type of dwelling and the main materials used in
house construction, occupancy status, and method of waste disposal, utilities and household
facilities. It is envisaged that the housing data from the 2010 PHC will enable planners and
policy makers formulate realistic and relevant housing policies and design appropriate
programmes to meet Ghana’s housing needs.
Data collected on housing assists in understanding key aspects of housing and housing
conditions. It assists planners make evidence-informed decisions on housing policies and
interventions. The information from housing censuses also serves as a basis for planning
housing and human settlement program and policies, evaluation and monitoring of housing
conditions and needs of the population within the context of the Millennium Development
Goal Seven (MDG7). This chapter provides an insight into housing and housing conditions in
Ada West District in the Greater Accra Region of Ghana. The data covers housing stock and
types of houses, ownership, household room occupancy and housing conditions with
particular reference to water and sanitation as well as information on cooking space and
household energy sources.
8.2 Housing Stock
Table 8.1 provides information on stock of houses and households by type of locality. The
total population of the district is 59,124 and it constitutes 1.5 percent of the total population
of Greater Accra Region. 29.7 percent are in the urban locality, and 70.3 percent are living in
the rural locality. The total household population of the District is 57,746 and forms 1.5
percent of that of Greater Accra Region (3,888,512).
The number of households in the district is 11,642 and constituting 1.1 percent of total
households in Greater Accra Region (1,036,370) and 0.2 percent of the total households in
Ghana (5,467,054). The average household per house in the district is 1.7 and it is above that
of the Country (1.6) and below that of the Region (2.2). However the urban average
household per house (2.1) almost equates that of the region (2.2).
The average household size of the district is 5.1 and is above that of the Region which is (3.9)
and that of the entire country of (4.5). The average household size in the rural locality of (5.1)
which is the same as the figure for the district (5.1) which is higher than that of the urban
locality (5.0).
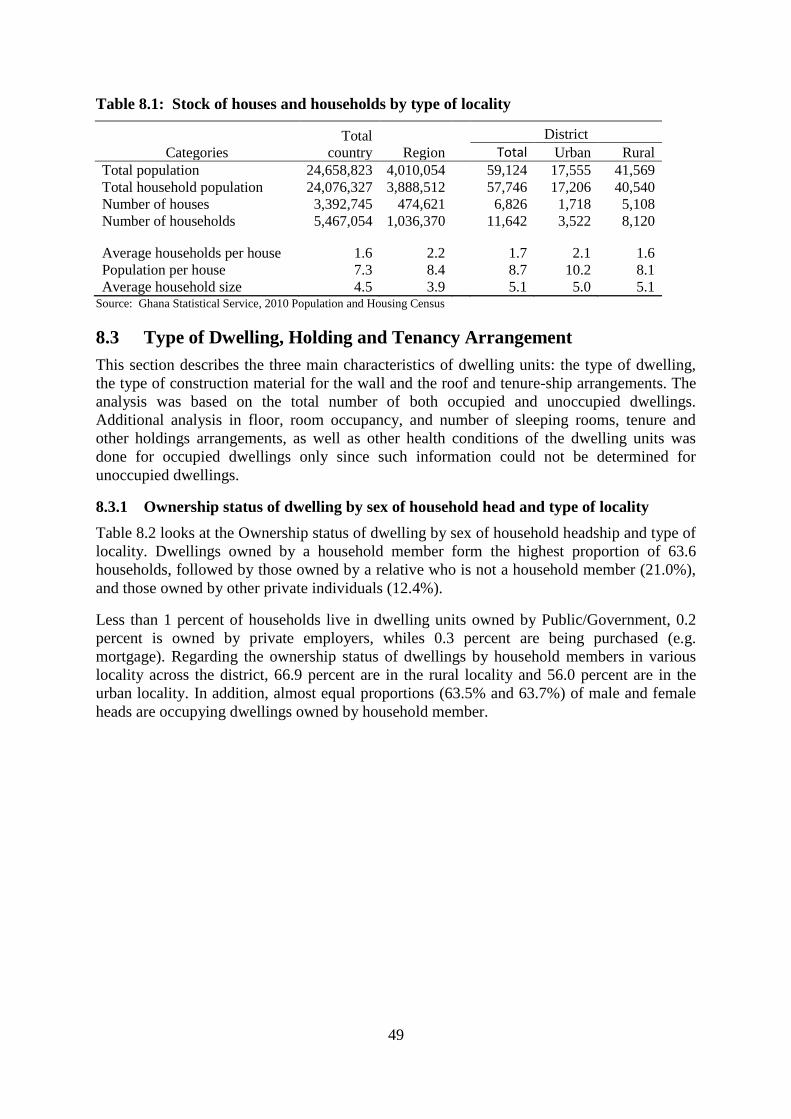
49
Table 8.1: Stock of houses and households by type of locality
Categories Total
country Region
District Total Urban Rural
Total population 24,658,823 4,010,054
59,124 17,555 41,569
Total household population 24,076,327 3,888,512
57,746 17,206 40,540
Number of houses 3,392,745 474,621
6,826 1,718 5,108
Number of households 5,467,054 1,036,370
11,642 3,522 8,120
Average households per house 1.6 2.2
1.7 2.1 1.6
Population per house 7.3 8.4
8.7 10.2 8.1
Average household size 4.5 3.9 5.1 5.0 5.1 Source: Ghana Statistical Service, 2010 Population and Housing Census
8.3 Type of Dwelling, Holding and Tenancy Arrangement
This section describes the three main characteristics of dwelling units: the type of dwelling,
the type of construction material for the wall and the roof and tenure-ship arrangements. The
analysis was based on the total number of both occupied and unoccupied dwellings.
Additional analysis in floor, room occupancy, and number of sleeping rooms, tenure and
other holdings arrangements, as well as other health conditions of the dwelling units was
done for occupied dwellings only since such information could not be determined for
unoccupied dwellings.
8.3.1 Ownership status of dwelling by sex of household head and type of locality
Table 8.2 looks at the Ownership status of dwelling by sex of household headship and type of
locality. Dwellings owned by a household member form the highest proportion of 63.6
households, followed by those owned by a relative who is not a household member (21.0%),
and those owned by other private individuals (12.4%).
Less than 1 percent of households live in dwelling units owned by Public/Government, 0.2
percent is owned by private employers, whiles 0.3 percent are being purchased (e.g.
mortgage). Regarding the ownership status of dwellings by household members in various
locality across the district, 66.9 percent are in the rural locality and 56.0 percent are in the
urban locality. In addition, almost equal proportions (63.5% and 63.7%) of male and female
heads are occupying dwellings owned by household member.

50
Table 8.2: Ownership status of dwelling by sex of household head and type of locality
Total Male headed Female headed Urban Rural
Number Percent Number Percent Number Percent Number Percent Number Percent
Total 11,642 100.0
6,638 100.0
5,004 100.0
3,522 100.0
8,120 100.0
Owned by household member 7,403 63.6
4,213 63.5
3,190 63.7
1,972 56.0
5,431 66.9
Being purchased (e.g. mortgage) 31 0.3
17 0.3
14 0.3
2 0.1
29 0.4
Relative not a household member 2,448 21.0
1,217 18.3
1,231 24.6
725 20.6
1,723 21.2
Other private individual 1,446 12.4
961 14.5
485 9.7
749 21.3
697 8.6
Private employer 114 1.0
91 1.4
23 0.5
10 0.3
104 1.3
Other private agency 27 0.2
18 0.3
9 0.2
10 0.3
17 0.2
Public/Government ownership 88 0.8
61 0.9
27 0.5
26 0.7
62 0.8
Other 85 0.7 60 0.9 25 0.5 28 0.8 57 0.7 Source: Ghana Statistical Service, 2010 Population and Housing Census

51
8.3.2 Type of occupied dwelling unit by sex of household head and type of locality.
Table 8.3 provides the type of occupied dwelling unit by sex of household head and type of
locality. The commonest type of dwelling unit is Compound House (rooms) which constitutes
62.4 percent, followed by the Separate house unit (25.0%) and Semi-detach house unit
(4.3%). The other dwelling types form less than 1 percent (0.1%) of all dwelling unit types.
The proportion of separate houses in rural localities (27.9%) is more than those in urban areas
(18.5%). This may be attributed to the availability of land and comparatively cheaper
building materials in rural areas.
The Compound Houses account for 70.8 percent of dwelling unit types in the urban locality
and 58.8 percent in the rural areas. This means that about 7 out of every 10 households in the
urban locality live in compound houses.
The proportion of female heads of households in compound house (64.3%) is more than that
of males (61.0%). Besides, the proportion of male heads of households in separate houses of
(26.4%) is more than that of females (23.3%). This seems to suggest that higher proportion of
households headed by males are more likely to live in separate houses than female-headed
households.
Table 8.3: Type of occupied dwelling unit by sex of household head and type of locality
Type of dwelling
Total
country Region
District
Total Male
headed
Female
headed Urban Rural Number Percent
Total 5,467,054 1,036,370 11,642 100.0 100.0 100.0 100.0 100.0
Separate house 1,471,391 176,647 2,915 25.0 26.4 23.3 18.5 27.9
Semi-detached house 391,548 84,233 500 4.3 4.0 4.7 2.5 5.1
Flat/Apartment 256,355 66,202 277 2.4 2.8 1.8 1.1 2.9
Compound house (rooms) 2,942,147 595,062 7,268 62.4 61.0 64.3 70.8 58.8
Huts/Buildings (same compound) 170,957 11,268 456 3.9 3.7 4.2 4.9 3.5
Huts/Buildings (different
compound) 36,410 2,154 50 0.4 0.5 0.4 0.3 0.5
Tent 10,343 2,284 7 0.1 0.1 0.0 0.1 0.1
Improvised home (kiosk/container
etc.) 90,934 59,977 65 0.6 0.7 0.4 0.9 0.4
Living quarters attached to
office/shop 20,499 7,928 44 0.4 0.4 0.3 0.3 0.4
Uncompleted building 66,624 27,284 44 0.4 0.3 0.4 0.3 0.4
Other 9,846 3,331 16 0.1 0.1 0.1 0.3 0.1
Source: Ghana Statistical Service, 2010 Population and Housing Census
8.4 Construction Materials
8.4.1 Main construction material for outer wall of dwelling unit by type of locality
The construction/building material for outer wall of dwelling unit by type of locality is shown
in Table 8.4. For the purpose of this analysis, material for outer wall refers to the material
used for putting up the dwelling unit. According to the Table, the main construction material
for outer wall in the district is the cement blocks/concrete (68.6%), followed by mud
brick/earth (27.7%). The Wooden outer walls constitute 1.6 percent of walls in the district.
The Land Crete forms (0.8%). Palm leaf/thatch (grass)/raffia invariably constitute (0.5%); the
Metal Sheet/Slate/Asbestos is 0.3 percent, and Bamboo (0.1%) is rarely used for the
building/construction of outer walls.

52
The proportion of urban dwelling units with Mud Brick/Earth outer wall is 11.8 percent; far
below the rural percentage of 34.0 percent. The Cement blocks/Concrete constitutes 84.4
percent of outer walls of dwelling units in the urban locality, where nearly all dwelling units
have concrete block/concrete outer walls compared to that of the rural (61.9%).
Table 8.4: Main construction material for outer wall of dwelling unit by type of locality
District
Total
country Region Total
Material for Outer wall Number Percent Urban Rural
Total 5,817,607 1,090,397
12,216 100.0
100.0 100.0
Mud brick/Earth 1,991,540 39,198
3,382 27.7
11.8 34.4
Wood 200,594 110,736
192 1.6
1.7 1.5
Metal sheet/Slate/Asbestos 43,708 14,038
35 0.3
0.3 0.3
Stone 11,330 2,692
26 0.2
0.1 0.3
Burnt bricks 38,237 3,981
17 0.1
0.2 0.1
Cement blocks/Concrete 3,342,462 896,518
8,378 68.6
84.4 61.9
Land Crete 104,270 3,810
98 0.8
0.4 1.0
Bamboo 8,206 1,380
11 0.1
0.1 0.1
Palm leaf/Thatch (grass)/Raffia 38,054 1,806
58 0.5
0.9 0.3
Other 39,206 16,238 19 0.2 0.1 0.2 Source: Ghana Statistical Service, 2010 Population and Housing Census
8.4.2 Main material for the floor of dwelling unit by type of locality
The table 8.5 depicts the main material for the floor of dwelling unit by type of locality. The
type of material used for the floor has implications for health since contamination and ease of
disinfection varies with the type of material used for the floor. According to the Table, the
main material used for floors is Cement/Concrete (87.7%); and the Earth/Mud floors follow
with 10.3 percent of dwelling units in the District.
The Cement/Concrete is mostly used for floors in both urban and rural localities, but the
proportion of the urban (92.9%) is higher than that of the rural (85.4%). Meanwhile the
proportion of floors made with Earth/Mud in the rural areas 12.3 percent is higher than the
urban areas (5.7%). Moreover, apart from Cement/Concrete and Earth/Mud, other
construction materials for the floors constitute very low proportions.
Table 8.5: Main construction materials for the floor of dwelling unit by type of locality
Materials for the floor
Total
country Region
District
Total
Number Percent Urban Rural
Total 5,467,054 1,036,370
11,642 100.0
100.0 100.0
Earth/Mud 872,161 53,990
1,201 10.3
5.7 12.3
Cement/Concrete 4,255,611 830,972
10,208 87.7
92.9 85.4
Stone 32,817 4,928
26 0.2
0.2 0.2
Burnt brick 6,537 1,996
8 0.1
0.0 0.1
Wood 52,856 38,877
32 0.3
0.3 0.3
Vinyl tiles 57,032 27,454
59 0.5
0.2 0.6
Ceramic/Porcelain/Granite/
Marble tiles 88,500 39,618
68 0.6
0.5 0.6
Terrazzo/Terrazzo tiles 85,973 34,697
33 0.3
0.1 0.4
Other 15,567 3,838 7 0.1 0.1 0.1 Source: Ghana Statistical Service, 2010 Population and Housing Census

53
8.4.3 Main construction material for roofing of dwelling unit by type of locality
The most common material for roofing of dwelling units is the Slate/Asbestos (52.6%),
followed by the metal sheets with 25.0 percent. The Thatch/Palm leaf or Raffia, and
Cement/Concrete constitute 19.4 percent and 1.7 percent respectively. Meanwhile the
Mud/Mud bricks/Earth, Wood, Bamboo and Roofing tile, each constitute less than 1 percent
of materials used for roofing dwelling units in the district.
The use of slate/asbestos accounts for 71.6 percent of roofing material in the urban locality
compared to 44.2 percent in the rural areas. Besides, the use of metal sheets invariably
constitutes 15.7 percent in the urban areas is lower than the 28.9 percent of dwelling units
that are roofed using metal sheets in rural areas. The use of Thatch/Palm leaf or Raffia
constitutes 23.4 percent in the rural locality higher than the 10.0 percent reported in urban
areas.
Table 8.6: Main construction material for roofing of dwelling unit by type of locality
Main Roofing material
Total
country Region
District
Total
Urban Rural Number Percent
Total 5,817,607 1,090,397 12,216 100.0 100.0 100.0
Mud/Mud bricks/Earth 80,644 3,162 61 0.5 0.2 0.6
Wood 45,547 8,895 27 0.2 0.1 0.3
Metal sheet 4,152,259 537,503 3,054 25.0 15.7 28.9
Slate/Asbestos 759,039 454,300 6,430 52.6 71.6 44.6
Cement/Concrete 141,072 41,671 210 1.7 1.9 1.6
Roofing tile 31,456 18,041 23 0.2 0.1 0.2
Bamboo 71,049 2,284 16 0.1 0.2 0.1
Thatch/Palm leaf or Raffia 500,606 16,797 2,367 19.4 10.0 23.4
Other 35,935 7,744 28 0.2 0.2 0.3 Source: Ghana Statistical Service, 2010 Population and Housing Census
8.5 Room Occupancy
The number of rooms households occupy is one of the good indicators for assessing how
crowded dwelling units in a locality are and the space available per person. The size of
households in a dwelling unit in terms of the sleeping rooms available to them can have
health implications. The more crowded the room, the greater the chances of the rapid spread
of infections and the likelihood of sleep disturbances.
Table 8.7 depicts the households by size and number of sleeping rooms occupied in a
dwelling unit. The Table shows that slightly more than two fifths (43.6%) of households use
single rooms. Those with household size 1 have the highest proportion (85.9%) having access
to one sleeping room. The greatest proportions of households with sizes ranging from 1 to 7
have access to one sleeping room. This gives a picture of overcrowding where for instance
20.6 percent of households with a size of 7 in a dwelling unit have access to only one
sleeping room.
The highest proportion of household sizes ranging from 8 to 10+ has access to two sleeping
rooms. Household size 10+ has comparatively the highest proportion accessing three rooms
to nine rooms or more.
On the whole, for most dwelling units, irrespective of the size of households, the access to
sleeping room is either one or two rooms.

54
Table 8.7: Household size and number of sleeping rooms occupied in dwelling unit
Total Number of sleeping rooms
House-
hold
size Number Percent
One
room
Two
rooms
Three
rooms
Four
rooms
Five
rooms
Six
rooms
Seven
rooms
Eight
rooms
Nine
rooms
or more
Total 11,642 100.0
43.6 31.1 12.8 6.4 2.6 1.7 0.8 0.5 0.6
1 1,783 100.0
85.9 11.3 1.1 0.8 0.6 0.2 0.1 0.0 0.1
2 1,342 100.0
65.1 29.3 4.4 0.9 0.1 0.2 0.0 0.0 0.1
3 1,422 100.0
55.6 35.4 6.6 1.5 0.5 0.2 0.1 0.1 0.1
4 1,415 100.0
47.3 37.2 10.2 4.2 0.6 0.1 0.1 0.1 0.1
5 1,380 100.0
37.2 39.3 14.5 6.1 2.0 0.3 0.4 0.1 0.1
6 1,154 100.0
28.5 42.3 16.1 8.2 2.3 1.3 0.8 0.3 0.2
7 894 100.0
20.6 38.3 24.0 10.7 3.2 2.3 0.3 0.1 0.3
8 685 100.0
12.8 38.4 27.3 10.8 3.5 4.2 1.5 0.7 0.7
9 489 100.0
10.0 29.4 25.8 18.8 8.0 3.9 1.6 0.6 1.8
10+ 1,078 100.0 4.4 19.7 23.6 18.0 11.8 9.5 4.8 4.2 4.2
Source: Ghana Statistical Service, 2010 Population and Housing Census
8.6 Access to Utilities and Household Facilities
8.6.1 Main source of lighting of dwelling units
The Table 8.8 provides information on the main source of lighting of dwelling units by type
of locality. According to the table, three (3) main sources of non-natural lighting can be
identified: Electricity (mains), Kerosene lamp, and Flashlight/Torch.
The highest proportion of dwelling units (66.0%) in the district uses electricity (mains) as the
main source of lighting. Dwelling units that use electricity from private generator is less than
1 percent (0.9%). Kerosene is the next commonly use as source lighting with (27.2%) after
electricity (mains). The use of the Flash light follows by 5 percent of households. The Table
8.8 again portrays that while 65.2 percent of urban dwelling units use the electricity (mains),
and 66.3 percent use it in the rural areas. The Flashlight usage constitutes 5.3 percent of
urban dwelling units whilst it is 4.9 percent in the rural areas.
Table 8.8: Main source of lighting of dwelling unit by type of locality
Main source of light
Total
country Region
District
Total
Number Percent Urban Rural
Total 5,467,054 1,036,370
11,642 100.0
100.0 100.0
Electricity (mains) 3,511,065 902,831
7,681 66.0
65.2 66.3
Electricity (private generator) 36,142 6,644
101 0.9
0.6 1.0
Kerosene lamp 971,807 61,509
3,171 27.2
27.1 27.3
Gas lamp 9,378 1,463
43 0.4
0.8 0.2
Solar energy 9,194 1,023
5 0.0
0.0 0.1
Candle 41,214 19,251
40 0.3
0.7 0.2
Flashlight/Torch 858,651 39,942
580 5.0
5.3 4.9
Firewood 13,241 1,036
7 0.1
0.1 0.0
Crop residue 4,623 443
4 0.0
0.1 0.0
Other 11,739 2,228 10 0.1 0.1 0.1 Source: Ghana Statistical Service, 2010 Population and Housing Census

55
8.6.2 Main source of cooking fuel, and cooking space used by household
Table 8.9 provides information on the main source of cooking fuel, and cooking space used
by households in the district.
The Table shows that there are three (3) main sources of cooking fuel used by households in
the district. The charcoal source constitutes the largest cooking fuel of 55.2 percent, wood
however forms 29.0 percent and Gas 8.7 percent. The Table again depicts that 6.0 percent of
households in the district do not cook using any of the main sources of cooking fuel. Even
though charcoal is the main source of cooking for both urban and rural households, the urban
proportion of 69.0 percent is higher than the rural locality percentage of (49.2%). On the
other hand, the use of wood as cooking fuel is higher in rural areas 35.5% than 14.0% in
urban areas. Significant proportion 9.1% of rural households use gas as cooking fuel
compared to 7.8% of urban households.
The percentage distribution of cooking spaces available to households, as given in Table 8.9,
explains that the most common cooking spaces available in the district, as well as the region
and the country are Separate room for exclusive use of household, open space in compound
and Verandah.
Structures with roof but without walls are also used in the district. Households that use
separate room exclusively in the district constitute 33.4 percent (About 1 out of every 3
households). Those that use open spaces constitute 25.6 percent (About 1 out of every 5),
16.2 percent uses the verandah and 8.0 percent use Separate room shared with other
household(s).
The proportion of rural households that use separate room exclusively (37.6%) is higher than
the urban proportion (23.9%). Almost equal proportions of urban and rural households 25.8%
and 25.3% use open space in compound as cooking space. The data further shows that a
higher proportion of urban households 23.0% compared to 13.2% of rural households use the
verandah as cooking space.
Table 8.9: Main source of cooking fuel, and cooking space used by households
Total
country Region
District
Source of cooking
fuel/cooking space
Total
Urban
Rural
Number Percent Number Percent Number Percent
Cooking Space
Total 5,467,054 1,036,370 11,642 100.0
3,522 100.0
8,120 100.0
None no cooking 306,118 71,797 693 6.0
286 8.1
407 5.0
Wood 2,197,083 36,560 3,379 29.0
494 14.0
2,885 35.5
Gas 996,518 429,464 1,012 8.7
273 7.8
739 9.1
Electricity 29,794 9,645 41 0.4
3 0.1
38 0.5
Kerosene 29,868 11,627 57 0.5
26 0.7
31 0.4
Charcoal 1,844,290 470,277 6,427 55.2
2,431 69.0
3,996 49.2
Crop residue 45,292 724 14 0.1
1 0.0
13 0.2
Saw dust 8,000 2,713 13 0.1
4 0.1
9 0.1
Animal waste 2,332 919 1 0.0
0 0.0
1 0.0
Other 7,759 2,644 5 0.0
4 0.1
1 0.0

56
Table 8.9: Main source of cooking fuel, and cooking space used by households (cont’d)
Total
country Region
District
Source of cooking
fuel/cooking space
Total
Urban
Rural
Number Percent Number Percent Number Percent
Cooking space
Total 5,467,054 1,036,370 11,642 100.0
3,522 100.0
8,120 100.0
No cooking space 386,883 86,433 790 6.8
319 9.1
471 5.8
Separate room for
exclusive use of
household 1,817,018 319,998 3,893 33.4
841 23.9
3,052 37.6
Separate room shared
with other household(s) 410,765 30,270 932 8.0
241 6.8
691 8.5
Enclosure without roof 117,614 17,007 237 2.0
82 2.3
155 1.9
Structure with roof but
without walls 349,832 15,465 399 3.4
167 4.7
232 2.8
Bedroom/Hall/Living
room) 74,525 27,948 455 3.9
150 4.3
305 3.8
Verandah 1,173,946 302,863 1,884 16.2
809 23.0
1,075 13.2
Open space in
compound 1,115,464 230,843 2,982 25.6
890 25.3
2,092 25.8
Other 21,007 5,543 70 0.6 23 0.6 47 0.6
Source: Ghana Statistical Service, 2010 Population and Housing Census
8.7 Main Source of Water for Drinking and Other Domestic Use
8.7.1 Main source of water of dwelling units for drinking
Table 8.10 presents the main source of water of dwelling units for drinking and other
domestic purposes. The source of water supply particularly for drinking has tremendous
effect on the disease prevalence in a community. The main health benefit of clean water
supply is a reduction in diarrheal, although the effects on other diseases are also substantial.
Water is often classified as “improved” or “unimproved”. Sources considered as improved
are household connection to public pipe borne water supply system, public standpipe, and
borehole, protected (lined) dug well, protected spring, and rainwater collection. Unprotected
wells and springs, vendors, and tanker-trucks are considered unimproved.
According to Table, there are six (6) main sources of drinking water for dwelling units in the
District. These are Public tap/Standpipe (63.1%), Pipe borne outside the dwelling unit
(19.9%), Sachet water constitutes (7.2%), Pipe-born inside the dwelling unit (4.7%),
Dugout/Pond/Lake/Dam/Canal also form (2.2%) of the main water source, and
Borehole/Pump tube well (1.5%).
In the urban locality more dwelling units use public tap/standpipe (69.6%) compared to 60.3
percent use in the rural areas. In addition, 21.0 percent of rural dwelling units, use pipe-borne
outside dwelling than in the urban locality 17.5 percent. Besides, more dwelling units in the
urban locality use sachet water 10.5 percent compared to rural dwelling units sachet water
use of 5.7 percent. The use of Dugout/Pond/Lake/Dam/Canal is 3.1 percent in rural dwelling
units with 0.0 percent use in urban communities in the district.

57
Table 8.10: Main source of water of dwelling unit for drinking and other
domestic purposes
District
Total
country Total
Sources of water Region Number Percent Urban Rural
Main source of drinking water
Total 5,467,054 1,036,370
11,642 100.0
100.0 100.0
Pipe-borne inside dwelling 790,493 272,766
551 4.7
0.7 6.5
Pipe-borne outside dwelling 1,039,667 291,107
2,319 19.9
17.5 21.0
Public tap/Standpipe 712,375 103,356
7,351 63.1
69.6 60.3
Bore-hole/Pump/Tube well 1,267,688 15,989
178 1.5
0.3 2.1
Protected well 321,091 7,167
36 0.3
0.2 0.4
Rain water 39,438 1,833
8 0.1
0.1 0.1
Protected spring 19,345 3,513
14 0.1
0.0 0.2
Bottled water 20,261 10,952
36 0.3
0.5 0.2
Sachet water 490,283 290,342
835 7.2
10.5 5.7
Tanker supply/Vendor provided 58,400 29,843
22 0.2
0.5 0.0
Unprotected well 112,567 2,314
12 0.1
0.1 0.1
Unprotected spring 12,222 318
3 0.0
0.0 0.0
River/Stream 502,804 4,179
22 0.2
0.0 0.3
Dugout/Pond/Lake/Dam/Canal 76,448 1,677
252 2.2
0.0 3.1
Other 3,972 1,014
3 0.0
0.0 0.0
Main source of water for other domestic use
Total 5,467,054 1,036,370
11,642 100.0
100.0 100.0
Pipe-borne inside dwelling 905,566 363,174
591 5.1
0.5 7.0
Pipe-borne outside dwelling 1,089,030 384,657
2,582 22.2
18.0 24.0
Public tap/Standpipe 704,293 127,980
7,629 65.5
77.9 60.2
Bore-hole/Pump/Tube well 1,280,465 41,441
201 1.7
0.3 2.3
Protected well 465,775 24,489
119 1.0
0.2 1.4
Rain water 39,916 3,538
4 0.0
0.0 0.0
Protected spring 18,854 2,674
14 0.1
0.1 0.1
Tanker supply/Vendor provided 100,048 64,630
67 0.6
1.5 0.2
Unprotected well 152,055 5,804
100 0.9
1.3 0.7
Unprotected spring 15,738 1,586
5 0.0
0.1 0.0
River/Stream 588,590 11,331
34 0.3
0.0 0.4
Dugout/Pond/Lake/Dam/Canal 96,422 3,765
287 2.5
0.0 3.5
Other 10,302 1,301 9 0.1 0.1 0.1
Source: Ghana Statistical Service, 2010 Population and Housing Census
8.7.2 Main source of water of dwelling unit for other domestic use
According to Table 8.10, there are six (6) main sources of drinking water for dwelling units
in the District. These are Public tap/Standpipe (65.5%), Pipe borne outside the dwelling unit
(22.2%), Pipe-born inside the dwelling unit (5.1%), Dugout/Pond/Lake/Dam/Canal constitute
(2.5%), Borehole/Pump tube well (1.7%), and Protected well water constitutes (1.0%)
account for the main source of water for domestic use.
In the urban locality more dwelling units use public tap/standpipe (77.9%) compared to 60.2
percent use in the rural areas. Also, 24.0 percent of rural dwelling units use pipe-borne water
outside dwelling than in the urban locality 18.0 percent. The use of Dugout/Pond/
Lake/Dam/Canal is 3.5 percent by rural dwelling units only.
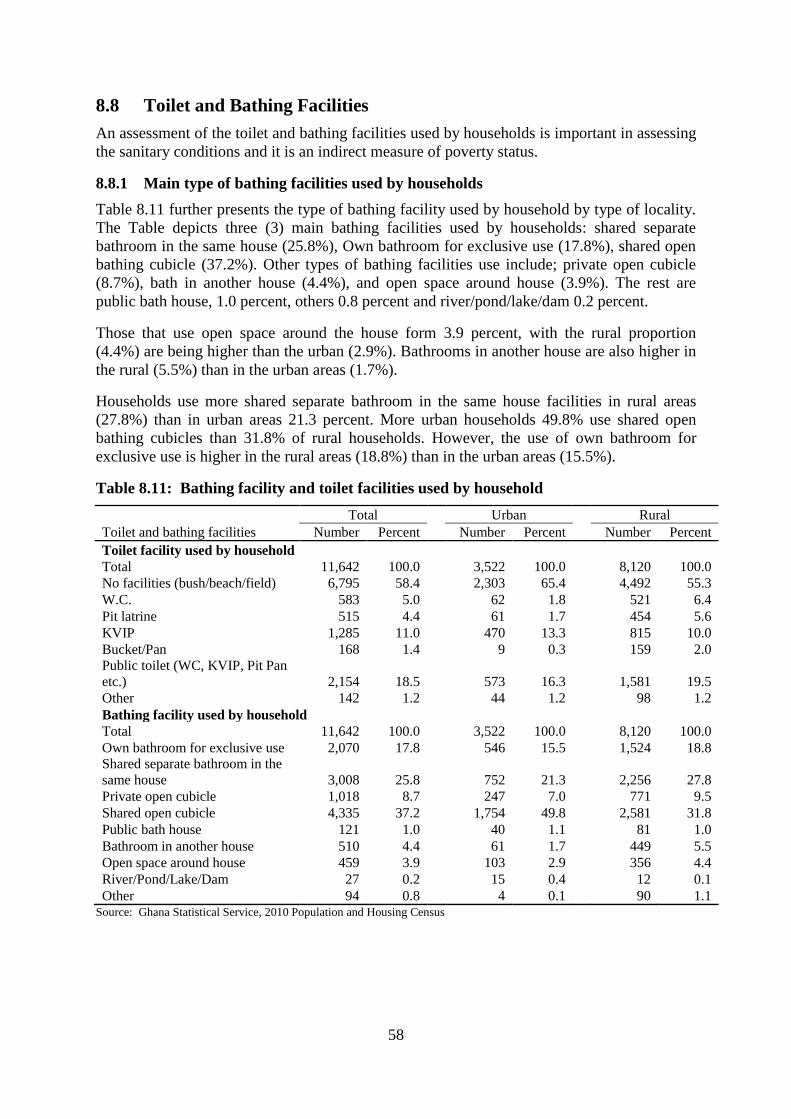
58
8.8 Toilet and Bathing Facilities
An assessment of the toilet and bathing facilities used by households is important in assessing
the sanitary conditions and it is an indirect measure of poverty status.
8.8.1 Main type of bathing facilities used by households
Table 8.11 further presents the type of bathing facility used by household by type of locality.
The Table depicts three (3) main bathing facilities used by households: shared separate
bathroom in the same house (25.8%), Own bathroom for exclusive use (17.8%), shared open
bathing cubicle (37.2%). Other types of bathing facilities use include; private open cubicle
(8.7%), bath in another house (4.4%), and open space around house (3.9%). The rest are
public bath house, 1.0 percent, others 0.8 percent and river/pond/lake/dam 0.2 percent.
Those that use open space around the house form 3.9 percent, with the rural proportion
(4.4%) are being higher than the urban (2.9%). Bathrooms in another house are also higher in
the rural (5.5%) than in the urban areas (1.7%).
Households use more shared separate bathroom in the same house facilities in rural areas
(27.8%) than in urban areas 21.3 percent. More urban households 49.8% use shared open
bathing cubicles than 31.8% of rural households. However, the use of own bathroom for
exclusive use is higher in the rural areas (18.8%) than in the urban areas (15.5%).
Table 8.11: Bathing facility and toilet facilities used by household
Total Urban Rural
Toilet and bathing facilities Number Percent Number Percent Number Percent
Toilet facility used by household Total 11,642 100.0
3,522 100.0
8,120 100.0
No facilities (bush/beach/field) 6,795 58.4
2,303 65.4
4,492 55.3
W.C. 583 5.0
62 1.8
521 6.4
Pit latrine 515 4.4
61 1.7
454 5.6
KVIP 1,285 11.0
470 13.3
815 10.0
Bucket/Pan 168 1.4
9 0.3
159 2.0
Public toilet (WC, KVIP, Pit Pan
etc.) 2,154 18.5
573 16.3
1,581 19.5
Other 142 1.2
44 1.2
98 1.2
Bathing facility used by household
Total 11,642 100.0
3,522 100.0
8,120 100.0
Own bathroom for exclusive use 2,070 17.8
546 15.5
1,524 18.8
Shared separate bathroom in the
same house 3,008 25.8
752 21.3
2,256 27.8
Private open cubicle 1,018 8.7
247 7.0
771 9.5
Shared open cubicle 4,335 37.2
1,754 49.8
2,581 31.8
Public bath house 121 1.0
40 1.1
81 1.0
Bathroom in another house 510 4.4
61 1.7
449 5.5
Open space around house 459 3.9
103 2.9
356 4.4
River/Pond/Lake/Dam 27 0.2
15 0.4
12 0.1
Other 94 0.8 4 0.1 90 1.1 Source: Ghana Statistical Service, 2010 Population and Housing Census

59
8.8.2 Main type of toilet facilities used by households
Table 8.11 & Figure 8.2 present the type of toilet facilities used by households by type of
locality. The table shows that more than half (58.4%) of households in the district do not have
toilet facilities and thus use the bush, beach and fields. This is followed by the use of Public
toilets 18.5 percent, KVIP-11.0 percent, W.C.-5.0 percent, and the Pit latrine 4.4 percent.
The proportion of households that have to use the bush, beach, and fields is more prevalent in
the urban areas 65.4 percent than in the rural areas 55.3 percent. Public toilets are also used
more by rural households (19.5%) than urban households (16.3%). The use of W.C. is higher
in rural communities 6.4 percent than in the urban areas 1.8 percent. The use of the KVIP by
households is higher in urban areas 13.3% compared to 10.0 percent of rural households.
More rural households 5.6 percent use the Pit latrine than 1.7 percent of urban households.
8.9 Method of Waste Disposal
Waste disposal is a challenge in both urban and rural areas. Table 8.12 shows the method of
solid and liquid waste disposal in the district.
8.9.1 Solid waste disposal
According to the table, the most commonly use method of solid waste disposal are the Public
dumping at open dump site (39.4%), and burning of waste (29.7%) are the most used
method of solid waste disposal. The data further shows that Indiscriminate disposal of solid
waste is done by 10.5 percent of households while 9.6 percent of households have the solid
waste collected from the dwelling units and 6.5 percent of households use the public dumping
in a container method. The households that bury their solid waste constitute 3.3 percent.
The dumping of solid waste at open dump site is the most common method by (43.3%) and
(7.7%) urban and rural households. Almost equal proportions of households in urban and
rural areas burn their solid waste.
8.9.2 Liquid waste disposal
Table 8.12 shows that majority (50.1%) of households’ dispose of their liquid waste onto the
compound, followed by those that throw it onto the street (34.2%), and those that throw it
into the gutters (7.4%). Another (4.0%) of households dispose of liquid waste through a
drainage system into a gutter and 1.1 percent of households have a drainage through a pit (use
the soak away system) while 1.7 percent of households have a connection to the central
sewage system for waste disposal. The percentage of dwelling units connected to the central
sewage system is 1.7 percent. More rural households 54.4% compared to 40.2 percent of
urban households, throw their liquid waste onto the compound. On the other hand, 51.6
percent of urban households than 26.6% of their rural counterparts throw their liquid waste
onto the street.

60
Table 8.12: Method of rubbish and liquid waste disposal by households
Waste disposal
District
Total Urban
Rural
Number Percent Number Percent Number Percent
Method of Solid waste disposal
Total
11,642 100.0
3,522 100.0
8,120 100.0
Collected
1,112 9.6
70 2.0
1,042 12.8
Burned by household
3,455 29.7
1,041 29.6
2,414 29.7
Public dump (container)
762 6.5
397 11.3
365 4.5
Public dump (open space)
4,590 39.4
1,525 43.3
3,065 37.7
Dumped indiscriminately
1,228 10.5
359 10.2
869 10.7
Buried by household
382 3.3
76 2.2
306 3.8
Other
113 1.0
54 1.5
59 0.7
Method of liquid waste disposal
Total
11,642 100.0
3,522 100.0
8,120 100.0
Through the sewerage system
197 1.7
15 0.4
182 2.2
Through drainage system into a
gutter
461 4.0
41 1.2
420 5.2
Through drainage into a pit
(soak away)
132 1.1
12 0.3
120 1.5
Thrown onto the street/outside
3,978 34.2
1,816 51.6
2,162 26.6
Thrown into gutter
859 7.4
159 4.5
700 8.6
Thrown onto compound
5,831 50.1
1,415 40.2
4,416 54.4
Other 184 1.6 64 1.8 120 1.5 Source: Ghana Statistical Service, 2010 Population and Housing Census

61
CHAPTER NINE
SUMMARY OF KEY FINDINGS AND
POLICY IMPLICATIONS
9.1 Introduction
This chapter presents a summary of the findings and policy implications of the previous eight
chapters based on analysis of selected topics of the 2010 Population and Housing Census for
Greater Accra.
9.2 Demographic Characteristics
9.2.1 Summary of findings
The analyses in chapter two focused on the demographic characteristics of the district. These
are essentially the characteristics of the human population of the district such as its size,
growth, density, distribution, and statistics regarding birth, marriage, disease and death.
These are the most basic characteristics of a population and their structure can have a
considerable impact on the population’s social and economic situation, both present and
future. The analyses were based on the 2010 PHC
The total population of the district is 59,124, with the male population being 28,579 (48.3%)
and the females 30,548 (51.7%). The share of the population in urban and rural areas is
17,555 and 41,569 which is (29.7% and (70.3%) respectively, show that majority of the
population in the district lives in rural areas. The age group with the highest population 16.0
percent is 0-4, followed by 5-9 age group 14.1% and 10-14, 12.7 percent. Those aged 95
years and older, record the lowest total population with a proportion of 0.1 percent.
The age structure of the district shows a broad base that gradually declines with increasing
age indicating that the population of the district young. The age dependency ratio is 90.6, the
child dependency ratio is 81.6 and the old age dependency ratio is 9.1.
The sex ratio is 93.6 percent which means that for every 100 female populations, there were
approximately 94 males in the population.
Total fertility rate (TFR) of 4.0 is the highest amongst all the districts in the region. The
general fertility rate (GFR) is also the highest in the region with 115.3 compared with the
regional of 75.7. The crude birth rate (CBR) is 27.8, higher than the regional average of 22.7
The death rate of the district is 6.5 the third highest in the region and higher than the crude
death rate of all districts in the region (4.3)
The data shows that 15,283 constituting 25.8 percent of the total populations enumerated in
the district are migrants.
Of the total number of migrants, more than half (54.0%) were born elsewhere (that is, outside
the locality of enumeration) but in the Greater Accra Region. Amongst those born in the
Greater Accra Region, 18.3 percent had resided for less than one year, 27.7 percent have
resided for between one and four years.

62
9.2.2 Policy implications
Since the district has a broad youth base, it is recommended that resources be channeled
proportionally to cater for the needs of the youth. It is important especially to be able to
adequately educate the youth of the district for its future development and to curb such vices
as youth delinquency. Education may be in the form of formal education as well as skills
training. The youth must also be provided with employment opportunities. Educated youth
without the necessary jobs will be fruitless. The provision of jobs could also ease the age-
dependency ratio of 90.6 which is quite high. The social and health care needs of the youth
should also be catered for by providing them with social amenities and health facilities.
The total fertility rate of 4.0 and the general fertility rate of 115.3 happen to be the highest in
the region. The crude birth rate of 27.8 is also higher than the regional average. This may lead
to a high population growth rate and must be factored into the economic resources of the
district.
With a crude death rate of 6.5, the district comes third highest in the region. Policy
interventions must investigate causes of death and aim to lessen preventable ones. Better
health services must also be provided especially Community-Based Health Planning and
Services (CHPS) compounds which are easily accessible by rural folks.
Twenty five (25) out of every hundred people enumerated in the district is a migrant. These
migrants can be a potential asset for the district by tapping their skills and using them for the
benefits of the district. It can however be a potential problem if they become a liability to the
district by engaging in nefarious activities.
9.3 Social Characteristics
9.3.1 Summary
Chapter three analyzed some household characteristics such as the household composition
and structure, Nationality, Marital Status, Religious affiliation, Literacy and Education. Data
on these social characteristics is needed for planning social services in health, education and
housing
The Chapter shows that 20.2 percent of household members in the district are heads of
households; with 23.8 percent of males being heads of household and 16.7 percent of female
heads. Extended family members such as parents-in-law, son/daughter-in-law, and other
relations have very minimal representation in households in the region. The data shows that
26.8 percent of households in the district are comprised of single parents living with their
extended families and 21.5 percent of the households are nuclear family made up of head,
spouse(s) and children only. One-fifth (20.5%) of the households are also made up of the
extended family comprising of the head, spouse(s), children and relatives of the head.
The results indicate that 44.2 percent of the population 12 years and older is married and 41.4
percent are never married while 5.6 percent are in an informal union, 3.7 percent, 2.9 percent
and 2.3 percent are widowed, divorced or separated, respectively. A higher proportion of
males than females are never married. The majority of those who are economically not active
(59.4%) have never been married. Only 11.1percent of the population in that group are
married. In contrast, 86.4 percent of the employed are married while 37.7 percent of them
have never been married. The highest proportion of the unemployed (4.9%) is those in
Informal/Consensual union/Living together while the lowest proportion 1.0 percent are the
widowed.

63
In addition, 95.6 percent of the population enumerated in the district is Ghanaian by birth, 1.9
percent has dual nationality, and one percent is of ECOWAS origin. Less than one percent
(0.5%) of the population is Africans other than ECOWAS nationals.
Majority 88.3 percent of the population is Christians followed by those with no religion
(4.9%) and Islam (4.8%). Among the population who are Christians, those who belong to the
Pentecostal/Charismatic group (68.8%) is in the majority followed by the Protestants
(18.4%). Whereas males are likely to belong to the Protestant group, females are more likely
to belong to the Pentecostal/Charismatic group.
Slightly more than two thirds (68.5%) of the population is literate and 31.5 percent are not
literate Of the literate population, 58.6 percent are literate in English and Ghanaian Language
while 36.0 percent are literate in English language only. Only 4.0 percent of the population is
literate in Ghanaian Language
Two-fifths (40.5%) of females compared to 32.1 percent of males are literate in English only.
A relatively higher proportion of males (63.0%) than females (53.5%) are literate in both
English and Ghanaian language.
9.3.2 Policy implications
Although there is a higher proportion of male heads of household than females, the difference
is not very wide. It is recommended that economic and educational opportunities continue to
be expanded for females in order for them to enhance their already important role in the
households.
There is almost an equal proportion for those who are married and those who have never been
married. This may indicate that attitudes may be changing towards marriage. Social change
and economic development may also be a contributory factor. From the statistics there are
more married and employed people than there are married and unemployed. Employment is
therefore a variable for marital status. These trends can be studied further for programs and
policies that may be useful for the country’s developmental goals.
Although there is a wide degree of variation between the proportions of the religious
affiliations in the district, the religious harmony that exists there should be commended and
religious elders should continue to strive to prevent conflict among members of the different
religions.
Nearly one third (31.5%) of the population is not literate. This is a bad reflection on the
prevailing state of educational status of the districts. Again, 63.0 percent of males are
educated and 53.5 percent of females are educated showing the gender disparity in education
in the district. Policy interventions should make education available and affordable to all as
well as focus on the girl child with regards to education
9.4 Economic Characteristics
9.4.1 Summary
The economic characteristics of any population are important in examining population and
development interrelationships so that appropriate policies can be adopted. Population and
development interrelationships have been a major area of research and policy concern in
developing countries, including Ghana. Rapid population increase compound economic
stagnation and associated unemployment problems

64
The data shows that 73.0 percent of the population aged 15 years and over in the district is
economically active and 27.0 percent is economically not active. Of those economically
active, 95.8 percent are employed and 4.2 percent unemployed. Again, 96.1 percent of the
economically active males are employed while it is 95.6 percent of females. The age group
that contributes the greatest to employment is the 45-49 age groups (93.8%) with much lower
proportions found in very early and late ages. The 20-24 age groups have the highest
proportion of unemployment (5.3%).
Skilled Agriculture, Forestry and Fishery and Craft and related trades employ the largest
(60.7%) of the employed population. Service and sales workers are the third highest
proportionally with 17.4 percent. Clerical support workers record the least proportion of 0.7
percent.
Three quarters (72.5%) of the employed population in the district aged 15 years and over
work in the Agriculture forestry and fishing industry, Manufacturing industry and Wholesale
and retail; repair of motor vehicles and motorcycles industry with each industry contributing
42.5 percent, 15.8 percent and 14.1 percent respectively.
About 60.5 percent of the employed are self-employed (without employees). Employees and
Contributing Family Workers both have equal proportions of 14.2 percent. Apprentices make
up 1.8 percent of the employment sector whiles the Domestic Employee (house help) group
are 0.5 percent of the employment sector.
The proportion that is self-employed (without employees) for the females (67.0%) exceed
that of the males (52.8%). The proportion of females who are “contributing family workers”
(16.2%) also exceeds that of males (11.8%). On the contrary, while 22.3percent of the
employed males are employees, only 7.4 percent of the employed females are employees.
The proportions are generally low for both sexes in areas such as Apprentice and Domestic
Employee (House help)
Whiles the Public (Government sector) employs only 4.1 percent of the employed; the Private
Informal employs 89.5 percent. The private formal also employs 5.7 percent.
9.4.2 Policy implications
The census results show that 95.8 percent of the economically active population is employed.
This proportion is quite high compared to other districts in the region. It is recommended that
the status quo be examined and if possible improved upon. The females also lag behind the
men in proportion with regards to employment. Equal opportunities regarding gender should
be closely looked at. It is also worth mentioning that the age group with the highest level of
unemployment is the 20-24 age groups. This age group is also one of the most vulnerable age
groups and they can succumb to all sorts of illegal temptations. Some employment drives
should be specifically targeted at this age group.
The occupation with the highest proportion of the employed population is agricultural
forestry and fishery workers. Policy interventions can therefore examine ways in which this
industry can be further developed. Irrigation systems and fertilization initiatives for example
can be invested in to further boost the growth of the industry. Other occupations can also be
looked at for their potential of growing and providing employment for the employed
population of the district. Clerical support workers are almost nonexistent in the district
(0.7%) this will provide the educated in the society to migrate to find work and this will be a
loss to the district. Again initiative drives are needed to be put in place to prevent this from

65
happening. The bulk of those employed (60.5%) are self-employed without employees. If
there are policies to help these businesses grow, depending on the nature of business, they
could create more employment opportunities for others. Finally, the government only
employs 4.1 percent of the population. This is understandable because the district is a new
one and still going through the decentralization process. It is expected that with time there
will be more government agencies and organizations operating in the district so that
employment in this sector will be increased.
9.5 Information Communications Technology
9.5.1 Summary
Chapter Five analyzed access to ICT and facilities relative to various socio-demographic
characteristics such as age, sex, education, locality of residence, and economic activity status
in the district. Slightly over two fifths (44.3%) of the population above 12 years and older
own mobile phones. This is less than half of the population. Males that own mobile phone
form 52.6 percent and females are 37.1 percent. Mobile phone ownership is higher among
males than females. Furthermore, 4.5 percent of the population aged 12 years and above
have access. The proportion of males constitutes 6.7 percent, and females are 2.5 percent of
internet facility users. Households with fixed telephone lines constitute only 1.3 percent of
the total number of households in the district. Households with male heads are 1.4 percent
who has fixed telephone lines ownership and the female heads with households having fixed
lines is 1.1 percent.
Only 4.3 percent households have desktop/ laptop. Male headed household whose households
use desktop/laptop computers are 5.5 percent while it is 2.7 percent for their female
counterparts.
9.5.2 Policy implications
The analysis shows that ICT usage is very low in the district especially in rural areas. There
are likely to be a number of reasons for this, including access and availability of required
infrastructure, e.g. mobile phone coverage and connectivity. It is therefore recommended that
the District Assembly direct investment in ICT infrastructure and services. In order to
increase the use of internet, the government, especially the District perhaps needs to establish
internet facilities in public places such as schools, libraries, local government decentralized
departments and agencies in collaboration with community organizations. This will make it
possible for rural populations to be linked with the rest of the district, region, Ghana and
beyond, and tap into the enormous developmental opportunities that internet usage brings.
It is very relevant for the district, government and other development partners to seriously
take measures to invest in ICT as a development tool or drive. This will afford the district,
government agencies, private companies and community organizations the opportunity to
disseminate important public information to users and the general public through mobile
phones. This may include weather information produced by Ghana Meteorological Agency,
public health information and advice from the Ghana Health Service, and information on
market prices for those selling goods.

66
9.6 Disability
9.6.1 Summary
The Chapter Six explores national, regional district data from the 2010 Population and
Housing Census with primary focus on persons with disability (PWDs). The analysis in the
chapter shows that 2.2 percent of people in the district have some form of disability. Again,
the proportion of Persons with disability is higher among females (2.3%) than males (2.0%).
The most common type of disability in the district is sight/visual impairment which accounts
for 31.4 percent of the total population of Persons with disability. The physically challenged
invariably constitutes the next highest disability type with (25.3%) and the least type of
disability being the “other” type of disability (10.6%). There is a close proportional
difference between urban and rural persons with disability populations in the district. There
are almost equal proportions of disabled persons in both urban (2.1%), and rural (2.2%)
localities. In the Ada West District, Persons with disability who are employed constitute 46.4
percent, 2.9 percent are unemployed, and 50.7 percent of them are economically not active.
Persons with emotional problems forms 55.7 percent of the persons with disability who are
employed, the unemployed 3.4%, and the economically not active also constitute 40.9
percent. This is followed by sight/visual impairment with a proportions in the labor force (48
4%), the unemployed (2.5%) and the economically not active (49.0%). The intellectual
disorders in the labor force invariably form 22.6 percent, with unemployment 3.0 percent,
and economically not active 74.4
Finally, the proportion of employed males who have disability (46.7%) is just a little higher
than that of the females (46.2%). The proportion of unemployed females who are disabled
(2.7%) is lower than that of males (3.2%); and for persons with disability in the economically
not active class, the proportion with disability is 37.7 percent for females, and 45.6 percent
for males.
9.6.2 Policy implications
Due to the increasing numbers of disabled persons, the District Assemblies should provide
infrastructure, tools and services that will be user friendly for persons with disability. Efforts
must be made to improve the educational attainment of PWDs. These should include the
establishment of special schools for children with disability, giving support services to
persons with disabilities, for example, provision of hearing aids, braille and wheelchairs to
PWDs, which will in turn encourage them to attend school and participate fully in school
activities.
The release and management of Persons with Disabilities (PWDs) Fund by government and
the district should be more proactive taking cognizance of needs assessment, training,
accountability and transparency.
Finally, the provision of infrastructure such as skills development training centers should be
built and equipped by the in order to train PWDs in various relevant skills that will make
them more employable and reduce their vulnerability and enable them to live higher quality
lives. The various non-governmental organizations (NGOs), individuals and other
development partners could invariably fund such support services for PWDs in the district.

67
9.7 Agricultural Activity
9.7.1 Summary
The major economic activity in the district is agriculture with 57.5 percent of households in
the district is engaged in it. Furthermore, 77.1 percent of the households engaged in
Agriculture are from the rural areas, and the remaining 22.9 percent are from the urban areas.
The agricultural activities in the district are grouped into four (4) categories which includes;
Crop farming, Tree planting, Livestock Rearing and Fish farming. The data shows that 48.1,
percent of the households engaged in agriculture are into crop farming, and 36.5 percent are
into livestock rearing. Crop farming is the predominant agricultural activity in the district,
with the highest proportion of the households in the rural areas forming 83.3, percent, and
urban locality constituting only 16.7 percent. The rural proportions of the households
engaged in livestock rearing are 74.4 percent comparatively higher than that of the urban 25.6
percent. In fact, the rural proportions of the households are higher than that of the urban for
all other categories of agricultural activities within the district.
The distribution of livestock is such that the highest proportion of livestock is chicken
(40.8%). and is followed by goat with 20.7 percent, then cattle (13.9%) and guinea fowl
(8.3%). Sheep constitute 6.2 percent, of livestock animals, pig forms 4.9 percent of livestock
animals.
Again, 38.2 percent of the keepers are keepers of chicken, 32.9 percent for goat, 6.3 percent
and 6.0 percent for sheep and cattle respectively, and also 5.6 percent, 5.2 percent for pig and
guinea fowl respectively. The average animal per keeper is 16 for chicken, an indication that
chicken keeping is widely distributed in the District. That of snail is 400 animals per keeper,
cattle is 34, and marine fish 50 per keeper.
9.7.2 Policy implications
The proportion of the agricultural households engaged in crop farming is sufficiently high but
relatively low in livestock rearing, and extremely low in tree growing and fish farming. The
deforestation and its negative effect on climate change require that tree growing be
encouraged. Livestock rearing, tree growing, and fish farming in the district require
pragmatic approach and effective promotion or strategies beyond what currently pertains in
order to encourage many agricultural households to go into those farming activities.
Other major findings of the Chapter Seven are that the rainfall pattern is erratic, very
unreliable making produce output very low. This makes farming unattractive to the youth
such that significant proportions of the youth are not interested in agriculture. To encourage
the youth to stay in agriculture and not migrate from the district, there is the need to introduce
technologies (mechanization) such as irrigation, and use of machinery amongst others that
would remove or reduce the drudgery in farming. Again, the educated youth in the district
must be assured of marketing outlets for farm produce and profitability in taking up farming
as a business.
Finally, to promote increase crop yield there is the need to introduce innovations in the areas
of modern or modified seeds, fertilizers, and weedicides as well as encourage the formation
of farmer based organizations and cooperative societies across the district.
68
9.8 Housing Conditions
9.8.1 Summary
The Chapter Eight analyzed housing conditions and characteristics within the district. The
total population of the district (59,124) is 1.5 percent of the total population of Greater Accra
Region. 29.7 percent are in the urban locality, and 70.3 percent are living in the rural
locality. The total household population of the District (57,746) is 1.5 percent of that of
Greater Accra Region (3,888,512).
The number of households in the District is 1.1 percent of Total Households in Greater Accra
Region (1,036,370) and 0.2 percent of the Total Households in Ghana (5,467,054). 30.3
percent (3,522) of the households are in the urban locality, 69.7 percent are in the rural
locality. The urban locality consists of 25.5 percent of houses in the District and that of the
rural is 74.8 percent. Despite the rural population is higher, the Population per house is higher
in the urban (10.2%) than in the rural locality (8.1%). The average household per house of
(1.7) is above that of the Country (1.6) and below that of the Region (2.2). However the
urban average household per house (2.1) almost equates that of the Country (2.2).
Dwellings owned by a household member forms the highest proportion (63.6%) of the
dwelling, followed by those owned by a relative who is not a household member (21.0%),
and those owned by other private individuals (12.4%). Only 0.8 percent of the dwelling units
in the district have Public/Government ownership, 0.2 percent is owned by Private
employers, whiles 0.3 percent are being purchased (e.g. mortgage). There are more dwelling
units (66.9%) owned by household members in the rural areas compared to 56.0 percent
owned by their urban counterparts. There are almost equal proportions 63.7 percent and 63.5
percent of male and female heads of households in dwelling units owned by a household
member.
The commonest type of dwelling unit is Compound House (rooms) which constitutes 62.4
percent followed by the Separate House unit (25.0%) and Semi-detach house unit (4.3%).
The other dwelling types form less than 1 percent (0.1%) of all dwelling unit types. The
proportion of separate houses in rural localities is (27.9%) more than in urban locality which
is (18.5%). This may be attributed to the availability of land and comparatively cheaper
building materials in rural areas. The Compound Houses account for 70.8 percent of dwelling
unit types in urban areas and 58.8 percent in rural areas. This means that more than 6 out of
every 10 houses in the urban locality are compound houses.
The proportion of female heads of households in compound house (64.3%) is more than that
of males (61.0%). Besides, the proportion of male heads of households in separate houses of
(26.4%) is more than that of females (23.3%). This seems to suggest that more male heads
are able to afford separate houses than female heads.
The main construction material for outer wall in the District is the cement blocks/concrete
(68.6%), followed by mud brick/earth (27.7%). The Wooden outer walls constitute 1.6
percent of walls in the district. The Land Crete forms (0.8%). Palm leaf/thatch (grass)/raffia
invariably constitute (0.5%); the Metal Sheet/Slate/Asbestos is (0.3%), and Bamboo (0.1%) is
rarely used for the building/construction of outer walls.
Urban dwelling units with Mud Brick/Earth outer wall is 11.8 percent; far below the rural
percentage of (34.0%). The Cement blocks/Concrete constitutes 84.4 percent of outer walls
of dwelling units in the urban locality compared to that of the rural areas (61.9%).

69
The Cement/Concrete is mostly used for floors in the district (87.7%); but the proportion of
the urban areas is (92.9%) higher than in rural areas (85.4%). Meanwhile the proportion of
floors made with Earth/Mud in the rural areas is 12.3 percent compared to that of the urban
areas (5.7%). Moreover, apart from Cement/Concrete and Earth/Mud, other construction
material for the floor constitutes very low proportions.
The most common material for roofing of dwelling units is the Slate/Asbestos (52.6%),
followed by the metal sheets with 25.0 percent. The Thatch/Palm leaf or Raffia, and
Cement/Concrete constitutes 19.4 percent and 1.7 percent respectively. Meanwhile the
Mud/Mud bricks/Earth, Wood, Bamboo and Roofing tile, each constitute less than 1 percent
of materials used for roofing dwelling units in the District. The use of slate/ asbestos accounts
for 71.6 percent of roofing material in the urban locality compared to 44.6 percent in the rural
areas. Besides, the use of metal sheets invariably constitutes 15.7 percent in the urban locality
lower than the 28.9 percent of use in the rural locality. The use of Thatch/Palm leaf or Raffia
constitutes 23.4 percent in the rural locality higher than the 10.0 percent.
The result show that 43.6 percent of households use single rooms and those with household
size 1 have the highest proportion (85.9%) having access to one sleeping room. The greatest
proportions of households with sizes ranging from 1 to 7 have access to one sleeping room.
This gives a picture of overcrowding where for instance 20.6 percent of households with a
size of 7 in a dwelling unit have access to only one sleeping room. The highest proportion of
household sizes ranging from 8 to 10+ has access to two sleeping rooms.
The highest proportion of dwelling units (66.0%) in the District uses electricity (mains) as the
main source of lighting. Dwelling units that use electricity from private generator is less than
1 percent (0.9%). Kerosene is the next commonly used source of lighting with (27.2%) after
electricity (mains). The use of the Flash light follows with 5.0 percent. The result again
portrays that while 65.2 percent of urban dwelling units use the electricity (mains), and 66.3
percent use it in the rural locality. The Flashlight usage constitutes 5.3 percent of urban
dwelling units whilst it is 4.9 percent in the rural locality.
The use of charcoal constitutes the largest source cooking fuel for 55.2 percent of households,
wood however forms 29.0 percent and Gas 8.7 percent. Again, 6.0 percent of households in
the district do not cook using any of the main sources of cooking fuel. Even though charcoal
is the main source of cooking for both urban and rural households, the urban proportion of
69.0 percent is higher than the rural areas percentage of (49.2%). The percentage distribution
of cooking spaces available to households explains that the most common cooking spaces
available in the district are Separate room for exclusive use of household (33.4%), open space
in compound (25.6%) and the Verandah (16.2%). The proportion of rural households that use
separate room exclusively (737.6%) is higher than the urban proportion of (23.9%). However
the urban proportion for open space in compound (25.3%) is almost the same as the rural
proportion of (25.8%).
There are six (6) main sources of drinking water for dwelling units in the district. These are
Public tap/Standpipe (63.1%), Pipe borne outside the dwelling unit (19.9%), Sachet water
constitutes (7.2%), Pipe-born inside the dwelling unit (4.7%), Dugout/Pond/Lake/Dam/Canal
also form (2.2%) of the main water source use, and Borehole/Pump tube well (1.5%). More
dwelling units in the urban locality use public tap/standpipe (69.6%) compared to 60.3
percent of use in rural areas. In addition, 21.0 percent of rural households use pipe-borne
outside their dwellings than 17.5% of urban households. Besides, more dwelling units in the
urban locality use sachet water 10.5 percent compared to rural dwelling units sachet water

70
use of 5.7 percent. The use of Dugout/Pond/Lake/Dam/Canal as source for drinking by rural
households is 3.1 percent.
The main bathing facilities used by households in the district include shared open cubicle
(37.2%), shared separate bathroom in the same house (25.8%) and Own bathroom for
exclusive use (17.8%). Other types of bathing facilities use include; private open cubicle
(8.7%), bath in another house (4.5%), and open space around house (3.9%).
There are very few toilet facilities in the entire district and even the few available ones are
not usable. This result into open space defecation (free range) in the bush, beaches and fields
by 58.4 percent of households in the district, followed by the use of Public toilets 18.5
percent, KVIP-11.0 percent, W.C.-5.0 percent, and the Pit latrine 4.4 percent. Public toilets
are used more by rural households (19.5%) than urban households (16.3%). The proportion of
households that do not have toilet facilities is higher in urban areas 65.4 percent than in rural
areas 55.3 percent. The use of W.C. is higher in rural communities 6.4 percent than in the
urban areas 1.8 percent. The use of the Pit latrine in rural areas 5.6 percent is higher than in
urban areas 1.7 percent. In addition, 13.3% of urban households use the KVIP compared to
10.0 percent of rural households.
The common methods of solid waste disposal are the Public dumping at open dump site
(39.4%), and burning of waste (29.7%). Public dumping in a container is (6.5%), and only 9.6
percent of households have their solid waste collected from the dwelling units. Indiscriminate
disposal of solid waste forms 10.5 percent and burying solid waste also constitute 3.3 percent
of the methods used by households. The dumping of solid waste at open dump site is the most
common method both in the urban (43.3%) and the rural (37.7%) areas, and followed by
burning in rural locality 29.7 percent and urban locality 29.6 percent. The data also shows
that 50.1% of households throw their liquid waste on to the compound.
9.8.2 Policy implications
Conscious efforts should be made to solve the housing deficit in the district by the district
Assembly, private individual’s civil society organizations, and other development partners.
This could be done through encouraging or promoting the use of local traditional building
materials to construct houses the district. This would reduce the cost of building and hence
reduce rent in the district. The district as an entity as well as private individuals could invest
in the provision of modern housing facilities at affordable rates for the general public to buy.
There is the need to continue exploring non-traditional sources of energy and supporting
initiatives aimed at addressing the lighting needs of off-grid households by making safe,
affordable, durable, and environmentally sustainable lighting available to the masses through
solar and other means. There is potential to expand solar energy to accelerate economic
growth and the district or government needs to invest more time and money to make solar
energy more available and affordable.
The chapter again demonstrates that sanitation – disposal of both liquid and solid household
waste, toilet and bathing facilities – is very poor in the district. It appears that expenditure on
solid waste disposal and drainage is rarely seen as forming part of a portfolio of investments
in public health. Rather, it is generally perceived by decision makers as comparable with
other investments such as roads or public transportation, which are not considered to be
public health interventions. Sewage disposal should be planned as a major health
intervention. Its linkage to financial sustainability of the National Health Insurance Scheme
(NHIS) needs to be explored given that several diseases are linked to poor sanitation.

71
The proportion using public toilets is also quite high. The district initiatives to construct them
as revenue-generating units and this might explain the pervasive use of public toilets in spite
of the unhygienic conditions of most the facilities. As a matter of fact the district has a big
role to play in the provision of adequate public toilet facilities and maintaining their hygiene.
Almost one in ten dwelling units does not have access to any toilet facilities and household
members use the bush/beach and open fields. Laws requiring landlords to provide toilet
facilities in houses should be enforced by the district and should also apply to owner-occupier
households.

72
REFERENCES
District Medium Term Development Plans, 2010 – 2014 (DMTDPs) Dangbe East District
Assembly
Ghana Statistical Service, 2010 Population and Housing Census, Greater Accra Region
Analytical Report
C.O.C Amate (1999); The Making of Ada (Woeli Publishing Services Accra, 1999),
Ghana Statistical Service, 2010 Population and Housing Census, National Analytical Report
Anarfi, J.K., Kwankye, S.O., Ofosu-Mensah, A. and Tiemoko, R. (2003). Migration from and
to Ghana: A Background Paper. Working Paper C4. Migration, Globalisation and
Poverty. Development Research Centre, University of Sussex.
Asiedu, A.B and Arku, G. (2009). The rise of gated housing estates in Ghana: Empirical
insights from three communities in metropolitan Accra. Journal of Housing and the
Built Environment, 24:227-247.
Codjoe, S.N.A. (2010). Population and food crop production in male- and female-headed
households in Ghana. International Journal of Development Issues, Vol. 9 (1): 68-85.
Codjoe, S.N.A. and Owusu, G. (2011). Climate change/variability and food systems:
Evidence from Afram Plains, Ghana. Regional Environmental Change, Vol.
11(4):753-765.
Deere, C.D. (2005). The feminisation of agriculture? Economic restructuring in rural Latin
America. Occasional Paper 1, United Nations Research Institute for Social
Development, Geneva.
Gaisie, S.K. (1981). Child spacing patterns and fertility differentials in Ghana. In: Hilary J.
Pace and Ron Lesthaeghe (Eds.). Child spacing in Tropical Africa: traditions and
change. Academic Press: 237-253.
Ghana Statistical Service (2002). Population and Housing Census, Summary Report of final
Results.
Ghana Statistical Service. (2005). 2000 Population and Housing Census. Greater Accra
Region. Analysis of District Data and Implications for Planning. Accra: GSS.
Ghana Statistical Service (2012). 2010 Population and Housing Census. Summary Report of
Final Results. GSS, Accra.
Heinsohn, G. (2003). Sons and World Power: Terror in the Rise and Fall of Nations. Zurich:
Orrell and Fussch..
Institute of Statistical, Social and Economic Research (2000). The State of the Ghanaian
Economy in 1999. Legon: University of Ghana.
Institute of Statistical, Social and Economic Research (2011). The State of the Ghanaian
Economy in 2010. Legon: University of Ghana.

73
Mtshali, S.M. (2002). Household Livelihood Security in Rural KwaZulu-Natal, South Africa.
Wageningen: Wageningen Universiteit.
World Health Organisation (2011). Summary World Report on Disability.
WHO/NMH/VIP/11.01 WHO, Malta.
WHO and UNICEF (2000). The Global Water Supply and Sanitation Assessment 2000
Report. Geneva: WHO.
Wogugu M.O and Fayorsey C.K. ( 1980). Modernization and Household Size in Urban Ghana.
Population Information and Documentation Systems for Africa (PIDSA). Ottawa:
RIPS/IDRC.

74
APPENDICES
Table A1: Household composition by type of locality
Total
country
District
Total Urban Rural
Total 5,467,136
11,642 3,522 8,120
Household with head and a
spouse only 208,340
297 87 210
Household with head and multiple
spouse only -
- - -
Household with head spouse(s)
and biological/adopted children
only 1,337,416
2,359 603 1,756
Household with head spouse(s)
biological/adopted children and
relatives of the head only 762,847
1,442 388 1,054
Household with head spouse(s)
biological/adopted children
relatives and nonrelatives of the
head 47,570
84 21 63
Household with head spouse(s)
and other composition 165,052
297 95 202
Head only 960,700
1,783 646 1,137
Household with head and
biological/adopted children only 707,214
1,753 538 1,215
Household with head
biological/adopted children and
relatives of the head only 603,295
2,135 717 1,418
Household with head
biological/adopted children
relatives and nonrelatives of the
head 41,189
92 31 61
Household with head and other
composition but no spouse 633,513 1,400 396 1,004 Ghana Statistical Service, 2010 Population and Housing Census

75
Table A2: Population 3 years and older by sex, disability type and level of education
Disability Total
Never
attended Nursery
Kinder-
garten Primary
JSS/
JHS Middle
SSS/
SHS
Secon
dary
Voc/
Tech /
Comm
Post middle
/secondary
certificate
Post
secondary
diploma
Bachelor
degree
Post graduate (Cert.
Diploma Masters
PHD etc.)
Both sexes
Total 53,459 15,999 2,151 2,961 15,761 8,681 2,860 2,724 414 515 324 592 404 73
No disability 52,197 15,351 2,134 2,946 15,538 8,546 2,737 2,687 395 506 316 577 394 70
With a disability 1,262 648 17 15 223 135 123 37 19 9 8 15 10 3
Sight 395 219 6 5 47 26 50 13 4 4 4 10 4 3
Hearing 172 98 2 1 34 17 13 4 0 1 1 0 1 0
Speech 162 103 0 3 27 12 12 4 0 0 0 0 1 0
Physical 321 182 2 1 51 31 32 6 9 2 1 0 4 0
Intellectual 163 98 1 1 26 9 19 6 1 0 1 0 1 0
Emotional 244 91 4 4 61 48 20 7 4 2 0 2 1 0
Other 135 65 4 4 18 9 21 5 1 0 1 4 3 0
Male
Total 25,734 5,812 1,119 1,507 7,874 4,440 1,777 1,671 296 324 182 404 268 60
No disability 25,163 5,602 1,113 1,497 7,755 4,358 1,695 1,649 280 320 177 396 263 58
With a disability 571 210 6 10 119 82 82 22 16 4 5 8 5 2
Sight 184 79 0 2 25 18 36 7 4 1 3 5 2 2
Hearing 89 39 1 1 26 10 8 3 0 0 0 0 1 0
Speech 82 44 0 3 18 6 8 2 0 0 0 0 1 0
Physical 133 49 1 1 23 19 22 5 7 1 1 0 4 0
Intellectual 72 30 1 1 16 4 13 5 1 0 0 0 1 0
Emotional 114 34 2 2 31 25 7 5 3 2 0 2 1 0
Other 62 21 3 4 8 5 15 2 1 0 1 2 0 0
Female
Total 27,725 10,187 1,032 1,454 7,887 4,241 1,083 1,053 118 191 142 188 136 13
No disability 27,034 9,749 1,021 1,449 7,783 4,188 1,042 1,038 115 186 139 181 131 12
With a disability 691 438 11 5 104 53 41 15 3 5 3 7 5 1
Sight 211 140 6 3 22 8 14 6 0 3 1 5 2 1
Hearing 83 59 1 0 8 7 5 1 0 1 1 0 0 0
Speech 80 59 0 0 9 6 4 2 0 0 0 0 0 0
Physical 188 133 1 0 28 12 10 1 2 1 0 0 0 0
Intellectual 91 68 0 0 10 5 6 1 0 0 1 0 0 0
Emotional 130 57 2 2 30 23 13 2 1 0 0 0 0 0
Other 73 44 1 0 10 4 6 3 0 0 0 2 3 0

76
Table A3: Population by sex, number households and number of houses in
the 20 largest communities
Sex
S/No. Community Name Total Male Female House
holds Houses
1 Anyamam 6,464 3,055 3,409 1,080 581
2 Sege Junction 5,990 2,833 3,157
1,402
750
3 Akplabanya 5,101 2,500 2,601
1,040
387
4 Goi
3,657 1,707 1,950
728
464
5 Koluedor 3,051 1,410 1,641
725
384
6 Lolonya 2,443 1,160 1,283
435
306
7 Toflokpo 2,357 1,144 1,213
435
269
8 Adzomanukope 2,293 1,081 1,212
436
256
9 Bornkope 2,275 1,109 1,166
404
269
10 Matsekope 1,977 971 1,006
364
179
11 Wokumegbe 1,628 765 863
266
157
12 Salom
1,530 750 780
285
226
13 Sege Nakonkope 1,401 704 697
229
159
14 Tugakope 1,249 594 655
239
142
15 Addokope 1,110 489 621
250
180
16 Ayisah
1,034 575 459
194
172
17 Agbenyega 1,002 518 484
240
45
18 Koluedor Manheim 967 471 496
191
115
19 Koni Amatey 965 502 463
167
145
20 Abuanokope 956 449 507 258 69 Ghana Statistical Service, 2010 Population and Housing Census

77
Table A4: Population by age group in the 20 largest communities
Age Group
S/No. Community Name
All
ages 0-4 5-9 10-14 15-19 20-24 25-29 30-34 35-39 40-44 45-49 50-54 55-59 60-64 65-69 70-74 75+
1 Anyamam 6,464 1,069 1,024 891 735 535 423 370 304 237 183 180 107 125 80 91 110
2 Sege Junction 5,990 896 833 769 738 560 470 359 325 275 216 159 109 101 45 62 73
3 Akplabanya 5,101 817 671 696 618 455 399 331 255 217 160 132 83 68 55 60 84
4 Goi 3,657 469 447 399 381 346 285 228 215 156 124 157 81 94 67 93 115
5 Koluedor 3,051 468 330 318 345 301 275 199 152 144 121 113 65 70 41 42 67
6 Lolonya 2,443 382 377 282 284 211 187 126 97 99 77 51 51 52 42 51 74
7 Toflokpo 2,357 404 315 284 265 198 188 166 112 92 81 68 32 35 26 39 52
8 Adzomanukope 2,293 372 351 282 251 225 157 151 122 88 71 56 29 39 30 26 43
9 Bornkope 2,275 423 349 325 219 191 153 115 118 87 79 61 29 35 21 30 40
10 Matsekope 1,977 319 272 259 236 160 125 81 100 89 75 58 43 41 36 26 57
11 Wokumegbe 1,628 288 233 172 171 146 121 94 90 64 37 50 28 30 28 23 53
12 Salom 1,530 314 248 176 148 121 120 87 72 59 45 29 25 22 15 15 34
13 Sege Nakonkope 1,401 222 238 255 150 112 74 82 69 50 30 24 27 17 6 20 25
14 Tugakope 1,249 184 190 158 150 143 81 65 47 43 38 32 30 23 11 17 37
15 Addokope 1,110 154 157 153 133 84 72 49 42 42 37 29 31 52 23 20 32
16 Ayisah 1,034 181 142 158 122 76 81 60 41 25 30 33 25 19 11 14 16
17 Agbenyega 1,002 106 97 78 91 138 114 86 87 62 50 26 17 10 12 16 12
18 Koluedor Manheim 967 176 138 137 99 101 64 60 59 29 20 16 12 19 5 15 17
19 Koni Amatey 965 175 121 156 129 64 59 69 38 32 29 32 16 11 9 13 12
20 Abuanokope 956 114 99 91 108 106 103 97 55 48 30 22 31 14 13 13 12 Ghana Statistical Service, 2010 Population and Housing Census

78
LIST OF CONTRIBUTORS
Project Secretariat
Dr. Philomena Nyarko, Government Statistician
Mr. Baah Wadieh, Deputy Government Statistician
Mr. David Yenukwa Kombat, Acting Census Coordinator
Mr. Sylvester Gyamfi, DISDAP Project Coordinator
Mrs. Abena A. Osei-Akoto, Data Processing
Mr. Rochester Appiah Kubi Boateng, Data Processing
Mrs. Jacqueline Anum, Data Processing
Mrs. Samilia Mintah, Data Processing
Mr. Yaw Misefa, Data Processing
Mr. Ernest Enyan, Data Processing
Mr. Christian Assem, Regional Statistician
Ms. Hanna Frempong Konadu, Formatting/Typesetting
Mrs. Hellen Ayitevie, Formatting/Typesetting
Ms. Dieudonnee Ankamah, Formatting/Typesetting
Writers
Nashiru Iddisah
Delali Arnold Kofi Mordegli
Consultant
Mrs. Edith Mote
Editor/ Reviewers
Mr. Adams Kasanga
Mr. Godwin Odei Gyebi
Mrs. Jane Acolatse