ada.org: dental medicaid - 2012 - american dental association
TRANSCRIPT

Dental Medicaid - 2012 Thomas P. Wall, MA, MBA
Dental Health Policy Analysis Series

ii
Dental Medicaid - 2012
© 2012 American Dental Association. All rights reserved. ISBN: 978-1-60122-165-0
DENTAL HEALTH POLICY ANALYSIS SERIES
Suggested Citation: Wall TP. Dental Medicaid - 2012. Dental Health Policy Analysis Series. Chicago: American Dental Association, Health Policy Resources Center; 2012.

iii
Table of Contents Introduction ............................................................................................................... 1
Background ............................................................................................................... 2
Where do Children Covered by Medicaid Receive Dental Services? ................. 3
What Methods Are Most Effective to Increase Utilization? .................................. 3
MEDICAID DENTAL PROGRAMS IMPLEMENTED WITH COMMERCIAL DENTAL PLANS .................................................................................................................. 4
MICHIGAN – HEALTHY KIDS ................................................................................... 5
A NATIONAL STUDY .............................................................................................. 5
THE RECENT ECONOMIC DOWNTURN .................................................................... 6
GLOBAL VERSUS SELECTIVE REIMBURSEMENT RATE ADJUSTMENTS ...................... 6
What Methods Are Used to Monitor the Provision of Medicaid Dental Services to Children? .............................................................................................. 6
THE ANNUAL EPSDT REPORT (FORM CMS-416) .................................................. 6
GAPS REMAIN IN CMS’ EFFORTS TO MONITOR THE PROVISION OF DENTAL SERVICES TO CHILDREN IN MEDICAID .................................................................... 7
DENTAL PERIODICITY SCHEDULES ......................................................................... 7
METHODS USED BY STATE MEDICAID PROGRAMS TO MONITOR THE PROVISION OF DENTAL SERVICES TO CHILDREN ...................................................................... 8
WHAT IS THE TARGET DENTAL CARE UTILIZATION RATE AMONG CHILDREN COVERED BY MEDICAID? ...................................................................................... 8
WHAT IS THE GOAL—INCREASED UTILIZATION OF DENTAL SERVICES OR
IMPROVEMENTS IN ORAL HEALTH? ........................................................................ 9
What is Known About Dentist Participation in the Medicaid Program? ........... 10
A RECENT CMS REPORT .................................................................................... 10
INSURE KIDS NOW WEB SITE .............................................................................. 10
What is the Impact of Reimbursement Rates on State Medicaid Dental Expenditures? ......................................................................................................... 10
The Delivery of Dental Services through Managed Care Organizations (MCO) ....................................................................................................................... 12
Non-Dentist Providers of Oral Health Services to Children Covered by Medicaid .................................................................................................................. 13
REIMBURSING MEDICAL PROVIDERS FOR PREVENTIVE ORAL HEALTH SERVICES ... 13
NEW DENTAL WORKFORCE MODELS ................................................................... 13

iv
What Barriers Continue to Hinder State Initiatives to Improve Access to Medicaid Dental Services? .................................................................................... 13
Future Directions .................................................................................................... 14
UTILIZATION OF DENTAL SERVICES AMONG MEDICAID BENEFICIARIES & PROVIDER PARTICIPATION IN MEDICAID PROGRAMS ............................................. 14
MONITORING THE ORAL HEALTH OF MEDICAID CHILDREN ..................................... 14
MANAGED CARE ORGANIZATIONS ........................................................................ 14
MEDICAID EXPENDITURES ................................................................................... 15
MEDICAID ENROLLMENT AND THE AFFORDABLE CARE ACT ................................... 15
CMS ORAL HEALTH STRATEGY ........................................................................... 16
BREAKING DOWN BARRIERS TO ORAL HEALTH FOR ALL AMERICANS ..................... 16
Appendix 1: Children’s Health Insurance Program (CHIP) ................................ 17
A NATIONAL STUDY ............................................................................................ 17
MEDICAID & CHIP – EXPANDING ELIGIBILITY & REDUCING REIMBURSEMENT ......... 17
Appendix 2: Medicaid Dental Programs for Adults ............................................ 19
THE RECENT ECONOMIC TURNDOWN .................................................................. 19
THE CONSEQUENCES OF ELIMINATING MEDICAID DENTAL BENEFITS FOR ADULTS .............................................................................................................. 19
THE AFFORDABLE CARE ACT (ACA) .................................................................... 19
References/Footnotes ............................................................................................ 20
v
List of Figures FIGURE 1: PERCENT OF MEDICAID CHILDREN WITH A DENTAL VISIT, 2000-2009 .............. 1 FIGURE 2: TOTAL MEDICAID & CHIP (PERSONAL HEALTH) & MEDICAID & CHIP DENTAL FUNDING, 2004-2010 (IN MILLIONS OF DOLLARS) .............................................. 15
List of Tables TABLE 1: NUMBER OF STATES CHANGING DENTAL PAYMENT RATES, FY 2011 AND FY 2012 ................................................................................................................. 6 TABLE 2: NUMBER OF STATE MEDICAID PROGRAMS EMPLOYING CERTAIN METHODS TO MONITOR THE PROVISION OF MEDICAID DENTAL SERVICES TO CHILDREN .................... 8 TABLE 3: CHANGES IN DENTAL PAYMENTS AND USERS IN SELECTED REFORM STATES, THROUGH FEDERAL FISCAL YEAR 2004 ........................................................... 11 TABLE 4: BARRIERS THAT HINDER STATE INITIATIVES TO IMPROVE ACCESS TO MEDICAID DENTAL SERVICES ........................................................................................ 13

1
Dental Medicaid - 2012 Introduction
Medicaid is the primary source of dental coverage for children in low-income families. Although it accounts for a small percentage of total Medicaid spending, the funding of Medicaid dental programs grew rapidly during the past 20 years. Between 1990 and 2010, Medicaid dental expenditures grew from $756.1 million to $7.4 billion, or from 2.4 percent to 7.1 percent of total dental expenditures.1 During this period of time individual states used a variety of approaches to expand the delivery of dental services to low-income children. According to a recent CMS (Centers for Medicare & Medicaid Services) report:
“Data collected by CMS show a clear record of improved children’s access to dental care in Medicaid/CHIP. Approximately 40 percent of children in Medicaid received a dental service in 2009, reflecting a nearly 50 percent increase over the 27 percent of children who received a dental service in 2000. These improvements in access occurred during a time period when the number of children enrolled in Medicaid/CHIP and eligible for EPSDT grew from 23.5 million to 33.8 million.” 2
Figure 1: Percent of Medicaid Children with a Dental Visit, 2000-2009
27.0% 26.6% 27.9%30.4% 31.5% 32.7% 32.8% 34.3%
36.2%39.9%
0%
5%
10%
15%
20%
25%
30%
35%
40%
45%
2000 2001 2002 2003 2004 2005 2006 2007 2008 2009
However, clouds are gathering on the horizon. As a result of the recent economic recession and anemic recovery plus the priorities of state legislators, many states are struggling to fund dental Medicaid programs. In an effort to control expenses, states have moved Medicaid dental beneficiaries into managed care programs, reduced dental reimbursement rates and reduced or eliminated dental benefits for adults. Through the Affordable Care Act – the health care reform law enacted in 2010 – at least 5.3 million more children will gain dental coverage by 2014.3 Most of them will

2
enter Medicaid or Children’s Health Insurance Program (CHIP) programs that already have difficulty ensuring care to their enrollees. This may be a good time to look back at what was accomplished in Medicaid dental programs prior to the recent recession. The approach taken in this paper will be to (1) identity and examine several key Medicaid dental policy questions/issues; (2) to determine which questions/issues have been answered; and (3) to identify questions or issues where further work is needed. The focus of this paper is on several key questions/issues related to dental Medicaid programs for children:
Where do children covered by Medicaid receive dental services?
What methods are most effective to increase utilization?
What methods are used to monitor the provision of Medicaid dental services to children?
What is known about dentist participation in the Medicaid program?
What is the impact of reimbursement rates on state Medicaid dental expenditures?
The delivery of dental services to Medicaid children through managed care organizations.
Non-dentist providers of dental services.
What barriers continue to hinder state initiatives to improve access to Medicaid dental services?
The discussion focuses on the literature related to these issues, published after 2000. However, as needed, earlier studies are used to shed light on a particular question/issue. Areas where research is lacking are also identified. This report concludes with sections devoted to the CHIP program and Medicaid dental programs for adults. This study is an extension of earlier work. In 2003, the American Dental Association’s Health Policy Resources Center published a report entitled, “Medicaid and Dental Care for Children: A Review of the Literature.”4 In that report, the authors described the broader social context of Medicaid and CHIP programs, reviewed the historical development of public programs focused on the provision of dental care to underserved children, and examined the dental Medicaid program, focusing on the literature related to dentist participation and the utilization of dental services among Medicaid beneficiaries. According to the authors, the material contained within the report was current as of 1999-2000.
Background
The Medicaid program, established as Title XIX of the Social Security Amendments of 1965, was designed to provide health care for all indigent and medically indigent people, with funding shared between federal and state governments. Although

3
states differ in eligibility rules and expenditures for services provided, amendments to the Medicaid program instituted in 1968 required all states to include dental care for individuals younger than 21 years of age as part of the Early and Periodic, Screening, Diagnostic, and Treatment Service (EPSDT). In 1996, the Department of Health and Human Services (DHHS) Office of the Inspector General released a report that examined access to and utilization of dental services among children covered by Medicaid.5 According to the report, less than 1 in 5 covered children received any preventive dental services and dentist participation was too low to assure access. This report received widespread circulation and is largely credited with spurring subsequent efforts at the federal and state level to improve access to EPSDT dental services. Legislation passed by Congress in 1997 created the State Children’s Health Insurance Program (SCHIP). SCHIP is also a joint federal and state program and complements the Medicaid program by providing health insurance to children whose family income is low, but not low enough to qualify for Medicaid. Coverage of dental services under the SCHIP program is discussed in Appendix 1.
Where do Children Covered by Medicaid Receive Dental Services?
In a study of the dental safety net in Connecticut, Beazoglou et al (2005) reported that 69 percent of children enrolled in Medicaid who obtained dental care did so in private offices.6 A second national study defined the underserved population as 82.5 million poor, near poor and low-income persons based on relatively low dental care utilization rates.7 Although underserved, 27.8 percent of this population - 22 million persons - reported a dental visit in 2000. The authors estimated that the dental safety net (dental clinics in community health centers, hospitals, public schools and dental schools) provided care to 7.4 million patients annually. This suggested that 60 to 70 percent of the underserved who obtained care must have done so in private dental offices. Even with an expanded safety net, the authors concluded that the majority of low-income patients who are able to obtain dental services would continue to receive these services in private practices. Thus, a long-term reduction in access to care and oral health disparities will depend on participation by the private practice community in caring for the underserved.
What Methods Are Most Effective to Increase Utilization?
In the late 1990s and early 2000s, a number of states took steps to improve access to dental care among Medicaid beneficiaries. Alabama, Michigan, South Carolina, Tennessee, Virginia and Washington employed a variety of approaches to address access concerns: they raised reimbursement rates, revamped administrative structures and processes, and conducted outreach and education to both providers and patients. A recent study8 focused on efforts in these states and included interviews with 26 key informants to answer the question: what effect does raising Medicaid reimbursement rates have on access to dental care?

4
Key findings from the study include:
Rate increases are necessary – but not sufficient on their own – to improve access to dental care. Easing administrative burdens and involving state dental societies and individual dentists as active partners are also crucial.
Rates need to at least cover the cost of providing the service, which is estimated to be 60 to 65 percent of dentists’ charges.
Working with patients and their families about how to use dental services is a core element of reforms.
In the six states examined, provider participation increased by at least one-third, and sometimes more than doubled, following rate increases.
Patients’ access to care, as measured by the percentage of enrollees using dental services, also increased after rates rose. Despite meaningful gains, the portion of Medicaid children receiving services was below the level of privately insured children.
MEDICAID DENTAL PROGRAMS IMPLEMENTED WITH COMMERCIAL DENTAL PLANS Innovative programs implemented for Medicaid and low-income beneficiaries in Michigan and Western Pennsylvania have engaged commercial dental plans with adequate networks and devoted funding levels that allowed purchasing of dental services at competitive market rates.9,10 Analyses of these programs by university-based experts have demonstrated significant successes in relatively short time periods. These model programs have demonstrated substantial increases in individuals with a regular source of care, reductions in unmet treatment needs, increases in provider participation and geographic access, utilization patterns that stabilized per-enrollee costs, and high degrees of provider and enrollee satisfaction.

5
MICHIGAN – HEALTHY KIDS In 2000, the State of Michigan enrolled all Medicaid eligible children from 22 rural counties (increased to 61 counties in subsequent years) in a Delta Dental of Michigan plan called Healthy Kids Dental (HKD). Delta set fees for HKD children the same as for privately insured patients and used the same administrative procedures for filing claims, utilization review and paying dentists. There were no out-of-pocket expenses for Medicaid members or a yearly maximum. Dental fees were increased annually to keep up with inflation. An article published in 2003, included an assessment of the first 12 months of HKD.9 The authors reported that dental care utilization increased 31.4 percent overall and 39 percent among children continuously enrolled for 12 months, compared with the previous year under Medicaid. Dentists’ participation increased substantially, and the distance traveled by patients was cut in half. Costs were 2.5 times higher, attributed to more children receiving care, the mix of services shifting to more comprehensive care and payment at customary reimbursement levels. In five years (2005), HKD utilization rates for those enrolled for 12 months increased to 53 percent, compared to the traditional Medicaid program (35 percent), but they were not as high as the privately insured (64 percent).11 Since 2005, utilization rates continued to grow slowly each year. The number of participating dentists increased 24.7 percent, and the average travel distance to the dentist decreased almost 20 percent. Finally there was no increase in the number of area dentists, so the existing dental workforce was able to provide care to another 100,000 children (200,000 eligible). In order to expand the number of Healthy Kids Dental counties, in 2008 the state adopted Delta’s fixed PPO reimbursement schedule, which was lower than the company’s Premier rate.8 Even with the switch providers still received fees that are higher than fee-for-service Medicaid. However, the Michigan Dental Association (MDA) reported that there was a 14 percent drop in participation associated with the change in plans. Some providers ended participation because they believed that the program was going backward; others misunderstood the nature of the shift, and thought that they would be newly responsible for serving fee-for-service Medicaid patients. Since the change, the MDA has worked to educate providers about what the switch entails.
A NATIONAL STUDY A study by Decker (2011), based on all fifty states, reported that changes in state Medicaid dental payment fees between 2000 and 2008 were positively associated with the use of dental care among children and adolescents covered by Medicaid.12 For example, a $10 increase in the Medicaid prophylaxis payment level (from $20 to $30) was associated with a 3.92 percentage point increase in the likelihood that a child or adolescent covered by Medicaid had seen a dentist.

6
THE RECENT ECONOMIC DOWNTURN Before the recent economic downturn, a number of states increased reimbursement rates for dentists in an effort to encourage broader participation of dentists in publicly funded programs and increase access to care. However, as states began to look for ways to address budget shortfalls, many made cuts to dental reimbursement rates. Fiscal pressures resulted in 11 states with cuts to dental rates in fiscal year (FY) 2011 and 13 states that adopted cuts in 2012.13 Only four states reported increases in dental rates for FY 2011 and three states planned increases for FY 2012. The focus, at least in the near future, may shift to how dentists react to decreases in reimbursement in Medicaid dental programs.
Table 1: Number of States Changing Dental Payment Rates, FY 2011 and FY 2012
Fiscal Year 2011 Fiscal Year 2012
Increase Decrease Increase Decrease
Dentists 4 11 3 13
GLOBAL VERSUS SELECTIVE REIMBURSEMENT RATE ADJUSTMENTS Many states reimburse at higher relative rates for selected procedures or categories of services (e.g., diagnostic and preventive services) within their Medicaid fee schedules. This well-intended strategy provides additional economic incentives for dentists or other providers to deliver these services and may increase crude access statistics. However, this strategy generally provides inadequate incentives for dentists to provide the full scope of services required by Medicaid enrolled children (e.g., restorative treatment for decayed teeth) since procedures that are more technically demanding and often require advanced behavior management approaches to achieve a child’s cooperation are reimbursed at relatively lower rates. In effect, the program may end up allocating most of its resources for diagnostic and preventive services while the restorative and surgical treatment needs of large numbers of children remain unmet.14
What Methods Are Used to Monitor the Provision of Medicaid Dental Services to Children?
THE ANNUAL EPSDT REPORT (FORM CMS-416) Form 416 is the primary tool used by the Center for Medicare & Medicaid Services (CMS) for overseeing the provision of dental services to children in state Medicaid programs. CMS initially required states to provide only one type of dental-related data: the annual number dental assessments provided to children enrolled in Medicaid. In 1999, Form 416 was expanded to capture, by age group, the total number of eligible children: Receiving any dental service. Receiving any preventive dental service. Receiving dental treatment services.
The revised Form-416 also linked the reporting of dental services to the American Dental Association’s Current Dental Terminology (CDT) codes.

7
The most commonly cited measure for access to dental care in Medicaid is based on the CMS Form 416.15 Dividing the total number of enrollees in the state receiving any dental service by the total number of children enrolled in Medicaid at any time during the year yields a percentage of children using dental services. This is also referred to as the “ever-enrolled” utilization rate. Some believe that Form-416 data should be adjusted to account for those children who may not be enrolled for an entire year, either by (1) counting only those children continuously enrolled for the entire year; (2) counting only those children continuously enrolled, but having a single break in eligibility of no more than 30 days (the HEDIS method); (3) counting only those children who were not enrolled in the prior year – the “new enrollee” method; (4) recording the total number of children eligible for EPSDT by calculating the portion of the reporting year that individuals were Medicaid eligible – the “Average Period of Eligibility” method; and (5) counting only those enrolled for various lengths of time (e.g., 10 months, 9 months, etc.). Others have suggested age adjustment (e.g., excluding children under age one). Inclusion of children less than age one may artificially decrease utilization rates since the vast majority of infants under age one do not visit the dentist. The addition of Form-416 data on preventive and treatment services may assist stakeholders in their efforts to assess whether children are receiving appropriate levels of both types of services, or whether programs appear to be geared toward one aspect of care, perhaps at the expense of another. Beginning in 2011, Form-416 also collects: Total eligibles receiving a sealant on a permanent molar. Total eligibles receiving dental diagnostic services. Total eligibles receiving oral health services by a non-dentist. Total eligibles receiving any dental or oral health service.
GAPS REMAIN IN CMS’ EFFORTS TO MONITOR THE PROVISION OF DENTAL
SERVICES TO CHILDREN IN MEDICAID Since dental services delivered to beneficiaries enrolled in managed care programs are not reported separately from services to fee-for-service beneficiaries, the CMS 416 data does not provide information that could be used to flag problems with a specific service delivery method. Further, it is not possible to determine how many children in a state received all of the recommended dental services included in the state’s periodicity schedule. Efforts to improve the CMS-416 continue.15
DENTAL PERIODICITY SCHEDULES Many State Medicaid programs have some flexibility in determining the frequency and timing of dental screenings covered for children under the EPSDT benefit. Under federal law, however, state Medicaid programs must provide these dental services at intervals that meet reasonable standards of dental practice as determined by the state after consultation with recognized dental organizations involved in children’s health care. According to CMS guidance, as an alternative to developing a state-specific periodicity schedule, a state may adopt a nationally recognized dental periodicity standard, such as the schedule recommended by the American Academy of Pediatric Dentistry (AAPD).16 CMS considers AAPD’s periodicity schedule a

8
model for comparison and it is published in CMS’s Guide to Children’s Dental Care in Medicaid.17
METHODS USED BY STATE MEDICAID PROGRAMS TO MONITOR THE PROVISION OF
DENTAL SERVICES TO CHILDREN A 2008/09 survey of state Medicaid directors indicated that various methods were used to monitor the provision of dental services to children.18
Table 2: Number of State Medicaid Programs Employing Certain Methods to Monitor the Provision of Medicaid Dental Services to Children
Monitoring Method Number of States
(51 States) Track utilization by collecting CMS 416 data 50 Use claims data and/or encounter data provided by managed care organizations
23
Collect and analyze data from phone calls to the state or managed care organizations regarding concerns with dental care
16
Collect and analyze data from beneficiary satisfaction surveys
16
Use survey data to monitor problems obtaining needed dental services
11
Use survey data to monitor the oral health of children 7 Other monitoring methods* 19
Note: States could select more than one monitoring method. * States reported using other methods including generating ad hoc reports on various dental procedures and analyzing monthly budget reports by procedure code to monitor utilization trends.
WHAT IS THE TARGET DENTAL CARE UTILIZATION RATE AMONG CHILDREN
COVERED BY MEDICAID?
Uninsured According to the behavioral model of access to medical care, health insurance status is an “enabling factor” that influences one’s ability to acquire health care services.19 According to this view, it would be instructive to compare children covered by Medicaid to those who are uninsured.
Middle Income Children Although he admits that there is no easy answer to this question, Bailit (2006) argued that if the poor, near poor and low-income groups had the same utilization rates as middle-income families, disparities in access would be greatly reduced.7
Healthy People 2020 Another option is to use the goal set for the federal Healthy People 2020 initiative. According to the 2007 Medical Expenditure Panel Survey, 26.7 percent of children and adolescents aged 2 to 18 years in families at or below 200 percent of the federal poverty level received a preventive dental service during the past year. The Healthy People 2020 target utilization rate is 29.4 percent, which represents a 10 percent improvement.20

9
Children Covered by Private Dental Insurance To put Medicaid utilization rates in context, Borchgrevink et al (2008) pointed out that according to the 2004 Medical Expenditure Panel Survey (MEPS), 58 percent of children ages 0 to 20 with private dental insurance received dental services. According to the authors, the fact that 42 percent of these children did not receive annual dental care suggests there may be a limit to how high Medicaid utilization rates can go.8 The appropriate utilization objective for the Medicaid eligible population is important because it determines the extent and magnitude of the access problem and the strategies selected to reduce disparities.
WHAT IS THE GOAL—INCREASED UTILIZATION OF DENTAL SERVICES OR
IMPROVEMENTS IN ORAL HEALTH?
What is the Relationship Between Utilization and Oral Health? Some empirical evidence regarding the relationship is available. At the extremes of utilization rates (20 to 30 percentage points), there are major differences in oral health status. For differences of 10 percentage points or less, the difference in oral health status appears to be minimal.21
The Oral Health of Medicaid Children If the utilization of dental services can be considered as a means to the end of better oral health, why not just monitor the oral health of Medicaid children? According to a 2008 GAO report, compared to children with private dental insurance, children in Medicaid were almost twice as likely to have untreated tooth decay.22 These results were based on National Health and Nutrition Examination Survey (NHANES) data from 1999 to 2004. Data from the NHANES did show some improvement for children in more recent surveys. For example, comparison of NHANES survey data from 1988 through 1994 to more recent data from 1999 through 2004 showed that the percentage of children aged 6 to 18 in Medicaid with at least one dental sealant increased nearly threefold, from 10 percent to 28 percent. As for the percent of Medicaid children with untreated caries, none of the changes from the 1988 through 1994 period to the 1999 through 2004 period was found to be statistically significant. State-level estimates are not available from the NHANES. Some state-level data on the oral health of children is available from the National Oral Health Surveillance System:23
Percentage of 3rd grade students with caries experience, including treated and untreated tooth decay.
Percentage of 3rd grade students with untreated tooth decay.
Percentage of 3rd grade students with dental sealants on at least one
permanent molar tooth.

10
What is Known About Dentist Participation in the Medicaid Program?
While comprehensive nation-wide data on dentist participation in Medicaid do not exist, available data suggest that problems with low participation in Medicaid persist. Additionally, among dentists who do participate in Medicaid, many may place limits on the number of Medicaid patients that they will treat. The Association of State and Territorial Dental Directors conducts an annual survey that collects information about the dental workforce in each state, including questions regarding dentist participation in public dental programs.24 The survey is sent to the dental directors in all states and the District of Columbia. In 2009, 45 states responded. Most states responding to the 2009 survey reported low participation among dentists, although not all states responded completely. A GAO analysis of these data showed that 25 of 39 states reported that fewer than half of the dentists in their states treated any Medicaid patients during the previous year.25 Only one of 41 states reported that more than half of the state’s dentists saw 100 or more Medicaid patients during the previous year.
A RECENT CMS REPORT A recent CMS report concluded that from 2000 to 2009, the increase in the percentage of children in Medicaid receiving a dental service (27 percent to 40 percent) during a period of enrollment growth (23.5 million to 33.8 million) indicated that dental provider capacity serving children expanded.2
INSURE KIDS NOW WEB SITE
To help families locate dentists who treat children in Medicaid or CHIP, the Children’s Health Insurance Program Reauthorization Act of 2009 (CHIPRA) required the US Department of Health and Human Services (HHS) to post information on participating dentists on its Insure Kids Now Web site. The Web site is designed to allow families with a child in Medicaid or CHIP to find dentists close to where they live. Information about the dentist includes practice address and phone number, whether the dentist is accepting new Medicaid or CHIP patients and whether the practice can accommodate children with special needs.26 A 2010 GAO report found cases in which information posted on the Insure Kids Now Web site was not complete, not usable, or not accurate.25 In August 2010, officials from CMS – the agency within HHS responsible for implementation and that established the data elements that states should provide – described the Web site as a “work in progress” and reported that they are continually improving the site.
What is the Impact of Reimbursement Rates on State Medicaid Dental Expenditures?
What is the impact on state Medicaid budgets of increases in Medicaid dental reimbursement and increases in utilization? As mentioned above, for Michigan’s HKD program, an assessment of the first 12 months of the program concluded that costs were 2.5 times higher, attributed to more children receiving care, the mix of

11
services shifting to more comprehensive care and payment at customary reimbursement levels.9 In September 2008, as the result of a lawsuit, the Connecticut Medicaid program increased children’s dental fees to the 70th percentile of 2005 market fees. The state estimated that the higher fees would increase Medicaid expenditures by $20 million in 12 months. Instead, in just two months, expenditures increased by $26 million. It was estimated that if the increase in utilization continued, the state would spend an additional $256 million for the first year of the program.27 One report looked at the impact of programs designed to increase utilization of dental services on Medicaid budgets in three states.8 In Tennessee, for example, the number of users of dental services more than doubled, and the payments per user also more than doubled. Combined, this meant an increase in total state spending of more than 350 percent (see Table 3). The report concluded that increases in state spending were generally in proportion to increases in utilization. Table 3: Changes in Dental Payments and Users in Selected Reform States, Through Federal Fiscal Year 2004
Year of Reform Percent
Change 2000 2004
ALABAMA
Number of Enrollees Using Services 72,287 155,541 115%Total Dental Payments $11,465,011 $44,449,030 288%Payment Per User $159 $286 80%
SOUTH CAROLINA
Number of Enrollees Using Services 162,567 256,782 58%Total Dental Payments $48,151,459 $89,304,420 85%Payment Per User $296 $348 18%
TENNESSEE
Number of Enrollees Using Services 131,899 286,314 117%Total Dental Payments $28,660,471 $130,660,471 355%Payment Per User $217 $455 110%
The following analysis is drawn from the work of Drs. James Crall and Burton Edelstein for the Children’s Fund of Connecticut, Inc. and the Connecticut Health Foundation.14 The authors note that the following will likely apply, particularly in states where Medicaid reimbursement rates vary considerably from current market rates.
Improvements will cost more – developing and sustaining an effective, market-based dental care system for the underserved may require the commitment of considerably more financial resources than may be currently allocated.
12
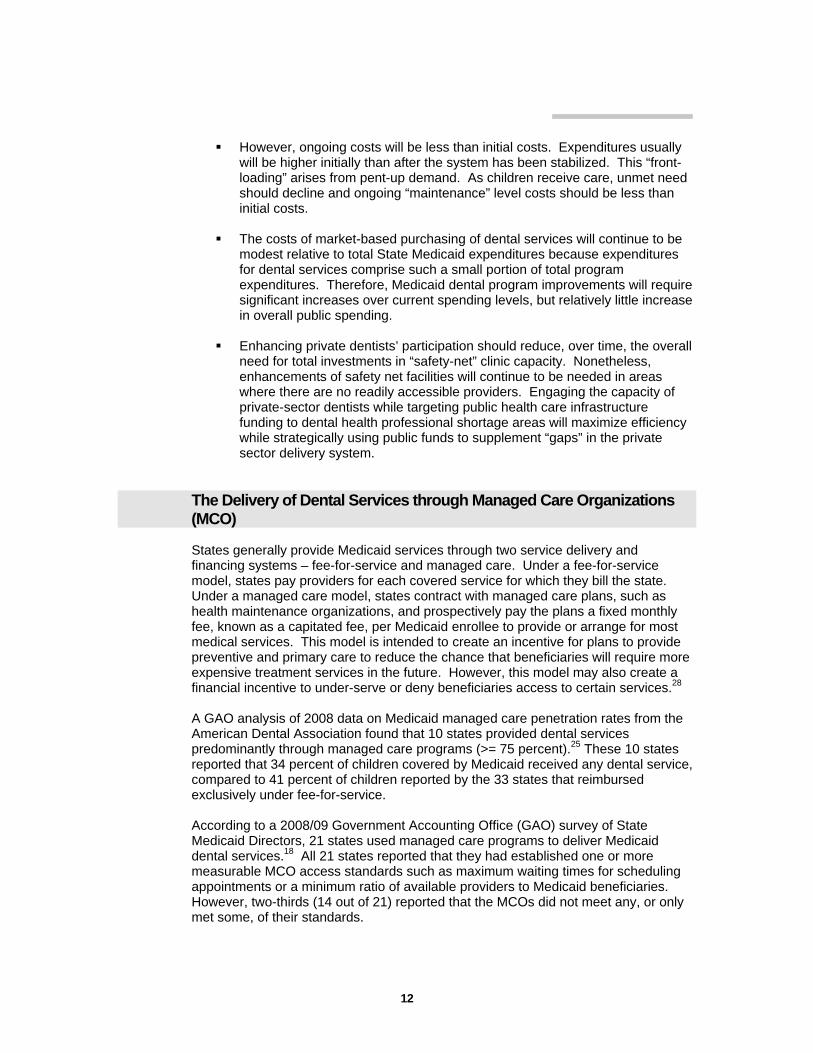
However, ongoing costs will be less than initial costs. Expenditures usually will be higher initially than after the system has been stabilized. This “front-loading” arises from pent-up demand. As children receive care, unmet need should decline and ongoing “maintenance” level costs should be less than initial costs.
The costs of market-based purchasing of dental services will continue to be
modest relative to total State Medicaid expenditures because expenditures for dental services comprise such a small portion of total program expenditures. Therefore, Medicaid dental program improvements will require significant increases over current spending levels, but relatively little increase in overall public spending.
Enhancing private dentists’ participation should reduce, over time, the overall
need for total investments in “safety-net” clinic capacity. Nonetheless, enhancements of safety net facilities will continue to be needed in areas where there are no readily accessible providers. Engaging the capacity of private-sector dentists while targeting public health care infrastructure funding to dental health professional shortage areas will maximize efficiency while strategically using public funds to supplement “gaps” in the private sector delivery system.
The Delivery of Dental Services through Managed Care Organizations (MCO)
States generally provide Medicaid services through two service delivery and financing systems – fee-for-service and managed care. Under a fee-for-service model, states pay providers for each covered service for which they bill the state. Under a managed care model, states contract with managed care plans, such as health maintenance organizations, and prospectively pay the plans a fixed monthly fee, known as a capitated fee, per Medicaid enrollee to provide or arrange for most medical services. This model is intended to create an incentive for plans to provide preventive and primary care to reduce the chance that beneficiaries will require more expensive treatment services in the future. However, this model may also create a financial incentive to under-serve or deny beneficiaries access to certain services.28 A GAO analysis of 2008 data on Medicaid managed care penetration rates from the American Dental Association found that 10 states provided dental services predominantly through managed care programs (>= 75 percent).25 These 10 states reported that 34 percent of children covered by Medicaid received any dental service, compared to 41 percent of children reported by the 33 states that reimbursed exclusively under fee-for-service. According to a 2008/09 Government Accounting Office (GAO) survey of State Medicaid Directors, 21 states used managed care programs to deliver Medicaid dental services.18 All 21 states reported that they had established one or more measurable MCO access standards such as maximum waiting times for scheduling appointments or a minimum ratio of available providers to Medicaid beneficiaries. However, two-thirds (14 out of 21) reported that the MCOs did not meet any, or only met some, of their standards.
13
Non-Dentist Providers of Oral Health Services to Children Covered by Medicaid
REIMBURSING MEDICAL PROVIDERS FOR PREVENTIVE ORAL HEALTH SERVICES
Preventive oral health care is particularly important for young children at high risk for dental disease because the presence of cavity-causing bacteria can quickly progress into extensive decay known as Early Childhood Caries (ECC) or baby bottle tooth decay. Since children typically see primary care medical providers earlier and more regularly than they see dentists, thirty-five state Medicaid agencies are working to increase children’s access to preventive oral health services by reimbursing primary care medical providers for services such as fluoride varnish application, an oral exam or screening, oral health risk assessment, and /or caregiver education.29 A study of five states that provide such reimbursement showed diversity in terms of the design and implementation of such a program. Among the issues considered were: (1) what preventive services are covered, (2) procedure codes (medical vs. dental), (3) payment rates, (4) eligible providers, and (5) patient age or service frequency limits.
NEW DENTAL WORKFORCE MODELS
This topic is beyond the scope of this report, however, two ADA papers, Breaking Down Barriers to Oral Health for All Americans: The Role of Workforce (February 2011) and Breaking Down Barriers to Oral Health for All Americans: Repairing the Tattered Safety Net (August, 2011) explore this issue.30,31
What Barriers Continue to Hinder State Initiatives to Improve Access to Medicaid Dental Services?
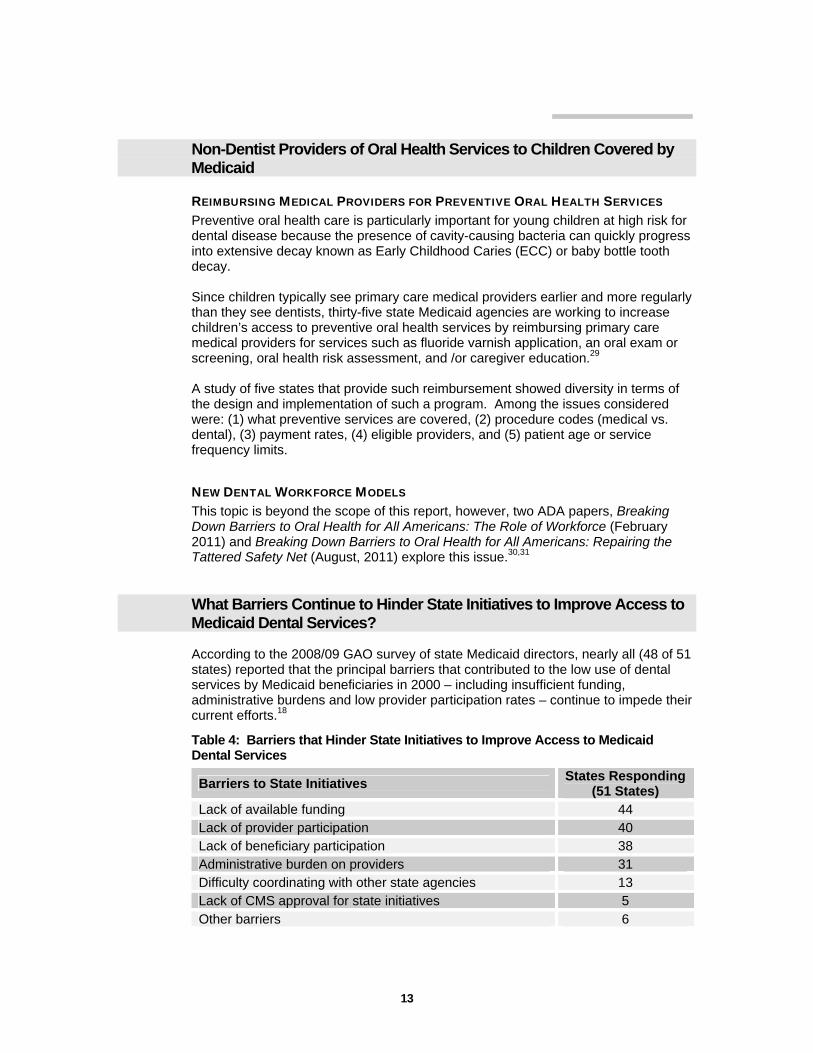
According to the 2008/09 GAO survey of state Medicaid directors, nearly all (48 of 51 states) reported that the principal barriers that contributed to the low use of dental services by Medicaid beneficiaries in 2000 – including insufficient funding, administrative burdens and low provider participation rates – continue to impede their current efforts.18
Table 4: Barriers that Hinder State Initiatives to Improve Access to Medicaid Dental Services
Barriers to State Initiatives States Responding
(51 States) Lack of available funding 44 Lack of provider participation 40 Lack of beneficiary participation 38 Administrative burden on providers 31 Difficulty coordinating with other state agencies 13 Lack of CMS approval for state initiatives 5 Other barriers 6
14
When asked to describe the extent to which state goals were being met, some states reported that successes in increasing the numbers of providers enrolled in the Medicaid program have resulted in increasing rates of utilization by children, but more needs to be done. States also described other challenges to meeting their goals and improving children’s access to dental care, such as fluctuations in eligibility for services, lack of beneficiary compliance, low oral health awareness among beneficiaries, and a lack of demand for routine dental care by beneficiaries.
Future Directions
UTILIZATION OF DENTAL SERVICES AMONG MEDICAID BENEFICIARIES & PROVIDER
PARTICIPATION IN MEDICAID PROGRAMS
Although individual state inconsistencies remain, improvements to CMS Form 416 have resulted in more accurate measures of the utilization of dental services among Medicaid children. It is worth noting that, in most states, these improvements occurred over a period of several years. As mentioned above, CHIPRA (2009) requires HHS/CMS to post information about provider participation on the Insure Kids Now Web site. HHS/CMS is working with the states to improve the completeness, usability and accuracy of the information. Collaboration between state dental Medicaid departments and their respective state dental association could improve this resource. Because of the important role that private practice dentists play in the delivery of oral health care services to Medicaid children, this is an issue that needs to be addressed.
MONITORING THE ORAL HEALTH OF MEDICAID CHILDREN
The ultimate objective of Medicaid dental programs is clearly improvement in the oral health of Medicaid beneficiaries. Researchers are beginning to look at the link between the utilization of dental services and oral health. Higher levels of utilization among Medicaid children should result in improved oral health. However, the results of national-level studies are mixed. This is not surprising considering that only a few states have made efforts to improve Medicaid dental programs and document changes related to those efforts. State-level measures of oral health are needed to provide a clearer picture than is possible with national data. Although state-level oral health outcome measures may be required to demonstrate the effectiveness of Medicaid dental programs, the other measures discussed in this paper will continue to be important. For example, those states that cannot demonstrate improvements in oral health will want to know why and where they should focus their attention. The continued monitoring of utilization and provider participation will help to identify underlying problems and design effective interventions.
MANAGED CARE ORGANIZATIONS As pressures to control costs increase, more states can be expected to use managed care organizations to deliver oral health services to Medicaid children. These organizations need to be closely monitored to ensure that the goal of reducing costs does not result in a reduction of dental services offered.

15
MEDICAID EXPENDITURES
Figure 2 shows changes in the levels of total Medicaid & CHIP expenditures and Medicaid & CHIP dental expenditures from 2004 to 2010.1 Although Medicaid & CHIP dental expenditures make up a very small portion of total Medicaid & CHIP expenditures, the percentage in 2010 was 2.2 percent, up from 1.6 percent in 2004.
Figure 2: Total Medicaid & CHIP (Personal Health) & Medicaid & CHIP Dental Funding, 2004-2010 (in millions of dollars)
$325,749$355,449
$277,031
$309,738
$381,548
$290,528$294,164
$4,322 $4,611 $4,775 $5,227$6,174
$7,503$8,486
$0$50,000
$100,000$150,000$200,000$250,000$300,000$350,000$400,000$450,000
2004 2005 2006 2007 2008 2009 2010
$0
$2,000
$4,000
$6,000
$8,000
$10,000
$12,000
Total Medicaid & CHIP Medicaid & CHIP Dental
Part of the increase in Medicaid expenditures shown in Figure 2 was related to an increase in the U.S. population from 292.9 million in 2004 to 308.7 million in 2010. However, it is also necessary to consider the impact of the economic recession that began in December, 2007.
MEDICAID ENROLLMENT AND THE AFFORDABLE CARE ACT
Unemployment increased as the economy moved into recession. Enrollment in public programs increased due to the loss of employment-based health insurance among the unemployed and those moving from full-time to part-time employment.
The American Recovery and Reinvestment Act (2009) required states to maintain their Medicaid eligibility rules and enrollment procedures as a condition of receiving a significant, temporary increase in the federal Medicaid matching rate (see below).
The Affordable Care Act (ACA) also included a maintenance-of-effort
requirement designed to keep Medicaid coverage steady for adults until broader reform goes into effect in 2014 and for children until 2019, as well as extending those protections to children covered by CHIP.
Both CHIPRA (2009) and the ACA (2010) also included provisions to
improve outreach and enrollment for Medicaid and CHIP among children who are eligible but not yet enrolled in either of the programs.

16
Through the ACA, at least 5.3 million more children are expected to gain dental coverage by 2014.
CMS ORAL HEALTH STRATEGY To sustain the progress already achieved and to accelerate further improvements in access to oral health services, CMS has developed a national oral health strategy.32 The strategy centers on the establishment of new state and national oral health goals and the development of state-specific action plans to increase use of preventive services for children. Two goals were announced in 2010:
To increase the rate of children ages 1-20 enrolled in Medicaid or CHIP who receive any preventive dental service by 10 percentage points over a 5-year period; and
To increase the rate of children ages 6-9 enrolled in Medicaid or CHIP who
receive a dental sealant on a permanent tooth by 10 percentage points over a 5-year period.
Although these are national goals, progress will be tracked nationally and by state, with the intent that corresponding state-specific goals will drive the achievement of the national goals. The strategy is comprised of five key components:
Working with States to develop oral health action plans. Strengthening technical assistance to States and Tribes. Improving outreach to providers. Improving outreach to beneficiaries. Partnering with other governmental agencies.
BREAKING DOWN BARRIERS TO ORAL HEALTH FOR ALL AMERICANS According to a recent ADA report a comprehensive, coordinated approach for health education and promotion, care coordination and effective prevention is critical to improving the oral health of the underserved.31 Success will hinge on the following fundamental principles:
Prevention is essential. Everyone deserves a dentist. Availability of care alone will not maximize utilization. Coordination is critical. Treating the existing disease without educating the patient is a wasted
opportunity, making it likely that the disease will recur. Public-private collaboration works. Silence is the enemy.

17
Appendix 1: Children’s Health Insurance Program (CHIP)33
CHIP expanded health coverage to children - approximately 7.7 million children in fiscal year 2009 – whose families have incomes that are low, but not low enough to qualify for Medicaid.25 States can administer their CHIP programs as (1) an expansion of their Medicaid program; (2) a stand-alone program; or (3) a combination of Medicaid expansion and stand-alone. Although states have flexibility in establishing their CHIP benefit package, all states covered some dental services in 2009, though benefits varied. Children in CHIP programs that are administered as expansions of Medicaid programs are entitled to the same dental services under the EPSDT benefit as children in Medicaid. The Children’s Health Insurance Program Reauthorization Act of 2009 (CHIPRA) expanded federal requirements for state CHIP programs to cover dental services. Specifically, CHIPRA requires states to cover dental services in their CHIP programs beginning in October 2009 and gave states authority to use benchmark plans to define the benefit package to supplement children’s private health insurance with a dental coverage plan financed through CHIP. Data on the provision of dental services to children covered by CHIP are limited. However, beginning in fiscal year 2010, CHIPRA requires states to include information on CHIP dental services of the type contained in CMS Form 416 for children covered by Medicaid and further required the inclusion of information on the provision of CHIP dental services in managed care programs.25
A NATIONAL STUDY A study based on a national dataset looked at trends in public dental expenditures and dental visits among children in the U.S. from 1996 to 2004.34 Among the results reported were that funding for SCHIP and SCHIP expansion grew from $0 prior to 1998 to $517 million in 2004. Between 1996 and 2004, there was an increase in the number and percent of children 2 to 20 years of age who reported a dental visit during the past year. These increases were most notable among children in the 100% to 200% FPL (federal poverty level) category. These are the children targeted by SCHIP. The percent with a dental visit grew from 32.4 percent to 37.0 percent and approximately 900,000 more children in this income group visited the dentist in 2003-04 than 1996-97.
MEDICAID & CHIP – EXPANDING ELIGIBILITY & REDUCING REIMBURSEMENT The authors of a recent annual report on Medicaid and CHIP point to the significant progress that has been made in expanding Medicaid eligibility, with most gains benefiting children.35 According to the report, almost all states now cover children in families with incomes above 200 percent of the federal poverty level. The report points out that in 2010, in spite of the country’s continuing economic problems, nearly all states “held steady” in terms of playing a central role in providing coverage to millions of people who would otherwise lack affordable coverage options. Thirteen states expanded eligibility during 2010. The authors attribute the stability in public programs to the government’s decision both to provide temporary Medicaid fiscal relief to states through June 2011, and to require states to maintain their Medicaid and CHIP eligibility rules and enrollment procedures until broader health reform goes into effect. Also mentioned is the expected broad expansion of the Medicaid program due to provisions of the Affordable Care Act (ACA).

18
On the negative side, due to continuing budget pressures, states also made other changes such increased use of managed care and cuts to provider reimbursement rates and benefits to reduce Medicaid spending growth in 2010.

19
Appendix 2: Medicaid Dental Programs for Adults
While state Medicaid programs are required by federal rules to cover comprehensive dental services for children, coverage for adult dental services is optional. According to a 2010 report, twenty-two states provided no dental coverage for adults or limited that coverage to emergency or trauma services only.36 In other states services may be limited to one examination and cleaning per year, or a cap may be placed on the dollar amount of services that will be covered in a given year. Most states also set income limits for eligibility at a much lower level for adults than for children. Among elderly Americans, traditional Medicare is not a source of dental insurance. It provides coverage for only extremely limited hospital-based oral surgeries required in conjunction with other treatments. Therefore, almost 70 percent of Americans age 65 and older do not have dental coverage.37
THE RECENT ECONOMIC TURNDOWN Although research has increasingly recognized the importance of dental care and coverage for overall health and well-being, adult dental benefits are often one of the first targets of Medicaid reductions. Results from a 50-State Medicaid Budget Survey for State Fiscal Years 2010 and 2011 reported that several states eliminated all or some adult dental services including Arizona, California, Hawaii and Massachusetts.38
THE CONSEQUENCES OF ELIMINATING MEDICAID DENTAL BENEFITS FOR ADULTS Several studies have looked at the consequences among those who lose benefits in states that have eliminated adult dental Medicaid benefits. These studies have reported increased out-of-pocket costs for dental care provided by dentists, the use of less appropriate treatment settings for dental problems (e.g., Hospital Emergency Departments), and ongoing pain due to untreated dental disease among those who delay treatment.39,40,41 Recent studies suggest that parent’s access to and use of dental care is an important pathway for low-income children’s access to dental care.42 For example, one study found that caregivers who had visited a dentist for preventive reasons were five times more likely to have taken their children to visit a dentist than parents who had never been to the dentist.43 More generally, research shows a linkage between family coverage and improved access to care for children.44
THE AFFORDABLE CARE ACT (ACA) The ACA does not mandate dental care for adults in Medicaid, nor is dental care likely to be included in the essential benefit packages in insurance plans sold through most states' exchanges under the provisions of the law. Thus, the ACA is not likely to dramatically improve access to dental care for adults.45
20
References/Footnotes
1. U.S. Department of Health and Human Services, Centers for Medicare & Medicaid Services. National Health Expenditure Data. Available at: https://www.cms.gov/NationalHealthExpendData/01_Overview.asp. Accessed April 4, 2012. 2. U.S. Department of Health and Human Services, Centers for Medicare & Medicaid Services. Use of dental services in Medicaid and CHIP. Centers for Medicare & Medicaid Services, September, 2011. 3. PEW Center on the States. The state of children’s dental health: making coverage matter. Available at: http://www.pewtrusts.org/our_work_report_detail.aspx?id=85899360019. Accessed April 4, 2012. 4. Coulter ID, Maida CA, Belloso R, Freed J, Petters K, Marcus M. Medicaid and dental care for children: a review of the literature. Dental Health Policy Analysis Series. Chicago: American Dental Association, Health Policy Resources Center; 2003. 5. Department of Health and Human Services. Children’s dental services under Medicaid – access and utilization. Office of the Inspector General, April 1996. 6. Beazoglou T, Heffley D, Lepowsky S, Douglass J, Lopez M, Bailit H. Dental safety net in Connecticut. JADA 2005;136(10):1457-1462. 7. Bailit H, Beazoglou T, Demby N, McFarland J, Robinson P, Weaver R. Dental safety net – current capacity and potential for expansion. JADA 2006;137(6):807-815. 8. Borchgrevink, A, Snyder A, Gehshan S. The effects of Medicaid Reimbursement rates on access to dental care. National Academy for State Health Policy, March, 2008. 9. Eklund S, Pittman J, Clark S. Michigan Medicaid’s Healthy Kids Dental Program – an assessment of the first 12 months. JADA 2003;134(11):1509-1515. 10. Lave JR, Keane CR, Lin CJ, et al. Impact of a children’s health insurance program on newly enrolled children. JAMA 1998;279(6):1820-1825. 11. Eklund SA. Michigan’s Medicaid “Healthy Kids Dental” program: assessment of the first five years. Report presented at: American Dental Association Dental Economics Advisory Group Meeting: March 1, 2007; Chicago. 12. Decker S. Medicaid payment levels to dentists and access to dental care among children and adolescents. JAMA 2011; 306(7):187-193. 13. Kaiser Commission on Medicaid and the Uninsured. Moving ahead amid fiscal challenges: A look at Medicaid spending, coverage and policy trends. Results of a 50-state Medicaid Budget for State Fiscal Years 2011 and 2012. Washington DC. October, 2011. Available at http://www.kff.org/medicaid/8248.cfm. Accessed April 4, 2012.

21
14. U.S. Department of Health and Human Services, Centers for Medicare & Medicaid Services. 2008 national dental summary. Centers for Medicare & Medicaid Services, January 2009. 15. Schneider D, Hayes K, Crall J. The CMS form-416 report, understanding its use in assessing dental care utilization in Medicaid’s early and periodic screening, diagnostic and treatment (EPSDT) service for children. National Oral Health Policy Center, April, 2005. 16. American Academy of Pediatric Dentistry. Reference Manual 2000-01. Pediatr Dent 2000;22. 17. U.S. Department of Health and Human Services. Guide to children’s dental care in Medicaid. Centers for Medicare & Medicaid Services, October 2004.
18. U.S. General Accounting Office. State and federal actions have been taken to improve children’s access to dental services, but gaps remain. GAO-09-723. Washington, DC: U.S. General Accounting Office, September, 2009. 19. Anderson RM. Revisiting the behavioral model of access to medical care: Does it matter? J Health Soc Behav 1995;36(1):1-10. 20. U.S. Department of Health and Human Services, HealthyPeople.gov. Topics & objectives index - healthy people. Available at: http://healthypeople.gov/2020/topicsobjectives2020/default.aspx. Accessed April 4, 2012.
21. Bailit H, Newhouse J, Brooks R et al. Does more generous dental insurance coverage improve oral health: a study of patient cost sharing. JADA 1985;110(5):701-707. 22. U.S. General Accounting Office. Extent of dental disease in children has not decreased, and millions are estimated to have untreated tooth decay. GAO-08-1121. Washington, DC: U.S. General Accounting Office, September, 2008. 23. U.S. Department of Health and Human Services, Centers for Disease Control and Prevention, National Center for Chronic Disease and Prevention and Health Promotion. National Oral Health Surveillance System. Available at: http://www.cdc.gov/nohss/index.htm. Accessed April 4, 2012. 24. Association of State and Territorial Dental Directors. Synopsis of state and territorial dental public health programs. Available at: http://apps.nccd.cdc.gov/synopses/. Accessed April 4, 2011. 25. U.S. General Accounting Office. Oral health – efforts underway to improve children’s access to dental services, but sustained attention needed to address ongoing concerns. GAO-11-96. Washington, DC: U.S. General Accounting Office, November, 2010. 26. U.S. Department of Health and Human Services. Insure Kids Now. Available at: http://www.insurekidsnow.gov/. Accessed April 4, 2012.

22
27. Connecticut State Dental Association. Connecticut dental health partnership provider recruitment progress report. February, 2010. 28. U.S. General Accounting Office. Concerns remain about sufficiency of data for oversight of children’s dental services. GAO-07-826T. Washington, DC: U.S. General Accounting Office, May, 2007. 29. Cantrell C. Engaging primary care medical providers in children’s oral health. State Health Policy Briefing, NASHP, September 2009. Available at: http://www.nashp.org/publication/reimbursing-medical-providers-preventive-oral-health-services-state-policy-options. Accessed April 4, 2012. 30. American Dental Association. Breaking down barriers to oral health for all Americans: The role of workforce. February, 2011. Available at: http://www.ada.org/sections/advocacy/pdfs/ada_workforce_statement.pdf. Accessed April 4, 2012. 31. American Dental Association. Breaking down barriers to oral health for all Americans: Repairing the tattered safety net. August, 2011. Available at: http://www.ada.org/sections/advocacy/pdfs/breaking-down-barriers.pdf. Accessed April 4, 2012. 32. U.S. Department of Health and Human Services, Centers for Medicare & Medicaid Services. CMS oral health strategy. Centers for Medicare & Medicaid Services, April, 2011. 33. In February 2009, the Children’s Health Insurance Program Reauthorization Act of 2009 renamed the State Children’s Health Insurance Program (SCHIP) to the Children’s Health Insurance Program (CHIP). 34. Wall T, Brown L. Public dental expenditures and dental visits among children in the U.S. – 1996-2004. Pub Health Reports 2008;123(5): 636-645. 35. Kaiser Commission on Medicaid and the Uninsured. Holding steady, looking ahead: annual findings of a 50-state survey of eligibility rules, enrollment and renewal procedures, and cost sharing practices in Medicaid and CHIP, 2010-2011. Washington DC. January, 2011. 36. Shirk C. Oral health checkup: Progress in tough fiscal times? Washington, DC: National Health Policy Forum; 2010. 37. McGinn-Shapiro M. Medicaid coverage of adult dental services. National Academy for State Health Policy. October, 2008. Available at: http://nashp.org/publication/medicaid-coverage-adult-dental-services. Accessed April 4, 2012. 38. Smith VK, Gifford K, Ellis E, Rudowitz R, Snyder L. Hoping for economic recovery, preparing for health reform: A look at Medicaid spending, coverage and policy trends. Washington, DC: Kaiser Family Foundation; 2010. 39. Cohen LA, Manski RJ, Hooper FJ. Does elimination of Medicaid reimbursement affect the frequency of emergency department visits? JADA 1996;127(5):605-609.

23
40. Kaiser Commission on Medicaid and the Uninsured. Eliminating adult dental coverage in Medicaid: An analysis of the Massachusetts experience. Washington DC. September, 2005. 41. Wallace NT, Carlson MJ, Mosen DM, Snyder JJ, Wright BJ. The individual and program impacts of eliminating Medicaid dental benefits in the Oregon health plan. Am J Public Health 2011;101(11):2144-2150. 42. Grembowski D, Spiekerman C, Milgrom P. Linking mother and child access to dental care. Pediatrics 2008;122(4). 43. Sohn W, Ismail A, Amaya A, Lepkowski J. Determinants of dental care visits among low-income African-American children. JADA 2007;138(3):309-318. 44. Gifford EJ, Weech-Maldonado R, Short PF. Low-income children’s preventive services use: implications of parents’ Medicaid status. Health Care Financing Review 2005;26(4).
45. Kenney G, McMorrow, Zuckerman S, Goin D. A decade of health care access declines for adults holds implications for changes in the Affordable Care Act. Health Affairs 2012;31(5):899-908.

ISBN 978-1-60122-165-0©2012 American Dental Association. All rights reserved.
MED-2012