adaptation and validation of food product specific analytical
TRANSCRIPT

University of Nebraska - LincolnDigitalCommons@University of Nebraska - LincolnDissertations, Theses, & Student Research in FoodScience and Technology Food Science and Technology Department
12-2011
Adaptation and Validation of Food ProductSpecific Analytical Methods for MonitoringPrebiotics Present in Different Types of ProcessedFood MatricesRebbeca M. DuarUniversity of Nebraska-Lincoln, [email protected]
Follow this and additional works at: http://digitalcommons.unl.edu/foodscidiss
Part of the Food Science Commons
This Article is brought to you for free and open access by the Food Science and Technology Department at DigitalCommons@University of Nebraska -Lincoln. It has been accepted for inclusion in Dissertations, Theses, & Student Research in Food Science and Technology by an authorizedadministrator of DigitalCommons@University of Nebraska - Lincoln.
Duar, Rebbeca M., "Adaptation and Validation of Food Product Specific Analytical Methods for Monitoring Prebiotics Present inDifferent Types of Processed Food Matrices" (2011). Dissertations, Theses, & Student Research in Food Science and Technology. 21.http://digitalcommons.unl.edu/foodscidiss/21

ADAPTATION AND VALIDATION OF FOOD PRODUCT SPECIFIC ANALYTICAL
METHODS FOR MONITORING PREBIOTICS PRESENT IN DIFFERENT TYPES OF
PROCESSED FOOD MATRICES
by
Rebbeca M. Duar
A THESIS
Presented to the Faculty of
The Graduate College at the University of Nebraska
In Partial Fulfillment of Requirements
For the Degree of Master of Science
Major: Food Science and Technology
Under the Supervision of Professor Vicki L. Schlegel
Lincoln, Nebraska
December, 2011

ADAPTATION AND VALIDATION OF FOOD PRODUCT SPECIFIC ANALYTICAL
METHODS FOR MONITORING PREBIOTICS PRESENT IN DIFFERENT TYPES OF
PROCESSED FOOD MATRICES
Rebbeca M. Duar M.S
University of Nebraska 2011
Adviser: Vicki L. Schlegel.
Prebiotic carbohydrates are now added to a variety of processed foods to beneficially
affect the gut microbial composition and activities. However, published data remain limited on
the stability of prebiotics during food processes, such as baking, extrusion, pasteurization, high
temperature heating, low pH condition, etc. As the complexity of the food matrix may also affect
the ability to test for prebiotics, product specific analytical methods, including UV-vis
spectroscopy, GC and HPLC, were developed and validated to monitor the stability of FOS,
inulin and GOS in different types of processed food (breakfast cereal, cookie, muffin, sports
drink and a nutritional bar). The results showed satisfactory linearity (r>0.9) for all the validated
methods, however differences in the complexity of the ingredients were reflected in method
accuracy and precision. Method precision was determined by calculating the percent relative
standard deviation (% RSD) of spiked samples (n=5) below (0.5%) and above (2%) the target
amount to be supplemented in the food products (1%) with results ranging from 1-39%. Methods
for monitoring FOS and GOS resulted in low detection and quantitation limits allowing analysis
of prebiotics of less than 1% in the presence of complex matrices. On the other hand the inulin
method presented high detection and quantitation limits. Additionally, accuracy was affected by
compounds present in the food matrix, which was accessed by determining the percent
recoveries of spiked prebiotic in the control samples and applying corresponding correction

factors to the supplemented processed foods when the accuracy was below 90% or above 110%.
The chemical fate of the prebiotics was determined by applying the optimized and validated
extraction and analytical method to prototype food products with 1% supplemented prebiotic.
Recoveries ranged from 25-300% depending on method’s performance, complexity of the matrix
and the severity of the processing effects. Finally the fate of the prebiotics in a cereal and sports
drink that were prepared under various processing conditions indicated a high stability of GOS,
while FOS and inulin were affected by low pH and high temperatures.

iii
ACKNOWLEDGMENTS
First of all we thank USDA-NRI for funding this project. We also thank GTC nutrition,
Beneo-Orafti, for providing us with prebiotics.
This thesis wouldn’t be possible without the direction and dedication of my adviser, Dr
Vicki Schlegel, to whom I extend my most sincere thanks for more than two years of mentoring,
and support. My special thanks to Dr. Hutkins Dr. Wehling, Dr. Rose and Dr. Cuppett, for their
help and advice. Also, thanks to Richard and all my lab mates for their help and good times in
the lab.
My deepest gratitude goes to my mom and aunt, without them I would have never made
it this far in life. They have been there for me every step of the way, have always loved me
unconditionally, and have supported me through all of my tough decisions.
To my friends, my crowd, Felipe and Maria Isabel, thanks for your unconditional
friendships and for company and support, especially late in the evenings, and when I needed help
the most. Thanks guys for keeping me sane and happy through the journey of grad school. My
special thanks to my “favorite” friend Michal, you never let me give up.
Last but not least, thanks be to God for my life through all tests in the past two years.
Nobody said it was easy, but at in the end you get what you deserve, the amount of effort you put
determines the amount of joy that you receive.

iv
TABLE OF CONTENT
LIST OF FIGURES ...................................................................................................................... vii
LIST OF TABLES ......................................................................................................................... ix
A. LITERATURE RIVIEW ............................................................................................................ 1
Background of Prebiotics ............................................................................................................. 1
A.1 Chemistry of Prebiotics ....................................................................................................... 1
A.1.1 Fructooligosaccharides ............................................................................................. 2
A.1.2 Inulin ......................................................................................................................... 4
A.1.3 Galactooligosaccharides ........................................................................................... 5
A.2 Health Promoting Properties of Prebiotics ......................................................................... 6
A.2.1 FOS Health Promoting Properties ............................................................................ 8
A.2.2 Inulin Health Promoting Properties ........................................................................ 10
A.2.3 GOS Health Promoting Properties ......................................................................... 12
A.3 Prebiotics in Foods ............................................................................................................ 15
A.3.1 FOS in Foods .......................................................................................................... 15
A.3.2 Inulin in Foods ........................................................................................................ 15
A.3.3 GOS in Foods .......................................................................................................... 19
A.4 Prebiotic Analysis ............................................................................................................. 21
A.4.1 FOS Analysis .......................................................................................................... 21
A.4.2 Inulin Analysis ....................................................................................................... 22
A.4.3 GOS Analysis ........................................................................................................ 22
B. OBJECTIVES AND SPECIFIC AIMS.................................................................................... 23
C. MATERIALS AND METHODS ............................................................................................. 24
C.1 Specific aim 1: Develop and/or adapt extraction and analytical procedures. ..................... 24
C.1.1. FOS Analysis ........................................................................................................... 27
C.1.2 Inulin Analysis .......................................................................................................... 29
C.1.3 GOS Analysis ........................................................................................................... 32
C.2 Specific Aim 2: Method Validation .................................................................................... 35

v
C.2.1 Accuracy ................................................................................................................... 35
C.2.2 Precision ................................................................................................................... 35
C.2.3 Linearity of Calibration Curves ................................................................................ 35
C.2.4 Limit of Detection ..................................................................................................... 36
C.2.5 Limit of Quantitation ................................................................................................ 36
C.3 Specific Aim 3: Analysis of 1% prebiotic supplemented food products. ........................... 36
C.4 Specific aim 4: To assess the chemical fate of FOS, GOS and inulin during various
processing treatments. ................................................................................................................ 37
C.4.1 Chemical Fate of FOS, Inulin and GOS in Sports Drink ......................................... 37
C.4.2 Chemical Fate of FOS, Inulin, and GOS in Extruded ready-to-eat Breakfast Cereal.
............................................................................................................................................ 38
D. RESULTS AND DISCUSSION .............................................................................................. 40
D.1 Specific aim 1: Method Development or Adaptation ......................................................... 40
D.1.1 FOS ........................................................................................................................... 40
D.1.2 Inulin ......................................................................................................................... 42
D.1.3 GOS .......................................................................................................................... 45
D.2 Specific Aim 2: Method Validation ................................................................................... 49
D.2.1 FOS ........................................................................................................................... 49
D.2.2 Inulin ......................................................................................................................... 52
D.2.3 GOS .......................................................................................................................... 54
D.3 Specific Aim 3: Analysis of 1% prebiotic supplemented food products. ........................... 56
D.3.1 FOS ........................................................................................................................... 56
D.3.2 Inulin ......................................................................................................................... 57
D.3.3 GOS .......................................................................................................................... 57
D.4. Specific aim 4. Chemical fate of FOS, GOS and inulin during various processing
treatments. .................................................................................................................................. 61
D.4.1 Chemical fate of FOS in the breakfast cereal. .......................................................... 61
D.4.2 Chemical fate of inulin in breakfast cereal ............................................................... 62

vi
D.4.3 Chemical fate of GOS in breakfast cereal ................................................................ 62
D.4.4 Chemical fate of FOS in sports drink ....................................................................... 66
D.4.5 Chemical fate of inulin in sports drink ..................................................................... 66
D.4.6 Chemical fate of GOS in sports drink ...................................................................... 67
E. CONCLUSIONS ...................................................................................................................... 71
Bibliography ..................................................................................................................... 73

vii
LIST OF FIGURES
Figure 1. Structure of the commercial fructooligosacharides. (Source: Hussein et al. (1998)). ..... 3
Figure 2. Structure of inulin. (Source: Ueno et al. (2011)). ........................................................... 4
Figure 3. Structure of the commercial GOS (adopted from Dr Jens Walter, Department of Food
Science and Technology, University of Nebraska, Nutraceuticals notes). ......................... 5
Figure 4. Proposed mechanism by selective fermentation of prebiotics and subsequent production
of short chain fatty acids resulting in improved bowel habit, increased dietary mineral
absorption, and lower risks of colon cancer. (Source: Crittenden et al. (2006)). ............... 7
Figure 5. Schematic illustration of the adherence (A) and anti-adhesive agents: probiotics (B)
adhesion analogs (C), and receptor analogs (D). (Source: Shoaf et al. (2008)). ............. 14
Figure 6. Percentages of glycosidic linkages los by hydrolysis in FOS incubated for different
time periods (0, 5, 15, 20, 30 and 60 min) at 100 °C. (Source: (Courtin et al. (2009)) ... 16
Figure 7. Degradation of inulin from chicory during thermal treatment up to 60 minutes at
temperatures between 100 and 195 °C. (Adapted from Böhm et al. (2005)). .................. 18
Figure 8. Stability of Vivinal ® GOS at low pH and 85 °C for 5 minutes. Source: (Friesland
Foods Domo, GRASS notice FDA (2007)). ..................................................................... 20
Figure 9. Flow diagram of the extraction procedure and analysis of FOS from the food matrices
........................................................................................................................................... 28
Figure 10. Flow diagram of the extraction procedure and analysis of inulin from the food
matrices. ............................................................................................................................ 31
Figure 11. Flow diagram of the extraction procedure and analysis of GOS from the food
matrices. ............................................................................................................................ 34
Figure 12. 23
factorial design applied to the pasteurized sports drink. ......................................... 39
Figure 13. Different variables of screw speeds and temperatures while maintaining other
extrusion parameters. ........................................................................................................ 39
Figure 14. GC chromatogram of GOS (1mg/ml). Peaks: galactose (ret time 10.12 min), glucose
(ret time 10.83 min) myo-inositol (11.26 min). ................................................................ 46
Figure 15. GC chromatogram of sports drink control. Peaks: fructose (ret time 9.473 min),
glucose (11.31 min) myo-inositol (11.75 min). ................................................................ 47
viii
Figure 16. GC chromatogram of sports drink spiked with 1% GOS. Peaks: Fructose (ret time
9.495 min), galactose (10.32 min), glucose (11.21 min), myo-Inositol (11.26 min)....... 47
Figure 17. GC chromatogram of breakfast cereal control. Peaks: Fructose (ret time 9.19 min),
glucose (10.78 min), myo-inositol (11.23 min) ................................................................ 48
Figure 18. GC chromatogram of breakfast cereal spiked with 1% GOS. Peaks fructose (ret time
9.264 min), galactose (10.05 min), glucose (ret time 10.82 min) myo-inositol (11.308
min). .................................................................................................................................. 48
Figure 19. Percent recovery of 1% supplemented FOS in different prototype foods after
processing. Results shown as MEAN ± STD (n=3). ........................................................ 58
Figure 20. Percent recovery of inulin after processing of food products supplemented of 1%
prebiotic. Results shown as MEAN ± STD (n=3). ........................................................... 59
Figure 21. Percent GOS after processing of food products supplemented of 1% prebiotic.
Results shown as MEAN ± STD (n=3)............................................................................. 60
Figure 22. FOS recovery in breakfast cereal supplemented with 1% FOS and extruded under
different screw and temperature conditions. Results shown as MEAN ± STD (n=3). Bars
with different letters are statistically different (p>0.05) using Tukey HSD test. .............. 63
Figure 23. FOS recovery in sports drink supplemented with 1% FOS prepared and under
different pH and sweetener ratios. Results shown as MEAN ± STD (n=3). Bars with
different letters are statistically different (p>0.05) using Tukey HSD test. ...................... 68
Figure 24. Inulin recovery in sports drink supplemented with 1% inulin and prepared under
different pH and sweetener ratios. Results shown as MEAN ± STD (n=3). Bars with
different letters are statistically different (p>0.05) using Tukey HSD test. ...................... 69
Figure 25. GOS recovery in sports drink supplemented with 1% GOS and prepared under
different pH and sweetener ratios. Results shown as MEAN ± STD (n=3). Bars with
different letters are statistically different (p>0.05) using Tukey HSD test ....................... 70

ix
LIST OF TABLES
Table 1. Extruded Ready-to-eat Breakfast Cereal Formulation .................................................. 24
Table 2. Cookie Formulation ....................................................................................................... 25
Table 3. Muffin Formulation ....................................................................................................... 25
Table 4. Nutritional Bar Formulation ........................................................................................... 26
Table 5. Sports Drink Formulation ............................................................................................... 26
Table 6. Optimization conditions for extracting inulin in the different food products ................ 44
Table 7. Optimization conditions for extracting GOS from sports drink and breakfast cereal .... 46
Table 8. Method performance characteristics for FOS in different food products ...................... 51
Table 9. Method performance characteristics for inulin in different food products ..................... 53
Table 10. Percent recoveries of 1% FOS supplemented food products after processing. ............ 58
Table 11. Percent recoveries of 1% inulin supplemented food products after processing. .......... 59
Table 12. Percent recoveries of 1% GOS supplemented food products after processing ............ 60

1
A. LITERATURE RIVIEW
Background of Prebiotics
The Prebiotic concept was introduced by Gibson & Roberfoid (1995) as “non-
digestible food ingredients that beneficially affect the host by selectively stimulating the
growth and/or activity of one or a limited number of bacteria in the colon, and thus
improves host health”. Later the concept was updated to “a selectively fermented
ingredient that allows specific changes, both in the composition and/or activity in the
gastrointestinal microflora that confers benefits upon host well-being and health” (Gibson
et al., 2004). Lastly during the 2008 International Scientific Association for Probiotics
and Prebiotics (ISAPP) meeting, a prebiotic was defined as “a selectively fermented
ingredient that results in specific changes in the composition and/or activity of the
gastrointestinal microbiota, thus conferring benefit(s) upon host health” (ISAPP 2008).
The “Prebiotic effect” refers to the pathological and physiological effects both in
experimental and human intervention studies specifically linked-to or at least correlated
with selective changes in gut microbiota composition (Roberfroid et al. 2010).
A.1 Chemistry of Prebiotics
The human small intestine produces enzymes that are specific for α-glycosidic
linkages. Prebiotics are carbohydrates with molecular structures resistant to the digestive
enzymes due to the β-configuration of their glycosidic bonds, thus reaching the colon
where they serve as fermentation substrates for selected colonic microbiota. Not all
dietary carbohydrates are prebiotics, and resistance to digestion alone is not the sole
criteria to classify a carbohydrate as a prebiotic. Roberforid (2007) suggested certain
requirements for a prebiotic: 1) resist digestion and absorbtion in the upper

2
gastrointestinal tract; 2) be a suitable susbtrate for selected bateria in the colon i.e.,
bifidobacteria and lactobacilli; 3) contribute to the growth of selected gastrointestinal
bacteria towards a healthier composition contributing to host’s health and well-being.
The majority of scientific data regarding prebiotic effects include inulin-type fructans and
galactooligosaccharides (Roberfroid et al. 2010).
A.1.1 Fructooligosaccharides
Fructooligosaccharides (FOS) belong to a heterogeneous group of carbohydrates
with the characteristic of having fructose residues as the majority of their monomers.
Commercially available FOS are produced enzymatically from natural disaccharides or
polysaccharides and consist of molecular chains with a degree of polymerization (DP)
lower than 9 (Nguyeh et al., 1999). One type of FOS is derived from the partial
enzymatic hydrolysis of inulin using endo-inulinase but it can also be synthesized from
sucrose by a transfructosylation processes with the enzyme β-fructofuranosidase from
Aspergillus niger (Yun 1996; Frank 2002). The main FOS consist of 1-kestose (GF2),
nystose (GF3) and 1F β-fructofuranosylnystose (GF4), which are oligomers of one
glucose unit and two, three and four fructose units, respectively (Figure 1). The fructosyl-
glucose linkage is always α-(1→2) and the fructosyl-fructose linkages are -(2→1)
(Antosova et al. 1999; Birkett et al. 2009).

3
Figure 1. Structure of the commercial fructooligosacharides. (Source: Hussein et
al. (1998)).

4
A.1.2 Inulin
Inulin is a type of fructan widely found in nature for plant energy storage (Niness
1999). From a structural point of view, it is a polysaccharide of D-fructofuranose units β-
(2→1) linked with a D-glucosyl residue at the end of the chain (Figure 2) (Ueno et al.
2011). Depending on the source, the degree of polymerization ranges from 20 to 60
(Roberforid 2007; Böhm et al. 2005). These carbohydrates have been classified as non-
digestible oligosaccharides due to their resistance to human enzyme hydrolysis as
demonstrated in both in vitro and in vivo methods (Cherbut 2002; Roberfoid et al. 1998).
Figure 2. Structure of inulin. (Source: Ueno et al. (2011)).

5
A.1.3 Galactooligosaccharides
Galactooligosaccharides (GOS) are derived from soya beans and lactose and are
one of the most commonly produced prebiotics (Nauta et al. 2009). GOS are comprised
of different short chain polysaccharides, each of which contain galactose as monomers
bonded by β-(1→3), β-(1→4), or β-(1→6) linkages with a terminal glucose (Figure 3).
These oligosaccharides are enzymatically produced by transglycosylation of lactose using
β-galactosidase (Bankova et al. 2006; Berreteau et al. 2006).
Figure 3. Structure of the commercial GOS (adopted from Dr Jens Walter,
Department of Food Science and Technology, University of Nebraska, Nutraceuticals
notes).
6
A.2 Health Promoting Properties of Prebiotics
Several potential health benefits have been attributed to these non-absorbable
carbohydrates, which include increasing of fecal bulk, promoting growth of selective but
beneficial microorganisms of the human microflora, lowering of serum cholesterol,
improving mineral absorption and enhancing immune function (Crittenden et al. 2006;
Roberfroid et al. 2010). As an outcome to these benefits, there is interest in prebiotics as
preventative interventions for health related conditions or even serious diseases,
including ulcerative colitis, colon cancer, coronary heart disease, and osteoporosis. The
mechanisms by which these events occur are not entirely understood and are still under
scientific debate (Roberfroid et al. 2010). However some of the proposed health
promoting mechanisms of prebiotics are depicted in Figure 4, and include: 1.) growth
stimulation of endogenous beneficial bacteria in the gut, hence promoting colonization
resistance against pathogenic bacteria by nutrient and niche competition; 2.) selective
fermentation of the prebiotics to short chain fatty acids (SCFA) resulting in increased
absorption of essential minerals, and lipogenisis regulation in the host and lower
intestinal pH antigenic for some pathogenic bacteria; 3.) promotion of colonic peristalsis
by increasing stool weight and bulk, which in turn shortens transit time and alleviates
constipation.

7
Figure 4. Proposed mechanism by selective fermentation of prebiotics and
subsequent production of short chain fatty acids resulting in improved bowel habit,
increased dietary mineral absorption, and lower risks of colon cancer. (Source: Crittenden
et al. (2006)).

8
A.2.1 FOS Health Promoting Properties
FOS are recognized as a prebiotic because it meets all the required criteria. FOS
thus reaches the colon without being metabolized and are then fermented by the colonic
microbiota to lactate and SCFA (Niness 1999; Nguyeh et al. 1999). Several in vitro
studies have demostrated that FOS is selectively fermented by the health promoting
bacteria, bifidobacteria and lactobacilli (Bouhnik et al. 2007; Kapl (Kaplan & Hutkins,
2003)an et al. 2003; Macfarlane et al. 2008). In particular, a number of human studies
have shown the bifidogenic effect of FOS at doses ranging from 1 to 31 g/day (Thuoty et
al. 2001; Buddington et al. 1996; Menne et al. 2000; Bouhnik et al. 2007).
Studies have also shown that FOS are not utilized by harmful bacterial, e.g.,
Escherichia coli or Clostridium dificile (Hidaka et al. 1986). In a 48-hour incubation
study with mixed fecal flora, Rousseau et al. (2005) demostrated that the pathogenic
microorganisms Candida albicans and Gardnerella vaginalis, which are often causers of
urogenital infections, did not utilize FOS. The inhibition of such pathogenic bacterial
growth by FOS has been attributed to SCFA production and lower intestinal pH (Birkett
et al. 2009). Other studies involving animals fed FOS followed by exposure to pathogens
showed similar protective effects. For example, Brunce et al. (1995) determined that the
mortality and morbidity of piglets supplemented with FOS for 6 days were reduced
compared to a control group given enterotoxigenic E. Coli K88 alone. In addition,
piglets fed FOS (7.5 g/L) for 14 days resulted in a significant reduction in the severety of
Salmonella typhimuriumin infections (Correa-Matos et al. 2003).

9
FOS supplementation has further been associated with modulating and
strengthening the immune function. Guigoz et al. (2002) showed that consumption of 8 g
of FOS per day by elderly people reduced the inflammatory response. Moreover, the
addition of FOS and GOS (8 g/L in a 9:1 ratio) to an infant formula induced beneficial
antibody profiles by significantly reducing plasma levels of IgE, IgG1, IgG2 and IgG3, in
infants at a high risk for allergies (van Hoffen et al., 2009). Early exposure of non-
breast-fed infants to a formula of FOS-GOS (6 g/L) significantly increased secretory
immunoglobulin after 16 weeks, thereby enhancing the maturation and development of
the gastrointestinal immune defense (Bakker-Zierikzee et al. 2006; Scholtens et al. 2008).
Using a randomized, placebo-controlled trial with health infants, Bruzzese et al.
(2005) reported that supplementation of infant formula with FOS and GOS had a
prophylactic effect in the incidence of gastroenteritis and diarrhea. Likewise, Lindsay et
al. (2005) encountered a positive therapeutic effect by patients with Crohn’s disease after
receiving 15 g of FOS for 3 weeks. Treatment of 5 g of FOS in patients with minor
functional bowel disorders during a 6 week period significantly reduced the incidence of
digestive disorders by 46.3% and associated symptoms (Paineau et al. 2008).
Several research groups have shown that FOS fermentation in the colon increases
the colorectal absorption of calcium, iron, and magnesium in rats (Ohta et al. 1995;
Lopez et al. 2000). Similar effects have been reported in humans (Ohta et al. 1998;
Tahiri et al. 2001; Fukushima et al. 2002; Uenishi et al. 2002; van den Heuvel et al.
2009). In particular, Bouhnick et al. (2007) showed that FOS fermentation in the colon
produces SFCA resulting in a lower intestinal pH, thus increasing mineral solubility. It
has also been proposed that FOS aids in rebalancing lipid homeostasis and leads to higher

10
cholesterol excretion (Bouhnik et al. 2007). Although the mechanisms causing these
responses are not fully understood, it has been attributed to 1.) decreases in the daily
energy intakes due to lower calorie value of FOS when used as a sweetener; 2.) beneficial
changes in the intestinal microflora influencing lipid absorption and metabolism; 3.)
binding of FOS to lipids preventing cholesterol absorption at the intestinal mucosal; and
4.) increased synthesis of fermentation by products (SCFA), which may decrease
cholesterol synthesis in the liver (Yamashita et al. 1984; Kok et al. 1996; Delzenne &
Kok 2001).
Lastly, research in animal models has revealed that FOS has significant
anticarcinogenic properties, including prevention of colon cancer (Pool- Zobel et al.
2002), lower incidence of tumors, metastases and inhibition of malignant tumor growth
(Taper et al. 1999).
A.2.2 Inulin Health Promoting Properties
According to several research groups inulin is fermented in the colon producing
lactate and SCFA thereby evoking beneficial changes in the intestinal microflora and
improving mucosal integrity (Roberfoid et al. 1998; Jenkins et al. 1999; Gibson 2000).
The prebiotic effect of inulin has been shown to stimulate the growth of Bifidobacterium
and reduce the Enterobacteriacea populations in both human and animal studies (Gibson
et al., 1995; Kleessen et al. 1997; Kolida et al. 2007; Ramnani et al. 2010). It has also
been proposed that inulin aids in the survival and implantation of probiotic bacteria
providing a symbiotic effect (Niness 1999).
Recent data indicate that inulin consumption beneficially modulates the immune
system, including the gut-associated lymphoid tissues (Schley et al. 2002). Watzl et al.

11
(2005) fed rats an inulin enriched diet (10%) resulting in a significant higher levels of the
anti-inflammatory cytokine interlukin-10. A prospective randomized, placebo controlled
pilot trial performed by Casellas et al. (2007) showed beneficial effects on symptoms and
reduced intestinal inflammation in patients with ulcerative colitis when administrated 4 g
of inulin 3 times a day for 14 days. Additionally Furrie et al. (2005) tested the effects of
a symbiotic therapy on patients with ulcerative colitis by combining inulin (6 g) with the
probiotic bacteria Bifidobacterium longum (2 x 10¹¹
) twice a day for 4 weeks. This study
indicated a reduction in the ulcerative colitis symptoms and a significant decrease in the
mucosal anti-inflammatory cytokines.
Other studies have shown anti-cancer responses to dietary treatment with inulin,
such as reducing the incidence and growth of malignant tumors and decreasing
metastases (Taper et al. 1999). Inulin consumption has been linked to promoting satiety
and lowering total energy intake, which has the potential of translating into a supplement
for weight management (Archer et al. 2004). For instance, consumption of 16 g/day of
inulin increased satiety and reduced hunger in humans (Cani et al. 2006). Research
groups have reported that inulin consumption resulted in increased fecal biomass and
water content in stools, thus improving laxation and reducing constipation (Gibson et al.
1995; Kleessen et al. 1997). Den Hond et al. (2000) investigated the effect of inulin on
bowel function in healthy volunteers with low stool frequency, and determined that
administration of 15 g/day for 2 weeks significantly increased stool frequency.
Furthermore, fermentation of inulin by the gastrointestinal microflora has been associated
with greater intestinal absorption of minerals. Coundray et al. (1997) confirmed that
ingestion of inulin (40 g/day) by young men for a 28 day period significantly increased

12
calcium. Similarly, Younes et al. (2001) showed a significant increase in the calcium and
magnesium absorption in rats fed a high-inulin diet (100 g/kg) for 21 days. Lastly,
improved blood lipid profiles were reported in response to inulin consumption (Williams
1999; Causey et al. 2000). For example, the latter group showed a significant reducction
in serum tryglycerides (by 40 mg/dl).
A.2.3 GOS Health Promoting Properties
GOS are completely fermented in the human colon producing SCFA (Alles et al.
1999) and their bifidogenic effect has been demonstrated throughout the literature
(Alander et al. 2001; Ben et al. 2004; Bouhnik et al. 2004; Vulevic et al. 2008). Davis et
al. (2010) tested the bifidogenic effect of different doses of GOS in healthy adults and
showed a significant increase at 5 g and 10 g. Silk et al. (2009) demonstrated that
consumption of GOS at doses ranging 3.5-7 g/day enhanced fecal bifidobacteria and
alleviated the symptoms of patients with irritable bowel syndrome. Additionally, GOS
intake prevented the incidence and symptoms of travelers’ diarrhea (Drakoularakou et al.
2010).
Studies have confirmed the anti-adherent activity of commercially available GOS
against several infectious bacteria in the gastrointestinal tract. It has been proposed that
GOS acts as molecular decoys that mimic the carbohydrate binding sites recognized by
the pathogen in epithelial cells (Figure 5). Specifically, pathogens bind to the GOS rather
than to the host cells and are thus displaced from the gastrointestinal tract without causing
infection (Shoeaf et al. 2008). Other researchers have shown that GOS inhibited the
adherence of Escherichia coli, Salmonella enterica serovar Typhimurium and two

13
different strains of Cronobacter sakazakii to tissue culture cells at a concentration of 16
mg/ml (Shoaf et al. 2006; Searle et al. 2009; Quintero et al. 2011).
Reports have shown that the consumption of GOS increases calcium absorption
using rats as the model system (Chonan et al. 1995; Chonan et al. 1996) but humans
subjects produced opposite outcomes. van den Heuvel et al. (1998) investigated the
effect on calcium and iron absorption in young healthy subjects fed 15 g/d GOS but
increases absorption of either mineral did not occur. In a second study, the same research
group reported that GOS consumption by postmenopausal women (20 g/d) for 9 days
resulted in higher true calcium absorption (van den Heuvel et al. 2000).
Vulevic et al. (2008) showed beneficial immune effects of GOS consumption with
44 elderly subjects who received a 5.5 g/day treatment. The results indicated a significant
increase in phagocytosis and natural killer activities, as well as elevated production of
anti-inflammatory cytokines with a concomitant reduction in pro-inflammatory
cytokines. In particular, GOS have attracted attention due to similarities to human milk
oligosaccharides (Alander et al. 2001; Moro & Arslanoglu 2005 Sangwan et al. 2011)
that play an important role in infants’ immune system development and modulation of
their intestinal microflora.
GOS has also been linked to lower bacterial enzyme activities involved in the
formation of carcinogenic compounds and to lower levels of secondary bile acids linked
to increased colon cancer risk (Ito et al. 1993; Rowland et al. 1993). Administration of
GOS has shown protective properties against colo-rectal cancer by reducing the number
of tumors in a rat model system (Wijnands et al. 1999).

14
Figure 5. Schematic illustration of the adherence (A) and anti-adhesive agents:
probiotics (B) adhesion analogs (C), and receptor analogs (D). (Source: Shoaf et al.
(2008)).

15
A.3 Prebiotics in Foods
Some prebiotics, such as inulin and oligofructose, occur naturally in foods
(Roberfroid 2002) but are increasingly used as functional ingredients for a variety of
processed foods (Roberfroid et al. 2010). However, during processing carbohydrates
undergo different changes, such as Maillard-reaction, caramelization and hydrolysis
(Matusek et al. 2008; Birkett et al. 2009). Certainly, oligosaccharides that have been
enzymatically or chemically hydrolyzed are not expected to retain prebiotic activity
considering that released sugars would be absorbed in the intestinal tract or metabolized
by the general commensal flora. Thus, the interaction of the prebiotic with the
surrounding matrix and the effect that processing might have on their structure must be
considered (Huebner et al. 2008).
A.3.1 FOS in Foods
FOS are extensively distributed in the plant kingdom, particularly in banana,
wheat, barley, onion, garlic, asparagus and Jerusalem artichoke (Campbell et al. 1997;
Roberfroid 2002). FOS has been used in the food industry to manufacture pastry, frozen
deserts and dairy products; contributing to both body, texture and as a low calorie
sweetener (Campbell et al. 1997; Niness 1999; Sangeethat et al. 2005). Although little
data exist on the physio-chemical characteristics and other stability properties of FOS in
processed foods (Yun 1996), Mujoo et al. (2003) showed that added kestose and nystose
levels decreased after the bread baking process. According to results reported by Courtin
et al. (2009), a reduction of 60-67% (w/w) of the glycosidic linkages β-(2→1) occurred
between fructose units at low pH (2.0 and 3.0) and after incubation at 100 °C for 60
minutes (Figure 6). Other experiments have shown significant degradation of FOS under

16
acidic conditions (pH 2-4) and high temperature 70-120 °C (L'homme et al. 2003;
Matusek et al. 2008).
Figure 6. Percentages of glycosidic linkages los by hydrolysis in FOS incubated
for different time periods (0, 5, 15, 20, 30 and 60 min) at 100 °C. (Source: (Courtin et al.
(2009))

17
A.3.2 Inulin in Foods
Inulin is found naturally in a variety of plants and in some bacteria and fungi, thus
inulin has always been part of the human diet. Common sources include chicory roots
(Cichorium intybus), Jerusalem artichoke, leaks, onion, garlic and asparagus (Frank,
2002). Inulin can also be enzymatically synthesized from sucrose (Niness 1999; Frank
2002; Roberfroid 2002)
In the food industry, inulin is widely used for both its nutritional and functional
properties (Frank 2002). It is often used in the production of low glycemic index foods
intended for diabetics and hydrolyzed to produce fructose syrups (Hofer et al. 1999).
Furthermore, inulin improves physical and organoleptic properties of low fat foods and
can be used as a fat replacer. Inulin is added to foods as a prebiotic ingredient and to
enrich the fiber content of products without sacrificing mouth feel and or producing off-
flavors (Niness 1999; Frank 2002). Nevertheless, Böhm et al. (2005) showed that dry
thermal treatment of inulin caused significant degradation of the long fructose chains
leading to the formation of smaller molecules such as di-D fructose and dianhydrides
(Figure 7). Losses of the initial inulin content in bakery products during the dough
development and the baking process has been reported (Pranznik et al. 2002).

18
Figure 7. Degradation of inulin from chicory during thermal treatment up to 60
minutes at temperatures between 100 and 195 °C. (Adapted from Böhm et al. (2005)).

19
A.3.3 GOS in Foods
Products containing GOS were first launched in Japan in the late 1980s (Nauta et
al. 2009). GOS has since been recognized as a stable, soluble and functional ingredient,
suitable as an ingredient for a number of foods and beverages, including dairy products,
bakery products, breakfast cereals, beverages, snack bars infant formulas, functional
foods, and clinical nutrition formulas (FDA 2007; Sangwan et al. 2011). GOS have a
very stable shelf life even at low pH and high temperature conditions (Figure 8) due to
the presence of β-type linkages (FDA 2007; Nauta et al. 2009; Sangwan et al. 2011). In
food products requiring heat treatment, GOS remains stable at temperatures up to 100 and
120 °C and pH values of 3-7 (FDA 2007).
GOS are increasingly applied as ingredients for infant formula and growing-up-
milks as a means to mimic the biological functions of human milk oligosaccharides
(Napol et al. 2003; Nauta et al. 2009; Sangwan et al. 2011). The amount of supplemented
GOS varies by product but current infant formulas typically contain up to 8 g GOS per l
(FDA 2007), which is based in part on the amount of complex oligosaccharides in mature
human milk (5-8 g/l) (Kuz et al. 2000). Results from studies by Savino et al. (2003) and
Moro et al. (2002) indicated that infant formula supplemented with up to 7.2 g GOS per l
was well tolerated by healthy term infants without causing any adverse effects. GOS are
also incorporated into symbiotic formulations to enhance the survival, colonization and
functionality of probiotics (Kukkonen et al. 2008; Piirainen et al. 2008).

20
Figure 8. Stability of Vivinal ® GOS at low pH and 85 °C for 5 minutes. Source:
(Friesland Foods Domo, GRASS notice FDA (2007)).
21
A.4 Prebiotic Analysis
As stated previously, carbohydrates can undergo different changes, including
Maillard-reactions, caramelization and hydrolysis; hence the supplemented prebiotics
could lose their effect by breaking down or changing during processing (Matusek et al.
2008). Although different analytical methods to detect and characterize non-digestible
carbohydrates are reported throughout the literature, the vast majority have only been
applied to the analysis of pure prebiotics and not to prebiotics supplemented in different
complex foods matrices. Therefore, it is necessary to develop selective analytical
methods, capable of accurately measuring prebiotics in the presence of complex food
matrices.
A.4.1 FOS Analysis
Several methods to detect and quantitate FOS have been discussed in the
literature, including thin layer chromatography (Park et al. 2001), gas chromatography
with mass spectrometry detection and nuclear magnetic resonance (Hayashi et al. 2000).
Nevertheless, high performance liquid chromatography (HPLC) using both polar and
non-polar resin based columns with refractive index detection is the prevalent technique
for FOS analyses (Sangeethat et al. 2005). Anion exchange chromatography methods
using an alkaline mobile phase and pulsed electrochemical detection (Shiomi et al. 1991;
Campbel et al. 1997) as well as, cation-exchange chromatography using water as the
eluent and Ca2+
as the counter ion (Antosova et al. 1999) have also been established.
22
A.4.2 Inulin Analysis
Presently inulin can be legally labeled as “dietary fiber”, but the official method
for analysis of “dietary fiber” is unable to detect it (Frank 2002). For this reason, liquid
chromatography methods with refractive index detection have been developed for its
detection and quantification, both directly and indirectly after hydrolysis to fructose
(Zuleta et al. 2001; Vendrell-Pascuas et al. 2000; Wang et al. 2010). However,
colorimetric methods for fructans based on acidic or enzymatic hydrolysis are more
commonly used due to their simplicity and low costs (Hofer et al. 1999; Korakli et al.
2003; Wang et al. 2010). The official AOAC method for the measurement of fructans is a
colorimetric method where fructans are hydrolyzed to fructose and then measured after
reaction with p-hydroxybenzoic acid hydrazide (AOAC 2002).
A.4.3 GOS Analysis
Several analytical methods have been published pertaining to the identification
and quantification of GOS, including UV spectroscopy (Dias et al. 2008), capillary
electrophoresis (Albrecht et al. 2010), HPLC with refractive index detection (Albayrak &
Yiang 2002), and thin layer chromatography (Sanz et al. 2005; Splechtna et al. 2006).
The existing official method for the determination of trans-galactooligosaccharides in
food products (AOAC 2001.2) is based on high performance anion-exchange
chromatography with pulsed amperometric detection of galactose after hydrolysis of
GOS with β-galactosidase (de Slegte 2002).

23
B. OBJECTIVES AND SPECIFIC AIMS
Stability of prebiotics during food processing is a very important requirement
given that prebiotics are biologically active compounds in terms of their health promoting
properties. As the complexity of the food matrix may also affect the ability to test for
prebiotics, product specific analytical methods are needed to monitor different types of
processed food. Therefore the objective of this project was to adapt or develop, validate,
and then apply analytical methods that are capable of monitoring prebiotics in different
types of processed food matrices, including breakfast cereal, cookie, muffin, sports drink
and a nutritional granola bar. The objective of this project was satisfied by completing
the following specific aims.
Specific Aim 1: To develop and/or adapt extraction and product specific
analytical procedures for measuring FOS, GOS and inulin in the different food matrices.
Specific Aim 2: To validate the methods established from Specific Aim 1 for
each food matrix.
Specific Aim 3: To apply the validated method to the food matrices prepared
with 1% of the prebiotic under standard unit preparation procedures.
Specific aim 4: To assess the chemical fate of FOS, GOS and inulin in prototype
of extruded cereal and a sports drink prepared under different processing / formulation
parameters.

24
C. MATERIALS AND METHODS
C.1 Specific aim 1: Develop and/or adapt extraction and
analytical procedures
Processed foods used for this study included extruded ready-to-eat breakfast
cereal, muffin, cookie, and nutritional bar, which were provided by Dr. Randy Wehling
(Department of Food Science and Technology, University of Nebraska). The
formulations of each product are shown in Tables 1-5. Supplemented products were
prepared with the following prebiotics: 1) Galactooligosacharides (GTC nutrition),
90%db. 2) Short-chain fructooligosaccharides powder (NutraFlora®) (GF2 33.8%, GF3
50.1%, and GF4 11.6%) 3) Inulin (ORAFTI) ≥ 92.2% oligofructose, DP between 2 and 8.
Table 1. Extruded Ready-to-eat Breakfast Cereal Formulation
Component g/batch
Oat flour 800
Corn flour 1010
Sucrose (granulated table sugar) 160
Salt 20
Calcium carbonate 10
Prebiotic 20
*Refer to Figure 13 for processing parameters.

25
Table 2. Cookie Formulation
Component g/batch
Shortening 64
Sugar 130
Salt, USP 2.1
Bicarbonate of Soda, USP 2.5
Dextrose solution (8.1g dextrose hydrous,
USP in 150 ml water)
33
Distilled water 16
Flour14% mb 225
*Baked in an industrial rotating oven at 204 ° C for 10 min.
Table 3. Muffin Formulation
Component g/batch
All-purpose flour (Bleached wheat flour, maltea
barley flour, niacin, iron, thiamin, mononitrate,
riboflavin, folic acid)
250
Granulated sucrose 75
Baking powder (Baking soda, corn starch,
sodium aluminium sulfate, calcium sulfate,
monocalcium phosphate)
15
Salt 3.1
Eggs (whole, slightly beaten) 50
Milk (fluid) 200
Butter(melted) 75
Distilled water 50
Prebiotic 7.5
*Baked in a conventional oven at 240 ° C for 20 min.

26
Table 4. Nutritional Bar Formulation
Component g/batch
Rolled oats (whole) 420
Granola cereal (whole grain rolled oats,
evaporated cane juice, expeller pressed canola oil,
defatted wheat germ, oat flour, brown rice syrup,
molasses, salt, natural flavor, soy lecithin)
420
Margarine 50
Honey (clover) 350
Peanut butter(creamy style) 100
Sucrose(granulated table sugar) 50
Salt 5
Roasted peanuts (chopped) 75
Prebiotics 14.7
* Ingredients mixed in a table top mixer, compressed until firmly packed
and allowed to set overnight.
Table 5. Sports Drink Formulation
Component g/L
Granulated sucrose 25
Corn syrup solids 25
Citric acid According to pH
Sodium chloride 1
Sodium citrate 0.1
Prebiotic - resistant starch 10
Red food color Small amount
* Refer to Figure 12 for processing parameters.

27
C.1.1. FOS Analysis
FOS was initially extracted according to the method shown in Figure 9 and
adjusted to achieve optimal recovery from each food based on spike recovery tests (Table
6) . Identification and quantification of FOS was determined by high performance liquid
chromatography using an amino bonded phase carbohydrate column (Waters
3.9x300mm) warmed at 35 °C and interfaced to a refractive index detector (Waters RI
2414) maintained at 35 °C and sensitivity 1. Acetonitrile in water (75:25 v/v) served as
the mobile phase and was set at a flow rate of 1.0 ml/min (Nishizawa et al. 2000; Sheu et
al. 2001). FOS standards of 1-kestose, nystose and 1-fructofuranosylnystose, (Wako,
Osaka, Japan) were injected at 5 concentration points ranging from 0.25 to 7.50 mg/ml.
Peak areas were recorded and plotted to construct calibration curves. FOS levels in the
samples were determined by using the calibration curve constructed from external
standards.
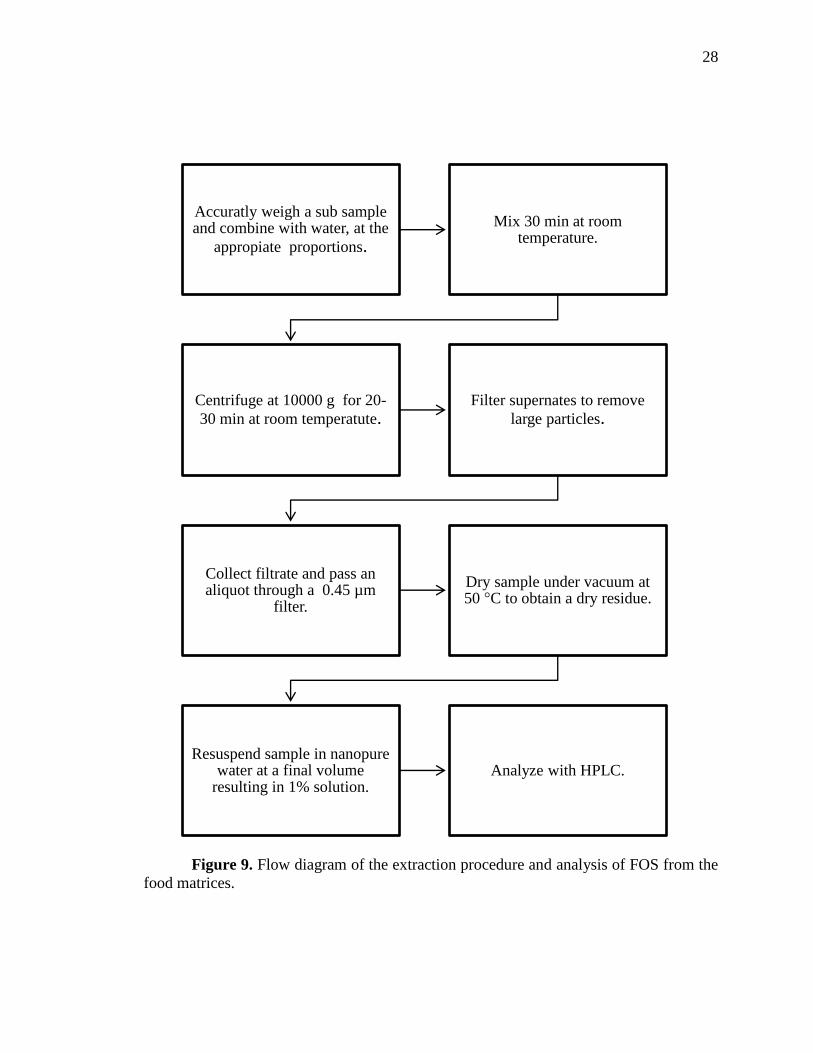
28
Figure 9. Flow diagram of the extraction procedure and analysis of FOS from the
food matrices.
Accuratly weigh a sub sample and combine with water, at the
appropiate proportions.
Mix 30 min at room temperature.
Centrifuge at 10000 g for 20-
30 min at room temperatute. Filter supernates to remove
large particles.
Collect filtrate and pass an aliquot through a 0.45 µm
filter.
Dry sample under vacuum at 50 °C to obtain a dry residue.
Resuspend sample in nanopure water at a final volume
resulting in 1% solution. Analyze with HPLC.
29
C.1.2 Inulin Analysis
Inulin was extracted from the processed foods using the basic protocol shown in
Figure 10 unless indicated otherwise in Section D. Inulin content in the samples was
measured according to the Total Fructan AOAC method 999.03, using an assay kit
purchased from Megazyme International (K-FRUC 5/2008,Ireland Ltd., County Wicklow
Ireland). The kit included sucrose/amylase and fructanase as freeze-dried powders. The
sucrase/amylase mixture contained 100 U of sucrase, 500 U of β-amylase from B. cereus,
100 U of pullulanase from K. pneumoniae and 1000 U of maltase from yeast. The
fructanase mixture included 10000 U of exo-inulinase and 100 U of endoinulinase. The
enzyme solutions were prepared by dissolving sucrase/amylase and the fructanase freeze-
dried powders into 22 ml of sodium maleate (100 mM, pH 6.5) and 22 ml of sodium
acetate buffer respectively. Enzyme solutions were divided into 5 ml aliquots and stored
at 20 °C in polypropylene containers. Solutions and buffers consisted of sodium maleate
buffer (100 mM, pH 6.5), sodium acetate buffer (100 mM, pH 4.5), sodium hydroxide
(50 mM), acetic acid (100 mM) and alkaline borohydride solution (10 mg/mL of sodium
borohydride in 50 mM sodium hydroxide). The p-hydroxybenzoic acid hydrazide
(PAHBAH) reducing sugar assay reagent was prepared by mixing 2 solutions
immediately before use. Solution A consisted in 10 g PAHBAH (Sigma Cat. No. H-9882,
Sigma Chemical Co. St. Louis, MO 63178, USA) and 10 ml concentrated HCl diluted to
200 ml with distilled water and stored at room temperature (ca 22°C). Solution B was
prepared by dissolving 24.9 g of trisodium citrate dihydrate, 2.20 g of calcium chloride
dihydrate and 40.0 g sodium hydroxide into 2 l of distilled water stored at room
temperature.
30
Briefly, the method consisted of extracting the inulin from the food products with
hot water, followed by a treatment with sucrase and with a mixture of starch-degrading
enzymes. The sugars were then reduced to sugar alcohols with alkaline borohydride.
Finally, inulin was hydrolyzed to fructose with purified fructanase (exo-inulinase plus
endo-inulinase), The reducing sugars were measured with a spectrophotometer (Beckman
Coulter DU 800) at 410 nm after reaction with para-hydroxybenzoic acid hydrazide.
(PAHBAH).
Inulin was quantitated against a 5 point calibration curve constructed from
standards (ORAFTI, Pennsylvania, USA) ranging from 0.3 to 30 mg/ml. Total inulin
content was determined by subtracting the fructan value obtained for the control from the
fructan value of the spiked sample.

31
Figure 10. Flow diagram of the extraction procedure and analysis of inulin from
the food matrices.
Accurately weigh
1.0±0.05 g of a test
portion.
Add hot distilled
water at 80°C; stir
80°C for 15 min.
Cool solution to
room temperature,
adjust volume to 100
ml with distilled
water, and mix.
Centrifuge at 1000 g
for 20 min ,or until
pellet is formed.
Filter aliquot of
solution through
paper Whatman No.
1, or equivalent.
Transfer 0.2 ml of
filtrate.
Add 0.2 ml of
sucrase/amylase
solution, and
incubate at 40°C for
30 min.
Add 0.2 ml alkaline
borohydride solution
to each tube and
incubate at 40°C for
30 min.
Add 0.5 ml acetic
acid and mix.
Transfer four 0.2 ml
aliquots.
Add 0.1 mL of
fructanase to 3 of
these samples.
Add 0.1 ml of 0.1 M
sodium acetate
buffer to the 4th
sample
(sample blank).
Incubate at 40°C for
20 min.
Add 5.0 ml
PAHBAH working
reagent.
Incubate in boiling
water bath for 6 min.
Remove all tubes from
boiling water bath and
immediately place in
cold water (18–20°C)
for ca 5 min.
Measure absorbance
of all solutions at
410 nm.

32
C.1.3 GOS Analysis
GOS was extracted and analyzed by the AACC method 32-25 (AACC Int 1994)
with some modifications, as shown in Figure 11. Residues of GOS were determined as
alditol acetates by gas liquid chromatography as described by Courtin et al. (2000). In
brief, samples were hydrolyzed with 2.8 M sulfuric acid into galactose and glucose,
followed by a reduction to sugar alcohols with alkaline borohydride (150 mg/mL of
sodium borohydride in 3 M ammonium hydroxide) and a final acetylation to alditol
acetates (Courtin et al. 2000). The derivatized sugars (1.0 µl) were resolved on an Elite
225 column (Perkin Elmer N9316177, 30 m x 0.25 mm x 0.25 µm film) interfaced to a
gas chromatograph (Agilent Technologies 7820A) with splitter injection port (split ratio
1:20) and flame ionization detector. The carrier gas was helium while the separation and
detection temperatures were 220 °C and 240 °C, respectively.
Correction factors (CFms), accounting for sugar losses during hydrolysis and
derivatization and for different GC responses were calculated for each individual
monosaccharide relative to an internal standard (myo-inositol) using the following
correction factor obtained from known standards (glucose, galactose).
Where Ams = peak area for individual monosaccharide, Astd = peak area for
internal standard (myo-inositol), Wms = weight (milligrams) of monosaccharide in the
sample, and Wstd = weight (milligrams) of internal standard in the solution.
Levels of galactose and glucose as anhydrosugars (AS) from GOS were
calculated from the equation:

33
Where Fm = recalculation factor for individual monosaccharides to
polysaccharide residues (0.90 for hexoses), and S = weight (mg dry matter) of original
sample.
Furthermore GOS in the food samples was calculated based only on the amount
of galactose recovered. Percent of galactose derived from GOS was calculated by
analyzing standards of known concentrations with the same procedure as for the samples.
Finally to determine the presence of free galactose in the sample, and/or if degradation of
GOS occurred during processing, the content of free galactose in both the control and
supplemented (1% GOS) samples was quantified by reducing the monosaccharides
present in the samples prior to the hydrolysis.

34
Figure 11. Flow diagram of the extraction procedure and analysis of GOS from
the food matrices.
Prepare a solution galactose and glucose
and the internal standard to (myo-inositol) each at
1mg/ml (STD).
Prepare a solution of myo-inositol at the same
concentration of the expected concentration of
the sugar in sample (ISTD)
Accurately weigh a of a test portion and combine with to achive 1mg/ml GOS concentration .
Mix 30 min at room temp
Centrifuge to obtain pellet at room.
Transfer 250 µl of sample (S) to a 35 ml
open test tube with screw cap.
Add 50 µl of 2.8M
sulfuric acid and 50 µl
of ISTD to sample (S).
Hydrolyze: Pressure cook
in High (15 psi and
80 °C for 1 h).
Add 75 µl of 12 M
ammonium hydroxide and
mix.
Add 40 µl of freshly
prepared 150 mg/ml
alkaline sodium
borohydride.
Incubate at 40 °C for 1 h.
Add 40 µl of glacial
acetic acid; mix.
Add 0.5 ml of 1-
methylimidazole; mix.
Add 5 ml of acetic
anhydride (slowly); mix.
Let stand 10 min at room
temperature.
Add 1 ml absolute
ethanol.
Let stand 10 min at room
temperature.
Move tubes to a cooler
with ice up to shoulder of
tube
Slowly add 5 ml of well
mixed 7.5 M sodium
hydroxide; mix.
Let stand 5 min at room
temperature.
Add another 5 ml of 7.5
M sodium hydroxide.
Transfer ethyl acetate
(top) layer to a fresh tube. Analyze by GC.
Analyze the STD at as the first and last injection of
the runs.

35
C.2 Specific Aim 2: Method Validation
Method validation was performed according to the statistical design presented in
the United States Pharmacopia and the AOAC Peer verified methods: Manual for policies
and procedures (AOAC 1998) based upon accuracy, precision, linearity of the standard
curve, limit of detection, limit of quantitation, and specificity / selectivity.
C.2.1 Accuracy
Processed finished products that had been prepared without a given prebiotic were
extracted / analyzed via the cited extraction / analysis methods (S1), which served as the
control. These samples were spiked with the prebiotic at known concentrations above and
below and at the target levels expected in the treated products (S2). The products were
again extracted and analyzed based upon the optimized analysis methodologies. Method
accuracy was thus be accessed by determining % recoveries as follows:
% Recovery = (Conc. S2 –Conc. S1/Known increment conc) X 100.
C.2.2 Precision
The relative standard deviation of individual results (% RSD) was determined by
analyzing replicate samples (n = 5) prepared according to the conditions of the tests
(Specific Aim 1).
C.2.3 Linearity of Calibration Curves
Standards with different but known concentrations (4-5 different concentrations)
were analyzed in triplicate and the response was correlated vs. concentration. The
regression curve y= mx + b, was calculated by the method of least squares of the standard
responses vs. concentration, where “m” is the slope of the line and “y” is the y intercept.

36
The correlation coefficient (R) was determined to access degree of linearity (AOAC
1998).
C.2.4 Limit of Detection
Limits of detection were determined by calculating the mean value of the matrix
blank response (n ≥10) times 3 standard deviation of the mean.
C.2.5 Limit of Quantitation
Limits of quantitation will be determined by calculating the mean value of the
matrix blank response times (n ≥10) times 10 standard deviation of the mean.
C.2.6 Specificity / Selectivity
Matrix blanks were analyzed to ensure that no interfering compounds were
present or that a given carbohydrate was not indistinguishable from the corresponding
standard material in the appropriate matrix.
C.3 Specific Aim 3: Analysis of 1% prebiotic supplemented
food products
Based upon the results generated in Specific Aims 1 and 2, the extraction and
analysis procedures were applied to the final products (Table 1-5) containing 1% of the
prebiotic in the initial formulation. Percent recovery of the different formulated
prototypes was determined and corrected based on the recovery from the validation
studies, i.e., if % recoveries of a given method were low a corresponding correction
factor was applied to the test results.

37
C.4 Specific aim 4: To assess the chemical fate of FOS, GOS
and inulin during various processing treatments
The chemical fate of FOS, inulin and GOS was determined by applying the
validated extraction and analytical methods in the sports drink and extruded ready-to-eat
cereal prepared under different processing conditions as described in the next sections.
Means of the prebiotic content were calculated with ANOVA tests followed by the Tukey
HSD test set at a 5% level of significance.
C.4.1 Chemical Fate of FOS, Inulin and GOS in Sports Drink
The pasteurized sports drink was prepared according to the formulation shown in
Table 5 and Figure 12. All ingredients were mixed with distilled water to a final volume
of 1 l. A pH of 3.5 was adjusted accordingly for each batch using citric acid. The mixed
ingredients were then stirred and heated to a minimum temperature of 175 ˚C using a stir/
hot plate. The drink product was hot-filled into PET bottles and allowed to cool. Upon
cooling, the final sports drink products were stored at ambient temperatures prior to
analysis.
To determine the effects of pH and sweetener composition on prebiotic stability,
the following treatments were implemented: 1) varied sucrose: Corn syrup solids
(DE=60) ratios (1:2, 1:1, 2:1), and 2) pH values 3.0, 3.5, and 4.0. The experiment was
completely randomized as a 23
factorial with a split plot design. Each trial held at constant
sweetener ratio while adjusting pH to 3.0, 3.5 and 4.0. Figure 12 shows the 23 factorial
design.

38
C.4.2 Chemical Fate of FOS, Inulin, and GOS in Extruded ready-to-eat
Breakfast Cereal
Extruded ready-to-eat breakfast cereal samples were prepared using different
screw speed (120, 170, and 220 rpm) and temperature (110, 140, and 170 ˚C) as provided
by Dr. Randy Wehling (Department of Food Science and Technology, University of
Nebraska Lincoln). A conical twin screw laboratory extruder (C.W. Brabender Model
2003 GR-8) with a barrel diameter of 1.9 cm and a length: diameter ratio of 20:1 was
used for the extrusion process. The mix was equilibrated overnight with appropriate
additions of distilled water to obtain a final moisture content of 17% prior to extrusion.
Trials run were conducted to determine optimum feed-mix moisture content, barrel
temperature, and screw speed for cereal model expansion. The screw speed (170 rpm)
and barrel temperature (140 °C) combination that provided optimum expansion was
selected. A complete randomized design with varying two additional screw speeds (120
rpm and 220 rpm) and two additional temperatures (120 °C and 170 °C) were conducted
while holding the other parameter constant at the optimum value (Figure 13).

39
Figure 12 . 23
factorial design applied to the pasteurized sports drink.
Figure 13. Different variables of screw speeds and temperatures while
maintaining other extrusion parameters.

40
D. RESULTS AND DISCUSSION
Methods for extracting and quantitating inulin, FOS and GOS from different
processed food products were developed by spiking known amounts (0.5, 1 and 2%) of a
given prebiotic into the product base formula (without supplemented prebiotic) and
determining the amount recovered. This approach is not typically applied to food based
ingredients and thus has not been reported for method development of any prebiotic
supplemented food. Method performance was then validated based on precision,
linearity, detection limit, quantitation limits and accuracy. Moreover the validated
methods for each prebiotic were applied to the food matrices prepared with 1% of the
prebiotic under standard unit preparation procedures. Finally the chemical stability of
prebiotics in terms of the total supplemented levels was evaluated for the breakfast cereal
and the sports drink when prepared under different processing conditions.
D.1 Specific aim 1: Method Development or Adaptation
D.1.1 FOS
FOS were initially extracted according to the steps shown in Figure 9. This
method was selected based on excellent separation, precise quantititation and high
percent recoveries of the FOS standards, as completed in our lab. Furthermore, separation
was achieved under isocratic conditions in aproximately 30 min. and often fitration was
the only sample clean-up step needed prior to HPLC analysis. Nevertheless, further
adjustments to the extraction method were needed for some of the food matrices to
improve the overall accuracy (Table 6).

41
Because the extruded breakfast cereal had a high water absorption capacity, most
likely due to the high content of soluble fibers and starch present in the oat and corn
flours (Delcour 2010); this characteristic precluded the use of water as the only extraction
solvent. FOS was thus extracted from the breakfast cereal using a mixture of water and
ethanol at a 1:1 (v/v). A similar approach but with 25% boiling ethanol was successfully
used to extract FOS from bread (Mujoo et al. 2003). After extraction, the samples were
placed under vacuum until completely dried. Finally, the samples were re-dissolved to 1
ml of nanopure water to achieve a FOS concentration (mg/ml) above the detection and
quantitation limits of the method. Alternatively, the muffins exhibited low water
absorption and 2 ml of water was sufficient to achieve percent recoveries of ~100%.
A second extraction was needed for 1% spiked cookie to completely extract FOS.
It was hypothesized that because the cookies contained high levels of sucrose (27 mg per
gram of cookie), which is highly soluble in water (IPCS 1999), the extraction solvent was
saturated by this simple sugar preventing complete extraction of the prebiotic in a single
step approach. This hypothesis was confirmed by the higher percent recoveries obtained
from an additional extraction (<80-100%). In the case of the nutritional bar, the
ingredients, such as roasted chopped peanuts and whole rolled oats, together with the
higher viscosity of honey and peanut butter prevented homogeneous distribution of FOS
in the matrix (Table 4). A larger amount of test portion (10 g) combined with a water 1:2
(w/v) ratio was required to achieve suitable FOS recoveries (66-113%). Finally, the
sports drink did not require any extraction procedures and only limited sample handling
procedures, which consisted of passing the drink through a 0.45 µm syringe filter to
42
remove large particles prior to HPLC analysis. Table 6 summarizes the optimization
conditions for the FOS spiked food products.
D.1.2 Inulin
Inulin was initially extracted and analyzed with the official AACC method 32-32
as shown in Figure 10. This method was chosen because it is widely used due its
simplicity and economy. Additionally, it can be used to measure fructans in a wide range
of plant and food materials (AACC Int 2001; Wang et al. 2010). However, food product
specific adjustments to the original extraction steps (Figure 10) were needed to improve
method performance (Table 7). For example, according to the official method, total
fructan content is calculated by measuring free fructose. In brief, it compares the
absorbance of the test sample with the absorbance from the reaction of a fructose
standard (54.4 µg) with the coloring agent PAHBAH. Using a conversion factor, the
amount of free fructose is then converted to anhydrofructose as occurs in fructan. For
this project, the use of a calibration curve was the preferred method to determine the
concentration of inulin in the food samples. A set of inulin standards were used to
construct the curve and the response of the test sample was then interpolated to determine
the concentration. The latter proved to be a reliable approach, as the curve was linear
within the working range of the spiked sample and had a strong correlation (r>0.99)
allowing the use of inulin standards for the remaining experiments. Furthermore, overall
precision of the method performance improved (< 75-100%) when 50 ml of water were
used as the extraction solvent instead of the 100 ml indicated in the method’s original
protocol (data not shown).

43
One important characteristic of this method is that the color response is the same
for fructose and glucose (AACC Int 2001). Hence, the response obtained from a
product’s base formula (control) had to be subtracted from the response obtained from
the spiked samples. The high sucrose content in the cookie (Table 2) probably
overwhelmed the capacity of the coloring agent (PAHBAH) thus affecting the ability of
the method to differentiate fructose from the inulin from glucose and fructose derived
from sucrose. A possible resolution of this problem would be to increase the incubation
time with sodium borohydride to ensure that the monosaccharides resulting from the
sucrase incubation step are completely reduced to sugar alcohols, thereby preventing any
non-selective interaction with the PAHBAH coloring agent. Wang et al. (2010) also
concluded that the colorimetric method is prone to interfering compounds such as
glucans, hexoses and sucrose resulting in inaccuracies and overestimation. The authors
proposed the use of an HPLC method to address this issue; however, sample preparation
and analysis were more laborious. The colorimetric method was still preferred due to
effective preliminary results. In addition a large number of samples could be analyzed in
a shorter time, as was required for this project.

44
Table 6. Optimization conditions for extracting FOS in the different food products
Food Product
Amount of
sub-sample analyzed
Extraction Solvent
Further procedures
for extraction
optimization.
Extruded cereal
10.00 ± 0.05 g
20.0 ± 0.1 ml of 1:1
water: ethanol
Concentrated to a
final volume of 1 ml.
Muffins
1.00 ± 0.05 g
2.0 ± 0.1 ml of water
-
Cookies
10.00 ± 0.05
20.0 ± 0.1 ml of water
-Pellet extracted an
additional time with
10 ml of water.
Nutrition bar
10.00 ± 0.05 g
10.0 ± 0.1 ml of water
Concentrated to a
final volume of 1 ml.
Sports drink
1.00 ± 0.05 ml
No extraction needed.
-
Table 6. Optimization conditions for extracting inulin in the different food products
Food
Product
Amount of sub-
sample analyzed
Volume
of extraction solvent
(water) indicated by
the protocol
Volume
of extraction solvent
used for assay
optimization.
Extruded cereal 1.00 ± 0.05 g 100 ± 0.1 ml 50 ± 0.1 ml
Muffins
1.00 ± 0.05 g
100 ± 0.1 ml
50 ± 0.1 ml
Cookies
1.00 ± 0.05 g
100 ± 0.1 ml
Optimization was not
achieved.
Nutrition bar
1.00 ± 0.05 g
100 ± 0.1 ml
50 ± 0.1 ml
Sports drink
1.00 ± 0.05 ml
100 ± 0.1 ml
50 ± 0.1 ml
45
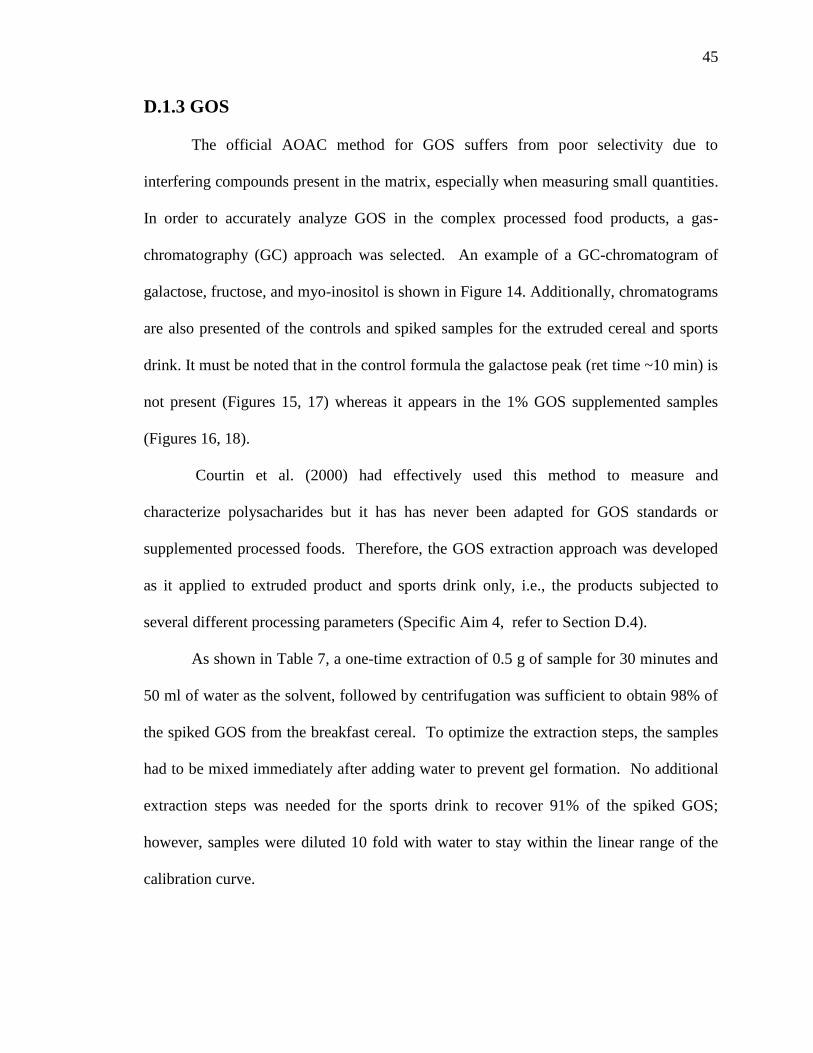
D.1.3 GOS
The official AOAC method for GOS suffers from poor selectivity due to
interfering compounds present in the matrix, especially when measuring small quantities.
In order to accurately analyze GOS in the complex processed food products, a gas-
chromatography (GC) approach was selected. An example of a GC-chromatogram of
galactose, fructose, and myo-inositol is shown in Figure 14. Additionally, chromatograms
are also presented of the controls and spiked samples for the extruded cereal and sports
drink. It must be noted that in the control formula the galactose peak (ret time ~10 min) is
not present (Figures 15, 17) whereas it appears in the 1% GOS supplemented samples
(Figures 16, 18).
Courtin et al. (2000) had effectively used this method to measure and
characterize polysacharides but it has has never been adapted for GOS standards or
supplemented processed foods. Therefore, the GOS extraction approach was developed
as it applied to extruded product and sports drink only, i.e., the products subjected to
several different processing parameters (Specific Aim 4, refer to Section D.4).
As shown in Table 7, a one-time extraction of 0.5 g of sample for 30 minutes and
50 ml of water as the solvent, followed by centrifugation was sufficient to obtain 98% of
the spiked GOS from the breakfast cereal. To optimize the extraction steps, the samples
had to be mixed immediately after adding water to prevent gel formation. No additional
extraction steps was needed for the sports drink to recover 91% of the spiked GOS;
however, samples were diluted 10 fold with water to stay within the linear range of the
calibration curve.

46
Table 7. Optimization conditions for extracting GOS from sports drink and
breakfast cereal
Food Product
Amount of sub-
sample analyzed
Extraction Solvent
(water)
Further procedures
for extraction
optimization
Extruded cereal
0.50 ± 0.05 g
50.0 ± 0.1 ml
Mix immediately after
adding water to
prevent gel formation.
Mix for 30 min,
followed by
centrifugation at 4500
rpm for 20 min
Sports drink 1.00 ±.05 ml 10.0 ± 0.1 ml Mix, no extraction
needed.
Figure 12. GC chromatogram of GOS (1mg/ml). Peaks: galactose (ret time 10.12
min), glucose (ret time 10.83 min) myo-inositol (11.26 min).

47
Figure 13. GC chromatogram of sports drink control. Peaks: fructose (ret time
9.473 min), glucose (11.31 min) myo-inositol (11.75 min).
Figure 14. GC chromatogram of sports drink spiked with 1% GOS. Peaks:
Fructose (ret time 9.495 min), galactose (10.32 min), glucose (11.21 min), myo-Inositol
(11.26 min).
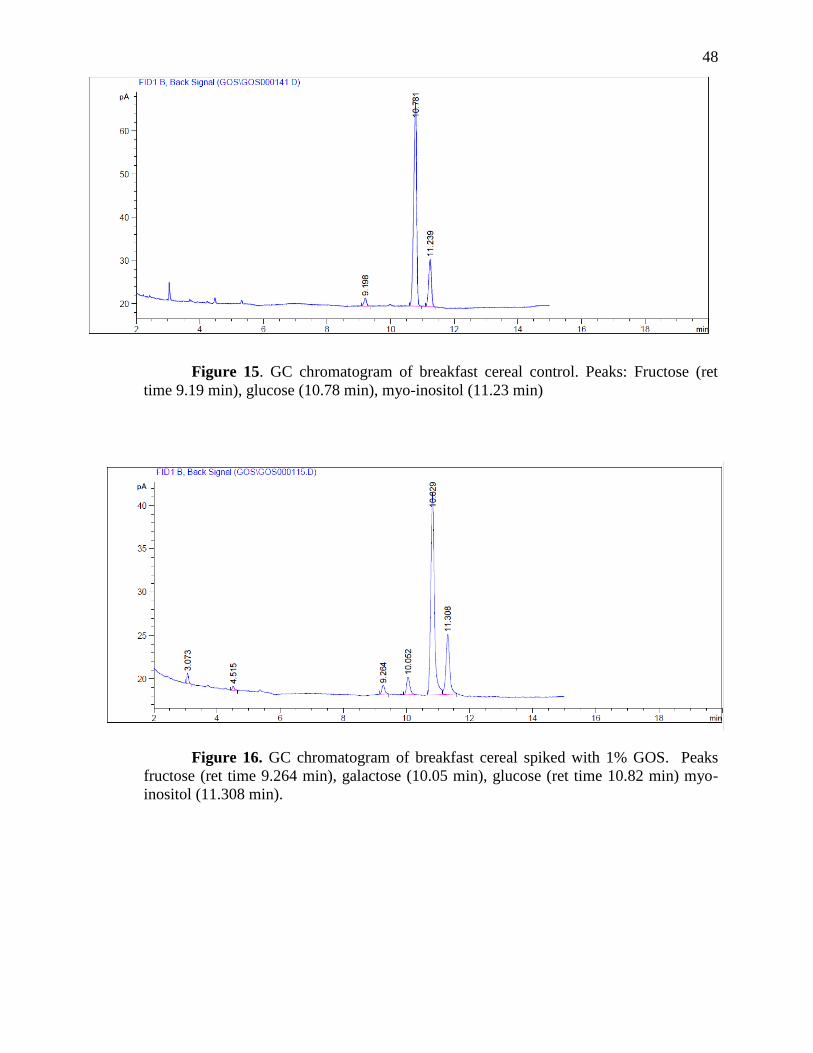
48
Figure 15. GC chromatogram of breakfast cereal control. Peaks: Fructose (ret
time 9.19 min), glucose (10.78 min), myo-inositol (11.23 min)
Figure 16. GC chromatogram of breakfast cereal spiked with 1% GOS. Peaks
fructose (ret time 9.264 min), galactose (10.05 min), glucose (ret time 10.82 min) myo-
inositol (11.308 min).

49
D.2 Specific Aim 2: Method Validation
Selective and sensitive analytical methods for the quantitative evaluation of
prebiotics in different food matrices are critical to evaluate their stability during different
food preparation procedures. Therefore, the analytical methods optimized in Specific
Aim 1 were validated to ensure reliable and reproducible measurement of each prebiotic
in each food matrix. Method validation included accuracy, precision, linearity, limit of
detection, limit of quantitation and selectivity (AOAC, 1998).
D.2.1 FOS
Linearity of the FOS assay was evaluated with each food product to confirm the
performance of the method and the equipment. FOS standards ranging from 0.25-7.5
mg/ml resulted in consistently linear calibration curves with strong correlations (r > 0.90)
for kestose, nystose and 1-fructofuranosyl nystose (Table 9). These calibration curves
were then used to determine limits of detection and quantitiation. The results showed that
both parameters were lower than 1% for all the food products. The sports drink exhibited
the lowest limits of detection and quantitation at 0.008% and 0.014%, respectively. On
the other hand, the remaining food products produced detection limits from 0.14-0.21%
and quantitation limits from 0.43- 0.75%.
Effects from differences in food matrices were predominantly reflected in method
accuracy and precision. Method precision was determined by calculating the percent
relative standard deviation (% RSD) of spiked samples (n=5) below (0.5%) and above
(2%) the target amount to be supplemented in the food products (1%) (Table 9). The
sports drink showed the highest precision (1-4%) while the breakfast cereal exhibited the
lowest precision (18-27%). The complexity of the matrix and the presence of interfering

50
compounds in the breakfast cereal, as opposed to a liquid matrix requiring minimum
clean-up and handling steps, might have contributed to the differences in precision
between the breakfast cereal and the sports drink. Moreover, variability decreased as the
% prebiotic increased for all the food products with the notable exception of the cookie.
In this case, the lowest %RSD (2%) occurred for the 0.5% spiked prebiotic sample as
opposed to a %RSD of 19% when spiked with 2% prebiotic. The high sucrose content in
the cookie probably increased the amount of solutes in the extraction solvent allowing
lower amounts of prebiotic (i.e. 0.5%) to be extracted and dissolved. Higher amounts
(i.e. 2%) might have caused the solvent to reach or to be close to the saturation point
resulting in partial extractions of the prebiotic. One possible solution would be to increase
the volume and/or the temperature of solvent to prevent saturation. Moreover, method
accuracy, as determined by percent recoveries of spiked prebiotic in the control samples,
was between 80 and 100% for the cookie, sports drink and muffin. For food products
with less than 90% recovery, as is the case of breakfast cereal and nutritional bar, a
correction factor was applied to the final results when analyzing prebiotic supplemented
food products after processing.

51
Table 8. Method performance characteristics for FOS in different food products
Breakfast
cereal Cookie Muffin Nutrition
bar Sports drink Linearity (regression analysis
Kestose : 0.25 - 7.5 mg/ml(n=3)
y = 103688x -26321
r=0.9996
y = 258152x
+186097
r=0.9753
y = 272931x
+80203
r=0.9970
y = 285392x
+128321
r2=0.9998
y = 3123539x
+ 16253 r= 0.9999
Nystose: 0.25 - 7.5 mg/ml (n=3)
y = 136427x - 36158
r = 0.9996
y = 273142x
– 112449 r = 0.9973
y = 272931x
+ 80203 r = 0.9976
y = 273098x
+ 48825 r = 0.9987
y= 2722490x
+ 21160 r= 0.9999
1-fructofuranosyl
nystose: 0.25-7.5 mg/ml
(n=3)
y = 32660x - 1093.5
r = 0.9988
y = 272058x
– 60167 r = 0.9751
y = 268210x - 6532.1
r = 0.9973
y = 276210x
– 11172 r = 0.9986
y= 2615410x
+ 28631 r² = 0.9995
Precision (%RSD)
Standard:0.5% (n=5) 26.98 2.37 38.70 24.15 3.88 Standard: 1% (n=5) 20.25 22.80 16.64 8.16 3.88 Standard: 2% (n=5) 18.44 18.88 3.85 8.27 0.73 Detection limit (%)
Kestose
0.046 0.050 0.003 0.048 0.001
Nystose 0.078 0.090 0.000 0.000 0.003
1-fructofuranosyl nystose 0.088 0.050 0.143 0.093 0.004
Total FOS 0.213 0.190 0.146 0.141 0.008
Quantitation limit (%)
Kestose 0.090 0.270 0.140 0.274 0.003
Nystose 0.150 0.104 0.000 0.000 0.006
1-fructofuranosyl nystose 0.230 0.058 0.560 0.320 0.005
Total FOS 0.467 0.432 0.700 0.594 0.014 Accuracy/specificity
(%recovery) Standard:0.5%(n=5) 106.99 92.02 107.53 90.98 100.62 Standard: 1% (n=5) 81.62 103.7 103.41 82.07 102.19
Standard: 2% (n=5) 84.01 86.75 100.65 79.41 94.08

52
D.2.2 Inulin
As shown in Table 10, method linearity of the inulin assay was evaluated by
constructing a 5 point calibration curve with standards ranging from 3-30 mg/ml.
Calibration curves were re-evaluated with each food product analysis generating
regression lines with strong correlation coefficients (r > 0.99). In addition, method
precision was determined by again analyzing the %RSD of the control samples (n=5)
spiked with 0.5%, 1%, and 2% inulin (w/v). For the 1% spiked samples, %RSD ranged
between 5-18% for all the products. The sports drink produced the lowest %RSD (3-8%)
whereas %RSD were the highest for the cookies (5-32%) and breakfast cereal (7-30%).
The lowest limit of detection (0.14%) resulted for sports drink while the
nutritional bar exhibited the highest limit of detection (2.55%). A similar trend occurred
for the limit of quantification with the lowest values produced for the sports drink
(0.24%) and the highest for the nutrition bar (4.64%). With the exception of sports drink,
both limits of detection and quantitation were over the target amount of prebiotic to be
supplemented in the food products (1%). However, this problem was addressed during
the method optimization as the matrix response was taken into account when calculating
the amount of inulin present in the samples (Table 6). Because the percent recoveries
were above 110% for both the spiked breakfast cereal and the muffin, a correction factor
was applied when calculating the amount of inulin present in the supplemented products
after processing.
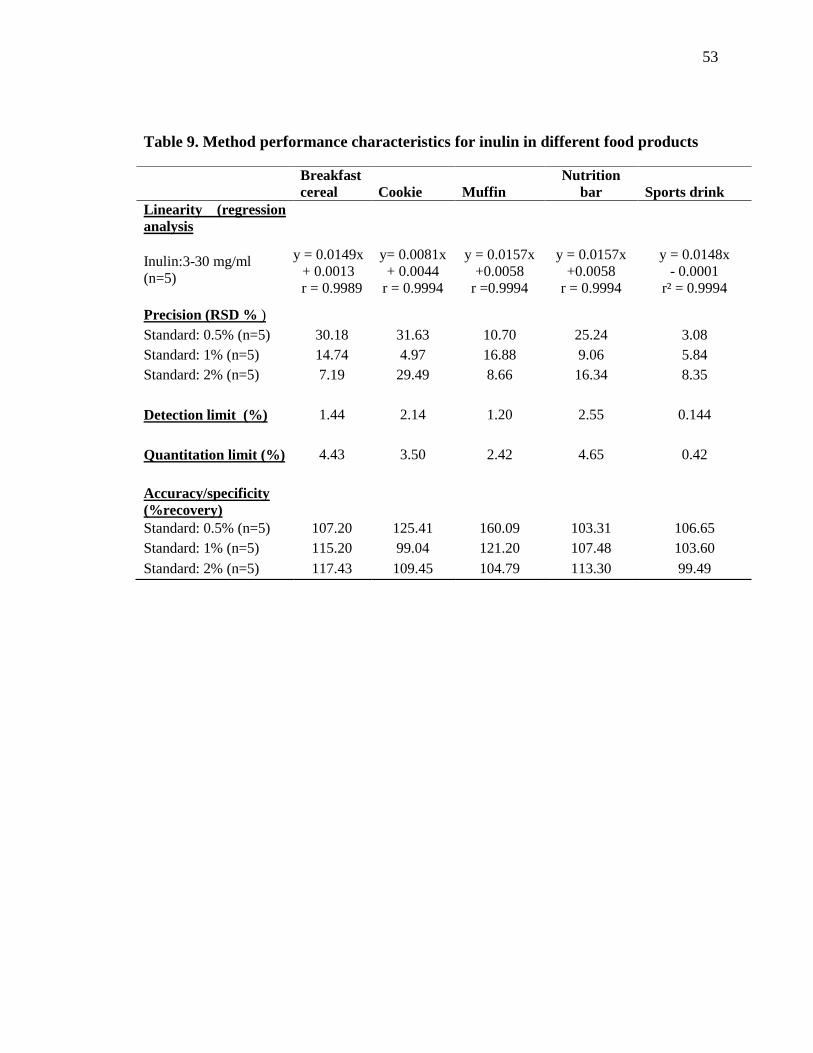
53
Table 9. Method performance characteristics for inulin in different food products
Breakfast
cereal Cookie Muffin Nutrition
bar Sports drink Linearity (regression
analysis
Inulin:3-30 mg/ml (n=5)
y = 0.0149x
+ 0.0013 r = 0.9989
y= 0.0081x
+ 0.0044 r = 0.9994
y = 0.0157x
+0.0058 r =0.9994
y = 0.0157x
+0.0058 r = 0.9994
y = 0.0148x
- 0.0001 r² = 0.9994
Precision (RSD % )
Standard: 0.5% (n=5) 30.18 31.63 10.70 25.24 3.08
Standard: 1% (n=5) 14.74 4.97 16.88 9.06 5.84
Standard: 2% (n=5) 7.19 29.49 8.66 16.34 8.35
Detection limit (%) 1.44 2.14 1.20 2.55 0.144
Quantitation limit (%) 4.43 3.50 2.42 4.65 0.42
Accuracy/specificity
(%recovery) Standard: 0.5% (n=5) 107.20 125.41 160.09 103.31 106.65
Standard: 1% (n=5) 115.20 99.04 121.20 107.48 103.60
Standard: 2% (n=5) 117.43 109.45 104.79 113.30 99.49

54
D.2.3 GOS
The linearity of the assay and r values of the GOS method were confirmed by
constructing 5 point calibration curves with galactose, glucose, and myo-inositol each
ranging in concentration from 1-20 mg/ml (Table 11). Linear regions were obtained for
each standard at the cited concentration range with coefficient correlations greater than
0.99.
Additionally, overall method precision was high as indicated by low %RSD
values for samples (n=5) spiked with each of three levels of GOS (0.5%, 1%, and 2%
(w/w), and (w/v) in the sports drink. Method precision for the sport drink at 1% GOS
was 2%, whereas a %RSD of 7% and 6% resulted for the 0.5% and 2% GOS spiked
drink, respectively. Likewise the breakfast cereal exhibited a %RSD of 8% for the 0.5%
and 1% spiked base formula with a slightly lower %RSD (5%) for the 2% GOS spiked
sample.
Limits of detection for GOS were 0.024% in the sports drink and 0.032% in the
breakfast cereal. The lowest quantitatable percent of GOS was 0.024% for the sports
drink and 0.093% for the breakfast cereal. As these values were below the amount of
prebiotic supplemented in the food matrices, the method was considered suitable to apply
to the supplemented food systems. Furthermore, the method presented high percent
recoveries for both the breakfast cereal (98%) and sports drink (91%) indicating a high
accuracy and specificity of the assay. A summary of all the method performance results
are shown in Table 11.

55
Table 11. Method performance characteristics for GOS in different food products
Breakfast cereal Sports drink
Linearity (regression analysis
Galactose: 1- 20 mg/ml (n=3) y = 361610x - 30357
r = 0.9985
y = 361610x – 30357
r = 0.9985
Glucose 1- 20 mg/ml (n=3) y = 306002x + 59647
r = 0.9992
y = 306002x + 59647
r = 0.9992
myo-inositol: 1- 20 mg/ml (n=3) y = 461702x - 61489
r = 0.9984
y = 461702x - 61489
r = 0.9998
Precision (RSD % )
Standard: 0.5% (n=5) 7.68 6.99 Standard: 1% (n=5) 8.32 1.63 Standard: 2% (n=5) 4.7 6.45
Detection limit (%)
GOS 0.032 0.024
Quantitation limit(%) 0.093 0.024 GOS
Accuracy/specificity (%recovery)
Standard: 0.5% (n=5) 132.60 86.68 Standard: 1% (n=5) 97.71 91.42 Standard: 2% (n=5) 101.54 91.59

56
D.3 Specific Aim 3: Analysis of 1% prebiotic supplemented
food products
Published data remain limited about the stability of prebiotics exposed to different
food processes such as baking, extrusion, pasteurization, high temperature heating, low
pH condition, etc., despite the food industry’s interest in supplement products. The
objective of Specific Aim 3 was to determine the prebiotic content after processing food
products supplemented with 1% (w/w) FOS, inulin, and GOS. The optimized and
validated method for each matrix (Specific Aim 1-2) was then applied to the
supplemented prototype foods. The muffin was prepared and kept in the freezer at -20 ˚C
whereas the extruded cereal, cookie, and nutritional bar were prepared and maintained at
ambient temperature prior to analysis. The sports drink, with equal amounts of sucrose
and corn syrup solids, was adjusted to pH 3.5, pasteurized at 79 ˚C and stored at room
temperature.
D.3.1 FOS
As shown in Table 12 and Figure 19, recoveries were 100%, 91% and 113% for
the supplemented muffin, cookie and nutrition bar, respectively. For the breakfast cereal,
only 47% of the supplemented FOS remained after extrusion at optimal conditions (170
rpm and 140 °C). Similarly, only 54% of the FOS supplemented into the sports drink was
recovered for a formulation pH of 3.5 and a pasteurization temperature of 79 ˚C.
According to L’Homme et al. (2003) and Voragen (1998), FOS are unstable at elevated
temperatures and low pH, which may have contributed to the low recoveries for the
cereal and sports drink. Extruded materials are also exposed to intense mechanical shear
and high pressure in addition to high temperature (Bjorck et al. 1984). Redistribution

57
of soluble and insoluble fiber occurs during extrusion of whole grains, meaning structural
changes occur at the molecular level (Bjorck et al., 1984; Guadalberto & Kazemzadeh
1997); this effect may have also contributed to the degradation FOS in the breakfast
cereal.
D.3.2 Inulin
Percent recoveries of inulin were determined by subtracting the fructan content in
the base formula and applying the corresponding correction factor. Recoveries of 106%,
103% and 107% and 126% were obtained for the supplemented extruded cereal, nutrition
bar, sports drink and muffins, respectively (Table 13 and Figure 20). On the other hand,
the percent recovery of inulin in the cookies was approximately 300%. This outcome
was expected as the optimization of the method was not achieved most likely due the
high sucrose content in the matrix.
D.3.3 GOS
Stability of the GOS was assessed by applying the validated method to the
extruded cereal and sports drink. As shown in Table 14 and Figure 19, percent recoveries
for the extruded cereal and the sports drink were ~ 100% indicating that the cited process
parameters used did not affect GOS stability.

58
Table 10. Percent recoveries of 1% FOS supplemented food products after
processing.
FOS content
Sample Before
correction factor
After
correction factor
% Recovered
Extruded cereal
0.39 ± 0.01
0.47 ± 0.01
47%
Muffins 0.91 ± 0.07 - 91%
Cookie 1.01± 0.12 - 100%
Nutrition bar 0.94 ± 0.05 1.13 ± 0.63 113%
Sports Drink 0.54 ±0.08 - 54%
Results shown as MEAN ± STD (n=3)
Figure 17. Percent recovery of 1% supplemented FOS in different prototype foods after
processing. Results shown as MEAN ± STD (n=3).
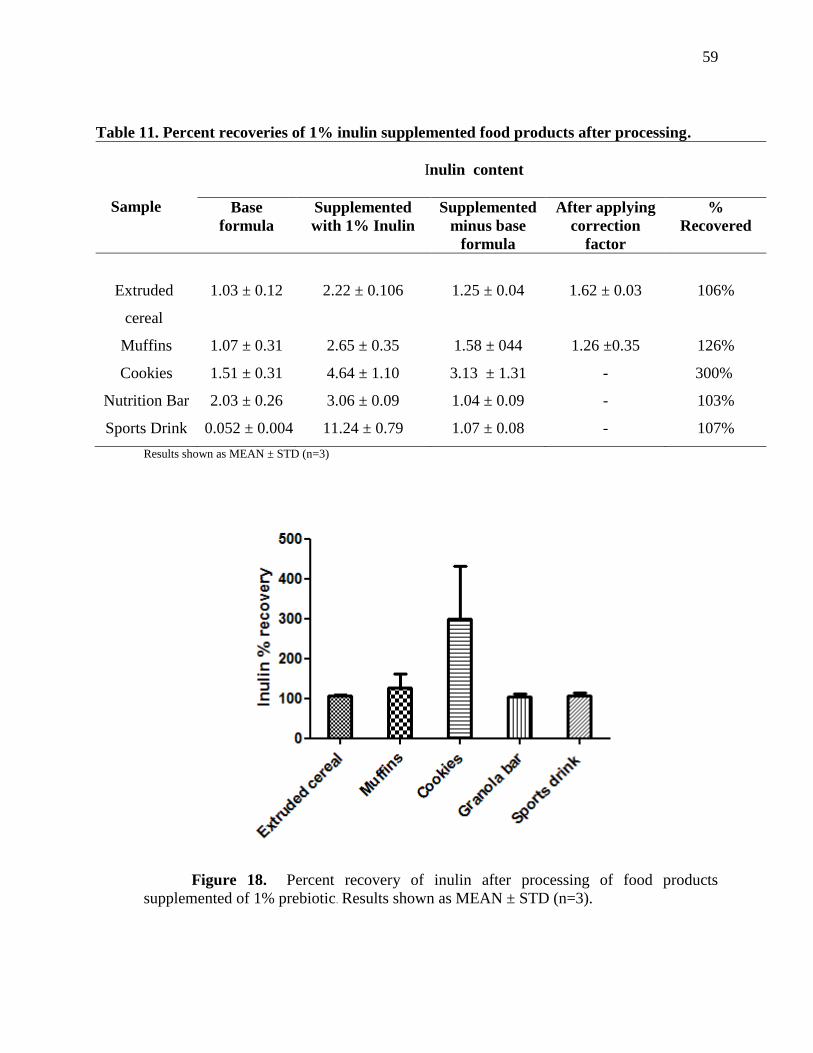
59
Table 11. Percent recoveries of 1% inulin supplemented food products after processing.
Sample
Inulin content
Base
formula
Supplemented
with 1% Inulin
Supplemented
minus base
formula
After applying
correction
factor
%
Recovered
Extruded
cereal
1.03 ± 0.12
2.22 ± 0.106
1.25 ± 0.04
1.62 ± 0.03
106%
Muffins 1.07 ± 0.31 2.65 ± 0.35 1.58 ± 044 1.26 ±0.35 126%
Cookies 1.51 ± 0.31 4.64 ± 1.10 3.13 ± 1.31 - 300%
Nutrition Bar 2.03 ± 0.26 3.06 ± 0.09 1.04 ± 0.09 - 103%
Sports Drink 0.052 ± 0.004 11.24 ± 0.79 1.07 ± 0.08 - 107%
Results shown as MEAN ± STD (n=3)
Figure 18. Percent recovery of inulin after processing of food products
supplemented of 1% prebiotic. Results shown as MEAN ± STD (n=3).

60
Table 12. Percent recoveries of 1% GOS supplemented food products after processing
Sample
GOS content
Supplemented with 1%
GOS
% Recovery
Extruded cereal
1.06 ± 0.034
106%
Sports drink
1.07 ±0.078
107% Results shown as MEAN ± STD (n=3)
Figure 19. Percent GOS after processing of food products supplemented of 1%
prebiotic. Results shown as MEAN ± STD (n=3).

61
D.4. Specific aim 4. Chemical fate of FOS, GOS and inulin
during various processing treatments
To further evaluate the chemical stability of prebiotics in the breakfast cereal,
different screw speeds and barrel temperatures were used during the extrusion.
Specifically, 120 °C and 170 °C were used for the low and high barrel temperatures; and
120 rpm and 220 rpm were used for the low and high screw speeds. (Refer to Figure 13
for d). Three trials for each prebiotic were conducted using a split plot design where one
optimal condition was held (i.e. barrel temperature or screw speed), while the other
condition was varied.
To determine the effects of pH and reducing sugar content on stability of the
prebiotics in sports drinks, various sweetener ratios of sucrose: corn syrup solids (1:1,
1:2, 2:1) were tested at different pH values (3.0, 3.4 and 4.0). The experiment was
completely randomized with a split-plot design, where the sweetener composition was
held and pH was varied for each trial (n=3).
D.4.1 Chemical fate of FOS in the breakfast cereal
As shown in Figure 20, extrusion in general reduced the levels of supplemented
FOS in the breakfast cereal. During optimum extruding conditions less than 50% of the
initial supplemented FOS was recovered. A similar tendency occurred regardless of the
extruding condition but the lowest FOS levels were recovered when extrusion was held at
the highest temperature (170 °C).
Several mechanisms could be involved in the degradation of FOS. For example,
the higher screw speed exposes the FOS to sheer stress. At lower screw speeds the
pressure within the extruder is increased due to higher screw fill, hence that product is

62
exposed to high temperature and pressure for a longer time, resulting in chemical bond
breakage of the macromolecules (Guadalberto et al. 1997). Furthermore, liability of FOS
to heat hydrolysis has been well demonstrated in previous studies (L'Homme et al. 2003;
Matusek et al. 2009; Kewicki 2007).
D.4.2 Chemical fate of inulin in breakfast cereal
Optimal and low temperature extruding conditions did not significantly affect
inulin levels in the supplemented breakfast cereal. However, variations in screw speeds
resulted in recoveries of 25% and 34% at 120 rpm and 170 rpm, respectively (Figure 23).
Additionally, low levels of inulin (35%) were recovered after high temperature (170 °C)
extruding conditions. Although Böhm et al. (2005) showed that thermal treatment of
inulin at temperatures between 135 and 195 °C can induce significant degradation, there
remains a significant lack of scientific information on the thermal stability of inulin
during extrusion.
D.4.3 Chemical fate of GOS in breakfast cereal
Based on the results obtained from this study, GOS was stable at all extrusion
conditions with 99% recoveries for the product processed under the optimal processing
conditions. As shown in recoveries of 115%, 105% and 102% occurred at high screw
speed, low screw speed and low barrel temperatures, respectively. The lowest levels
(81%) were recovered when the breakfast cereal was extruded at the highest temperature
but the results were not significantly different (p>0.05) from the optimal conditions.

63
Figure 20. FOS recovery in breakfast cereal supplemented with 1% FOS and
extruded under different screw and temperature conditions. Results shown as MEAN ±
STD (n=3). Bars with different letters are statistically different (p>0.05) using Tukey
HSD test.

64
Figure 23. Inulin recovery in breakfast cereal supplemented with 1% Inulin and
extruded under different screw and temperature conditions .Results shown as MEAN ±
STD (n=3). Bars with different letters are statistically different (p>0.05) using Tukey
HSD test.

65
Figure 24. GOS recovery in breakfast cereal supplemented with 1% GOS and
extruded under different screw and temperature conditions. Results shown as MEAN ±
STD (n=3). Bars with different letters are statistically different (p>0.05) using Tukey
HSD test.

66
D.4.4 Chemical fate of FOS in sports drink
FOS was more stable as the pH increased in the sports drink, regardless of the
sweeter composition (Figure 23). Although a percent recovery of 97% resulted for the
supplemented FOS at pH 4.0 and lower reducing sugar content (S:CSS 2:1), the results
were not significantly different (p>0.05) from the other sweetener ratios. At pH 3 and pH
3.5, recoveries of less than 70% independent of the sweetener composition were
obtained. Nevertheless, percent recovery (37%) was significantly (p<0.05) decreased at
pH 3 and equal amounts of sucrose and corn syrup solids. Previous studies have reported
low FOS stability at elevated temperatures and low pH (Blecker et al. 2002; L'Homme et
al. 2003; Matusek et al. 2009; Kewicki 2007), fructose furanosyl residues in the FOS are
believed to be prone to the acid hydrolysis (Voragen 1998).
D.4.5 Chemical fate of inulin in sports drink
Compared to FOS, inulin was more stable regardless of the pH or sweetener
composition (Figure 24.). The lowest inulin recovered (90%) resulted at pH 3 with added
sucrose and corn syrup solids at 1:1 ratio. This result was statistically different (p>0.05)
form those obtained for the pH 3.5 and pH 4.0 formulations at the same sweetener
compositions but no significant differences occurred for the other treatments. Christian
et al. (2000) reported degradation of inulin at high temperature (160 ᵒC) in the presence
of citric acid. According to L'Homme et al. (2003) hydrolisis is caused by the
protonation of oxygen in the glycosidic bond.

67
D.4.6 Chemical fate of GOS in sports drink
As shown in Figure 23, supplemented GOS was stable at all pH values and/or
sweetener conditions. Overall, GOS had the greatest stability in the sports drink among
the studied prebiotics with recoveries > 95% at pH 3 and pH 3.5. Lower levels were
recovered at pH 4 but were not significantly different (p>0.05) from the other treatments.
Stability of GOS at high temperatures and acid conditions has been evaluated and
confirmed by several authors. Kewicki (2007) reported that GOS had not undergone
hydrolysis at pH 3 with heating at 100 ᵒC for 10 min, and only low losses occurred (5%)
when the pH was dropped to 2.0. The presence of the different β-bonds was attributed to
GOS thermostability at low pH (Voragen 1998). Hence, the results obtained from this
study are in very good agreement with the literature.

68
Figure 21. FOS recovery in sports drink supplemented with 1% FOS prepared
and under different pH and sweetener ratios. Results shown as MEAN ± STD (n=3). Bars
with different letters are statistically different (p>0.05) using Tukey HSD test.

69
Figure 22. Inulin recovery in sports drink supplemented with 1% inulin and
prepared under different pH and sweetener ratios. Results shown as MEAN ± STD (n=3).
Bars with different letters are statistically different (p>0.05) using Tukey HSD test.

70
Figure 23. GOS recovery in sports drink supplemented with 1% GOS and
prepared under different pH and sweetener ratios. Results shown as MEAN ± STD (n=3).
Bars with different letters are statistically different (p>0.05) using Tukey HSD test
71
E. CONCLUSIONS
There is an increasing interest in the use of prebiotics as food ingredients capable
of modifying the intestinal microbiota as a means to confer beneficial health effects.
Therefore, it is essential that prebiotics remain stable under typical food manufacturing
and processing conditions. In this project, methods for extracting and analyzing 3
commonly studied prebiotics (inulin, FOS and GOS) were initially developed and
validated for different processed prototype food products. Depending on the complexity
of the food matrix, optimized extraction procedures were required. When the method
accuracy was below 90% or above 110%, correction factors were applied for the analysis
of some supplement products. Method accuracy was determined via a spiked recovery
approach, which is not a typical step for food based ingredients. Results indicated that
method’s precision (%RSD) decreased as the matrix complexity increased but linear
calibration curves with strong correlation coefficients (r > 0.90) were generated for each
method.
Optimized methods for monitoring FOS and GOS presented low detection and
quantitation limits, resulting in reliable techniques to analyze low amounts of the
prebiotics in the presence of complex matrices. On the other hand the enzymatic-
spectrophotometric method to analyze inulin presented high detection and quantitation
limits and accuracy was affected by compounds present in the food matrix. Hence,
additional research is needed to develop a robust and high throughput method to monitor
inulin in the presence of complex food matrices.

72
Finally, degradation of FOS and inulin must be considered when added as a
prebiotic ingredient into thermally treated foods, especially in presence of acid. On the
other hand, this study showed that GOS was stable to high temperature and low pH.

73
References
AACC Int. (1994). Total Dietary Fiber-Determined as Neutral Sugar Residues, Uronic
Acid Residues, and Klason Lignin (Uppsala Method) Method 32-25. In A.
International, AACC International. Approved Methods of Analysis (11 ed.). St.
Paul, MN, U.S.A.
AACC Int. (2001). Measurement of Total Fructan in Foods by an
Enzymatic/Spectrophotometric Method (Method 32-32.01). In 2001, AACC
International Aproved Methods of Analysis (11 ed.). St. Paul, MN, USA.
Alander, M., Matto, J., Kneifel, W., Johansson, M., Kogler, B., Crittenden, R., et al.
(2001). Effect of galactoologosaccharide suplementation on human fecal
microflora and on survival and persistance of Bifidobacterium lactis Bb-12 in the
gastrointestinal tract. International Dairy Journal, 11, 817-825.
Albayrak, N., & Yiang, S. (2002). Production of galacto-oligosaccharides from Lactose
by Aspergillus orizae β-galactosidase immobilized on cotton cloth. Biotechnology
and Bioengineering, 77, 8-19.
Albrecht, S., Schols, H., Klarenbeek, B., Voragen, A., & Gruppen, H. (2010). Introducing
capillary electrophoresis with laser-indced fluorescence (CE-LIF) as a potential
analysis and quantification tool for galactooligosaccharides extracted from
complex food matrices. Journal of Agricultural and Food Chemistry , 58, 2787-
2794.
Alles, M., Hartemink, R., Meyboom, S., Harryvan, J., Van Laere, J., Nagengast, F., et al.
(1999). Effect of trasgalactooligosaccharides on the composition of the human
intestinal microflora and on putative risk markers for colon cancer. American
Journal of Clinical Nutrition, 69, 980 991.
Alsaffar, A. A. (2011). Effect of food processing on the resistant starch content of cereals
and cereal products-A review. International Journal of Food Science and
Technology, 46, 455-462.

74
Antosova, M., Polakovic, M., & Bales, V. (1999). Separation of fructoologosaccharides
on a cation-exange HLPC column in silver form with refractometric detection.
Biotechnology Techniques, 13, 889-882.
AOAC. (1998). AOAC peer verifies methods program; Method on policies and
procedures,. Retrieved from www.aoac.org
AOAC. (2002). AOAC Official Method 999.03 Measurement of the total fructan in foods.
Archer, B., Johnson, S., Devereux, H., & Baxter, A. (2004). Effect of fat replacement by
inulin or lupin-kernel fibre on sausage patty acceptability, post-meal perceptions
of satiety and food intake in men. British Journal of Nutrition , 91, 591-599.
Bakker-Zierikzee, A., Tol, E., Kroes, H., Alles, M., & Kok, F. (2006). Faecal SIgA
secretion in infants fed on pre- or probiotic infant formula. Pediatric Allergy
Immunology, 17, 134-140.
Bankova, E., Bakalova, N., Petrova, S., & Kolev, D. (2006). Enzymatic Synthesis of
Oligosaccharides and Alkilglycosides in Water-Organic Media via
Transglycosylation of Lactose. Biotechnology and Biotechnological Equipment,
114-119.
Ben, X., Zhou, X., Zhao, W., Yu, W. P., Zhang, W., Wu, S., et al. (2004).
Supplementation of milk formula with galactooligosaccharides impoves intestinal
microflora and fermantation in term infants. Chinese Medical Journal, 117, 927-
931.
Berreteau, H., Delattre, C., & Michaud, P. (2006). Production of Oligosaccharides as
promising New Food Aditive Generation. Food Technology and Biotechnology,
44, 323-333.
Birkett, A., & Francis, C. (2009). Short-Chain Fructo-oligosaccharides: A low Molecular
Weight Fructan. In S. Cho, Handbook of Prebiotics and Probiotics Ingredients:
Health Benefits and Food. (pp. 14-38). CRC Press.
Bjorck, I., Nyman, M., & Asp, N.-G. (1984). Extrusion cooking and dietary fiber: effects
on dietary fiber content and on degradation in the rat intestinal tract. Cereal
Chemistry, 61, 175-179.

75
Blecker, C. F., Van Herck, J., Chevelier, J., & Paquot, M. (2002). Kinetic Study of the
Acid Hydrolysis of Various Oligofructose Samples. Journal of Agricultural Food
Chemistry, 50, 1602-1607.
Böhm, A., Kaise, I., Trebstein, A., & Henle, T. (2005). Heat-induced degradation of
inulin. European Food Research and Technology, 220, 466-471.
Bouhnik, Y., Achour, L., Paineau, D., Riottot, A., & B., F. (2007). Four-week short chain
fructo-oligosaccharides ingestion leads to increasing fecal bifidobacteria and
cholesterol excretion in healthy elderly volunteers. Nutrition Journal , 42, 42-46.
Bouhnik, Y., Raskine, L., Simoneau, G., Vicaut, E., Neut, C., Flourié, B., et al. (2004).
The capacity of nondigestible carbohydrates to stimulate fecal bifidobacteria in
healthy humans: a double-blind, randomised, placebo-controlled, parallel-group,
dose-response relation study. American Journal of Clinical Nutrition , 80, 1658-
1664.
Bruzzese, E., Volpicelli, M., Squeglia, V., Bruzzese, D., Salvini, F., Bisceglia, M., et al.
(2009). A formula containing galacto- and fructo-oligosaccharides prevents
intestinal and extra-intestinal infections: an observational study. Clinical Nutrition
, 28, 156-161.
Buddington, R., Williamsn, C., Chen, S., & Wintherly, S. (1996). Dietary supplement of
neosugar alters the fecal flora and decreases activities of some reductive enzymes
in human subjects. American Journal of Nutrition , 63, 709-716.
Bunce, T., Howard, M., Kerley, M., Alle, G., & Pace, L. (1995). Protective effect of
fructooligosaccharide (FOS) in prevention of mortality and morbidity from
infectious E coli K:88 challenge. American Journal of Animal Science, 63, 1784-
1788.
Campbell, J. M., Bauer, L., Fahey, G. C., H. A., Wolf, B., & Hunter, D. E. (1997).
Selected Fructooligosaccharide (1-kestose, Nystose, and 1-
Fructofunarosylnystose) Composition of Food and Feeds. Journal of Agricultural
and Food Chemistry , 45, 3076-3082.
Cani, P., Joly, E., Horsmans, Y., & Delzene, N. (2006). Oligofructose promotes satiety in
healthy human: a pilot study. European Journal of Clinical Nutrition, 60, 567-
572.

76
Casellas, F., Borruel, N., Torrejón, A., Varela, E., Antolin, M., Guarner, F., et al. (2007).
Oral oligofructose-enriched inulin supplementation in acute ulcerative colitis is
well tolerated and associated with lowered faecal calprotectin. Alimentary
Pharmacology & Therapeutics, 9, 1061-10670.
Causey, J., Feirtag, J., Gallaher, D., Tubgland, B., & Slavin, J. (2000). Effects of dietary
inulin on serum lipids, blood glucose and the gastrointestinal environment in
hypercholesterolemic men. Nutrition Research , 20, 141-201.
Cherbut, C. (2002). Inulin and oligofructose in the dietary fiber concept. British Journal
of Nutrition , 159-162.
Chonan, O., & Watanuki, M. (1995). Effect of galactooligosaccharides on calcium
absorption in rats. Journal of Nutrition Science and Vitaminology., 41, 95-104.
Chonan, O., & Watanuki, M. (1996). The effect of 6'-galactooligosaccharides on bone
mineralization of rats adapted to different levels of dietary calcium. International
journal for vitamin and nutrition research, 66, 244-249.
Correa-Matos, N., Donovan, S., Isaacson, R., Gaskins, H. W., & Tappenden, K. (2003).
Fermentable fiber reduces recovery time and improves intestinal fuction in piglets
following Salmonella typhimurium infection. Journal of Nutrition , 133, 1845-
1852.
Coundray, C., Bellanger, J., Castilglia-Delavaud, C., Remesy, C., Vermorel, M., &
Rayssignuier, Y. (1997). Effect of soluble or partly soluble dietary fibres
supplementation on absorption and balance of calcium, magnesium, iron and zinc
in healthy young men. European Journal of Clinical Nutrition, 51, 375-380.
Courtin, C., Swennen, K., Verjans, P., & Delcour, J. (2009). Heat and pH stability of
prebiotics arabinoxylooligosaccharides, xylooligosaccharides and
fructooligosaccharides. Food Chemistry, 112, 831-837.
Courtin, C., Van den Broek, H., & Delcour, J. (2000). Determination of reducing end
sugar residues in oligo- and polysaccharides by gas -liquid chromatography.
Journal of Chromatography A, 866, 97-104.
Crittenden, R., & Playne, M. (2006). Modifying the Human Intestinal Microbiota with
Prebiotics. In A. Ouwehand, & E. Vaugha, Gastrointestinal Microbiology (pp.
285-302). CRC Press / ITPS.
77
Davis, L., Martinez, I., Walter, J., & Hutkins, R. (2010). A dose dependent impact of
prebiotic galactooligosaccharides on the intestinal microbiota of healthy adults.
International Journal of Food Microbiology, 144, 285-292.
de Slegte, J. (2002). Determination of trans-galactooligosaccharides in selected food
products by ion-exchange chromatography: colaborative study. Journal of AOAC
international, 85, 417-423.
Delcour, J. A. (2010). Principles of Cereal Science and Tecnology. St Paul, MN, U.S.A:
AACC International , Inc.
Delzenne, N., & Kok, N. (2001). Effects of fructans-type prebiotics on lipid metabolism.
American Journal of Clinical Nutrition, 73, 456s-458s.
Den Hond, E., Geypens, B., & Ghoos, Y. (2000). Effect of high performance chicory
inulin on constipation. Nutrition Research, 20, 731-736.
Dias, L., Veloso, A., Correia, D., Rocha, O., Torres, D., Rocha, I., et al. (2008). UV
spectrophotometry method for the monitoring of galacto-oligosaccharides
production. Food Chemistry, 113, 246-252.
Drakoularakou, A., Tzortzis, G., Rastall, R., & Gibson, G. (2010). A double-blind,
placebo-controlled, randomized human study assessing the capacity of a novel
galacto-oligosaccharide mixture in reducing travellers' diarrhoea. European
Journal of Clinical Nutrition, 64, 146-152.
FDA. (2007). GRAS Notification for Galacto-oligosaccharides (GOS).
Frank, A. (2002). Technological functionality of inulin and oligofructose. British Journal
of Nutrition, 87, S287-S291.
Fukushima, Y., Jun, C., Kegai, K., Ohta, A., Sakai, K., Uenishi, K., et al. (2002).
Calcium absorption of malt drinks containing fructooligosaccharides and safety in
humans. Journal of Nutritional Food, 5, 49-60.
Furrie, E., Macfarlane, S., Kennedy, A., Cummings, J., Walsh, S., O'Neil, D., et al.
(2005). Synbiotic therapy (Bifidobacterium longum/Synergy 1) initiates
resolution of inflammation in patients with activeulcerative colitis: a randomised
controlled pilot trial. Gut, 54, 242-249.
Gibson, G. (2000). Dietary Modulation of the Human Gut Microflora Using the
Prebiotics Oligofructose and Inulin. Journal of Nutrition, 129, 1438S- 1441S.
78
Gibson, G. R., Beatty, E. R., Wang, X., & Cummings, J. (1995). Selective stimulation of
bifidobacteria in the human colon by oligofructose and inulin. Gastroenterology,
108, 975-982.
Gibson, G., & Roberfoid, M. B. (1995). Dietary modulation of the human colonic
miciobiota: Introducing the concept of prebiotics. Journal of Nutrition, 1401-
1412.
Gibson, G., Beatty, E., Wang, X., & Cummings, J. (1995). Selective stimulation of
bifidobacteria in the human colon by oligofructose and inulin. Gastroenterology,
103, 975-982.
Gibson, G., Probert, H., Van Loo, J., Rastall, R., & Roberfroid, M. (2004). Dietary
Modulation of the Human Colonic Microbiota: Updating the Concept of
Prebiotics. Nutrition Research Reviews, 17, 259-275.
Guadalberto, D. B., & Kazemzadeh, M. a. (1997). "Effect of extrusion processing on the
soluble and insoluble fiber, and phytic acid contents of cereal brans." . Plants
Foods for Human Nutrition, 51, 187-198.
Guigoz, Y., Rochat, F., Perruisseau-Carrier, G., Rochat, I., & Schiffrin, E. (2002). Effects
of oligosaccharide on the faecal flora and non-specific immune system in elderly
people. Nutrition Research, 22, 13-25.
Guy, R. (2001). Extrusion Cooking - Technologies and Applications. Woodhead
Publishing.
Hayashi, S., Yoshiyama, T., & Fuji, N. S. (2000). Production of a novel syrup containing
neofructo-oligosaccharides by the cells of Penicillium citrinum. Biotechnology
Letters , 22, 1465-1469.
Hidaka, H., Eida, T., Takizawa, T., & Tashiro, Y. (1986). Effects of
fructooligosaccharides on intestinal flora and human health. Bifidobacteria
Microflora , 5, 37-50.
Hofer, K., & Jeneweing, D. (1999). Enzymatic determination of inulin in food and
dietary supplements. European Food Research and Technolgy, 209, 423-427.
Huebner, J., Wehling, R., Parkhurts, A., & Hutkins, R. (2008). Effec of processing
conditions on the prebiotic activity of commercial prebiotics. International Dairy
Journal, 18, 287-293.

79
Hussein, H., Campbell, J., Bauer, L. F., Hogarth, L., & Wolf, B. H. (1998). Ingredients,
Selected Fructooligosaccharide Composition of Pet-Food. Journal of Nutrition ,
128, 28035-28055.
IPCS. (1999). Sucrose International Chemical Safety Card 1507. Retrieved November
14, 2011, from International Programme on Chemical Safet:
http://www.inchem.org/documents/icsc/icsc/eics1507.htm
ISAPP. (2008). 6th Meeting of the International Scientific Association of Probiotics and
Prebiotics. International Scientific Association of. London.
Ito, M., Kimura, M., Deguchi, Y., Miyamori-Watabe, A., Yajima, T., & T., K. (1993).
Effects of transgalactosylated disaccharides on the human intestinal microflora
and their metabolism. Journal of Nutrition Science and Vitaminology, 39, 279-
278.
IUPAC. (1997). Compendium of Chemical Terminology (the "Gold Book"). (2nd ed.).
Oxford: Blackwell Scientific Publications.
Jenkins, D., Kendall, C., & Vuksan, V. (1999). Inulin, Oligofructose and intestinal
function. 1431S- 1433S.
Kaplan, H., & Hutkins, R. (2003). Metabolism of Fructooligosaccharides by
Lactobacillus paracasei 1195. Applied and Environmental Microbiology., 69,
2217-2222.
Kewicki, R. (2007). The stability of gal-polyols and oligosaccahrides during
pasteurization at low pH. LWT - Food Science and Technology, 40, 1259-1265.
Kleessen, B., Sykura, B., Zunft, H., & Blaunt, M. (1997). Effects of inulin and lactose on
fecal microflora, microbial activity, and bowel habit in elderly constipated
persons. American Journal of Clinical Nutrition, 65, 1397-1402.
Kok, N., Roberfroid, M., & Delxenne, N. (1996). Involvement of lipogenesis in the lower
VLDL secretion induced by oligofuctose in rats. Brithish Journal of Nutrition ,
76, 881-890.
Kolida, S., & Gibson, G. (2007). Prebiotic capacity if Inulin-type fructans. The Journal of
Nutrition, 137, 2503S - 2506S.
80
Korakli, M., Hinrichs, C., Ehrmann, M., & Vogel, R. (2003). Enzymatic determination of
inulin and fructooligosaccharides in food. European Food Research and
Technology , 217, 530-234.
Kukkonen, K., Savilahti, E., Haahtela, T., Juntunen-Backman, K., Korpela, R., Poussa,
T., et al. (2008). Long-term safety and impact on infection rates of postnatal
probiotic and prebiotic (synbiotic) treatment: randomized, double-blind, placebo-
controlled trial. Pediatrics , 122, 122-128.
Kuz, C., Rudloff, S., & Baier, W. S. (2000). Oligosaccharides in human milk: Structural,
Functional, and Metabolic Aspects. Annual Review of Nutrition , 20, 699-722.
L'Homme, C., Arbelot, M., Paugserver, A., & Biagini, A. (2003). Kinetics of Hydrolysis
of Fructooligosacharides in MIneral- Buffered Aqueous Solutions; Influence of
pH and Temperture. Journal of Agricultural and Food Chemistry, 51, 224-228.
L'homme, C., Arbelot, M., Puigserver, A., & Biagini, A. (2003). Kinetics of Hydrolysis
of Fructooligosaccharides in Mineral-Buffered Aqueous Solutions: Influence of
pH and Temperature. Journal of Agricultural and Food Chemistry, 51, 224-228.
Lindsay, J., Whelan, K., Stagg, A., Gonin, P., Al-Hassi, H., Rayment, N., et al. (2005).
Clinical, microbiological, and immunological effects of fructo-oligosaccharide in
patients with Crohn’s disease. International Journal of Gastroenterology and
Hepatology, 55, 348-355.
Lopez, H., Coundray, C., Levrat-Verny, M., Feillet-Coudray, C., Demigne, C., &
Remesy, C. (2000). Fructooligosaccharides enhance mineral apparent absorption
and counteract the deleterious effects of phytic acid on mineral homeostasis in
rats. Journal of Nutritional Biochemistry , 11, 500-508.
Macfarlane, G., Steed, H., & and Macfarlane, S. (2008). Bacterial metabolism and health-
related effects of galacto-oligosaccharides and other prebiotics. Journal of
Applied Microbiology , 104, 305-3440.
Matusek, A., Meresz, P., Diem Le, T., & örsi, F. (2009). Effect of temperature and pH on
the degradation of fructo-oligosaccharides. European Food Research and
Technology, 228, 355-365.

81
Menne, E., Guggenbuhl, N., & Roberfroid, M. (2000). Fn-type Chicory Inulin
Hydrolysate Has a Prebiotic Effect in Humans. Journal of Nutrition , 130, 1197-
1199.
Moro, G., minoli, I., Mosca, M., Fanaro, S., Jelinek, J., Stahl, B., et al. (2002). Dosage-
Related Bifidogenic Effects of Galacto- and Fructooligosaccharides in Formula-
Fed Term Infants. Journal of Pediatric Gastroenterology and Nutrition, 34, 291-
295.
Mujoo, R., & Ng, P. (2003). Physicochemical Properties of Bread Baked from Flour
Blended with Immature Wheat Meal Rich in Fructooligosaccharides. Food
Chemistry and Toxicology , 68, 2448-2452.
Napoli, J., Brand-Miller, J., & Conway, P. (2003). Bifidogenic effects of feeding infant
formula containing galactooligosaccharides in healthy formula-fed infants. Asia
Pacific Journal of Clinical Nutrition , 12, 60-64.
Nauta, A., Bakker-Zierikze, A., & Schoterman, M. (2009). galacto-oligosaccharides. In
S. Cho, Handbook of Prebiotics and Probiotics Ingredients: Health Benefits and
Food Applications (pp. 14-38, 44-63, 75-88). CRC Press.
Nguyeh, Q., Mattes, F., Hoschke, A., Rezessy-Szabo, J., & Bhat, M. (1999). Produccion
purificacion and identificacion of fructooligosaccharides produces by beta-
fructofuranosidase from Aspergillud Niger IMI 303386. Biotechnology Letters,
21, 183-186.
Niness, K. R. (1999). Inulin and Oligofructose: What are They? Journal of Nutrition ,
129, 1402S- 1406S.
Nishizawa, K., Nakajima, M., & Nabetani, H. (2000). Kinetic Study on
Transfructosylation by b-Fructofuranosidase from Aspergillus nigerATCC 20611
and Availability of a Membrane Reactor for Fructooligosaccharide Production.
Food Science and Technology Research , 7, 39-44.
Ohta, A., Motohashi, Y., Sakai, K., Hirayama, M., Adachi, T., & Sakuma, K. (1998).
Dietary fructooligosaccharides increase calcium absorption and levels of mucosal
calbindin-D9k in the large intestine of gastrectomized rats. Scandinavian Journal
of Gastroenterology, 33, 1062-1068.

82
Ohta, A., Ohtsuki, M., Baba, S., Adachi, T., Sakata, T., & Sakaguchi, E. (1995). Calcium
and magnesium absorption from the colon and rectum are increased in rats fed
fructooligosaccharides. Journal of Nutrition, 125, 2417-2424.
Osborn, D., & Sinn, J. (2007). Prebiotics in infants for prevention of allergic disease and
food hypersensitivity. Cochrane Database of Systematic Reviews , 17, 1-25.
Paineau, D., Payen, F., Panserieu, S., Coulombier, G., Sobazek, A., Lartigau, I., et al.
(2008). The effects of regular consumption of short-chain fructo-oligosaccharides
on digestive comfort of subjects with minor functional bowel disorders. British
Journal of Nutrition , 99, 311-318.
Park, J., Oh, T., & Yun, J. (2001). Purification and characterization of a novel
transfructosylating enzyme from Bacillus macerans EG-6. Process Biochemistry,
37, 471-476.
Piirainen, L., Kekkonen, R., Kajander, K., Ahlroos, T., Tynkkynen, S., Nevala, R., et al.
(2008). In school-aged children a combination of galactooligosaccharides and
Lactobacillus GG increases bifidobacteria more than Lactobacillus GG on its
own. Annals of Nutrition and Metabolism , 52, 204-208.
Pool- Zobel, B., van Loo, J., Rowland, I., & Roberfroid, M. (2002). Experimental
evidences on the potential of prebiotic fructans to reduce the risk of colon cancer.
British Journal of Nutrition, 87, S273–S281.
Pranznik, W., E, C., & FIlipiak- Floriewiez, A. (2002). Soluble dietary fibres in
Jerusalem artichoke powders: Composition and application in bread. Nahrung, 46,
151-157.
Quintero, M., Maldonado, M., Perez-Munoz, M., Jimenez, R., Fangman, T., Rupnow, J.,
et al. (2011). Adherence Inhibition of Cronobacter sakazakii to Intestinal
Epithelial Cells by Prebiotic Oligosaccharides. Current Microbiology , 62, 1448–
1454.
Ramnani, P., Gaudier, E., Bingham, M., Bruggen, P., Touhy, K. M., & Gibson, G. R.
(2010). Prebiotic effect of fruit and vegetables shots containing Jesusalem
artichock inulin: a human intervention study. British Journal of Nutrition, 104,
233- 240.

83
Roberfoid, M., Van-Loo, J., & Gibson, G. (1998). The bifidogenic nature of chicory
inulin and its hydrolysis products. Journal of Nutrition, 128, 9-11.
Roberforid, M. (2007). Prebiotics: The Concept Revisited. The Journal of Nutrition , 137,
830S-837S.
Roberfroid, M. (2002). Fuctional foods: concepts and application to inulin and
oligofructose. British Journal of Nutrition, 87, 139-143.
Roberfroid, M., Gibson, G., Hoyles, L., McCartney, A., Rastal, R., Rowland, I., et al.
(2010). Prebiotic effects: metabolic and health benefits. British Journal of
Nutrition, 104, 3-51.
Rousseau, V., Lepargneur, J., Roques, C. R.-S., & Paula, F. (2005). Prebiotic effects of
oligosaccharides on selected vaginal lactobacilli and pathogenic microorganisms.
11, 145-159.
Rowland, I., & Tanaka, R. (1993). The effects of transgalactosylated oligosaccharides on
gut flora metabolism in rats associated with a human fecal microflora,. Journal of
Applied Bacteriology, 74, 667–674.
Sangeethat, P., Ramesh, M., & Prapulla, S. (2005). Recent trends in the microbial
producction, analysis and application of Fructooligosaccharides. Trends in Food
Science & Technology, 16, 442-457.
Sangwan, V., Tomar, S., Singh, R., Singh, A., & Ali, B. (2011). Galactooligosaccharides:
Novel Components of Designer Foods. Journal of Food Science, 76, 103-111.
Sanz, M., Cote, G., Gibson, G., & Rastall, R. (2005). Prebiotic Properties of
Alternansucrase Maltose-Acceptor Oligosaccharides. Journal of Agricultural and
Food Chemistry, 53, 5911-5916.
Schley, P., & Field, C. (2002). The immune-enhancing effects of dietary fibres and
prebiotics. British Journal of Nutrition , 87, s221-s230.
Scholtens, P., Alliet, P., Raes, M., Alles, M., Kroes, H., Boehm, G., et al. (2008). Fecal
Secretory Immunoglobulin A Is Increased in Healthy Infants Who Receive a
Formula with Short-Chain Galacto-Oligosaccharides and Long-Chain Fructo-
Oligosaccharides. Journal of Nutrition, 138, 1141-1147.
Searle, L., Best, A., Nunez, A., Salguero, F., Johnson, L., Weyer, U., et al. (2009). A
mixture containing galactooligosaccharide, produced by the enzymic activity of

84
Bifidobacterium bifidum, reduces Salmonella enterica serovar Typhimurium
infection in mice. Jornal of Medical Microbiology , 58, 37-48.
Sheu, D., Lio, P., Chen, S., Lin, C., & Duan, K. (2001). Production of
fructooligosaccharides in high yield using a mixed enzyme system of β-
fructofuranosidase and glucose oxidase. Biotechnology Letters, 23, 1499-1503.
Shiomi, N., Onodera, S., Chatterron, J., & Harrison, P. (1991). Separation of
Fructooligosaccharides Isomers by Anion-exchange Chromatography. 55, 1427-
1428.
Shoaf, K., & Hutkins, R. (2008). Adherence, anti-adherence, and oligosaccharides
preventing pathogens from sticking to the host. In S. L. Taylor, Advances in Food
and Nutrition Research (Vol. 55, pp. 101-161). Academic Press.
Shoaf, K., Mulvey, G., Armstrong, G., & Hutkins, R. (2006). Prebiotic
Galactooligosaccharides Reduce Adherence of Enteropathogenic Escherichia Coli
to issue Culture Cells. Infection and Inmunity, 74, 6920-6928.
Silk, D., Davis, A., Vulevic, J., Tzortziss, G., & Gibson, G. (2009). Clinical trial: the
effects of trans-galactooligosaccharide prebiotic on fecal microbiota and
symptoms in irritable bowel syndrome. Alimentary Pharmacology Therapy, 29,
508-518.
Splechtna, B., Nguyen, T., Steinbock, M., Kulbe, K., Lorenz, W., & Haltrich, D. (2006).
Production of prebiotic galacto-oligosaccharides from lactose using β-
galactosidases Lactobacillus reuteri. Journal of Agricultural and Food Chemistry,
54, 4999-5006.
Tahiri, M., Tressol, J., Arnaud, J., Bornet, F., Bouteloup-Demange, C., Feillet-Coudray,
C., et al. (2001). Five-week intake of short-chain fructo-oligosaccharides
increases intestinal absorption and status of magnesium in postmenopausal
women. Journal of Bone Mineral Research , 16, 2152-2160.
Taper, H., & Roberfroid, M. (1999). Influence of inulin and oligofructose on breast
cancer and tumor growth. Journal of Nutrition , 129, 1488-1491.
Taper, H., & Roberfroid, M. (1999). Influence of inulin and oligofructose on breast
cancer tumor growth. The Journal of Nutrition, 129, 1488S-1491S.

85
Thuoty, K., Kolida, S., Lustenberger, A., & Gibson, G. (2001). The prebiotic effects of
biscuits containing partially hydrolysed guar gum and fructo-oligosaccharides – a
human volunteer study. British Journal of Nutrition, 86, 341-348.
Uenishi, K., Ohta, A., Fukushima, Y., & Kagawa, Y. (2002). Effect of a Malt Drink
Containing Fructooligosaccharides on Calcium Absorption and Safety of Long-
term Administration. Japanese Journal of Nutrition and Dietetics, 60, 11-18.
Ueno, K., Ishiguro, Y., Yodoshida, M., Onodera, S., & Shiomi, N. (2011). Cloning and
functional characterization of a fructan 1-exohydrolase (1-FEH) in edible burdock
(Arctium lappa L.). Chemistry Central Journal , 5, 1-9.
van den Heuvel, E., Muijs, T., Brouns, F., & Hendriks, H. (2009). Short-chain fructo-
oligosaccharides improve magnesium absorption in adolescent girls with a low
calcium intake. Nutritional Research, 29, 229-237.
Van den Heuvel, E., Schaafsma G, M. T., & W., v. D. (1998). Nondigestible
oligosaccharides do not interfere with calcium and nonheme-iron absorption in
young, healthy men. American Journal of Clinical Nutrition , 67, 45-451.
van den Heuvel, E., Schoterman, M., & Muijs, T. (2000). Transgalactooligosaccharides
stimulate calcium absorption in postmenopausal women. Journal of Nutrition ,
13, 2938-2942.
van den Heuvel, G., Schaafsma, G., Muys, T., & Dokkum, W. (1998). Nondigestible
oligosaccharides do not interfere with calcium and noheme-iron absorbtion in
young healthy men. American Journal of Clinical Nutrition, 67, 445-451.
van Hoffen, E., Ruiter, B., Faber, J., M'Rabet, L., Knol, E., Stahl, B., et al. (2009). A
specific mixture of short-chain galacto-oligosaccharides and long-chain fructo-
oligosaccharides induces a beneficial immunoglobulin profile in infants at high
risk for allergy. Allergy , 64, 484-487.
Vendrell-Pascuas, S., Castellote- Bargallo, A., & Lopez- Sabater, M. (2000).
Determination of inulin in meat ptoducts by high-preformance liquid
chromatography with refractive index detection. Journal of Chromarography A,
881, 591-597.
Voragen, A. (1998). Technological aspects of functional food-related carbohydrates.
Trends in Food Science and Technology, 9, 328-335.
86
Vulevic, J., Drakoularakou, A., Yaqoob, P., Tzortzis, G., & Gibson, G. (2008).
Modulation of the fecal microflora profile and immune function by a novel trans-
galactooligosaccharide mixture (B-GOS) in healthy elderly volunteers. American
Journal of Clinical Nutrition, 88, 1438-1446.
Wang, H., Zhang, Z., Liang, L., Wen, S., Liu, C., & Xu, X. (2010). A comparative study
of hugh-performance liquid chromatography and colorimetric method for inulin
determination. European Food Research and Technology, 230, 701-706.
Wang, H., Zhang, Z., Liang, L., Wen, S., Lui, C., & Xu, X. (2010). A comparative study
of high preformnce liquid chromatography and colirimetruc method for inulin
determination. European Food Research and Technology, 230, 701-706.
Watzl, B., Girrbach, S., & Roller, M. (2005). Inulin, oligofructose and
immunomodulation. British Journal of Nutrition, 93, S49-S55.
Wijnands, M., Appel, M., Hollanders, V., & Woutersen, R. (1999). A comparison of the
effects of dietary cellulose and ferment- able galacto-oligosaccharide, in a rat
model of colorectal carcinogenesis: Fermentable fibre confers greater protection
than non-fermentable fibre in both high and low fat backgrounds,. 20, 651-656.
Williams, C. (1999). Effects of Inulin on Lipid Parameters in Humans. The Journal of
Nutrition , 129, 1471S-1473S.
Yamashita, K., Kawai, K., & Itakura, M. (1984). Effects of fructo-oligosaccharides on
blood glucose and serum lipids in diabetic subjects. Nutrition Research, 4, 229-
232.
Younes, H., Coundray, C., Bellanger, J., Demigne, C., Rayssiguier, Y., & Remesy, C.
(2001). Effects of two fermentable carbohydrates (inulin and resistant starch) and
their combination on calcium and magnasium balance in rats. British Journal of
Nutrition, 86, 479-485.
Yun, J. (1996). Fruncooligosaccharides -Occurrence, preparation, and application.
Enzyme and Microbial Technology , 19, 107-117.
Zuleta, A., & Sambucetti, E. (2001). Inulin Determination for Food Labeling. Journal of
Agricultural and Food Chemistry, 49, 4570-4572.

A
Appendix 1
Flow diagrams of the optimized extraction procedure and analysis of
FOS from the different food products

B
Figure 1. Flow diagram of the optimized extraction procedure and analysis of
FOS from the in the extruded cereal
Accuratly weigh 10 ± 0.05 g and combine with 20 ml of 1:1
ethanol :water
Mix 30 min at room temperature.
Centrifuge at 10000 g for 20-
30 min at room temperatute. Filter supernatant to remove
large particles.
Collect filtrate and pass an aliquot through a 0.45 µm
filter.
Dry sample under vacuum at 50 °C to obtain a dry residue.
Resuspend sample in nanopure water at a final volume
resulting in 1% solution. Analyze with HPLC.

C
Figure 2. Flow diagram of the optimized extraction procedure and analysis of
FOS from the muffins
Accurately weigh 1 ± 0.05 g and combine with 2 ml ± 0.1 of
water Mix 30 min at room temperature.
Centrifuge at 10000 g for 20-30
min at room temperatute. Filter supernatant to remove large
particles.
Collect filtrate and pass an aliquot through a 0.45 µm filter.
Analyze with HPLC.

D
Figure 3. Flow diagram of the optimized extraction procedure and analysis of
FOS from the cookies.
Accurately weigh 10 ± 0.05 g and combine with 20 ± 0.1 ml
of water
Mix 30 min at room temperature.
Centrifuge at 10000 g for 20-
30 min at room temperatute.
Collect supernatant. Add 10 ± 0.1 ml of water to the pellet
and mix 30 min at room temperature
Filter supernatants to remove
large particles.
Collect filtrates eand pass an aliquot through a 0.45 µm
filter.
Analyze with HPLC.

E
Figure 4. Flow diagram of the optimized extraction procedure and analysis of
FOS from the nutrition bar
Accurately weigh 10 ± 0.05 g and combine with 10 ml of 1:1
ethanol :water
Mix 30 min at room temperature.
Centrifuge at 10000 g for 20-
30 min at room temperatute. Filter supernatant to remove
large particles.
Collect filtrate and pass an aliquot through a 0.45 µm
filter.
Dry sample under vacuum at 50 °C to obtain a dry residue.
Resuspend sample in nanopure water at a final volume
resulting in 1% solution. Analyze with HPLC.

F
Figure 5. Flow diagram of the optimized extraction procedure and analysis of
FOS from the nutrition bar
Accurately measure 1.0 ± 0.05 ml.
Filter sample through a 0.45 µm filter.
Analyze with HPLC.

G
Appendix 2
Flow diagrams of the optimized extraction procedure and analysis of
inulin from the different food products

H
Figure 1. Flow diagram of the optimized extraction procedure and analysis of
inulin from the extruded cereal.
Accurately weigh
1.0±0.05 g of a test
portion.
Add hot distilled
water at 80°C; stir
80°C for 15 min.
Cool solution to
room temperature,
adjust volume to 50
ml with distilled
water, and mix.
Centrifuge at 1000 g
for 20 min ,or until
pellet is formed.
Filter aliquot of
solution through
paper Whatman No.
1, or equivalent.
Transfer 0.2 ml of
filtrate.
Add 0.2 ml of
sucrase/amylase
solution, and
incubate at 40°C for
30 min.
Add 0.2 ml alkaline
borohydride solution
to each tube and
incubate at 40°C for
30 min.
Add 0.5 ml acetic
acid and mix.
Transfer four 0.2 ml
aliquots.
Add 0.1 mL of
fructanase to 3 of
these samples.
Add 0.1 ml of 0.1 M
sodium acetate
buffer to the 4th
sample
(sample blank).
Incubate at 40°C for
20 min.
Add 5.0 ml
PAHBAH working
reagent.
Incubate in boiling
water bath for 6 min.
Remove all tubes from
boiling water bath and
immediately place in
cold water (18–20°C)
for ca 5 min.
Measure absorbance
of all solutions at
410 nm.

I
Figure 2 Flow diagram of the optimized extraction procedure and analysis of
inulin from the muffins.
Accurately weigh
1.0±0.05 g of a test
portion.
Add hot distilled
water at 80°C; stir
80°C for 15 min.
Cool solution to
room temperature,
adjust volume to 50
ml with distilled
water, and mix.
Centrifuge at 1000 g
for 20 min ,or until
pellet is formed.
Filter aliquot of
solution through
paper Whatman No.
1, or equivalent.
Transfer 0.2 ml of
filtrate.
Add 0.2 ml of
sucrase/amylase
solution, and
incubate at 40°C for
30 min.
Add 0.2 ml alkaline
borohydride solution
to each tube and
incubate at 40°C for
30 min.
Add 0.5 ml acetic
acid and mix.
Transfer four 0.2 ml
aliquots.
Add 0.1 mL of
fructanase to 3 of
these samples.
Add 0.1 ml of 0.1 M
sodium acetate
buffer to the 4th
sample
(sample blank).
Incubate at 40°C for
20 min.
Add 5.0 ml
PAHBAH working
reagent.
Incubate in boiling
water bath for 6 min.
Remove all tubes from
boiling water bath and
immediately place in
cold water (18–20°C)
for ca 5 min.
Measure absorbance
of all solutions at
410 nm.

J
Figure 3. Flow diagram of the optimized extraction procedure and analysis of
inulin from the nutrition bar.
Accurately weigh
1.0±0.05 g of a test
portion.
Add hot distilled
water at 80°C; stir
80°C for 15 min.
Cool solution to
room temperature,
adjust volume to 50
ml with distilled
water, and mix.
Centrifuge at 1000 g
for 20 min ,or until
pellet is formed.
Filter aliquot of
solution through
paper Whatman No.
1, or equivalent.
Transfer 0.2 ml of
filtrate.
Add 0.2 ml of
sucrase/amylase
solution, and
incubate at 40°C for
30 min.
Add 0.2 ml alkaline
borohydride solution
to each tube and
incubate at 40°C for
30 min.
Add 0.5 ml acetic
acid and mix.
Transfer four 0.2 ml
aliquots.
Add 0.1 mL of
fructanase to 3 of
these samples.
Add 0.1 ml of 0.1 M
sodium acetate
buffer to the 4th
sample
(sample blank).
Incubate at 40°C for
20 min.
Add 5.0 ml
PAHBAH working
reagent.
Incubate in boiling
water bath for 6 min.
Remove all tubes from
boiling water bath and
immediately place in
cold water (18–20°C)
for ca 5 min.
Measure absorbance
of all solutions at
410 nm.

K
Figure 3. Flow diagram of the optimized extraction procedure and analysis of
inulin from the sports drink.
Accurately measure
1.0 ±0.05 ml of a
test portion.
Add hot distilled
water at 80°C; stir
80°C for 15 min.
Cool solution to
room temperature,
adjust volume to 50
ml with distilled
water, and mix.
Filter aliquot of
solution through
paper Whatman No.
1, or equivalent.
Transfer 0.2 ml of
filtrate.
Add 0.2 ml of
sucrase/amylase
solution, and
incubate at 40°C for
30 min.
Add 0.2 ml alkaline
borohydride solution
to each tube and
incubate at 40°C for
30 min.
Add 0.5 ml acetic
acid and mix.
Transfer four 0.2 ml
aliquots.
Add 0.1 mL of
fructanase to 3 of
these samples.
Add 0.1 ml of 0.1 M
sodium acetate
buffer to the 4th
sample
(sample blank).
Incubate at 40°C for
20 min.
Add 5.0 ml
PAHBAH working
reagent.
Incubate in boiling
water bath for 6 min.
Remove all tubes from
boiling water bath and
immediately place in
cold water (18–20°C)
for ca 5 min.
Measure absorbance
of all solutions at
410 nm.

L
Appendix 3
Flow diagrams of the optimized extraction procedure and analysis of
GOS from different food products

M
Figure 1. Flow diagram of the optimized extraction procedure and analysis of
GOS from the extruded cereal.
Prepare a solution galactose and glucose
and the internal standard to (myo-inositol) each at 1mg/ml (STD).
Prepare a solution of myo-inositol at the
same concentration of the expected
concentration of the sugar in sample (ISTD)
Accurately weigh 0.5 ± 0.05 g and combine
with 50.0 ± 0.1 ml of water to achive 1mg/ml
GOS concentration .
Vortex inmediatly after adding water
to prevent gel formation.
Mix 30 min at room temp
Centrifuge at 4500 rpm for 20 min to obtain
pellet
Transfer 250 µl of sample (S) to a 35 ml
open test tube with screw cap.
Add 50 µl of 2.8M
sulfuric acid and 50 µl
of ISTD to sample (S).
Hydrolyze: Pressure
cook in High (15 psi
and
80 °C for 1 h).
Add 75 µl of 12 M
ammonium hydroxide
and mix.
Add 40 µl of freshly
prepared 150 mg/ml
alkaline sodium
borohydride.
Incubate at 40 °C for 1
h.
Add 40 µl of glacial
acetic acid; mix.
Add 0.5 ml of 1-
methylimidazole; mix.
Add 5 ml of acetic anhydride (slowly);
mix.
Let stand 10 min at
room temperature.
Add 1 ml absolute
ethanol.
Let stand 10 min at
room temperature.
Move tubes to a cooler
with ice up to shoulder
of tube
Slowly add 5 ml of
well mixed 7.5 M
sodium hydroxide; mix.
Let stand 5 min at room
temperature.
Add another 5 ml of 7.5
M sodium hydroxide.
Transfer ethyl acetate
(top) layer to a fresh
tube.
Analyze by GC. Analyze the STD at as
the first and last injection of the runs.

N
Figure 2. Flow diagram of the optimized extraction procedure and analysis of
GOS from the extruded cereal.
Prepare a solution galactose and glucose
and the internal standard to (myo-inositol) each at 1mg/ml (STD).
Prepare a solution of myo-inositol at the same
concentration of the expected concentration of the sugar in sample
(ISTD)
Accurately measure 1.0 ± 0.05 ml and
combine with 100.0 ± 0.1 ml of water to
achive 1mg/ml GOS concentration .
Transfer 250 µl of sample (S) to a 35 ml
open test tube with screw cap.
Add 50 µl of 2.8M
sulfuric acid and 50
µl of ISTD to sample
(S).
Hydrolyze: Pressure
cook in High (15 psi
and
80 °C for 1 h).
Add 75 µl of 12 M
ammonium hydroxide
and mix.
Add 40 µl of freshly
prepared 150 mg/ml
alkaline sodium
borohydride.
Incubate at 40 °C for
1 h.
Add 40 µl of glacial
acetic acid; mix.
Add 0.5 ml of 1-
methylimidazole;
mix.
Add 5 ml of acetic anhydride (slowly);
mix.
Let stand 10 min at
room temperature.
Add 1 ml absolute
ethanol.
Let stand 10 min at
room temperature.
Move tubes to a
cooler with ice up to
shoulder of tube
Slowly add 5 ml of
well mixed 7.5 M
sodium hydroxide;
mix.
Let stand 5 min at
room temperature.
Add another 5 ml of
7.5 M sodium
hydroxide.
Transfer ethyl acetate
(top) layer to a fresh
tube.
Analyze by GC. Analyze the STD at as
the first and last injection of the runs.