adaptive drug development programs for phases 2 and 3 in neuropathic pain - 2011 isbs
TRANSCRIPT

Designing Adap,ve Ph2‐Ph3 programs for Neuropathic Pain
Ni,n Patel & Jim Bolognese Cytel, Inc.
International Symposium on Biopharmaceutical Statistics, Berlin, March 2011

ISBS, Berlin March 2011 2
Neuropathic Pain Applica,on Subteam of the PhRMA/DIA Adap,ve Programs Network
• Keaven Anderson, Arnold Gammaitoni, David HewiP, Merck
• Zoran Antonijevic, Quin,les • Jim Bolognese, Cytel • Christy Chuang‐Stein, Pfizer • Frank Miller, Astra Zeneca • Ni,n Patel, Cytel (lead) • Jose Pinheiro, J&J 4/19/11 2

ISBS, Berlin March 2011 3
Outline
• Overview of Simula,on Plan • Describe first stage of plan (completed)
– Ph2b and Ph3 designs – Commercial model for Net Present Value (NPV) – Dose Response Scenarios
• Simula,on Results • Concluding Remarks
ISBS, Berlin March 2011 4 4/19/11 4 4
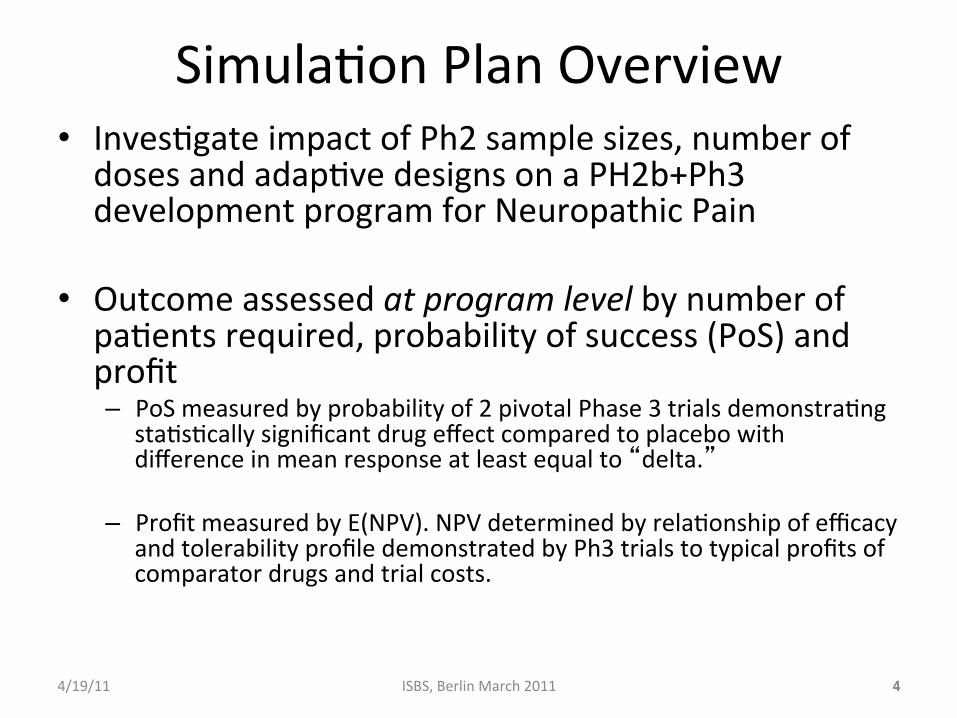
Simula,on Plan Overview • Inves,gate impact of Ph2 sample sizes, number of doses and adap,ve designs on a PH2b+Ph3 development program for Neuropathic Pain
• Outcome assessed at program level by number of pa,ents required, probability of success (PoS) and profit – PoS measured by probability of 2 pivotal Phase 3 trials demonstra,ng
sta,s,cally significant drug effect compared to placebo with difference in mean response at least equal to “delta.”
– Profit measured by E(NPV). NPV determined by rela,onship of efficacy and tolerability profile demonstrated by Ph3 trials to typical profits of comparator drugs and trial costs.

ISBS, Berlin March 2011 5 5
Efficacy and Safety Response • 0‐10 pain scale used to measure efficacy for treatment of neuropathic
pain in both Ph2 (12 wks.) and Ph3 (12 months) – Target level of response (delta) is mean difference from placebo of 1
unit – SD of response known to be 2 units in Ph2 and Ph3 – Mean Dose Response is 4‐Parameter Logis,c (4PL) func,on
• Two types of AE’s: – ‘nuisance’ AE’s that are non‐transient and not manageable by other
means (e.g. weight gain, sexual func,on AE’s) – serious AE’s with rare probability of occurrence and only likely to be
detected in the post marke,ng stage (e.g. CV events, liver failure. simulate the risk of stopping the program if an important numeric increment of this serious AE is observed.

ISBS, Berlin March 2011 6 4/19/11 6 6
Nuisance AE’s • Moderate probability of occurrence (e.g., 0.2 or 0.3 maximum
binomial probability). – will not cause stoppage of development or drug approval, but will lower the benefit/risk profile and nega,vely impact sales.
– Placebo rate for nuisance AE’s= 0.15. – drug rate 0.2‐0.3 assumed similar to marketed products (>0.3 worse; <0.2 bePer)
• In first stage of work reported here, we rely on selec8on of lowest dose mee8ng target to reflect monotone increase in rate of nuisance AE’s with dose. Subsequently we will simulate nuisance AE rates during Ph 2b trials and use them in selec8ng dose(s) to carry forward to Ph3

ISBS, Berlin March 2011 7 4/19/11 7 7
Ph2b and PH 3 Designs In first stage of work we consider tradi8onal fixed designs with
equal alloca8on to all arms for Ph2b and Ph3 designs
• Ph2 prior chosen to be prac,cally flat over likely range of parameters of 4PL dose response
• For each Ph2b trial replicated MCMC samples from posterior distribu,on are used to es,mate mean response at each dose and placebo: – If no dose meets target diff from pbo, no Ph3 trials are conducted – If at least one dose meets target select smallest dose, di , that meets
target to run two concurrent Ph 3 trials each with sample size for 95% power (alpha=0.025, 1‐sided)

ISBS, Berlin March 2011 8 8
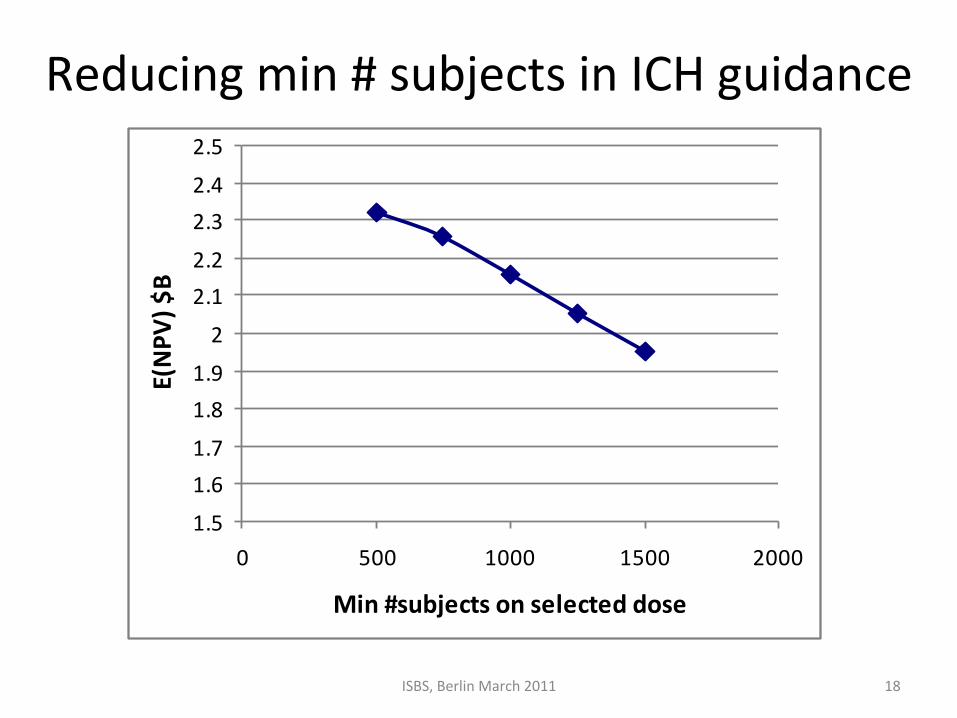
ICH E1A guidance for minimum number of subjects for dose approval
• ICH E1A guidance applicable for neuropathic pain (among others) is to
have 1500 pa,ents treated at the target dose of interest, with at least 500 treated for at least 6 months and at least 100 for at least 1 year These minimum sample size requirements are for the 3 combined Ph2 and Ph3 trials along with other unblinded studies.
• We assume that Ph2 subjects on study drug are switched to the Ph3 dose and pbo subjects are con,nued on pbo for the Ph 3 treatment period of 12 months for safety assessment.
• We adjust Ph 3 sample sizes to follow this regulatory guidance assuming
no other studies will be conducted. In every case we have considered this adjustment results in Ph3 being over‐powered for efficacy.

ISBS, Berlin March 2011 9 9
Calcula,ng PoS and ENPV • For Ph2b trial replicates where a dose was selected to carry into Ph3 trials: – Calculate predic,ve PoS = Pr(Both Ph3 trials show significance) = Pr(Technical Success) = Pr(TS) using Ph2b posterior distribu,on.
– Use this probability to combine: • NPV|TS calculated from Commercial model • Nega,ve NPV resul,ng from Ph2b and Ph3 trial costs when there is no Technical Success
• Es,mate E(NPV) by averaging across simula,ons. Also compute empirical probability distribu,on of NPV to show risk.

ISBS, Berlin March 2011 10 4/19/11 10
Decision Analysis Tree
Positive
Negative
Choose Ph2b
Design
Ph2b Trial
Result
NPV
s of
cas
h st
ream
s
Positive
Negative
Choose Ph 3 Designs
Ph 3 Trial Results

ISBS, Berlin March 2011 11 4/19/11 11 11
Commercial Model • Let e* (di) denote the true mean difference in efficacy from placebo for
dose di . Let s* (di) denote the nuisance AE rate for dose di • These values determine the fith year revenue (net of variable costs) from
marke,ng a dose by interpola,on in the table below. This table was constructed based on discussions with David HewiP, MD, and Arnold Gammaitoni, MD, clinical development experts in the neuropathic pain therapeu,c area.
5th year sales($B)
e*(di)/s*(di) 0 0.1 0.25 0.4 0.75 10 0 0 0 0 0 0
0.4 0 0 0 0 0 00.9 1 1 0.75 0.25 0 0
1.25 1.5 1.5 1 0.5 0 01.75 2 2 1.5 1 0.25 0.25
2 2 2 1.5 1 0.25 0.25

ISBS, Berlin March 2011 12 12
REVENUE
0.00.1
0.20.3
0.40.50.60.70.8
0.91.0
1.11.2
1.3
YEAR
0 10 20
Revenue over time for Effective Patent Life TP=3,7,10,13(S5=$1B, b=0.03, c=1)
Time Profile of Net Revenue
Patent Expiration
Slope after 5th year = b, Decay parameter for period after patent expiration = c
5th Year Sales

ISBS, Berlin March 2011 13
Example
DRCurve D0 D1 D2 D3 D4 D5 D6 D7 D8
Efficacy 0.000 0.001 0.034 0.217 0.567 0.854 1.002 1.068 1.099
Rate for NuisanceAE’s
0.1 0.1 0.1 0.1 0.15 0.20 0.25 0.30 0.35
13
Base Case: Ph2 Sample Size = 30x9 = 270 subjects
Efficacy and Safety Dose Response

ISBS, Berlin March 2011 14 14 14
Parameter seungs for Example Ph3 alpha(1‐sided) 0.025
PH2_SD 2 PH3_SD 2 Power 0.95
Target Mul,plier 1 Target Value 1
Dura,on of Dev. Time before the Ph2b trial (yrs) 2
Cost per site $15K Cost per pa,ent $3.5K
Pa,ent Accrual per month per site in PH2b trial 0.5
Pa,ent Accrual per mo. per site in PH3 trial 1 # Sites in PH2b trial 50
# Sites in each PH3 trial 80
Months of PH2b trial dura,on per pa,ent 3
Months of PH3 trial dura,on per pa,ent 12
Lag between end PH2b trial and start PH3 trial (months) 6
Cost of manufacturing gear‐up $1M Revenue model parameter b 0.1 Revenue model parameter c 0.5
Discount rate per year 0.10 Total patent life (yrs) 17
Dura,on between end PH3 trial and launch (months) 12
% of PH2 N comple,ng long‐term extension 50
Minimum Subjects Required for Safety on Selected Dose 1500

ISBS, Berlin March 2011 15
Base Case di
Pro
babi
lity
di s
elec
ted
Ph2
Pos
t_M
EA
N(d
i)
Ph2
Pos
t_M
EA
N(p
bo)
Ph2
Pos
t_S
tDev
(di)
Ph2
Pos
t_S
tDev
(pbo
)
SS
_per
_PH
3tria
l
PH
2_D
UR
(yrs
)
PH
3_D
UR
(yrs
)
TOT_
DE
V_T
IME
(yrs
) if T
ech
Suc
c
Exp
ecte
dNP
V($
B)
3 0.010 0.5196 -0.429 0.22 0.265 1380 1.15 2.44 7.09 -0.011 4 0.068 0.6292 -0.331 0.19 0.252 1380 1.15 2.44 7.09 1.021 5 0.244 0.7738 -0.197 0.18 0.234 1380 1.15 2.44 7.09 2.541 6 0.322 0.9198 -0.042 0.17 0.225 1380 1.15 2.44 7.09 2.764 7 0.146 0.9806 0.029 0.20 0.212 1380 1.15 2.44 7.09 2.362 8 0.014 1.1208 0.147 0.25 0.213 1380 1.15 2.44 7.09 1.873 . 0.196 1.15 . -0.002
ISBS, Berlin March 2011 16
Distribu,on of NPV
00.10.20.30.40.50.60.70.80.91
-0.5 0.5 1.5 2.5 3.5
E(NPV) $BCu
m P
roba
bilit
y
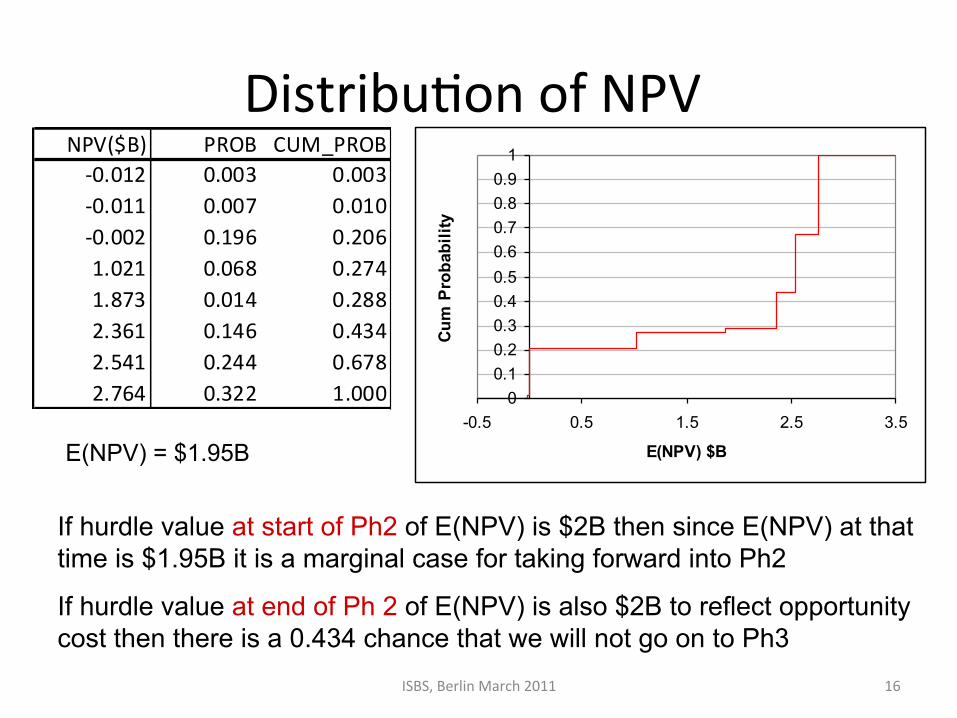
If hurdle value at start of Ph2 of E(NPV) is $2B then since E(NPV) at that time is $1.95B it is a marginal case for taking forward into Ph2
If hurdle value at end of Ph 2 of E(NPV) is also $2B to reflect opportunity cost then there is a 0.434 chance that we will not go on to Ph3
E(NPV) = $1.95B
NPV($B) PROB CUM_PROB‐0.012 0.003 0.003‐0.011 0.007 0.010‐0.002 0.196 0.2061.021 0.068 0.2741.873 0.014 0.2882.361 0.146 0.4342.541 0.244 0.6782.764 0.322 1.000

ISBS, Berlin March 2011 17
Varying Ph2b Sample Size
17
Phase 2 Power
Prob. of going to Phase 3
Phase 3 Sample size if
conducted
Prob. Phase 3 Success
Total Development Time (yrs)
Expected True
Discounted NPV ($B)
SS=15x9=135 0.82 0.75 2880 0.74 6.7 1.81
SS=25x9=225 0.95 0.79 2800 0.79 7.0 1.90
SS=30x9=270 0.97 0.80 2760 0.80 7.1 1.95
SS=45x9=405 0.99 0.84 2640 0.83 7.5 1.84
SS=60x9=540 0.99 0.87 2520 0.86 7.9 1.81
Best PoS in Ph3 might not mean highest NPV
ISBS, Berlin March 2011 18
Reducing min # subjects in ICH guidance
1.5
1.61.7
1.81.9
2
2.12.2
2.32.4
2.5
0 500 1000 1500 2000
Min #subjects on selected dose
E(NPV
) $B

ISBS, Berlin March 2011 19
Op,mizing Ph 2 and Ph 3 Sample Sizes without ICH guideline minimum
Op,mum: E(NPV) = $B 2.32, Sample Sizes: Ph2 = 270 Ph3 = 800 (both trials)
1.2
1.4
1.6
1.8
2
2.2
2.4
200 700 1200 1700 2200 2700
Ph 3 Sample Size
E(NPV
) $B 135
225
270
405
540

ISBS, Berlin March 2011 20
Base Case with low and flat Dose Response
20
Phase 2 Power
Prob. of going to Phase 3
Prob. Phase 3 Success
Total Develop‐ment
Time (yrs)
Expected True NPV
($B)
Efficacy 0.97 0.80 0.80 7.1 1.95
half_EFF 0.55 0.16 0.16 7.1 0.071
null 0.036 0.002 0.000001 7.1 ‐0.0017
Half_EFF 0.000 0.0005 0.017 0.108 0.289 0.427 0.501 0.535 0.550
Eff. Flat 0 0 0 0 0 0 0 0 0

ISBS, Berlin March 2011 21
Concluding Remarks Next Steps to extend simula,on model (par,al list):
– Compare effect of having 4 doses (instead of 8) in Ph2b trial – Model safety explicitly:
• simulate nuisance AE’s Ph2 and select doses to maximize ENPV es,mates from Ph2b posterior distribu,on
• Model serious AE’s (as described by Chris Jennison) – Consider other tradi,onal fixed designs for Ph 3 with more than one dose – Extend commercial model to reflect situa,ons when more than one dose is
approved and marketed – Evaluate adap,ve and group sequen,al designs for both Ph2b and Ph 3 – Model uncertainty in 5th year sales forecast and recognize down‐side risk by
using measures other than E(NPV) to compare programs (e.g. probability of mee,ng target level of NPV, expected u,lity based on elicited u,lity func,on)
– Use prior for probability of different dose response scenarios (as described by Carl‐Fredrik Burman and Chris Jennison)
Explore opportunity to examine idea of Progressive Authoriza,on that has
been discussed at mee,ngs at the Center for Biomedical Innova,on at MIT with FDA Deputy Commissioner Dr. Murray Lumpkin, MD deputy commissioner, FDA


Extra Slides
ISBS, Berlin March 2011 24 24
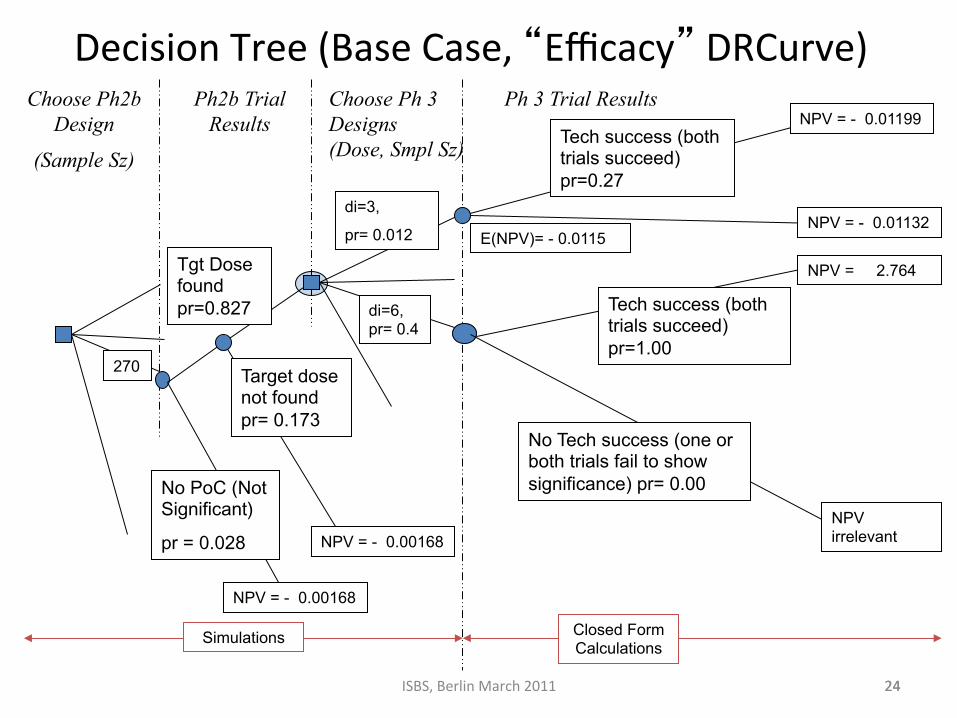
Decision Tree (Base Case, “Efficacy” DRCurve) Choose Ph2b
Design
(Sample Sz)
Ph2b Trial Results
Tech success (both trials succeed) pr=1.00
Choose Ph 3 Designs (Dose, Smpl Sz)
Ph 3 Trial Results
270
NoPoC(NotSignificant)
pr=0.028
Target dose not found pr= 0.173
Tgt Dose found pr=0.827 di=6,
pr= 0.4
No Tech success (one or both trials fail to show significance) pr= 0.00
di=3,
pr= 0.012 E(NPV)= - 0.0115
Tech success (both trials succeed) pr=0.27
Simulations
NPV = 2.764
NPV irrelevant
NPV = - 0.01199
NPV = - 0.01132
Closed Form Calculations
NPV = - 0.00168
NPV = - 0.00168
ISBS, Berlin March 2011 25
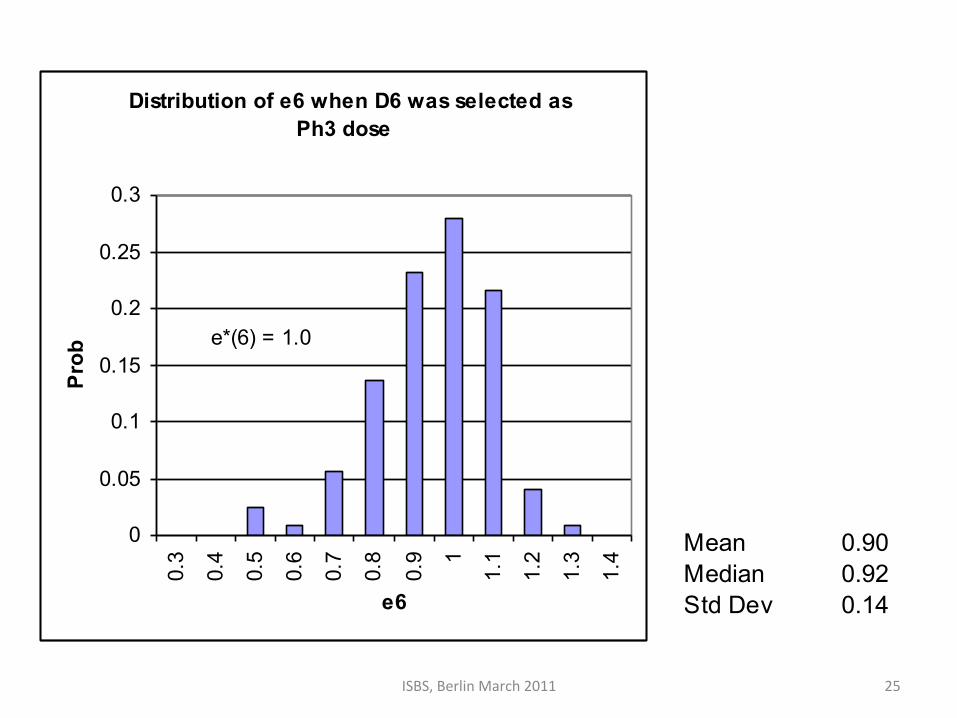
Distribution of e6 when D6 was selected as Ph3 dose
0
0.05
0.1
0.15
0.2
0.25
0.30.
3
0.4
0.5
0.6
0.7
0.8
0.9 1
1.1
1.2
1.3
1.4
e6
Prob
e*(6) = 1.0
Mean 0.90Median 0.92Std Dev 0.14

ISBS, Berlin March 2011 26
Accoun,ng for downside risk • Maximizing E(NPV) does not model risk. If a u,lity func,on is elicited for NPV the availability of distribu,on of NPV enables calcula,on of u,li,es for different Ph2 and Ph3 sample sizes.
• Assessing u,lity func,on can be difficult. A sa,sficing criterion of maximizing the probability of mee,ng or exceeding a specified target NPV can reflect risk.
• If the target is $B 0.8, Ph2 SS= 540 (pr = 0.86) is bePer than the ENPV maximizing SS of 270 (pr = 0.79).
• Can also use Target and linear loss func,ons on either side (Birge and Louveaux)

ISBS, Berlin March 2011 27
Base Case (Efficacy DRCurve) No dose selected 0.196
Dose selected 0.804
Pr(NoSignif)= 0.028 Pr(NoDoseSel|Signif)= 0.173
Pr(Dose Found|Signif)= 0.827 Pr( di =1|dose found)= 0.000 Pr( di =2|dose found)= 0.000 Pr( di =3|dose found)= 0.012 Pr( di =4|dose found)= 0.085 Pr( di =5|dose found)= 0.303 Pr( di =6|dose found)= 0.400 Pr( di =7|dose found)= 0.182 Pr( di =8|dose found)= 0.017