adaptive resource configuration for cloud infrastructure management
TRANSCRIPT

Future Generation Computer Systems 29 (2013) 472–487
Contents lists available at SciVerse ScienceDirect
Future Generation Computer Systems
journal homepage: www.elsevier.com/locate/fgcs
Adaptive resource configuration for Cloud infrastructure managementMichael Maurer a,∗, Ivona Brandic a, Rizos Sakellariou b
a Vienna University of Technology, Distributed Systems Group, Austriab University of Manchester, School of Computer Science, UK
a r t i c l e i n f o
Article history:Received 30 October 2011Received in revised form28 June 2012Accepted 14 July 2012Available online 25 July 2012
Keywords:Cloud ComputingAutonomic ComputingRule-based systemCase-Based ReasoningKnowledge managementResource management
a b s t r a c t
To guarantee the vision of Cloud Computing QoS goals between the Cloud provider and the customerhave to be dynamically met. This so-called Service Level Agreement (SLA) enactment should involvelittle human-based interaction in order to guarantee the scalability and efficient resource utilization ofthe system. To achieve this we start from Autonomic Computing, examine the autonomic control loopand adapt it to govern Cloud Computing infrastructures. We first hierarchically structure all possibleadaptation actions into so-called escalation levels. We then focus on one of these levels by analyzingmonitored data from virtualmachines andmaking decisions on their resource configurationwith the helpof knowledge management (KM). The monitored data stems both from synthetically generated workloadcategorized in different workload volatility classes and from a real-world scenario: scientific workflowapplications in bioinformatics. As KM techniques, we investigate two methods, Case-Based Reasoningand a rule-based approach. We design and implement both of them and evaluate them with the helpof a simulation engine. Simulation reveals the feasibility of the CBR approach and major improvementsby the rule-based approach considering SLA violations, resource utilization, the number of necessaryreconfigurations and time performance for both, synthetically generated and real-world data.
© 2012 Elsevier B.V. All rights reserved.
1. Introduction
The vision of Cloud Computing is to provide computing poweras a utility, like gas, electricity or water [1]. For the underlyinginfrastructure this means that it has to deal with dynamic loadchanges, ranging from peak performance to utilization gaps. Thisbrings up two issues: on the one hand, the management of aCloud Computing infrastructure has to guarantee pre-establishedcontracts despite all the dynamism of workload changes. Onthe other hand it has to efficiently utilize resources and reduceresource wastage. As to the former, the pre-established contracts,so called Service Level Agreements (SLAs), contain Service LevelObjectives (SLOs) that represent Quality of Service (QoS) goals,e.g., ‘‘storage should be at least 1000 GB’’, ‘‘bandwidth should beat least 10 Mbit/s’’ or ‘‘response time should be less than 2 s’’, andpenalties that have to be paid to the customer if these goals areviolated.
This work can be integrated into the Foundations of Self-governing ICT Infrastructure (FoSII) project [2], but is on its owncompletely self-sufficient. The FoSII project aims at developing an
∗ Correspondence to: Argentinierstrasse 8/184-1, 1040Wien, Austria. Tel.: +43 158801 18457.
E-mail addresses: [email protected] (M. Maurer),[email protected] (I. Brandic), [email protected] (R. Sakellariou).
0167-739X/$ – see front matter© 2012 Elsevier B.V. All rights reserved.doi:10.1016/j.future.2012.07.004
infrastructure for autonomic SLA management and enforcement.Besides the already implemented LoM2HiS framework [3] thattakes care of monitoring the state of the Cloud infrastructureand its applications, the knowledge management (KM) systempresented in this article can be viewed as another building blockof the FoSII infrastructure. [4] proposes an approach to manageCloud infrastructures bymeans of Autonomic Computing, which ina control loop monitors (M) Cloud parameters, analyzes (A) them,plans (P) actions and executes (E) them; the full cycle is knownas MAPE [5]. According to [6] a MAPE-K loop stores knowledge(K) required for decision-making in a knowledge base (KB) thatis accessed by the individual phases. This paper addresses theresearch question of finding a suitable KM system (i.e., a techniqueof how stored information should be used) and determining howit interacts with the other phases for dynamically and efficientlyallocating resources.
One of the imminent problems that come up when dealingwith the MAPE-K loop is to define possible actions that can beexecuted at the end of the loop. Due to the plethora of possiblereconfiguration actions in Clouds, e.g., increasing/decreasingavailable memory or storage for virtual machines (VMs), choosingVMs to migrate to selected physical machines (PMs), determiningPMs to power on/off, etc., it is not trivial to identify the mostbeneficial action in a certain situation. On the one hand it is nottrivial to retrieve and store all necessary information in a Cloudinfrastructure. On the other hand, andmore important in ourwork,

M. Maurer et al. / Future Generation Computer Systems 29 (2013) 472–487 473
dealing with the complexity of recommending an action basedon this information is, as we will see, in most cases NP-hard. Totackle this, we structure all possible actions and organize them ina hierarchical model of so called escalation levels.
In [7,8] we have shown that approaches using Case BasedReasoning (CBR) and rules as knowledge management techniquessucceed in autonomically enacting SLAs and governing importantparts of Cloud computing infrastructures. Case Based Reasoningwas chosen, because it offers a natural translation of Cloud statusinformation into formal knowledge representation and an easyintegration with the MAPE phases. Moreover, it promises tobe scalable (as opposed to e.g., Situation Calculus) and easilyconfigurable (as opposed to rule-based systems). Related workhas not observed the usage of CBR nor has it evaluated differentKM techniques in Cloud environments. However, we determinedsome drawbacks of CBR as far as its learning performance andits scalability were concerned. Therefore, we also designed andimplemented a rule-based knowledge management approach.Using rules [8]wemanaged to improve not only SLA adherence andresource allocation efficiency as discussed in [7], but also attainedan efficient use of reallocation actions and high scalability.
Yet, evaluating the KM system on a real environment is nota trivial task because of two reasons: First, Cloud infrastructuresusually are huge data centers consisting of hundreds of PMs andeven more VMs. Thus, a first step is to simulate the impact ofautonomic management decisions on the Cloud infrastructure todetermine the performance of the KM decisions. Consequently, wedesigned and implemented a simulation engine that mimics theMAPE-K cycle on large Clouds. Second, workload data for a largenumber of VMs has to be provided as input for the simulation.We decided to go two ways: On the one hand, we generatedsynthetic workload data categorized into different workloadvolatility classes. These workload volatility classes are determinedby the speed and intensity of workload change. On the other hand,we gathered real world data from monitoring scientific workflowapplications in the field of bioinformatics [9]. These workflowsneed a huge, yet unpredictable and varying amount of resources,and are thus – due to the needed flexibility and scalability – aperfect match for a Cloud computing application [10].
Themain challenge in thiswork is to evaluateKMtechniques forautonomic SLA enactment in Cloud computing infrastructures thatfulfill the three following conflicting goals: (i) achieving low SLAviolation rates; (ii) achieving high resource utilization such that thelevel of allocated but unused resources is as low as possible; and(iii) achieving (i) and (ii) by as few time- and energy-consumingreallocation actions as possible. We will call this problem theresource allocation problem throughout the rest of the paper.
The main contributions of this paper are:
1. Design and implementation of a generic (KM-technique ag-nostic) simulation engine to assess the quality of the KM anddecision-making techniques.
2. Partitioning the resource allocation problem for Cloud infras-tructures into several subproblems by proposing escalation lev-els that structure all possible reaction possibilities into differentsubproblems using a hierarchical model.
3. Design, Implementation and Evaluation of two KM techniquesfor one escalation level, i.e., VM resource configuration: CBR,and the rule-based approach.
4. Application of the rule-based approach to real-world monitor-ing data from scientific workflow applications in the field ofbioinformatics.
The remainder of this work is divided as follows: In Section 2we present related work. Section 3 gives some backgroundinformation by explaining the MAPE-K loop and the FoSII project.In Section 4 we structure the problem into the mentioned
escalation levels, and in Section 5 we describe how to usethe two KM techniques (CBR and rules) to tackle the resourceallocation problem for a certain escalation level. Section 6 showsthe evaluation of both approaches, especially focusing on the rule-based approach. Section 7 concludes this contribution and pointsout future work.
2. Related work
Concerning related work, we have determined four differentways to compare our work with other achievements in this area.Whereas the first level compares other works dealing with SLAenactment and resource efficiency, the second one considers thearea of knowledge management, and the third one comparescommercial products to our approach. Fourthly, the FoSII projectis briefly related to other projects in this field.
Firstly, there has been some considerable work on optimizingresource usage while keeping QoS goals. These papers, however,concentrate on specific subsystems of Large Scale DistributedSystems, such as [11] on the performance of memory systems,or only deal with one or two specific SLA parameters. Petrucciet al. [12] or Bichler et al. [13] investigate one general resourceconstraint andKhanna et al. [14] only focuses on response time andthroughput. A quite similar approach to our concept is provided bythe Sandpiper framework [15], which offers black-box and gray-box resource management for VMs. Contrary to our approach,though, it plans reactions just after violations have occurred. Alsothe VCONF model by Rao et al. [16] has similar goals as presentedin Section 1, but depends on specific parameters, can only executeone action per iteration and it neglects the energy consumptionof executed actions. Other papers focus on different escalationlevels (as described in Section 4). [17,18] focus on VM migrationand [19] on turning on and off physical machines, whereas ourpaper focuses on VM re-configuration. Additionally, none of thepresented papers uses a KB for recording past action and learning.Hoyer et al. [20] also undertake a speculative approach as inour work by overbooking PM resources. They assign VMs to PMsthat would exceed their maximum resource capacities, becauseVMs hardly ever use all their assigned resources. Computing thisallocation they also take into consideration workload correlationof different VMs. Borgetto et al. [21] tackle the trade-off betweenconsolidating VMs on PMs and turning off PMs on the onehand, and attaining SLOs for CPU and memory on the other.However, the authors assume a static setting and do not considerdynamically changing workloads. So, e.g., they do not take thenumber of migrations into account. Stillwell et al. [22] in a similarsetting define the resource allocation problem for staticworkloads,present the optimal solution for small instances and evaluateheuristics by simulations. Nathani et al. [23], e.g., also deal withVM placement on PMs using scheduling techniques. [24] reactto changing workload demands by starting new VM instances;taking into account VM startup time, they use prediction modelsto have VMs available already before the peak occurs. Other workssuch as [25] have already considered the last escalation level(see Section 4), i.e., outsourcing of applications to other Clouds.Summarizing we can say that there has been a great deal of workon the different escalation levels, whereas VM configuration hasnot been observed yet.
Secondly, there has been work on KM of SLAs, especially rule-based systems. Paschke and Bichler [26] look into a rule basedapproach in combination with the logical formalism ContractLog.It specifies rules to trigger after a violation has occurred, but itdoes not deal with avoidance of SLA violations. Others inspectedthe use of ontologies as KBs only at a conceptual level. [27] viewedthe system in four layers (i.e., business, system, network anddevice) and broke down the SLA into relevant information for
474 M. Maurer et al. / Future Generation Computer Systems 29 (2013) 472–487
each layer, which had the responsibility of allocating requiredresources. Again, no details on how to achieve this have beengiven. Bahati and Bauer [28] also use policies, i.e., rules, to achieveautonomic management. They provide a system architectureincluding a KB and a learning component, and divide all possiblestates of the system into so called regions, which they assign acertain benefit for being in this region. A bad region would be,e.g., response time > 500 (too slow), fair region response time <100 (too fast, consuming unnecessary resources) and a good region100 ≤ response time ≤ 500. The actions are not structured, butare mixed together into a single rule, which makes the rules veryhard to manage and to determine a salience concept behind them.However, we share the idea of defining ‘‘over-utilized’’, ‘‘neutral’’and ‘‘under-utilized’’ regions. Our KM system allows us to chooseany arbitrary number of resource parameters that can be adjustedon a VM. Moreover, our paper provides a more wholesomeapproach than related work and integrates the different actionlevels that work has been carried out on.
Thirdly, commercial Cloud IaaS platforms such as AmazonEC2 [29], Rackspace [30] or RightScale [31] have a very limitedchoice of preconfigured and static VM resource provisioningtypes. Amazon EC2 only offers VM instance types such as small,medium or large with predefined storage, computing units, andmemory without the possibility of reconfiguring or fine-tuningthem beforehand, not to mention during runtime. Rackspace onlyoffers storage on the IaaS level, and RightScale focuses moreon integrating different IaaS platforms such as Amazon EC2 orRackspace into a holistic view.
Fourthly, compared to other SLA management projects likeSLA@SOI [32], the FoSII project in general is more specific on CloudComputing aspects like deployment, monitoring of resources andtheir translation into high level SLAs instead of just working onhigh-level SLAs in general service-oriented architectures.
3. Background
In this section we describe how the KM approach can beintegrated within a more holistic Cloud management project that,e.g., also consists of amonitoring component. Yet, the KMapproachdoes not depend on the specific used monitoring framework, aslong as it correctly measures the current values of the parametersspecified in the SLA.
In this case, the FoSII project will serve as a running exam-ple. We will describe how the KM approach relates to other com-ponents of the FoSII project. Generally, the project distinguishesbetween system set-up and run time. During system set-up, applica-tions, their corresponding SLAs and used infrastructure are tailoredand adapted. Once the application is deployed, we consider mon-itoring, knowledge management and execution phases during runtime. In this section, in particular,we focus on the adaptation,mon-itoring, and knowledge management phases, as shown in Fig. 1.Thus, the MAPE-K loop is extended to the A-MAPE-K loop, wherethe additional A stands for the adaptation phase during system set-up. This adaptation phase, however, should not be confused withlater adaptation and re-configuration of resources during systemrun time. Quite evidently, we especially focus on the knowledgemanagement phase in this paper. The three mentioned phases aredescribed as follows:
Adaptation As shown in Fig. 1, part 1, the adaptation phase com-prises all steps necessary to be done before successfuldeployment and start of the application. This includesSLA contract establishment and tailoring of the monitor-ing systems for the particular application. We assumethat Cloud providers register their resources to partic-ular databases containing public SLA templates. There-after, Cloud users can look up resources that they want
to use for the deployment of their applications. Similarto the providers, Cloud users also have an SLA templateutilized for their private business processes. We assumethat the private SLA template cannot be changed, since itcould also be part of some other local business processesand has usually to comply with different legal and secu-rity guidelines. If matching SLA templates are found, anSLA contract can be negotiated and established and theapplication can be deployed.Thus, during this phase it has to be ensured thatprivate templates of the provider and consumers matchpublicly available templates. However, public and privatetemplates may differ. A typical mismatch betweentemplates would be between different measurementunits of attributes, as for example for the SLO clockspeed or missing attributes. Therefore, a mechanism isrequired for the automatic adaptation between differenttemplates without changing the templates themselves.A possible solution for this is the so called SLA mappingapproach presented in [33]. This approach can includehandling of missing SLA parameters, inconsistenciesbetween attributes and translation between differentattributes. More complex adaptations would includeautomatic service aggregation, including third partyservices, if, for example, the clock speed attribute iscompletely missing in the public template, but requiredin the private template. A third party provider (e.g., acomputer hardware reseller) could be integrated todeliver information about the clock speed attribute.Detailed information on the adaptation phase includingthe SLA mapping approach are found in [33,34].
Monitoring Current monitoring systems (e.g., ganglia [35]) facili-tatemonitoring only of low-level systems resources, suchas free_disk or packets_sent, but SLA parameterstypically are, e.g., storage and outgoing bandwidth. Thus,SLA parameters required by an application usually differfrom the parameters measured by the monitoring tools.To achieve a mapping from the low-level metrics to thehigh-level SLA parameters, the monitoring phase shouldcomprise two core components, namely the host mon-itor and the run-time monitor (see Fig. 1, part 2). Theformer is responsible for monitoring low-level resourcemetrics, whereas the latter is responsible formetricmap-ping, and consequently for the monitoring of SLAs andinforming the KM phase about SLA violations. This moni-toring framework has proven to be highly scalable and ispresented in more detail in [3].
Knowledge Management Since the analysis, plan and KB partsare highly interweaved with each other, we call theensemble of these phases the Knowledge ManagementPhase (see Fig. 1, part 3). The knowledge managementcomponent receives current information about SLAparameters of each running application from the run-time monitor of the monitoring component. Dependingon the KM technique in use, the KM phase analyzesthis data to determine critical situations, where eitherSLA parameters are about to be violated or too manyresources are wasted. The analysis component receivesthe monitoring data, stores it in the KB and queriesit to recommend an action to be executed. The planphase maps these actions onto PMs or plans outsourcingthem to other Cloud providers. Finally, the actions areexecuted (Execution phase) with the help of actuators.Additionally, the KB does not only enable decisionmaking out of current data, i.e., suggesting actions tobe executed, but also improving the quality of decisionsby keeping track of the success or failure of previousdecisions, i.e., learning.

M. Maurer et al. / Future Generation Computer Systems 29 (2013) 472–487 475
Fig. 1. FoSII infrastructure.
4. Structuring the problem: escalation levels
This section presents a methodology of dividing the resourceallocation problem into smaller subproblems using a hierarchicalapproach. It demonstrates which actions can be executed in whatlevel to achieve SLA adherence and efficient resource allocation forCloud infrastructures.
In general, we can think of the following reallocation actions:
1. for individual applications:(a) Increase incoming bandwidth share by x%.(b) Decrease incoming bandwidth share by x%.(c) Increase outgoing bandwidth share by x%.(d) Decrease outgoing bandwidth share by x%.(e) Increase memory by x%.(f) Decrease memory by x%.(g) Add allocated storage by x%.(h) Remove allocated storage by x%.(i) Increase CPU share by x%.(j) Decrease CPU share by x%.(k) Outsource (move application) to other Cloud.(l) Insource (accept application) from other Cloud.
(m) Migrate application to different VM.2. for VMs:
(a) Increase incoming bandwidth share by x%.(b) Decrease incoming bandwidth share by x%.(c) Increase outgoing bandwidth share by x%.(d) Decrease outgoing bandwidth share by x%.(e) Increase memory by x%.(f) Decrease memory by x%.(g) Add allocated storage by x%.(h) Remove allocated storage by x%.(i) Increase CPU share by x%.(j) Decrease CPU share by x%.(k) Outsource (move VM) to other Cloud.(l) Insource (accept VM) from other Cloud.
(m) Migrate VM to different PM.
3. for physical machines (computing nodes):(a) Add x computing nodes.(b) Remove x computing nodes.
4. Do nothing.
For an application, under ‘‘increase incoming bandwidth share’’we understand to increase the application’s share of all theavailable incoming bandwidth of a VM, and for a VM the sharerelates to all the available incoming bandwidth of a PM. Theidea of bandwidth sharing is a common idea in network systemsas described in [36]. Similar arguments account for outgoingbandwidth or CPU share.
We then group these actions into so called escalation levelsthat we define in Table 1. The idea is that every problem thatoccurs should be solved on the lowest escalation level. Only ifthis is not possible, the problem is tried to be solved on the nextlevel, and again, if this fails, on the next one, and so on. Thelevels are ordered in a way such that lower levels offer faster andmore local solutions than higher ones. At every level it has to bedecided, whether the proposed action should be executed or not,because it is important to know when to do nothing, since everyreallocation action is time and energy consuming. In fact, for everylevel there is the possibility not to execute the proposed action.If the proposed action is not executed, then the decision-makingprocess will stop and not evaluate whether the next escalationlevel should be considered or not.
The first escalation level (‘‘change VM configuration’’) works lo-cally on a PM and tries to change the amount of storage ormemory,e.g., that is allocated to the VM from the PM resources. Then, mi-grating applications (escalation level 2) is more lightweight thanmigrating VMs and turning PMs on/off (escalation levels 3 and4). For all three escalation levels already the whole system statehas to be taken into account to find an optimal solution. Theproblem stemming from escalation level 3 alone can be formu-lated into a binary integer problem (BIP), which is known to beNP-complete [37]. The proof is out of scope for this paper, but asimilar approach can be seen in [12]. The last escalation level hasleast locality and greatest complexity, since the capacity of other

476 M. Maurer et al. / Future Generation Computer Systems 29 (2013) 472–487
(a) Before action execution. (b) After action execution.
Fig. 2. Actions used in five escalation levels: before and after action execution.
Table 1Escalation levels.
1. Change VM configuration.2. Migrate applications from one VM to another.3. Migrate one VM from one PM to another or create new VM on
appropriate PM.4. Turn on/off PM.5. Outsource to other Cloud provider.
Cloud infrastructures have to be taken into account, too, and nego-tiations have to be started with them as well.
Also the rule-based approach benefits from this hierarchicalaction level model, because it provides a salience concept forcontradicting rules. Without this concept it would be troublesometo determine which of the actions, e.g., ‘‘Power on additionalPM with extra storage and migrate VM to this PM’’, ‘‘Increasestorage for VM by 10%’’ or ‘‘Migrate application to another VMwith more storage’’ should be executed, if a certain threshold forallocated storage has been exceeded. The proposed KMapproacheswill present a solution for escalation level 1. Fig. 2 visualizes theescalation levels fromTable 1 before and after actions are executed.Fig. 2(a) shows applications App1 and App2 deployed on VM1 thatis itself deployed on PM1, whereas App3 runs on VM2 running onPM2. Fig. 2(b) shows example actions for all five escalation levels.The legendnumbers correspond to the respective numbering of theescalation levels.
• Escalation level 1: At first, the autonomic manager considerswhether it should change VM configuration or not. Actions (1)show that the autonomic manager decided to change the VMconfiguration; VM1 is being up-sized and VM2 being down-sized.
• Escalation level 2: If VM reconfiguration has taken place, orif it has been recommended, but cannot be fulfilled yet,because some resource cannot be increased anymore due to theconstraints of the PM hosting the VM, in level 2 the autonomicmanager considers migrating the application to another largerVM that fulfills the required specifications from level 1. Soif, e.g., provided storage needs to be increased from 500 to800 GB, but only 200 GB are available on the respective VM,then the application has to be migrated to a VM that has atleast the same resources as the current one plus the remaining100 GB of storage. Action (2) shows the re-deployment of App2to VM2. Due to possible confinements of some applicationsto certain VMs, e.g., a user deployed several applications thatneed to work together on one VM, this escalation might beskipped in some scenarios. Also for Infrastructure as a Service(IaaS) providers, who directly provide the VMs without caringabout the applications running on them, this escalation level isomitted.
• Escalation level 3: If there is no appropriate VM available inlevel 2, or if level 2 is skipped and VM configurations havebeen recommended in level 1, in level 3 the autonomicmanagerconsiders creating a newVMon an appropriate PMormigratingthe VM to a PM that has enough available resources. Action (3)shows the re-deployment of VM2 to PM1.
• Escalation level 4: Again, if there is no appropriate PM availablein level 3, the autonomic manager suggests turning on a newPM (or turning it off if the last VMwas emigrated from this PM)in level 4. Action (4) shows powering on a new PM (PM3).
• Escalation level 5: Finally, the last escalation level 5 tries to out-source the application to another Cloud provider as explained,e.g., in the Reservoir project [38]. Action (5) outsources App3 toanother Cloud provider.
For an IaaS provider omitting escalation level 2, the sequence ofthese escalation levels is quite obvious: If VM sizes are not changedin escalation level 1, there is no need to trigger escalation level 3as VMs have not changed, and no better allocation of VMs to PMscan be found, if the previous one was already optimal. However,if VM sizes were changed, escalation level 3 can still come tothe conclusion that VM migrations are unnecessary. On the otherhand, if VM migrations were recommended, some PMs could bethen turned off in escalation level 4. Similarly, if no migrationswere triggered, thinking about turning off PMs is unnecessary,as no PMs run idle now that have not been running idle before.Finally, if all the previous actions were successfully executedwithout the help of another Cloud provider, there is no need toconsider outsourcing applications. Only if the last possibility failed,outsourcing applications should be considered. (Other businessincentives for outsourcing applications such as cheaper executioncosts in other Clouds, etc., are not consideredhere.) For providers ofother Cloud delivery models such as SaaS or PaaS, the sequence ofplacing applicationmigration after VM reconfiguration is arguable;another model could also propose an inverse sequence for thesetwo levels.
5. Implementing the knowledge management phase
In this sectionwepresent the implementation of theKnowledgeManagement phase using CBR and a rule-based approach.
5.1. Prerequisites
This subsection subsumes all the common assumptions for bothapproaches.
We assume that customers deploy applications on an IaaSCloud infrastructure. SLOs are defined within an SLA betweenthe customer and the Cloud provider for every application.

M. Maurer et al. / Future Generation Computer Systems 29 (2013) 472–487 477
Table 2Cases of (non-) SLA violations using the example of storage.
Provided (1) (GB) Utilized (2) (GB) Agreed (3) (GB) Violation?
500 400 1000 No500 510 1000 Yes
1000 1010 1000 No
Furthermore, there is a 1:1 relationship between applications andVMs. One VM runs on exactly one PM, but one PM can host anarbitrary number of VMs with respect to supplied vs. demandedresource capacities. After allocating VMs with an initial capacity(by estimating initial resource demand) for every application,we continuously monitor actually used resources and re-allocateresources according to these measurements.
For tackling the resource allocation for VMs, we need to definehow measured, provided and agreed values interrelate, and whatactually constitutes an SLA violation. An example is providedin Table 2. First, we deal with the measured value (1), whichrepresents the amount of a specific resource that is currently usedby the customer. Second, there is the amount of allocated resource(2) that can be used by the customer, i.e., that is allocated to theVM which hosts the application. Third, there is the SLO agreed inthe SLA (3). A violation therefore occurs, if less is provided (2) thanthe customer utilizes (or wants to utilize) (1) with respect to thelimits set in the SLA (3). Considering Table 2we can see that rows 1and 3 do not represent violations, whereas row 2 does represent anSLA violation. In order to save resources we envision a speculativeapproach: Can we allocate less than agreed, but still more thanused in order not to violate an SLA? Themost demanding questionsare how much can we lower the provisioning of resource withoutrisking an SLA violation. This heavily depends on the characteristicsof the workload of an application, especially its volatility.
5.2. Case Based Reasoning
Case Based Reasoning is the process of solving problems basedon past experience [39]. In more detail, it tries to solve a case(a formatted instance of a problem) by looking for similar casesfrom the past and reusing the solutions of these cases to solve thecurrent one. In general, a typical CBR cycle consists of the followingphases assuming that a new case was just received:
1. Retrieve the most similar case or cases to the new one.2. Reuse the information and knowledge in the similar case(s) to
solve the problem.3. Revise the proposed solution.4. Retain the parts of this experience likely to be useful for future
problem solving. (Store new case and found solution in KB.)
To adapt CBR to our problem, three issues have to be solved.First, it has to be decided how to format an instance of the problem.Second, it has to be decidedwhen two cases are similar. Third, goodreactions have to be distinguished from bad reactions.
As to the first problem we assume that each SLA has a uniqueidentifier id and a collection of SLOs. SLOs are predicates of the form
SLOid(xi, comp, πi) with comp ∈ {<, ≤, >,≥, =}, (1)
where xi ∈ P represents the parameter name for i = 1, . . . ,nid, πi the parameter goal, and comp the appropriate comparisonoperator. Then, a CBR case c is defined as
c = (id,m1, p1,m2, p2, . . . ,mnid , pnid), (2)
where id represents the SLA id, andmi and pi themeasured (m) andprovided (p) value of the SLA parameter xi, respectively.
To use the SLA parameters storage and incoming bandwidth forexample, a typical use case looks like this: SLA id = 1 withSLO1 (‘‘Storage’’, ≥, 1000) and SLO1 (‘‘Bandwidth’’, ≥, 50.0). A
corresponding case received by the measurement component istherefore written as c = (1, 500, 700, 20.0, 30.0). A result caserc = (c−, ac, c+, utility) includes the initial case c−, the executedaction ac , the resulting case c+ measured some time interval later,which corresponds to one iteration in the simulation engine, andthe calculated utility described later. In order to give the KB someknowledge about what to do in specific situations, several initialcases are stored in the KB as described in [7] in more detail.
Secondly, to define similarity between two cases is not straight-forward, because due to their symmetric nature Euclidean dis-tances, e.g., do not recognize the difference between over- andunder-provisioning. Following the principle of semantic similar-ity from [40] for the summation part this leads to the followingequation
d(c−, c+) = min(wid, |id−− id+
|)
+
x∈P
wx
(p−x − m−
x ) − (p+x − m+
x )
maxx
−minx
, (3)
where w = (wid, wx1 , . . . , wxn) is the weight vector; wid is theweight for non-identical SLAs; wx is the weight, and maxx andminx themaximum andminimum values of differences px −mx forparameter x.
As far as the third issue is concerned, every action is evaluatedby its impact on violations and utilization. This way CBR isable to learn whether an action was appropriate for a specificmeasurement or not. The utility of an action is calculated bycomparing the initial case c− with the resulting final case c+. Theutility function is composed by a violation and a utilization termweighed by the factor 0 ≤ α ≤ 1:
utility =
x∈P
violation(x) + α · utilization(x). (4)
Higher values forα strengthen theutilization of resources,whereaslower values the non-violation of SLA parameters. We further notethat c(x) describes a case only with respect to parameter x. E.g.,we say that a violation has occurred in c(x), when in case c theparameter xwas violated.
We define the violation function for every parameter x asfollows:
violation(x) =
1, No violation occurred in c+(x),but in c−(x)
1/2, No violation occurred in c+(x)and c−(x)
−1/2 Violation occurred in c+(x) and c−(x)−1 Violation occurred in c+(x),
but not in c−(x).
(5)
The utilization function is calculated by comparing the usedresources to the provided ones. We define the distance δ(x, y) =
|x − y|, and utilization for every parameter as
utilization(x) =
1, δ(p−
x ,m−
x ) > δ(p+
x , u+
x )
−1, δ(p−
x ,m−
x ) < δ(p+
x , u+
x )0, otherwise.
(6)
A utilization utility of 1 is retrieved if less over-provisioning ofresources takes place in the final case than in the initial one, anda utilization utility of −1 if more over-provisioning of resourcestakes place in the final case than in the initial one.
The whole CBR process works as follows: Before the firstiteration, we store the mentioned initial cases consisting of aninitialmeasurement, an action and a resultingmeasurement. Then,when CBR receives a new measurement, this measurement iscompared to all cases in the KB. From the set of closest cases

478 M. Maurer et al. / Future Generation Computer Systems 29 (2013) 472–487
Table 3Resource policy modes.
Green Plenty of resources left. Over-consumption allowed.
Green–orange Heavy over-consumption is forbidden. All applications that consume morethan τ% (threshold to be specified) of the agreed resource SLO arerestrained to τ/2% over-consumption
Orange Resource is becoming scarce, but SLA demand can be fulfilled if noover-consumption takes place. Thus, over-provisioning is forbidden.
Orange–red Over-provisioning forbidden. Initiate outsourcing of some applications.
Red Over-provisioning forbidden. SLA resource requirements of all consumerscannot be fulfilled. If possible, a specific choice of applications isoutsourced. If not enough, applications with higher reputation points orpenalties are given priority over applications with lower reputationpoints/penalties. SLAs of latter ones are deliberately broken to ensure SLAsof former ones.
grouped by a clustering algorithm we choose the one with thehighest utility and execute exactly the same action as in the chosencase. Afterwards, this action, the resulting measurement and theutility of the action is added to the initial measurement, and storedas a complete case.
5.3. Rule-based approach
For the rule-based approach we first introduce several resourcepolicy modes to reflect the overall utilization of the system inthe VM configuration rules. Dealing with SLA-bound resourcemanagement, where resource usage is paid for on a ‘‘pay-as-you-go’’ basis with SLOs that guarantee a minimum capacity ofthese resources as described above, raises the question, whetherthe Cloud provider should allow the consumer to use moreresources than agreed. We will refer to this behavior as over-consumption. Since the consumer will pay for every additionalresource, it should be in the Cloud provider’s interest to allowover-consumption as long as this behavior does not endanger theSLAs of other consumers. Thus, Cloud providers should not allowover-consumption when the resulting penalties they have to payare higher than the expected revenue from over-consumption.To tackle this problem, we introduce five policy modes for everyresource that describe the interaction of the five escalation levels.As can be seen in Table 3 the policymodes are green, green–orange,orange, orange–red and red. They range from low utilization of thesystem with lots of free resources left (policy mode green) overa scarce resource situation (policy mode orange) to an extremelytight resource situation (policy mode red), where it is impossibleto fulfill all SLAs to their full extent and decisions have to bemade which SLAs to deliberately break and which applications tooutsource.
In order to know whether a resource r is in danger of under-provisioning or already is under-provisioned, or whether it is over-provisioned, we calculate the current utilization ut r =
userprr × 100,
where user and prr signify howmuch of a resource r was used andprovided, respectively, and divide the percentage range into threeregions using the two ‘‘threat thresholds’’ TT r
low and TT rhigh:
• Region −1: Danger of under-provisioning, or under-provision-ing (>TT r
high).• Region 0: Well provisioned (≤TT r
high and ≥ TT rlow).
• Region +1: Over-Provisioning (<TT rlow).
The idea of this rule-based design is that the ideal value thatwe call target value tv(r) for utilization of a resource r is exactlyin the center of region 0. So, if the utilization value after somemeasurement leaves this region by using more (Region −1) or lessresources (Region +1), then we reset the utilization to the targetvalue, i.e., we increase or decrease allocated resources so that theutilization is again at
tv(r) =TT r
low + TT rhigh
2%.
Fig. 3. Example behavior of actions at time intervals t1–t6 .
As long as the utilization value stays in region 0, no action will beexecuted. E.g., for r = storage, TT r
low = 60%, and TT rhigh = 80%,
the target value would be tv(r) = 70%. Fig. 3 shows the regionsand measurements (expressed as utilization of a certain resource)at time steps t1, t2, . . . , t6. At t1 the utilization of the resourceis in Region −1, because it is in danger of a violation. Thus, theKB recommends to increase the resource such that at the nextiteration t2 the utilization is at the center of Region 0, which equalsthe target value. At time steps t3 and t4 utilization stays in thecenter region and consequently, no action is required. At t5, theresource is under-utilized and so the KB recommends the decreaseof the resource to tv(r), which is attained at t6. Additionally, ifover-provisioning is allowed in the current policy mode, then theadjustment will always be executed as described regardless ofwhat limit was agreed in the SLA. On the other hand, if over-provisioning is not allowed in the current policy mode, then therule will allocate at most as much as agreed in the SLA (SLOr ).
The concept of a rule increasing resource r is depicted in Fig. 4.The rule executes if the current utilization ut r and the predictedutilization ut rpredicted of the next iteration (cf. next paragraph) bothexceed TT r
high (line 2). Depending on what policy level is activethe rule either sets the provided resource prr to the target valuetv(r) for policy levels green and green–orange (line 3) or to at mostwhat was agreed in the SLA (SLOr ) plus a certain percentage ϵ toaccount for rounding errors when calculating the target value inpolicy levels orange, orange–red and red (line 5). A similar rulescheme for decreasing a resource can be seen in Fig. 5. The maindifference is that it does not distinguish between policymodes andthat it sets the provisioned resource to at least a minimum valueminPr r , whichmay be 0, that is needed to keep the application alive

M. Maurer et al. / Future Generation Computer Systems 29 (2013) 472–487 479
Fig. 4. Rule scheme for increasing a resource.
Fig. 5. Rule scheme for decreasing a resource.
(line 4). The rule is executed if the current utilization ut r and thepredicted utilization ut rpredicted of the next iteration both lie belowTT r
low (line 2).A large enough span between the thresholds TT r
low and TT rhigh
helps to prevent oscillations of repeatedly increasing and decreas-ing the same resource. However, to further reduce the risk of os-cillations, we suggest to calculate a prediction for the next valuebased on the latest measurements. Thus, an action is only invokedwhen the current AND the predicted measurement exceed the re-spective TT. So, especially when only one value exceeds the TT, noaction is executed.
The rules have been implemented using the Java rule engineDrools [41]. The Drools engine sets up a knowledge sessionconsisting of different rules and a working memory. Rules getactivated when specific elements are inserted into the workingmemory such that the conditional ‘‘when’’ part evaluates to true.Activated rules are then triggered by the simulation engine. Inour case, the simulation engine inserts measurements and SLAsof applications into the working memory. Different policy modeswill load slightly modified rules into the Drools engine and thusachieve a high adaptability of the KM system reacting to thegeneral performance of the Cloud infrastructure. As opposed to theCBR approach in [7], the rule-based approach is able to fire morethan one action at the same iteration, which inherently increasesthe flexibility of the system. Without loss of generality we canassume that one application runs on one VM (several applications’SLAs can be aggregated to form one VM SLA) and we assume themore interesting case of policy modes orange, orange–red or red,where over-provisioning is not allowed.
Listing 1 shows the rule to increase parameter storage formu-lated in the Drools language following the pattern presented inFig. 4. Line 1 defines the name of the rule that is split into a con-dition part (when, lines 2–12) and an execution part (then, lines13–17). Line 4 tries to find the SLA of an application, and stores itsid in $slaID and the SLA into $slaApp. Line 6 looks for a set ofactions for this $slaID where no storage action has been addedyet (storage == false) in order to avoid contradicting actionsfor storage for one measurement. Line 8 searches for a measure-ment for the appropriate VM (vmID == $slaID) that has been in-serted into working memory that is no prediction ($prediction== false) and where the percentage of utilized storage exceedsTT r
high (storage_utilized > storage_HighTT), and storesused and provided values into $s_used and $s_provided, re-spectively. The predicted measurement for the next iteration ishandled similarly in line 10. Finally, line 12 checks whether pro-vided storage is still below the agreed value in the SLA. This is done,because in policy modes orange to red over-consumption is pro-hibited. The rules for policy modes green and green–orange wouldomit this line. Now, if all these conditions are met, the rule getsactivated. When fired, line 15 calculates the new value for prr as
explained in Fig. 4. This line (as line 12) would also be altered forpolicy modes green and green–orange. Line 17 then modifies theaction container $as and inserts the appropriate storage actionwith the value for provided storage to be set. Other rules followthe same pattern as described here and in Fig. 4 for rules increas-ing resource allocations and in Fig. 5 for rules decreasing resourceallocations.
Listing 1: Rule ‘‘storage_increase’’1 rule " storage_increase "2 when3 / / Remember SLA id o f app l i ca t i on4 $SLA_app : Application ( $slaID : id )5 / / Look f o r s e t o f ac t i ons that has no storage act ion yet6 $ as : Actions ( s la ID == $slaID , storage == fa lse )7 / / Look f o r measurement that has high u t i l i z a t i o n of
s torage8 $m : Measurement ( predict ion == false , s to rage_ut i l i zed >
storage_HighTT , vmID == $slaID , $s_used : storage_used, $s_provided : storage_provided )
9 / / Look f o r pred i c ted measurement that w i l l have highu t i l i z a t i o n of s torage
10 $m_pred : Measurement ( predict ion == true ,s to rage_ut i l i zed > storage_HighTT , vmID == $slaID )
11 / / Check whether we provide l e s s than SLO value12 eval ( $s_provided <= Double . valueOf ( $SLA_app .
getThresholdByName ( " storage " ) ) )13 then14 / / Ca l cu la t e tv15 double newStorage = Math .min( $s_used / ( ( storage_HighTT+
storage_LowTT ) /2) , Double . valueOf ( SLA_app .getThresholdByName ( " storage " ) )∗ (1+eps /100) ) ;
16 / / Add storage act ion to s e t o f ac t i ons17 modify ( $ as ) addAction (new StorageActionDirect ( newStorage
, "GB" ) ) , setStorage ( ) ;18 end
6. Evaluation and comparison
In this section we evaluate the two presented approacheswith several different synthetic and real-world workload data. Forthis purpose, we present a KM-agnostic simulation engine thatimplements the autonomic control loop and simulates executedactions and evaluates their quality responding to the workloaddata at stake.
6.1. Simulation engine implementing the MAPE-K loop
The goal of the simulation engine is to evaluate the qualityof a KM system with respect to the number of SLA violations,the utilization of the resources and the number of requiredreallocation actions. Furthermore, the simulation engine servesas an evaluation tool for any KM technique in the field of CloudComputing, as long as it can implement the twomethods of the KBmanagement interface:
1. public void receiveMeasurement(int slaID,String[] provided,String[] measurements, List<String>violations); and
2. public Actions recommendAction(int slaID);.

480 M. Maurer et al. / Future Generation Computer Systems 29 (2013) 472–487
Fig. 6. Simulation engine implementing MAPE-K loop.
The parameter slaID describes the ID of the SLA thatis tied to the specific VM, whose provided and measuredvalues are stored in the arrays provided and measurements,respectively (cf. Section 5.1). The list violations contains allSLA parameters being violated for the current measurements.The method receiveMeasurement inputs new data into theKB, whereas the method recommendActions outputs an actionspecific to the current measurement of the specified SLA. Thesimulation engine traverses all parts of the MAPE-K loop as canbe seen in Fig. 6 and described in Section 3. The simulationengine is iteration based, meaning that in one iteration the MAPE-K loop is traversed exactly once. (In reality, one iteration couldlast from some minutes to about an hour depending on thespeed of the measurements, the length of time the decisionmaking takes, and the duration of the execution of the actions,for example migrating a resource intensive VM to another PM.)The Monitoring component receives monitoring information fromeither synthetic or real-world workload from the current iteration.It forwards the data into the Knowledge base (1). The Knowledgebase contains representations of all important objects in the Cloudand their characteristic information. These objects are the runningapplications, the virtual machines, and the physical machineswith the current state of their CPU power, memory, storage, etc.,the corresponding SLAs with their SLOs, and information aboutother Clouds in the same federation. Furthermore, the KB also hasrepresentations of the inserted measurements, and the availableactions to execute (these have to be pre-defined). Finally, the KBalso contains a decision mechanism that interprets the state ofavailable objects in order to recommend a reconfiguration action.This mechanism can be substituted by any KM technique; asalready mentioned, we used CBR and a rule-based mechanism.The next step in the MAPE loop is the Analysis component, whichqueries the KB for actions to recommend (for a specific SLA id)(2); these actions are then returned to the analysis component(3). The Planning component schedules the suggested actions,and the Execution component executes them. The changed stateconfiguration of the Cloud objects are automatically reflected inthe KB (4). The Monitoring and the Execution components aresimulated. This means that the monitoring data is not measuredon a real system during the simulation, even though it handlesinput measured at a real system or synthetic workloads generatedbeforehand (see Sections 6.3 and 6.4). The Execution componentupdates the object representation of themanipulated objects in theKB, but obviously does not actually manipulate real-world objects.The quality of the decision making can ultimately be judged by
the number of occurred SLA violations, resource wastage and thenumber of needed reallocation actions.
6.2. Performance indicators
The subsequent evaluations will be based on the followingperformance indicators: violations, utilization, actions, resourceallocation efficiency (RAE), costs, and time efficiency. Whereasthe first three and the last one are rather self-explanatory,costs and RAE need a little more explanation. So violationsand actions measure (as a percentage) the amount of occurringviolations/actions in relation to all possible violations/actions, andutilization the average utilization over all iterations (and over allSLA parameters, if they are not shown explicitly). Time efficiencymeasures the average time that is needed to handle one VM inone iteration. For resource allocation efficiency we want to relateviolations and utilization. The basic is idea is that RAE should equalutilization (100%−w, wherew stands for wastage, see below) if noviolations occur (p = 0%, where p stands for penalty, see below),equal 0 if the violation rate is at 100%, and follow a linear decreasein between. Thus, we define
RAE =(100 − w)(100 − p)
100. (7)
A more general approach also taking into account the cost ofactions represents the definition of a generic cost function thatmaps SLA violations, resource wastage and the costs of executedactions into a monetary unit, which we want to call Cloud EUR.First, we define a penalty function pr(p) : [0, 100] → R+ thatdefines the relationship between the percentage of violations p (asopposed to all possible violations) and the penalty for a violationof resource r . Second, we define a function wastage wr(w) :
[0, 100] → R+ that relates the percentage of unused resources wto the energy in terms ofmoney that these resources unnecessarilyconsume. Third, we define a cost function ar(a) : [0, 100] →
R+ from the percentage of executed actions a (as opposed to allpossible actions that could have been executed) to the energy andtime costs in terms of money. The total cost c is then defined as
c(p, w, c) =
r
pr(p) + wr(w) + ar(a). (8)
We assume functions pr , wr and ar for this evaluationwith pr(p) =
100p, wr(w) = 5w, and ar(a) = a for all r . The intention behindchoosing these functions is (i) to impose very strict fines in order

M. Maurer et al. / Future Generation Computer Systems 29 (2013) 472–487 481
to proclaim SLA adherence as top priority, (ii) to weigh resourcewastage a little more than the cost of actions.
The cost function is currently not evaluated within the simula-tion engine, it is a value calculated after the simulation for compar-ison reasons. Thus, the recommended actions do not depend on thespecific functions we assumed. However, it could be incorporatedinto the KB in order to adjust and learn the TTs for every resource r .
6.3. Evaluation and comparison of CBR and rules using synthetic data
To evaluate a great variety of workload data, one approach isto create them synthetically. For this, we extended the workloadgenerator as described in [7] to allow a categorization of datavolatility.
The workload generator is intended to generate very generalworkloads for IaaS platforms dealing with slower developmentsas well as rapid changes. For one parameter, the workload isgenerated as follows: The initial value of theworkloads is randomlydrawn from a Gaussian distribution with µ =
SLO2 and σ =
SLO8 ,
where SLO represents the Service Level Objective value agreedin the SLA. Then, an up- or down-trend is randomly drawn, aswell as a duration of this trend between a pre-defined numberof iterations (for our evaluation this interval of iterations equals[2, 6]), both with equal probability. For every iteration, as longas the trend lasts, the current measured value is increased ordecreased (depending on the trend) by a percentage evenly drawnfrom the interval [iBegin, iEnd]. After the trend is over, a new trendis drawn and the iterations continue as described before.
Clearly, the values for iBegin and iEnd determine the difficultyfor handling the workload. A workload that operates with lowiBegin and iEnd values exhibits only very slight changes and doesnot, consequently, need a lot of dynamic adaptations. Large iEndvalues, on the contrary, need the enforcement mechanisms tobe very elastically tuned. For the evaluation and comparison ofCBR and the rule-based approach we defined a LOW_MEDIUMworkload volatility class with iEnd = 18%. For the further eval-uation of the rule-based approach we defined and tested LOW,MEDIUM, MEDIUM_HIGH and HIGH workload volatility classes(not shown here) with iEnd = 10%, 50%, 75%, and 100%, re-spectively. As a minimum change we set iBegin = 2% for allclasses.
As the crucial parameters for CBR and the rule-based approachdiffer, we define scenarios for both approaches separately, but stillcompare them to the aforementioned six performance indicators.
As resources for IaaS one can use all parameters that can beadapted on a VM. For the evaluation we chose to take the follo-wing parameters and SLOs for CBR: storage ≥ 1000 GB, incomingbandwidth ≥ 20 Mbit/s, and the following parameters andSLOs for the rule-based approach: storage ≥ 1000 GB, incomingbandwidth ≥ 20 Mbit/s, outgoing bandwidth ≥ 50 Mbit/s,memory ≥ 512 MB, and CPU power ≥ 100 MIPS (Million Instruc-tions Per Second).
As far as CBR is concerned, its behavior differs by the α valuein Eq. (4) (setting importance to avoiding violations or achievinghigh utilization), by the number of executed iterations, becauseof its inherent learning feature, and the initial cases. At thebeginning, we configure all 50 VMs exactly equally with 80%of the storage SLO value and two-thirds of the bandwidth SLOvalue provided. Then, we execute 2, 5, 10 and 20 iterations withvalues for α being 0.1, 0.2, 0.3, 0.4, 0.5, 0.6 and 0.8. We omitvalues 0.2 and 0.4 in the evaluation because their outcomes donot differ enough from the values shown, and all values > 0.5,because they reveal unacceptable high SLA violation rates. Settingup the initial cases was done by choosing one representativecase for each action that could be triggered. For our evaluationthe SLA parameters bandwidth and storage (even though not
Fig. 7. Choosing initial cases for CBR using the example of storage.
Table 4Eight simulation scenarios for TTlow and TThigh .
Scenarios1 (%) 2 (%) 3 (%) 4 (%) 5 (%) 6 (%) 7 (%) 8 (%)
TTlow 30 30 30 50 50 50 70 70TThigh 60 75 90 60 75 90 75 90
being tied to them in any way—we could have also namedthem, e.g., memory and CPU time) were taken into considerationresulting in nine possible actions ‘‘Increase/Decrease bandwidthby 10%/20%’’, ‘‘Increase/Decrease storage by 10%/20%’’, and ‘‘Donothing’’. Taking storage for example, we divide the range ofdistances for storage St betweenmeasured and provided resourcesinto five parts as depicted in Fig. 7. We choose some reasonablethreshold for every action as follows: If pSt − mSt = −10 thenaction ‘‘Increase Storage by 20%’’ as this already is a violation; ifp−
St−mSt = +50 then action ‘‘Increase Storage by 10%’’ as resourcesare already scarce but not so problematic as in the previous case;if pSt − mSt = +100 then action ‘‘Do nothing’’ as resources areneither very over- nor under-provisioned; if pSt − mSt = +200then action ‘‘Decrease Storage by 10%’’ as now resources are over-provisioned; and we set action ‘‘Decrease Storage by 20%’’ whenwe are over the latest threshold as then resources are extremelyover-provisioned. We choose the values for our initial cases fromthe center of the respective intervals. Ultimately, for the initialcase for the action, e.g., ‘‘Increase Storage by 20%’’ we take thejust mentioned value for storage and the ‘‘Do nothing’’ value forbandwidth. This leads to c = (id, 0, −10, 0, 7.5), and becauseonly the differences between the values matter, it is equivalent to,e.g., c = (id, 200, 190, 7.5, 15.0).
As far as the rule-based approach is concerned, its behavior dif-fers by the set threat thresholds. Thus, we investigate low, mid-dle and high values for TT r
low and TT rhigh (as defined in Section 5.3),
where TT rlow ∈ {30%, 50%, 70%} and TT r
high ∈ {60%, 75%, 90%} forall resources stated above.We combine the TTs to formeight differ-ent scenarios as depicted in Table 4.Weexecute 100 iterationswith500 applications, and set the ‘‘safety slack’’ ϵ = 5% (cf. Listing 1).
Fig. 8 presents the aforementioned performance indicatorsof CBR. The ‘‘No CBR’’ line means that the autonomic manageris turned off, which implies that the configuration of the VMsis left as set at the beginning, i.e., no adaptation actions dueto changing demands are executed. In Fig. 8(a) we see thatup to more than half of the violations can be avoided whenusing α ∈ {0.1, 0.3} instead of no autonomic management.However, fewer SLA violations result in lower resource utilization(cf. Fig. 8(b)), as more resources have to be provided than canactually be utilized. Reconfiguration actions as depicted in Fig. 8(c)lie slightly below or at 50%, except for ‘‘No CBR’’, of course.Another point that can be observed is that after a certain amountof iterations the quality of the recommended actions decreases.This is probably due to the fact that the initial cases get moreand more blurred when more cases are stored into CBR, as allnew cases are being learned and there is no distinction madebetween ‘‘interesting’’ and ‘‘uninteresting’’ cases. Nevertheless,when we relate SLA violations and resource utilization in termsof RAE, all CBR methods are generally better than the defaultmethod, especially for α ∈ {0.3, 0.5} after five iterations. Yet,RAE decreases strictly monotonically for all α. Furthermore, costs– relating violations, utilization and reconfiguration actions – canalso be reduced to half for α ∈ {0.1, 0.3}. However, there is a

482 M. Maurer et al. / Future Generation Computer Systems 29 (2013) 472–487
35%
25%
15%
30%
20%
10%
20
5%0%
2 5#Iterations
"Alpha=0.1" "Alpha=0.3"
"Alpha=0.5" "No CBR"
Vio
latio
ns [%
]
10
85%
80%
75%
70%
65%
55%
50%
45%
60%
202 5
#Iterations
10
Util
izat
ion
[%]
202 5
#Iterations
10
52%
50%
48%
46%
42%
40%
44%Act
ions
[%]
(a) Violations. (b) Utilization. (c) Actions.
202 5
#Iterations
10
75
70
65
60
55
50
45
40
RA
E
202 5 10
Cos
t [C
loud
€]
3500
3000
2500
2000
1500
1000
500#Iterations
250
200
150
100
50
0
300
0 5 10 15 20
Tim
e [m
s]
(d) Resource allocation efficiency. (e) Cost. (f) Average execution time per VM.
Fig. 8. Evaluation of CBR with respect to SLA violations, utilization and energy efficiency.
seemingly exponential increase in the average execution time perVM (cf. Fig. 8(f)) due to higher number of cases stored in the KB.
Summing up, the simulation shows that learning did take place(and cost some time) and that CBR is able to recommend rightactions for many cases, i.e., to correctly handle and interpret themeasurement information that is based on a random distributionnot known to CBR.
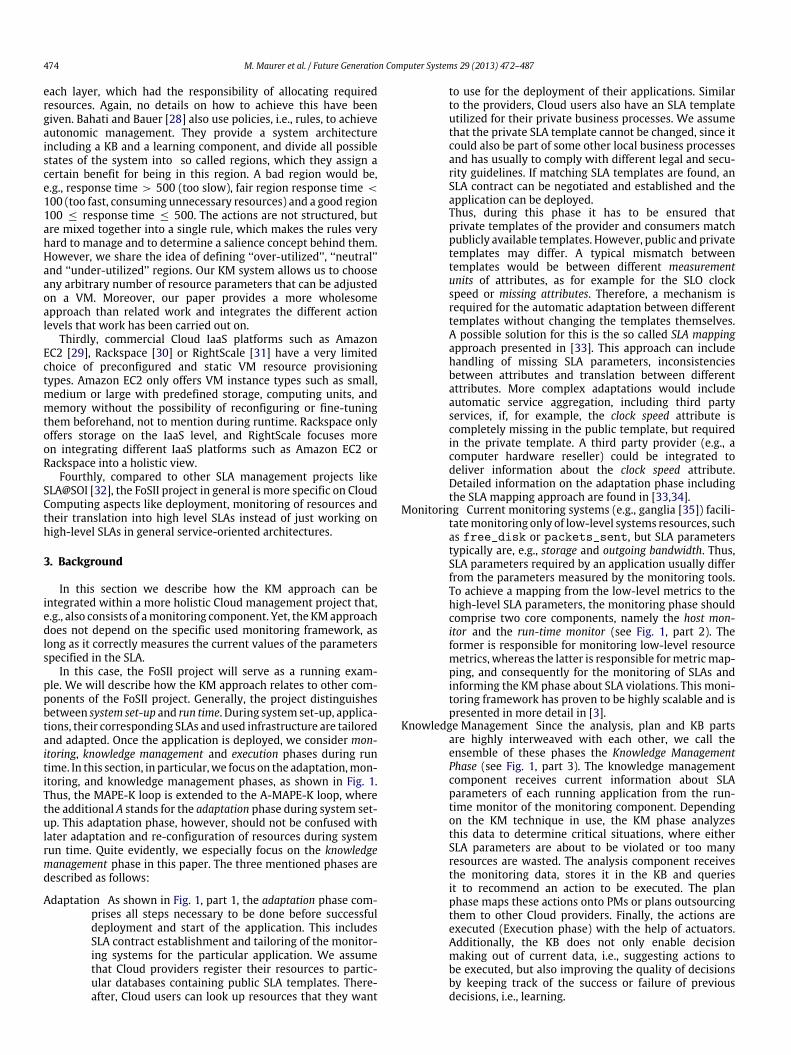
Fig. 9 shows the same evaluation for the rule-based approachevaluating the aforementioned eight scenarios. From Fig. 9(a) welearn that in terms of SLA violations Scenario 1 achieves the bestresult, where only 0.0908% of all possible violations occur, andScenario 8 yields the worst result, with a still very low violationrate of 1.2040%. In general, the higher the values are for TThigh, theworse is the outcome. The best result achieved with CBR was at7.5%. Thus, the rule-based approach achieves an up to 82 timesbetter performance with the right TTs set, and still a six timesbetter performance in the worst case.
Fig. 9(b) shows resource utilization. We see that the combina-tion of high TTlow and high TThigh (Scenario 8) gives the best uti-lization (84.0%), whereas low values for TTlow and TThigh lead tothe worst utilization (62.0% in Scenario 1). Still, compared to CBRwhich scored a maximum of 80.4% and a minimum of 51.8%, therule-based approach generally achieves better results.
The percentage of all executed actions as compared to allpossible actions that could have been executed is shown in Fig. 9(c).One observes that the greater the span between TTlow and TThighis, the fewer actions have to be executed. Most actions (60.8%)are executed for Scenario 7 (span of only 5% between TT values),whereas least actions (5.5%) are executed for Scenario 3 (span of60% between TT values). CBR almost always recommended exactlyone (out of two possible) actions and hardly ever (in about 1% ofthe cases) recommended no action.
As violations are very low in general, the resource allocationefficiency is very similar to the utilization. The best value canbe achieved with Scenario 8 (84.0%), the worst with Scenario 1(62.0%). CBR achieves a RAE of at most 69.7% (α = 0.5 at iteration2), and at least 45.5% (α = 0.1 at iteration 20).
Fig. 8(e) shows the costs for each scenario using Eq. (8). Thebest trade-off between the three terms is achieved by Scenario5 that has medium values for TT r
low and TT rhigh. It has a very low
violation rate of 0.0916%, a quite elaborate utilization of 72.9%,
but achieves this with only 19.8% of actions. Scenario 7 achievesa better violation and utilization rate but at the cost of an actionrate of 60.8%, and consequently has higher costs. The lowest costvalue for CBR is 923.0 Cloud EUR, the highest 2985.3 Cloud EUR.
If the utility of the decision decreases for a certain time frame(as cost increases), the KB could determine the cost summand inEq. (8) that contributes most to this decrease. For any resourcer , if the term is p, then decrease TT r
high. If the term is w, thenincrease TT r
low. Otherwise, if the term is c, then widen the span ofTT r
high and TT rlow, i.e., increase TT
rhigh and decrease TT r
low. We plan toinvestigate this in our future research.
As far as time performance and scalability are concerned,the performance tests are very encouraging. We executed 100iterations from 100 to 3000 VMs. We performed every test twiceand calculated the average execution time as well as the averagetime it took for the simulation engine to handle one VM. As shownin Fig. 9(f) the execution time per VM stays quite constant for upto 1500 VMs, and thus average execution time is about linear. For3000 VMs, it took 647 s/100 = 6.47 s for one iteration to treat allVMs. The high time consumption per VM for 100 VMs in Fig. 9(f)is due to the initialization of the rule knowledge base which takesover-proportionally long for just a small number of VMs and doesnot weigh so much for more VMs.
CBR took 240 s for 50 VMs and 20 iterations. Thus, CBR took240 s/20 = 12 s for one iteration to treat all VMs, which is twiceas long as the rule-based approach takes, which even has 60 timesmore VMs. However, CBR implements learning features, which therule-based approach currently does not, and could be sped up bychoosing only specific cases to be stored in the KB.
Summarizing, the rule-based approach highly outperformsCBR with respect to violations (up to 82 times better results),actions, cost, and time performance. The rule-based approach alsoachieves better ‘‘best case’’ and better ‘‘worst case’’ results forthe remaining performance indicators utilization and resourceallocations efficiency. In more detail, seven out of eight scenarioswere better than the worst CBR value for utilization, whereasonly one scenario was better than the best CBR utilization value.Again, accumulating these results into cost, all rule-based scenariosoutperform CBR by a factor of at least 4 (worst rule-based scenario(236) compared to the best CBR result (923)), which to a largeextent is due to the huge number of violations that the rule-based
M. Maurer et al. / Future Generation Computer Systems 29 (2013) 472–487 483
1.4%
1.2%
1.0%
0.8%
0.6%
0.4%
0.2%
0.0%1 2 3 4 5 6 7 8
Scenario
Vio
latio
ns [%
]
1 2 3 4 5 6 7 8Scenario
Util
izat
ions
[%]
90%
85%
80%
75%
70%
65%
60%
55%
50%1 2 3 4 5 6 7 8
Scenario
80%
60%
40%
20%
0%
Act
ions
[%]
(a) Violations. (b) Utilization. (c) Actions.
1 2 3 4 5 6 7 8
Scenario
85
80
75
70
65
60
55
50
RA
E
1 2 3 4 5 6 7 8
Scenario
240
220
200
180
160
140
120
Cos
t [C
loud
€]
2.5
2
1.5
1
0.5
00 1000 2000 3000
VMs
Tim
e [m
s]
(d) Resource allocation efficiency. (e) Cost. (f) Average execution time per VM.
Fig. 9. Violations, utilization, actions and utility for Scenarios 1–8, execution time for rule-based approach.
approach is able to prevent and the high number of actions it cansave.
Consequently, we consider the rule-based approach as the bet-ter technique to deal with VM reconfiguration in Cloud Computinginfrastructures, and we will focus the remaining part of this articleon a deeper investigation and understanding of the rule-based ap-proach by evaluating it with real world workload. A deeper inves-tigation of synthetic workload also suggests the self-adaptation ofthe TTs from the rule-based approach. A successful self-adaptationhas been presented in [42].
6.4. Applying and evaluating a bioinformatics workflow to the rule-based approach
As detailed in [43,44], bioinformatics workflows have gaineda great need for large-scale data analysis. Due to the fact thatthese scientific workflows are very resource intensive and cantake hours if not days to complete, provisioning them in anenvironment with fixed resources leads to poor performance.On the one hand, the workflow might run out of resources andthus may have to be restarted on a larger system. On the otherhand, too many resources might be provisioned in order notto take risks of a premature abort, which may cause a lot ofresources to be wasted. Thus, Cloud computing infrastructuresoffer a promising way to host these sorts of applications [10].The monitoring data presented in this Section was gathered withthe help of the Cloud monitoring framework Lom2His [3]. UsingLom2His we measured utilized resources of TopHat [45], a typicalbioinformatics workflow application analyzing RNA-Seq data [46],for a duration of about three hours [9].
In the following we briefly describe the bioinformatics work-flow inmore detail. We here consider Next Generation Sequencing(NGS), a recently introduced high-throughput technology for theidentification of nucleotide molecules like RNA or DNA in biomed-ical samples. The output of the sequencing process is a list of bil-lions of character sequences called ‘reads’, each typically holds upto 35–200 letters that represent the individual DNA bases deter-mined. Lately, this technology has also been used to identify and
Fig. 10. Overview of the TopHat aligning approach.
count the abundances of RNA molecules that reflect new gene ac-tivity. We use the approach, called RNA-Seq, as a typical exampleof a scientific workflow application in the field of bioinformatics.
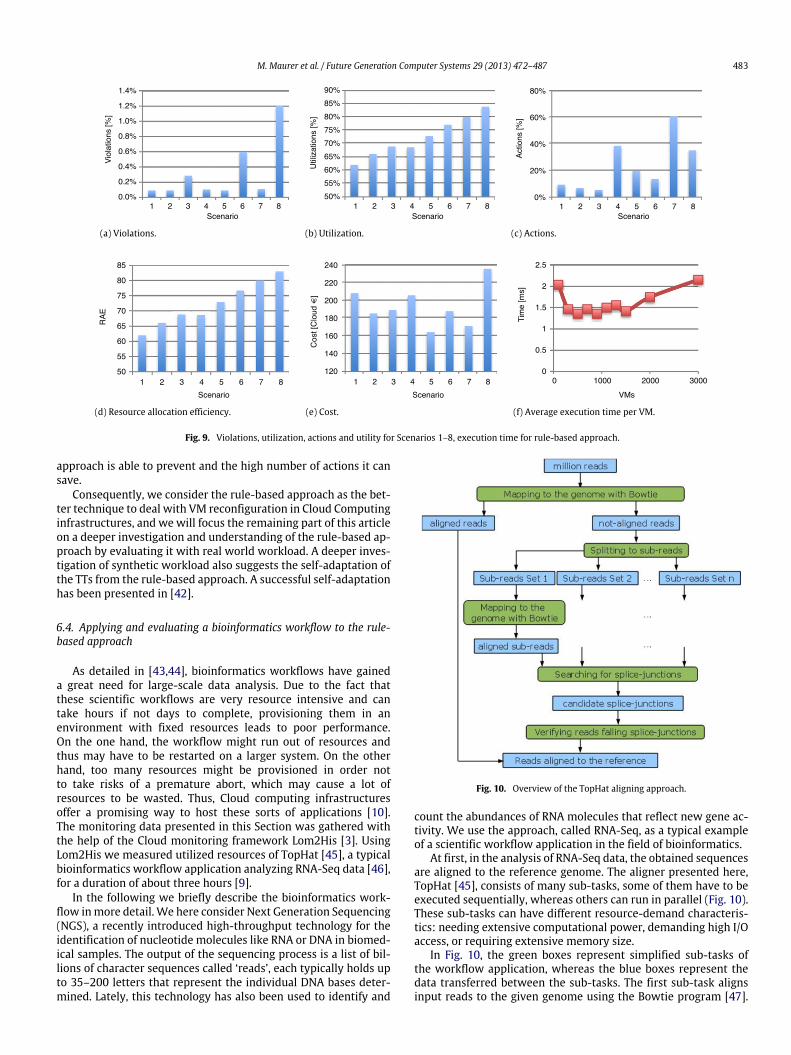
At first, in the analysis of RNA-Seq data, the obtained sequencesare aligned to the reference genome. The aligner presented here,TopHat [45], consists of many sub-tasks, some of them have to beexecuted sequentially, whereas others can run in parallel (Fig. 10).These sub-tasks can have different resource-demand characteris-tics: needing extensive computational power, demanding high I/Oaccess, or requiring extensive memory size.
In Fig. 10, the green boxes represent simplified sub-tasks ofthe workflow application, whereas the blue boxes represent thedata transferred between the sub-tasks. The first sub-task alignsinput reads to the given genome using the Bowtie program [47].

484 M. Maurer et al. / Future Generation Computer Systems 29 (2013) 472–487
3.0%
2.5%
2.0%
1.5%
1.0%
0.5%
0.0%CPU Memory Storage Avg
Scenario 2.1 Scenario 2.2 Scenario 2.3 Scenario 2.4
Scenario 2.8Scenario 2.7Scenario 2.6Scenario 2.5
Vio
latio
ns [%
]
CPU Memory Storage Avg
Scenario 1 Scenario 2.1 Scenario 2.2 Scenario 2.3
Scenario 2.8
Scenario 2.4
Scenario 3Scenario 2.7Scenario 2.6Scenario 2.5
100%
80%
60%
40%
20%
00%
Util
izat
ion
[%]
(a) Violations. (b) Utilization.
CPU Memory Storage Avg
Scenario 1 Scenario 2.1 Scenario 2.2 Scenario 2.3
Scenario 2.8
Scenario 2.4
Scenario 3Scenario 2.7Scenario 2.6Scenario 2.5
35%
30%
25%
20%
15%
10%
5%
0%
Act
ions
[%]
(c) Reconfiguration actions.
Fig. 11. Violations, utilization and reconfiguration actions for ten autonomic management scenarios using bioinformatics workflow.
Table 5TopHat SLA.
Service Level Objective (SLO) name SLO value
CPU power ≥20000MIPSMemory ≥8192 MBStorage ≥19456 MB
Unaligned reads are then divided into shorter sub-sequenceswhich are further aligned to the reference genome in the next sub-task. If sub-sequences coming from the same read were alignedsuccessfully to the genome, that may indicate that this readwas straddling a ‘gap’ in the gene, falling on a so-called splice-junction. After verification of candidate reads falling on splicejunctions, these and the reads that were aligned in the first sub-task are combined to create an output with a comprehensive list oflocalized alignments.
We demonstrate by simulation that the rule-based approachcan guarantee the resource requirements in terms of CPU, memoryand storage for the execution of the workflow in a resource-efficient way.
Therefore, we define the SLA shown in Table 5 for TopHatwith the maximum amount of available resources on the physicalmachine on which we are executing it. The physical machine has aLinux/Ubuntu OS with a Intel Xeon(R) 3 GHz CPU, two cores, 9 GBof memory, and 19 GB of storage. For CPU power, we convert CPUutilization intoMIPS based on the assumption that an Intel Xeon(R)3 GHz processor delivers 10000MIPS for 100% resource utilizationof one core, and linearly degrades with CPU utilization.
In order to validate our approach, we make three simulationcategories,wherewe set up andmanage our VMsdifferently: In thefirst category (Scenario 1) we assume a static configuration witha fixed initial resource configuration of the VMs. Normally, whensetting up such a testbed as described in [9], an initial guess of
possible resource consumption is done based on early monitoringdata. From this data on, we assume quite generous resource limits.The first ten measurements of CPU, memory, and storage lie inthe range of [140, 12500] MIPS, [172, 1154] MB, [15.6, 15.7] GB,respectively. So we initially configured our VM with 15000 MIPS,4096MB, and 17.1 GB, respectively. The second category subsumesseveral scenarios, where we apply our autonomic managementapproach to the initial configuration in the first category. The eightscenarios in this category depend on the chosen TTs. Accordingto Table 4 we define these scenarios as Scenario 2.1, 2.2, . . . , 2.8,respectively. As the third category (Scenario 3), we consider a bestcase scenario, where we assume we have an oracle that predictsthe maximal resource consumption that we statically set our VMconfiguration to. Moreover, according to the first measurementswe decide to enforce a minimum of 1 MIPS CPU, 768 MB memory,and 1 GB storage.
As depicted in Fig. 11(a)–(c) one sees violations, utilization, aswell as the number of reconfiguration actions, respectively, forevery parameter (together with an average value) in the differentscenarios. Generally, the bars are naturally ordered beginning fromScenario 1, over Scenarios 2.1, . . . , 2.8, ending with Scenario 3.The number of violations in Scenario 1 reach 41.7% for CPU andmemory, and 49.4% for storage, which leads to an average of44.3%. (For better visibility, these results have been excluded fromFig. 11(a).) Thus, we experience violations in almost half of thecases. This is especially crucial for parametersmemory and storage,where program execution could fail, if it runs out of memory orstorage, whereas for a violation of the parameter CPU, we would‘‘only’’ delay the successful termination of the workflow.
With Scenarios 2.* we can reduce the SLA violations to aminimum. We completely avoid violations for storage in all sub-scenarios, as well as for memory in all but one sub-scenarios.Also CPU violations can be reduced to 0.6% for sub-scenarios
M. Maurer et al. / Future Generation Computer Systems 29 (2013) 472–487 485
185
180
175
170
165
160
155
150
145
140
135
Scenario
2.1
Scenario
2.2
Scenario
2.3
Scenario
2.4
Scenario
2.5
Scenario
2.6
Scenario
2.7
Scenario
2.8
Scenario
3
Cos
t [C
loud
€]
(a) Cost.
Scenario
2.1
Scenario
1
Scenario
2.2
Scenario
2.3
Scenario
2.4
Scenario
2.5
Scenario
2.6
Scenario
2.7
Scenario
2.8
Scenario
3
90
85
80
75
70
65
60
55
50
45
40
RA
E
(b) Resource allocation efficiency.
Fig. 12. Resource allocation efficiency and cost for ten autonomic management scenarios using bioinformatics workflow.
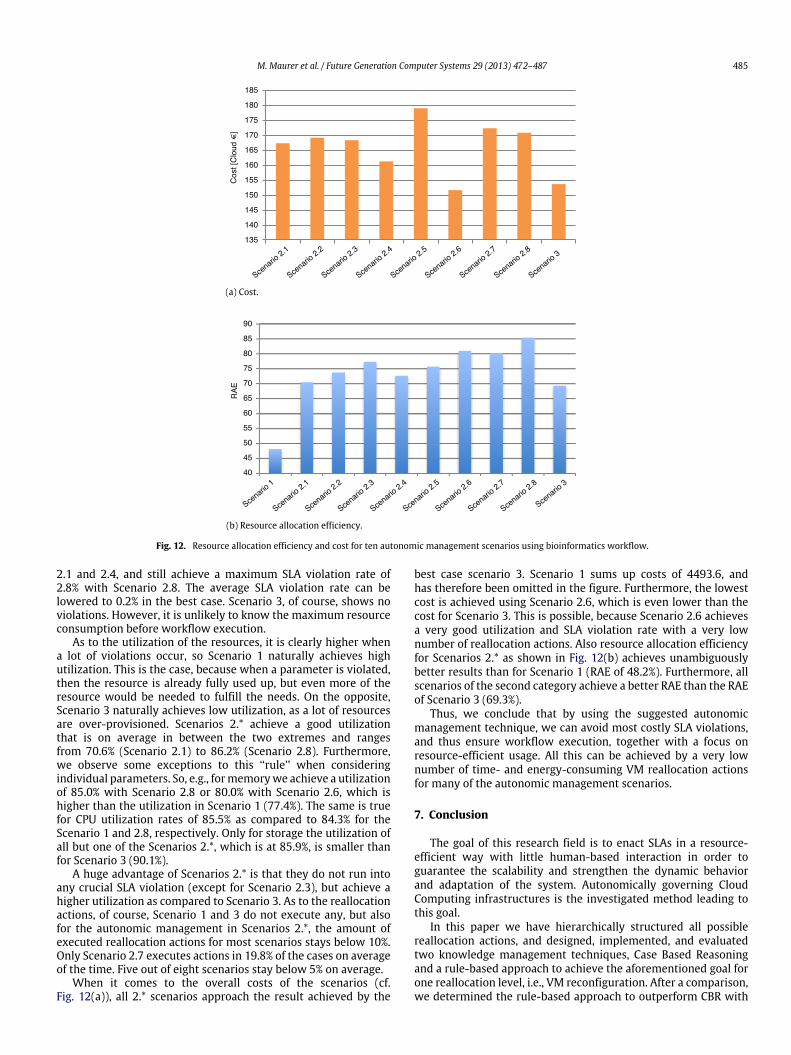
2.1 and 2.4, and still achieve a maximum SLA violation rate of2.8% with Scenario 2.8. The average SLA violation rate can belowered to 0.2% in the best case. Scenario 3, of course, shows noviolations. However, it is unlikely to know the maximum resourceconsumption before workflow execution.
As to the utilization of the resources, it is clearly higher whena lot of violations occur, so Scenario 1 naturally achieves highutilization. This is the case, because when a parameter is violated,then the resource is already fully used up, but even more of theresource would be needed to fulfill the needs. On the opposite,Scenario 3 naturally achieves low utilization, as a lot of resourcesare over-provisioned. Scenarios 2.* achieve a good utilizationthat is on average in between the two extremes and rangesfrom 70.6% (Scenario 2.1) to 86.2% (Scenario 2.8). Furthermore,we observe some exceptions to this ‘‘rule’’ when consideringindividual parameters. So, e.g., formemorywe achieve a utilizationof 85.0% with Scenario 2.8 or 80.0% with Scenario 2.6, which ishigher than the utilization in Scenario 1 (77.4%). The same is truefor CPU utilization rates of 85.5% as compared to 84.3% for theScenario 1 and 2.8, respectively. Only for storage the utilization ofall but one of the Scenarios 2.*, which is at 85.9%, is smaller thanfor Scenario 3 (90.1%).
A huge advantage of Scenarios 2.* is that they do not run intoany crucial SLA violation (except for Scenario 2.3), but achieve ahigher utilization as compared to Scenario 3. As to the reallocationactions, of course, Scenario 1 and 3 do not execute any, but alsofor the autonomic management in Scenarios 2.*, the amount ofexecuted reallocation actions for most scenarios stays below 10%.Only Scenario 2.7 executes actions in 19.8% of the cases on averageof the time. Five out of eight scenarios stay below 5% on average.
When it comes to the overall costs of the scenarios (cf.Fig. 12(a)), all 2.* scenarios approach the result achieved by the
best case scenario 3. Scenario 1 sums up costs of 4493.6, andhas therefore been omitted in the figure. Furthermore, the lowestcost is achieved using Scenario 2.6, which is even lower than thecost for Scenario 3. This is possible, because Scenario 2.6 achievesa very good utilization and SLA violation rate with a very lownumber of reallocation actions. Also resource allocation efficiencyfor Scenarios 2.* as shown in Fig. 12(b) achieves unambiguouslybetter results than for Scenario 1 (RAE of 48.2%). Furthermore, allscenarios of the second category achieve a better RAE than the RAEof Scenario 3 (69.3%).
Thus, we conclude that by using the suggested autonomicmanagement technique, we can avoid most costly SLA violations,and thus ensure workflow execution, together with a focus onresource-efficient usage. All this can be achieved by a very lownumber of time- and energy-consuming VM reallocation actionsfor many of the autonomic management scenarios.
7. Conclusion
The goal of this research field is to enact SLAs in a resource-efficient way with little human-based interaction in order toguarantee the scalability and strengthen the dynamic behaviorand adaptation of the system. Autonomically governing CloudComputing infrastructures is the investigated method leading tothis goal.
In this paper we have hierarchically structured all possiblereallocation actions, and designed, implemented, and evaluatedtwo knowledge management techniques, Case Based Reasoningand a rule-based approach to achieve the aforementioned goal forone reallocation level, i.e., VM reconfiguration. After a comparison,we determined the rule-based approach to outperform CBR with
486 M. Maurer et al. / Future Generation Computer Systems 29 (2013) 472–487
respect to violations and utilization, but also to time performance.Furthermore, we applied the rule-based approach to a real-world use case evaluating a scientific workflow from the areaof bioinformatics. We showed by simulation that the rule-basedapproach can effectively guarantee the execution of a workloadwith unpredictably large resource consumptions.
The next step will be to move from simulation to a real Cloudtestbed. Furthermore, the presented methods still involve someuser-interaction for parameter tuning. Thus, it will be of great in-terest to autonomically determine crucial parameters of the pre-sented methods and to adapt them based on current performance.
Another related field is the autonomic generation of IaaS SLAout of SaaS or PaaS SLAs. Theoretically, SaaS or PaaS applicationscan be perfectly set up on top of IaaS platforms. The crucial point isto extract an SLA for the IaaS parameters like bandwidth, storage,CPU power and memory that fit to SaaS/PaaS parameters likeresponse time. It is obvious that response time directly relates tothe mentioned IaaS parameters and user interaction. It is not thatobvious, however, how this translation should take place. E.g., doesthe SLO ‘‘response time < 2 s’’ translate into ‘‘memory > 512MB’’and ‘‘CPU power > 8000 MIPS’’ or rather ‘‘memory > 4096 MB’’and ‘‘CPU power > 1000 MIPS’’? Once the autonomic governanceof IaaS infrastructures is up and running, the autonomic translationof these SLAs will probably leverage the usage and usability of IaaSeven more.
Acknowledgments
The work described in this paper is supported by the ViennaScience and Technology Fund (WWTF) under grant agreementICT08-018 Foundations of Self-Governing ICT Infrastructures(FoSII) and by COST-Action IC0804 on Energy Efficiency inLarge Scale Distributed Systems. We also want to thank PawełP.Łabaj and David P. Kreil (Boku University Vienna) for providingus with the bioinformatics workflow application and VincentC. Emeakaroha (TU Vienna) for providing monitoring data on it.
References
[1] R. Buyya, C.S. Yeo, S. Venugopal, J. Broberg, I. Brandic, Cloud computing andemerging it platforms: vision, hype, and reality for delivering computing asthe 5th utility, Future Generation Computer Systems 25 (6) (2009) 599–616.http://dx.doi.org/10.1016/j.future.2008.12.001.
[2] (FOSII)—Foundations of self-governing ICT infrastructures, March, 2012.http://www.infosys.tuwien.ac.at/linksites/FOSII.
[3] V.C. Emeakaroha, I. Brandic, M. Maurer, S. Dustdar, Low level metrics to highlevel SLAs-LoM2HiS framework: bridging the gap betweenmonitoredmetricsand SLA parameters in cloud environments, in: The 2010 High PerformanceComputing and Simulation Conference in Conjunction with IWCMC 2010,Caen, France, 2010.
[4] I. Brandic, Towards self-manageable cloud services, in: S.I. Ahamed, et al.(Eds.), COMPSAC (2), IEEE Computer Society, 2009, pp. 128–133.
[5] B. Jacob, R. Lanyon-Hogg, D.K. Nadgir, A.F. Yassin, A Practical Guide to the IBMAutonomic Computing Toolkit, IBM Redbooks, 2004.
[6] M.C. Huebscher, J.A. McCann, A survey of autonomic computing—degrees,models, and applications, ACM Computing Surveys 40 (3) (2008) 1–28.http://doi.acm.org/10.1145/1380584.1380585.
[7] M. Maurer, I. Brandic, R. Sakellariou, Simulating autonomic SLA enactmentin clouds using case based reasoning, in: ServiceWave 2010, Ghent, Belgium,2010.
[8] M. Maurer, I. Brandic, R. Sakellariou, Enacting SLAs in clouds using rules, in:Euro-Par 2011, Bordeaux, France, 2011.
[9] V.C. Emeakaroha, P. Labaj, M. Maurer, I. Brandic, D.P. Kreil, Optimizing bioin-formaticsworkflows for data analysis using cloudmanagement techniques, in:The 6thWorkshop onWorkflows in Support of Large-Scale Science,WORKS11,2011.
[10] N. Merchant, J. Hartman, S. Lowry, A. Lenards, D. Lowenthal, E. Skidmore,Leveraging cloud infrastructure for life science research laboratories: ageneralized view, in: International Workshop on Cloud Computing atOOPSLA09, Orlando, USA, 2009.
[11] B. Khargharia, S. Hariri, M.S. Yousif, Autonomic power and performancemanagement for computing systems, Cluster Computing 11 (2) (2008)167–181.
[12] V. Petrucci, O. Loques, D. Mossé, A dynamic optimization model for powerand performance management of virtualized clusters, e-Energy’10, ACM,New York, NY, USA, 2010, pp. 225–233. http://doi.acm.org/10.1145/1791314.1791350.
[13] M. Bichler, T. Setzer, B. Speitkamp, Capacity planning for virtualized servers,Presented at Workshop on Information Technologies and Systems, WITS,Milwaukee, Wisconsin, USA, 2006.
[14] G. Khanna, K. Beaty, G. Kar, A. Kochut, Application performance managementin virtualized server environments, in: Network Operations and ManagementSymposium, 2006. NOMS 2006, 10th IEEE/IFIP, pp. 373–381, 2006. http://dx.doi.org/10.1109/NOMS.2006.1687567.
[15] T. Wood, P. Shenoy, A. Venkataramani, M. Yousif, Sandpiper: black-box andgray-box resource management for virtual machines, Computer Networks 53(17) (2009) 2923–2938. http://dx.doi.org/10.1016/j.comnet.2009.04.014.
[16] J. Rao, X. Bu, C.-Z. Xu, L.Wang, G. Yin, Vconf: a reinforcement learning approachto virtual machines auto-configuration, ICAC’09, ACM, New York, NY, USA,2009, pp. 137–146. URL: http://doi.acm.org/10.1145/1555228.1555263.
[17] Y. Yazir, C. Matthews, R. Farahbod, S. Neville, A. Guitouni, S. Ganti, Y.Coady, Dynamic resource allocation in computing clouds using distributedmultiple criteria decision analysis, in: Cloud Computing, CLOUD, 2010 IEEE3rd International Conference on, pp. 91–98, 2010. http://dx.doi.org/10.1109/CLOUD.2010.66.
[18] X.Meng, C. Isci, J. Kephart, L. Zhang, E. Bouillet, D. Pendarakis, Efficient resourceprovisioning in compute clouds via VMmultiplexing, in: Proceeding of the 7thInternational Conference on Autonomic Computing, ICAC’10, ACM, New York,NY, USA, 2010, pp. 11–20. URL: http://doi.acm.org/10.1145/1809049.1809052.
[19] M. Mazzucco, D. Dyachuk, R. Deters, Maximizing cloud providers revenuesvia energy aware allocation policies, in: CLOUD 2010, pp. 131–138, 2010.http://dx.doi.org/10.1109/CLOUD.2010.68.
[20] M. Hoyer, K. Schröder, W. Nebel, Statistical static capacity managementin virtualized data centers supporting fine grained QoS specification,in: Proceedings of the 1st International Conference on Energy-EfficientComputing and Networking, e-Energy’10, ACM, New York, NY, USA, 2010,pp. 51–60. URL: http://doi.acm.org/10.1145/1791314.1791322.
[21] D. Borgetto, H. Casanova, G.D. Costa, J.-M. Pierson, Energy-aware serviceallocation, Future Generation Computer Systems 28 (5) (2012) 769–779. http://dx.doi.org/10.1016/j.future.2011.04.018. URL: http://www.sciencedirect.com/science/article/pii/S0167739X11000690.
[22] M. Stillwell, D. Schanzenbach, F. Vivien, H. Casanova, Resource allocationalgorithms for virtualized service hosting platforms, Journal of Parallel andDistributed Computing 70 (9) (2010) 962–974. http://dx.doi.org/10.1016/j.jpdc.2010.05.006. URL: http://www.sciencedirect.com/science/article/pii/S0743731510000997.
[23] A. Nathani, S. Chaudhary, G. Somani, Policy based resource allocation in IaaScloud, Future Generation Computer Systems 28 (1) (2012) 94–103. http://dx.doi.org/10.1016/j.future.2011.05.016. URL: http://www.sciencedirect.com/science/article/pii/S0167739X11000987.
[24] S. Islam, J. Keung, K. Lee, A. Liu, Empirical prediction models for adaptiveresource provisioning in the cloud, Future Generation Computer Systems28 (1) (2012) 155–162. http://dx.doi.org/10.1016/j.future.2011.05.027. URL:http://www.sciencedirect.com/science/article/pii/S0167739X11001129.
[25] G. Kecskemeti, G. Terstyanszky, P. Kacsuk, Z. Neméth, An approach for virtualappliance distribution for service deployment, Future Generation ComputerSystems 27 (2011) 280–289. http://dx.doi.org/10.1016/j.future.2010.09.009.
[26] A. Paschke, M. Bichler, Knowledge representation concepts for automated SLAmanagement, Decision Support Systems 46 (1) (2008) 187–205.
[27] G. Koumoutsos, S. Denazis, K. Thramboulidis, SLA e-negotiations, enforcementand management in an autonomic environment, in: Modelling AutonomicCommunications Environments, 2008, pp. 120–125.
[28] R.M. Bahati, M.A. Bauer, Adapting to run-time changes in policies drivingautonomic management, in: ICAS’08: Proceedings of the 4th Int. Conf. onAutonomic and Autonomous Systems, IEEE Computer Society, Washington,DC, USA, 2008, http://dx.doi.org/10.1109/ICAS.2008.47.
[29] Amazon elastic compute cloud (Amazon EC2), 2010. http://aws.amazon.com/ec2/.
[30] Rackspace cloud, March, 2012. http://www.rackspace.com/cloud/.[31] Rightscale, 2012. http://www.rightscale.com/.[32] SLA@SOI, March, 2012. http://sla-at-soi.eu/.[33] M. Maurer, V.C. Emeakaroha, I. Brandic, J. Altmann, Cost-benefit analysis of
an SLA mapping approach for defining standardized cloud computing goods,Future Generation Computer Systems 28 (1) (2012) 39–47. http://dx.doi.org/10.1016/j.future.2011.05.023. URL: http://www.sciencedirect.com/science/article/pii/S0167739X11001051.
[34] I. Breskovic, M. Maurer, V.C. Emeakaroha, I. Brandic, S. Dustdar, Cost-efficientutilization of public sla templates in autonomic cloud markets, in: 4thIEEE International Conference on Utility and Cloud Computing, UCC 2011,Melbourne, Australia, 2011.
[35] M.L. Massie, B.N. Chun, D.E. Culler, The ganglia distributedmonitoring system:design, implementation and experience, Parallel Computing 30 (7) (2004)817–840.
[36] L. Massoulie, J. Roberts, Bandwidth sharing: objectives and algorithms,in: INFOCOM’99. Eighteenth Annual Joint Conference of the IEEE Computerand Communications Societies. Proceedings, vol. 3, IEEE, 1999, pp. 1395–1403.http://dx.doi.org/10.1109/INFCOM.1999.752159.
M. Maurer et al. / Future Generation Computer Systems 29 (2013) 472–487 487
[37] R.M. Karp, Reducibility among combinatorial problems, in: R.E. Miller,J.W. Thatcher (Eds.), Complexity of Computer Computations: Proc. of aSymp. on the Complexity of Computer Computations, Plenum Press, 1972,pp. 85–103.
[38] B. Rochwerger, et al. The Reservoir model and architecture for open federatedcloud computing, IBM Journal of Research and Development, 53 (4) (2009).URL: http://www.research.ibm.com/journal/rd/534/rochwerger.pdf.
[39] A. Aamodt, E. Plaza, Case-based reasoning: foundational issues, methodologi-cal variations, and system approaches, AI Communications 7 (1994) 39–59.
[40] M. Hefke, A framework for the successful introduction of KM using CBR andsemantic web technologies, Journal of Universal Computer Science 10 (6)(2004).
[41] Drools, 2012. http://www.drools.org.[42] M. Maurer, I. Brandic, R. Sakellariou, Self-adaptive and resource-efficient
SLA enactment for cloud computing infrastructures, in: 5th InternationalConference on Cloud Computing, IEEE Cloud 2012, Honolulu, HI, USA, 2012.
[43] P. Romano, Automation of in-silico data analysis processes through workflowmanagement systems, Briefings in Bioinformatics 9 (1) (2007) 57–68.
[44] D. Smedley,M.A. Swertz, K.Wolstencroft, G. Proctor,M. Zouberakis, J. Bard, J.M.Hancock, P. Schofield, Solutions for data integration in functional genomics:a critical assessment and case study, Briefings in Bioinformatics 9 (6) (2008)532–544.
[45] C. Trapnell, L. Pachter, S.L. Salzberg, Tophat: discovering splice junctions withRNA-Seq, Bioinformatics 25 (9) (2009) 1105–1111. http://dx.doi.org/10.1093/bioinformatics/btp120.
[46] P.P. Łabaj, G.G. Leparc, B.E. Linggi, L.M. Markillie, H.S. Wiley, D.P. Kreil,Characterization and improvement of RNA-Seq precision in quantitativetranscript expression profiling, Bioinformatics 27 (13) (2011) i383–i391.http://dx.doi.org/10.1093/bioinformatics/btr247.
[47] B. Langmead, C. Trapnell, M. Pop, S. Salzberg, Ultrafast and memory-efficientalignment of short DNA sequences to the human genome, Genome Biology 10(3) (2009) R25.
MichaelMaurer is currentlyworking as a project assistantat the Distributed System Group, Information SystemsInstitute, Vienna University of Technology (TU Wien). Hestudied the diploma program Applied Mathematics witha focus on Computer Science (first M.Sc.) and the master’sprogramComputational Intelligence (secondM.Sc.),whichhe finished both with distinction in November 2007 andApril 2009 respectively. Furthermore, he studied at theCity College of New York in New York USA during thewinter term 2008. He has been working on the FoSII(Foundations of Self-governing ICT Infrastructures) project
funded by the Vienna Science and Technology Fund (WWTF) since 2009. Hisresearch areas of interest include Cloud Computing, Autonomic Computing, ServiceLevel Agreements, and Knowledge Databases. He is especially interested in theautonomic governing of Cloud Computing infrastructures.
Ivona Brandic is Assistant Professor at the DistributedSystems Group, Information Systems Institute, ViennaUniversity of Technology (TU Wien). Prior to that, shewas Assistant Professor at the Department of ScientificComputing, Vienna University. She received her Ph.D.degree from Vienna University of Technology in 2007.From 2003 to 2007 she participated in the specialresearch project AURORA (AdvancedModels, Applicationsand Software Systems for High Performance Computing)and the European Union’s GEMSS (Grid-Enabled MedicalSimulation Services) project. She is involved in the
European Union’s SCube project and she is leading the Austrian national FoSII(Foundations of Self-governing ICT Infrastructures) project funded by the ViennaScience and Technology Fund (WWTF). She is aManagement Committeemember ofthe European Commission’s COST Action on Energy Efficient Large Scale DistributedSystems. From June to August 2008 she was visiting researcher at the Universityof Melbourne. Her interests comprise SLA and QoS management, service-orientedarchitectures, autonomic computing, workflow management, and large scaledistributed systems (Cloud, Grid, Cluster, etc.).
Rizos Sakellariou is a Senior Lecturer in the Schoolof Computer Science of the University of Manchester,where he teaches and leads a Research Laboratory withresearch interests in the wide area of High-Performance,Parallel and Distributed Computing. He has carriedout research focusing primarily on issues related toparallelism and resource sharing, on a wide variety oftopics (e.g., parallelizing compilers, performancemodelingand prediction, multithreading, load balancing, workloadand task scheduling, distributed query processing, gridinformation systems, service level agreements, adaptive
and autonomic computing) and with a large number of collaborators. Currently,he is particularly interested in problems related to resource management andscheduling on any High-Performance and/or Parallel Computing environment(from multi-/many-core to grids and clouds), adaptive and autonomic computing,SLA-based and cloud computing.