adaptive user profiles for enterprise information …adaptive user profiles for enterprise...
TRANSCRIPT

Adaptive User Profiles for Enterprise Information Access♦ Elke Michlmayr1, Steve Cayzer, Paul Shabajee Digital Media Systems Laboratory HP Laboratories Bristol HPL-2007-72 May 2, 2007* user profiles, del.icio.us, tagging, folksonomy, web2.0, semantic web, information access, enterprise information management
A major challenge for users of enterprise information is finding theinformation they want, presented in a way that makes sense to them. Inthis paper we tackle this problem by creating adaptive user profiles fromimplicit behaviour. In traditional approaches to information filtering, the user has to explicitly create his or her profile, and manually keep theprofile up to date. Taking advantage of the popularity of collaborativetagging systems, we use the recorded tagging behaviour to construct animplicit, yet realistic and dynamic user profile. We present and evaluatealgorithms for creating such profiles, characterizing their behaviourthrough statistical analysis. In addition, we present a visualisation toolwhich was used in a small scale user study to provide insight as to the effectiveness of our approach. Finally, we show how the profiles can beleveraged to enable personalised access to enterprise data sources.
* Internal Accession Date Only ♦ WWW2007 16th International World Wide Web Conference, 8-12 May 2007, Banff, Canada 1Women’s Postgraduate College for Internet Technologies (WIT), Vienna University of Technology, Vienna, Austria Approved for External Publication © Copyright 2007 Hewlett-Packard Development Company, L.P.

Adaptive User Profiles for Enterprise InformationAccess
Elke MichlmayrWomen’s Postgraduate Collegefor Internet Technologies (WIT),Vienna University of Technology,
Vienna, [email protected]
Steve CayzerHewlett-Packard Laboratories
Filton Road, Stoke GiffordBristol BS34 8QZUnited Kingdom
Paul ShabajeeHewlett-Packard Laboratories
Filton Road, Stoke GiffordBristol BS34 8QZUnited Kingdom
ABSTRACTA major challenge for users of enterprise information is finding the information they want, presented in a way that makes sense to them. In this paper we tackle this problem by creating adaptive user profiles from implicit behaviour. In traditional approaches to information filtering, the user has to explicitly create his or her profile, and manually keep the profile up to date. Taking advantage of the popularity of collaborative tagging systems, we use the recorded tagging behaviour to construct an implicit, yet realistic and dynamic user profile. We present and evaluate algorithms for creating such profiles,characterizing their behaviour through statistical analysis. Inaddition, we present a visualisation tool which was used in a small scale user study to provide insight as to the effectiveness of our approach. Finally, we show how the profiles can be leveraged to enable personalised access to enterprise data sources.
Categories and Subject DescriptorsH.3.3 [Information Storage and Retrieval]: Information Search and Retrieval
Keywordstagging user profiles dynamics information filteringvisualisation hci
1. INTRODUCTIONThis paper is about dynamic user profiles and their role in personalizing access to enterprise information sources. Of course, manually created user profiles tend to go stale rather quickly. We prefer to create profiles from observing user behaviour on oft-used systems, like social bookmarking services such as del.icio.us1. These systems provide interfaces for annotating bookmarks with free-text keywords. Their simplicity and their immediate usefulness for improved rediscovery of information have attracted a high number of users. Since many users stick with the same bookmark collection for years, these data contain fine-grained information about a user’s changing interests over time. All users’ annotated bookmarks are per default publicly accessible. Hence, an immense amount of metadata is available. Thiscollaboratively created data provides a valuable resource. Aggregations of it are provided to the user community.This paper describes an innovative approach to utilizing such data to create user profiles that can in turn be used for enterprise information access. Unlike many other profilelearning mechanisms, which rely on relevance feed-back from
1 http://del.icio.us/
the user, our method does not require any additional user input. Moreover, since tagging data is time-based, it allows us to create user profiles that dynamically adapt to drifts in users’interests. The profile we extract represents the most important parts of a users’ behaviour (that is, some data clustering is performed). Both persistent long-term interests and transient short-term interests co-exist in the profile. We also show how the user profile can be used to guide the user’s navigation, that is, to provide the user with personalized access to information resources (in our case the HP Labs Technical Report archive).This paper is organized as follows. In Section 2 we discussvarious possibilities for creating a user profile out of a tagcollection. This provides the design rationale for the Add-ATagalgorithm, which is formally defined in Section 3 and statistically evaluated in section 4. Section 5 presents user profile visualisation methods together with user feedback (section 6) about them. The emphasis is put on the visualisingthe profile’s changes over time. Section 7 shows how users can browse information resources through an representation of the user profile. Finally, Section 8 gives an overview of related work and Section 9 concludes.
2. User Profile CreationWe take a user-centric perspective, focusing on those tags which have been employed by a single user. We treat the tagging data as a continuous stream of information about a user’s interests which can be used for creating a rich user profile.Aggregated information about a user’s bookmark collection is often represented as a tag cloud, in which all tags a user has employed so far are listed alphabetically and the font size of a tag is set according to how often it has been used so far. Our claim is that tag clouds fail to represent two important properties of a user’s bookmark collection. Firstly, they do not represent the relationships between the tags, which can be derived using co-occurrence techniques. Secondly, they do not consider that tagging data is time-based in their weighting of the relative importance of a tag.Our aim is to learn user profiles from tagging data that include those two properties. We focus not only on which tags have been used, but rather on which tags have been used in combination. If a user annotates a certain bookmark with two tags, there is some kind of semantic relationship between them. The more often two tags are used in combination, the more intense this relationship is. This is represented by a graph with labeled nodes and undirected weighted edges in which nodes correspond to tags and edges correspond to the relationship between tags. Each time a new tag is used, a new node for this tag is added to the graph. Each time a new combination of tags is used, a new weighted edge between the

corresponding nodes is created in the graph. If two tags co-occur again, the weight for the corresponding edge is increased.The data available for profile construction is the following. Consider a user’s bookmark collection consisting of a user defined number of bookmarks. Each bookmark in the collection is composed of a title, a description, a URL, a date, and a set of tags. For creating the profile, we focus on the tags and their temporal ordering by increasing date. In this section we present three different methods for profile construction. Section 2.1 illustrates the naive approach, Section 2.2 the co-occurrence approach, and Section 2.3 the adaptive approach. Examples are used to illustrate the approaches.The sample data used for the examples is shown in Figure 1.
Fig. 1: Sample data. A user stores a collection of 15 bookmarks. These bookmarks are annotated with the tags
shown as space-separated lists. The lists are ordered according to the time the corresponding bookmarks were
added to the bookmark collection. The oldest one is shown first (line 1). Note that this is a very small data sample, for
explanatory purposes. The entire bookmark collection for this user contains many more bookmarks.
Table 1: List of tags ranked by their number of occurrence
2.1 Naive approachTo construct a user profile out of this data, the task is to aggregate it in such a way that the interests of the user are reflected according to their intensity. The more often a certain tag is used, the higher the interest of the user in the corresponding topic. Hence, the most simple method for creating aggregated data for a user’s bookmark collection is to count the occurrence of tags. The result of this computation is a list of tags which is ranked according to tag popularity. For the sample data (see Figure 1), the ranked tag list is shown in Table 1. It reveals that most tags have been used only once, and that there are only a few tags which were used often. The user profile can then be created by selecting the top k most
popular tags from the ranked list. If we select the top 3 tags, for example, the resulting user profile consists of the tags: web ai teaching.The benefit of this method is that it is very simple, and hence fast. However, it has some drawbacks. One major problem is that those tags which are most often used tend to be not very specific (e.g., the tag web is a very general one). Moreover,the resulting profile consists of a set of tags. Although the tagging data includes information about the relationships between those tags, these relationships are not included in the user profile. The co-occurrence approach presented in the next section tackles both these drawbacks.
2.2 Co-occurrence approachThe resulting profile is more specific if we focus not only onwhich tags have been used, but rather on which tags have been used in combination. This can be achieved by relying on the co-occurrence technique known from Social Network Analysis (Wasserman & Faust 1994). If two tags are used in combination (co-occur) by a certain user for annotating a certain bookmark, there is some kind of semantic relationship between them. The more often two tags are used in combination, the more intense this relationship is. This is represented by a graph with labeled nodes and undirected weighted edges in which nodes correspond to tags and edges correspond to the relationship between tags. Each time a new tag is used, a new node for this tag is added to the graph. Each time a new combination of tags is used, a new edge with weight 1 between the corresponding nodes is created in the graph. If two tags co-occur again, the weight for the corresponding edge is increased by 1.The graph is created by parsing the tags for all items in thebookmark collection and applying the technique describedabove. In the second step, a user profile is derived from theresulting graph by selecting the top k edges with the highestweights and their incident nodes. Figure 2 shows the resultinggraph when applying the co-occurrence approach to the sample data. A ranked list of the weights of the resulting graph’s edges for the sample data is shown in Table 2. Selecting the top 3 edges and their incident nodes for the user profile returns a graph with 5 nodes and the following edges:ai-teaching tools-web geo-web.
Fig. 2: Co-occurrence network for the sample data. Two nodes are linked with an edge if the corresponding tags have been
used in combination for annotating a bookmark. Edge weights are not shown. Note that although the amount of sample data
is rather small, the resulting network is quite big.

Co-occurrence techniques have been employed for diversepurposes. First and foremost, the folksonomy providers rely on it for computing related tags. Moreover, co-occurrence is also used in knowledge discovery from databases (Chen & Lynch 1992), for extracting light-weight ontologies from tagging data (Mika 2005), or for tag recommendation (Byde et al 2007; Xu et al 2006). The novelty of our approach is that we use co-occurrence at a smaller scale: for one bookmark collection, only. The impact of this is that the relationships between the tags are not the result of a community-driven process, but entirely created by one user instead. Hence, the relationships between the tags might not make sense to anyone except to the user who created them. However, in the case of user profile creation this is acceptable and even desirable, because for this task we need to find out about how the interests of a user are connected to each other, no matter how unorthodox these connections might be. One drawback of the co-occurrence approach is that it does not include bookmarks that are annotated with a single tag. In order to overcome this issue, it would be necessary to combine it with the naive approach. The result would be a graph with weighted nodes and weighted edges. However, we decided against a combination of approaches, because the average percentage of bookmarks annotated with only one tag by our user population (Section 4.1) is 8%. This can serve as an indicator that the average percentage of bookmarks annotated with only one tag on del.icio.us is small. Therefore, we accept the loss of these data in favour of a simpler method.Another drawback of this approach is that the age of bookmarks and their temporal ordering is not considered. This issue is addressed by the adaptive approach presented in the next section.
Table 2: Top 4 tag combinations ranked by their number ofoccurrence. Note that only those combinations with weights
higher than 1 are shown.
2.3 Adaptive approachSince social bookmarking systems have been around for quite a while now, many of their users manage a rather big bookmark collection which they continuously have been adding items to for the time span of several months or even years. In the test set described in Section 4.1, the average lifetime of the bookmark collections is 607.7 days. Hence, the age information of the tagging data is important. It makes a difference if a user has used a certain tag and, therefore, specified a certain interest, one day or one year ago. In the co-occurrence approach, this information is not considered. To include the age of the bookmarks in the user profile we extend the co-occurrence approach with the evaporation technique known from ant algorithms (Dorigo & Caro 1999).Evaporation is a simple method to add time-based information to the weights of the edges in the graph: Each time the profile graph is updated with tags from a newly added bookmark, the weights of the edges that already exist in the graph are decreased slightly by removing a small percentage of the current value of the weight. Obviously, when creating the profile graph for the adaptive approach by parsing the tags for all items in the bookmark collection, it is necessary to start
parsing from the oldest item and to process the items in the same temporal order as they were added to the bookmark collection. The nodes and edges in the resulting graph are the same as in the co-occurrence approach, but the weights of the edges are different. Since the user profile is created by extracting the top k edges with the highest weights and their incident nodes are from the profile graph, the resulting user profile will be different as well. Applying the adaptive approach to the sample data apparently returns the same profile graph as before ( Figure 2). However the weights of the links in this graph are different. Table 3 lists the highest weighted edges in this graph. Selecting the top 3 edges and their incident nodes for the user profile returns a graph with 6 nodes and the following edges: ai-teaching tools-web security-research. The combinations geo-web and security-research occur the same number of times in the sample data. The difference between this user profile and the user profile returned by the co-occurrence approach shows the effect of using evaporation for profile creation. In the co-occurrence approach, the weight was the same for both combinations and therefore it was necessary to randomly select one of them for the profile. With the adaptive approach it is possible to detect that the latter combination has been used at a later point in time and can therefore be considered as currently more important to the user.
Table 3: Top 4 tag combinations for the adaptive approach with parameters α = 1.0, β = 1.0, ρ = 0.01 (see Section 3 for details). Again only those combinations with weights higher
than 1 are shown.
3. The Add-A-Tag algorithmNow we formally define the adaptive algorithm that was described in Section 2.3. Section 3.1 describes how to create the profile graph. Section 3.2 defines how to extract the user profile from the profile graph.
3.1 Updating the graphConsider a user u adding a bookmark item b tagged with tags t1, . . . , tn to his or her bookmark collection. The profile graph is Gu = (V,E) where V = v1, . . . , vn is the set of vertices (which correspond to tags) and E = e1, . . . , en is the set of edges, updated as follows.
Evaporation In the first step, the existing information in the graph is changed by applying the evaporation formula shown in Equation 1 to every edge ex ∈ E
wex ← wex - ρ · wex (1)
where ρ ∈ [0, 1] is a constant and wex is the weight of edge ex.
Reinforcement In the second step, the n new tags from bookmark b: t1, . . . , tn are added to the graph. For every combination titj where i, j ∈1, . . . , n and i < j, the following procedure is executed:
1. For every tag tx (x ∈ i, j), add a corresponding vertex vx to graph Gu, if vx does not exist.
2. If it does not yet exist, add an edge with weight α between vertex vi and vertex vj to graph Gu, where constant α is a real number and α > 0.3. Otherwise, if an edge between vertex vi and vertex vj exists, increase its weight by β. Constant β is a real number and β > 0.The procedure described above is executed each time the user adds an bookmark item to the bookmark collection.
3.2 Extracting the user profileExtracting the user profile from the profile graph is definedas follows.1. Create a ordered set Es from E = e1, . . . , en. Es contains all edges ex (x ∈ 1, . . . , n) from graph Gu ordered in decreasing order by their weights wex .2. Create set Ek by extracting the top k elements from set Es, where k is a natural number and k > 0.3. Create graph Gu0 which contains all edges from Ek and all vertices vx from graph Gu which are incident to one of the edges in Ek.The size of the user profile Gu0 is determined by the value chosen for parameter k.
4. Evaluation of profile adaptivityEvaluating the adaptive aspects of the user profile creation mechanism is complicated because the amount of change in the user profile depends on the user’s activity pattern as well as on the profile creation mechanism itself. In this section we develop an evaluation methodology and apply it to the co-occurrence approach and to the adaptive approach. The differences in the results demonstrate the effectiveness of the adaptive component in the Add-A-Tag algorithm. Section 4.1 describes the test data used. In Section 4.2 we introduce a metric for computing the distance between two versions of a user profile created at different points in time. Section 4.3 shows the results of applying the metric to the profiles created.
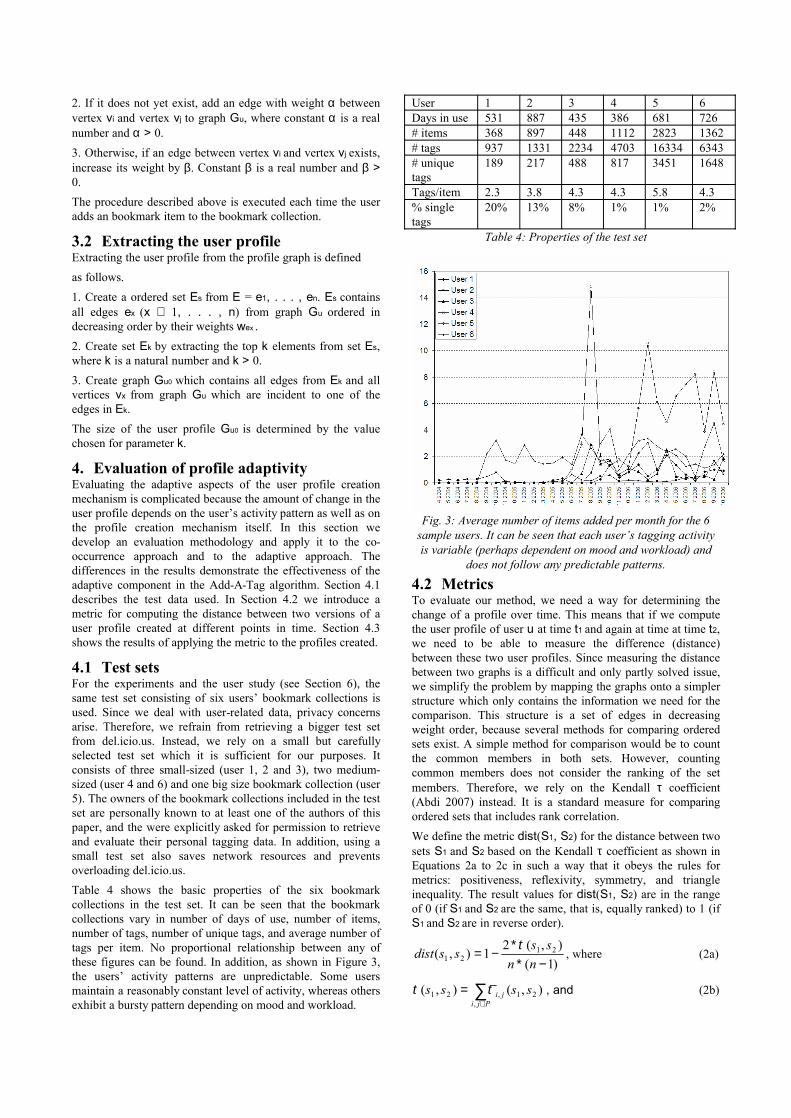
4.1 Test setsFor the experiments and the user study (see Section 6), the same test set consisting of six users’ bookmark collections is used. Since we deal with user-related data, privacy concerns arise. Therefore, we refrain from retrieving a bigger test set from del.icio.us. Instead, we rely on a small but carefully selected test set which it is sufficient for our purposes. It consists of three small-sized (user 1, 2 and 3), two medium-sized (user 4 and 6) and one big size bookmark collection (user 5). The owners of the bookmark collections included in the test set are personally known to at least one of the authors of this paper, and the were explicitly asked for permission to retrieve and evaluate their personal tagging data. In addition, using a small test set also saves network resources and prevents overloading del.icio.us. Table 4 shows the basic properties of the six bookmark collections in the test set. It can be seen that the bookmark collections vary in number of days of use, number of items, number of tags, number of unique tags, and average number of tags per item. No proportional relationship between any of these figures can be found. In addition, as shown in Figure 3, the users’ activity patterns are unpredictable. Some users maintain a reasonably constant level of activity, whereas others exhibit a bursty pattern depending on mood and workload.
User 1 2 3 4 5 6Days in use 531 887 435 386 681 726# items 368 897 448 1112 2823 1362# tags 937 1331 2234 4703 16334 6343# unique tags
189 217 488 817 3451 1648
Tags/item 2.3 3.8 4.3 4.3 5.8 4.3% single tags
20% 13% 8% 1% 1% 2%
Table 4: Properties of the test set
Fig. 3: Average number of items added per month for the 6 sample users. It can be seen that each user’s tagging activity is variable (perhaps dependent on mood and workload) and
does not follow any predictable patterns.
4.2 Metrics To evaluate our method, we need a way for determining the change of a profile over time. This means that if we compute the user profile of user u at time t1 and again at time at time t2,we need to be able to measure the difference (distance) between these two user profiles. Since measuring the distance between two graphs is a difficult and only partly solved issue, we simplify the problem by mapping the graphs onto a simpler structure which only contains the information we need for the comparison. This structure is a set of edges in decreasing weight order, because several methods for comparing ordered sets exist. A simple method for comparison would be to count the common members in both sets. However, counting common members does not consider the ranking of the set members. Therefore, we rely on the Kendall τ coefficient (Abdi 2007) instead. It is a standard measure for comparing ordered sets that includes rank correlation.We define the metric dist(S1, S2) for the distance between two sets S1 and S2 based on the Kendall τ coefficient as shown in Equations 2a to 2c in such a way that it obeys the rules for metrics: positiveness, reflexivity, symmetry, and triangle inequality. The result values for dist(S1, S2) are in the range of 0 (if S1 and S2 are the same, that is, equally ranked) to 1 (if S1 and S2 are in reverse order).
)1(),(21),( 21
21 −∗∗
−=nn
ssssdist τ, where (2a)
∑∈
=Pji
ji ssss,
21,21 ),(),( ττ , and (2b)

=otherwise
sandsinordersametheinarejiifssji 1.0),( 1
21,τ (2c)
In Equation 2a, variable n is the size of the sets. In Equation 2b, P is the set of pairs of distinct elements in S1 and S2. The Kendall τ is applicable only for sets which have the same members and – consequently – are of same size. For our setting, this means that those set members that are present in only one of the sets need to be added to the other one. We append the missing set members to the end of the set in order not to affect the ranking of the pairs.
4.3 ResultsNow we compute the user profiles for the six user’s bookmark collections described in Section 4.1. We incrementally create the profile graph by adding the bookmark items in their temporal order, and – each time after adding all bookmarks that were created by the user within the time span of one week – we extract the user profile from the profile graph. Using this procedure we retrieve a set of user profiles
{ }nttGu ...1:)( ∈for each user u and each week t. In the next step, we apply the metric dist to these data in order to assess the amount ofchange between the weekly snapshots of the profiles. For eachuser u, every user profile Gu for week t + 1 is compared to the user profile Gu for the previous week t. Figure 4 shows the results of this computation for the co-occurrence approach (parameter k set to 20) and Figure 5 shows the results for the Add-A-Tag approach (parameter k set to 20, α = 1.0, β = 1.0, and ρ = 0.01). In both figures, the data points show the metric values, and trend lines of type moving average with period 6 show the performance of the metric values over time for the different users. In Figure 4, it can be seen that the degree of change in the user profiles decreases over time for the co-occurrence approach. Although the users are specifying new tag combinations when adding bookmarks to their collections, the most often used tag combinations are too dominant and prevent newly arising tag combinations from being included in the profile. When comparing these results to those of the Add-A-Tag approach (Figure 5), one can see that (1) the degree of change in the user profile is higher in the Add-ATag approach, and that (2) when comparing the Add-A-Tag results for the 20-weeks time spans, the overall amount of change in the profiles over time is remarkably similar for every time span. This provides evidence that the Add-A-Tag approach meets its goal of adapting the profile to the interests of the user over time.For a more detailed evaluation, Figure 6 shows a direct comparison of the co-occurrence and the Add-A-Tag method for one user together with the weekly activity of this user expressed as the logarithm of the average number of items added to the bookmark collection (cf. Figure 3). Again, trend lines of type moving average with period 6 are included. The dashed lines show the user’s activity. What Figure 6 reveals is that both approaches exhibit a change pattern that is proportional to the user’s activity pattern, but the Add-A-Tag approach’s curve (1) shows a considerably higher amount of change and (2) fits better with the activity pattern. This is particularly the case for the results in the time span between week 80 and week 100, where the user’s activity level is high and the Add-A-Tag approach appropriately
reflects the activity pattern, but the co-occurrence approach puts too much emphasis on the most often used tag combinations fails to adapt to the newly-used ones.
Fig. 4: Co-occurrence approach (• = 0, k = 20)
Fig. 5: Add-A-Tag (• = 1.0, •= 1.0, • = 0.01, k = 20)
Fig. 6: Direct comparison of approaches for user 5.
However, one drawback of the Add-A-Tag approach that became evident during the experiments is that the value for parameter ρ needs to be chosen very carefully. The higher the value for parameter ρ, the more emphasis is put on those items

that were added to the bookmark collection recently. Choosing a value in the range between 0.01 and 0.05 for ρ gives reasonable results where the proportion between newly used tag combinations and often-used tag combinations is balanced. Setting the value for ρ higher than 0.05 places the emphasis on newly-used tag combinations.
5. Profile visualisationNow we need a way to observe the changes in a user profile over time. The visualisation method described in this section was first intended as a “debug tool” to view the creation process of a profile in the design phase of the Add-A-Tag algorithm. However, it turned out to be of high interest to the del.icio.us users among our peers to be able to view their tagging activities in the past. For this reason, it developed into a fully functional tool. A screen shot of the visualisation tool is shown in Figure 7. The screen is divided into a main part and a control panel at the bottom of the screen. The control panel contains (1) radio buttons which allow the user to select one of the profile creation methods and (2) a button to start the visualisation. After starting a visualisation, the user profile is presented as an animation over time. The bottom panel shows a date and the main part of the screen shows the state of the user profile at this date. A button allows the user to pause and resume the animation. The tool is implemented as a Java applet, and the graph visualisation is based on the JUNG framework2.We decided for a graphical representation of the profile instead of a text-based one. This makes it much easier to show the network structure of the profile. To provide for intuitive observation of the dynamic changes, all nodes are moving using a “bubbling up” metaphor, which means that they enter the screen from the bottom and continuously move towards the top. If a tag is included in the user profile at one point of time, but not included in the next state, it vanishes from the screen. Using this metaphor, visualising the profiles created with the naive approach is straightforward. The nodes are shown as dots and labeled with their corresponding tags. They enter the screen from the bottom on a randomly chosen horizontal position, and bubble up. However, for the co-occurrence approach and for the Add-A-Tag approach, it is also necessary to visualise the edges between the nodes. The lengths of the edges between the nodes need to correspond to the edge’s weights. The higher the weight, the shorter the length of the edge must be. Basically, there are two approaches possible for visualising these dynamic graphs. In the first approach, all nodes and edges that will be included in the profile at a certain point in time need to be known in advance. In the next step, a graph layout algorithm can be applied for calculating the positions of all the nodes and edges.During the animation, those nodes that are currently included in the profile are set to visible while all the others are set to invisible. The benefit of this approach is that the nodes do not move. However, the drawback is that the layout algorithm creates a visually pleasing layout for the complete graph, but the layouts of the different graph states shown over time are not optimized and tend to look quite ugly. Therefore, we had to adopt another approach by using an iteration-based graph
2 http://jung.sourceforge.net
visualisation algorithm that incrementally optimizes the layout of the different graph states.
Fig. 7: visualisation of a user profileWe chose to combine nodes “bubbling up” with the spring embedder layout algorithm of Fruchterman & Reingold (1991), in which the nodes repel or attract each other depending on the edges between them and on the weight of these edges. In addition, a minimum and a maximum length for the edges was defined in order to prevent node labels being printed on top of each other, and to avoid nodes being too far away from each other. The “bubbling up” metaphor and spring embedding work together. If a tag A that newly appears at the bottom of the screen has a connection to a tag B that is already shown on the screen, the spring embedder algorithm will cause tag B to move down on the screen and tag A to move up at the same time. Tag A and tag B will move towards each other until the edge between them has a length according to its weight. This has desirable impacts on the vertical positions of the profile’s components, which divide themselves into active and not active as well as into long-term, mid-term, and short-term interests of a user. Those subgraphs of the graph which change over time – meaning that new nodes connect to the subgraph –are vertically aligned in the center of the screen (e.g., the two subgraphs related to research and travel in Figure 7), because newly added tags make the older, related tags move down again. They refer to long- and midterm interests of a user that are currently active. On the contrary, those subgraphs that do not change but are still included in the profile move to the top of the screen (e.g., ants-conferences in Figure 7). They refer to long-term interests of a user that are currently not active. The third category are those tags that move in from the bottom and vanish shortly after (e.g., uk-cornwall in Figure 7). They refer to short-term interests of a user.

6. User studyIn this section we present the results of a small user study conducted in order to get feedback about user’s acceptance of the three different profile creation and profile visualisationmethods. Six users were provided with the visualisation tool described in the last section. The names of the profile creation methods were not mentioned in order not to influence the results of the user study. In Figure 7, Method A refers to the naive approach, Method B to the Add-A-Tag approach, and Method C to the co-occurrence approach. They were asked to fill out a questionnaire in which they had to rate the different methods. The following scale was used for the rating: Very good, Good, Fair, Poor, Very Poor. In addition, the users were asked to rank the methods from 1 to 3 according to how much they liked them, and to justify both the choices for rating and ranking using free-form text. There was also some space for additional comments included. The application and the questionnaire were sent by email to the user, who also replied using email. As overall feedback, we observed a Wow!-effect similar to the one described by Vi´egas et al (2006) in their study ofvisualising users’ email archives. The users were generally pleased with the possibility of viewing aggregated information about their bookmark collection. Both being able to view the (1) relationships between the tags and the (2) trends over time were recognized and appreciated. In their feedback, many of the users mentioned that some tag combinations showed up in the profile at some point of time which they were able to track back to a specific event they could still remember. To cite one of the users: “I kept having the feeling that by looking at the graph some sort of hidden meaning was coming out. Thevisualisation style is definitely inspiring, for revealing non-obvious relations!”Although the participants in the user study were not provided with any information about the inner working of the different methods, a majority of the users (4 of 6) were able to correctly identify and describe which kind of aggregation was performed for the different approaches, e.g, as one user expressed it: “I guess method 3 represents the average most used tags, while method 2 the average most recently used tags.”. However, the users’ references for the different methods turned out to be quite diverse. Two users ranked the co-occurrence approach first, two of them preferred the Add-A-Tag approach, and one of them ranked both of them equally. One of the users favored the naive approach. This may have been down to thevisualisation algorithm rather than the profile creation method: “there was too much movement and too many changes on the screen, and the edges between them were detracting from the tags”. The average rating for the naive approach was Poor. The average rating for both co-occurrence approach and the Add-A-Tag approach was Good. Several users mentioned that they perceived the difference between the co-occurrence approach and the Add-A-Tag approach as being rather small. We may conclude that the preferred method of user profile creation is a very individual choice. For this reason, instead of creating a tool with a hard coded method, a preferable solution may be to allow the user to choose and configure his or her profile creation algorithm and visualisation method. The popularity of the co-occurrence method shows that users value the long-term tag relationships in their profile; however they also appreciated that Add-A-Tag adapts better to recent changes. Allowing users to select the balance of long-term and short-term
interests would provide control without over-burdening the user.
7. PROFILES FOR PERSONALIZED INFORMATION ACCESSIn the following we discuss the usage of the created profile for assisting users in navigating information resources. We present two example scenarios in which the created profile can be of benefit. Section 7.1 discusses the scenario of browsing the Web, Section 7.2 that of an annotated data source. Obviously, the profile can also be used for accessing a user’s bookmark collection in the same manner as tag clouds are used for that task. Since visualising the relationships between the tags andthe time-based aspects at the same time would cognitivelyoverload users, in this section we focus on visualising therelationships between the tags in the profile at a fixed point in time.
7.1 Browsing the WebIf the person knows what he or she is looking for, e.g., when performing a search, knowing the user’s additional interestsother from the current one is of minor importance. On the contrary, knowing the user’s interests is important if the person does not know what he or she is looking for, e.g, when browsing the Web for no specific purpose. In this case, theprofile can be shown in the browser’s sidebar or as part of the Web page (similar to a navigation menu). When a tag occurs in the Web page the user is currently looking at, the tag can be highlighted in the profile, and clicking on it results in automatic scrolling to the position on the page on which the tag occurs. Another possibility is to highlight the terms in the Web page that are matched by tags in the profile (e.g., in the same manner as search strings are highlighted when viewing the Google cache of a search result). To improve the recall, string matching is used in combination with stemming.
7.2 Browsing an annotated data sourceThe situation is more complex if a user wants to access a data source that is annotated with metadata. In this case, a matching needs to be performed. In general, matches are possible between (1) the profile and the content of the data source (as already discussed in the previous section), or between (2) the profile and the metadata of the data source as a description of the corresponding content. In the following we discuss the latter case using the HP Technical Reports3 as an example for such a data source. They comprise a document collection annotated with metadata, such as title, author(s), date of publication, number of pages, abstract, and keywords. Only metadata that describe the contents of a resource can be used for the matching. Structural metadata (such as number of pages) is not helpful for matching, but can be exploited for additional navigational options in the interface.In our example there are three possibilities for the matching between profile and data source. We can either match (1) tags and keywords, (2) tags and abstracts, or/and (3) tags and full text. If the tags in the profile are from very different domains than the domain of the data source, the matching may not be successful. However, at least a partial overlap between the user’s overall interest and his or her current interests can be safely assumed. For the matching itself, string matching in combination with stemming is used. Since tags are most
3 http://www.hpl.hp.com/techreports
commonly in lower-case letters, whereas keywords are usually in capitalized letters, the matching needs must be performed in a case-insensitive way.
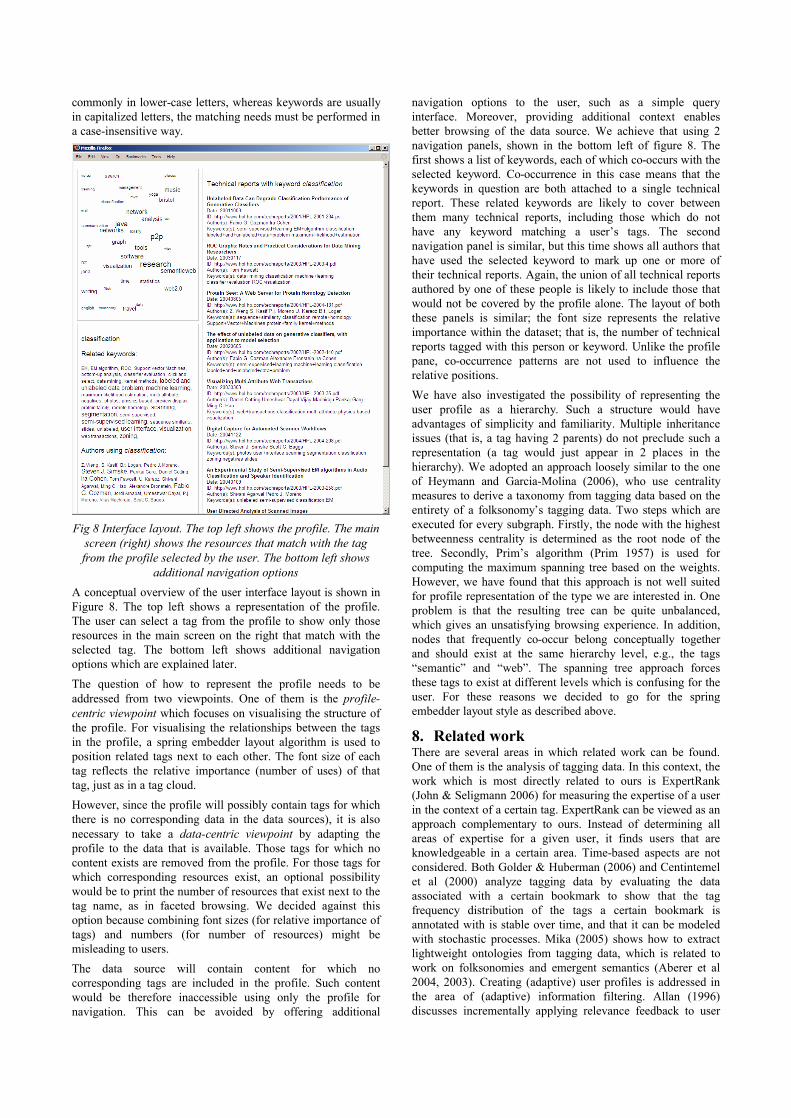
Fig 8 Interface layout. The top left shows the profile. The main screen (right) shows the resources that match with the tag from the profile selected by the user. The bottom left shows
additional navigation optionsA conceptual overview of the user interface layout is shown in Figure 8. The top left shows a representation of the profile. The user can select a tag from the profile to show only those resources in the main screen on the right that match with the selected tag. The bottom left shows additional navigation options which are explained later.The question of how to represent the profile needs to be addressed from two viewpoints. One of them is the profile-centric viewpoint which focuses on visualising the structure of the profile. For visualising the relationships between the tags in the profile, a spring embedder layout algorithm is used to position related tags next to each other. The font size of each tag reflects the relative importance (number of uses) of thattag, just as in a tag cloud.However, since the profile will possibly contain tags for which there is no corresponding data in the data sources), it is also necessary to take a data-centric viewpoint by adapting the profile to the data that is available. Those tags for which no content exists are removed from the profile. For those tags for which corresponding resources exist, an optional possibility would be to print the number of resources that exist next to the tag name, as in faceted browsing. We decided against this option because combining font sizes (for relative importance of tags) and numbers (for number of resources) might be misleading to users.The data source will contain content for which no corresponding tags are included in the profile. Such content would be therefore inaccessible using only the profile for navigation. This can be avoided by offering additional
navigation options to the user, such as a simple query interface. Moreover, providing additional context enables better browsing of the data source. We achieve that using 2 navigation panels, shown in the bottom left of figure 8. The first shows a list of keywords, each of which co-occurs with the selected keyword. Co-occurrence in this case means that the keywords in question are both attached to a single technical report. These related keywords are likely to cover between them many technical reports, including those which do not have any keyword matching a user’s tags. The second navigation panel is similar, but this time shows all authors that have used the selected keyword to mark up one or more of their technical reports. Again, the union of all technical reports authored by one of these people is likely to include those that would not be covered by the profile alone. The layout of both these panels is similar; the font size represents the relative importance within the dataset; that is, the number of technical reports tagged with this person or keyword. Unlike the profile pane, co-occurrence patterns are not used to influence the relative positions. We have also investigated the possibility of representing the user profile as a hierarchy. Such a structure would have advantages of simplicity and familiarity. Multiple inheritance issues (that is, a tag having 2 parents) do not preclude such a representation (a tag would just appear in 2 places in the hierarchy). We adopted an approach loosely similar to the one of Heymann and Garcia-Molina (2006), who use centrality measures to derive a taxonomy from tagging data based on the entirety of a folksonomy’s tagging data. Two steps which are executed for every subgraph. Firstly, the node with the highest betweenness centrality is determined as the root node of the tree. Secondly, Prim’s algorithm (Prim 1957) is used for computing the maximum spanning tree based on the weights. However, we have found that this approach is not well suited for profile representation of the type we are interested in. One problem is that the resulting tree can be quite unbalanced, which gives an unsatisfying browsing experience. In addition, nodes that frequently co-occur belong conceptually together and should exist at the same hierarchy level, e.g., the tags “semantic” and “web”. The spanning tree approach forces these tags to exist at different levels which is confusing for the user. For these reasons we decided to go for the spring embedder layout style as described above.
8. Related workThere are several areas in which related work can be found.One of them is the analysis of tagging data. In this context, the work which is most directly related to ours is ExpertRank (John & Seligmann 2006) for measuring the expertise of a user in the context of a certain tag. ExpertRank can be viewed as an approach complementary to ours. Instead of determining all areas of expertise for a given user, it finds users that are knowledgeable in a certain area. Time-based aspects are not considered. Both Golder & Huberman (2006) and Centintemel et al (2000) analyze tagging data by evaluating the dataassociated with a certain bookmark to show that the tag frequency distribution of the tags a certain bookmark is annotated with is stable over time, and that it can be modeledwith stochastic processes. Mika (2005) shows how to extractlightweight ontologies from tagging data, which is related towork on folksonomies and emergent semantics (Aberer et al 2004, 2003). Creating (adaptive) user profiles is addressed in the area of (adaptive) information filtering. Allan (1996)discusses incrementally applying relevance feedback to user

profiles and how to cope with shifts in the user’s interests, an issue he calls “query drift”. Moreover, several nature-inspired approaches can be found in this research field. Nootropia (Nanas et al 2006) is a system for adaptive information filtering based on an immune system inspired approach. Another approach is that of Tebri et al. (2005), who use reinforcement learning for profile creation.Several papers address visualisation issues. TagLines (Dubinko et al 2006) is a visualisation of the most popular tags over time in Flickr. It takes the entirety of Flickr tags into account. Since this is a huge amount of data, TagLines incorporates an efficient algorithm for computing the top k tags for time intervals of different sizes. Themail (Vi´egas et al 2006) is a system for visualising a user’s email archive. The focus is on visualising the communication with one particular person over time. Two different timescales (yearly and monthly) are used. The graph visualisation tools presented in this paper are based on the JUNG framework4. The GUESS framework (Adar 2006) supports visualisation of dynamic graphs with the so-called tweening algorithm. Similar to the visualisation tool described in this paper, it creates an animation of the changes over time. This animation can be saved to QuickTime format. A TouchGraph-based visualisation of del.icio.us related tags is provided by Alf Eaton5. Hassan-Montero and Herrero-Solana(2006) suggest an improvement on tag cloud visualisation by applying clustering algorithms to group related tags next to each other. Tag clustering is also addressed by Begelman et al (2006).Several applications for visualising a user’s tag collection can be found on the Web. Extisp.icio.us6, also described as “del.icio.us scattering” by its author, is a simple HTMLbased visualisation that uses the size of a browser window. Just as for a tag cloud, the size of the tags depends on their popularity. The output looks similar to the one presented in Figure 7, but unlike as in our approach, the tags are positioned randomly on the screen and the relationships between the tags are not taken into account. Since the tags are not filtered according to their popularity, the output is quite scattered: Some tags are printed in very small font size, and some on top of each other. Revealicious7 provides three different ways for visualising a user’s tag collection. One of them, called SpaceNav, is a method for graph exploration. Selecting a tag shows all its neighbors in a circle layout. Selecting a neighbor again brings up its neighborhood. The history of clicked tags is shown as a path. For selected tags, it is also shown how often it has been used and to how many other tags it is related. TagsCloud is an extended tag cloud in which hovering over a tag brings up related tags in color. Grouper does the same, but additionally groups all tag into the categories “most used”, “commonly used”, and “less used”. Delicious Soup8 shows all tags as dots in a two-dimensional grid. The size of a dot roughly corresponds to the number of times the tag has been used. Hovering over a dots shows textual information about how often and since when the tag has been used, together with the number of related tags. In addition, the related dots are
4 http://jung.sourceforge.net5 http://hublog.hubmed.org/archives/001049.html6 http://kevan.org/extispicious/7 http://www.ivy.fr/revealicious/8 http://www.zitvogel.com/delicioussoup/
highlighted. Delicious Soup could perhaps be improved by positioning related dots next to each other in the grid, and by including the tag for a related dot when highlighting it.
9. ConclusionWe describe a technique for building a profile from a user’s browsing behaviour. It does not seem adequate to take account of tag frequency alone; co-occurence information is needed to make the profiles make sense to the user. The profiles demonstrably adapt over time; we show how mechanisms like evaporation can be used to deal with transient and changing interests. We evaluated the Add-A-Tag approach in two ways. First, we defined a metric appropriate for quantifying the amount of change over time and compared the results for several possibilities for creating user profiles from bookmark collections. Second, we conducted a user study to find out if our ideas are accepted by the users. For this purpose, a visualisation method for dynamic graphs was designed and a prototype was implemented. Visualisation of the generated profiles is not straightforward but seems genuinely useful.Profiles can also be used to access other information sources in a way that makes sense to the user. We have shown an example where tag profile information guides access to the HP Labs technical report archive. However the principles are much more generic and we would like to explore uses with other data source and scale it up to provide a production ready service(s) in the future.One issue still unsolved is that of profile representation. We found a simple graph like layout algorithm worked better than tag clouds or hierarchical layout. However, we would like to have larger scale user feedback to support our conclusions. Also the spectrum of layout algorithms is far from exhausted; given the utility of such profiles to the user it seems this would be a promising direction for our work. The matching of profiles to information sources has to date been achieved using simple mechanisms; string matching in combination with stemming and case conversion. This could be enhanced by backing the comparison algorithm with a thesaurus such as WordNet – this would link tags with synonym keywords, for example. Another possibility would be to use a data-centric approach, such as clustering, to find implicit relationships between tags or technical report keywords. Again, this mechanism would allow a tag to be matched to a larger number of possible keywords.
10. AcknowledgementsWe are grateful to Jeremy Carroll and Kalvis Apsitis for providing expertise on graphs and graph metrics, and to PaoloCastagna, Hui Wan, and Andrew Byde for their helpful comments in the design phase of the visualisation method. Wealso would like to thank the participants of the user study, who let us use their bookmark collections and provided veryvaluable feedback.
11. REFERENCESH. Abdi. Encyclopedia of Measurement and Statistics, chapter Kendall rank correlation, pages 508–510. Sage, 2007. K. Aberer, P. Cudre-Mauroux, A. M. Ouksel, T. Catarci, M.-S. Hacid, A. Illarramendi, V. Kashyap, M. Mecella, E. Mena, E. J. Neuhold, O. D. Troyer, T. Risse, M. Scannapieco, F. Saltor, L. de Santis, S. Spaccapietra, S. Staab, and R. Studer. Emergent Semantics Principles and Issues. In Proceedings of the 9th International Conference on Database Systems forAdvanced Applications (DASFAA 2004), March 2004.

K. Aberer, P. Cudre-Mauroux, and M. Hauswirth. The Chatty Web: Emergent Semantics Through Gossiping. In Procceedings of the 12th International World Wide Web Conference (WWW 2003), May 2003. E. Adar. GUESS: A Language and Interface for Graph Exploration. In Proceedings of the InternationalConference on Conference on Human Factors in Computing Systems (CHI2006), April 2006. J. Allan. Incremental Relevance Feedback for Information Filtering. In Proceedings of the 19th Annual International ACM SIGIR Conference on Research and Development in Information Retrieval (SIGIR ‘96), pages 270–278, New York, NY, USA, August 1996. ACM Press. G. Begelman, P. Keller, and F. Smadja. Automated Tag Clustering: Improving Search and Exploration in the Tag Space. In Proceedings of the Collaborative Web Tagging Workshop, 15th International World Wide Web Conference (WWW 2006), May 2006. A. Byde, H. Wan, and S. Cayzer. Personalized TagRecommendations via Social Network and Content-based Similarity Metrics. In Proceedings of the International Conference on Conference on Weblogs and Social Media (ICWSM’07), March 2007. U. Cetintemel, M. J. Franklin, and C. L. Giles. Self-adaptive user profiles for large-scale data delivery. In Proceedings of the 16th International Conference on Data Engineering (ICDE 2000), page 622, Washington, DC, USA, February/March 2000. IEEE Computer Society. H. Chen and K. J. Lynch. Automatic Construction of Networks of Concepts Characterizing Document Databases. IEEE Transactions On Systems, Man, and Cybernetics, 22(5):885–902, September/October 1992.
M. Dorigo and G. D. Caro. New Ideas in Optimization, chapter The Ant Colony Optimization Meta-Heuristic, pages 11–32. McGraw-Hill, 1999.M. Dubinko, R. Kumar, J. Magnani, J. Novak, P. Raghavan, and A. Tomkins. Visualizing Tags over Time. In Proceedings of the 15th International World Wide Web Conference (WWW 2006), pages 193–202, New York, NY, USA, 2006. ACM Press.T. M. J. Fruchterman and E. M. Reingold. Graph drawing by force-directed placement. Software - Practice and Experience, 21(11):1129–1164, 1991.S. A. Golder and B. A. Huberman. The Structure ofCollaborative Tagging Systems. Journal of Information Science, 32(2):198–208, April 2006.Y. Hassan-Montero and V. Herrero-Solana. Improving Tag-Clouds as Visual Information Retrieval Interfaces. In Proceedings of the International Conference onMultidisciplinary Information Sciences and Technologies (InSciT2006), October 2006. P. Heymann and H. Garcia-Molina. Collaborative Creation of Communal Hierarchical Taxonomies in Social Tagging Systems. Technical report, Computer Science Department, Stanford University, April 2006.A. John and D. Seligmann. Collaborative Tagging andExpertise in the Enterprise. In Proceedings of theCollaborative Web Tagging Workshop, 15th International World Wide Web Conference (WWW 2006), May 2006.
E. Michlmayr, S.Cayzer and P. Shabajee Add-A-Tag: Learning Adaptive User Profiles from Bookmark Collections International Conference on Weblogs and Social Media ICWSM’2007 Boulder, Colorado, USA
E. Michlmayr and S.Cayzer Learning User Profiles from Tagging Data and Leveraging them for Personal(ized) Information Access WWW 2007, accepted.
P. Mika. Ontologies are us: A unified model of social networks and semantics. In Proceedings of the 4th International Semantic Web Conference (ISWC 2005), November 2005.N. Nanas, A. de Roeck, and V. Uren. Immune-Inspired Adaptive Information Filtering. In Proceedings of the 5th International Conference on Artificial Immune Systems (ICARIS 2006), September 2006. R. C. Prim. Shortest connection networks and somegeneralisations. Bell System Technical Journal, 36, 1957.H. Tebri, M. Boughanem, and C. Chrisment. Incremental profile learning based on a reinforcement method. In Proceedings of the ACM Symposium on Applied Computing (ACM SAC), March 2005. F. Vi´egas, S. Golder, and J. Donath. Visualizing EmailContent: Portraying Relationships from ConversationalHistories. In Proceedings of the International Conference on Conference on Human Factors in Computing Systems (CHI2006), April 2006.S. Wasserman and K. Faust. Social Network Analysis. Cambridge University Press, Cambridge, 1994. Z. Xu, Y. Fu, J. Mao, and D. Su. Towards the Semantic Web: Collaborative Tag Suggestions. In Proceedings of the Collaborative Web Tagging Workshop, 15th 8 International World Wide Web Conference (WWW 2006), May 2006.