addiction: what every judge should know michael l. dennis, ph.d. chestnut health systems normal, il...
TRANSCRIPT

Addiction: What Every Judge Should Know
Michael L. Dennis, Ph.D.Chestnut Health Systems Normal, IL
Presentation at “Addiction: What Every Judge Should Know” workshop, March 5, 2009, Paul Brown Stadium, Cincinnati, Ohio. This presentation was supported by funds from Ohio Supreme Court and Bureau of Justice Assistance Edward Byrne Competitive National Interest Grant no 2008-DD-BX-0710 and using data from NIDA grants no. R01 DA15523, R37-DA11323 and CSAT contract no. 270-07-0191. It is available electronically at www.chestnut.org/li/posters . The opinions are those of the authors do not reflect official positions of the government. Please address comments or questions to the author at [email protected] or 309-820-3805.

2
1. Illustrate the Chronic Nature of Addiction and the Correlates of Recovery
2. Demonstrate the Feasibility of Managing Addiction Across Episodes of Treatment to Improve Long Term Outcomes
3. Identify the Common Gaps in the Existing Treatment System and What it Means to Move it Toward Evidenced Based Practice
4. Demonstrate the Usefulness of Practice Based Evidence to Inform Clinical Decision Making About Placement and Treatment Planning
Goals of this Presentation are to

3
Illustrate the Chronic Nature of Addiction and the Correlates of Recovery

4
Severity of Past Year Substance Use/Disorders (2002 U.S. Household Population age 12+= 235,143,246)
Dependence 5%
Abuse 4%
Regular AOD Use 8%
Any Infrequent Drug Use 4%
Light Alcohol Use Only 47%
No Alcohol or Drug Use
32%
Source: 2002 NSDUH; Dennis & Scott 2007

5
Problems Vary by Age
0
10
20
30
40
50
60
70
80
90
100
12-13
14-15
16-17
18-20
21-29
30-34
35-49
50-64
65+
No Alcohol or Drug Use
Light Alcohol Use Only
Any Infrequent Drug Use
Regular AOD Use
Abuse
Dependence
NSDUH Age Groups
Severity CategoryAdolescent
OnsetRemission
Increasing rate of non-
users
Source: 2002 NSDUH; Dennis & Scott 2007

6
Higher Severity is Associated with Higher Annual Cost to Society Per Person
$0$231$231
$725$406
$0$0
$500
$1,000
$1,500
$2,000
$2,500
$3,000
$3,500
$4,000
No Alcohol orDrug Use
Light Alcohol
Use Only
AnyInfrequentDrug Use
Regular AODUse
AbuseDependence
Median (50th percentile)
$948
$1,613
$1,078$1,309
$1,528
$3,058Mean (95% CI)
This includes people who are in recovery, elderly, or do not use
because of health problemsHigher Costs
Source: 2002 NSDUH; Dennis & Scott 2007

7
Brain Activity on PET Scan Brain Activity on PET Scan After Using CocaineAfter Using Cocaine
Photo courtesy of Nora Volkow, Ph.D. Mapping cocaine binding sites in human and baboon brain in vivo. Fowler JS, Volkow ND, Wolf AP, Dewey SL, Schlyer DJ, Macgregor RIR, Hitzemann R, Logan J, Bendreim B, Gatley ST. et al. Synapse 1989;4(4):371-377.
Rapid rise in brain activity after taking
cocaine
Actually ends up lower than they started

8
Normal
Cocaine Abuser (10 days)
Cocaine Abuser (100 days)Photo courtesy of Nora Volkow, Ph.D. Volkow ND, Hitzemann R, Wang C-I, Fowler IS, Wolf AP,
Dewey SL. Long-term frontal brain metabolic changes in cocaine abusers. Synapse 11:184-190, 1992; Volkow ND, Fowler JS, Wang G-J, Hitzemann R, Logan J, Schlyer D, Dewey 5, Wolf AP. Decreased dopamine D2 receptor availability is associated with reduced frontal metabolism in cocaine abusers. Synapse 14:169-177, 1993.
Brain Activity on PET Scan Brain Activity on PET Scan After Using CocaineAfter Using Cocaine
With repeated use, there is a cumulative
effect of reduced brain activity which
requires increasingly more stimulation (i.e.,
tolerance)
Even after 100 days of abstinence
activity is still low
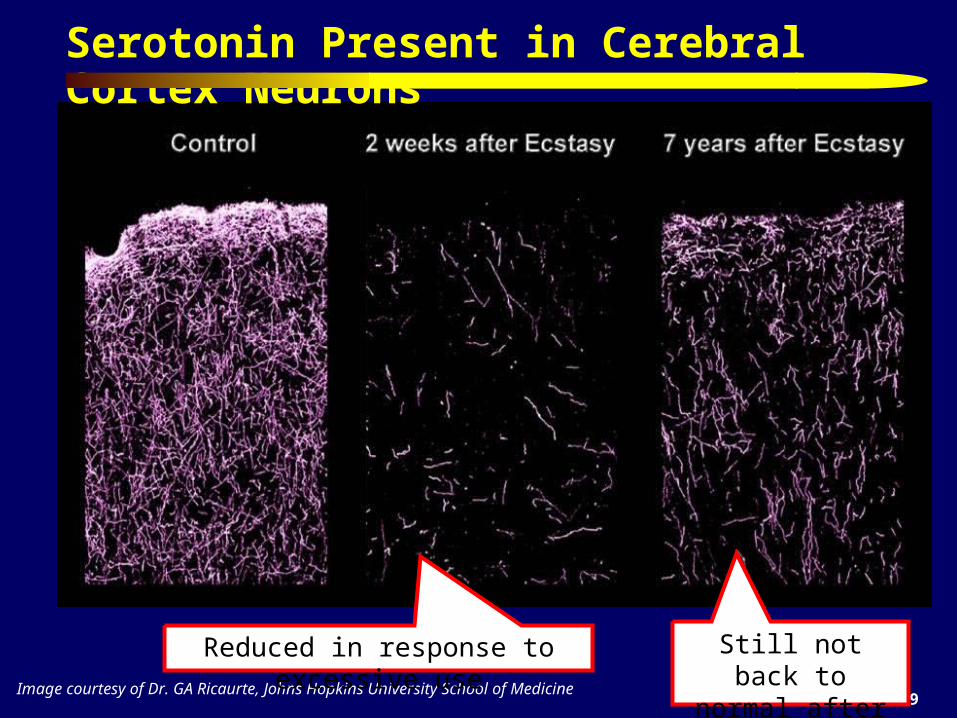
9Image courtesy of Dr. GA Ricaurte, Johns Hopkins University School of Medicine
Serotonin Present in Cerebral Cortex Neurons
Reduced in response to excessive use Still not back to normal after 7 years

10
Photo courtesy of the NIDA Web site. From A Slide Teaching Packet: The Brain and the Actions of Cocaine, Opiates, and Marijuana.t
pain
Adolescent Brain Development Occurs from the
Inside to Out and from Back to Front

11
Committing property crime, drug related crimes, gang related crimes, prostitution, and gambling to trade or get the money for alcohol or other drugs
Committing more impulsive and/or violent acts while under the influence of alcohol and other drugs
Crime levels peak between ages of 15-20 (periods or increased stimulation and low impulse control in the brain)
Adolescent crime is still the main predictor of adult crime Parent substance use is intertwined with child maltreatment and neglect –
which in turn is associated with more use, mental health problems and perpetration of violence on others
Overlap with Crime and Civil Issues

12
Substance Use Careers Last for Decades C
um
ula
tive
Su
rviv
al
Years from first use to 1+ years abstinence302520151050
1.0
.9
.8
.7
.6
.5
.4
.3
.2
.10.0
Median of 27 years from
first use to 1+ years
abstinence
Source: Dennis et al., 2005

13
Substance Use Careers are Longer the Younger the Age of First Use
Cu
mu
lati
ve S
urv
ival
Years from first use to 1+ years abstinence
under 15*
21+
15-20*
Age of 1st UseGroups
* p<.05 (different from 21+)
302520151050
1.0
.9
.8
.7
.6
.5
.4
.3
.2
.10.0
Source: Dennis et al., 2005

14
Substance Use Careers are Shorter the Sooner People Get to Treatment
Cu
mu
lati
ve S
urv
ival
20+
0-9*
10-19*
Year to 1st TxGroups
302520151050
1.0
.9
.8
.7
.6
.5
.4
.3
.2
.10.0
* p<.05 (different from 20+)Source: Dennis et al., 2005
Years from first use to 1+ years abstinence

15
Treatment Careers Last for Years C
um
ula
tive
Su
rviv
al
Years from first Tx to 1+ years abstinence2520151050
1.0
.9
.8
.7
.6
.5
.4
.3
.2
.10.0
Median of 3 to 4 episodes of treatment over 9 years
Source: Dennis et al., 2005

16
Lifetime Mental Health Diagnosis and Remission
Source: Dennis, Coleman, Scott & Funk forthcoming; National Co morbidity Study Replication
15% 13%8%
25%
10% 10% 8% 8%
46%
31%
7%
20%
0%
10%
20%
30%
40%
50%
60%
70%
80%
90%
100%
Any
AO
D
Alc
ohol
Dru
g
Any
Ext
erna
lizi
ng
Con
duct
Opp
osit
iona
lD
efia
nt
Inte
rmit
tent
Exp
losi
ve
Att
enti
on D
efic
it
Any
Int
erna
lizi
ng
Anx
iety
:
Moo
d :
Pos
ttra
umat
icS
tres
s
Lifetime Diagnosis
10% 10% 15% 8% 9%4%
18%12% 11%
3%4%7%
Past Year Remission
66%
77%
83%
58%
89% 89%
45%50%
39%
56%48%40%
Remission Rate (% Remission / % Dependent)
SUD Remission Rates are BETTER than Most Major DSM Diagnoses
17
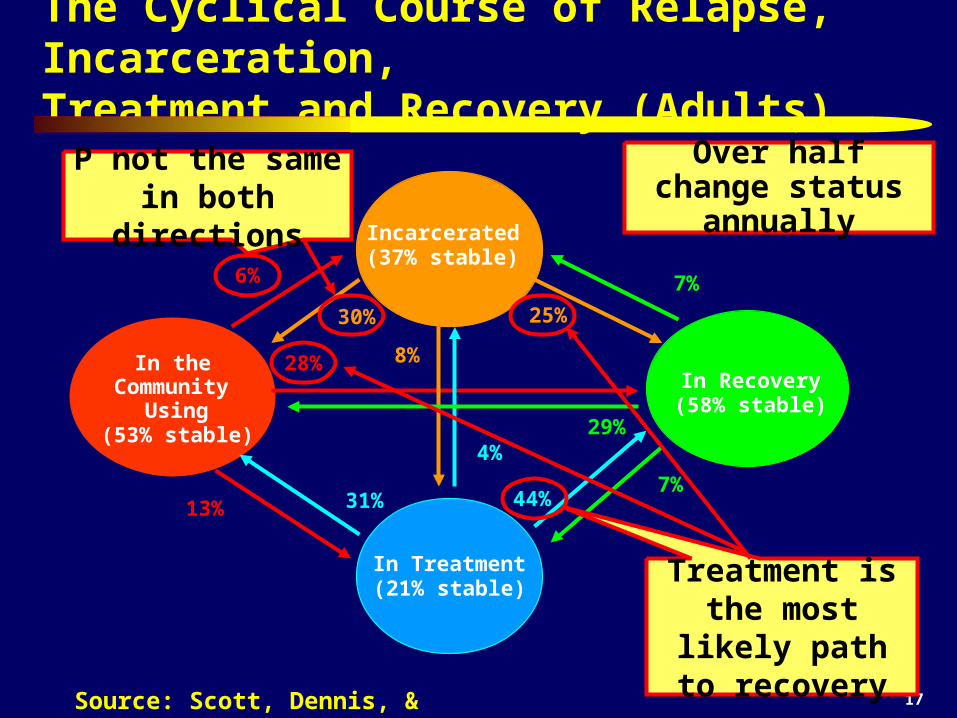
The Cyclical Course of Relapse, Incarceration, Treatment and Recovery (Adults)
In the Community
Using (53% stable)
In Treatment (21% stable)
In Recovery (58% stable)
Incarcerated(37% stable)
6%
28%
13%
30%
8%
25%
31%
4%
44%7%
29%
7%
Treatment is the most likely path
to recovery
P not the same in both directions
Over half change status annually
Source: Scott, Dennis, & Foss (2005)

18Source: Scott, Dennis, & Foss (2005)
Predictors of Change Also Vary by Direction
In the Community
Using (53% stable)
In Recovery (58% stable)
28%
29%
Probability of Sustaining Abstinence - times in treatment (0.83) + Female (1.72)- homelessness (0.61) + ASI legal composite (1.19)- number of arrests (0.89) + # of sober friend (1.22)
+ per 77 self help sessions (1.82)
Probability of Transitioning from Using to Abstinence - mental distress (0.88) + older at first use (1.12) -ASI legal composite (0.84) + homelessness (1.27)
+ # of sober friend (1.23)+ per 8 weeks in treatment (1.14)

19
Percent Sustaining Abstinence Through Year 8 by Duration of Abstinence at Year 7
36%
66%
86% 86%
0%
10%
20%
30%
40%
50%
60%
70%
80%
90%
100%
1 to 12 months(n=157; OR=1.0)
1 to 3 years(n=138; OR=3.4)
3 to 5 years(n=59; OR=11.2)
5+ years(n=96; OR=11.2)
Duration of Abstinence at Year 7
% S
usta
inin
g A
bsti
nent
thro
ugh
Yea
r 8
.
It takes a year of abstinence
before less than half relapse
Even after 3 to 7 years of abstinence about 14% relapse
Source: Dennis, Foss & Scott (2007)
1.22

20
0%
10%
20%
30%
40%
50%
60%
70%
80%
90%
100%
Using(N=661)
1 to 12 ms(N=232)
1 to 3 yrs(N=127)
3 to 5 yrs(N=65)
5 to 8 yrs(N=77)
% Days of Psych Prob (of 30 days)
% Above Poverty Line
% Days Worked For Pay (of 22)
% of Clean and Sober Friens
% Days of Illegal Activity (of 30 days)
Other Aspects of Recovery by Duration of Abstinence of 8 Years1-12 Months:
Immediate increase in clean and sober friend
1-3 Years: Decrease in
Illegal Activity; Increase in
Psych Problems
3-5 Years: Improved
Vocational and Financial Status
5-8 Years: Improved
Psychological Status
Source: Dennis, Foss & Scott (2007)

21
Death Rate by Years of Abstinence
Source: Scott, Dennis, & Funk (2008)
4.5%
0%1%2%3%4%5%6%7%8%9%
10%11%12%13%14%15%
Household
(OR=1.00)
Less than 1
(OR=2.87)
1-3 Years
(OR=1.61)
4-8 Years
(OR=0.84)
0%1%2%3%4%5%6%7%8%9%
10%11%12%13%14%15%
Household
(OR=1.00)
Less than 1
(OR=2.87)
1-3 Years
(OR=1.61)
4-8 Years
(OR=0.84)
Users/ Early Abstainers 2.87
times more likely to die in the next year
The Risk of Death goes down with
years of sustained abstinence
It takes 4 or more years of abstinence for
risk to get down to
community levels
11.9%
7.1%
3.8%

22
These studies provide converging evidence demonstrating that
Addiction is a brain disorder with the highest risk being during the period of adolescent to young adult brain development
Addiction is chronic in the sense that it often lasts for years, the risk of relapse is high, and multiple interventions are likely to be needed
Yet over two thirds of the people with addiction do achieve recovery
Treatment increases the likelihood of transitioning from use to recovery
Self help, peers and recovery environment help predict who stays there
Recovery is broader than just abstinence

23
Demonstrate the Feasibility of Managing Addiction Across Episodes of Treatment to Improve Long Term Outcomes

24
Lots of Geographic Variation in AOD Disorders
Source: OAS, 2006 – 2003, 2004, and 2005 NSDUH

25
Cumulative Recovery Pattern at 30 months
Source: Dennis et al, forthcoming
37% Sustained Problems
5% Sustained Recovery
19% Intermittent, currently in
recovery
39% Intermittent, currently not in
recovery
The Majority of Adolescents Cycle in and out of Recovery

26
Recovery* by Level of Care
* Recovery defined as no past month use, abuse, or dependence symptoms while living in the community. Percentages in parentheses are the treatment outcome (intake to 12 month change) and the stability of the outcomes (3months to 12 month change) Source: CSAT Adolescent Treatment Outcome Data Set (n-9,276)
0%
10%
20%
30%
40%
50%
60%
70%
80%
90%
100%
Pre-Intake Mon 1-3 Mon 4-6 Mon 7-9 Mon 10-12
Per
cent
in P
ast
Mon
th R
ecov
ery* Outpatient (+79%, -1%)
Residential(+143%, +17%)
Post Corr/Res (+220%, +18%)
OP & Resid
Similar
CC better

There Have Been Several Recent Reviews
Dennis & Scott (2007) review of evidenced related to understanding and managing addiction as a chronic condition
Marlowe (2008) and Bhati et al (2008) meta analyses of Drug Treatment Court Effectiveness and Cost-Effectiveness
Mckay’s (in press) review of 22 experiments and quasi experiments managing addiction over time found improved outcomes in 38% of those focused on less than 3 months, 44% on those that focused on 3 to 12 months and 100% of those that focused on more than 12 months

Experiments with Continuing Care
Assertive Continuing Care 1 (ACC-2) experiment with 183 adolescents discharged from residential substance abuse treatment and followed for 9 months in 1997-2004
Assertive Continuing Care 2 (ACC-2) experiment with 342 adolescents discharged from residential substance abuse treatment and followed for 12 months in 2005-2008
Assertive Outpatient Continuing Care Study (AOCCS) experiment with 320 adolescents admitted to outpatient substance abuse treatment and followed for 12 months in 2003-2008

29
Time to Enter Continuing Care and Relapse after Residential Treatment (Age 12-17)
Source: Godley et al., 2004 for relapse and 2000 Statewide Illinois DARTS data for CC admissions
0%
10%
20%
30%
40%
50%
60%
70%
80%
90%
100%
0 10 20 30 40 50 60 70 80 90
Days after Residential (capped at 90)
Per
cen
t of
Clie
nts
Cont.CareAdmis.
Relapse

30
ACC Enhancements
Continue to participate in UCC
Home Visits
Sessions for adolescent, parents, and together
Sessions based on ACRA manual (Godley, Meyers et al., 2001)
Case Management based on ACC manual (Godley et al, 2001) to assist with other issues (e.g., job finding, medication evaluation)

31
Assertive Continuing Care (ACC)Hypotheses
Assertive Continuin
g Care
General Continuin
g Care Adherence
Relative to UCC, ACC will increase General Continuing Care Adherence (GCCA)
Early Abstinence
GCCA (whether due to UCC or ACC) will be associated with higher rates of early abstinence
Sustained Abstinence
Early abstinence will be associated with higher rates of long term abstinence.
32
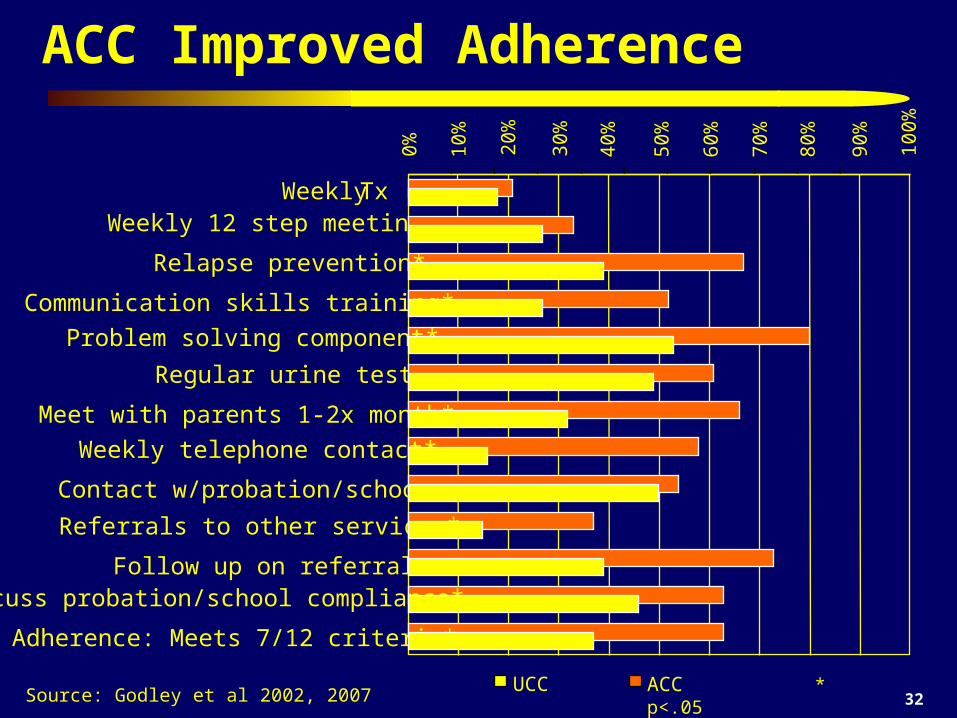
ACC Improved Adherence
Source: Godley et al 2002, 2007
0% 10%
20%
30%
40%
50%
60%
70%
80%
Weekly Tx Weekly 12 step meetings
Regular urine tests
Contact w/probation/school
Follow up on referrals*
ACC * p<.05
90%
100%
Relapse prevention*
Communication skills training*
Problem solving component*
Meet with parents 1-2x month*
Weekly telephone contact*
Referrals to other services*
Discuss probation/school compliance*
Adherence: Meets 7/12 criteria*
UCC

33
GCCA Improved Early (0-3 mon.) Abstinence
Source: Godley et al 2002, 2007
24%
36% 38%
0%
10%
20%
30%
40%
50%
60%
70%
80%
90%
100%
Any AOD (OR=2.16*) Alcohol (OR=1.94*) Marijuana (OR=1.98*)
Low (0-6/12) GCCA
43%
55% 55%
High (7-12/12) GCCA * p<.05

34
Early (0-3 mon.) Abstinence Improved Sustained (4-9 mon.) Abstinence
Source: Godley et al 2002, 2007
19% 22% 22%
0%
10%
20%
30%
40%
50%
60%
70%
80%
90%
100%
Any AOD (OR=11.16*) Alcohol (OR=5.47*) Marijuana (OR=11.15*)
Early(0-3 mon.) Relapse
69%
59%
73%
Early (0-3 mon.) Abstainer * p<.05

35
Relating Standards of Proof to Science
Beyond a Beyond a ReasonablReasonabl
e e DoubtDoubt
Clear andClear andConvincinConvincin
ggEvidenceEvidencePreponderancePreponderance
of the of the EvidenceEvidenceProbablProbabl
eeCauseCauseReasonablReasonabl
eeSuspicionSuspicion
LawLaw ScienceScienceMeta Analyses of Experiments/ Quasi Meta Analyses of Experiments/ Quasi
Experiments (Summary v Predictive, Experiments (Summary v Predictive, Specificity, Replicated, Consistency)Specificity, Replicated, Consistency)
Dismantling/ Matching study (What worked for Dismantling/ Matching study (What worked for whom)whom)
Experimental Studies (Multi-site,Experimental Studies (Multi-site, Independent,Independent, Replicated, Fidelity, Consistency)Replicated, Fidelity, Consistency)
Quasi-Experiments (Quality of Matching, Multi-Quasi-Experiments (Quality of Matching, Multi-site,site, Independent,Independent, Replicated, Consistency)Replicated, Consistency)
Pre-Post (multiple waves), Expert ConsensusPre-Post (multiple waves), Expert ConsensusCorrelation and Observational studiesCorrelation and Observational studiesCase Studies, Focus GroupsCase Studies, Focus GroupsPre-data Theories, Logic ModelsPre-data Theories, Logic ModelsAnecdotes, AnalogiesAnecdotes, Analogies
ST
RO
NG
ER
Source: Marlowe 2008
Weak Levels of
Expert Testimony

36
Meta Analyses of Experiments/ Quasi Meta Analyses of Experiments/ Quasi Experiments (Summary v Predictive, Experiments (Summary v Predictive, Specificity, Replicated, Consistency)Specificity, Replicated, Consistency)
Dismantling/ Matching study (What worked for Dismantling/ Matching study (What worked for whom)whom)
Experimental Studies (Multi-site,Experimental Studies (Multi-site, Independent,Independent, Replicated, Fidelity, Consistency)Replicated, Fidelity, Consistency)
Quasi-Experiments (Quality of Matching, Multi-Quasi-Experiments (Quality of Matching, Multi-site,site, Independent,Independent, Replicated, Consistency)Replicated, Consistency)
Pre-Post (multiple waves), Expert ConsensusPre-Post (multiple waves), Expert ConsensusCorrelation and Observational studiesCorrelation and Observational studiesCase Studies, Focus GroupsCase Studies, Focus GroupsPre-data Theories, Logic ModelsPre-data Theories, Logic ModelsAnecdotes, AnalogiesAnecdotes, Analogies
Relating Standards of Proof to Science
Beyond a Beyond a ReasonablReasonabl
e e DoubtDoubt
Clear andClear andConvincinConvincin
ggEvidenceEvidencePreponderancePreponderance
of the of the EvidenceEvidenceProbablProbabl
eeCauseCauseReasonablReasonabl
eeSuspicionSuspicion
LawLaw ScienceScience
ST
RO
NG
ER
Adult Drug Treatment Courts 5 meta analyses of 76 studies found crime reduced 7-26% with
$1.74 to $6.32 return on investment
Family Drug Treatment Courts – one multisite quasi experiment with positive findings for
parent and child
DWI Treatment Courts – one quasi experiment and five observational studies with effect sizes of 0 to .45 and one quasi experiment (effect size=.29
to .57)Juvenile Drug Treatment Courts, Mental Health Treatment Courts – multiple small studies with
mix of positive, null and negative findings

37
Potential Cost Savings of Expanding Diversion to Treatment Programs in Justice Settings
Currently treating about 55,000 people in these courts at a cost of $515 million with an average return on investment (ROI) of $2.14 per dollar
The ROI is higher (2.71) for those with more crime
It is estimated that there are at least twice as many people in need of drug court as getting it
Investing the $1 billion to treat them would likely produce a ROI of $2.17 billion to society
Source: Bhati et al (2008) To Treat or Not To Treat: Evidence on the Prospects of Expanding Treatment to Drug-Involved Offenders. Washington, DC: Urban Institute.

38
Experiments with Recovery Management Checkups to Manage Addiction Over Years
Early Re-Intervention (ERI) Experiment 1 – 448 adults entering treatment followed for 2-years from 2000-2002
Early Re-Intervention (ERI) Experiment 2 – 446 adults entering treatment followed for 5-years from 2004-2009
Women Offenders – 450 women coming out of Cook County jail and followed for 3-years from 2008-2013
Early Re-Intervention for Adolescents (ERI-A) – feasibility studies currently being conducted with over longitudinal data on over 4,000 adolescents

39
Recovery Management Checkup (RMC) Quarterly Screening to determining “Eligibility” and “Need” Linkage meeting/motivational interviewing to:
– provide personalized feedback to participants about their substance use and related problems,
– help the participant recognize the problem and consider returning to treatment,
– address existing barriers to treatment, and – schedule an assessment.
Linkage assistance– reminder calls and rescheduling– Transportation and being escorted as needed
Treatment Engagement Specialist

40
ERI-2 Time to Treatment Re-Entry
10%
20%
30%
40%
50%
60%
70%
80%
90%
100%
0% 0 90 18
0270 36
0450
540
630
Days to Re-Admission (from 3 month interview)
Percent Readmitted 1+ Times
55% ERI-2 RMC* (n=221)
37% ERI-2 OM (n=224)
*Cohen's d=+0.41 Wilcoxon-Gehen
Statistic (df=1)=16.56, p <.0001
630-246 = -384 days
The size of the effect is growing every quarter
Source: Scott & Dennis (in press)
RMC increases the odds of transitioning from using to treatment within a quarter by 2.1

41
ERI-2: Impact on Outcomes at 45 Months
0%
10%
20%
30%
40%
50%
60%
70%
80%
90%
100%
Re-enteredTreatment(d=0.22)*
of 14 SubsequentQuarters in Need
(d= 0.26) *
of 1260 DaysAbstinent(d= 0.26)* (d= -0.32)*
Still in need of Tx at Mon 45 (d= -0.22) *
Per
cent
age
OM RMC
* p<.05
55%
41%
67%
50%
56%
38%
Fewer Seq.Quartersin Need
74%
More days of
abstinent
of 180 Daysof Treatment
71%
61%
RMC Increased Treatment Participation
RMC Increased Treatment Participation
47%
Less likely to be in
Need at 45m
Source: Scott & Dennis (in press)

42
In the Community
Using (75% stable)
In Treatment (32% stable)
In Recovery (58% stable)
Incarcerated(56% stable)
4%
10%
10%
23%
8%
13%
35%
7%
25%6%
24%
3%
ERI 2: Average Quarterly Transitions over 3 years
34% Changed Status in an
Average Quarter
Again the Probability of
Entering Recovery is Higher from
Treatment
Source: Riley, Scott & Dennis, 2008

43
In the Community
Using (75% stable)
In Treatment (32% stable)
10%
In Recovery(58% stable)
35% 25%
Source: Riley, Scott & Dennis, 2008
ERI 2: Average Quarterly Transitions over 3 years
Transition to Tx (vs use)- Tx Resistance (0.93) + Freq. of Use (25.30)+ Desire for Help (1.23)+ Wks of Self Help (1.51)+ Self Help Act. (1.37)+ Prior Wks of Tx (1.07)+ RMC (2.08)
Transition Tx to Recovery (vs. relapse) - Freq. of Use (0.01) + Wks Self Help (1.39)-Tx Resistance (0.79) +Self Help Act. (1.31)

44
The Cyclical Course of Relapse, Incarceration, Treatment and Recovery: Adolescents
In the Community
Using (75% stable)
In Treatment (48% stable)
In Recovery (62% stable)
Incarcerated(46% stable)
5%
12%
7%
20%
24%
10%
26%
7 %
19%7%
27%
3%
Source: Dennis et al 2007. 2006 CSAT AT data set
Avg of 39% change status each quarter
P not the same in both directions
Treatment is the most likely path
to recoveryMore likely than adults to stay 90 days in treatment (OR=1.7)
More likely than adults to be diverted
to treatment (OR=4.0)

45
In the Community
Using (75% stable)
12%
27%
Probability of Going from Use to Early “Recovery” (+ good)-Age (0.8) + Female (1.7),- Frequency Of Use (0.23) + Non-White (1.6)
+ Self efficacy to resist relapse (1.4) + Substance Abuse Treatment Index (1.96)
* Average days during transition period of participation in self help, AOD free structured activities and inverse of AOD involved activities, violence, victimization, homelessness, fighting at home, alcohol or drug use by others in home•** Proportion of social peers during transition period in school/work, treatment, recovery, and inverse of those using alcohol, drugs, fighting, or involved in illegal activity.
In Recovery(62% stable)
Probability of Sustaining Recovery vs. Relapsing (+ good)- Freq. Of Use (0.0002) + Initial Weeks in Treatment (1.03)- Illegal Activity (0.70) + Treatment Received During Quarter (2.00)- Age (0.81) + Recovery Environment (r)* (1.45)
+ Positive Social Peers (r) (1.43)
The Cyclical Course of Relapse, Incarceration, Treatment and Recovery: Adolescents

46
In the Community
Using (75% stable)
In Treatment
(48 v 35% stable)
7%
Probability of Going from Use to “Treatment” (+ good)-Age (0.7) + Times urine Tested (1.7), + Treatment Motivation (1.6)
+ Weeks in a Controlled Environment (1.4)
The Cyclical Course of Relapse, Incarceration, Treatment and Recovery: Adolescents
Source: Dennis et al 2007. 2006 CSAT AT data set

47
In the Community
Using (75% stable)
In Treatment
(48 v 35% stable)
In Recovery (62% stable)
26% 19%
The Cyclical Course of Relapse, Incarceration, Treatment and Recovery: Adolescents
Probability of Going to Using vs. Early “Recovery” (+ good)-- Baseline Substance Use Severity (0.74) + Baseline Total Symptom Count (1.46)-- Past Month Substance Problems (0.48) + Times Urine Screened (1.56)-- Substance Frequency (0.48) + Recovery Environment (r)* (1.47)
+ Positive Social Peers (r)** (1.69)
* Average days during transition period of participation in self help, AOD free structured activities and inverse of AOD involved activities, violence, victimization, homelessness, fighting at home, alcohol or drug use by others in home
** Proportion of social peers during transition period in school/work, treatment, recovery, and inverse of those using alcohol, drugs, fighting, or involved in illegal activity.Source: Dennis et al 2007. 2006 CSAT AT data set

48
In the Community
Using (75% stable)
In Recovery (62% stable)
The Cyclical Course of Relapse, Incarceration, Treatment and Recovery: Adolescents
* Average days during transition period of participation in self help, AOD free structured activities and inverse of AOD involved activities, violence, victimization, homelessness, fighting at home, alcohol or drug use by others in home
20% 10%
Incarcerated(46% stable)
Probability of Going to Using vs. Early “Recovery” (+ good)+ Recovery Environment (r)* (3.33)
Source: Dennis et al 2007. 2006 CSAT AT data set
49
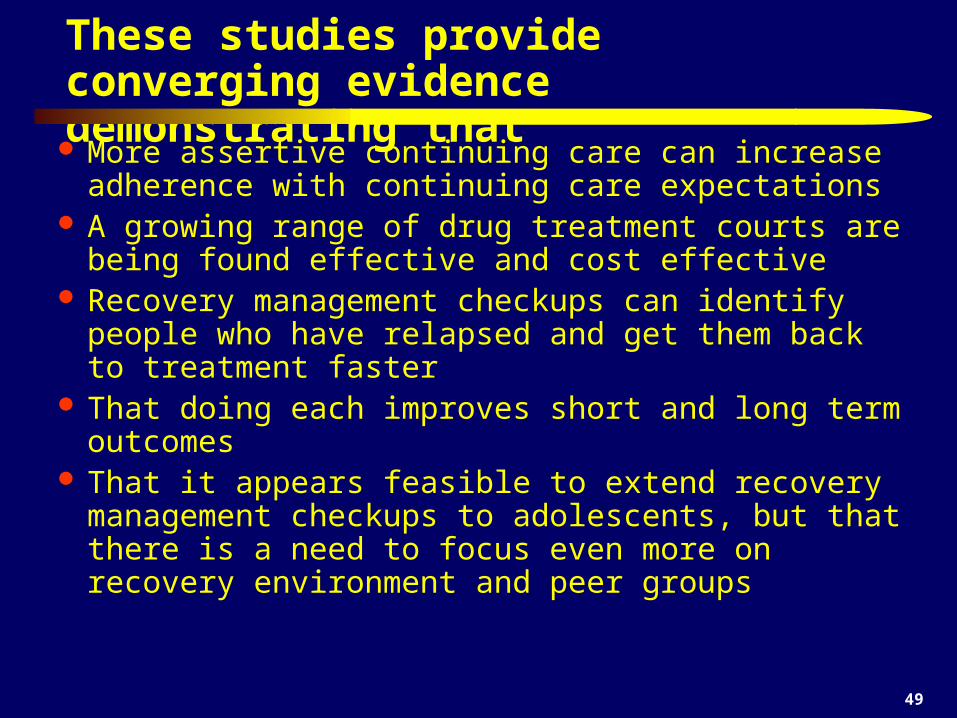
These studies provide converging evidence demonstrating that
More assertive continuing care can increase adherence with continuing care expectations
A growing range of drug treatment courts are being found effective and cost effective
Recovery management checkups can identify people who have relapsed and get them back to treatment faster
That doing each improves short and long term outcomes That it appears feasible to extend recovery management
checkups to adolescents, but that there is a need to focus even more on recovery environment and peer groups

50
Identify the Common Gaps in the Existing Treatment System and What it Means to Move it Toward Evidenced Based Practice
51
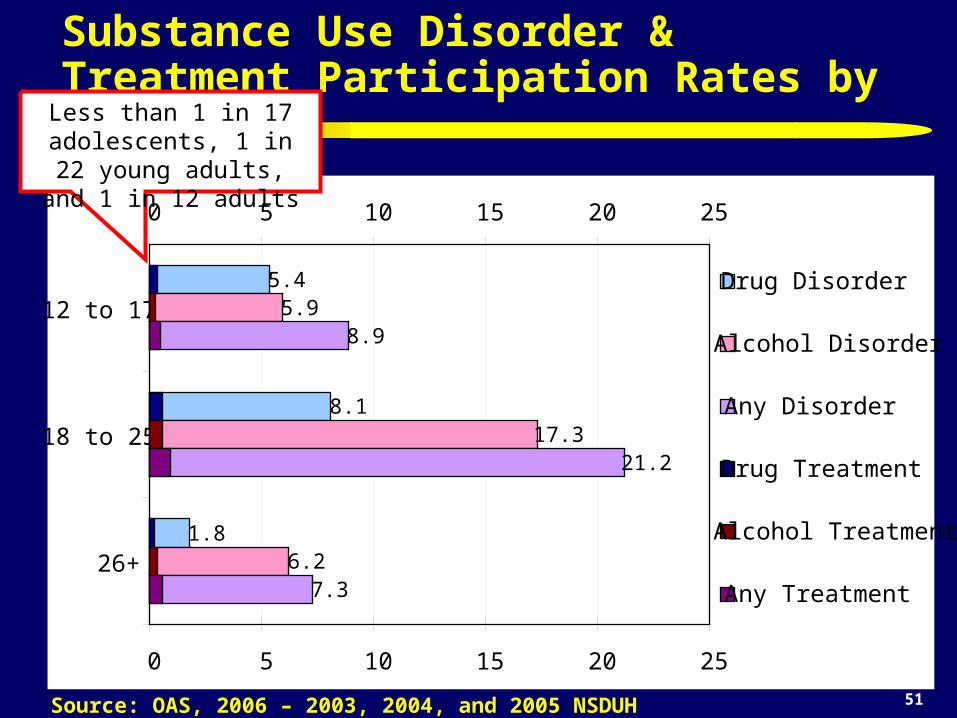
Substance Use Disorder & Treatment Participation Rates by Age
Source: OAS, 2006 – 2003, 2004, and 2005 NSDUH
5.4
8.1
1.8
5.9
17.3
6.2
8.9
21.2
7.3
0 5 10 15 20 25
12 to 17
18 to 25
26+
0 5 10 15 20 25
Drug Disorder
Alcohol Disorder
Any Disorder
Drug Treatment
Alcohol Treatment
Any Treatment
Less than 1 in 17 adolescents, 1 in 22 young adults, and 1 in 12 adults

52
The Majority Stay in Tx Less than 90 days
Source: Data received through August 4, 2004 from 23 States (CA, CO, GA, HI, IA, IL, KS, MA, MD, ME, MI, MN, MO, MT, NE, NJ, OH, OK, RI, SC, TX, UT, WY) as reported in Office of Applied Studies (OAS; 2005). Treatment Episode Data Set (TEDS): 2002. Discharges from Substance Abuse Treatment Services, DASIS Series: S-25, DHHS Publication No. (SMA) 04-3967, Rockville, MD: Substance Abuse and Mental Health Services Administration. Retrieved from http://wwwdasis.samhsa.gov/teds02/2002_teds_rpt_d.pdf .
52
42
20
33
0
30
60
90
Outpatient IntensiveOutpatient
Short TermResidential
Long TermResidential
Level of Care
Med
ian
Len
gth
of S
tay
in D
ays
Half are gone within 8 weeks, less than 25%
stay the 90 days recommended by NIDA
researchers

53
Less Than Half Are Positively Discharged
Source: Data received through August 4, 2004 from 23 States (CA, CO, GA, HI, IA, IL, KS, MA, MD, ME, MI, MN, MO, MT, NE, NJ, OH, OK, RI, SC, TX, UT, WY) as reported in Office of Applied Studies (OAS; 2005). Treatment Episode Data Set (TEDS): 2002. Discharges from Substance Abuse Treatment Services, DASIS Series: S-25, DHHS Publication No. (SMA) 04-3967, Rockville, MD: Substance Abuse and Mental Health Services Administration. Retrieved from http://wwwdasis.samhsa.gov/teds02/2002_teds_rpt_d.pdf .
0%
10%
20%
30%
40%
50%
60%
70%
80%
90%
100%
Outpatient IntensiveOutpatient
Short TermResidential
Long TermResidential
Level of Care
Dis
char
ge S
tatu
s
Other
Terminated
Dropped out
Completed
Transferred
Less than 10% are transferred

54
Programs often LACK Standardized Assessment for…
Substance use disorders (e.g., abuse, dependence, withdrawal), readiness for change, relapse potential and recovery environment
Common mental health disorders (e.g., conduct, attention deficit-hyperactivity, depression, anxiety, trauma, self-mutilation and suicidality)
Crime and violence (e.g., inter-personal violence, drug related crime, property crime, violent crime)
HIV risk behaviors (needle use, sexual risk, victimization)
Child maltreatment (physical, sexual, emotional) Recovery environment and peer risk

55
Other Challenges in Substance Abuse Treatment Workforce and Organizations
High turnover workforce with variable education background related to diagnosis, placement and treatment planning.
Heterogeneous needs and severity characterized by multiple problems, chronic relapse, and multiple episodes of care
Lack of access to or use of data at the program level to guide immediate clinical decisions, billing and program planning
Missing or misrepresented data that needs to be minimized and incorporated into interpretations
56
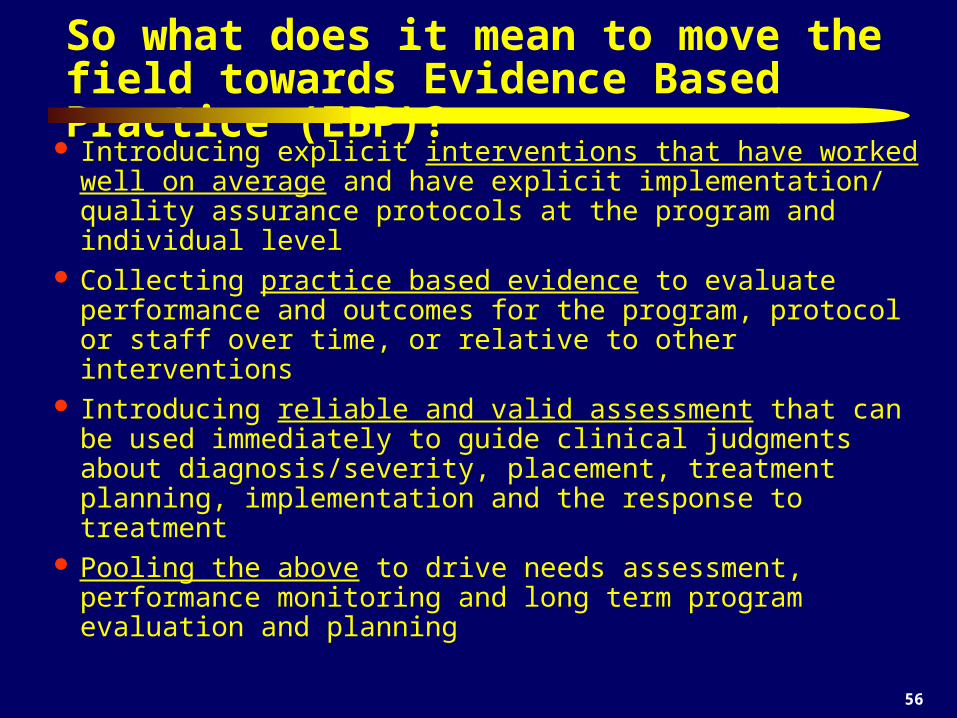
So what does it mean to move the field towards Evidence Based Practice (EBP)?
Introducing explicit interventions that have worked well on average and have explicit implementation/ quality assurance protocols at the program and individual level
Collecting practice based evidence to evaluate performance and outcomes for the program, protocol or staff over time, or relative to other interventions
Introducing reliable and valid assessment that can be used immediately to guide clinical judgments about diagnosis/severity, placement, treatment planning, implementation and the response to treatment
Pooling the above to drive needs assessment, performance monitoring and long term program evaluation and planning

57
What is Treatment? Motivational Interviewing and other protocols to help them understand how
their problems are related to their substance use and that they are solvable Residential, IOP and other types of structured environments to reduce short
term risk of relapse Detoxification and medication to reduce pain/risk of withdrawal and
relapse, including tobacco cessation Evaluation of antecedents and consequences of use Community Reinforcement Approaches (CRA) Relapse Prevention Planning Cognitive Behavioral Therapy (CBT) Proactive urine monitoring Motivational Incentives / Contingency Management Access to communities of recovery for long term support, including 12-
step, recovery coaches, recovery schools, recovery housing, workplace programs
Continuing care, phases for multiple admission

58
Other Specific Services that are Screened for and Needed by People in Treatment:
Tobacco cessation HIV Intervention to reduce high risk pattern of behavior
(sexual, violence, & needle use) Anger Management Psychiatric services related to depression, anxiety,
ADHD/Impulse control, conduct disorder/ ASPD/ BPD, Gambling
Trauma, suicide ideation, and para-suicidal behavior Child maltreatment and domestic violence interventions
(not just reporting protocols) Family, school and work problems Case management and work across multiple systems of
care and time

59
Components of Comprehensive Drug Components of Comprehensive Drug Addiction Treatment Recommended by NIDAAddiction Treatment Recommended by NIDA
www.drugabuse.gov
60
Two Key Resources Available from NIDATwo Key Resources Available from NIDA((http://www.drugabuse.gov ))

61
Major Predictors of Bigger Effects
1. A strong intervention protocol based on prior evidence
2. Quality assurance to ensure protocol adherence and project implementation
3. Proactive case supervision of individual
4. Triage to focus on the highest severity subgroup

62
Impact of the numbers of these Favorable features on Recidivism in 509 Juvenile Justice Studies in Lipsey Meta Analysis
Source: Adapted from Lipsey, 1997, 2005
Average Practice
The more features, the
lower the recidivism

63
Cognitive Behavioral Therapy (CBT) Interventions that Typically do Better than Usual Practice in Reducing Juvenile Recidivism (29% vs. 40%)
Aggression Replacement Training Reasoning & Rehabilitation Moral Reconation Therapy Thinking for a Change Interpersonal Social Problem Solving MET/CBT combinations and Other manualized CBT Multisystemic Therapy (MST) Functional Family Therapy (FFT) Multidimensional Family Therapy (MDFT) Adolescent Community Reinforcement Approach (ACRA) Assertive Continuing Care
Source: Adapted from Lipsey et al 2001, Waldron et al, 2001, Dennis et al, 2004
NOTE: There is generally little or no differences in mean effect size between these brand names

64
15%
19%
5%3%
0%
5%
10%
15%
20%
25%
Mon 12 Mon 24
Off Site
On-SiteWithImmediateFeedback
Impact of Simple On-site Urine Protocol with Feedback On False Negative Urines
Source: Scott & Dennis (in press)
On-site Urine
Feedback Protocol
associated with Lower
False Negatives (19 v 3%)

65
Implementation is Essential (Reduction in Recidivism from .50 Control Group Rate)
The effect of a well implemented weak program is
as big as a strong program implemented poorly
The best is to have a strong
program implemented
well
Thus one should optimally pick the strongest intervention that one can
implement wellSource: Adapted from Lipsey, 1997, 2005

66
Range of Effect Sizes (d) of MET/CBT for Change in Days of Abstinence by Site
0.00
0.20
0.40
0.60
0.80
1.00
1.20
1.40
4 Experiment Sites (f=0.39)(median within site d=0.29)
36 Replication Sites (f=0.21)(median within site d=0.49)
0.00
0.20
0.40
0.60
0.80
1.00
1.20
1.40
Coh
en’s
d
Source: Dennis, Ives, & Muck, 2008
Replication Sites Averaged Better than
Experiment
75% above medianof Experiment
6 programs completely
above Experiment

67
Number of Problems by Level of Care (Triage)
39%50% 55%
67%78%
0%
10%
20%
30%
40%
50%
60%
70%
80%
90%
100%
Outpatient(OR=1)
IntensiveOutpatient(OR=1.6)
Long TermResidential(OR=1.9)
Med. TermResidential(OR=3.2)
Short TermResidential(OR=5.5)
0 to 1
2 to 4
5 or more
* (Alcohol, cannabis, or other drug disorder, depression, anxiety, trauma, suicide, ADHD, CD, victimization, violence/ illegal activity)
Source: Dennis et al 2009; CSAT 2007 Adolescent Treatment Outcome Data Set (n=12,824)
Clients entering Short Term Residential
(usually dual diagnosis) have 5.5 times higher
odds of having 5+ major problems*

68
15%
45%
70%
0%10%20%30%40%50%60%70%80%90%
100%
Low (OR 1.0)
Mod.(OR=4.6)
High(OR=13.2)
NoneOneTwoThreeFourFive+
No. of Problems* by Severity of Victimization
Severity of Victimization
* (Alcohol, cannabis, or other drug disorder, depression, anxiety, trauma, suicide, ADHD, CD, victimization, violence/ illegal activity)
Source: Dennis et al 2009; CSAT 2007 Adolescent Treatment Outcome Data Set (n=12,824)
Those with high lifetime
levels of victimization have 13 times higher odds of
having 5+ major
problems*

69
Victimization and Level of Care Interact to Predict Outcomes
Source: Funk, et al., 2003
0
5
10
15
20
25
30
35
40
Intake 6 Months Intake 6 Months
Mar
ijua
na U
se (
Day
s of
90)
OP -High OP - Low/Mod Resid-High Resid - Low/Mod.
CHS Outpatient CHS Residential Traumatized groups have
higher severity
High trauma group does not respond to CHS OP
Both groups respond to residential treatment

70
Crime/Violence and Substance Problems Interact to Predict Any Recidivism
Low
Mod.
High
LowMod
.High0%
20%
40%
60%
80%
100%
Source: CYT & ATM Data
12 m
onth
rec
idiv
ism
Crime/ Violence predicted recidivism
Substance Problem Severity predicted
recidivismKnowing both was the
best predictor
Substance Problem
Scale
Crime and Violence
Scale

71
Crime/Violence and Substance Problems Interact Differently to Predict Recidivism to Violent Crime
Low
Mod.
High
LowMod
.High
Source: CYT & ATM Data
12 m
onth
rec
idiv
ism
T
o vi
olen
t cri
me
or a
rres
t
Substance Problem
Scale
Crime and Violence
Scale
0%
20%
40%
60%
80%
100%
Crime/ Violence predicted
violent recidivism
(Intake) Substance Problem Severity did
not predict violent recidivism
Knowing both was the best predictor

72
Only 5-10% of those with abuse/dependence are entering treatment Less than 75% stay the 90 days recommended by NIDA (half less than 50 days) Less than half are positively discharge Less than 10% leaving higher levels of care are transferred to outpatient continuing
care The majority of programs do NOT use standardized assessment, evidenced based
treatment, track the clinical fidelity of the treatment they provide or monitor their own performance in terms of client outcomes
Evidenced based practices can improve outcomes We can learn from practice based evidence
Problems With the Treatment System

73
Demonstrate the Usefulness of Practice Based Evidence to Inform Clinical Decision Making About Placement and Treatment Planning

74
No or Inconsistent Use of Placement Criteria
Average staff education is an Associate Degree and stay less than 2 years
In practice, programs primarily refer people to the limited range of services they have readily available.
Knowing nothing about the person other than what door they walked through we can correctly predict 75% (kappa=.51) of the adolescent level of care placements.
The American Society for Addiction Medicine (ASAM) has tried to recommend placement rules for deciding what level of care an adolescent should receive based on expert opinion, but run into many problems.

75
Examples of problems with placement (even with ASAM)
difficulty synthesizing multiple pieces of information
inconsistencies between competing rules
the lack of the full continuum of care or specific services to refer people to
having to negotiate with the participant, families and funders over what they will do or pay for
there is virtually no actual data on the expected outcomes by level of care to inform decision making related to placement

76
CSAT Adolescent Treatment GAIN Data from 203 level of care x site combinations
Outpatient
General Group Home
Short-Term Residential
Outpatient Continuing CareIntensive Outpatient
Long-term ResidentialModerate-Term Residential
Early InterventionOtherCorrections
Levels of Care
Source: Dennis, Funk & Hanes-Stevens, 2008

77
Global Appraisal of Individual Needs (GAIN)
The GAIN is a family of assessment tools ranging from a 5 minute screener to 20 minute quick assessment to a 1-2 hour comprehensive bio-psychosocial
The GAIN Recommendation and Referral Summary (GRRS) is a 6 to 8 page narrative report designed to help clinical staff generate diagnostic impressions, preliminary treatment planning recommendations, and level of care placement recommendations.
For each ASAM dimension, the GRRS includes narrative summaries of the client’s problems, treatment history, and treatment planning recommendations
This information can also be used to group individuals with similar presenting profiles

78
Ratings of Problem Severity (x-axis) by Treatment Utilization (y-axis) by Population Size (circle size)
12%
20%
14%
8%
14%
12%
-0.20
0.00
0.20
0.40
0.60
0.80
1.00
-0.20 0.00 0.20 0.40 0.60 0.80 1.00
Average Current Problem Severity
Ave
rage
Cur
rent
Tre
atm
ent U
tili
zati
on
.
A Low-Low
B Low- Mod
C Mod-Mod
DHi-Low
EHi-Mod
F. Hi-Hi (CC)
G. Hi-Mod(Env Sx/ PH Tx)
9%
H. Hi-Hi(Intx Sx; PH/MH Tx) 12%

79
While over 50% go to outpatient in 7 of 8 clusters, there are a range of placements in each cluster
0% 20% 40% 60% 80% 100%
A Low-Low
B Low-Mod
C Mod-Mod
D Hi-Low
E Hi-Mod
F Hi-Hi (CC)
G Hi-Mod (E/P)
H Hi-Hi (I/P/M)
Outpatient (OP) Intensive Outpatient (IOP)
Outpatient Continuing Care (OPCC) Short Term Residential (STR)
Long Term Residential (LTR)

80
Variance Explained in NOMS Outcomes
\1 Past month \2 Past 90 days *All statistically Significant
26%
24%
11%
25%
15%
33%
26%
18%
14%
8%
24%
0% 5% 10% 15% 20% 25% 30% 35%
No AOD Use
No AOD related Problem
No Health Problems
No Mental Health Problems
No Illegal Activity
No JJ System Involve.
Living in Community
No Family Prob.
Vocationally Engaged
Social Support
Count of above
Percent of Variance Explained

81
Predicted Count of Positive Outcomes by Level of Care: Cluster A Low - Low (n=1,025)
2
3
4
5
6
7
8
9
10
Outpatient Higher LOC
2
3
4
5
6
7
8
9
10
Predicted Count of Positive Outcomes by Level of Care: Cluster A Low - Low (n=1,025)
Person “A” does better in Outpatient
Person “B” does better in Higher Levels of Care

82
Best Level of Care*: Cluster A Low - Low (n=1,025)Best Level of Care*:
Cluster A Low - Low (n=1,025)
99.6%
0.4%0%
20%
40%
60%
80%
100%
120%
Outpatient Higher LOC
% B
est P
redi
cted
Out
com
es
* Based on Maximum Predicted Count of Positive Outcomes

83
A Low-Low (n=1456): Top 10 Tx Needs
79% - Not close to anyone in recovery, assign a recovery coach73% - Assign to relapse prevention52% - Discuss recent school problems and how they can be resolved50% - Coordinating care with juvenile justice system50% - HIV Intervention to reduce high risk pattern of sexual behavior41% - Increase structure to reduce recovery environment risk33% - Discussing the consequences of behavior control problems, the plan
to change, and possible referrals to help.31% - Referral for tobacco cessation30% - Review prior treatment experiences to determine what did and not
work29% - Develop plan for reduction of family fighting

84
Best Level of Care*: Cluster C Mod-Mod (n=1209)
30.2%
7.6%
23.6%
38.6%
0%
10%
20%
30%
40%
50%
60%
70%
80%
90%
Outpatient IOP OPCC Residential
% B
est P
redi
cted
Out
com
es
* Based on Maximum Predicted Count of Positive Outcomes
85
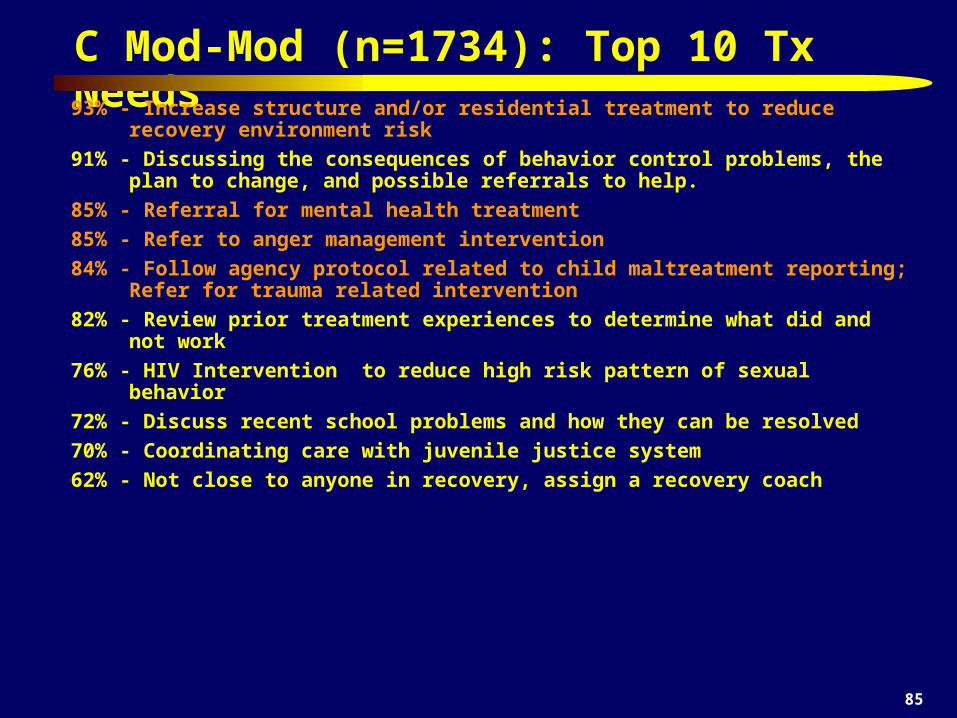
C Mod-Mod (n=1734): Top 10 Tx Needs93% - Increase structure and/or residential treatment to reduce recovery environment
risk
91% - Discussing the consequences of behavior control problems, the plan to change, and possible referrals to help.
85% - Referral for mental health treatment
85% - Refer to anger management intervention
84% - Follow agency protocol related to child maltreatment reporting; Refer for trauma related intervention
82% - Review prior treatment experiences to determine what did and not work
76% - HIV Intervention to reduce high risk pattern of sexual behavior
72% - Discuss recent school problems and how they can be resolved
70% - Coordinating care with juvenile justice system
62% - Not close to anyone in recovery, assign a recovery coach
86
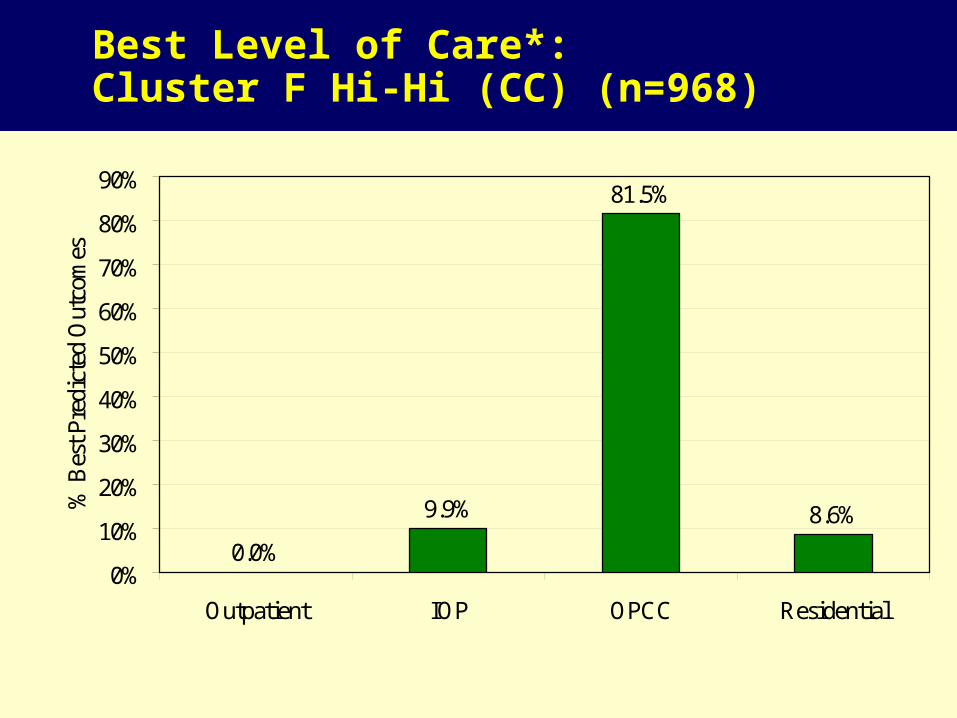
Best Level of Care*: Cluster F Hi-Hi (CC) (n=968)
81.5%
8.6%
0.0%
9.9%
0%
10%
20%
30%
40%
50%
60%
70%
80%
90%
Outpatient IOP OPCC Residential
% B
est P
redi
cted
Out
com
es
* Based on Maximum Predicted Count of Positive Outcomes

87
F Hi-Hi (CC) (n=1402): Top 10 Tx Needs
98% - Refer to continuing care following discharge from controlled environment
97% - Referral for mental health treatment
94% - Develop plan for obtaining stable housing
87% - Increase structure and/or residential treatment to reduce recovery environment risk
85% - Coordinating care with juvenile justice system
81% - HIV Intervention to reduce high risk pattern of sexual behavior
78% - Develop community re-entry plan
78% - Follow agency protocol related to child maltreatment reporting; Refer for trauma related intervention
72% - Discussing the consequences of behavior control problems, the plan to change, and possible referrals to help.
64% - Refer to anger management intervention

88
Best Level of Care*: Cluster G Hi-Mod (Env/PH) (n=749)Best Level of Care*:
Cluster G Hi-Mod (Env/PH) (n=749)
94.1%
5.9%0.0%
0%
10%
20%
30%
40%
50%
60%
70%
80%
90%
100%
Outpatient IOP/OPCC Residential
* Based on Maximum Predicted Count of Positive Outcomes

89
G Hi-Mod (Env/PH) (n=1038): Top 10 Tx Needs
100%-Consider need for detoxification or withdrawal services100% Consider medication to reduce non-opioid withdrawal and relapse99% - Review participation (attendance, motivation, participation, etc.) of client,
participation in family therapy, day treatment or other interventions to increase structure.
93% - Increase structure and/or residential treatment to reduce recovery environment risk
91% - Referral for mental health treatment79% - HIV Intervention to reduce high risk pattern of sexual behavior79% - Referral for tobacco cessation79% - Discussing the consequences of behavior control problems, the plan to
change, and possible referrals to help.74% - Review prior treatment experiences to determine what did and not work74% - Follow agency protocol related to child maltreatment reporting; Refer for
trauma related intervention

90
Summary of Best Level Of Care Based on Cluster and Expected Outcome
0%
10%
20%
30%
40%
50%
60%
70%
80%
90%
100%
Higher than OP 0.4%
Residential 14.1% 7.6% 38.3% 88.3% 94.1% 17.2% 8.6%
IOP/OPCC 27.9% 0.0%
OPCC 0.4% 30.2% 1.1% 78.2% 81.5%
IOP 10.5% 23.6% 0.0% 4.6% 9.9%
OP 99.6% 75.1% 38.6% 33.8% 10.6% 5.9% 0.0% 0.0%
Cluster ALow - Low (n=1025)
Cluster BLow - Mod (n=1654)
Cluster CMod-Mod (n=1209)
Cluster DHi-Low (n=687)
Cluster EHi-Mod
(n=1190)
Cluster GHi-Mod
(Env/PH)
Cluster HHi-Hi
(Intx/PH/MH
Cluster FHi-Hi (CC) (n=968)
*
*
*
*
* *

91
Change in Days Abstinent (while in community) by Level of Care and Gender
Source: CSAT 2007 AT Outcome Data Set (n=11,013)
0
10
20
30
40
50
60
70
80
90
Intake Last Followup
Day
s o
f A
bst
inen
ce
Female - OP (d=0.43)
Males - OP (d=0.33)
Female - Resid (d=0.82)
Males -Res (d=0.74)

92
MALES: Change in Days Abstinent in Community by type of Outpatient Approach
Source: CSAT 2007 AT Outcome Data Set (n=11,013)
0
10
20
30
40
50
60
70
80
90
Intake Last Follow-up
Day
s of
abs
tine
nce
in C
omm
unit
y
MST (d=0.87) (n=25)
Other Mot. Interv (d=0.79) (n=130)
ACRA/ACC (d=0.53) (n=460)
Total (d=0.33) (n=6272)
CHS OP (d=0.15) (n=281)
MDFT (d=0.07) (n=99)
METCBT7 (d=-0.03) (n=93)
FSN (d=0.48) (n=337)
Other (d=0.43) (n=482)
EMPACT (d=0.4) (n=102)
METCBT5 (d=0.33) (n=3368)
Other CBT (d=0.32) (n=150)
Seven Challenges (d=0.27) (n=93)
METCBT12 (d=0.2) (n=506)
EPOCH (d=0.18) (n=146)

93
FEMALES: Change in Days Abstinent in Community by type of Outpatient Approach
Source: CSAT 2007 AT Outcome Data Set (n=11,013)
0
10
20
30
40
50
60
70
80
90
Intake Last Follow-up
Day
s of
abs
tine
nce
in C
omm
unit
y
Total (d=0.42) (n=2339)
EMPACT (d=0.62) (n=31)
Other (d=0.52) (n=120)
CHS OP (d=0.48) (n=97)
METCBT12 (d=0.48) (n=174)
Seven Challenges (d=0.44) (n=51)
FSN (d=0.41) (n=96)
Other CBT (d=0.41) (n=35)
METCBT5 (d=0.4) (n=1491)
METCBT7 (d=0.38) (n=40)
MDFT (d=0.36) (n=28)
ACRA/ACC (d=0.35) (n=86)
EPOCH (d=0.02) (n=29)
Other Mot. Interv (d=0.87) (n=50)
MST (d=0.86) (n=11)

94
These analyses of Practice Based Evidence
Suggest that it is feasible to group people by their presenting needs and predict outcomes
This can be done by level of care or by type of evidenced based protocol within level of care or a subgroup (e.g., gender)
Making this data available to patients, families, clinical staff and the courts have the potential to improve patient outcome
Summary counts of need also have the potential to impact program planning and development

95
Concluding thoughts…
We need to strengthen our focus on prevention and treatment of substance use by adolescents and young adults
We need to target the latter phases of treatment to impact the post-treatment recovery environment and/or social risk groups that are the main predictors of long term relapse
We need to move beyond focusing on acute episodes of care to focus on continuing care and a recovery management paradigm
We need both evidenced based practices, and practice based evidence to improve outcomes

96
Sources and Related Work Bhati et al (2008) To Treat or Not To Treat: Evidence on the Prospects of Expanding Treatment to Drug-Involved Offenders. Washington, DC: Urban
Institute. Dennis, M.L., Coleman, V., Scott, C.K & Funk, R (forthcoming). The Prevalence of Remission from Major Mental Health Disorder in the US: Findings
from the National Co morbidity Study Replication. Dennis, M.L., Foss, M.A., & Scott, C.K (2007). An eight-year perspective on the relationship between the duration of abstinence and other aspects of
recovery. Evaluation Review, 31(6), 585-612 Dennis, M.L., Funk, R.R. & Hanes-Stevens, L. (2008). Moving the field from ‘no wrong door’ to the ‘best door’: An actuarial estimate of expected
outcomes by level of care among adolescents presenting for substance abuse treatment. Joint Meeting on Adolescent Treatment Effectiveness, March 25-27, 2008, Washington, DC.
Dennis, M.L., Godley, S.H., Diamond, G., Tims, F.M., Babor, T., Donaldson, J., Liddle, H., Titus, J.C., Kaminer, Y., Webb, C., Hamilton, N. and Funk, R. (2004). The Cannabis Youth Treatment (CYT) Study: Main Findings from Two Randomized Trials. Journal of Substance Abuse Treatment,27, 197-213.
Dennis, M.L., Ives, M., White, M., & Muck, R. (2008). The Strengthening Communities for Youth (SCY) initiative: A cluster analysis of the services received, their correlates and how they are associated with outcomes. Journal of Psychoactive Drugs, 40(1), 3-16.
Dennis, M. L., Scott, C. K. (2007). Managing Addiction as a Chronic Condition. Addiction Science & Clinical Practice , 4(1), 45-55. Dennis, M. L., Scott, C. K., Funk, R., & Foss, M. A. (2005). The duration and correlates of addiction and treatment careers. Journal of Substance Abuse
Treatment, 28, S51-S62. Dennis, M. L., & Scott, C. K. (2007). Managing substance use disorders (SUD) as a chronic condition. NIDA Addiction Science and Clinical Practice, 4(1),
45-55 Dennis, M. L., Scott, C. K., & Funk, R. (2003). An experimental evaluation of recovery management checkups (RMC) for people with chronic substance
use disorders. Evaluation and Program Planning, 26(3), 339-352. Dennis, M.L., White, M., Ives, M.I (2009). Individual characteristics and needs associated with substance misuse of adolescents and young adults in
addiction treatment. In Carl Leukefeld, Tom Gullotta and Michele Staton Tindall (Ed.), Handbook on Adolescent Substance Abuse Prevention and Treatment: Evidence-Based Practice. New London, CT: Child and Family Agency Press.

97
Sources and Related Work Epstein, J. F. (2002). Substance dependence, abuse and treatment: Findings from the 2000 National Household Survey on Drug Abuse (NHSDA Series A-
16, DHHS Publication No. SMA 02-3642). Rockville, MD: Substance Abuse and Mental Health Services Administration, Office of Applied Studies. Retrieved from http://www.DrugAbuseStatistics.SAMHSA.gov.
Fowler JS, Volkow ND, Wolf AP, Dewey SL, Schlyer DJ, Macgregor RIR, Hitzemann R, Logan J, Bendreim B, Gatley ST. et al. Synapse 1989;4(4):371-377.
Funk, R. R., McDermeit (Ives), M., Godley, S. H., & Adams, L. (2003). Maltreatment issues by level of adolescent substance abuse treatment: The extent of the problem at intake and relationship to early outcomes. Journal of Child Maltreatment, 8, 36-45.
Godley, S. H., Dennis, M. L., Godley, M. D., & Funk, R. R. (2004). Thirty-month relapse trajectory cluster groups among adolescents discharged from outpatient treatment. Addiction, 99(2 suppl), 129-139.
Godley, M. D., Godley, S. H., Dennis, M. L., Funk, R., & Passetti, L. L. (2002). A randomized field trial of an assertive aftercare protocol for adolescents following discharge from residential substance abuse treatment: Preliminary Outcomes. Journal of Substance Abuse Treatment, 23(1), 21-32.
Godley, M.D., Godley, S.H., Dennis, M.L., Funk, R.R., & Passetti, L.L. (2007). The Effect of Assertive Continuing Care on Continuing Care Linkage, Adherence, and Abstinence Following Residential Treatment for Adolescents. Addiction, 102(1), 81-92.
Godley, M.D., Kahn, J.H., Dennis, M.L., Godley, S.H., & Funk, R.R. (2005). The stability and impact of environmental factors on substance use and problems after adolescent outpatient treatment. Psychology of Addictive Behaviors, 19(1), 62-70.
Lipsey, M. W. (1997). What can you build with thousands of bricks? Musings on the cumulation of knowledge in program evaluation. New Directions for Evaluation, 76, 7-23.
Lipsey, M. W. (2005). What works with juvenile offenders: Translating research into practice. Paper presented at the Adolescent Treatment Issues Conference, Tampa.
Lipsey, M. W., Chapman, G. L., & Landenberger, N. A. (2001). Cognitive-behavioral programs for offenders. The Annals of the American Academy of Political and Social Science, 578, 144-157.
Marlowe, D. (2008). Recent studies of drug courts and DWI courts: Crime reduction and cost savings. National Institute on Drug Abuse (2000). Principles of Drug Addiction Treatment: A Research-Based Guide. Rockville, MD: Author. NIH Publication
No.00-4180 . On line at http://www.drugabuse.gov/PODAT/PODATIndex.html

98
Sources and Related Work National Institute on Drug Abuse (2006). Principles of Drug Abuse Treatment for Criminal Justice Populations: A Research-Based Guide.
Rockville, MD: Author. NIH Publication No. 06-5316. On line at http://www.drugabuse.gov/PODAT_CJ/ Office Applied Studies (2002). Analysis of the 2002 National Survey on Drug Use and Health (NSDUH) on line at
http://webapp.icpsr.umich.edu/cocoon/ICPSR-SERIES/00064.xml . Office Applied Studies (2002). Analysis of the 2002 Treatment Episode Data Set (TEDS) on line data at
http://webapp.icpsr.umich.edu/cocoon/ICPSR-SERIES/00056.xml ) Office of Applied Studies (OAS; 2005). Treatment Episode Data Set (TEDS): 2002. Discharges from Substance Abuse Treatment Services,
DASIS Series: S-25, DHHS Publication No. (SMA) 04-3967, Rockville, MD: Substance Abuse and Mental Health Services Administration. Retrieved from http://wwwdasis.samhsa.gov/teds02/2002_teds rptd.pdf .
Office of Applied Studies (2006). Results from the 2005 National Survey on Drug Use and Health: National Findings Rockville, MD: Substance Abuse and Mental Health Services Administration. http://www.oas.samhsa.gov/NSDUH/2k5NSDUH/2k5results.htm#7.3.1
Riley, B. B., Conrad, K. J., Bezruczko, N., & Dennis, M. (2007). Relative precision, efficiency and construct validity of different starting and stopping rules for a Computerized Adaptive Test: The GAIN Substance Problem Scale. Journal of Applied Measurement, 8(1), 48-64.
Riley, B.B.,, Scott, C.K, & Dennis, M.L. (2008). The effect of recovery management checkups on transitions from substance use to substance abuse treatment and from treatment to recovery. Poster presented at the UCLA Center for Advancing Longitudinal Drug Abuse Research Annual Conference, August 13-15, 2008, Los Angless, CA. www.caldar.org .
Rush, B., Dennis, M.L., Scott, C.K, Castel, S., & Funk, R.R. (2008). The Interaction of Co-Occurring Mental Disorders and Recovery Management Checkusp on Treatment Participation and Recovery.
Scott, C. K., & Dennis, M. L. (in press). Results from Two Randomized Clinical Trials evaluating the impact of Quarterly Recovery Management Checkups with Adult Chronic Substance Users. Addiction.
Scott, C. K., Dennis, M. L., & Foss, M. A. (2005). Utilizing recovery management checkups to shorten the cycle of relapse, treatment re-entry, and recovery. Drug and Alcohol Dependence, 78, 325-338.

99
Sources and Related WorkScott, C. K., Dennis, M. L., & Funk, R.R. (2008). Predicting the relative risk of death over 9
years based on treatment completion and duration of abstinence . Poster 119 at the College of Problems on Drug Dependence (CPDD) Annual Meeting, San Juan, PR, June 16, 2008. Available at www.chestnut.org/li/posters .
Scott, C. K., Foss, M. A., & Dennis, M. L. (2005). Pathways in the relapse, treatment, and recovery cycle over three years. Journal of Substance Abuse Treatment, 28, S61-S70.
Volkow ND, Hitzemann R, Wang C-I, Fowler IS, Wolf AP, Dewey SL. Long-term frontal brain metabolic changes in cocaine abusers. Synapse 11:184-190, 1992;
Volkow ND, Fowler JS, Wang G-J, Hitzemann R, Logan J, Schlyer D, Dewey 5, Wolf AP. Decreased dopamine D2 receptor availability is associated with reduced frontal metabolism in cocaine abusers. Synapse 14:169-177, 1993.
Waldron, H., Turner, C. (in press). Psychosocial Treatments for Adolescent Substance Abuse: A Review and Meta-Analyses . Journal of Clinical Child & Adolescent Psychology