adding inter-event capabilities to the linux trace event ... · 6 background –trace events...
TRANSCRIPT

1
Adding Inter-event Capabilities to the
Linux Trace Event Subsystem
Tom Zanussi
Intel Open Source Technology Center
Safety Critical Systems
ELC 2017, Feb 22

2
Trace Events Background
Latency Example
Design and Interface
Conclusion
Future Plans
Questions

3
Background – Trace Events
•Linux has a large set of ‘trace events’
• Important places in the kernel where data can be logged to an in-memory buffer
•There are hundreds of events, grouped into subsystems:
# cat /sys/kernel/debug/tracing/events/kmem/kmalloc/format
format:
field:unsigned char common_preempt_count; offset:3; size:1; signed:0;
field:int common_pid; offset:4; size:4; signed:1;
field:unsigned long call_site; offset:16; size:8; signed:0;
field:size_t bytes_req; offset:32; size:8; signed:0;
field:size_t bytes_alloc; offset:40; size:8; signed:0;
root:/sys/kernel/debug/tracing/events# ls
block filemap module timer cgroup gpio hda napi sched kmem
net scsi sock workqueue drm i2c pagemap i915 power iommu
synthetic irq random syscall task thermal
•Every event has a ‘format’ file describing each event field:

4
Background – Trace Event Subsystem (cont’d)
•An event or set of events can be ‘enabled’, which will log the given event(s)
• The default destination for events is the ftrace buffer at /sys/kernel/debug/tracing/trace
# echo 1 > /sys/kernel/debug/tracing/events/sched/enable
# cat /sys/kernel/debug/tracing/trace
bash-5141 [004] d...2.. 21721.488735: sched_switch: prev_comm=bash prev_pid=5141
prev_prio=120 prev_state=D ==> next_comm=swapper/4 next_pid=0 next_prio=120
<idle>-0 [001] dN..3.. 21721.490873: sched_wakeup: comm=ktimersoftd/1 pid=21 prio=98
ktimersoftd/1-21 [001] d...2.. 21721.490909: sched_switch: prev_comm=ktimersoftd/1
prev_pid=21 prev_prio=98 prev_state=S ==> next_comm=swapper/1 next_pid=0 next_prio=120

5
Background – Trace Events (cont’d)
kworker/u16:0-5621 [000] d..3 26386.740299: sched_wakeup: comm=gnome-terminal- pid=2079 prio=120
kworker/u16:0-5621 [000] .... 26386.740300: workqueue_execute_end: work struct ffff8d0745745208
kworker/u16:0-5621 [000] d..1 26386.740301: rcu_utilization: Start context switch
kworker/u16:0-5621 [000] d..1 26386.740302: rcu_utilization: End context switch
<idle>-0 [000] d..1 26386.740307: tick_stop: success=1 dependency=NONE
<idle>-0 [000] d..2 26386.740307: hrtimer_cancel: hrtimer=ffff8d079e2118a0
<idle>-0 [000] d..2 26386.740308: write_msr: 6e0, value 3bd492a3e6a3
Xorg-844 [000] ...1 26386.750751: sys_setitimer(which: 0, value: 7ffe599201c0, ovalue: 0)
Xorg-844 [000] d..1 26386.750755: itimer_state: which=0 expires=0 it_value=0.5000 it_interval=0.5000
Xorg-844 [000] ...1 26386.750756: sys_setitimer -> 0x0
Xorg-844 [000] .... 26386.750756: sys_exit: NR 38 = 0
Xorg-844 [000] .... 26386.750761: sys_enter: NR 47 (2f, 7ffe599201a0, 0, 75a922, 1000, 1)
Xorg-844 [000] ...1 26386.750762: sys_recvmsg(fd: 2f, msg: 7ffe599201a0, flags: 0)
Xorg-844 [000] .... 26386.750766: skb_copy_datagram_iovec: skbaddr=ffff8d073a013300 len=24
Xorg-844 [000] .... 26386.750768: consume_skb: skbaddr=ffff8d073a013300
Xorg-844 [000] .... 26386.750770: kfree: call_site=ffffffffbba5f2fe ptr=ffff8d06c2c94a00
Xorg-844 [000] .... 26386.750772: kmem_cache_free: call_site=ffffffffbba5f0d6 ptr=ffff8d073a013300
Xorg-844 [000] .... 26386.750773: kfree: call_site=ffffffffbba58730 ptr= (null)
Xorg-844 [000] ...1 26386.750773: sys_recvmsg -> 0x18
Xorg-844 [000] .... 26386.750773: sys_exit: NR 47 = 24
Xorg-844 [000] .... 26386.750786: sys_enter: NR 20 (2f, 7ffe59920320, 1, 0, 1, 20)
Xorg-844 [000] ...1 26386.750786: sys_writev(fd: 2f, vec: 7ffe59920320, vlen: 1)
Xorg-844 [000] d..2 26386.750794: sched_wakeup comm=firefox pid=2448 prio=120
sched_wakeup
sys_enter
kfree
consume_skb

6
Background – Trace Events (cont’d)
•But events don’t have to just log data – they can also ‘trigger’ actions
• ‘event trigger’ actions can be things like ‘dump a stacktrace’, ‘take a snapshot’, ‘enable another event’
•‘hist triggers’ add event data to a histogram instead of logging it to the trace buffer
# echo 'hist:key=common_pid.execname:val=count:sort=count.descending' > \
/sys/kernel/debug/tracing/events/syscalls/sys_enter_read/trigger
# cat /sys/kernel/debug/tracing/events/syscalls/sys_enter_read/hist
{ common_pid: gnome-terminal [ 3196] } hitcount: 280 count: 1093512
{ common_pid: Xorg [ 1309] } hitcount: 525 count: 256640
{ common_pid: compiz [ 2889] } hitcount: 59 count: 254400
{ common_pid: gmain [ 8704] } hitcount: 2 count: 32
...
{ common_pid: gdbus [ 2998] } hitcount: 1 count: 16
{ common_pid: rtkit-daemon [ 2052] } hitcount: 1 count: 8
{ common_pid: init [ 1] } hitcount: 2 count: 2

7
Background – Trace Events (cont’d)
Xorg-844 [000] ...1 26386.750751: sys_setitimer(which: 0, value: 7ffe599201c0, ovalue: 0)
Xorg-844 [000] d..1 26386.750755: sys_read (fd: c, buf: 7ffcbdfa2070, count: 18)
Xorg-844 [000] ...1 26386.750756: sys_setitimer -> 0x0
Xorg-844 [000] .... 26386.750756: sys_exit: NR 38 = 0
Xorg-844 [000] .... 26386.750761 sys_read (fd: c, buf: 7ffcbdfa2070, count: 18)
Xorg-844 [000] ...1 26386.750762: sys_recvmsg(fd: 2f, msg: 7ffe599201a0, flags: 0)
Xorg-844 [000] .... 26386.750766: skb_copy_datagram_iovec: skbaddr=ffff8d073a013300 len=24
Xorg-844 [000] .... 26386.750770: kfree: call_site=ffffffffbba5f2fe ptr=ffff8d06c2c94a00
bash-134 [000] .... 26386.750772: sys_read (fd: c, buf: 7ffcbdfa2070, count: 18)
bash-134 [000] .... 26386.750773: kfree: call_site=ffffffffbba58730 ptr= (null)
bash-134 [000] .... 26386.750773: sys_exit: NR 47 = 24
bash-134 [000] .... 26386.750786: sys_read (fd: c, buf: 7ffcbdfa2070, count: 18)
Xorg-844 [000] .... 26386.750761 sys_read (fd: c, buf: 7ffcbdfa2070, count: 18)
Xorg-844 [000] ...1 26386.750762: sys_recvmsg(fd: 2f, msg: 7ffe599201a0, flags: 0)
bash-134 [000] .... 26386.750772: sys_read (fd: c, buf: 7ffcbdfa2070, count: 18)
sys_enter_read
common_pid 844 count 32
common_pid 134 count 256
common_pid 77 count 1446
common_pid 7689 count 9654
common_pid 324 count 16256
common_pid 788 count 765869
hist

8
Inter-event Quantities
•We can get a lot of useful data by summarizing a single event i.e. intra-event
• But we can’t accomplish this very simple and common tracing pattern, calculating latencies:
event sched_wakeup()
{
timestamp[wakeup_pid] = now();
}
event sched_switch()
{
if (timestamp[next_pid])
latency = now() – timestamp[next_pid] /* next_pid == wakeup_pid */
wakeup_latency[next_pid] = latency
timestamp[next_pid] = null
}

9
Latency Example
cyclictest cyclictest
time

10
Latency Example
sleepcyclictest cyclictest
sys_nanosleep_enter
time

11
Latency Example
sleepcyclictest cyclictest
sys_nanosleep_enter
sched_wakeup
time

12
Latency Example
sleepcyclictest cyclictest
sys_nanosleep_enter
sched_wakeup sched_switch
time
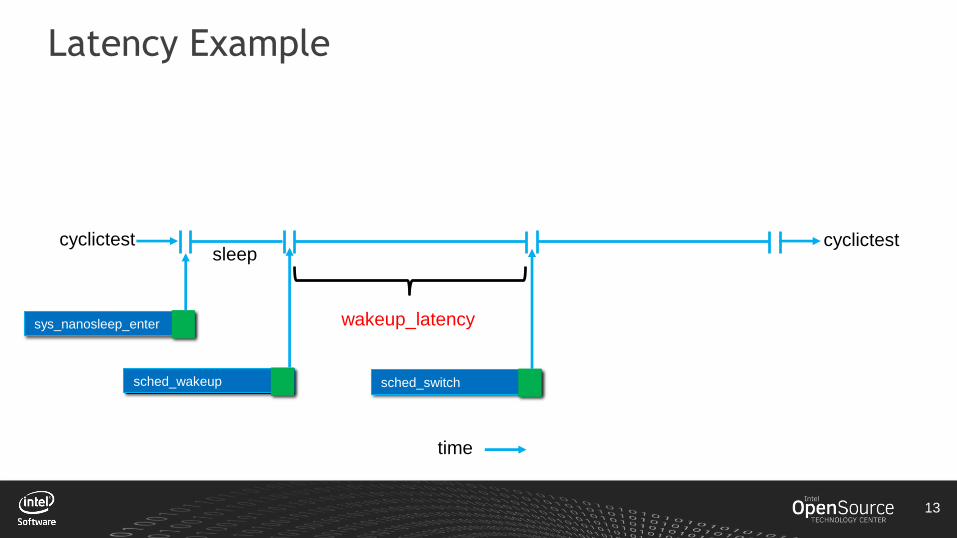
13
Latency Example
wakeup_latency
sleepcyclictest cyclictest
sys_nanosleep_enter
sched_wakeup sched_switch
time

14
Latency Example
wakeup_latency
sleepcyclictest cyclictest
sys_nanosleep_enter
sched_wakeup sched_switch sys_nanosleep_exit
wakeupswitch_latency
switchtime_latency
time
15
The Problem
•The Trace Event subsystem doesn’t do latencies
• Strictly intra-event while latencies are inter-event
• Latencies are one of the top uses of Trace Events
• The –RT patchset latency_hist is one example
•There are some external tools can calculate and use latencies
• But they all require extra languages and runtimes
• Not practicable for many embedded systems
•But we should be able to do that within the Trace Event subsystem
• ‘commoditize’ latency pattern

16
The Solution
•A few inter-event enhancements:
• Variables - calculate and save multi-event quantities
• Synthetic Events - gather and encapsulate those quantities
• ‘Actions’ - inject those quantities seamlessly back into the event subsystem
•These provide a ‘glue’ layer connecting events
• Enable a trivially ‘wireable’ inter-event mechanism

17
Variables and Simple Expressions
•Latency requires 2 events:
• Event #1: save ‘start’ value
• Event #2: ‘end’ value
• Retrieve ‘start’ value and subtract from ‘end’ value
•How do we retrieve start value?
• Hash table => hist trigger

18
Variables on matching events (key = pid)
sched_wakeup ts0
common_pid 844 ts0
common_pid 77 ts0
common_pid 7689 ts0
common_pid 324 ts0
common_pid 788 ts0
sched_switch ts1 lat
ts0
ts0 ts1
Wakeup latency
common_pid 844 ts1
common_pid 77 ts1
common_pid 7689 ts1
common_pid 324 ts1
common_pid 788 ts1
common_pid 134 ts0 common_pid 134 ts1ts1 – ts0
lat
lat
lat
lat
lat
lat ts1 lat
lat

19
Variables (cont’d)
•Variables can be defined for keys or values of any event
•They’re referenced by ‘matching’ events = same key
• They can be operated on by simple expressions (+ or -)
# echo 'hist:keys=pid:ts0=common_timestamp.usecs' >> \
/sys/kernel/debug/tracing/events/sched/sched_wakeup/trigger
# echo 'hist:keys=woken_pid=next_pid:wakeup_lat=common_timestamp.usecs-$ts0' >> \
/sys/kernel/debug/tracing/events/sched/sched_switch/trigger
•common_timestamp is a new field available for all events
• In nanosec units by default, .usecs can be appended for microseconds

20
Synthetic Events
•A latency histogram is derived from 2 events
•But the ‘hist’ file doesn’t belong to either – where should it live?
•sys/kernel/debug/tracing/events/???/hist
•Answer: on user-defined ‘synthetic’ events
• Derived from the variables of other events
• Full-fledged trace event in every other way
•sys/kernel/debug/tracing/events/synthetic/myevent/hist

21
Synthetic Events (cont’d)
sched_wakeup ts0
sched_switch ts1wakeup_lat
wakeup_latency wakeup_lat woken_pid
woken_pid

22
Synthetic Events (cont’d)
sched_wakeup ts0
pid 844 lat 8
pid 77 lat 124
pid 7689 lat 9
pid 324 lat 45
pid 788 lat 1316
sched_switch ts1wakeup_lat
wakeup_latency wakeup_lat woken_pid
woken_pid
h
i
s
t
common_pid 844ts0
common_pid 77ts0
common_pid 7689ts0
common_pid 324ts0
common_pid 788ts0
common_pid 844ts1
common_pid 77ts1
common_pid 7689ts1
common_pid 324ts1
common_pid 788ts1
common_pid 134ts0common_pid 134ts1 pid 134 lat 13
_ =

23
Synthetic Events (cont’d)
•A synthetic event is simply a user-defined event that combines variables from other events
# echo 'wakeup_latency \
int pid
u64 lat' >> \
/sys/kernel/debug/tracing/synthetic_events
# cat /sys/kernel/debug/tracing/synthetic_events
wakeup_latency int pid, u64 lat
my_other_latency int ppid, int prio, u64 lat
•You can create a histogram for it just like any other event
# echo 'hist:keys=pid,lat.log2:sort=pid,lat' >> \
/sys/kernel/debug/tracing/events/synthetic/wakeup_latency/trigger

24
hist trigger ‘actions’
•We know how a synthetic event is created, but what fires it off?
•An ‘action’ invoked on any match
• This one traces a synthetic event (like trace_xxx for static tracepoints):
onmatch(sched_wakeup).wakeup_latency(next_pid,$wakeup_lat)
•Other actions include one that saves context when a new max is hit
• yyy
echo 'hist:keys=next_pid:wakeup_lat=common_timestamp.usecs-$ts0: \
onmatch(sched_wakeup).wakeup_latency(next_pid,$wakeup_lat) >> \
/sys/kernel/debug/tracing/events/sched/sched_switch/trigger
•When a match occurs e.g. wakeup_lat finds $ts0 we can generate the event
onmax($latency).save(field1,field2,...)

25
Tying it all together – wakeup_latency
•First create the wakeup_latency synthetic event:
echo 'wakeup_latency lat pid prio' >> /sys/kernel/debug/tracing/synthetic_events
echo 'hist:keys=pid:ts0=common_timestamp.usecs if comm=="cyclictest"' >> \
/sys/kernel/debug/tracing/events/sched/sched_wakeup/trigger
•Next, define ts0 to save the timestamp on the sched_wakeup event:
echo 'hist:keys=next_pid:wakeup_lat=common_timestamp.usecs-$ts0: \
onmatch(sched_wakeup).wakeup_latency(next_pid,next_prio,$wakeup_lat) >> \
/sys/kernel/debug/tracing/events/sched/sched_switch/trigger
•Next, generate a wakeup_latency event from the sched_switch event:
•Finally, create a histogram on the wakeup_latency synthetic event:
echo 'hist:keys=pid,prio,lat' >> tracing/events/synthetic/wakeup_latency/trigger

26
wakeup_latency histogram output
# cat /sys/kernel/debug/tracing/events/synthetic/wakeup_latency/hist
{ pid: 2519, prio: 120, lat: 1 } hitcount: 12
{ pid: 2519, prio: 120, lat: 2 } hitcount: 671
{ pid: 2519, prio: 120, lat: 3 } hitcount: 588
{ pid: 2519, prio: 120, lat: 4 } hitcount: 202
{ pid: 2519, prio: 120, lat: 5 } hitcount: 28
{ pid: 2519, prio: 120, lat: 6 } hitcount: 13
...
{ pid: 2519, prio: 120, lat: 19 } hitcount: 2
{ pid: 2519, prio: 120, lat: 22 } hitcount: 2
{ pid: 2519, prio: 120, lat: 23 } hitcount: 1
{ pid: 2521, prio: 19, lat: 1 } hitcount: 735
{ pid: 2521, prio: 19, lat: 2 } hitcount: 8978
{ pid: 2521, prio: 19, lat: 3 } hitcount: 4798
...
{ pid: 2521, prio: 19, lat: 18 } hitcount: 1
{ pid: 2521, prio: 19, lat: 20 } hitcount: 2
{ pid: 2521, prio: 19, lat: 25 } hitcount: 1
{ pid: 2521, prio: 19, lat: 26 } hitcount: 1
{ pid: 2522, prio: 19, lat: 1 } hitcount: 392

27
Conclusions
•Inter-event capabilities are a natural and useful enhancement to Trace Events
•Enable non-programmatic access to a common tracing pattern
• Important quality for embedded
•Logically equivalent to bread-boarding non-compute components
•Lightweight layer for building straightforward latency applications
•latency_hist
•latency_anything
•anything_hist
28
Future Plans
•Not many
• The echo-based trigger syntax is close to its breaking point
• A few more ‘actions’ e.g. onmax().snapshot(), onmax().stacktrace()
•Applications
• Implement –RT latency_hist
• Integration with trace-cmd?

Q & A