adding richness to measurement
DESCRIPTION
Adding Richness to Measurement. A Case for Developing and Using Complex Measures. Data is Not Information The Search for Meaning in Measures. Meaning and Methodology - the Medium is the Message Multiple Users/Stakeholders Reporting Versus Quantitative Analysis Measuring Complex Outcomes - PowerPoint PPT PresentationTRANSCRIPT
Adding Richness to Adding Richness to MeasurementMeasurement
A Case for Developing and A Case for Developing and Using Complex MeasuresUsing Complex Measures

Data is Not InformationData is Not Information The Search for Meaning in MeasuresThe Search for Meaning in Measures
Meaning and MethodologyMeaning and Methodology - the Medium - the Medium isis the Messagethe Message
Multiple Users/StakeholdersMultiple Users/Stakeholders
Reporting Versus Quantitative AnalysisReporting Versus Quantitative Analysis
Measuring Complex OutcomesMeasuring Complex Outcomes
Enterprise-Level ActivitiesEnterprise-Level Activities

Complexity - Multiple StakeholdersComplexity - Multiple Stakeholders
The PublicThe Public Other Agencies - Other Agencies -
Entities Entities BudgetingBudgeting Program Funding Program Funding
OutcomesOutcomes Policy Decision Policy Decision
OutcomesOutcomes Evaluating Agency - Evaluating Agency -
Vendor Vendor PerformancePerformance
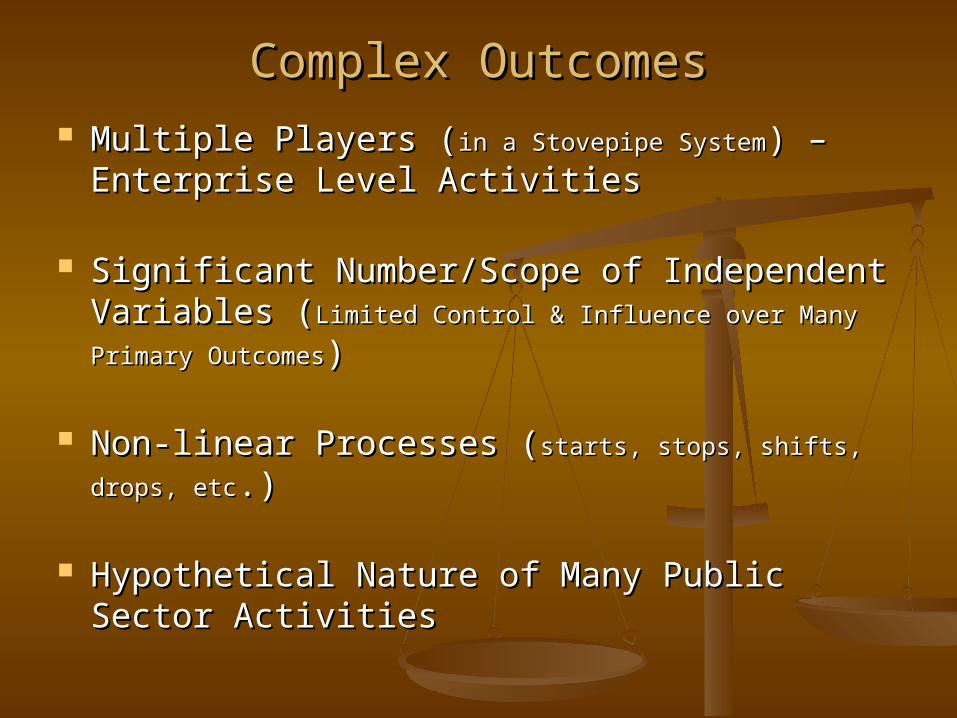
Complex OutcomesComplex Outcomes Multiple Players (Multiple Players (in a Stovepipe Systemin a Stovepipe System) – ) –
Enterprise Level ActivitiesEnterprise Level Activities
Significant Number/Scope of Independent Significant Number/Scope of Independent Variables (Variables (Limited Control & Influence over Many Primary Limited Control & Influence over Many Primary
OutcomesOutcomes))
Non-linear Processes (Non-linear Processes (starts, stops, shifts, drops, starts, stops, shifts, drops,
etcetc.).)
Hypothetical Nature of Many Public Sector Hypothetical Nature of Many Public Sector ActivitiesActivities
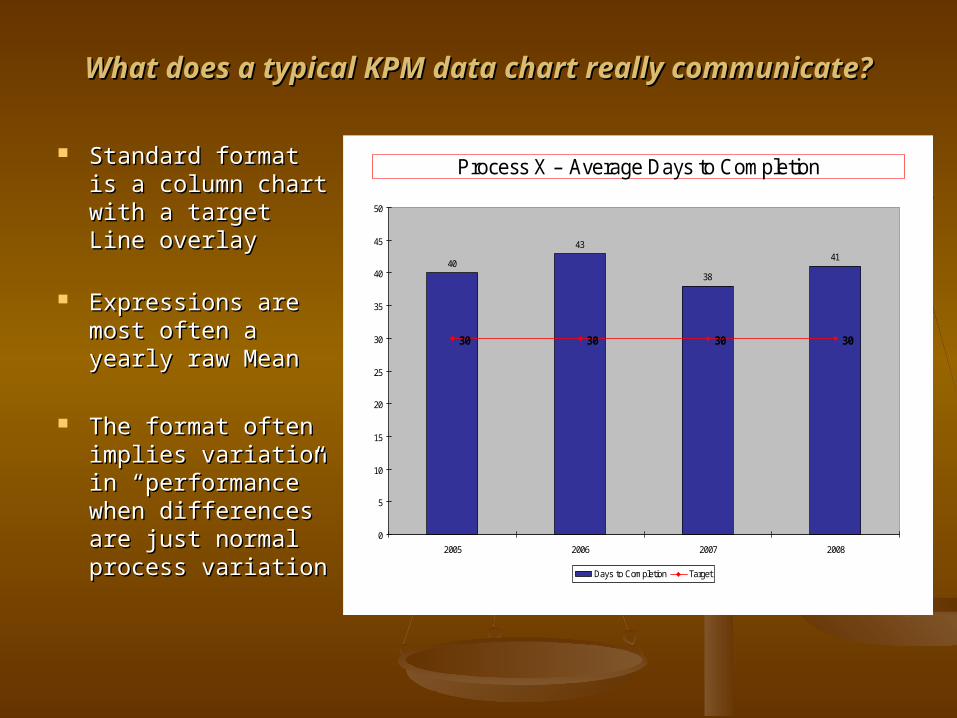
What does a typical KPM data chart really communicate?What does a typical KPM data chart really communicate?
Standard format Standard format is a column chart is a column chart with a target Line with a target Line overlay overlay
Expressions are Expressions are most often a most often a yearly raw Meanyearly raw Mean
The format often The format often implies variation implies variation in “performance” in “performance” when differences when differences are just normal are just normal process variationprocess variation
Process X – Average Days to Completion
40
43
38
41
30 30 30 30
0
5
10
15
20
25
30
35
40
45
50
2005 2006 2007 2008
Days to Completion Target
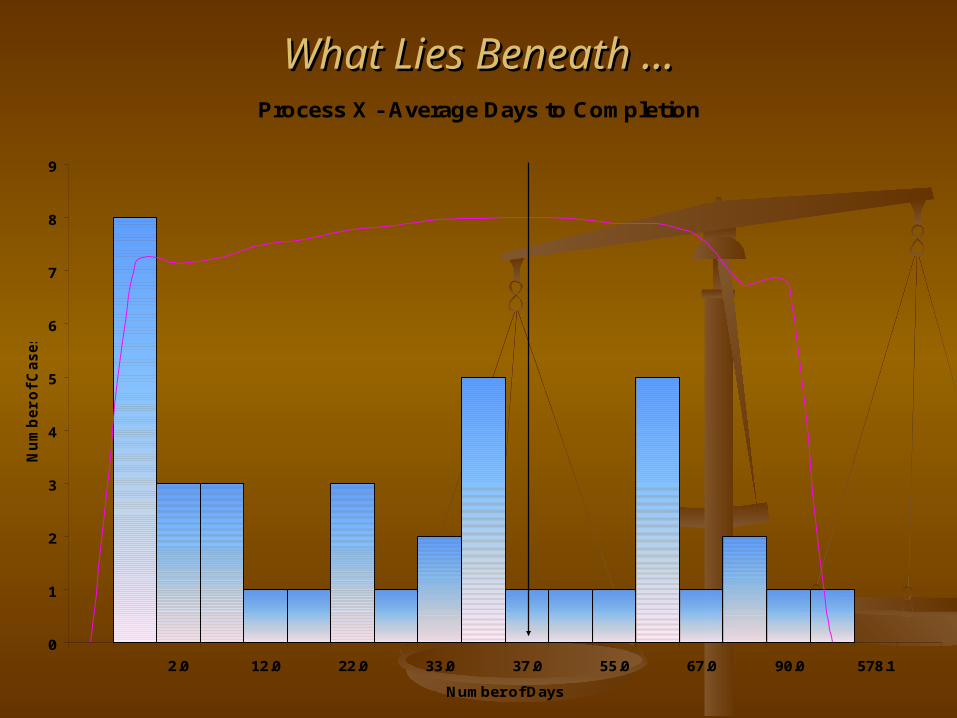
What Lies Beneath …What Lies Beneath …Process X - Average Days to Completion
0
1
2
3
4
5
6
7
8
9
2.0 12.0 22.0 33.0 37.0 55.0 67.0 90.0 578.1
Number of Days
Nu
mb
er
of
Ca
se
s
Mean 41.3Median 29.0Mode 1.0
Stdev 81.2Min 1.0Max 514.0
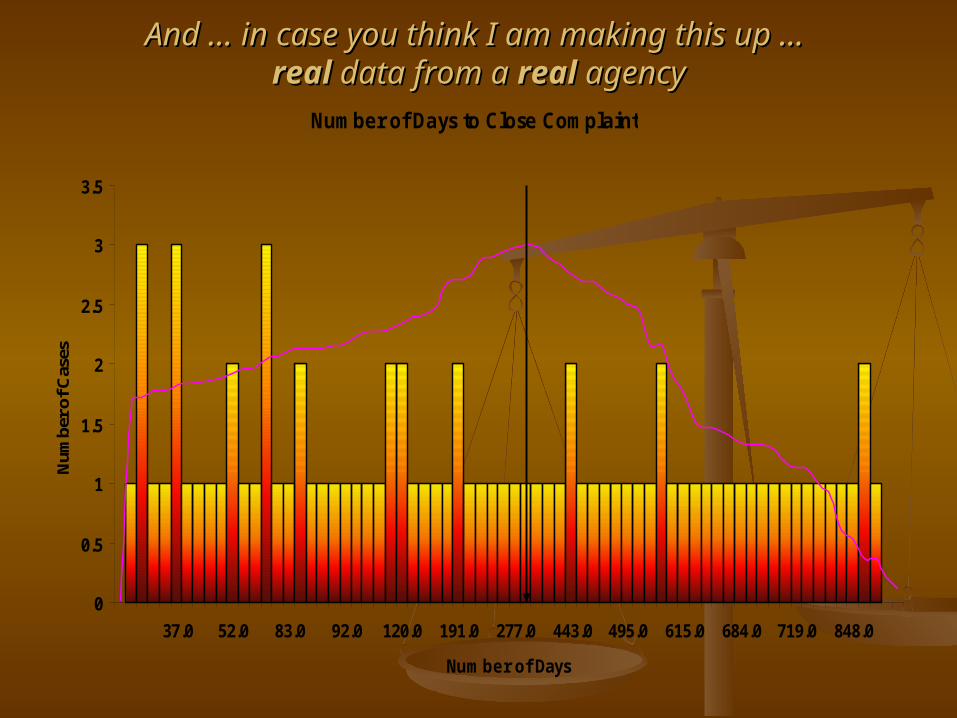
And … in case you think I am making this up … And … in case you think I am making this up … real real data from a data from a realreal agency agency
Number of Days to Close Complaint
0
0.5
1
1.5
2
2.5
3
3.5
37.0 52.0 83.0 92.0 120.0 191.0 277.0 443.0 495.0 615.0 684.0 719.0 848.0
Number of Days
Num
ber o
f Cas
es
Mean 321.7Median 191.0
Mode 71.0
Stdev 283.5Min 17.0Max 904.0

And you find out things about your process you didn’t know before …And you find out things about your process you didn’t know before …
Phase One - Normalized Distribution
0
10
20
30
40
50
60
70
80
90
100
Days
Num
ber
Mean 64.9Median 66.0
Mode 14.0
Stdev 39.0Min 0.0Max 171.0
Aggregate Measures – Selling PointsAggregate Measures – Selling Points Primary expression is a Primary expression is a singlesingle expression expression
“dashboard” indicator (“dashboard” indicator (Easy to understand – Easy Easy to understand – Easy to trackto track))
Statistically based (Statistically based (mathematically verifiable – easy mathematically verifiable – easy to auditto audit) – immediately useful for process ) – immediately useful for process improvement purposesimprovement purposes
Properly constructed indexes can be “de-Properly constructed indexes can be “de-aggregated” to provide increasingly aggregated” to provide increasingly granular detail back to the original raw granular detail back to the original raw datasetsdatasets
Can combine Can combine different types of datadifferent types of data into into the same measurethe same measure
Aggregate Measures – Selling PointsAggregate Measures – Selling Points Provides a powerful analytic – process improvement Provides a powerful analytic – process improvement
tooltool
Provides more complete, compelling and valid data Provides more complete, compelling and valid data for budget supportfor budget support
Organizations can use a combination of related Organizations can use a combination of related operational operational measures to create a single measures to create a single outcomeoutcome index (index (fewer measures, and little need for multiple part measures in fewer measures, and little need for multiple part measures in
the systemthe system))
Common Indices (Common Indices (Organizational Health, Timeliness of Organizational Health, Timeliness of Process, Process Improvement, Customer Service, etcProcess, Process Improvement, Customer Service, etc.).)
Allows for updating and adjusting measure Allows for updating and adjusting measure components without the need for a formal components without the need for a formal delete/replace (?)delete/replace (?)
Constructing Aggregate MeasuresConstructing Aggregate Measures What is the Outcome?What is the Outcome?
What are the What are the PrimaryPrimary Components of the Components of the Outcome?Outcome?
What are the What are the CriticalCritical Measures of the Measures of the Components?Components?
Normalizing Data – (Normalizing Data – (removing outliers and removing outliers and translating data into a common unit of expressiontranslating data into a common unit of expression))
Weighting ComponentsWeighting Components

Outcomes in the Public SectorOutcomes in the Public Sector
Change in StatusChange in Status Change in CapabilityChange in Capability Client/Customer SatisfactionClient/Customer Satisfaction Process Outcomes – Process Outcomes –
Efficiency/Effectiveness Efficiency/Effectiveness 1. Timeliness1. Timeliness2. Defects (errors, rework)2. Defects (errors, rework)3. Cost Reduction (savings, avoidance)3. Cost Reduction (savings, avoidance)
DEFINED DEFINED OutcomesOutcomes
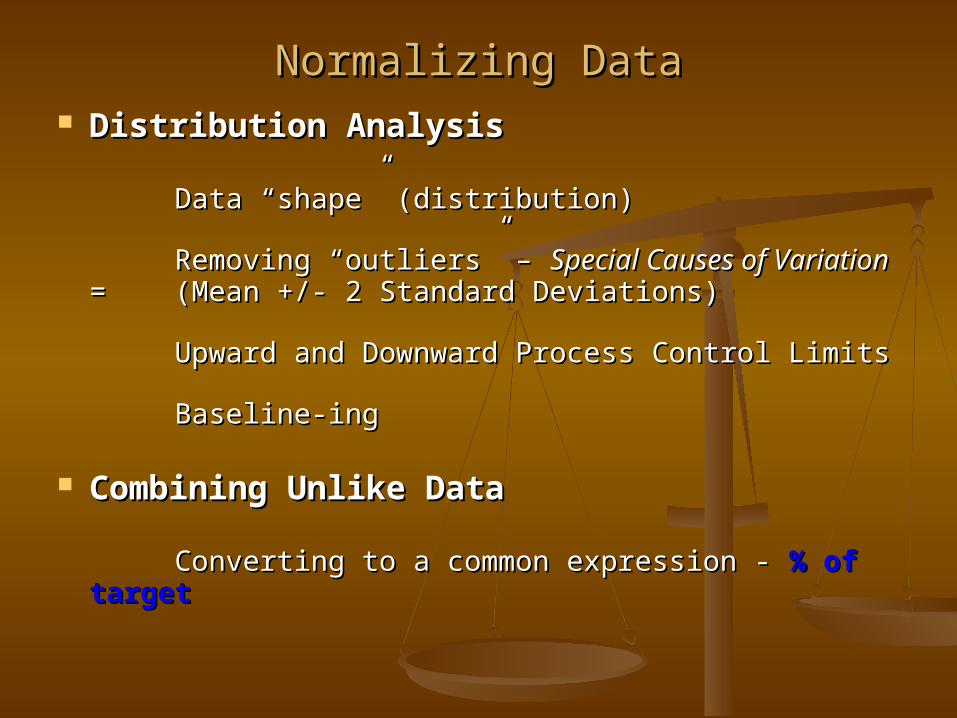
Normalizing DataNormalizing Data Distribution AnalysisDistribution Analysis
Data “shape” (distribution)Data “shape” (distribution)
Removing “outliers” – Removing “outliers” – Special Causes of Special Causes of VariationVariation = = (Mean +/- 2 Standard Deviations)(Mean +/- 2 Standard Deviations)
Upward and Downward Process Control LimitsUpward and Downward Process Control Limits
Baseline-ingBaseline-ing
Combining Unlike Data Combining Unlike Data
Converting to a common expression - Converting to a common expression - % of % of targettarget

Weighting CriteriaWeighting Criteria
Contribution to OutcomeContribution to Outcome ( (HighHigh, , ModerateModerate, ,
LowLow))
CriticalityCriticality ( (DeathDeath, , DismembermentDismemberment, , Skin RashSkin Rash))
FrequencyFrequency ( (ConstantlyConstantly, , SometimesSometimes, , RarelyRarely))
Data ReliabilityData Reliability (. (.9999999999, , OKOK, , Flip a CoinFlip a Coin))

ExamplesExamples
BOLI (BOLI (Bureau of Labor and IndustriesBureau of Labor and Industries) Composite ) Composite Timeliness Measure (Timeliness Measure (Wage and Hour, Civil Wage and Hour, Civil
RightsRights))
Department of Revenue “Taxpayer Department of Revenue “Taxpayer Assistance”Assistance”
DHS-Courts-CCF Shared DHS-Courts-CCF Shared “Permanency of Placement”“Permanency of Placement”
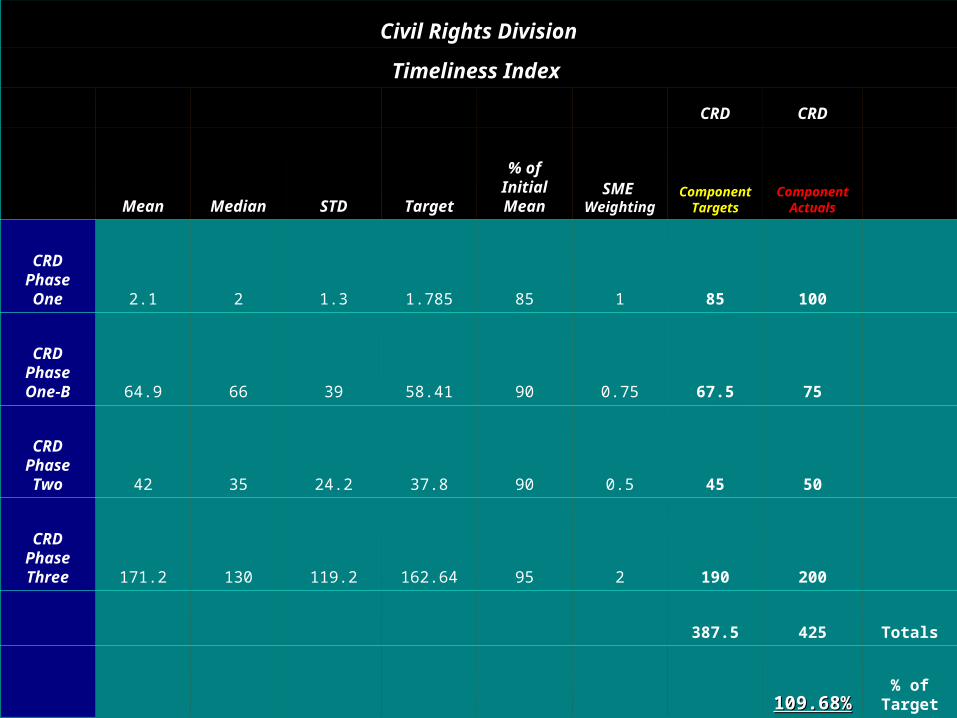
Civil Rights Division
Timeliness Index
CRD CRD
Mean Median STD Target
% of Initial Mean
SME Weighting
Component Targets
Component Actuals
CRD Phase One 2.1 2 1.3 1.785 85 1 85 100
CRD Phase One-B 64.9 66 39 58.41 90 0.75 67.5 75
CRD Phase Two 42 35 24.2 37.8 90 0.5 45 50
CRD Phase Three 171.2 130 119.2 162.64 95 2 190 200
387.5 425 Totals
109.68%109.68%% of
Target

Putting it all TogetherPutting it all Together
Index Components
“Effective Discovery – Disclosure of Legal Records”