adding value in the cloud with performance test
TRANSCRIPT
MySQL, NoSQL & Cloud 2014
Adding Value in the Cloudwith Performance Test
Rodolfo Kohn
Intel Software Argentina
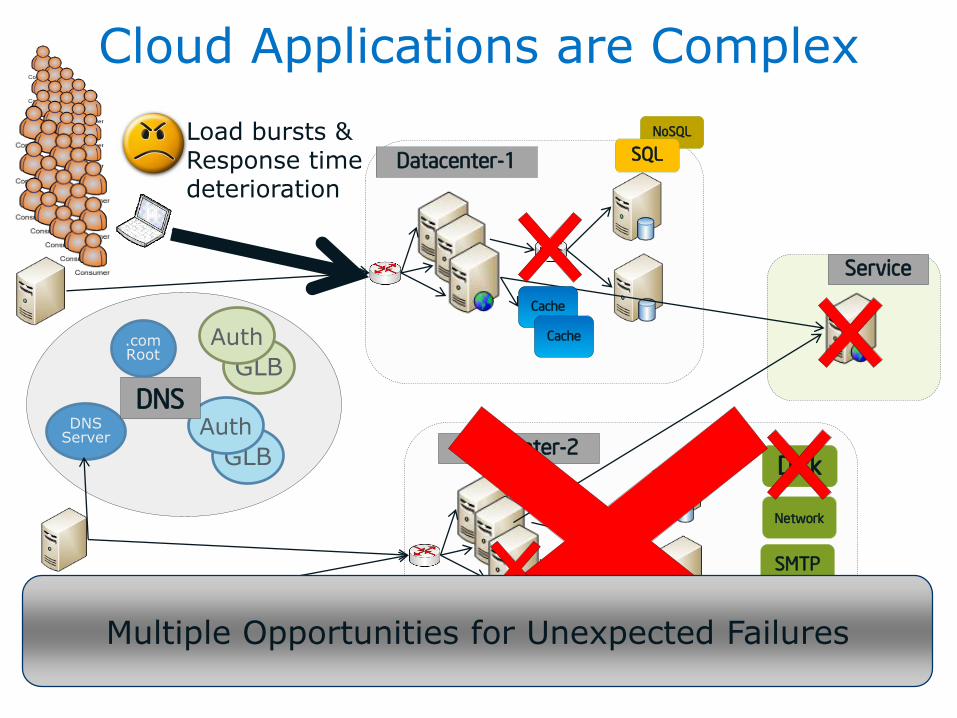
Cloud Applications are Complex
11/24/20142
DNSServer
.com Root
GLB
Auth
Datacenter-1
GLB
Auth
Datacenter-2
Service
Cache
Cache
Cache
Cache
DNS
Disk
Network
SMTP
CDN
NoSQL
SQL
Monitoring Logs Configuration Management
Multiple Opportunities for Unexpected Failures
Load bursts &Response time deterioration
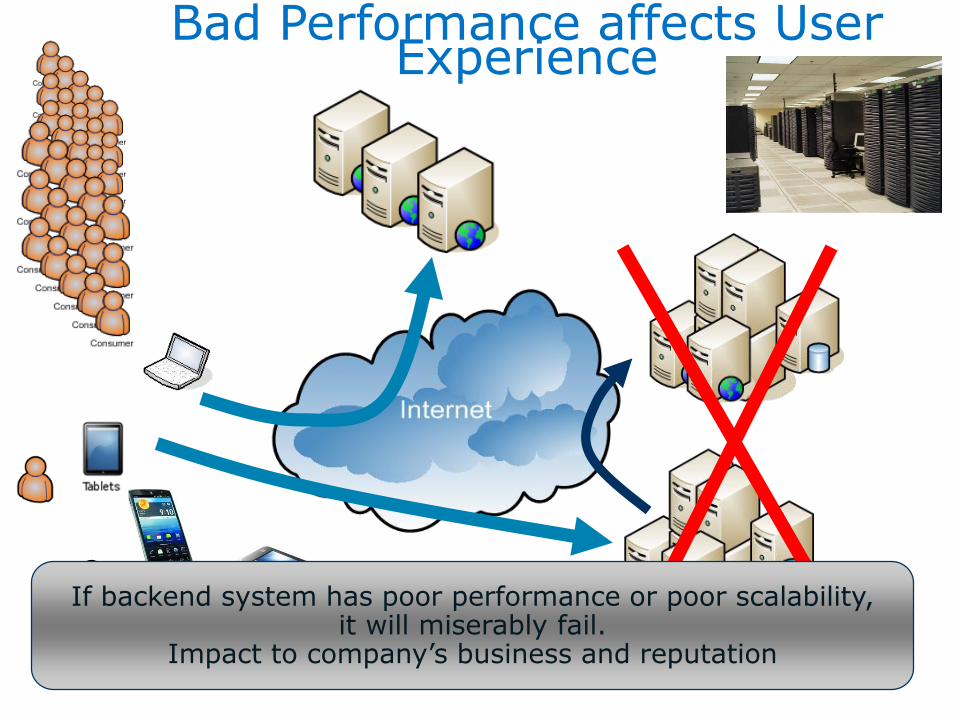
Bad Performance affects User Experience
Consumer
Competitor
Intel® Web Service
Intel® Web Service
If backend system has poor performance or poor scalability, it will miserably fail.
Impact to company’s business and reputation
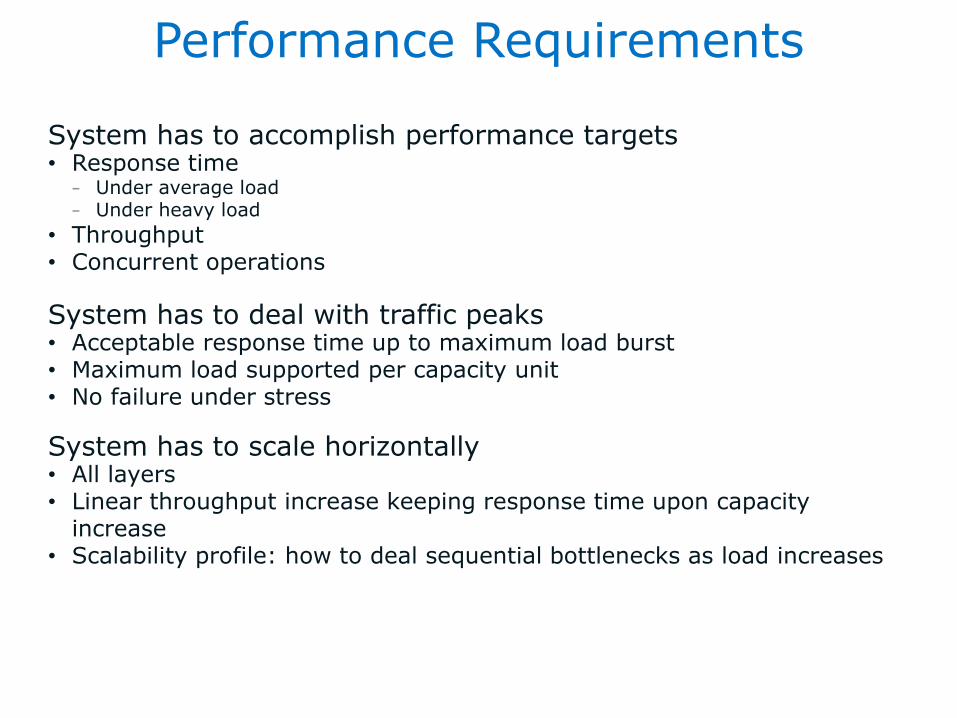
Performance Requirements
System has to accomplish performance targets• Response time
– Under average load– Under heavy load
• Throughput• Concurrent operations
System has to deal with traffic peaks• Acceptable response time up to maximum load burst• Maximum load supported per capacity unit• No failure under stress
System has to scale horizontally• All layers• Linear throughput increase keeping response time upon capacity
increase• Scalability profile: how to deal sequential bottlenecks as load increases
11/24/20144
Availability and Resilience Requirements
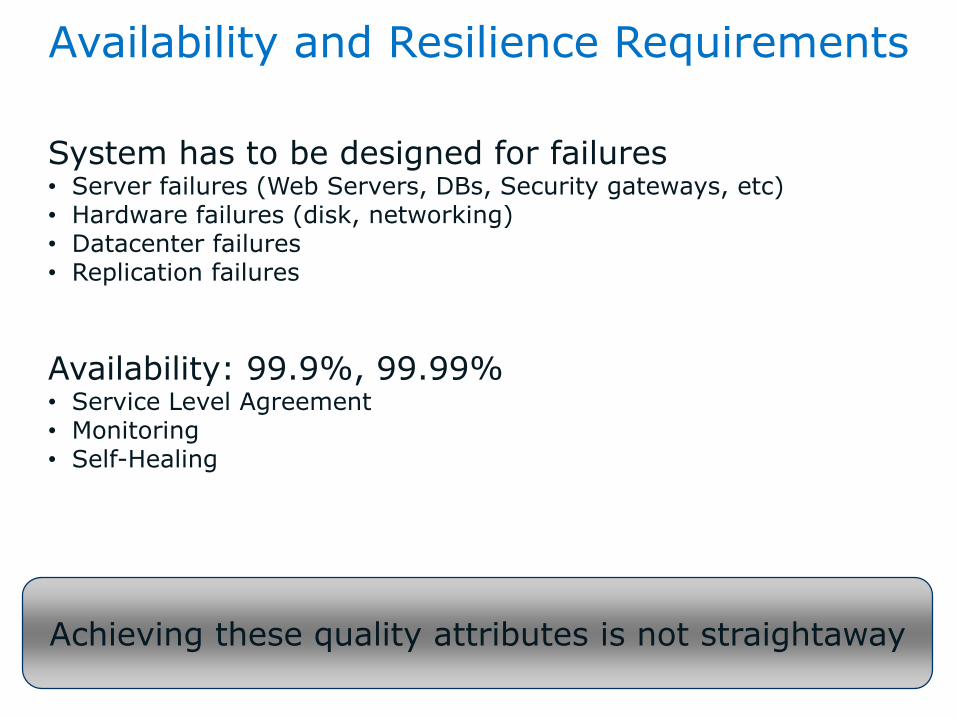
System has to be designed for failures• Server failures (Web Servers, DBs, Security gateways, etc)• Hardware failures (disk, networking)• Datacenter failures• Replication failures
Availability: 99.9%, 99.99%• Service Level Agreement• Monitoring• Self-Healing
11/24/20145
Achieving these quality attributes is not straightaway
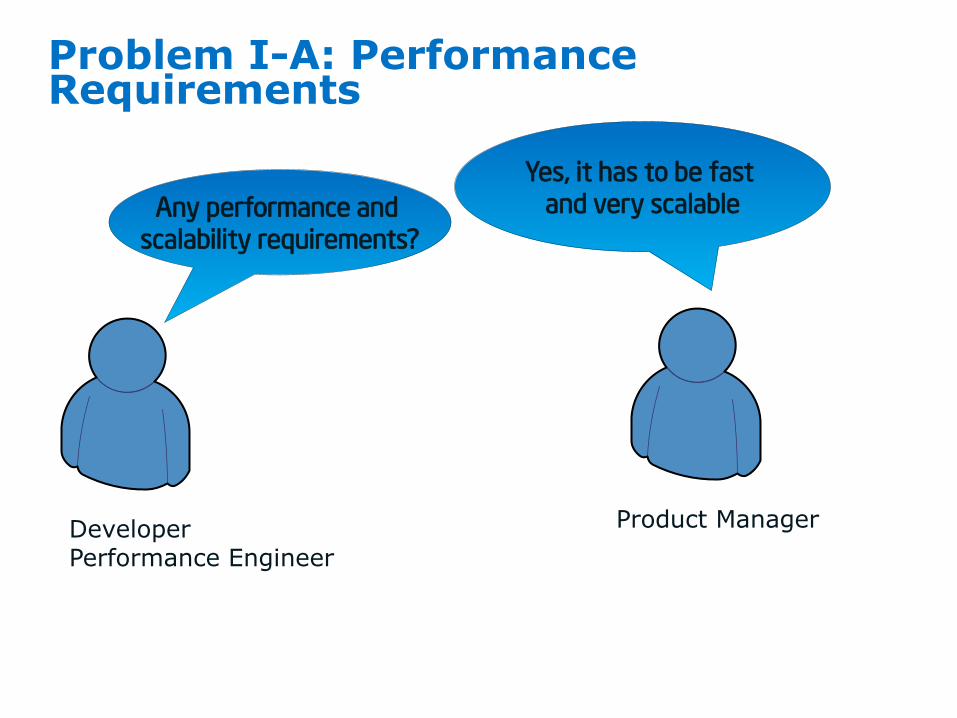
Problem I-A: Performance Requirements
Product ManagerDeveloperPerformance Engineer
Any performance and
scalability requirements?
Yes, it has to be fast and very scalable
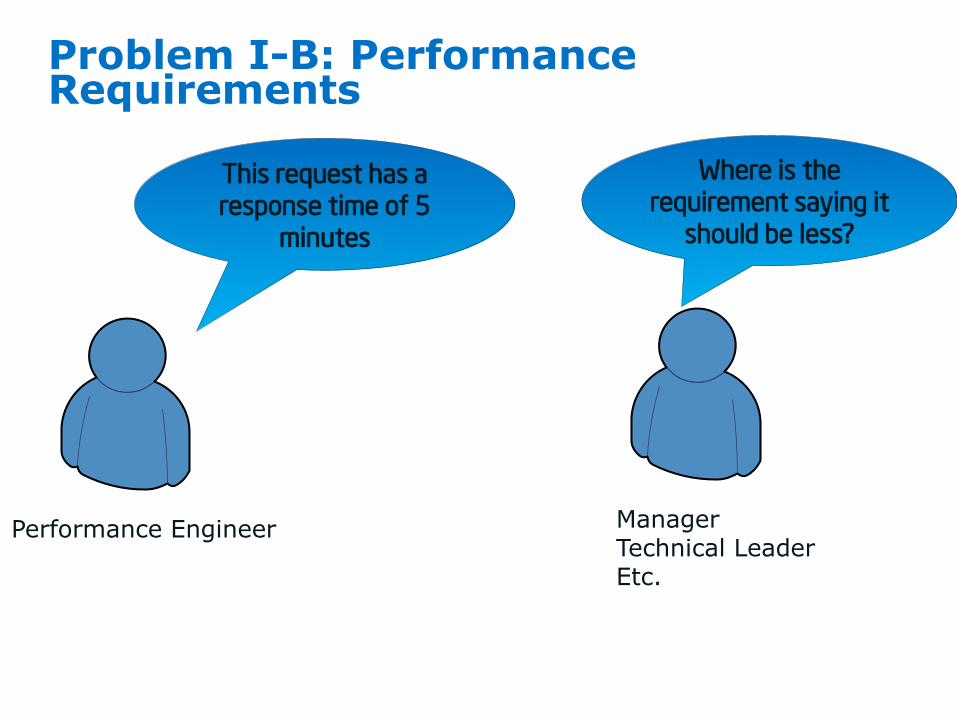
Problem I-B: Performance Requirements
ManagerTechnical LeaderEtc.
Performance Engineer
This request has a
response time of 5
minutes
Where is the
requirement saying it
should be less?
Good Performance Requirements
Identify your business events and business entities
Understand the order of magnitude you have to deal with
Estimate your workload
• Based on current workloads if possible
• Educated guess
Set performance targets for business events based on expected business entities
For static datacenters performance targets will change as load changes
For Dynamic datacenters and scalable systems performance targets should be set by server or group of servers
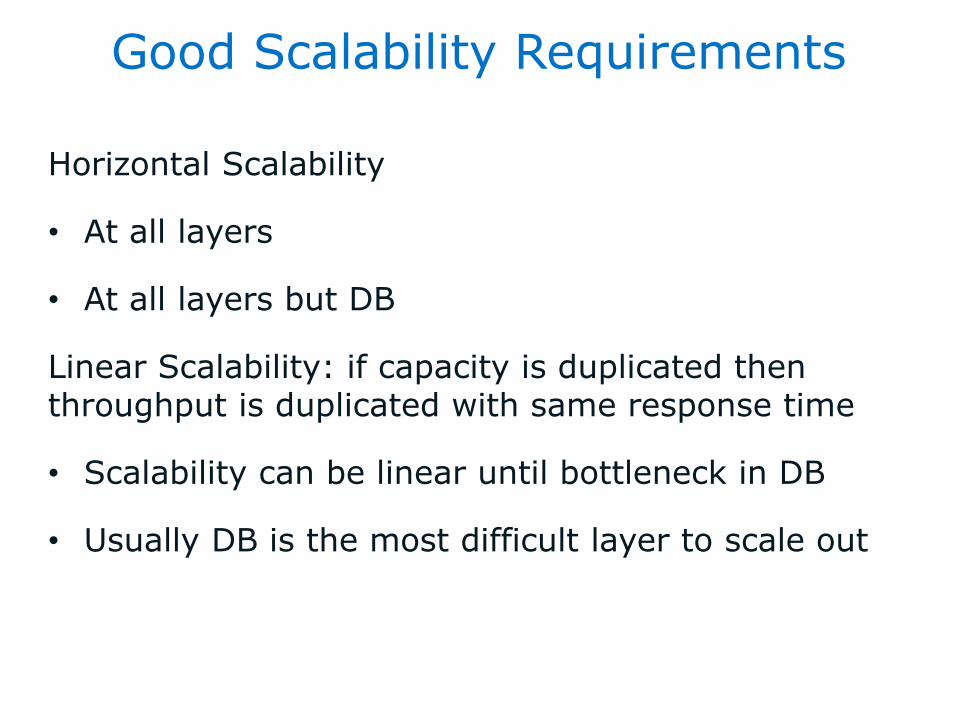
Good Scalability Requirements
Horizontal Scalability
• At all layers
• At all layers but DB
Linear Scalability: if capacity is duplicated then throughput is duplicated with same response time
• Scalability can be linear until bottleneck in DB
• Usually DB is the most difficult layer to scale out
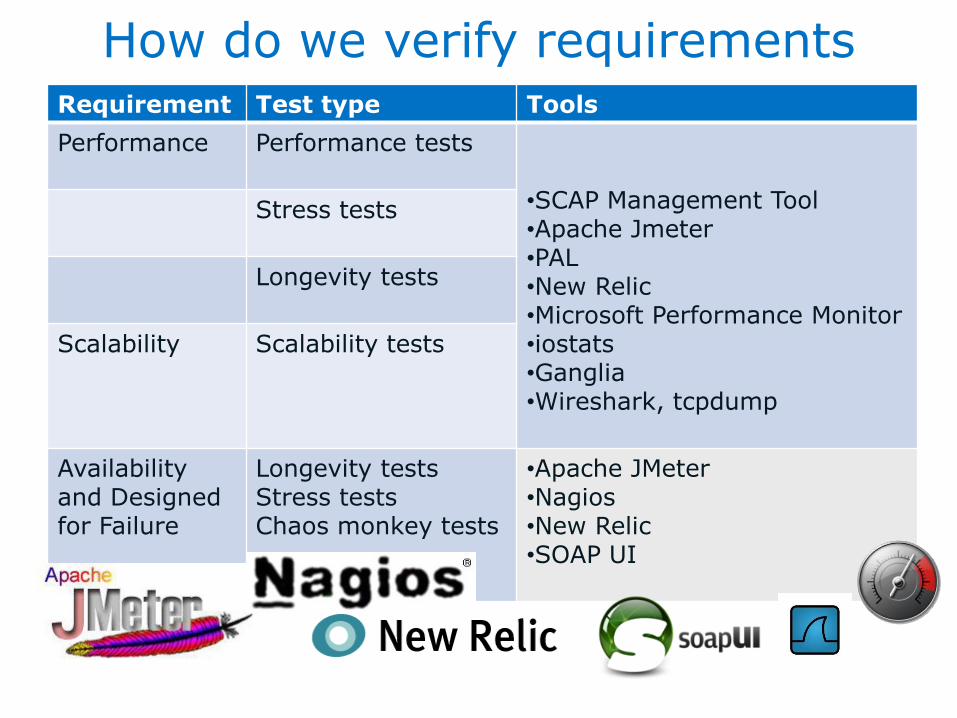
How do we verify requirements
11/24/201410
Requirement Test type Tools
Performance Performance tests
•SCAP Management Tool•Apache Jmeter•PAL•New Relic•Microsoft Performance Monitor•iostats•Ganglia•Wireshark, tcpdump
Stress tests
Longevity tests
Scalability Scalability tests
Availability and Designedfor Failure
Longevity testsStress testsChaos monkey tests
•Apache JMeter•Nagios•New Relic•SOAP UI
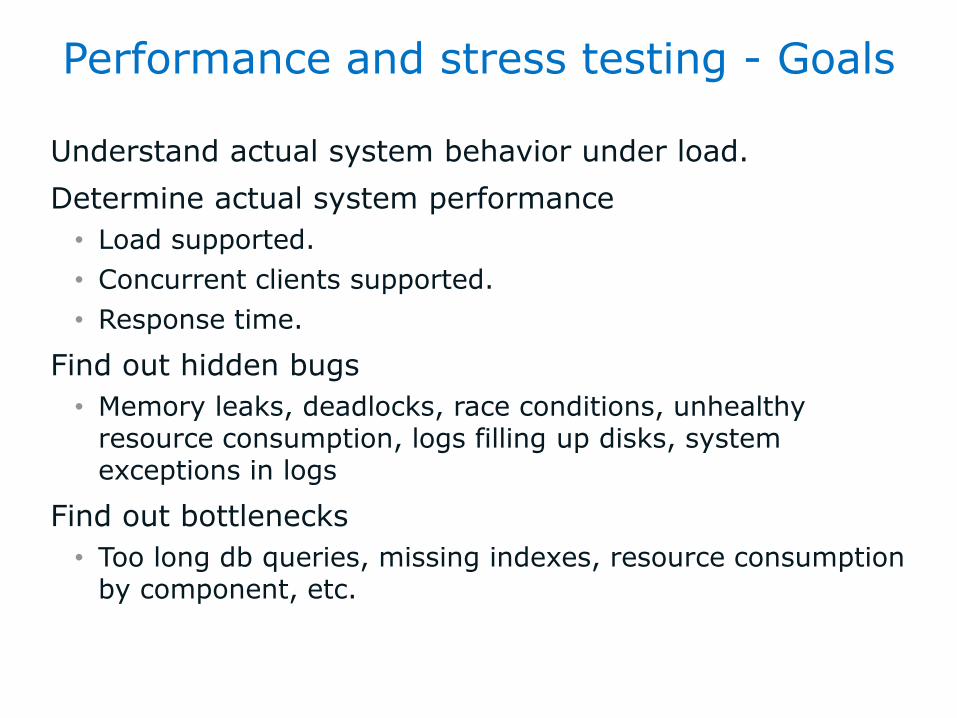
Performance and stress testing - Goals
Understand actual system behavior under load.
Determine actual system performance
• Load supported.
• Concurrent clients supported.
• Response time.
Find out hidden bugs
• Memory leaks, deadlocks, race conditions, unhealthy resource consumption, logs filling up disks, system exceptions in logs
Find out bottlenecks
• Too long db queries, missing indexes, resource consumption by component, etc.
11/24/201411
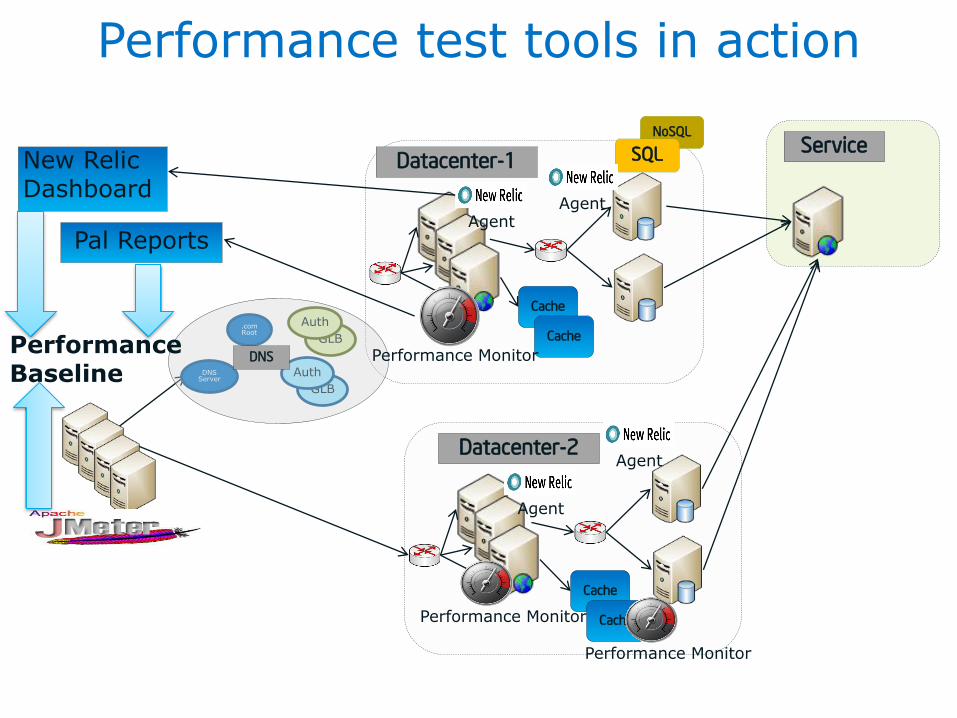
Performance test tools in action
11/24/201412
Datacenter-1
Datacenter-2
Service
Cache
Cache
Cache
Cache
DNSServer
.com Root
GLB
Auth
GLB
Auth
DNS
NoSQL
SQL
Performance Monitor
Performance Monitor
Agent
AgentAgent
Agent
Performance Monitor
Pal Reports
New Relic Dashboard
Performance Baseline
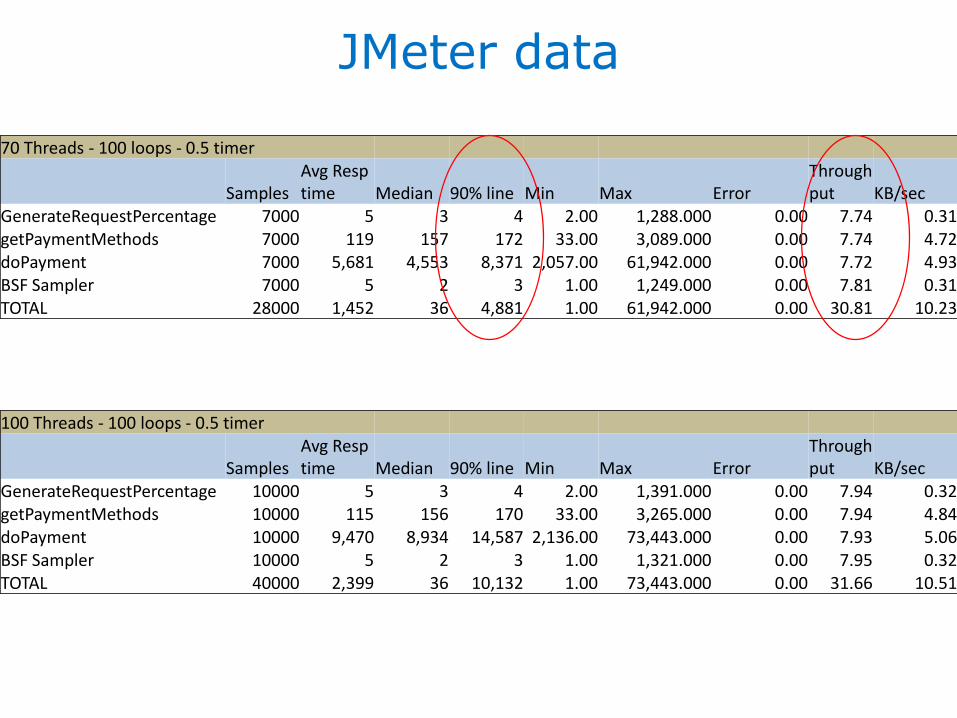
JMeter data
70 Threads - 100 loops - 0.5 timer
SamplesAvg Resp time Median 90% line Min Max Error
Throughput KB/sec
GenerateRequestPercentage 7000 5 3 4 2.00 1,288.000 0.00 7.74 0.31getPaymentMethods 7000 119 157 172 33.00 3,089.000 0.00 7.74 4.72doPayment 7000 5,681 4,553 8,371 2,057.00 61,942.000 0.00 7.72 4.93BSF Sampler 7000 5 2 3 1.00 1,249.000 0.00 7.81 0.31TOTAL 28000 1,452 36 4,881 1.00 61,942.000 0.00 30.81 10.23
100 Threads - 100 loops - 0.5 timer
SamplesAvg Resp time Median 90% line Min Max Error
Throughput KB/sec
GenerateRequestPercentage 10000 5 3 4 2.00 1,391.000 0.00 7.94 0.32getPaymentMethods 10000 115 156 170 33.00 3,265.000 0.00 7.94 4.84doPayment 10000 9,470 8,934 14,587 2,136.00 73,443.000 0.00 7.93 5.06BSF Sampler 10000 5 2 3 1.00 1,321.000 0.00 7.95 0.32TOTAL 40000 2,399 36 10,132 1.00 73,443.000 0.00 31.66 10.51
Performance test executions
We use internal/external Jmeters to execute.
We increase the number of threads until the system cannot handle them.
Previous to execute we create the db with preload data.• Results change when you execute with a populated db
During each execution we collect:• TPS, Response time
• Performance counters results – Templates exported from PAL.
• New Relic Transaction breakdown.
• Slow queries with New Relic
• DB CPU utilization and memory.
Establish baselines• Create/update the baselines for each scenario
• Compare with existent baselines.
14
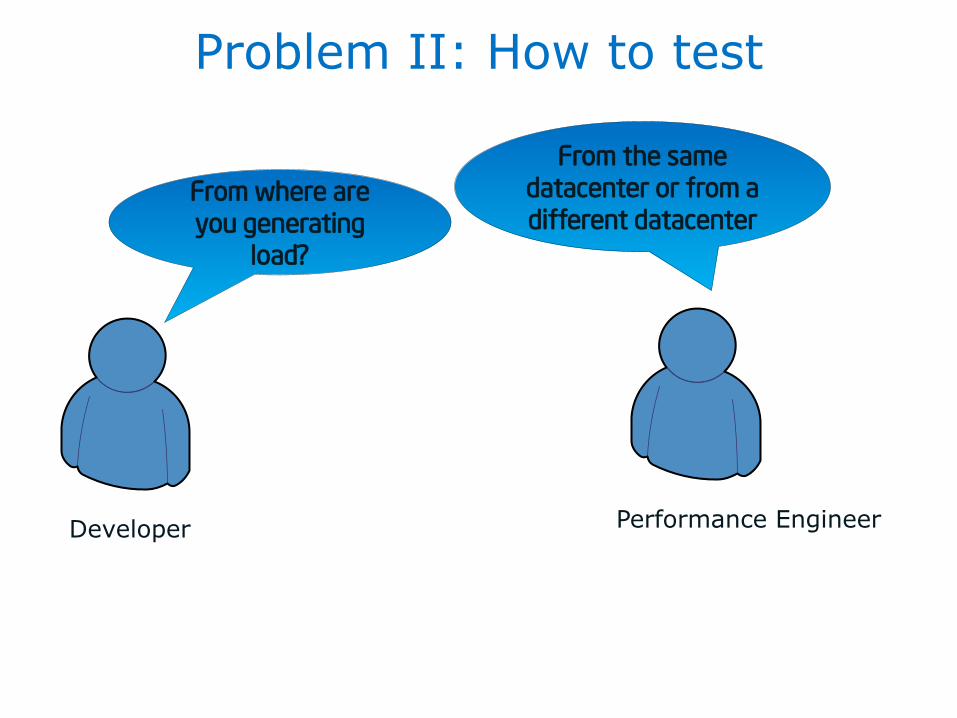
Problem II: How to test
Performance EngineerDeveloper
From where are you generating
load?
From the same
datacenter or from a different datacenter
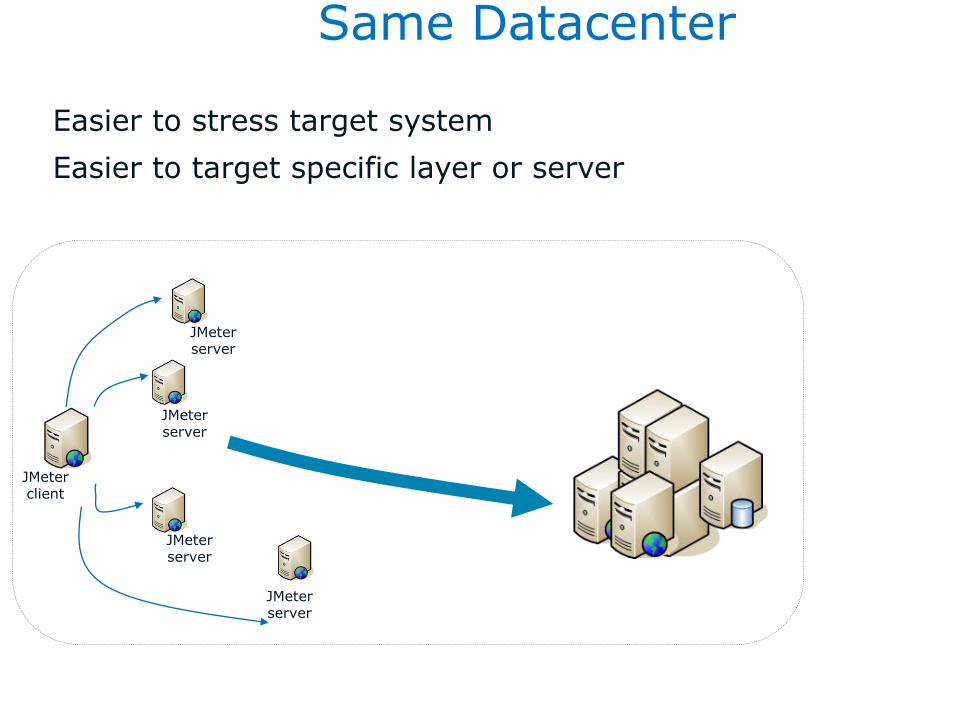
Same Datacenter
Competitor
Intel® Web Service
Intel® Web Service
JMeterserver
JMeterclient
JMeterserver
JMeterserver
JMeterserver
Easier to stress target system
Easier to target specific layer or server
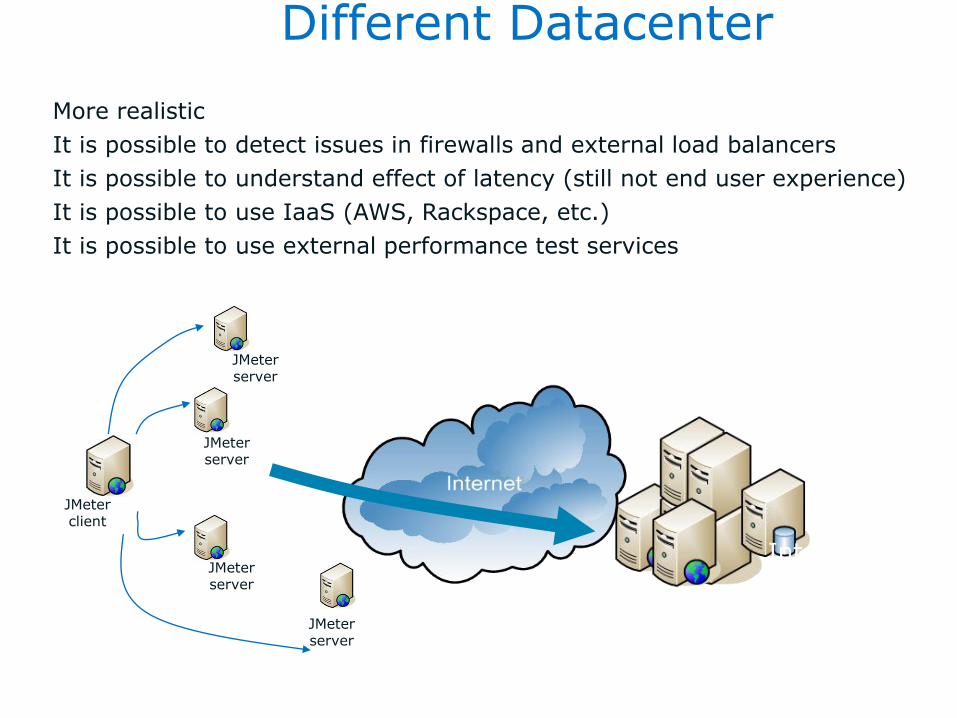
Different Datacenter
Competitor
Intel® Web Service
Intel® Web Service
JMeterserver
JMeterclient
JMeterserver
JMeterserver
JMeterserver
More realistic
It is possible to detect issues in firewalls and external load balancers
It is possible to understand effect of latency (still not end user experience)
It is possible to use IaaS (AWS, Rackspace, etc.)
It is possible to use external performance test services
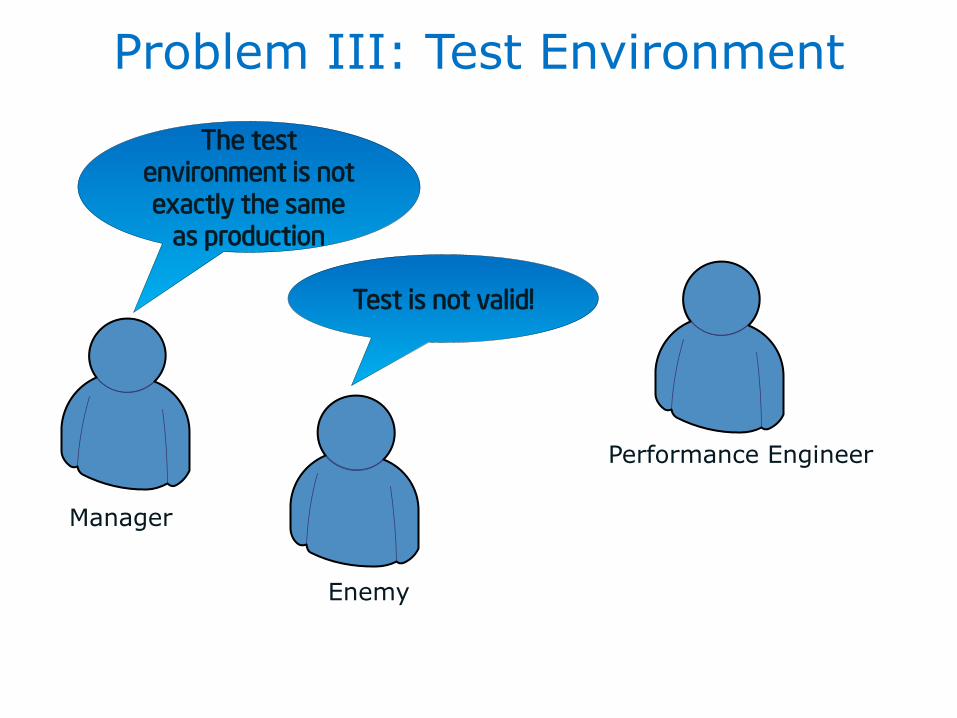
Problem III: Test Environment
Performance Engineer
Manager
The test
environment is not exactly the same
as production
Test is not valid!
Enemy
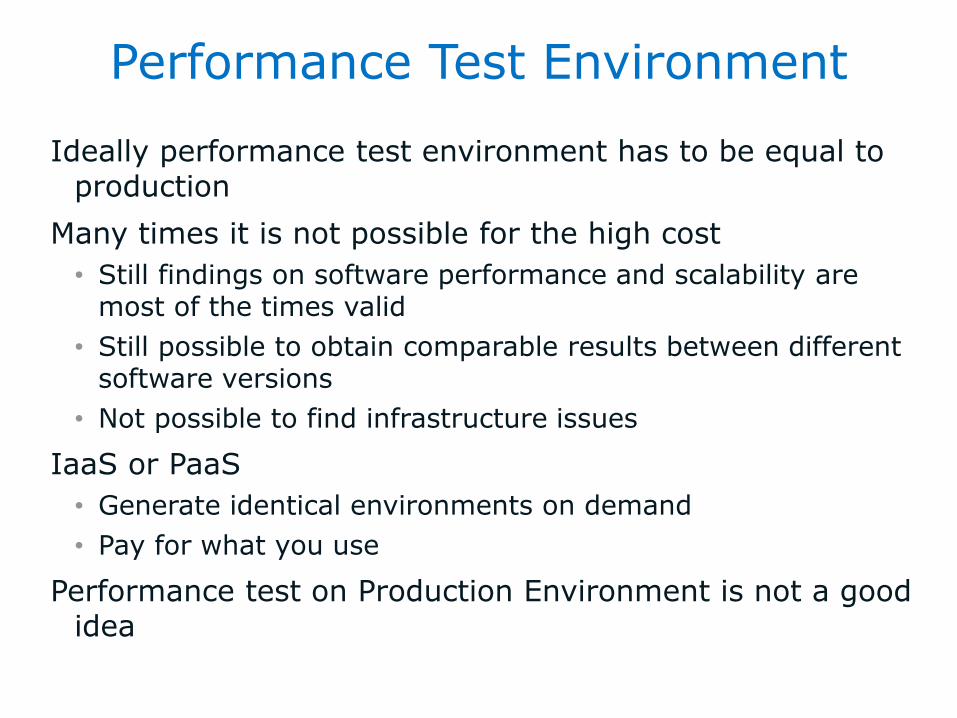
Performance Test Environment
Ideally performance test environment has to be equal to production
Many times it is not possible for the high cost
• Still findings on software performance and scalability are most of the times valid
• Still possible to obtain comparable results between different software versions
• Not possible to find infrastructure issues
IaaS or PaaS
• Generate identical environments on demand
• Pay for what you use
Performance test on Production Environment is not a good idea
11/24/201419
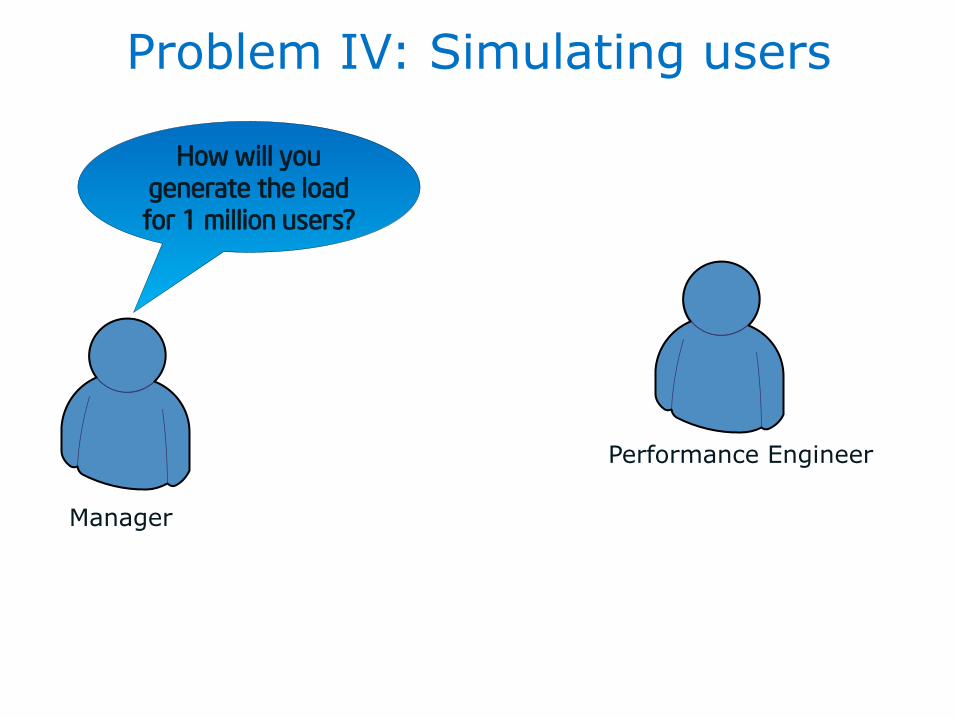
Problem IV: Simulating users
Performance Engineer
Manager
How will you generate the load
for 1 million users?
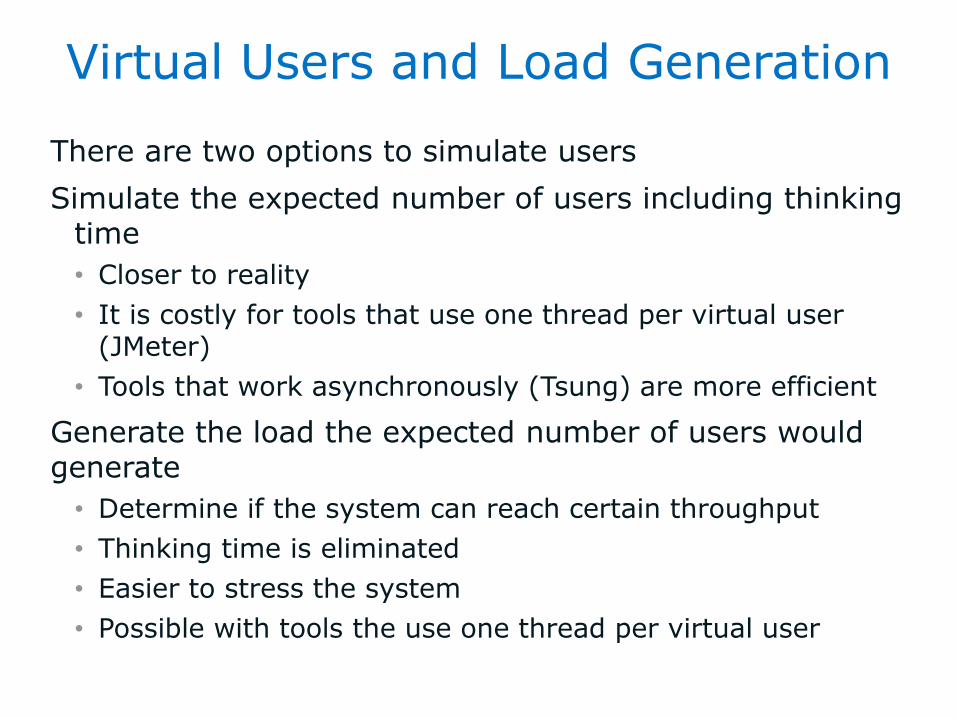
Virtual Users and Load Generation
There are two options to simulate users
Simulate the expected number of users including thinking time
• Closer to reality
• It is costly for tools that use one thread per virtual user (JMeter)
• Tools that work asynchronously (Tsung) are more efficient
Generate the load the expected number of users would generate
• Determine if the system can reach certain throughput
• Thinking time is eliminated
• Easier to stress the system
• Possible with tools the use one thread per virtual user
11/24/201421
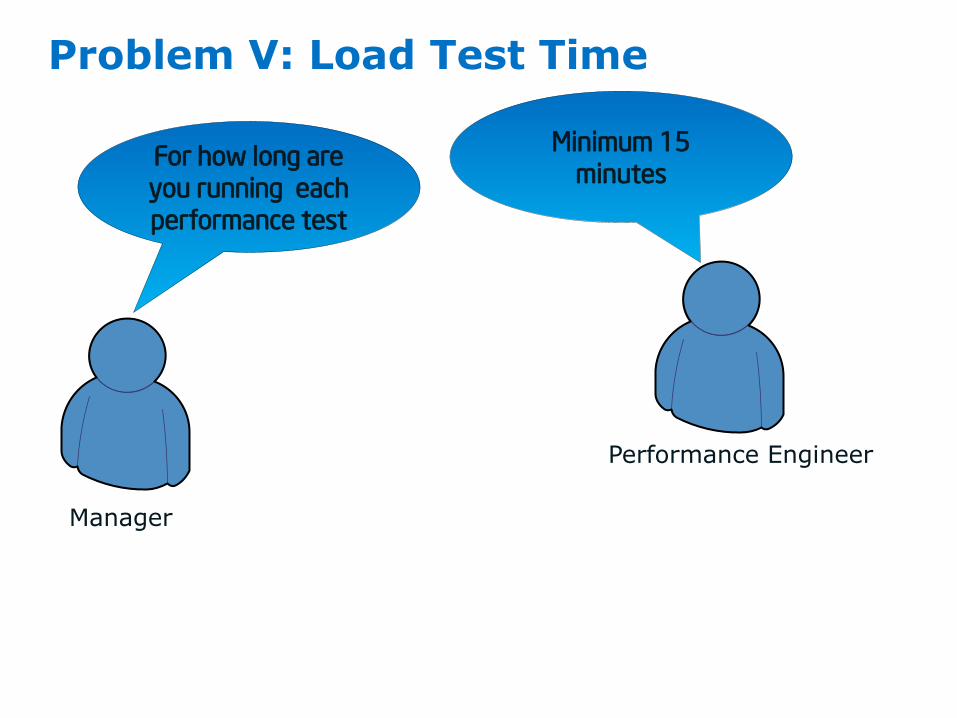
Problem V: Load Test Time
Performance Engineer
Manager
For how long are you running each
performance test
Minimum 15
minutes
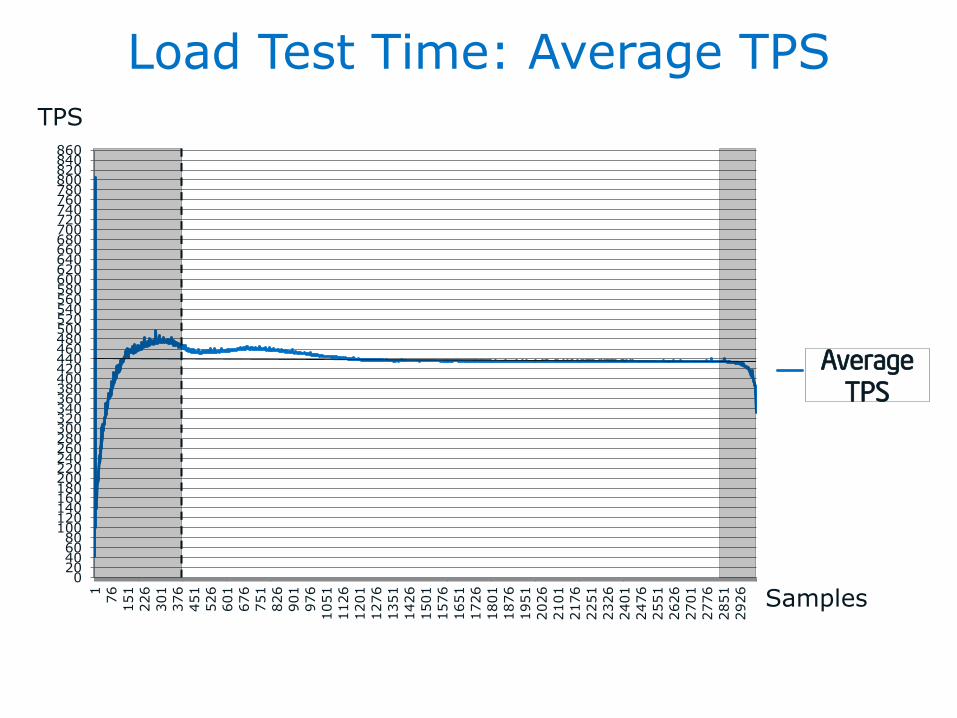
Load Test Time: Average TPS
020406080
100120140160180200220240260280300320340360380400420440460480500520540560580600620640660680700720740760780800820840860
1
76
151
226
301
376
451
526
601
676
751
826
901
976
1051
1126
1201
1276
1351
1426
1501
1576
1651
1726
1801
1876
1951
2026
2101
2176
2251
2326
2401
2476
2551
2626
2701
2776
2851
2926
Series1
Linear (Series1)
TPS
Samples
Average
TPS
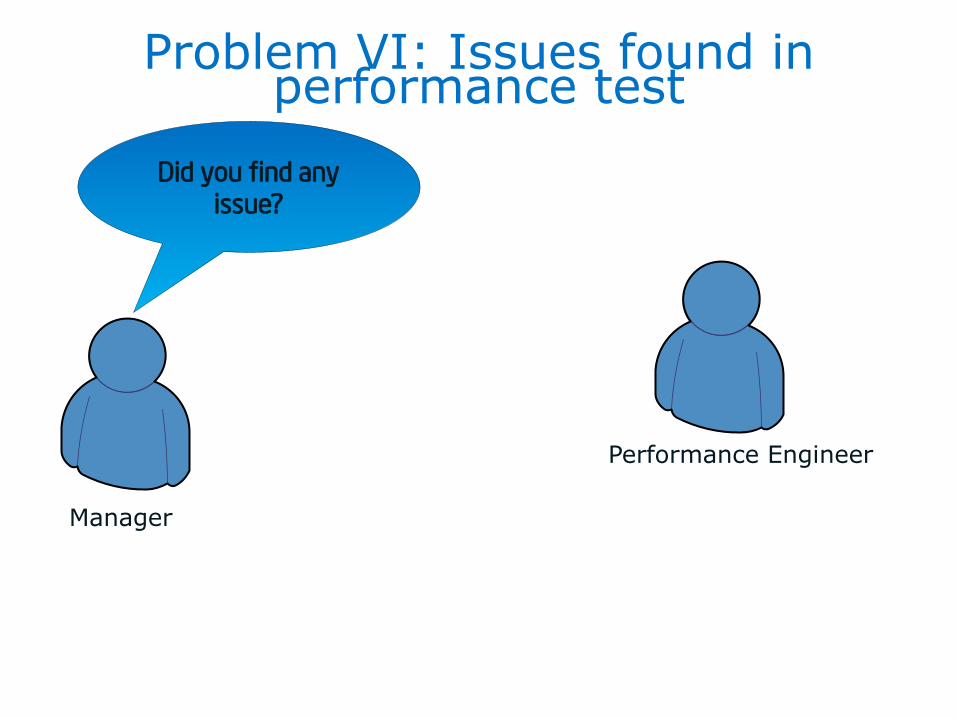
Problem VI: Issues found in performance test
Performance Engineer
Manager
Did you find any issue?
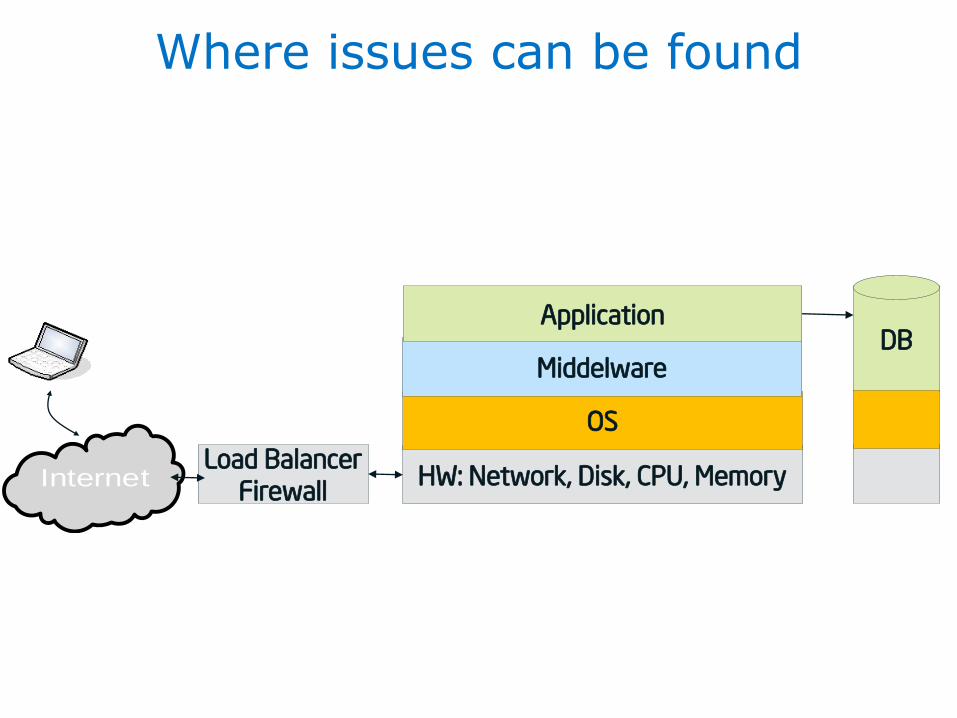
Where issues can be found
HW: Network, Disk, CPU, Memory
OS
Middelware
ApplicationDB
Load Balancer
FirewallInternet
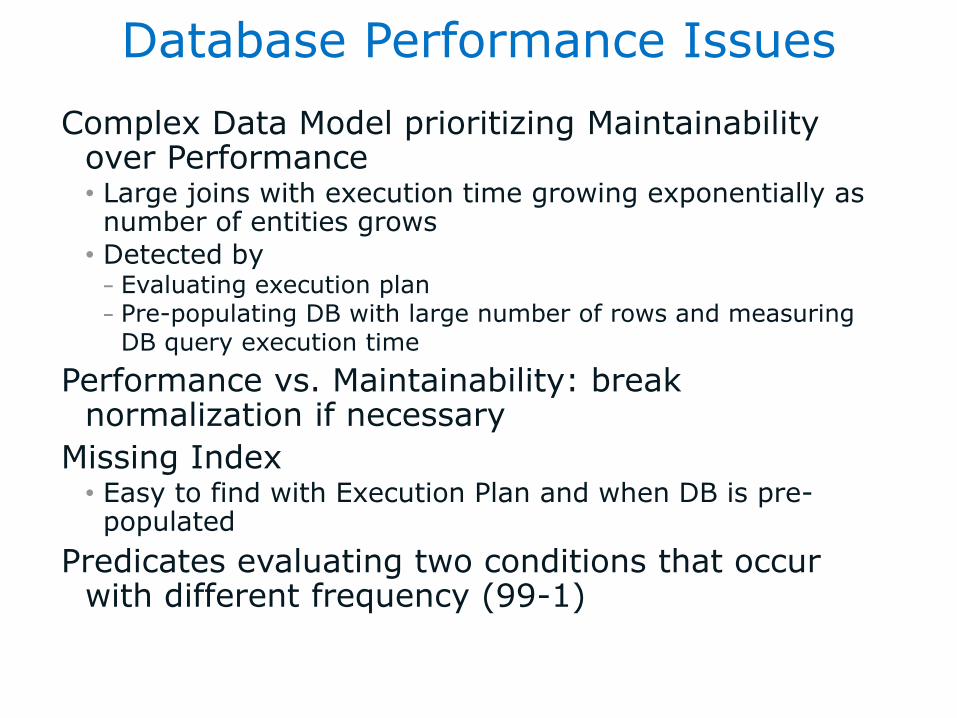
Database Performance Issues
Complex Data Model prioritizing Maintainability over Performance• Large joins with execution time growing exponentially as number of entities grows
• Detected by – Evaluating execution plan– Pre-populating DB with large number of rows and measuring
DB query execution time
Performance vs. Maintainability: break normalization if necessary
Missing Index• Easy to find with Execution Plan and when DB is pre-populated
Predicates evaluating two conditions that occur with different frequency (99-1)
26
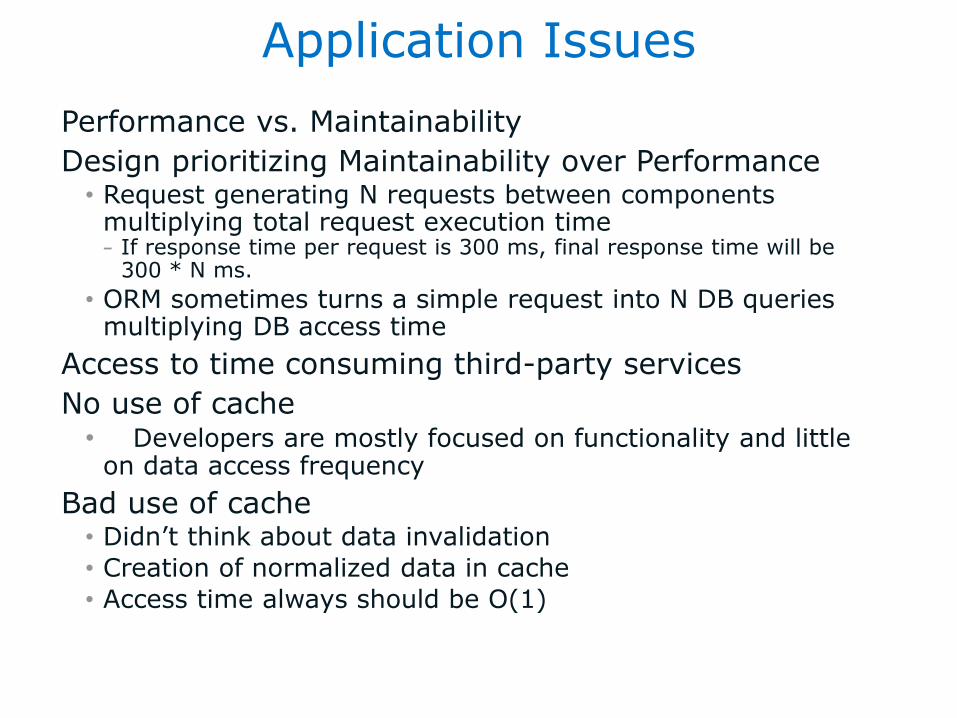
Application Issues
Performance vs. Maintainability
Design prioritizing Maintainability over Performance• Request generating N requests between components
multiplying total request execution time– If response time per request is 300 ms, final response time will be
300 * N ms.
• ORM sometimes turns a simple request into N DB queries multiplying DB access time
Access to time consuming third-party services
No use of cache• Developers are mostly focused on functionality and little
on data access frequency
Bad use of cache• Didn’t think about data invalidation
• Creation of normalized data in cache
• Access time always should be O(1)
27
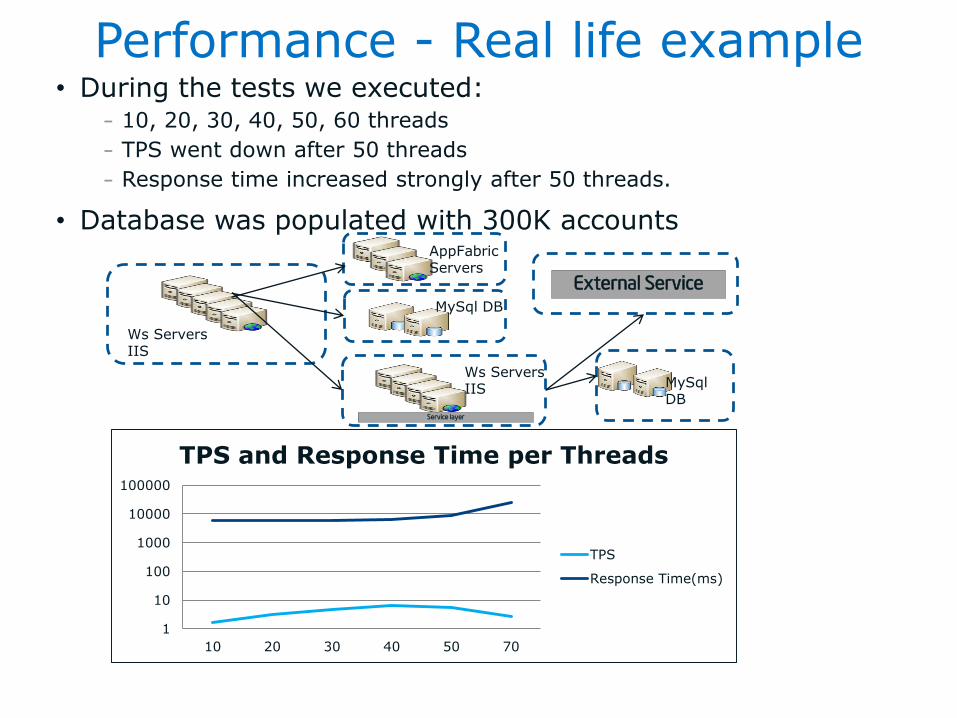
Performance - Real life example• During the tests we executed:
– 10, 20, 30, 40, 50, 60 threads
– TPS went down after 50 threads
– Response time increased strongly after 50 threads.
• Database was populated with 300K accounts
Ws ServersIIS
AppFabricServers
MySql DB
Ws ServersIIS
Service layer
MySqlDB
External Service
28
1
10
100
1000
10000
100000
10 20 30 40 50 70
TPS and Response Time per Threads
TPS
Response Time(ms)
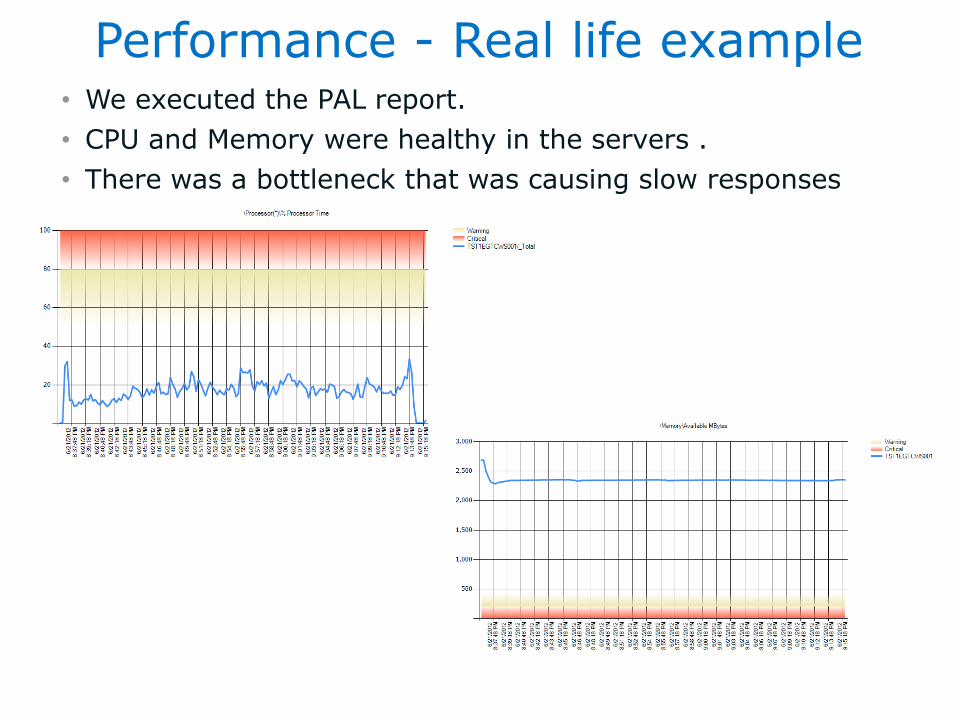
Performance - Real life example• We executed the PAL report.
• CPU and Memory were healthy in the servers .
• There was a bottleneck that was causing slow responses
29
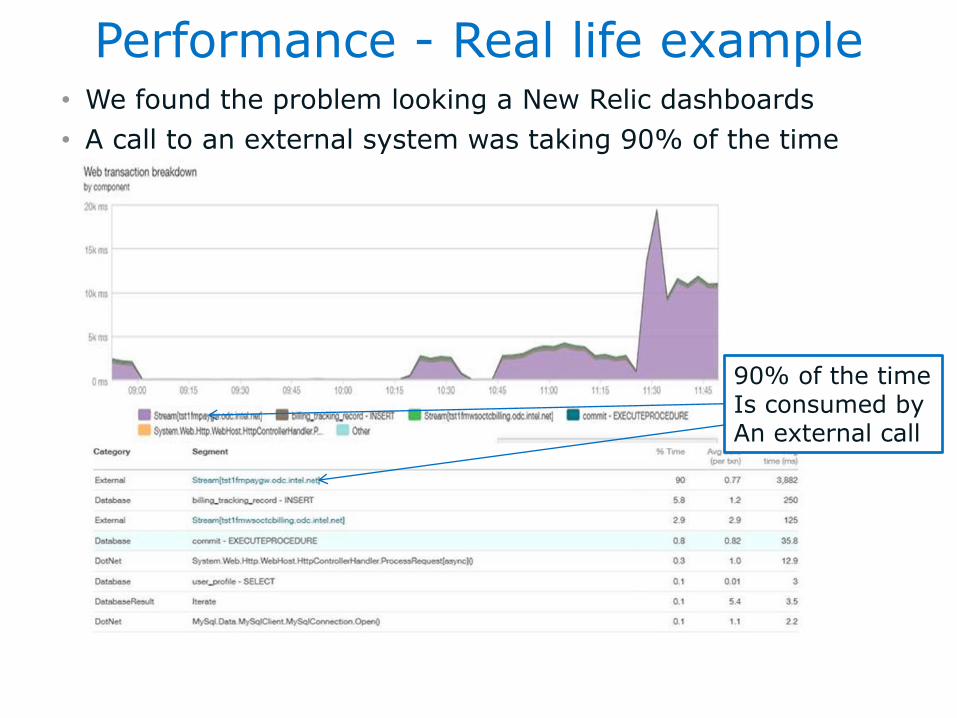
Performance - Real life example• We found the problem looking a New Relic dashboards
• A call to an external system was taking 90% of the time
90% of the timeIs consumed byAn external call
30
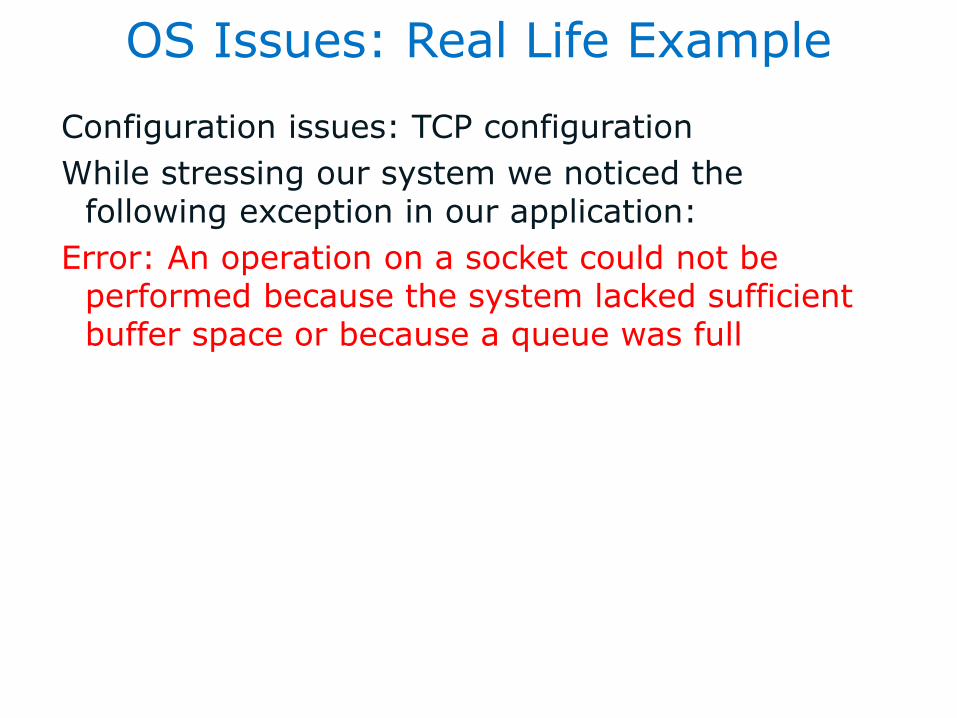
OS Issues: Real Life Example
Configuration issues: TCP configuration
While stressing our system we noticed the following exception in our application:
Error: An operation on a socket could not be performed because the system lacked sufficient buffer space or because a queue was full
31
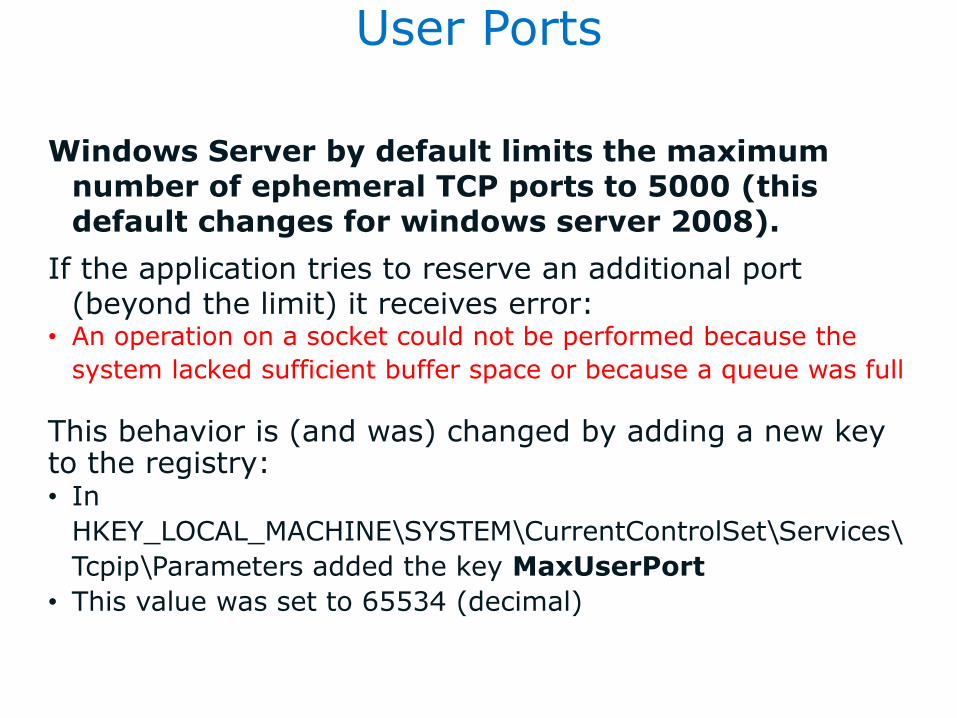
User Ports
Windows Server by default limits the maximum number of ephemeral TCP ports to 5000 (this default changes for windows server 2008).
If the application tries to reserve an additional port (beyond the limit) it receives error:
• An operation on a socket could not be performed because the
system lacked sufficient buffer space or because a queue was full
This behavior is (and was) changed by adding a new key to the registry:• In
HKEY_LOCAL_MACHINE\SYSTEM\CurrentControlSet\Services\
Tcpip\Parameters added the key MaxUserPort
• This value was set to 65534 (decimal)
11/24/201432
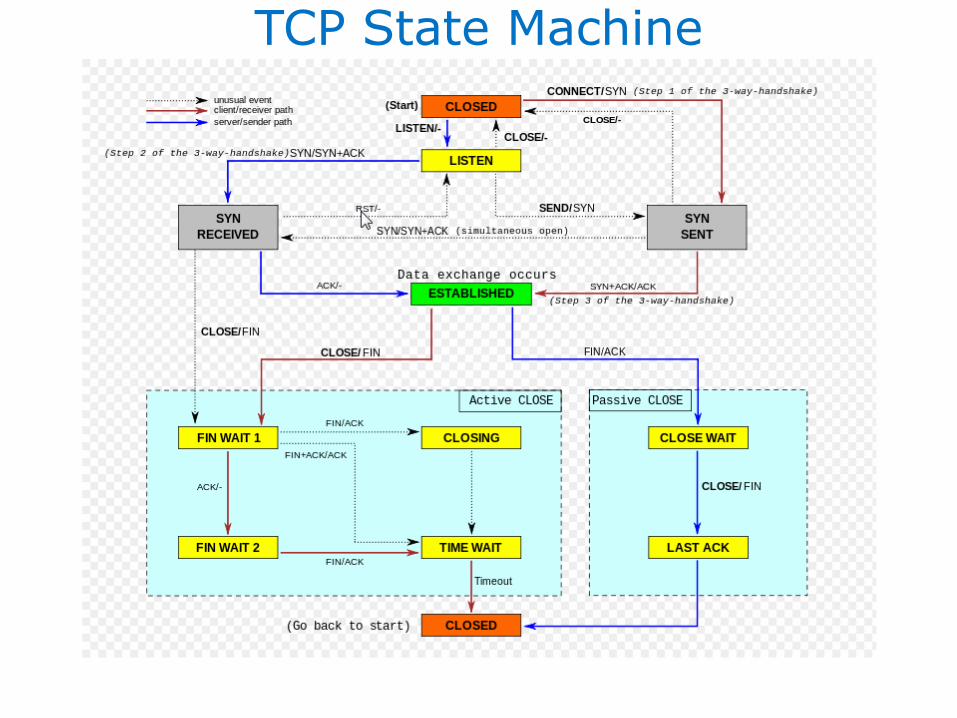
TCP State Machine
11/24/201433
Socket TIME WAIT
When we ran netstat –b we found many finished TCP connections in state TIME_WAIT.
This is a state of a TCP connection after a machine’s TCP has sent the ACK segment in response to a FIN segment received from its peer.
During this time resources are not released.
The default value for this timeout is 240 seconds according to documentation, we found it is actually between 60 or 120 seconds in our servers (Windows Server 2008 has different defaults).
We changed the value to 30 secs, in the registry:• In HKEY_LOCAL_MACHINE\SYSTEM\CurrentControlSet\Services\Tcpip\Parameters added
the key TcpTimedWaitDelay• This value was set to 30
More about this:
http://msdn.microsoft.com/en-us/library/ee377084%28v=bts.10%29.aspx
11/24/201434
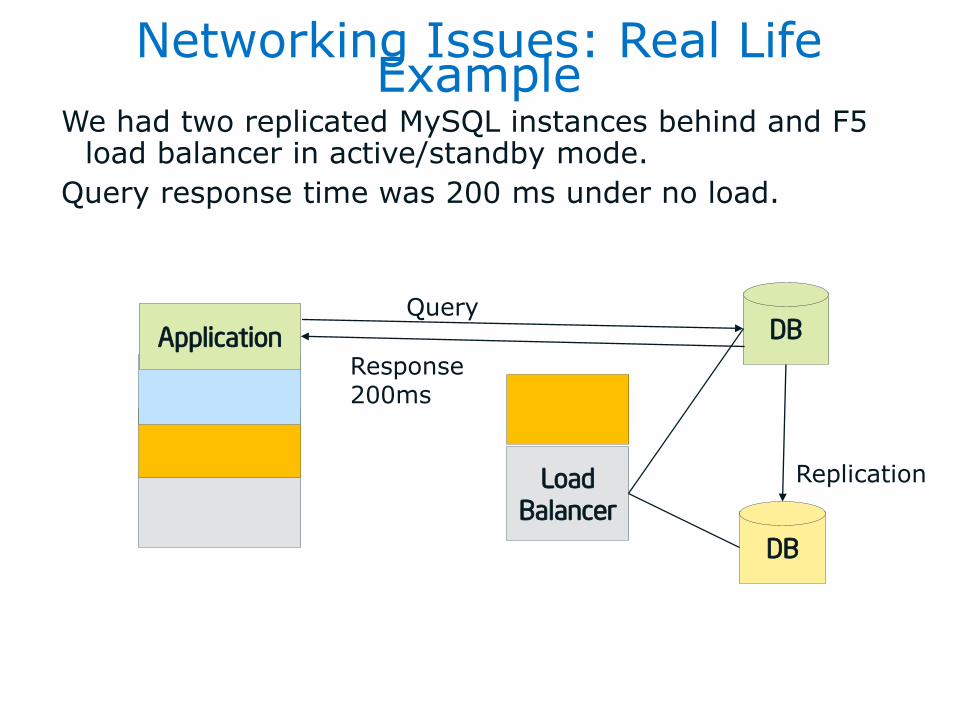
Networking Issues: Real Life Example
We had two replicated MySQL instances behind and F5 load balancer in active/standby mode.
Query response time was 200 ms under no load.
35
Load
Balancer
DB
DB
Replication
ApplicationQuery
Response200ms
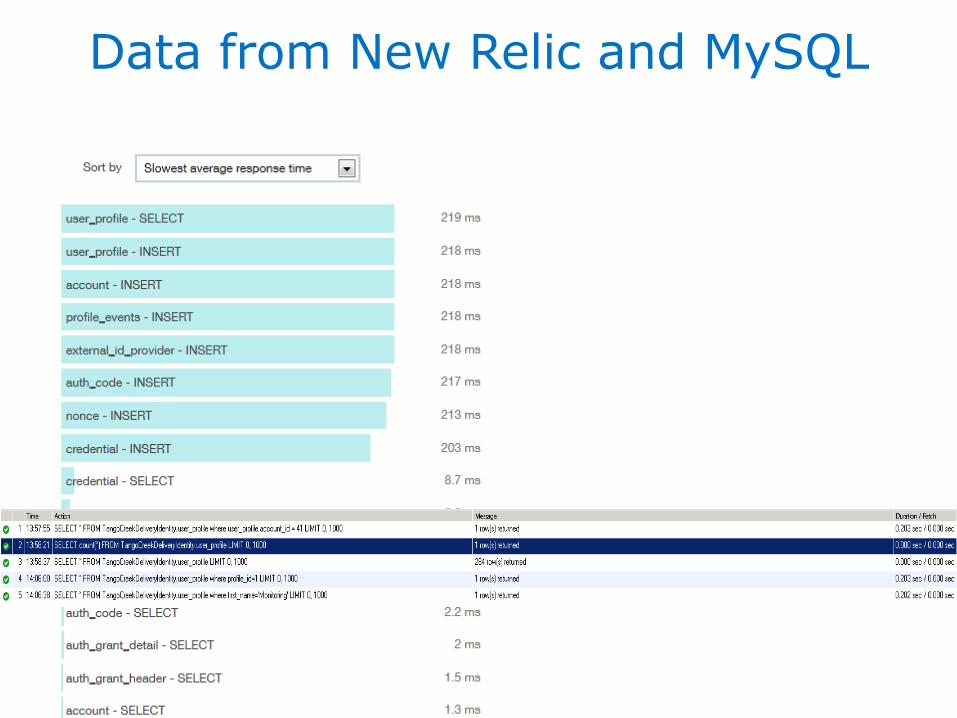
Data from New Relic and MySQL
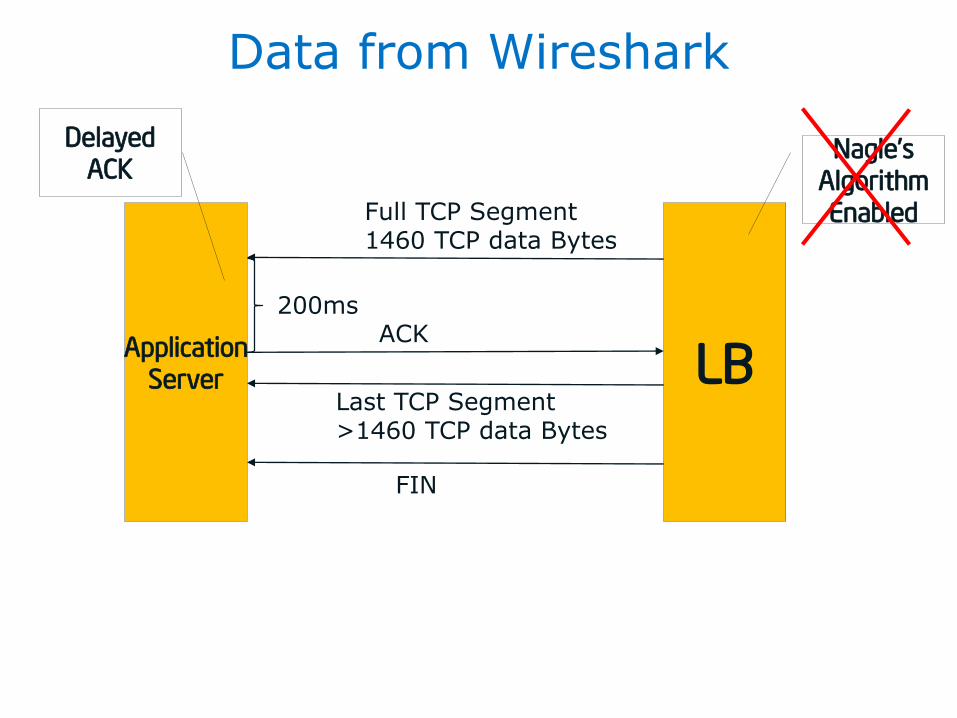
Data from Wireshark
LBApplication
Server
Full TCP Segment1460 TCP data Bytes
ACK200ms
Last TCP Segment>1460 TCP data Bytes
FIN
Nagle’s
Algorithm
Enabled
Delayed
ACK
11/24/201438
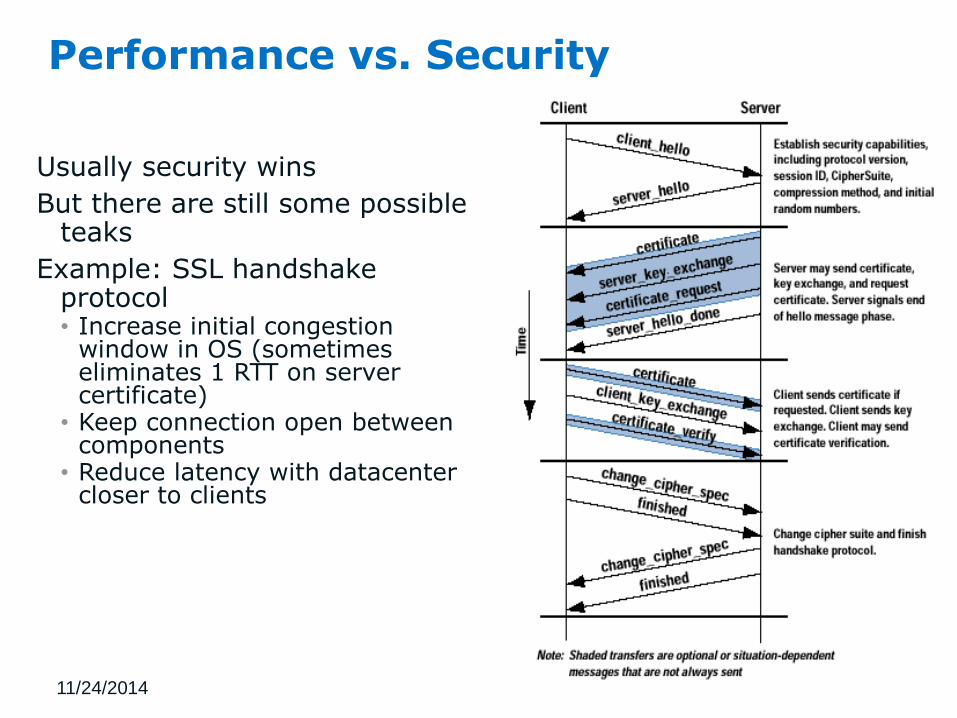
Performance vs. Security
Usually security wins
But there are still some possible teaks
Example: SSL handshake protocol• Increase initial congestion
window in OS (sometimes eliminates 1 RTT on server certificate)
• Keep connection open between components
• Reduce latency with datacenter closer to clients

Backup
40
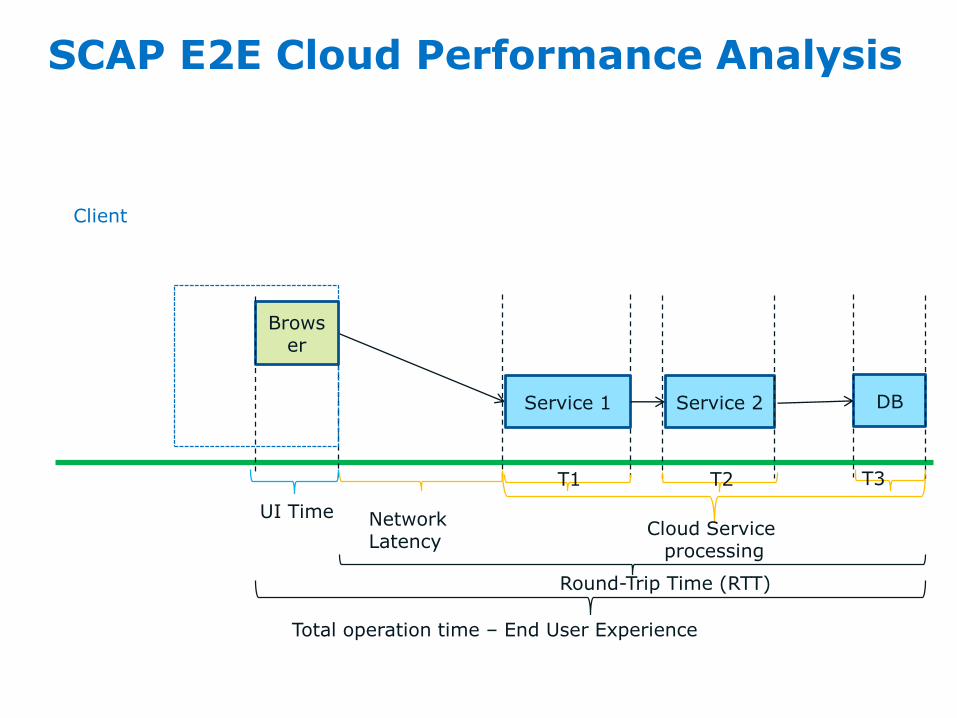
SCAP E2E Cloud Performance Analysis
Round-Trip Time (RTT)
Cloud Service processing
UI Time
Total operation time – End User Experience
Client
Network Latency
Browser
Service 1 Service 2 DB
T1 T2 T3
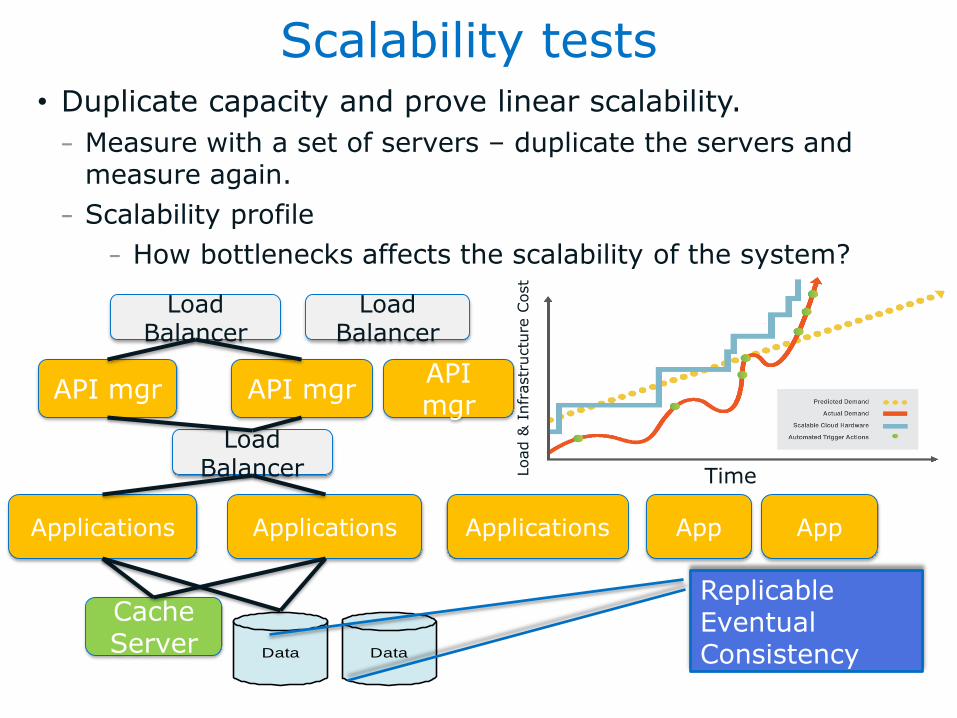
Scalability tests• Duplicate capacity and prove linear scalability.
– Measure with a set of servers – duplicate the servers and measure again.
– Scalability profile
– How bottlenecks affects the scalability of the system?
Applications
API mgr
Data
Cache Server
Load Balancer
Load Balancer
API mgr
Applications Applications App App
Data
TimeLoad &
Infr
astr
uctu
re C
ost
API mgr
Load Balancer
ReplicableEventual Consistency
41