adding value to local foods - knowledge for...
TRANSCRIPT
November 2012
CTA/CCST Marketing
Boards
©
Adding Value to Local Foods The Role & Impact of Marketing
Boards
Ian Ivey
November 2012
CTA/CCST Marketing
Boards
©
Setting the Scene
November 2012
CTA/CCST Marketing
Boards
©
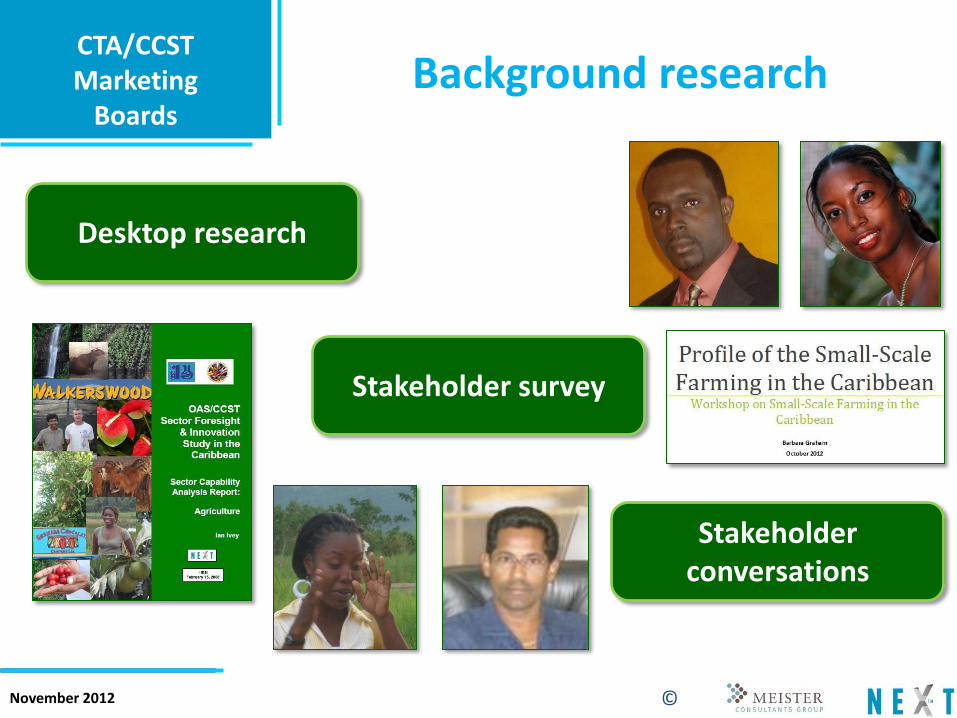
Background research
Desktop research
Stakeholder survey
Stakeholder conversations
November 2012
CTA/CCST Marketing
Boards
©
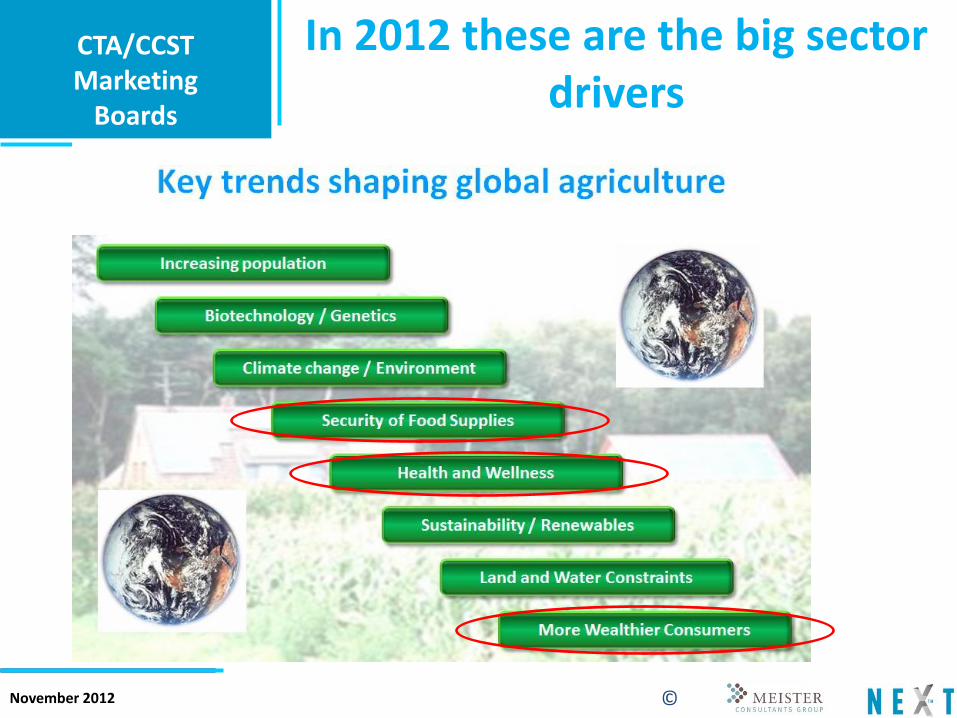
In 2012 these are the big sector drivers
November 2012
CTA/CCST Marketing
Boards
©
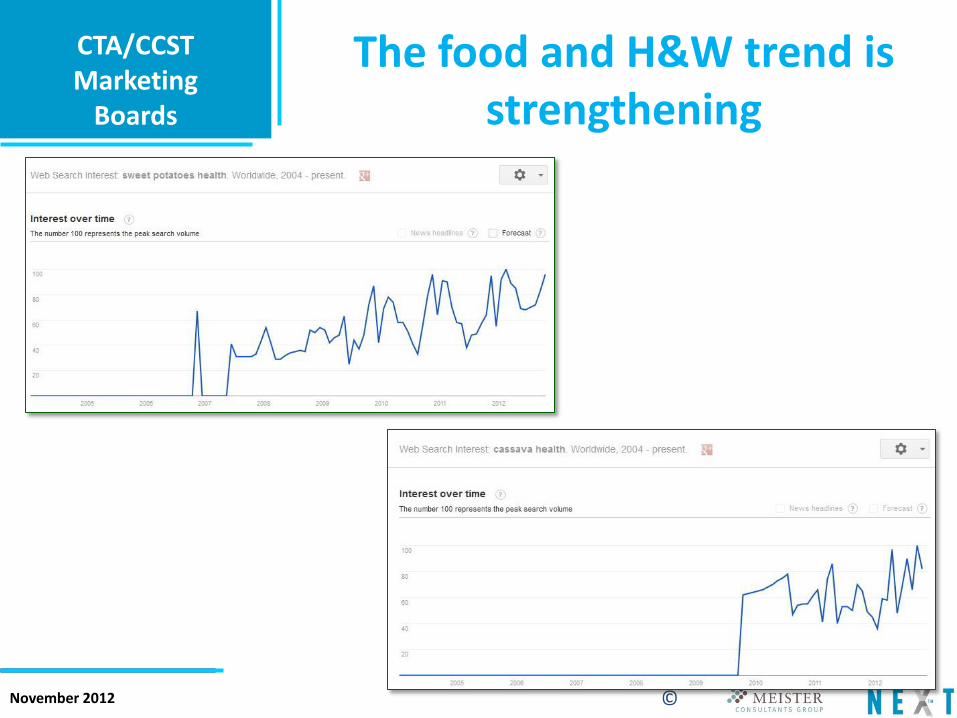
The food and H&W trend is strengthening
November 2012
CTA/CCST Marketing
Boards
©
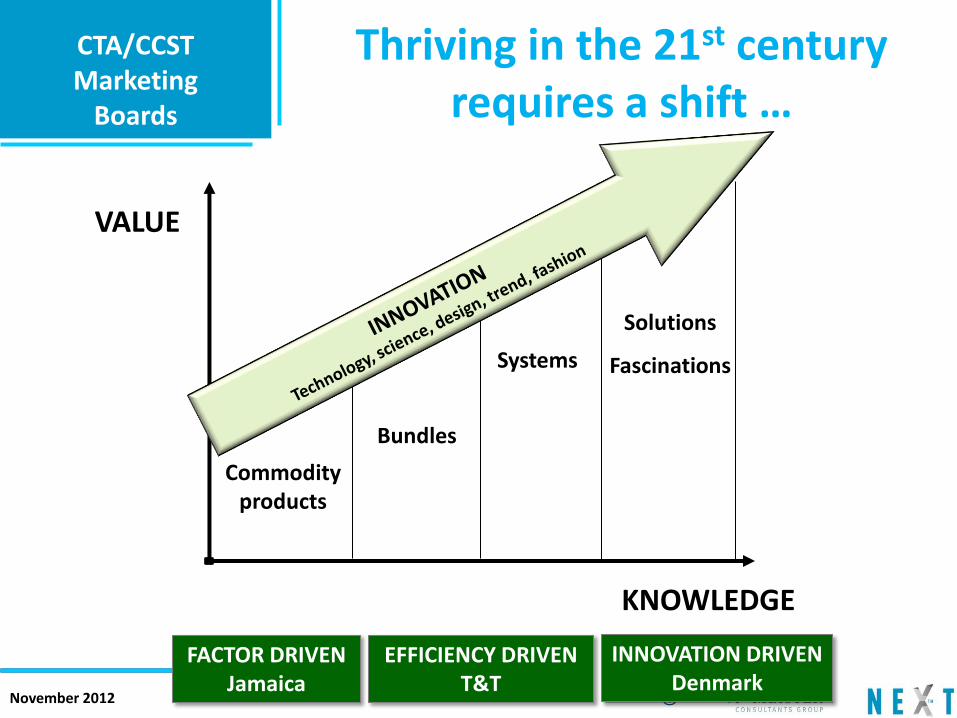
Commodity products
Bundles
Systems
Solutions
Fascinations
KNOWLEDGE
VALUE
Thriving in the 21st century requires a shift …
FACTOR DRIVEN Jamaica
EFFICIENCY DRIVEN T&T
INNOVATION DRIVEN Denmark
November 2012
CTA/CCST Marketing
Boards
©
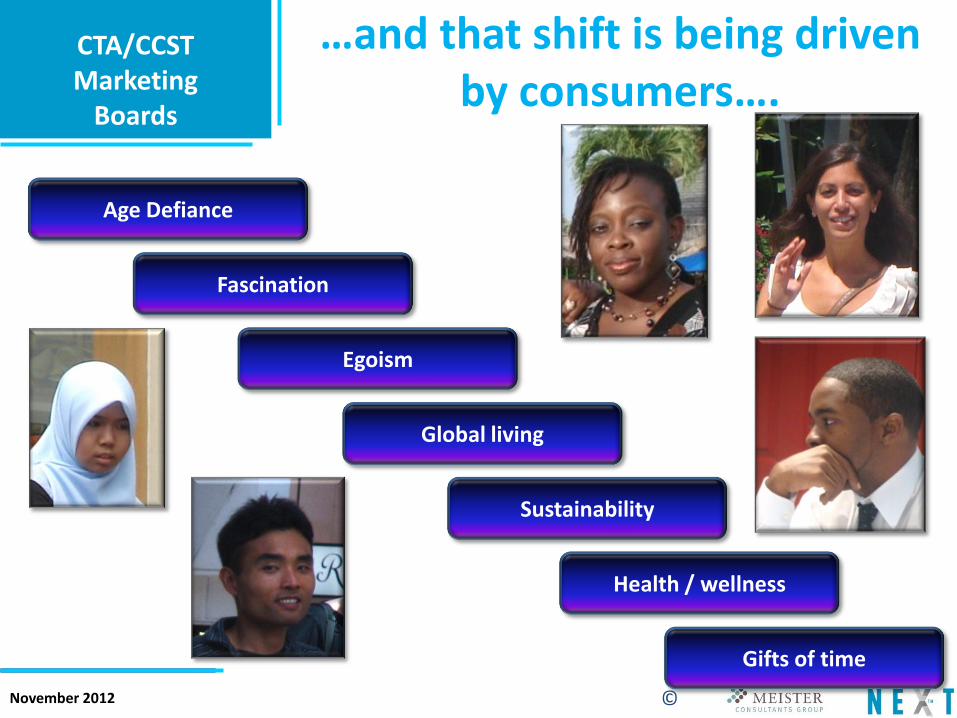
Age Defiance
Fascination
Global living
Egoism
Sustainability
Health / wellness
Gifts of time
…and that shift is being driven by consumers….
November 2012
CTA/CCST Marketing
Boards
©
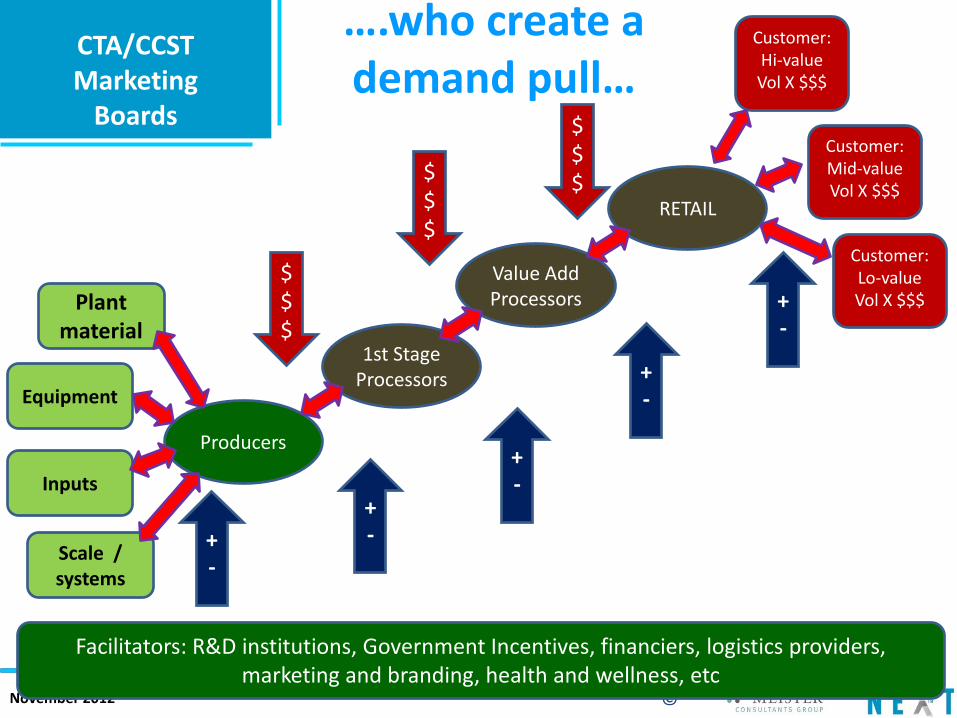
Customer: Hi-value Vol X $$$
Customer: Mid-value Vol X $$$
Customer: Lo-value Vol X $$$
RETAIL
Value Add Processors
1st Stage Processors
Producers
Plant material
Facilitators: R&D institutions, Government Incentives, financiers, logistics providers, marketing and branding, health and wellness, etc
Equipment
Inputs
Scale / systems
$$$
$$$
$$$
-+
-+
-+
-+
-+
….who create a demand pull…
November 2012
CTA/CCST Marketing
Boards
©
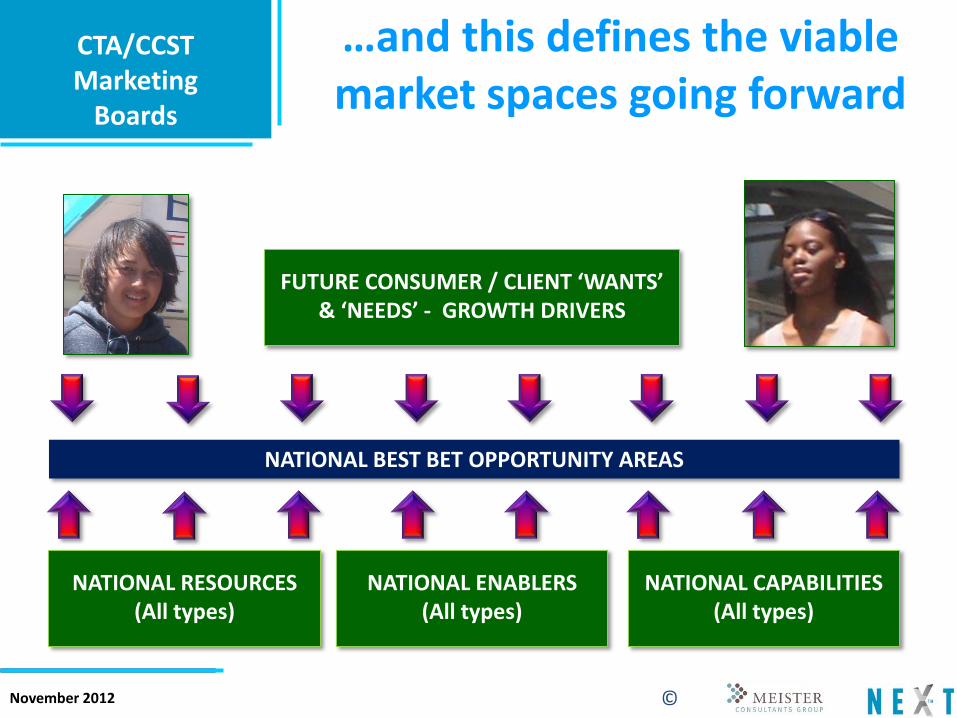
…and this defines the viable market spaces going forward
NATIONAL BEST BET OPPORTUNITY AREAS
NATIONAL RESOURCES (All types)
NATIONAL ENABLERS (All types)
NATIONAL CAPABILITIES (All types)
FUTURE CONSUMER / CLIENT ‘WANTS’ & ‘NEEDS’ - GROWTH DRIVERS
November 2012
CTA/CCST Marketing
Boards
©
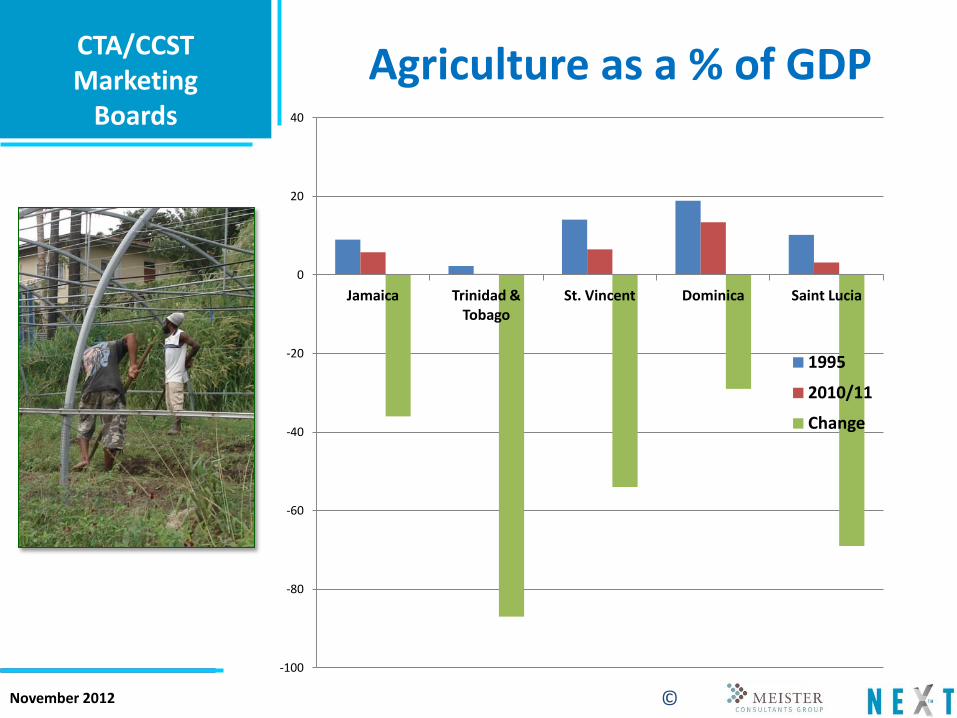
Agriculture as a % of GDP
-100
-80
-60
-40
-20
0
20
40
Jamaica Trinidad & Tobago
St. Vincent Dominica Saint Lucia
1995
2010/11
Change
November 2012
CTA/CCST Marketing
Boards
©
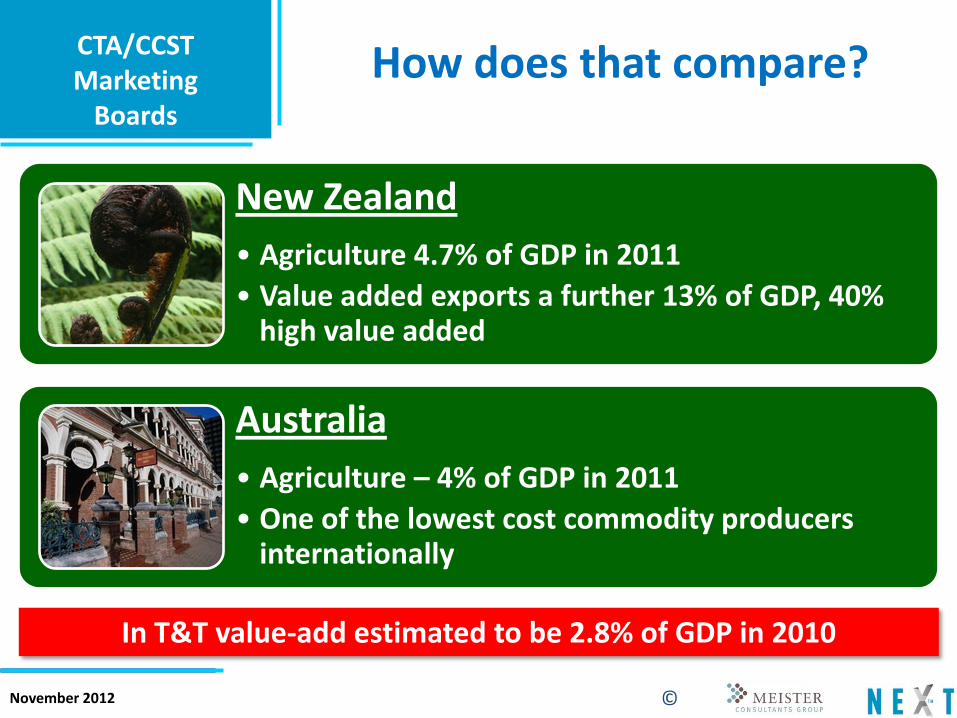
How does that compare?
New Zealand
• Agriculture 4.7% of GDP in 2011
• Value added exports a further 13% of GDP, 40% high value added
Australia
• Agriculture – 4% of GDP in 2011
• One of the lowest cost commodity producers internationally
In T&T value-add estimated to be 2.8% of GDP in 2010
November 2012
CTA/CCST Marketing
Boards
©
What is Food & Nutrition Security?
November 2012
CTA/CCST Marketing
Boards
©
A couple of views
“Food security means you need to be able to feed yourself. If it is based upon core competencies then it would mean you would focus on those
areas which you are best at. Food security is not just about growing your own food.”
“There is a need to define what is meant by ‘national food security’. In my view it is the ability of a nation to feed itself with the least risk – at least in the basic food area. It
doesn’t mean we need to grow all our own food. It means we need to set up a structure to minimise risk. In that case it may be better to contract the growing of food to Guyana
if they can produce it more competitively.”
November 2012
CTA/CCST Marketing
Boards
©
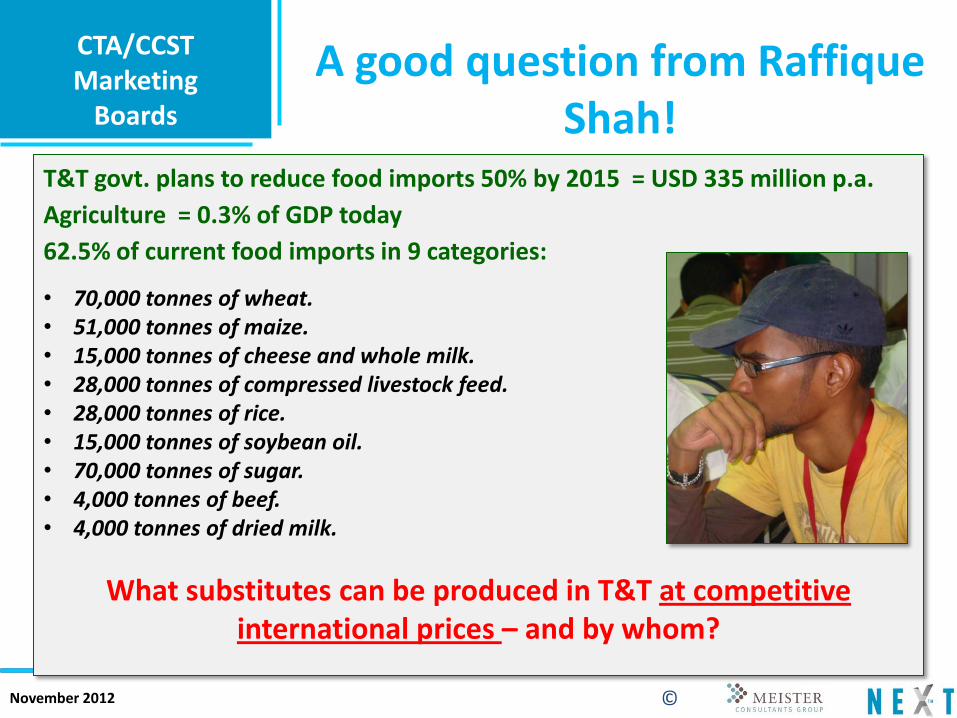
A good question from Raffique Shah!
T&T govt. plans to reduce food imports 50% by 2015 = USD 335 million p.a.
Agriculture = 0.3% of GDP today
62.5% of current food imports in 9 categories:
• 70,000 tonnes of wheat. • 51,000 tonnes of maize. • 15,000 tonnes of cheese and whole milk. • 28,000 tonnes of compressed livestock feed. • 28,000 tonnes of rice. • 15,000 tonnes of soybean oil. • 70,000 tonnes of sugar. • 4,000 tonnes of beef. • 4,000 tonnes of dried milk.
What substitutes can be produced in T&T at competitive international prices – and by whom?
November 2012
CTA/CCST Marketing
Boards
©
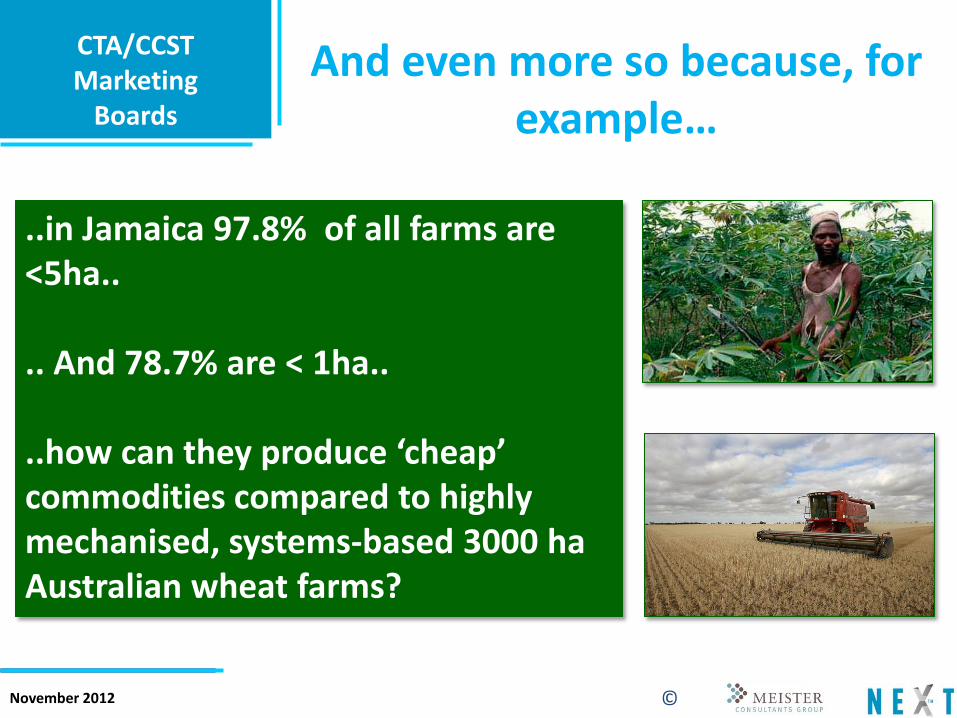
And even more so because, for example…
..in Jamaica 97.8% of all farms are <5ha.. .. And 78.7% are < 1ha.. ..how can they produce ‘cheap’ commodities compared to highly mechanised, systems-based 3000 ha Australian wheat farms?
November 2012
CTA/CCST Marketing
Boards
©
A view of how we could achieve that
“The agricultural sector in small island nations should be maximising the addition of real value to locally produced food and
the value created should be used to pay for the import of cheap commodity foods (which will always be the case in relative terms if
global food prices continue to increase).”
What a great idea!
November 2012
CTA/CCST Marketing
Boards
©
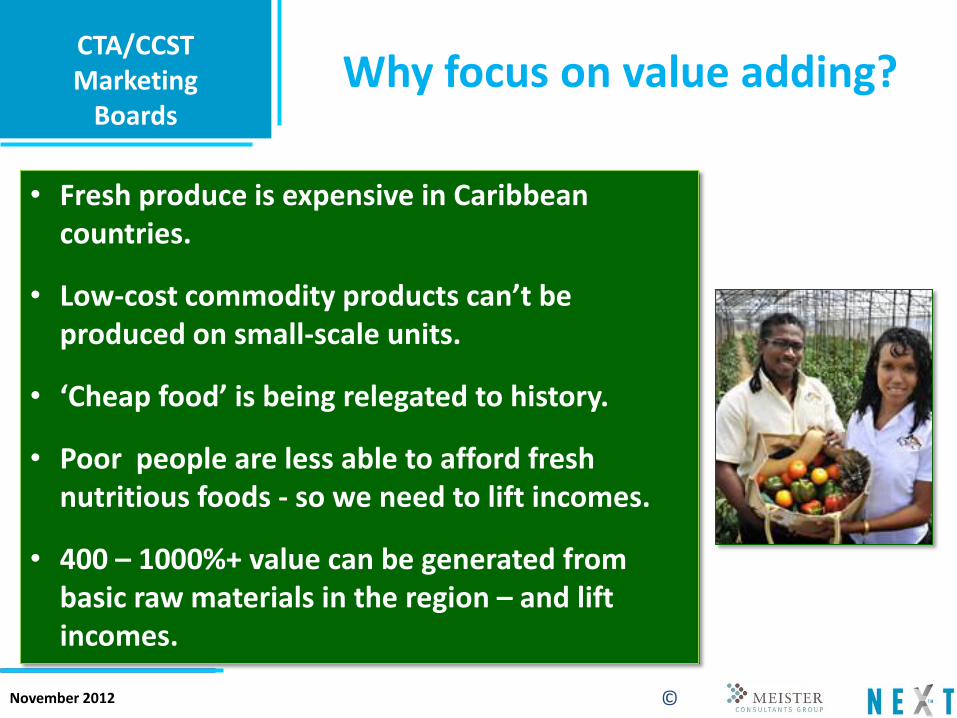
Why focus on value adding?
• Fresh produce is expensive in Caribbean countries.
• Low-cost commodity products can’t be produced on small-scale units.
• ‘Cheap food’ is being relegated to history.
• Poor people are less able to afford fresh nutritious foods - so we need to lift incomes.
• 400 – 1000%+ value can be generated from basic raw materials in the region – and lift incomes.
November 2012
CTA/CCST Marketing
Boards
©
Marketing Boards vs. Entrepreneurs
November 2012
CTA/CCST Marketing
Boards
©
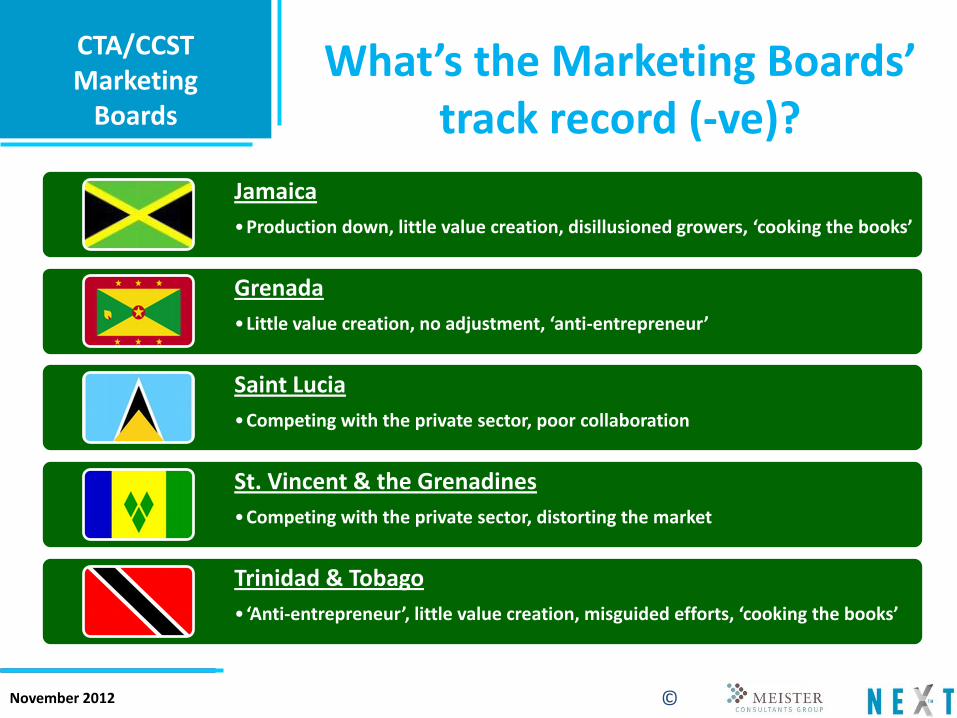
What’s the Marketing Boards’ track record (-ve)?
Jamaica
•Production down, little value creation, disillusioned growers, ‘cooking the books’
Grenada
•Little value creation, no adjustment, ‘anti-entrepreneur’
Saint Lucia
•Competing with the private sector, poor collaboration
St. Vincent & the Grenadines
•Competing with the private sector, distorting the market
Trinidad & Tobago
• ‘Anti-entrepreneur’, little value creation, misguided efforts, ‘cooking the books’
November 2012
CTA/CCST Marketing
Boards
©
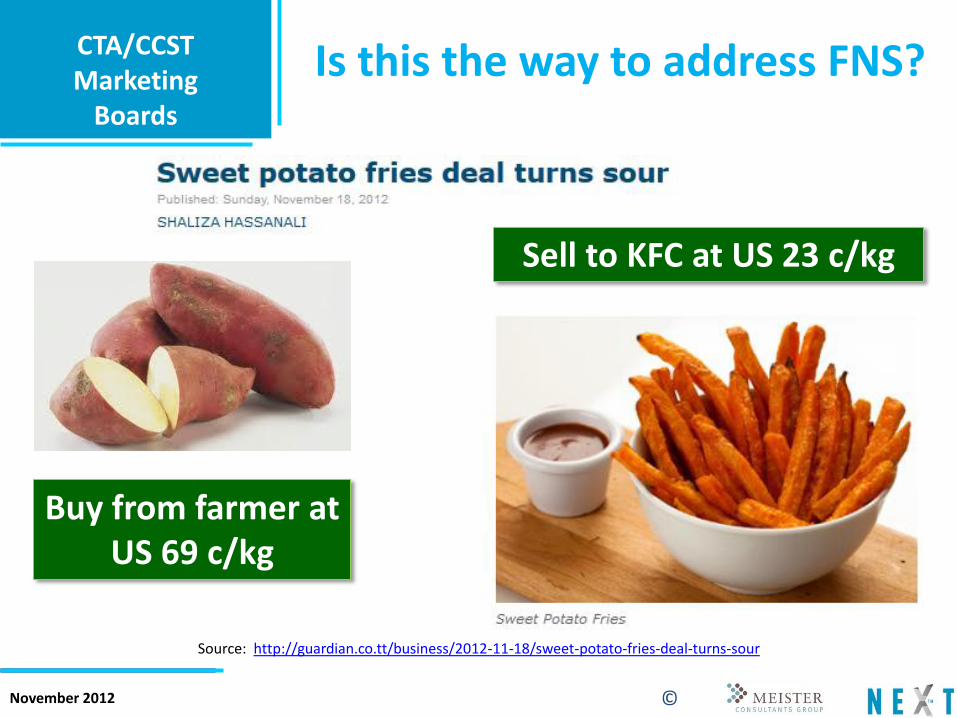
Is this the way to address FNS?
Source: http://guardian.co.tt/business/2012-11-18/sweet-potato-fries-deal-turns-sour
Buy from farmer at US 69 c/kg
Sell to KFC at US 23 c/kg
November 2012
CTA/CCST Marketing
Boards
©
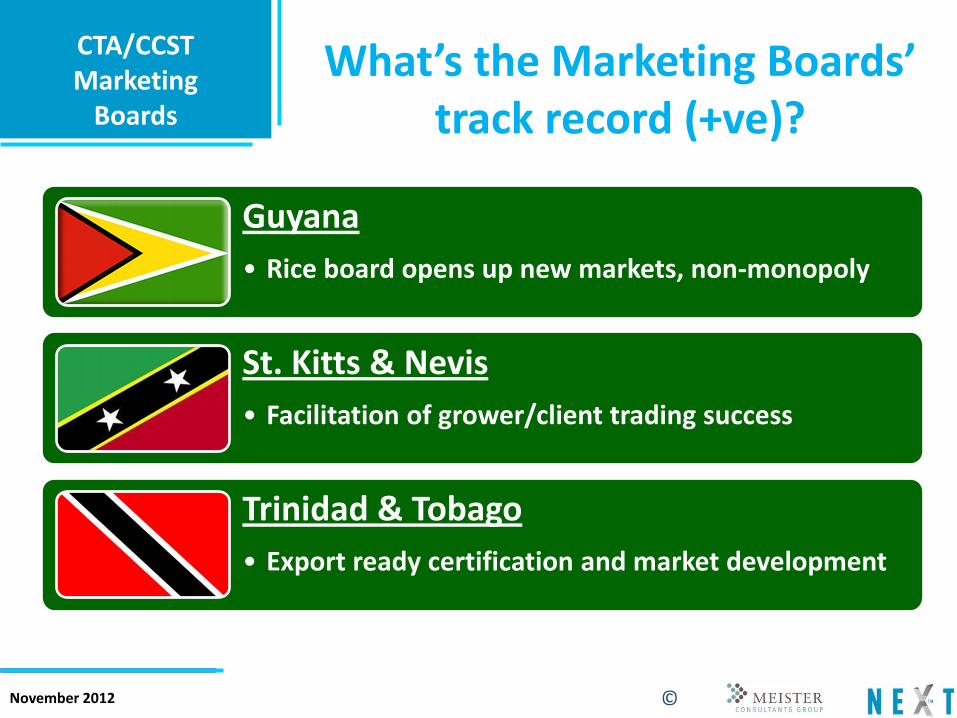
What’s the Marketing Boards’ track record (+ve)?
Guyana
• Rice board opens up new markets, non-monopoly
St. Kitts & Nevis
• Facilitation of grower/client trading success
Trinidad & Tobago
• Export ready certification and market development
November 2012
CTA/CCST Marketing
Boards
©
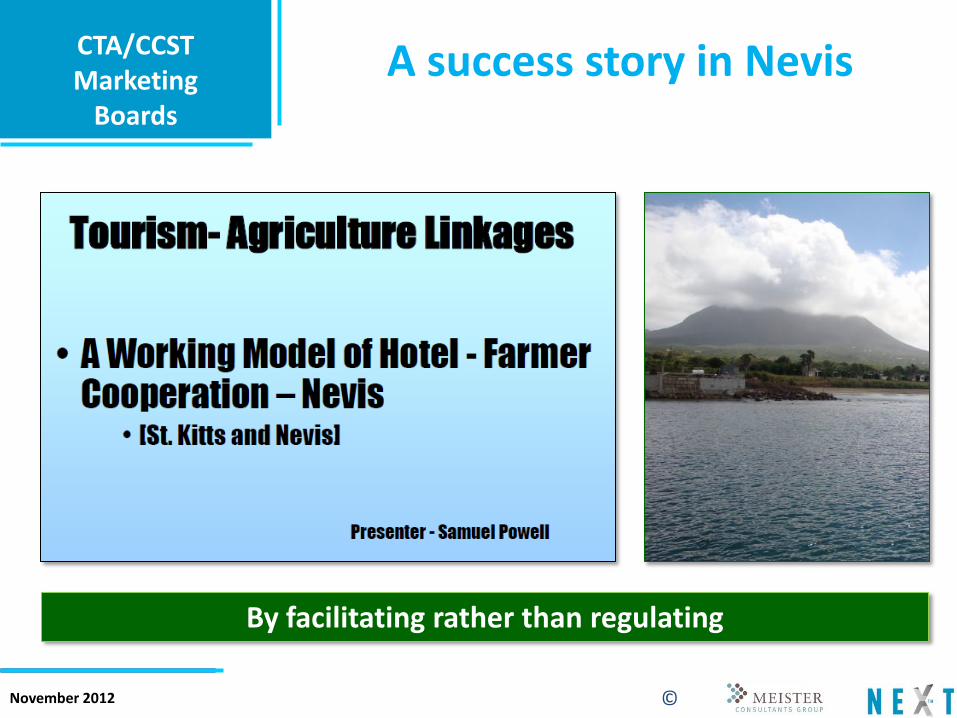
A success story in Nevis
By facilitating rather than regulating
November 2012
CTA/CCST Marketing
Boards
©
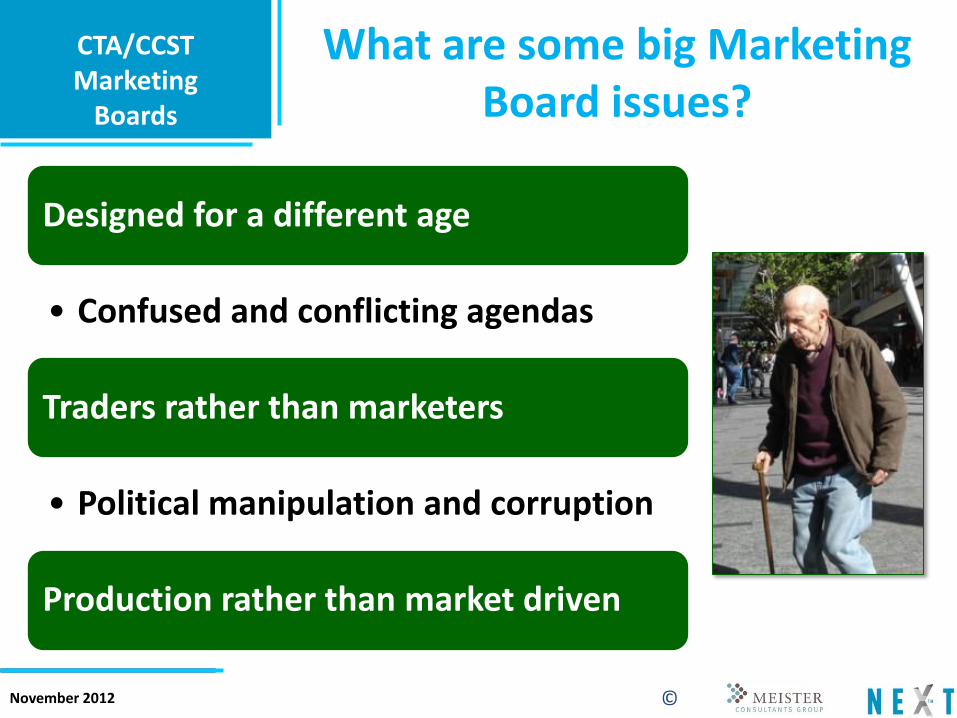
What are some big Marketing Board issues?
Designed for a different age
• Confused and conflicting agendas
Traders rather than marketers
• Political manipulation and corruption
Production rather than market driven
November 2012
CTA/CCST Marketing
Boards
©
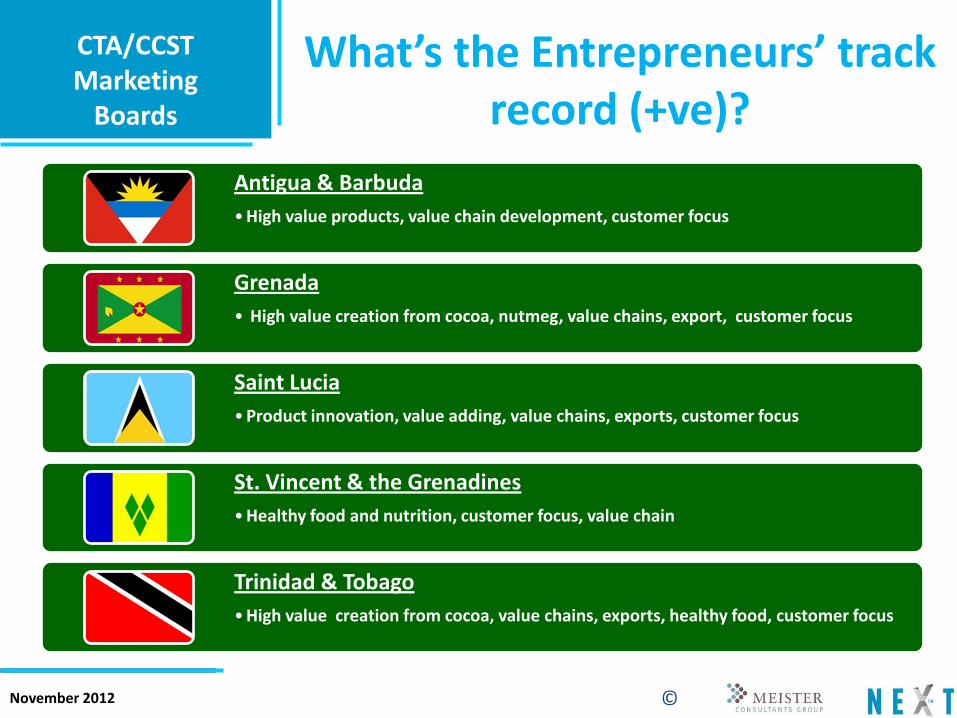
What’s the Entrepreneurs’ track record (+ve)?
Antigua & Barbuda
• High value products, value chain development, customer focus
Grenada
• High value creation from cocoa, nutmeg, value chains, export, customer focus
Saint Lucia
• Product innovation, value adding, value chains, exports, customer focus
St. Vincent & the Grenadines
• Healthy food and nutrition, customer focus, value chain
Trinidad & Tobago
• High value creation from cocoa, value chains, exports, healthy food, customer focus
November 2012
CTA/CCST Marketing
Boards
©
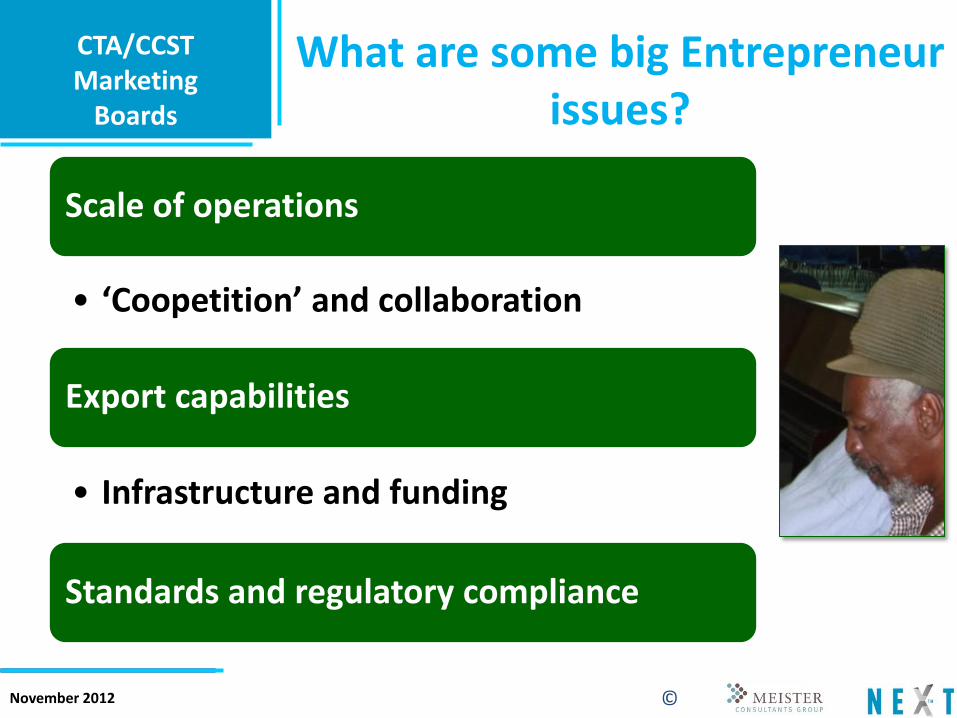
What are some big Entrepreneur issues?
Scale of operations
• ‘Coopetition’ and collaboration
Export capabilities
• Infrastructure and funding
Standards and regulatory compliance
November 2012
CTA/CCST Marketing
Boards
©
Going forward - some thoughts
November 2012
CTA/CCST Marketing
Boards
©
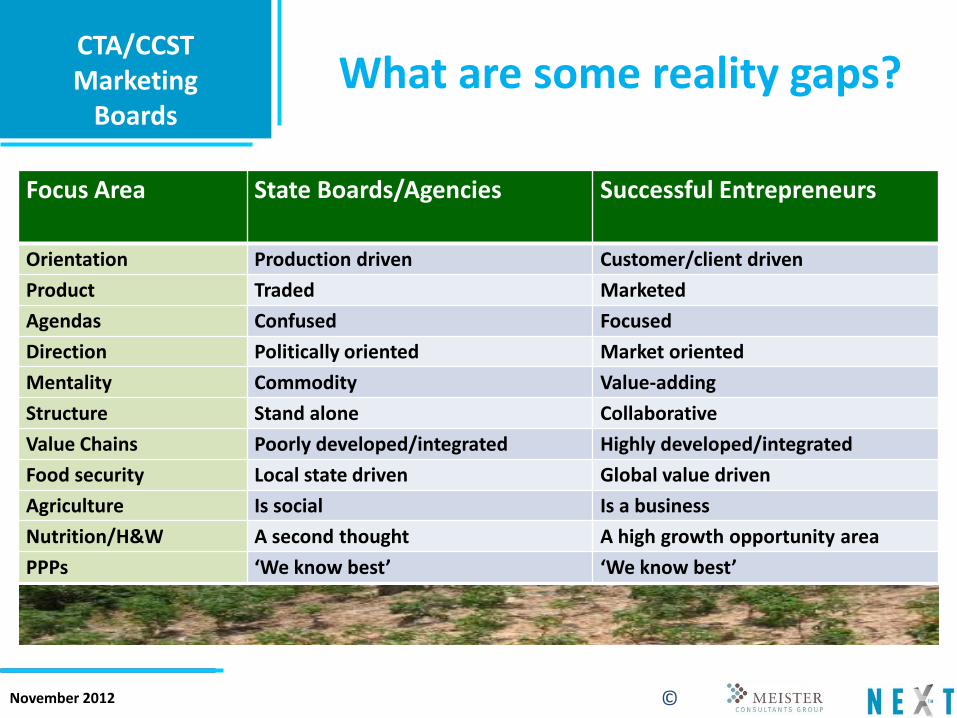
What are some reality gaps?
Focus Area State Boards/Agencies Successful Entrepreneurs
Orientation Production driven Customer/client driven
Product Traded Marketed
Agendas Confused Focused
Direction Politically oriented Market oriented
Mentality Commodity Value-adding
Structure Stand alone Collaborative
Value Chains Poorly developed/integrated Highly developed/integrated
Food security Local state driven Global value driven
Agriculture Is social Is a business
Nutrition/H&W A second thought A high growth opportunity area
PPPs ‘We know best’ ‘We know best’
November 2012
CTA/CCST Marketing
Boards
©
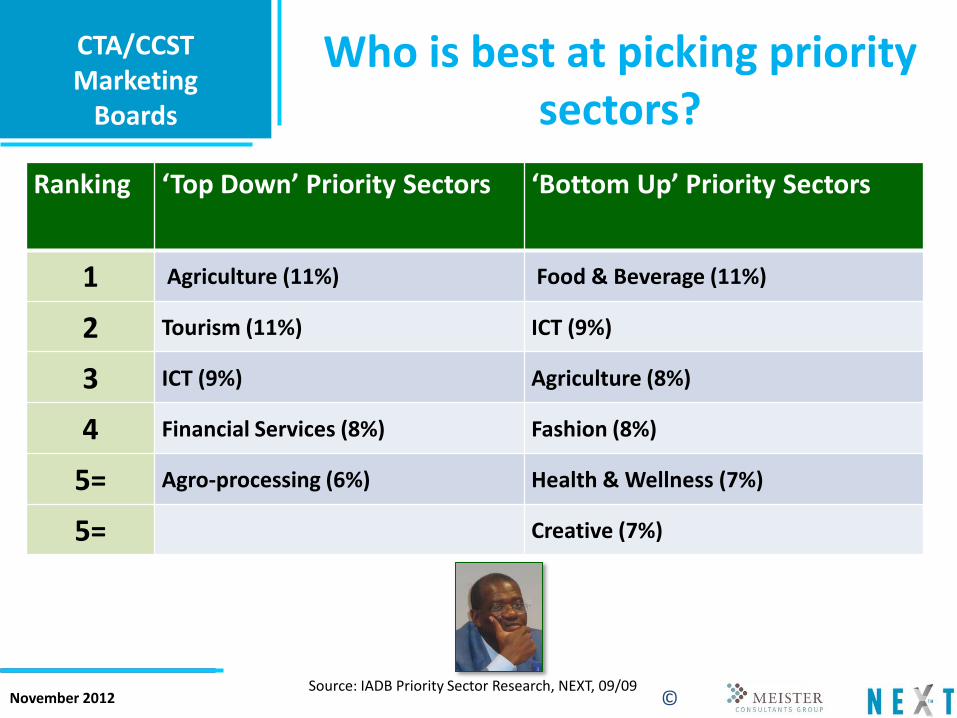
Who is best at picking priority sectors?
Ranking ‘Top Down’ Priority Sectors ‘Bottom Up’ Priority Sectors
1 Agriculture (11%) Food & Beverage (11%)
2 Tourism (11%) ICT (9%)
3 ICT (9%) Agriculture (8%)
4 Financial Services (8%) Fashion (8%)
5= Agro-processing (6%) Health & Wellness (7%)
5= Creative (7%)
Source: IADB Priority Sector Research, NEXT, 09/09
November 2012
CTA/CCST Marketing
Boards
©
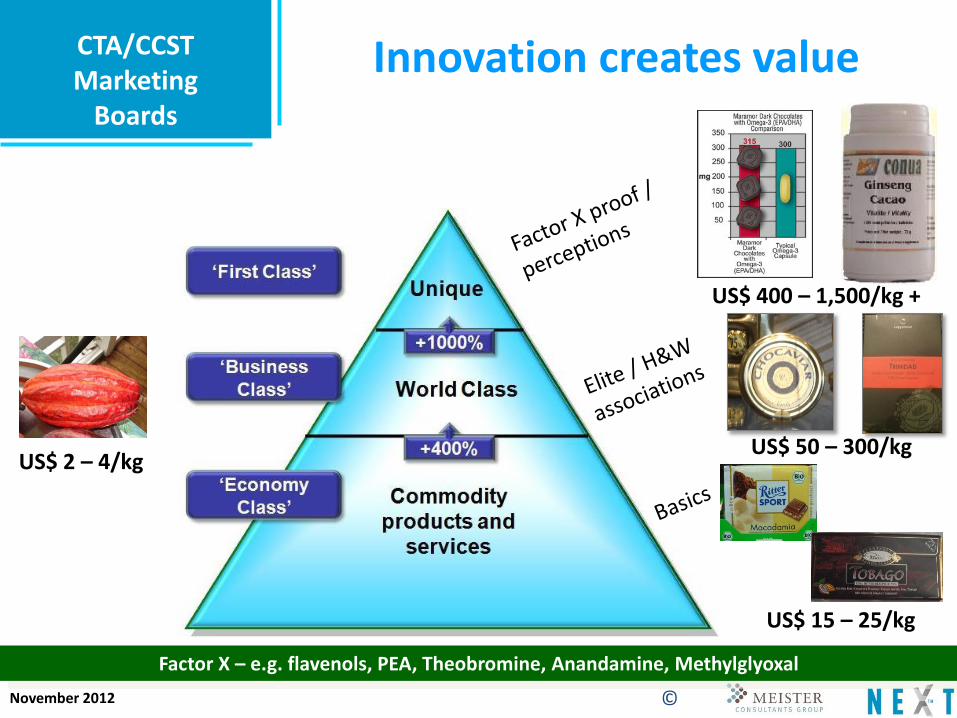
Innovation creates value
Factor X – e.g. flavenols, PEA, Theobromine, Anandamine, Methylglyoxal
US$ 400 – 1,500/kg +
US$ 50 – 300/kg
US$ 15 – 25/kg
US$ 2 – 4/kg
November 2012
CTA/CCST Marketing
Boards
©
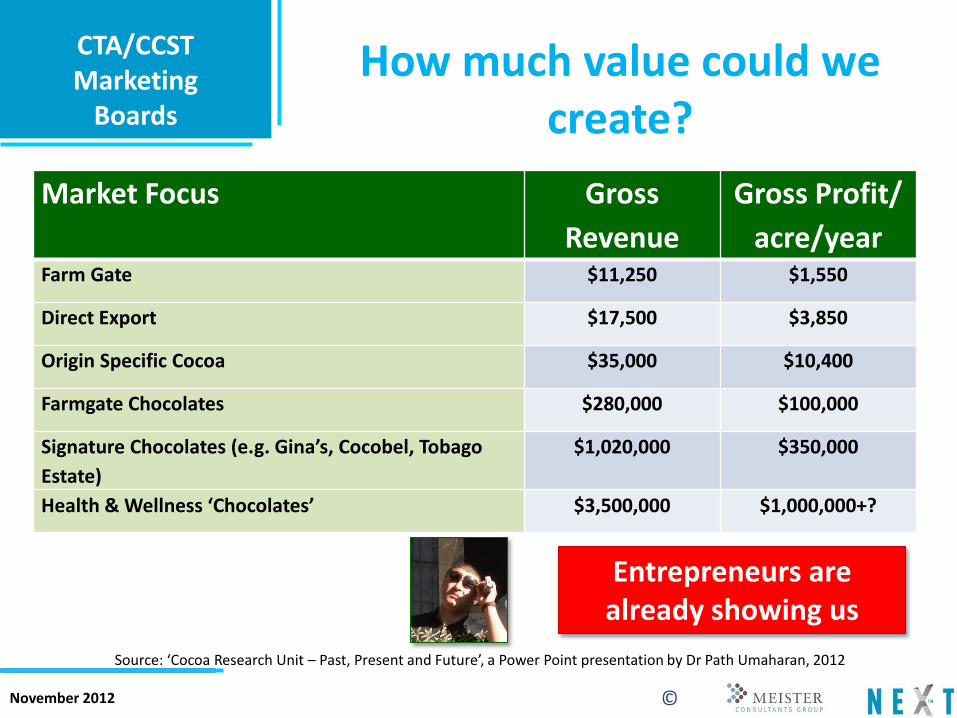
How much value could we create?
Market Focus Gross
Revenue
Gross Profit/
acre/year Farm Gate $11,250 $1,550
Direct Export $17,500 $3,850
Origin Specific Cocoa $35,000 $10,400
Farmgate Chocolates $280,000 $100,000
Signature Chocolates (e.g. Gina’s, Cocobel, Tobago
Estate)
$1,020,000 $350,000
Health & Wellness ‘Chocolates’ $3,500,000 $1,000,000+?
Source: ‘Cocoa Research Unit – Past, Present and Future’, a Power Point presentation by Dr Path Umaharan, 2012
Entrepreneurs are already showing us
November 2012
CTA/CCST Marketing
Boards
©
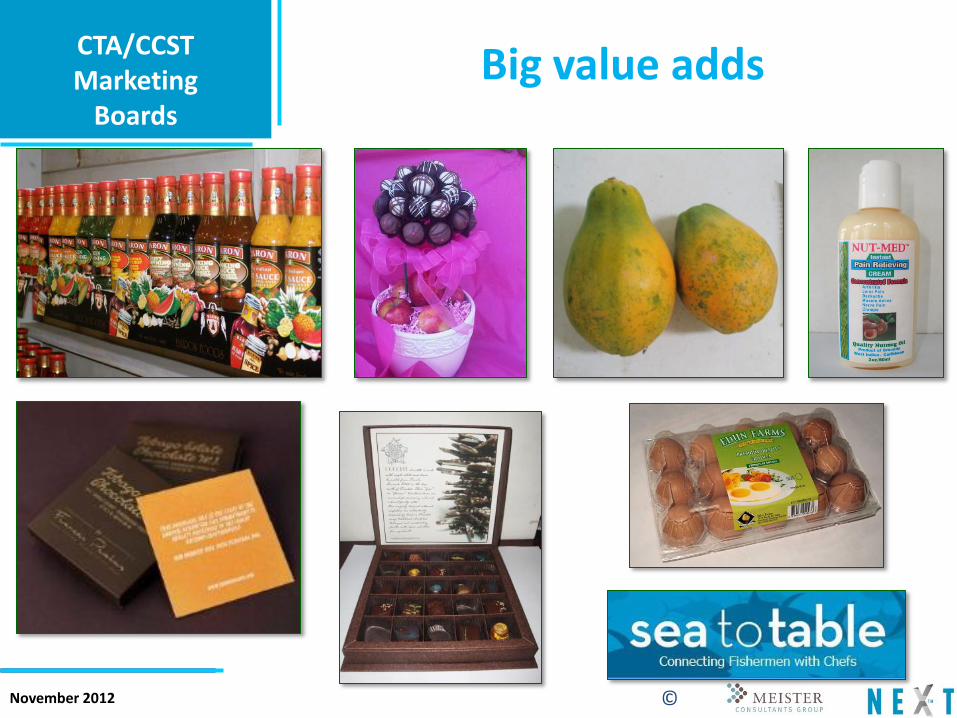
Big value adds
November 2012
CTA/CCST Marketing
Boards
©
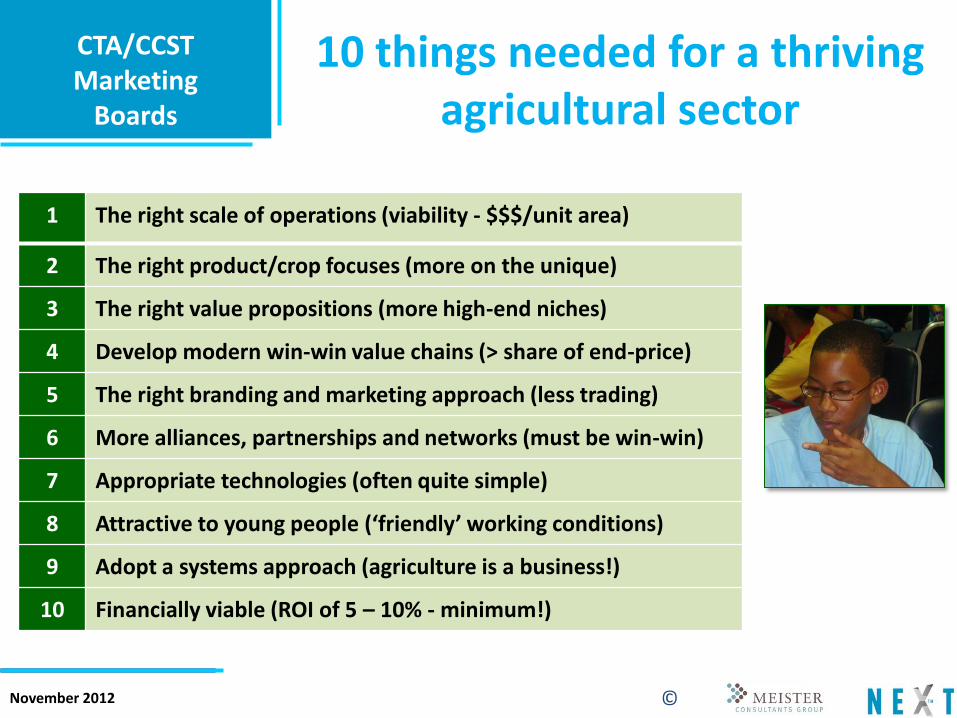
10 things needed for a thriving agricultural sector
1 The right scale of operations (viability - $$$/unit area)
2 The right product/crop focuses (more on the unique)
3 The right value propositions (more high-end niches)
4 Develop modern win-win value chains (> share of end-price)
5 The right branding and marketing approach (less trading)
6 More alliances, partnerships and networks (must be win-win)
7 Appropriate technologies (often quite simple)
8 Attractive to young people (‘friendly’ working conditions)
9 Adopt a systems approach (agriculture is a business!)
10 Financially viable (ROI of 5 – 10% - minimum!)
November 2012
CTA/CCST Marketing
Boards
©
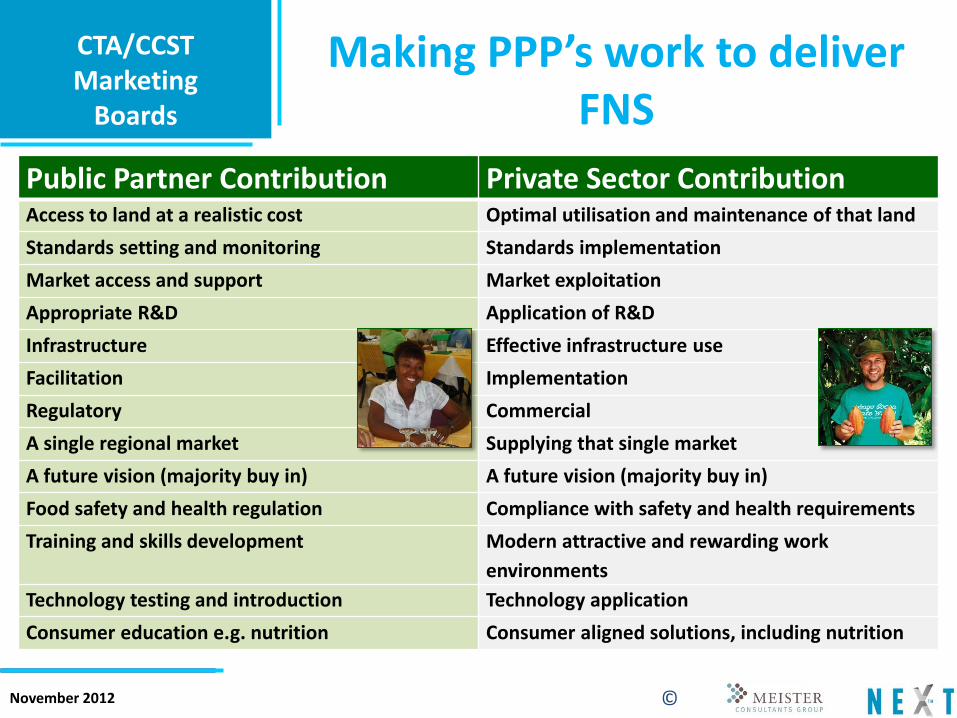
Making PPP’s work to deliver FNS
Public Partner Contribution Private Sector Contribution Access to land at a realistic cost Optimal utilisation and maintenance of that land
Standards setting and monitoring Standards implementation
Market access and support Market exploitation
Appropriate R&D Application of R&D
Infrastructure Effective infrastructure use
Facilitation Implementation
Regulatory Commercial
A single regional market Supplying that single market
A future vision (majority buy in) A future vision (majority buy in)
Food safety and health regulation Compliance with safety and health requirements
Training and skills development Modern attractive and rewarding work
environments
Technology testing and introduction Technology application
Consumer education e.g. nutrition Consumer aligned solutions, including nutrition
November 2012
CTA/CCST Marketing
Boards
©
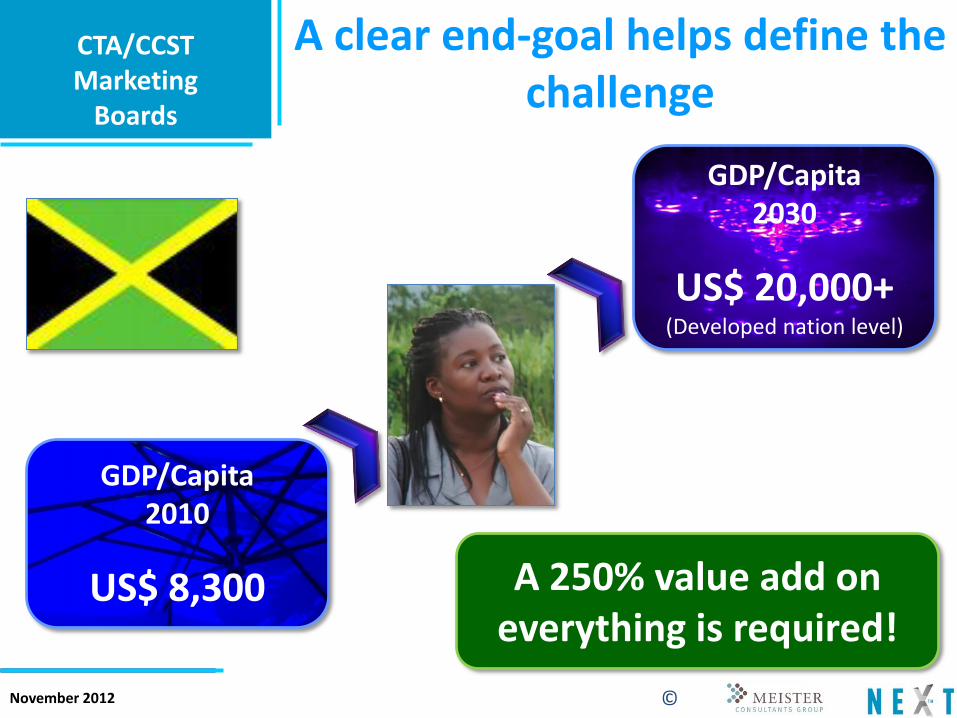
A clear end-goal helps define the challenge
A 250% value add on everything is required!
GDP/Capita 2010
US$ 8,300
GDP/Capita 2030
US$ 20,000+ (Developed nation level)
November 2012
CTA/CCST Marketing
Boards
©
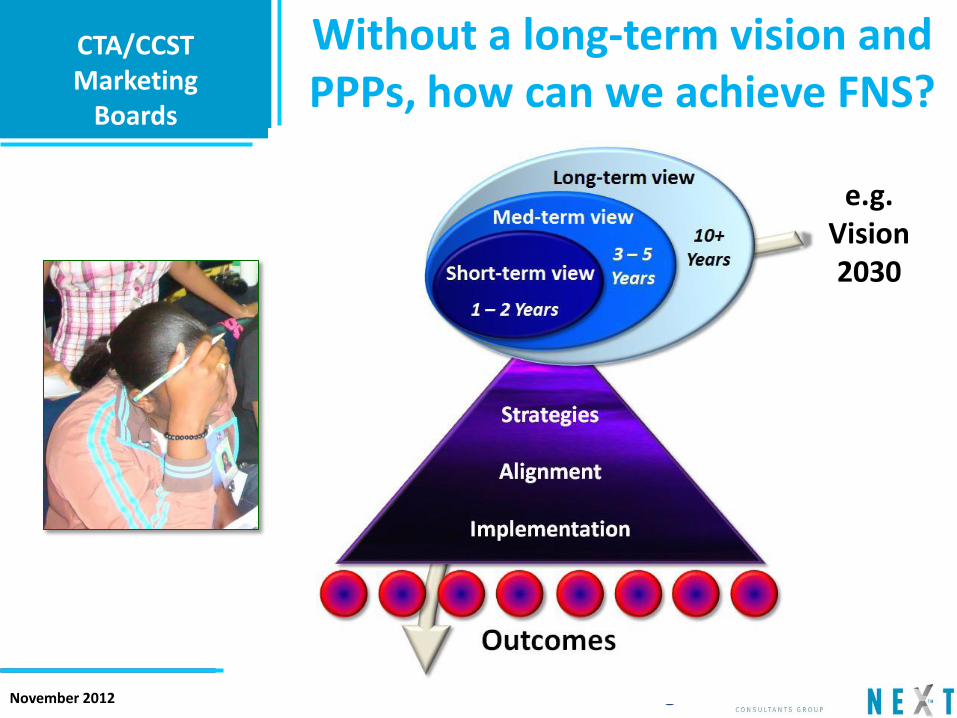
1 – 2 Years
Without a long-term vision and PPPs, how can we achieve FNS?
e.g. Vision 2030
November 2012
CTA/CCST Marketing
Boards
©
Thank you!