additional research needs to support the genii biosphere ... · additional research needs to...
TRANSCRIPT
Technical Letter Report PNNL-22506
Prepared for the U.S. Department of Energy under Contract DE-AC05-76RL01830
Additional Research Needs to Support the GENII Biosphere Models
BA Napier SF Snyder C Arimescu
November 2013
DISCLAIMER This report was prepared as an account of work sponsored by an agency of the United States Government. Neither the United States Government nor any agency thereof, nor Battelle Memorial Institute, nor any of their employees, makes any warranty, express or implied, or assumes any legal liability or responsibility for the accuracy, completeness, or usefulness of any information, apparatus, product, or process disclosed, or represents that its use would not infringe privately owned rights. Reference herein to any specific commercial product, process, or service by trade name, trademark, manufacturer, or otherwise does not necessarily constitute or imply its endorsement, recommendation, or favoring by the United States Government or any agency thereof, or Battelle Memorial Institute. The views and opinions of authors expressed herein do not necessarily state or reflect those of the United States Government or any agency thereof. PACIFIC NORTHWEST NATIONAL LABORATORY operated by BATTELLE for the UNITED STATES DEPARTMENT OF ENERGY under Contract DE-AC05-76RL01830 Printed in the United States of America Available to DOE and DOE contractors from the Office of Scientific and Technical Information,
P.O. Box 62, Oak Ridge, TN 37831-0062; ph: (865) 576-8401 fax: (865) 576-5728
email: [email protected] Available to the public from the National Technical Information Service, U.S. Department of Commerce, 5285 Port Royal Rd., Springfield, VA 22161
ph: (800) 553-6847 fax: (703) 605-6900
email: [email protected] online ordering: http://www.ntis.gov/ordering.htm
This document was printed on recycled paper.
(9/2003)
Technical Letter Report PNNL-22506
Additional Research Needs to Support the GENII Biosphere Models BA Napier SF Snyder C Arimescu November 2013 Pacific Northwest National Laboratory Richland, Washington 99352 PR Reed, Project Manager NRC Job Code V6237 U.S. Nuclear Regulatory Commission Office of Nuclear Regulatory Research Washington, D.C. 20555-0001
iii
Summary
In the course of evaluating the current parameter needs for the GENII Version 2 code (Snyder et al. 2013), areas of possible improvement for both the data and the underlying models have been identified. As the data review was implemented, PNNL staff identified areas where the models can be improved both to accommodate the locally significant pathways identified and also to incorporate newer models. The areas are general data needs for the existing models and improved formulations for the pathway models.
It is recommended that priorities be set by NRC staff to guide selection of the most useful improvements in a cost-effective manner. Suggestions are made based on relatively easy and inexpensive changes, and longer-term more costly studies. In the short term, there are several improved model formulations that could be applied to the GENII suite of codes to make them more generally useful. These are:
Implementation of the separation of the translocation and weathering processes
Implementation of an improved model for carbon-14 from non-atmospheric sources
Implementation of radon exposure pathways models
Development of a Keyhole Markup Language (KML) processor for the output report generator module data that could be superimposed upon digital maps for easier presentation and display
Implementation of marine mammal models (manatees, seals, walrus, whales, etc.)
Modifications to include a radionuclide transport model for estuarine environments.
Data needs in the longer term require extensive (and potentially expensive) research. Before picking any one radionuclide or food type, a review of current and anticipated environmental analyses should be made to select “dominant” radionuclides of interest to allow setting of cost-effective priorities for radionuclide- and pathway-specific research. These include
soil-to-plant uptake studies for oranges and other citrus fruits
Development of models for evaluation of radionuclide concentration in highly-processed foods such as oils and sugars
Sediment/radionuclide transport models in estuary, ocean, and freshwater environments.
Finally, renewed studies of radionuclide cleanup in various modern types of municipal water treatment facilities such as advanced filtration or reverse-osmosis processes may be performed without development of any new or costly experimental facilities.
v
Acronyms and Abbreviations
BSC Bechtel SAIC Company
DOE U.S. Department of Energy
EPA U.S. Environmental Protection Agency
EURT East Urals Radioactive Trace
IAEA International Atomic Energy Agency
IRSE Institute of Radiation Safety and Ecology
KML Keyhole Markup Language
MODARIA Modelling and Data for Radiological Impact Assessments (by IAEA)
NRC U.S. Nuclear Regulatory Commission
ONIS Opytnaya Nauchno-Issledovatel’skaya Stantsiya
PNNL Pacific Northwest National Laboratory
SAC System Assessment Capability
SAIC Science Applications International Corporation
STS Semipalatinsk Test Site
TRS Technical Report Series (by IAEA)
WLM Working Level Month
vii
Contents
Summary ........................................................................................................................................... iii
Acronyms and Abbreviations ............................................................................................................. v
1.0 Introduction ................................................................................................................................ 1
2.0 Data Needs for Existing Models ................................................................................................. 3
2.1 Plant/Crop Factors .............................................................................................................. 3
2.2 Animal Product Factors ...................................................................................................... 5
2.3 Aquatic Biota Factors ......................................................................................................... 5
2.4 Other Scenario-Specific Factors ......................................................................................... 7
2.5 Opportunities for Additional Data for Current Models ...................................................... 7
3.0 Improved Model Formulations ................................................................................................. 11
3.1 Expanded Consideration of Crops .................................................................................... 11
3.2 Expanded Consideration of Animal Products .................................................................. 13
3.3 Revised or Added Model Processes ................................................................................. 14
3.3.1 Translocation/Weathering (removal processes) .................................................... 15
3.3.2 Food Processing Losses ........................................................................................ 16
3.3.3 Carbon-14 Specific Activity Modeling for Non-atmospheric Sources ................. 16
3.3.4 Predator Animal Home Ranges ............................................................................. 16
3.3.5 Non-Standard Inhalation Scenarios ....................................................................... 17
3.3.6 Enhanced Water Vapor Exposure ......................................................................... 17
3.3.7 Supplementary Methods of Determining Transfer Factors ................................... 18
3.3.8 Radon .................................................................................................................... 19
3.3.9 Accident Analyses – Acute Models ...................................................................... 20
3.3.10 Surface Water Transport – Estuarine Model ......................................................... 20
3.3.11 Surface Water Transport – Sediment/Radionuclide Interactions .......................... 21
3.4 Advanced Display Capabilities ........................................................................................ 23
4.0 Recommendations .................................................................................................................... 25
5.0 References ................................................................................................................................ 27
1
1.0 Introduction
Radiological dose assessments are most efficiently and, in many cases, necessarily performed with software codes. In many instances where dose assessments are necessary to be performed for nuclear power station and other nuclear facility radiological releases to members of the public, the data and information required to perform these assessments may not be available. This may include data and information for plants, animal products, freshwater and saltwater food products, and data for other code parameters. It is important that this information be readily available for use by the NRC staff for routine and emergency analyses following radiological releases. In addition, the staff needs to know where the code could be improved. Therefore, the additional information needs can be broken down into two major components:
1. Data needs for the existing models to improve currently available capabilities
2. Model needs to improve or expand environmental model scope
a. To better estimate media concentrations
b. To expand the scope of media that are evaluated
In the course of evaluating the current parameter needs for the GENII Version 2 code (Snyder et al. 2013), areas of possible improvement for both the data and the underlying models have been identified.
The current models encompass major pathways that impact the majority of the population, but may omit pathways that are locally or regionally important. The potential research areas identified include not only radionuclide uptake in generic plants and animals and freshwater and saltwater food products but also some locally significant food sources. For example, although the available models are generally adequate for a typical suburban lifestyle, Executive Order 12898 of February 11, 1994, Federal Actions To Address Environmental Justice in Minority Populations and Low-Income Populations requires that other, less common but no less important, exposure conditions be evaluated.
As the data review was implemented, PNNL staff identified areas where the models can be improved both to accommodate the locally significant pathways identified and also to incorporate newer models such as those suggested in NUREG/CR-6910 (Napier 2006). Such modeling revisions could themselves require the generation of baseline parameter data.
3
2.0 Data Needs for Existing Models
“Adequate” parameterization for existing models is important for the determination of “adequate” results. The quotes are used because environmental modeling is inherently uncertain, so that exact discrete or even distributed values are rarely possible to implement. The model goal is usually to either prudently over-estimate or to develop a typical best-estimate result for the output of interest. An important category of parameters in environmental models is transfer coefficients (correspondingly referred to as transfer, uptake, bioconcentration, or bioaccumulation factors). Transfer coefficients are implemented in early parts of models, and therefore impact all downstream calculations.
The transfer coefficients presented in Snyder et al. (2013) are compiled from existing literature sources. The most complete sources are major reviews conducted by volunteers associated with programs administered by the International Atomic Energy Agency (i.e., TRS-364; TRS-422; TRS-472). (Many of the results of these programs have been separately published in, for example, the Journal of Environmental Radioactivity, e.g., Howard et al. 2009.) Thus, many original sources are referenced in one or more of the major reviews, and so there are really not as many data sources as it may initially seem. For example, the article on animal product transfer factors by Howard et al. (2009) is instructive in that it discusses the search for original sources (many historically originating from the Soviet Union) and traces their use in sequential reviews. In the Howard et al. (2009) extensive review of the possible radionuclide/food product combinations, they were able to derive transfer coefficient values for only about half of the combinations. Of these, the majority are based on less than 5 data points and only 21 of the 333 combinations are based on more than 10 data points. Not surprisingly, Cs, Sr, and I in cows’ milk (which has the most complete dataset) have the greatest number of sources and are the only radionuclides where the transfer factors are each based on >100 data points. Thus, although it is frequently suggested that radiological assessments be based upon site-specific data, it is almost never the case that transfer factor data are site- (or even regionally- or nationally-) specific.
2.1 Plant/Crop Factors
The soil-to-plant concentration ratio depends on the radionuclide, the soil type (which may include soil chemistry and concentrations of nutrients and analogues), and the plant type. The transfer factors are empirically derived; they are based on measurements made for specific chemical forms of the radionuclide on selected types of plant in selected soil types. Experimental data are not available for all elements for all food types. Frequently, a few measurements on a very limited number of plant types and growing conditions are used to infer a transfer factor for all crops. Often, when no referenceable documents are available, data are derived based on chemical groupings in the periodic table of the elements, such that chemically similar elements are assigned similar values.
Current models are intentionally limited to a few generic crop types. The limited number of food crops is beneficial to the analyst, because it minimizes the number of parameters that must be determined. However, this approach may be seen as ethnocentric and biased by members of some groups in the public. The recent IAEA review (TRS-472) provides information for a wide range of crop types (leafy vegetables, non-leafy vegetables, leguminous vegetables, root crops, tubers, grasses, leguminous fodder, pasture, herbs, and other crops; a separate section discusses fruits). The definition of “fruit” is broad and includes a ‘woody trees’ group (e.g., apple, pear, peach, apricot, olive, orange and grapevine), a ‘shrubs’ group (e.g., gooseberry, blackcurrant, red raspberry and red currant), and an ‘herbaceous plants’ group
4
(e.g., strawberry, melon, watermelon and rhubarb). It is obvious that “fruit” covers a wide range of morphologies; insufficient data are available to differentiate them at this time. In Snyder et al. (2013), following the convention of a number of codes, this has been categorized into only four types (leafy vegetables, other vegetables, fruits, and grains).
A potentially important determinant of site-specific concentration ratios is soil type. Investigations by Napier et al. (2007; 2012) have indicated that regionally-distinct soil types can have a significant difference in root uptake by equivalent vegetation. The recent IAEA compendium provides some information for sand, loam, and clay type soils, but the information is sparse and frequently unavailable. The compilation of concentration ratios in Snyder et al. (2013) used the “All” soil type as the default. It could be possible to generalize uptake for different chemical classes for the different soil types (slight increase, average, slight decrease) and apply chemical class/soil type adjustments to approximate site-specific corrections; this has not yet been investigated further.
The leafy vegetable category has the most available data. In modeling, this category generally combines human-consumed vegetables with animal-consumed grasses and forage. Of the elements in the periodic table, 42 have soil-to-plant uptake factors reported for at least one type of crop (although some of these may be for stable elements); many may also have been assigned on the basis of chemical similarity to measured values (e.g., Ng et al. 1982a). Most measurements are for Sr, Cs, and I. Napier et al. (2007; 2012) investigated Tc, Pu, Am, Np, and I in three soils of potential importance to nuclear waste disposal scenarios in an attempt to expand the available information for alfalfa but no human-consumed leafy vegetables; this type of investigation is slow and expensive.
The other vegetable category, which includes root crops, has a similar amount of data. Of the elements in the periodic table, 79 have soil-to-plant uptake factors reported for at least one type of crop (more may also have been assigned on the basis of chemical similarity to measured values). Most measurements are for Sr, Cs, and I. Napier et al. (2007; 2012) investigated Tc, Pu, Am, Np, and I in three soils of potential importance to nuclear waste disposal scenarios in an attempt to expand the available information for potatoes and onions, but no other root crops.
The fruit category has only a limited dataset to draw from. The main independent review is that of the IAEA (TRS-472); a broad-brush examination of stable elements in several types of fruits with use of neutron activation analysis by Napier et al. (2013) provides most of the remainder. Overall, this category has the fewest measurements reported. Widely consumed crops such as melons and oranges are lacking a solid database.
Grains are a particularly difficult group to categorize. The models were originally set up for seed-type grains such as wheat. However, one of the predominant crops grown as a grain feed in the United States is corn (maize). This is morphologically much different than wheat, and combining the two is probably inappropriate but is never-the-less common. Additionally, corn feed in the form of greenchop or silage is commonly modeled as grain, again, probably inappropriately. Napier et al. (2007; 2012) investigated Tc, Pu, Am, Np, and I in three soils of potential importance to nuclear waste disposal scenarios in an attempt to expand the available information for corn. Many of the values reported in literature compendia are actually imputed on the basis of chemical similarity.
Experimental evaluation of soil-to-plant uptake is time consuming and expensive, because multiple realizations of several types of plant/soil combinations must be grown, harvested, and analyzed. Uptake

5
in perennial plants such as trees is difficult to analyze because it takes longer to grow trees and shrubs to producing size, and often this cannot be done in laboratory settings because of the ultimate size of the tree. However, the only other sources of information are either analyses of accidental releases of material into the environment or studies of (potentially non-relevant) stable isotopes. Napier et al. (2013) have computed some chronic-exposure transfer factors for a single location for a number of tree types (not including citrus), with information about the woody parts of the tree as well as the fruit; this could be used as the basis for initial development of a tree model.
2.2 Animal Product Factors
The best database of transfer coefficients for farm animals is that for milk. The tabulated values in Snyder et al. (2013) are for cows’ milk; transfer parameters are also available for goat’s and sheep’s milk, although these are fewer in number. Not all of the transfer factors are experimentally derived values; the agricultural/animal nutrition literature contains a wealth of data on many stable elements in milk and herbage that has also been used to derive transfer parameters. Many of the elements considered may be under homeostatic control (where the organism maintains internal equilibrium by varying its physiological processes), and the transfer will therefore not be linear with the intake rate. However, given the large databases on which these values have been based, they are likely to be representative of ‘typical values’.
The transfer factors for meat presented in Snyder et al. (2013) are for beef. Additional transfer parameters are available for other frequently-consumed meats such as pork, sheep, and goats. IAEA (TRS-472) reports measured transfer factors for beef for 26 elements; most of the others tabulated are the result of approximations based upon chemical similarity (e.g., Ng et al. 1982b). The 26 elements cover most of the important radionuclides encountered in routine or accident analyses. Many fewer experiments are available for elements for the other meat types (15 for sheep, 11 for pork, 7 for goats). In modeling analyses, the beef transfer factors could be substituted for these animals.
The transfer factors for poultry are primarily for domesticated chickens. A total of 17 elements have been directly measured; other transfer factors are approximates. For eggs, estimates are also primarily for chickens. A total of 22 elements have been directly measured; other transfer factors are approximates (e.g., Ng et al. 1982b). Other bird eggs are sometimes consumed (duck, emu, and ostrich); transfer factors for these types of eggs are essentially non-existent. Allometric approaches (those based on biological scaling based on body mass) may be attempted to estimate concentrations of contaminants in non-chicken eggs (see below).
The best available transfer factors are based on reliable measurements of animals exposed in controlled conditions. Transfer factors are difficult to determine experimentally. Frequently, studies are reported of a time-series of measurements on single animals. Problems of radioactive waste management are magnified when experimenting with large animals.
2.3 Aquatic Biota Factors
The compilation of Snyder et al. (2013) considers the generic categories of marine biota to be (fin) fish, crustaceans, molluscs, and water plants/seaweeds for both freshwater and marine environments.
6
These are wide and somewhat arbitrary groupings and some people might further group crustaceans and molluscs as “shellfish”.
IAEA (TRS-472) provides a fairly complete list of elemental concentration ratios for freshwater fish; 49 elements have actual measured data. A difficulty with the compilation is that different fish inhabit different trophic levels – some are bottom feeders, some are piscivorous hunters. The simple concept of a water-to-fish transfer is inadequate to separate these different levels in the food chain. Therefore, there are wide variabilities associated with the values.
The database for freshwater invertebrates (molluscs) is similar; 45 elements have measured data. That for crustaceans has less data; only 21 elements are reported. As an approximation, freshwater mollusk data can be applied to the freshwater crustacean category.
The database for marine biota is somewhat larger than that for freshwater. IAEA (TRS-422) provides fish transfer factors for about 60 elements (although several of these are expert judgment extrapolations via chemical similarity). In similar fashion, 60 elements are also reported for marine molluscs and crustaceans. In IAEA (TRS-422), a separate category of molluscs is provided for cephalopods (squid and octopus). This category is not used in Snyder et al. (2013) because the GENII model does not include it specifically. The 60 elements considered cover nearly all of the radionuclides with sufficient fission production, half-life, or environmental persistence to be important for environmental analyses. Specialized sources of radioactive material, such as accelerators or isotope production facilities, may not be completely covered by this list.
As with freshwater fish, trophic level is not explicitly addressed in the concentration ratios for marine fish. As a result, “fish” is a generic category and there may be wide variability by species. In particular, the Scombroidea (e.g., mackerels, tuna, bonitos, swordfish, and sailfish) and billfish (e.g., spearfish and marlin) are most likely not well represented. Little to no data for most radionuclides apply to these types of sport fish. Because the concentration ratios are based on local concentrations of radionuclides in water, there is a more general problem – some fish have a very large range for hunting for food (for example, tuna found off of the US coast of California found with relatively high concentrations of cesium were most likely contaminated in waters far from where they were caught (e.g., Reuters; Fukushima radiation seen in tuna off California, http://www.reuters.com/article/2012/05/28/us-japan-nuclear-tuna-idUSBRE84R0MF20120528). Bluefin tuna only spawn in the western Pacific, off the coasts of Japan and the Philippines. As young fish, some migrate east to the California coast, where upwelling ocean water brings food. Adequately modeling these fish using local water concentrations and concentration ratios would be difficult if not impossible without consideration of their migratory patterns and home ranges (discussed below).
The database for aquatic plants in the IAEA review (TRS-422) provides, again, information for 60 elements for phytoplankton, zooplankton, and macroalgae for marine environments. Only the macroalgae is used in most modeling approaches. For freshwater environments, the database is slimmer – only 21 elements have direct measurements, but it is extended by other investigators using chemical similarity.
The derivation of concentration ratios is somewhat easier for aquatic biota, because large animals need not be kept penned for most categories. However, for marine biota as well as freshwater biota, the difficulty with the compilation is that the simple concept of a water-to-fish transfer is inadequate to
7
separate biota at different trophic levels. Therefore, there are wide variabilities associated with the values.
2.4 Other Scenario-Specific Factors
The fraction of plant roots in surface soil is used in the food crop and animal feed analyses and represents the fraction of plant roots that are in the contaminated soil layer. The uptake by plants is assumed to be proportional to this fraction. For most analyses in which soil contamination is caused by deposition from an airborne or waterborne source, this is adequate. However, for analyses of spills or other mechanisms that result in direct contamination of soil, some research in this assumption would be valuable.
The Water Purification Factor value is used in modeling treatment plant purification of domestic drinking water. The parameter value indicates the ratio of the contaminant concentration after and before purification. The majority of the values used are based on historical measurements of activation products in the Columbia River removed through use of an alum floc type plant. Additional research in other modern types of water treatment facilities, such as reverse osmosis, would make these values more justifiable. A review of the types of water treatment currently used in the United States would provide a basis for more in-depth analysis.
Resuspension of contaminants from the surface into the air is an area in which the parameters have a very high variability. Many years of research have not elucidated a simple underlying construct to reduce the variability. It is unlikely that additional research will result in a significant reduction in the uncertainty in this parameter.
The current application of weathering/translocation in the GENII model is simplistic and probably inappropriate. See discussion below on additional pathway model development.
2.5 Opportunities for Additional Data for Current Models
One source of information about multiple radionuclides of interest that has not been adequately tapped remains the Russian studies of the special research institute to evaluate the results of environmental contamination of farm fields and forests; this Pilot Scientific Research Station was known by its Russian acronym ONIS (Opytnaya Nauchno-Issledovatel’skaya Stantsiya). ONIS was established in 1958 following an explosion in 1957 of a tank containing high-level radioactive waste at the Mayak Production Association (Mayak PA) in western Siberia (sometimes called the “Kyshtym explosion” in the western literature). The tank contained about 20 million Ci at the time of the explosion, and about 10% of that was distributed beyond the boundaries of the Mayak site (beyond 5 km from the site of the explosion). The downwind transport of the material created a contaminated area known as the East Urals Radioactive Trace (EURT). The mixture of radionuclides released consisted primarily of short-lived fission products with a low amount of cesium and a larger amount of strontium. Because of its longer half-life, 90Sr has been used as a tracer. The area contaminated to activity densities greater than 2 Ci/km2 of 90Sr is about 1000 km2.
The research agenda for ONIS included
selection of agricultural crops that minimized uptake of 90Sr,
8
determination of optimum farming and irrigation practices that minimize crop nuclide levels,
animal breeding and feeding practices to minimize uptake of radionuclides, and
determination of optimum food product processing to reduce contamination.
The focus of research at ONIS varied over time. An approximate history includes:
1962: radiation genetics and radioecology of animals;
1963-1964: environmental behavior of non-strontium radionuclides including uranium and iodine; studies of global fallout; justification of permissible levels of radioactive materials in foods; resilience of agriculture to nuclear war;
1967: biogeochemical characteristics of fresh radionuclide mixtures;
1970s: experimental assessment of forests and grasslands; large-scale tritium and 129I studies, soil-plant and plant-animal transfers for neutron activation products, 14C, and plutonium; synergistic effects of radionuclide and chemical pollution; and radioecological principles of waste management;
early 1980s: generalization of the collected information into a still-classified 60-volume report;
1986-early 1990s: the staff at ONIS was heavily involved with the response to the Chernobyl accident;
early 1990s: ecological problems of the southern Urals area with focus on the EURT and Techa River contamination;
1998: ONIS staff and research folded back in to the Mayak Central Plant Laboratory.
Immediately following the 1957 tank explosion, radioactive contamination of soils was as high as 4000 Ci/km2, sufficiently high so as to be lethal to pine forests (about 20 km2 were killed). The areas within the Mayak PA boundaries were largely scraped clean, and regions of the EURT farther away were deep plowed. However, an area was set aside as a radioecological test site. This area, known as the Eastern Urals Reservation, is 8 to 9 km across and about 40 km long to the northeast of the Mayak site. Because it is closed to most human access, this reserve has become home to a wide variety of plants and animals.
More than 150 experimental sites have been established within the Eastern Urals Reservation. In addition to the contamination resulting from the EURT, additional radionuclides have been added to some experimental plots. A wide spectrum of radionuclides, including fission products, activation products, plutonium, and uranium have been added. These plots have been studied for soil-to-plant uptake of these additional radionuclides.
In addition to the soil-to-plant studies, a vivarium (now closed) was established within the reservation. At this location, several dozen head of livestock such as pigs, sheep, and cows were raised. The animals were exposed to radionuclides by oral or intravenous application. Resulting radionuclide concentrations in meat, organs and tissues were evaluated. Those animals were allowed to feed on native vegetation and had generally higher concentrations in their meat and tissue than wild animals; this is in part because the domestic animals were not allowed to range beyond the confines of the vivarium, and thus only were exposed in the areas of highest radioactivity. The effects on subsequent generations of animals were also considered.

9
The Mayak Central Plant Laboratory, Laboratory of Radiation Monitoring, which absorbed most of the ONIS staff, retains the records of the ONIS efforts. Prior to 1986, all Mayak and ONIS information was officially classified. Nearly all of the extensive work performed prior to this time remains in classified holdings. Most work related to environmental contamination, modeling of artificial radionuclides, behavior of radionuclides in plant and animal systems, and food and food-crop related activities has since been officially declassified; however, before individual pieces of information can be released they must be reviewed and approved – this can be a very time-consuming and expensive process. Relatively little of the work has been published in the open literature. Never-the-less, a great deal of data that is of potential interest to the US Nuclear Regulatory Commission has historically been performed at ONIS and Mayak. A wealth of information could be provided through a systematic review, organization, and publication of the historical work. This would require more than just summarization, because some of the early work would have been done with historical measurement techniques which would require review and perhaps revision to account for more recent improvements.
PNNL and NRC staff have had contacts with Mayak in the past. An agreement had been reached for NRC/RES funding to be channeled through PNNL to Mayak CPL to perform some of this work. However, changes in Russian international activities and Mayak management caused these efforts to end. Future efforts would be more fruitful if they could be conducted under the auspices of a full international agreement such as the US/Russian Joint Coordinating Committee on Radiation Effects Research, of which the NRC is a participant. Another alternative venue might also be through the IAEA’s Program on Modelling and Data for Radiological Impact Assessments (MODARIA) (http://goto.iaea.org/modaria ). The First Technical Meeting on MODARIA was held at IAEA headquarters in Vienna from 19 to 22 November 2012 and presentations and meeting papers in connection therewith are available on that website.
11
3.0 Improved Model Formulations
Potential improvements to current models in the areas of both expanded categorization of existing crop- and animal product models, as well as different parameterizations of current algorithms, are possible. The suggestions made here are focused on the GENII biosphere model (Napier et al. 2012).
3.1 Expanded Consideration of Crops
The current model parameterization is based on a limited number of terrestrial food crops and animal products. Historically, additional food crop types have been considered in some US models (e.g., FOOD, Napier et al. 1980) including:
Leafy vegetables Other above-ground vegetables Potatoes Other root vegetables Berries Melons Orchard Fruit Wheat Other Grain
The logic used in reducing this list to the current four major types was the observation that all types of vegetation used a single soil-to-plant uptake factor. In the years since the early 1980s, additional work reflected in IAEA (2010) and NRC studies (Napier et al. 2007; 2012) has broadened the possibilities for adding additional divisions of food type. The driver for subdividing the food types would be both public acceptance (people are more comfortable with describing their diets in terms of a range of common foods) and morphological differences in plant growth and growing season, size, and leaf-to-edible-portion ratios. The existing information such as that in IAEA (2010) would generally support this type of expansion, although with relatively large uncertainties.
Even if significant changes were not made in most crop categories, an important change that needs to be made relates to fruit and nut tree crops. In the United States, oranges account for 20% of tree fruit consumption. Citrus trees in general are under-represented in the database of uptake factors. Some work was done in relation to the US space program launches of plutonium-238-powered spacecraft (Pinder et al. 1987); additional investigations for other radionuclides would be useful.
Tree nuts are an additional subcategory that would benefit from model changes. Nuts are lumped with fruits in IAEA compilations (IAEA 2010). Work by Napier et al. (2013) indicates that nut concentrations of contaminants are approximately equal to tree fruit concentrations on a dry weight basis (thus, nuts as consumed would have a higher concentration than fruits per unit consumed mass). However, annual consumption of nuts is substantially lower than that of fruits for most people.
A food type that was demonstrated to be highly contaminated following the Chernobyl accident is mushrooms. Mushrooms do not clearly belong to any of the four main food categories. Substantial work has been done on forest mushrooms, as summarized in IAEA (2010). However, transfer factors for

12
mushrooms derived from the Chernobyl experience are limited to primarily cesium, with a few additional data points for strontium and plutonium. In the United States, most people consume commercially-raised mushrooms which are farmed on specially sterilized composted agricultural wastes in large barns or warehouses; mushrooms collected from wild sources are a specialty food for some ethnicities and an expensive delicacy harvested in limited areas. If mushrooms were to be included as a food type, additional laboratory work on transfer factors for a wide variety of radionuclides would be required. As noted by IAEA (2010), the uptake of radionuclides by mushrooms is difficult to quantify because of the difficulty of knowing the exact location within the soil, both vertically and horizontally, of the radionuclides being absorbed. As a result, the transfer coefficients to mushrooms are highly variable (3–4 orders of magnitude). This variability arises for several reasons:
The intensity of transfer is highly dependent on the species The mycelium depth determines the contamination chronology The type of mushroom can affect the degree of transfer.
Any experimental work would ideally standardize each of these variables, preferably in a manner that separately considers commercial production and wild production.
A second type of expansion is less obvious but perhaps more technically needed. The EPA divides foods into various categories in the Exposure Factors Handbook (EPA 2011). One of the main categories that have not been explicitly modeled is food sweeteners. Although mostly highly refined, sweeteners are a substantial portion of processed foods. Sugar and related sweeteners are derived from cane, sugar beets, agave, and other crops – each of which has its own morphology and growing regime. Corn syrup is also highly processed. Sugar is not necessarily a “southern” crop – sugar beets are grown extensively in the Pacific Northwest (Idaho, Washington). Addition of sweeteners to the list of crops considered would probably require additional consideration of the processing losses (discussed below).
Related to bulk sweeteners are “tree syrups” such as maple syrup, birch syrup, and, in tropical areas, coconut beer derived from coconut tree sap. These are a specialty item in most areas, but the omission of coconut sap beer from the early food pathway analysis of islanders on Eniwetok Atoll resulted in oversight of surprisingly large doses. Tree sap sweeteners are much less refined than traditional crystalline sugar and the key research would be in the transfer of contaminants to tree sap.
An unrelated sweetener is honey from bees (e.g., Bonazzola et al. 1991; Fulkery et al. 1998). Accumulation of radionuclides in honey has been reported; however, no models for estimating concentration from environmental contamination levels are known. Bonazzola et al. (1991) reported that honey can be contaminated by radionuclides accumulating in soils or plants. The primary pathway of contamination is plant nectar; pollen did not appear to be a dominant contributor. However, the radionuclide content did not appear to be correlated between radionuclides. In addition, the vegetation concentration varied sufficiently that multifloral honeys could not be traced. These investigations concluded that consideration of the botanical sources of the honey was also insufficient to allow use of honey as a bioindicator. Although possibly of public interest in the United States, it is unlikely that a reasonable model could be constructed for application in simulation modeling.
Another type of expansion is related to the EPA food category of vegetable oils. In the U.S., the Standard of Identity for a product labeled as "vegetable oil margarine" specifies only canola, safflower, sunflower, corn, soybean, or peanut oil may be used. (See "21 CFR Part 166 Margarine". Code of Federal

13
Regulations Title 21, Chapter I, Subchapter B, Part 166. U.S. Food and Drug Administration, April 1, 2011. http://www.accessdata.fda.gov/scripts/cdrh/cfdocs/cfcfr/CFRSearch.cfm?CFRPart=166&showFR=1.) Oils are also a large category of food consumed that is not explicitly called out in the current formulations. Most oils could be considered to be a form of seed or grain that has been highly processed. Addition of vegetable oils to the list of crops (e.g., cottonseed) considered would probably require additional consideration of the processing losses (discussed below).
The dominant staple food crop in humid tropical countries around the world is rice. However, more than 100 varieties of rice are commercially produced primarily in six states (Arkansas, Texas, Louisiana, Mississippi, Missouri, and California) in the U.S., approximately half of which is expected to be exported. The U.S. provides about 12% of world rice trade. The majority of domestic utilization of U.S. rice is direct food use (58%), with 21% used in processed foods and 11% in beer, and the remaining 10% used in pet food (USDA 2009). Most rice is produced under flooded conditions, in fields covered by a 5–15 cm layer of water. Cultivation methods have important effects on plant uptake of radionuclides from soil. Under flooded conditions, oxygen is depleted quickly by the respiration of soil microorganisms and plant. After the disappearance of oxygen, various degrees of anaerobiosis occur and chemical reduction of mineral nutrients takes place. This farming practice is significantly different from the cultivation of cereals in unflooded fields. Therefore, there is a need to consider the soil to rice transfer factors separately from the transfer factors of other crops (IAEA 2010). The IAEA (2010) provide concentration ratios for soil-to-rice (not water-to-rice; the transfer is primarily through the roots) for 12 key radionuclides. If this crop type were to be included, additional research and development of concentration ratios for additional radionuclides would be necessary; a series of laboratory experiments would be advisable.
Various herbs and leaves are not consumed directly, but may be brewed into teas. The radionuclide transmission from teas may not be from the internally-deposited material but only from easily-removable surface deposits. A simple algorithm related to dissolution into hot water of materials deposited on the outer portions of plants may be adequate to provide an upper estimate of intake from this pathway. Simple experiments on release of surface-retained contaminants could provide input. This could provide a substantial public-acceptance benefit, because one of the primary objections to conventional modeling has been the omission of native foods used for teas or medicines.
3.2 Expanded Consideration of Animal Products
As noted above, meat is treated in modeling as beef. Other types of animals are not explicitly included. Data are available for sheep and goats, although not as complete as that for beef cattle. Meat is also generally modeled as muscle; organ meats such as liver are not specifically called out. Data for individual organs for most radionuclides are not available. If it were desired to estimate doses from preferential consumption of organ meats, additional research on the distribution of different radionuclides within animal organs would be needed.
Some people consume products from herded sheep and horses, or even dogs. Some limited data are available for actinides and long-lived fission products in these animals from measurements made at the Semipalatinsk Test Site in Kazakhstan. The Semipalatinsk Test Site (STS), known as the “polygon”, is a 19,000 km2 zone located in the northeast of Kazakhstan. Between 1949 and 1989, the former USSR conducted about 456 nuclear explosions at STS. Until 1963, most of the explosions were carried out on
14
the surface and in the atmosphere (including 126 atmospheric tests with 30 surface bursts). After the breakup of the Soviet Union, effective control over the area by local governments was lost. The region is a combination of arid plains and lightly forested mountains. Between 30,000 and 40,000 people live near the STS, and a small number of people actually live on the site, primarily semi-nomadic herders and farmers. Following the breakup of the Soviet Union, the Russian military moved out of the STS, and took nearly all environmental sample records and records of activities with them. The National Nuclear Center, Institute of Radiation Safety and Ecology (IRSE), in the city of Kurchatov, Kazakhstan, carries out research on radiation safety at the STS and on radioecology of plants and animals. Preliminary contacts1 indicate that information may be available for the radionuclides of tritium, cobalt, strontium, cesium, europium, plutonium, americium, and radon.
Arctic marine ecosystems near Alaska and the Former Soviet Union are very diverse with seasonally fluctuating physical conditions. Many native species are consumed by indigenous populations, particularly in the Arctic region. Interest in the arctic will increase as Fukushima-related materials are transported to the northern US coast. A compilation by Layton et al. (1997) provides recommended bioaccumulation factors for 5 radionuclides for groups of marine organisms from different trophic levels in Arctic ecosystems. In addition, a more extensive database on bioaccumulation factors is provided for 13 elements in Arctic waters for sea mammals by IAEA (2004) for pinnipeds (seals, sea lions), polar bears, and cetaceans (whales, dolphins, porpoises). Radionuclide and trace element data are extremely limited for marine mammals when compared with other marine organisms. Furthermore, the fact that many marine mammals are not in constant contact with water and that they derive most of their radionuclide or trace element burden directly from their food over a wide-ranging area makes evaluation of contaminated food intakes somewhat tenuous. Nevertheless, in order to make relevant comparisons with concentration factors in other marine species, concentration factors for mammals have been computed using ambient concentrations of radionuclides and trace elements in the surrounding waters. Whether appropriate or not, this is the model typically applied.
A final category of aquatic biota generally omitted from radiological assessments is herpetofauna: amphibians and reptiles (e.g., alligators, turtles, frogs, snakes, lizards, etc.). These foods are generally locally produced and consumed, although there is a minor interstate commerce in farmed alligator. A herpetofauna research program at Savannah River National Laboratory investigates such radionuclide uptakes (http://srelherp.uga.edu/index.htm); information from this program may be available for the derivation of transfer factors or concentration ratios. The IAEA (2009; 2010) provides a limited database of uptake factors for frogs and reptiles for a total of 16 elements (interestingly omitting Sr); concluding that relatively few data are available for edible species of herpetofauna. Inclusion of herpetofauna as a pathway in radiological assessments would require extensive experimentation or approximation.
3.3 Revised or Added Model Processes
Several GENII v2 algorithms were identified for revision. These revisions would improve or expand current models.
1 Personal communication, Dr. Larisa Ptitskaya, Director, Institute of Radiation Safety and Ecology, Kurchatov, Kazakhstan, to Bruce Napier
15
3.3.1 Translocation/Weathering (removal processes)
Absorption and translocation are related, but warrant qualification. Above-ground parts of plants (leaves, blossoms, fruits, and branches) can directly absorb water and minerals as well as soluble radionuclides. This process is called foliar absorption. Some radionuclides, once absorbed into the body of the plant, will remain at or very near the location from which they were absorbed. Other radionuclides may be transported via the phloem of the plant to other plant structures, organs, or fruits. This process is referred to as translocation. The processes of absorption and translocation are dependent on the physical and chemical forms of the contaminating radionuclides. Materials incorporated in relatively large particles are not easily absorbed, and so are unlikely to be affected by translocation. Contaminants in ionic form are more likely to be absorbed. Once absorbed, the processes of weathering from the plant are changed; transport by wind and rain are much reduced, although physical losses such as leaf drop will remain. For other than leafy vegetables, there is unfortunately no comprehensive compilation of the rates of retention nor translocation of radionuclides into the plant via foliar contamination; the IAEA (2009, 2010) evaluate all available data and provide a small amount of radionuclide-specific/plant-specific data. Overall, most translocation values are less than 10% - sometimes substantially less.
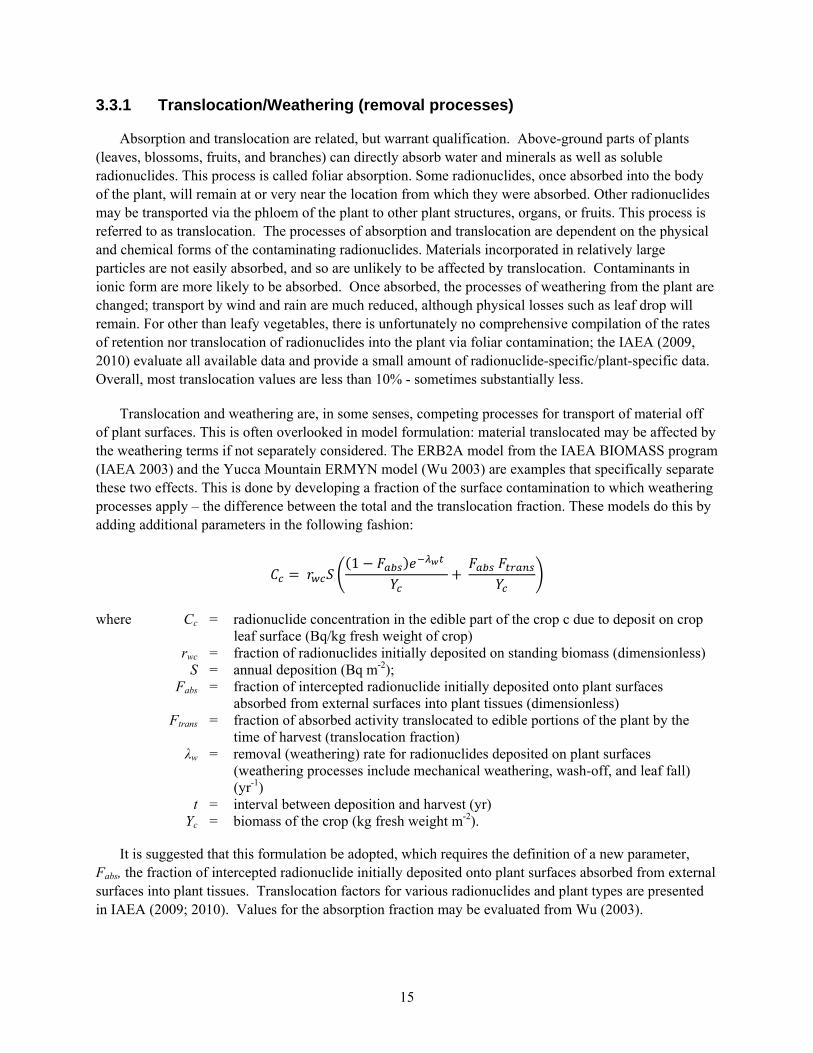
Translocation and weathering are, in some senses, competing processes for transport of material off of plant surfaces. This is often overlooked in model formulation: material translocated may be affected by the weathering terms if not separately considered. The ERB2A model from the IAEA BIOMASS program (IAEA 2003) and the Yucca Mountain ERMYN model (Wu 2003) are examples that specifically separate these two effects. This is done by developing a fraction of the surface contamination to which weathering processes apply – the difference between the total and the translocation fraction. These models do this by adding additional parameters in the following fashion:
1
where Cc = radionuclide concentration in the edible part of the crop c due to deposit on crop
leaf surface (Bq/kg fresh weight of crop) rwc = fraction of radionuclides initially deposited on standing biomass (dimensionless) S = annual deposition (Bq m-2); Fabs = fraction of intercepted radionuclide initially deposited onto plant surfaces
absorbed from external surfaces into plant tissues (dimensionless) Ftrans = fraction of absorbed activity translocated to edible portions of the plant by the
time of harvest (translocation fraction) λw = removal (weathering) rate for radionuclides deposited on plant surfaces
(weathering processes include mechanical weathering, wash-off, and leaf fall) (yr-1)
t = interval between deposition and harvest (yr) Yc = biomass of the crop (kg fresh weight m-2).
It is suggested that this formulation be adopted, which requires the definition of a new parameter, Fabs, the fraction of intercepted radionuclide initially deposited onto plant surfaces absorbed from external surfaces into plant tissues. Translocation factors for various radionuclides and plant types are presented in IAEA (2009; 2010). Values for the absorption fraction may be evaluated from Wu (2003).
16
3.3.2 Food Processing Losses
Changes in concentration in foods as a result of food preparation practices and activities are not commonly included in assessment models. Although such processes are routinely acknowledged, there is a relative scarcity in the literature of information as to how they should be handled. Evidence exists that soaking, peeling, boiling, or baking can effectively halve concentrations in consumed food. For instance, the EPA Exposure Factors Handbook does not even include a section about this process (EPA 2011).
Napier (2006) reports on the evaluation of food processing losses. The results of the computations confirm that for deterministic, maximum individual or critical group calculations, a processing retention of 1.0 is a reasonable and not overly conservative assumption. A value of 1.0 is always possible, and mean values for most food types are around 0.8 to 0.9. For leafy vegetables and other vegetables, the mean is about 0.8, ranging from 0.4 to 1.0. For fruits and grains, the mean is nearly 0.95, and the range is well under a factor of 2. The range for meat is from 0.3 to 1.0, with a mean of about 0.8. Only for milk is there a substantial variability and non-linearity: the result depends heavily on how much cheese is eaten in proportion to milk, because the making of cheese tends to reduce the contaminant concentrations.
As a conservative approach, food processing losses are not recommended for most food types. However, if commercially-distributed food types that are highly processed and broadly consumed by a significant fraction of the population (e.g., sweeteners or oils) are added as exposure pathways, a generic cleanup factor for the extensive processing should be added.
3.3.3 Carbon-14 Specific Activity Modeling for Non-atmospheric Sources
Current models include a specific-activity model for 14C uptake by plants from air. A similar model is needed for uptake from surface- and groundwater pathways; the model included in GENII (Napier et al. 2012) is inadequate.
Plants obtain most of their carbon via photosynthesis of CO2 from the air. Therefore, it is difficult to estimate the transfer of radioactive 14C from irrigation water or soil to plants. The approach adopted by Napier et al. (1988) is to assume that plants obtain a small fraction of carbon from soil, and to use that activity ratio. The approach used by Yu et al. (2001) is to assume that carbon in the soil slowly converts to CO2 and to then estimate a 14CO2 concentration in the air near crops. Due to the volatility of 14C in soil, it is quickly released via gaseous emission as 14CO2. Sheppard et al. (1991) measured the rate of 14C loss from soil in outdoor lysimeter experiments. Carbon loss rate from the soil, measured by the emission rate (the “evasion rate” in RESRAD), is 12 yr-1 for clay and loamy soils and 22 yr-1 for sandy and organic soils (Yu et al. 2001); thus, 14C concentrations in surface soil reach equilibrium within 1 to 2 months. Emission is the dominant mechanism for removing 14C from the soil. In comparison, losses due to leaching, radioactive decay, and soil erosion are slight. This approach allows a conservative estimation of average air concentrations of 14C from water-to-soil sources, and then the application of the atmospheric specific-activity model.
3.3.4 Predator Animal Home Ranges
An approach to evaluating the uptake of radionuclides into biota that range across large areas of variable contamination was pioneered in the Hanford System Assessment Capability (SAC) (Eslinger et
17
al. 2006). This model attempts to adjust for non-uniform contamination of the environment; that is, it adjusts the equilibrium transfer factor for an ‘average’ environment. This approach could be used, for instance, to deal with large predatory fish that roam over large regions of the ocean, such as tuna.
An arithmetic average of the contamination level to which the animal is exposed is used to calculate the smoothed result for like locations within a species’ home range. For example, an ‘average’ water concentration could be developed for fish, or an ‘average’ soil concentration could be developed for herbivorous mammals.
Although this is a very simple approach, it does require that estimates be made of concentration of radionuclides in water or soil for the entire range of the animal. Point estimates at specific locations are insufficient; all areas within the home range of the animal are required. For the current implementation of most models, this may require that preprocessing of environmental deposition or dilution predictions be made.
3.3.5 Non-Standard Inhalation Scenarios
Smoking is a pathway by which materials incorporated in plant material may be inhaled. Tobacco is the typical example of a plant that is smoked, but Native Americans and others also smoke traditional herbs and other plants. Smoking would be a pathway by which the quantity of material in a defined amount of plant material would be assumed to be vaporized and inhaled directly. For people outside of the immediate plume, or for water-borne sources, this could be a contributing factor to inhalation dose.
3.3.6 Enhanced Water Vapor Exposure
A similar under-evaluated exposure pathway is sweat bathing as part of the Sweat Lodge Ceremony, a traditional Native American custom (DOE 1997; Harris and Harper 1997). Based on tribal descriptions, between 0.5 and 3 hours/day on a weekly basis is assumed to be spent inside a sweat lodge kept at 60 - 80 degrees Centigrade (145 - 180 degrees Fahrenheit). No or very limited clothing is worn by the Ceremony participants. A large amount of wood is used to heat up the rocks in an open outside fire adjacent to the Lodge. The sweat lodge is heated with these hot rocks, onto which water is poured to create steam. Air inside the sweat lodge is assumed to be saturated with water (equivalent to 0.3 kilograms of water per m3 of air, and 0.3 L/m3 of semivolatiles and 2.5 L/m3 of volatiles), which are then available for inhalation and dermal absorption over the entire body. During the 1 hour of use, 4L of water is used. Doses resulting from intakes of some radionuclides via this pathway can be larger than the associated doses via drinking water if the radionuclides have low GI-tract absorption, since this is a mechanism for inhalation of large amounts of water (DOE 1997).
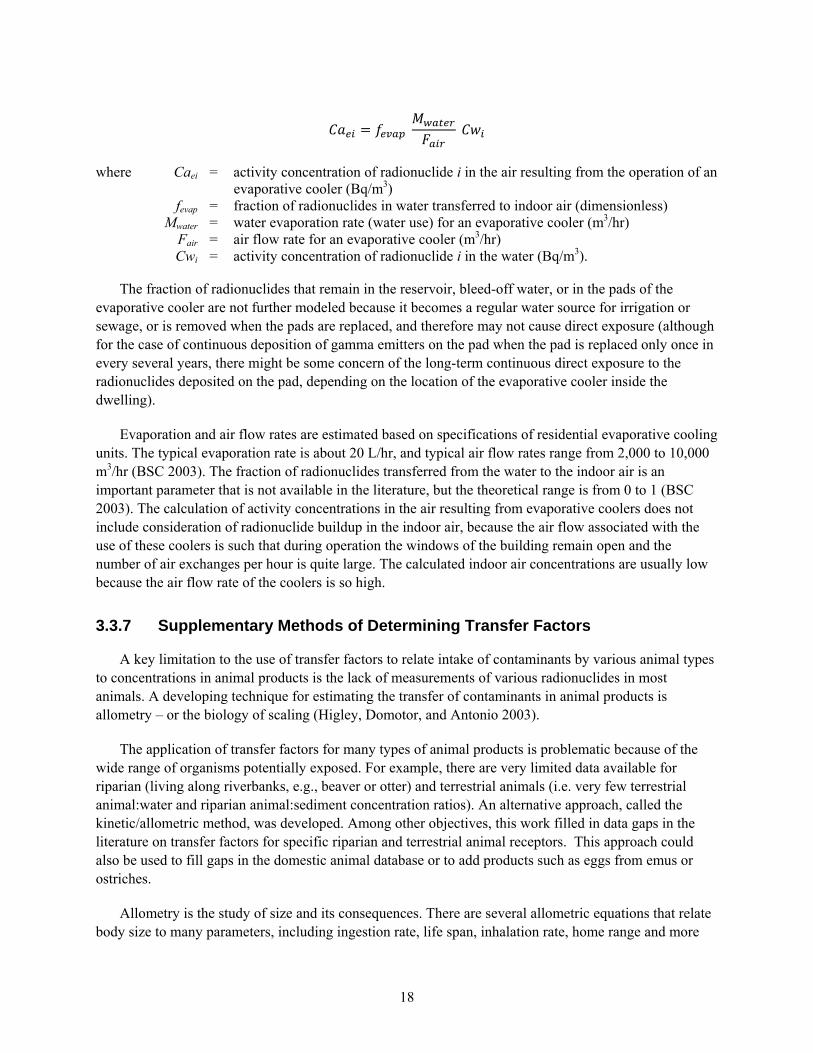
Evaporative coolers are commonly used in the hot, arid American West. Evaporative coolers cool air by evaporating a stream of water into a stream of air. These coolers might transfer water-borne radionuclides to the indoor air. Thus, modeling must include an estimate of the radionuclide concentrations in indoor air when evaporative coolers are in operation so that the radiation dose for the human receptor who inhales the contaminated air can be evaluated. Based on how evaporative coolers operate and the conservation of radioactivity (i.e., activity transferred to air is equal to the loss of activity from water), radionuclide concentrations in indoor air are estimated for this pathway by Wu (2003) as
18
where Caei = activity concentration of radionuclide i in the air resulting from the operation of an evaporative cooler (Bq/m3)
fevap = fraction of radionuclides in water transferred to indoor air (dimensionless) Mwater = water evaporation rate (water use) for an evaporative cooler (m3/hr) Fair = air flow rate for an evaporative cooler (m3/hr) Cwi = activity concentration of radionuclide i in the water (Bq/m3).
The fraction of radionuclides that remain in the reservoir, bleed-off water, or in the pads of the evaporative cooler are not further modeled because it becomes a regular water source for irrigation or sewage, or is removed when the pads are replaced, and therefore may not cause direct exposure (although for the case of continuous deposition of gamma emitters on the pad when the pad is replaced only once in every several years, there might be some concern of the long-term continuous direct exposure to the radionuclides deposited on the pad, depending on the location of the evaporative cooler inside the dwelling).
Evaporation and air flow rates are estimated based on specifications of residential evaporative cooling units. The typical evaporation rate is about 20 L/hr, and typical air flow rates range from 2,000 to 10,000 m3/hr (BSC 2003). The fraction of radionuclides transferred from the water to the indoor air is an important parameter that is not available in the literature, but the theoretical range is from 0 to 1 (BSC 2003). The calculation of activity concentrations in the air resulting from evaporative coolers does not include consideration of radionuclide buildup in the indoor air, because the air flow associated with the use of these coolers is such that during operation the windows of the building remain open and the number of air exchanges per hour is quite large. The calculated indoor air concentrations are usually low because the air flow rate of the coolers is so high.
3.3.7 Supplementary Methods of Determining Transfer Factors
A key limitation to the use of transfer factors to relate intake of contaminants by various animal types to concentrations in animal products is the lack of measurements of various radionuclides in most animals. A developing technique for estimating the transfer of contaminants in animal products is allometry – or the biology of scaling (Higley, Domotor, and Antonio 2003).
The application of transfer factors for many types of animal products is problematic because of the wide range of organisms potentially exposed. For example, there are very limited data available for riparian (living along riverbanks, e.g., beaver or otter) and terrestrial animals (i.e. very few terrestrial animal:water and riparian animal:sediment concentration ratios). An alternative approach, called the kinetic/allometric method, was developed. Among other objectives, this work filled in data gaps in the literature on transfer factors for specific riparian and terrestrial animal receptors. This approach could also be used to fill gaps in the domestic animal database or to add products such as eggs from emus or ostriches.
Allometry is the study of size and its consequences. There are several allometric equations that relate body size to many parameters, including ingestion rate, life span, inhalation rate, home range and more
19
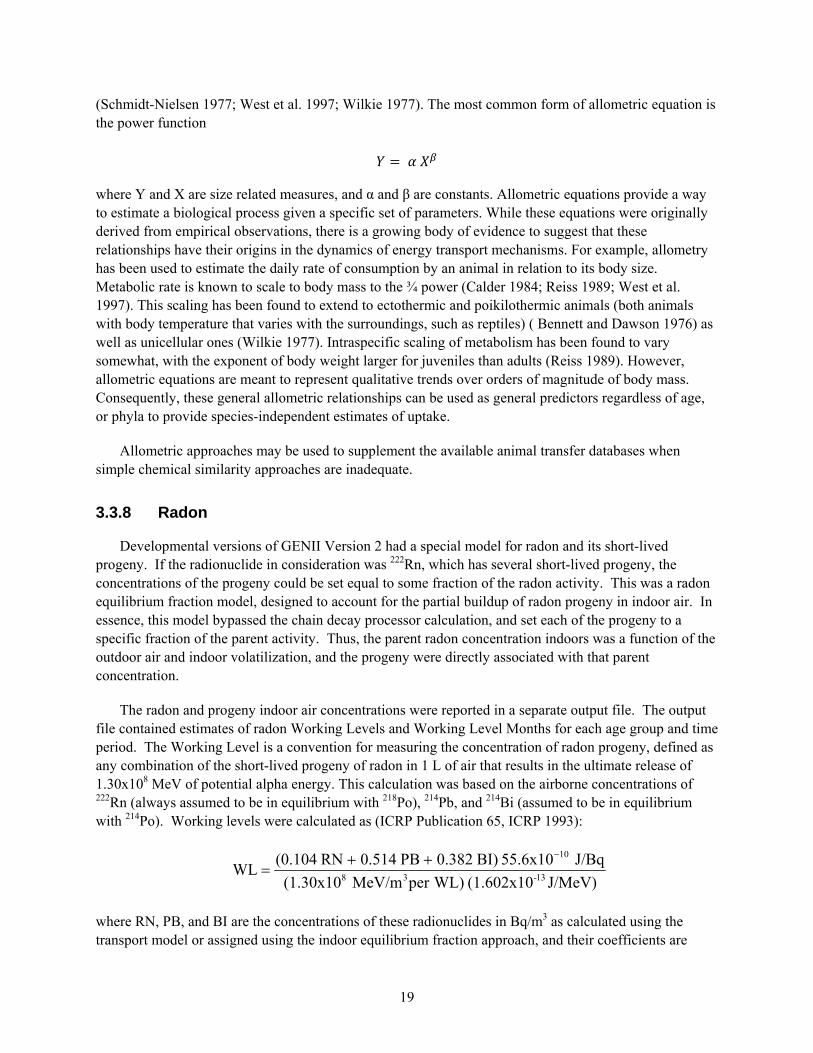
(Schmidt-Nielsen 1977; West et al. 1997; Wilkie 1977). The most common form of allometric equation is the power function
where Y and X are size related measures, and α and β are constants. Allometric equations provide a way to estimate a biological process given a specific set of parameters. While these equations were originally derived from empirical observations, there is a growing body of evidence to suggest that these relationships have their origins in the dynamics of energy transport mechanisms. For example, allometry has been used to estimate the daily rate of consumption by an animal in relation to its body size. Metabolic rate is known to scale to body mass to the ¾ power (Calder 1984; Reiss 1989; West et al. 1997). This scaling has been found to extend to ectothermic and poikilothermic animals (both animals with body temperature that varies with the surroundings, such as reptiles) ( Bennett and Dawson 1976) as well as unicellular ones (Wilkie 1977). Intraspecific scaling of metabolism has been found to vary somewhat, with the exponent of body weight larger for juveniles than adults (Reiss 1989). However, allometric equations are meant to represent qualitative trends over orders of magnitude of body mass. Consequently, these general allometric relationships can be used as general predictors regardless of age, or phyla to provide species-independent estimates of uptake.
Allometric approaches may be used to supplement the available animal transfer databases when simple chemical similarity approaches are inadequate.
3.3.8 Radon
Developmental versions of GENII Version 2 had a special model for radon and its short-lived progeny. If the radionuclide in consideration was 222Rn, which has several short-lived progeny, the concentrations of the progeny could be set equal to some fraction of the radon activity. This was a radon equilibrium fraction model, designed to account for the partial buildup of radon progeny in indoor air. In essence, this model bypassed the chain decay processor calculation, and set each of the progeny to a specific fraction of the parent activity. Thus, the parent radon concentration indoors was a function of the outdoor air and indoor volatilization, and the progeny were directly associated with that parent concentration.
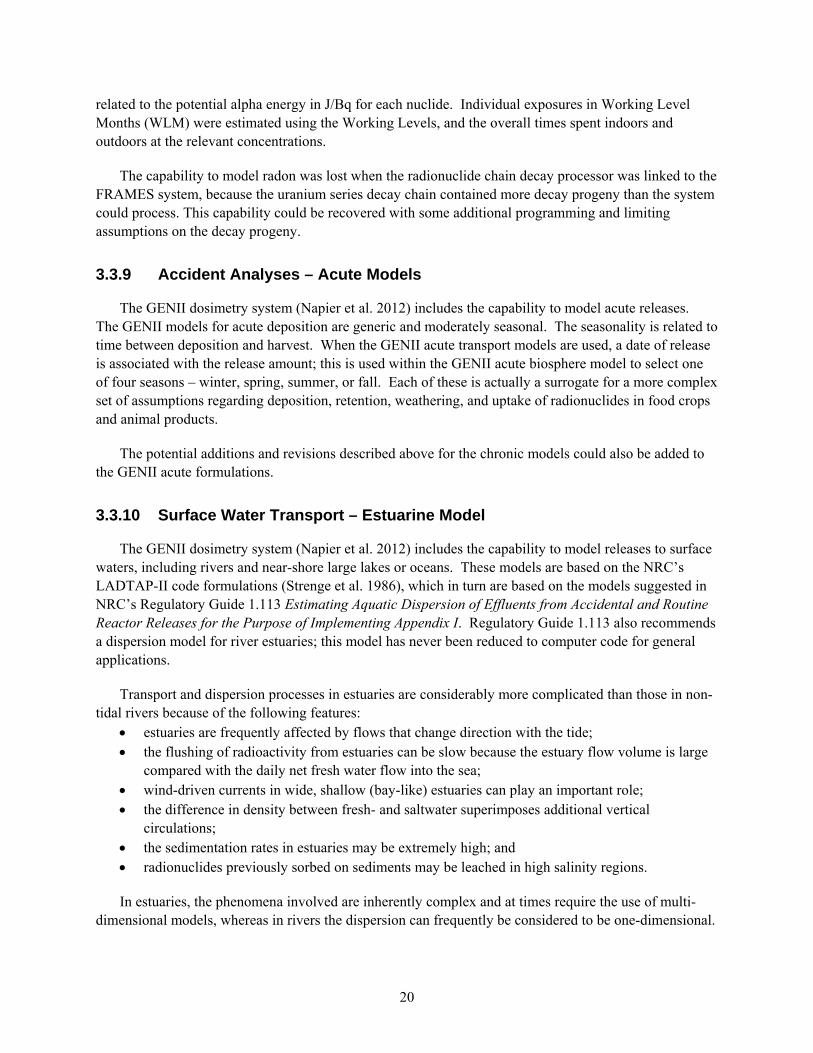
The radon and progeny indoor air concentrations were reported in a separate output file. The output file contained estimates of radon Working Levels and Working Level Months for each age group and time period. The Working Level is a convention for measuring the concentration of radon progeny, defined as any combination of the short-lived progeny of radon in 1 L of air that results in the ultimate release of 1.30x10⁸ MeV of potential alpha energy. This calculation was based on the airborne concentrations of 222Rn (always assumed to be in equilibrium with 218Po), 214Pb, and 214Bi (assumed to be in equilibrium with 214Po). Working levels were calculated as (ICRP Publication 65, ICRP 1993):
J/MeV)(1.602x10WL)perMeV/m(1.30x10
J/Bq55.6x10BI)0.382PB0.514RN(0.104WL
13-38
10
where RN, PB, and BI are the concentrations of these radionuclides in Bq/m3 as calculated using the transport model or assigned using the indoor equilibrium fraction approach, and their coefficients are
20
related to the potential alpha energy in J/Bq for each nuclide. Individual exposures in Working Level Months (WLM) were estimated using the Working Levels, and the overall times spent indoors and outdoors at the relevant concentrations.
The capability to model radon was lost when the radionuclide chain decay processor was linked to the FRAMES system, because the uranium series decay chain contained more decay progeny than the system could process. This capability could be recovered with some additional programming and limiting assumptions on the decay progeny.
3.3.9 Accident Analyses – Acute Models
The GENII dosimetry system (Napier et al. 2012) includes the capability to model acute releases. The GENII models for acute deposition are generic and moderately seasonal. The seasonality is related to time between deposition and harvest. When the GENII acute transport models are used, a date of release is associated with the release amount; this is used within the GENII acute biosphere model to select one of four seasons – winter, spring, summer, or fall. Each of these is actually a surrogate for a more complex set of assumptions regarding deposition, retention, weathering, and uptake of radionuclides in food crops and animal products.
The potential additions and revisions described above for the chronic models could also be added to the GENII acute formulations.
3.3.10 Surface Water Transport – Estuarine Model
The GENII dosimetry system (Napier et al. 2012) includes the capability to model releases to surface waters, including rivers and near-shore large lakes or oceans. These models are based on the NRC’s LADTAP-II code formulations (Strenge et al. 1986), which in turn are based on the models suggested in NRC’s Regulatory Guide 1.113 Estimating Aquatic Dispersion of Effluents from Accidental and Routine Reactor Releases for the Purpose of Implementing Appendix I. Regulatory Guide 1.113 also recommends a dispersion model for river estuaries; this model has never been reduced to computer code for general applications.
Transport and dispersion processes in estuaries are considerably more complicated than those in non-tidal rivers because of the following features:
estuaries are frequently affected by flows that change direction with the tide; the flushing of radioactivity from estuaries can be slow because the estuary flow volume is large
compared with the daily net fresh water flow into the sea; wind-driven currents in wide, shallow (bay-like) estuaries can play an important role; the difference in density between fresh- and saltwater superimposes additional vertical
circulations; the sedimentation rates in estuaries may be extremely high; and radionuclides previously sorbed on sediments may be leached in high salinity regions.
In estuaries, the phenomena involved are inherently complex and at times require the use of multi-dimensional models, whereas in rivers the dispersion can frequently be considered to be one-dimensional.
21
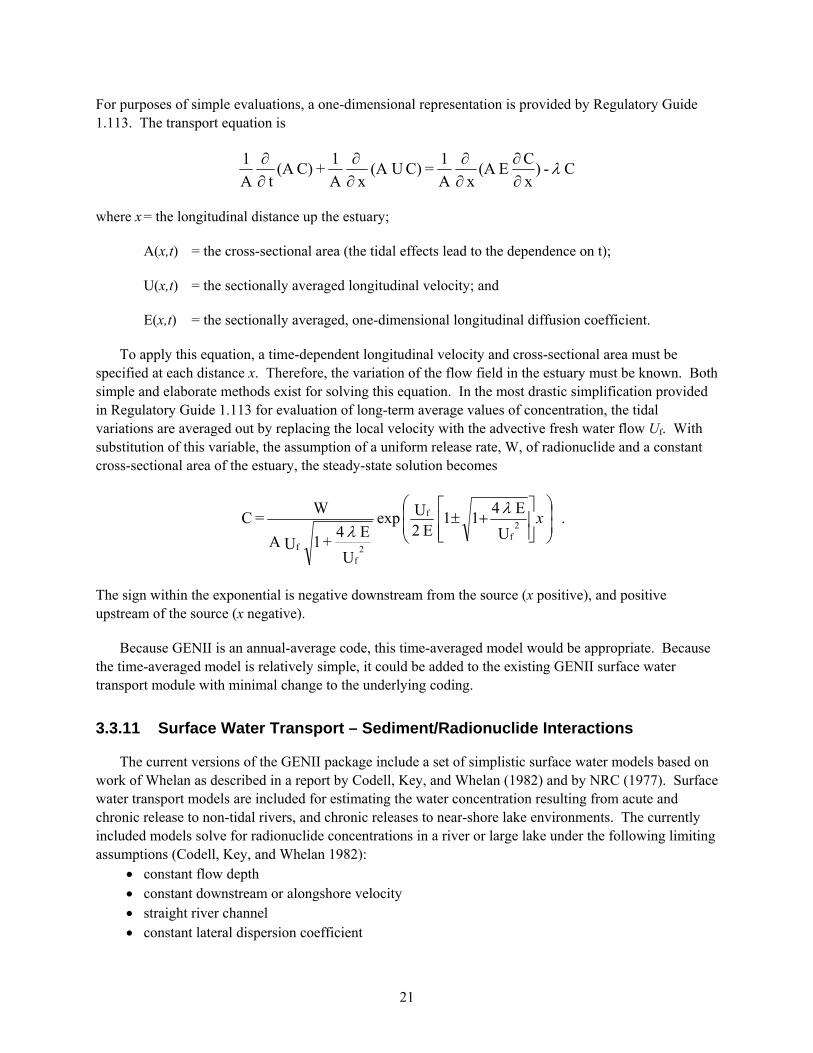
For purposes of simple evaluations, a one-dimensional representation is provided by Regulatory Guide 1.113. The transport equation is
C - )x
C E(A
x
A
1 = C) (A U
x
A
1 + C)(A
t
A
1
where x = the longitudinal distance up the estuary;
A(x,t) = the cross-sectional area (the tidal effects lead to the dependence on t);
U(x,t) = the sectionally averaged longitudinal velocity; and
E(x,t) = the sectionally averaged, one-dimensional longitudinal diffusion coefficient.
To apply this equation, a time-dependent longitudinal velocity and cross-sectional area must be specified at each distance x. Therefore, the variation of the flow field in the estuary must be known. Both simple and elaborate methods exist for solving this equation. In the most drastic simplification provided in Regulatory Guide 1.113 for evaluation of long-term average values of concentration, the tidal variations are averaged out by replacing the local velocity with the advective fresh water flow Uf. With substitution of this variable, the assumption of a uniform release rate, W, of radionuclide and a constant cross-sectional area of the estuary, the steady-state solution becomes
. U
E 411
E 2U exp
U
E 4 + 1 UA
W = C
f2
f
f2f
x
The sign within the exponential is negative downstream from the source (x positive), and positive upstream of the source (x negative).
Because GENII is an annual-average code, this time-averaged model would be appropriate. Because the time-averaged model is relatively simple, it could be added to the existing GENII surface water transport module with minimal change to the underlying coding.
3.3.11 Surface Water Transport – Sediment/Radionuclide Interactions
The current versions of the GENII package include a set of simplistic surface water models based on work of Whelan as described in a report by Codell, Key, and Whelan (1982) and by NRC (1977). Surface water transport models are included for estimating the water concentration resulting from acute and chronic release to non-tidal rivers, and chronic releases to near-shore lake environments. The currently included models solve for radionuclide concentrations in a river or large lake under the following limiting assumptions (Codell, Key, and Whelan 1982):
constant flow depth constant downstream or alongshore velocity straight river channel constant lateral dispersion coefficient
22
continuous point discharge release of effluent constant river width.
The current models include reduction of concentration by radioactive decay, but do not include any influence of the effects of sorption on sediment or sedimentary transport. Most radionuclides exist in surface water as liquid and solid phases and are transported by water and sediment (Voitsekhovitch et al. 1994.) Models of radionuclide transport should simulate hydrodynamics, sediment transport, and both dissolved and sediment-sorbed materials with their interactions. Numerous reviews of contaminant transport models (e.g., Onishi et al. 1981, 1987; Onishi 1985; NCRP 1984) indicate that many such models have been developed for rivers, estuaries, lakes, and oceans. Models that include sediment-contaminant interactions include one-dimensional models such as TODAM (Onishi et al. 1982a), two-dimensional models such as SERATRA (Onishi et al. 1982b) and FETRA (Onishi 1981), and three dimensional codes such as FLESCOT (Onishi et al 1993; Onishi and Trent 1982).
The Sediment-Contaminant Transport (SERATRA) model is a transient, two-dimensional (longitudinal and vertical) sediment transport model with algorithms to simulate complex sediment transport and decay mechanisms for pollutants in rivers and lakes (Onishi et al. 1982b; Onishi and Wise 1982). Three coupled submodels include a sediment transport model that simulates transport, deposition, and scouring of three sediment size fractions of cohesive and non-cohesive sediments; a dissolved contaminant submodel that includes mechanisms of contaminant adsorption/desorption and degradation resulting from hydrolysis, oxidation, photolysis, volatilization, biological activities, and radioactive decay; and a particulate submodel simulating material sorbed to sediments. The model also predicts changes of river bed conditions. The model has been tested with field data. SERATRA requires extensive data input and labor (up to 750 person-hours) for setup, assuming all input data are readily available (ASCE 1996).
For the simulation of radionuclide transport in several United States rivers, the Transfer One-Dimensional Degradation and Migration (TODAM) model has been used (Onishi et al. 1982a; Onishi and Wise 1982). TODAM is a transient, one-dimensional model simulating the transport of contaminants in rivers, reservoirs, and estuarine systems with second-order decay mechanisms. The model describes radionuclide transport attached on three typical fractions of the suspended sediments - sand, silt, and clay with specific sorption (Kd) values for each. The radionuclide transport module is supported by the comprehensive suspended sediment transport module that describes the transport of cohesive and non-cohesive sediments. TODAM was made by converting the 2-dimension SERATRA to a 1-dimensional code; although it is one dimensional, it can handle many tributaries and their main rivers at once. TODAM requires channel and flow characteristics to be provided as input data.
The FETRA code (Onishi 1981a; b) is based on the unsteady two- dimensional equations which simulate the transport, the deposition and the resuspension of sediments and contaminants together with their interactions. The model describes the transport of cohesive and non-cohesive sediments in open coastal waters.
The FLESCOT code (Onishi et al 1993; Onishi and Trent 1982) is an unsteady, three-dimensional, finite difference model, developed from the TEMPEST fluid dynamics model. It consists of sub-models of hydrodynamics, turbulence, water temperature, salinity, sediments (both cohesive and non-cohesive) and contaminants (both dissolved and sediment-sorbed). The FLESCOT model also simulates the behavior of sediments and contaminants in the riverbed, affected by erosion/deposition, direct

23
adsorption/desorption between water and bottom sediments, and bioturbation. It can calculate wind-induced flow and wave-induced sediment transport, thus affecting contaminants transport in shallow water. FLESCOT uses multiple bed layers as other models of Onishi of lower dimensions (TODAM, FETRA, SERATRA). The first layer (usually taken as a few cm thick) implicitly includes a very thin top layer (assigned as twice the bed sediment grown size) characterized by the chemical equilibrium between the attached and interstitial dissolved form of the radionuclide. This code also requires substantial user knowledge and inputs.
The GENII package is intended for application by non-hydrologists in an annual-average approach. As such, the code most likely to be an improvement over the current models that is still approachable by most users is likely to be TODAM. TODAM is the easiest to use of the models discussed above. It is currently being used to evaluate the transport of radioactive materials deposited from the Fukushima rector accident in rivers in Japan (personal communication, Y Onishi to BA Napier, 2013). Its use would provide enhanced capabilities to deal realistically with radionuclide-sediment interactions without prohibitive levels of user training. Its use could be an alternative to the older annual-averaged model discussed in Section 3.3.10.
3.4 Advanced Display Capabilities
The GENII Version 2 models use the organizing structure and some of the reporting capabilities of the Framework for Risk Analysis in Multimedia Environmental Systems (FRAMES) Version 1.7 platform. An overview of this software concept is provided by Whelan et al. (1997). All of the primary GENII development and all of the pertinent ASME NQA-1 (ASME 2000) quality assurance documentation, which is extensive (DOE 2012), refer to FRAMES 1.7.
Most of the GENII outputs may be geo-referenced – they may be assigned to an actual location on a map. More recent versions of FRAMES (Version 2.x) incorporate geo-referencing capabilities. Parts of the Nuclear Regulatory Commission currently use FRAMES v2 in some applications. Extension of the GENII QA regime to FRAMES 2 could provide access to convenient mapping capabilities.
An alternative that retains the current QA pedigree of GENII Version 2.10 et seq. would be to develop a KML (Keyhole Markup Language) application to project GENII results onto Google Earth-based maps. KML files may be e-mailed, hosted locally for sharing within a private internet, or hosted publicly on a web server. Just as web browsers display HTML files, Earth browsers such as Google Earth display KML files. Once properly configured, anyone who has installed Google Earth can view the KML files (see https://developers.google.com/kml/documentation/).
The NRC currently has access to utilities that can provide population data and economic activity data (i.e., farm production) that may be used for GENII (Bixler et al. 2008). These could also be incorporated in a display system.
25
4.0 Recommendations
This review has identified a number of areas in which additional data or revised models would be appropriate. However, not all are equally important. It is recommended that priorities be set by NRC staff to guide selection of the most useful improvements in a cost-effective manner. That said, the author provides a few suggestions based on relatively easy and inexpensive changes, and longer-term more costly studies.
In the short term, there are several improved model formulations that could be applied to the GENII suite of codes to make them more generally useful.
First, implementation of the separation of the translocation and weathering processes is a simple adaptation using currently available information that could be done quickly.
An improved model for carbon-14 from non-atmospheric sources is needed. This pathway is often seen in scenarios evaluating waste disposal options, and it frequently scores highly because of the relatively large dose predicted. It is likely that a more realistic formulation would show that this pathway is not as serious as is currently predicted, and this in turn could reduce concerns about radioactive waste disposal in many settings.
GENII at one time contained a radon model, and the basic coding is still hidden within the code modules, but not activated. A relatively minor revision to the code could once again make the various radon exposure pathways functional and available for use.
The GENII output is available in paper text format, but the underlying data are calculated on a grid that could be superimposed upon digital maps for easier presentation and display. The option of development of a KML processor for the output report generator modules retains the substantial Quality Assurance documentation developed for GENII over many years and seems like a relatively cost-effective solution.
If any additional pathways are to be added to the basic GENII biosphere model, the easiest to implement, and potentially most useful in environmental analyses, would be the addition of marine mammals (manatees, seals, walrus, whales, etc.).
The GENII annual-average environmental models could appropriately accommodate the Regulatory Guide 1.113 estuary radionuclide transport model.
Data needs in the longer term require extensive (and potentially expensive) research. Before picking any one radionuclide or food type, NRC staff should perform an in-house review of current and anticipated environmental analyses to select “dominant” radionuclides of interest for the primary scenarios of
Reactor licensing and compliance, Fuel manufacturing facilities, Spent nuclear fuel processing, and Waste management facilities.

26
This would allow setting of cost-effective priorities for radionuclide- and pathway-specific research. In the author’s opinion, a few pathways come to the fore. These include
soil-to-plant uptake studies for oranges and other citrus fruits,
Development of models for evaluation of radionuclide concentration in highly-processed foods such as oils and sugars, and
Sediment/radionuclide transport models in estuary, ocean, and freshwater environments.
Finally, renewed studies of radionuclide cleanup in various modern types of municipal water treatment facilities such as advanced filtration or reverse-osmosis processes may be performed without development of any new or costly experimental facilities.
27
5.0 References
ASCE. American Society of Civil Engineers. 1996. Hydrology Handbook, ASCE Manuals and Reports on Engineering Practice No. 28. ASCE, New York, NY.
American Society of Mechanical Engineers (ASME). 2000. Quality Assurance Requirements for Nuclear Facility Applications, NQA-1-2000. American Society of Mechanical Engineers, New York, NY.
Bechtel SAIC Company (BSC). 2003. Environmental Transport Input Parameters for the Biosphere Model. ANL-MGR-MD-000007 REV 01. Bechtel SAIC Company, Las Vegas, Nevada.
Bixler NE, Shannon SA, Morrow CW, Meloche BE. 2008. SECPOP2000: Sector Population, Land Fraction, and Economic Estimation Program, NUREG/CR-6525, Revision 1, Sandia National Laboratories, Albuquerque, NM.
Bonazzola GC, Ropolo R, Patetta A, Manino A. 1991. “Distribution of Fallout Radionuclides in Soil, Plants, and Honey,” Health Physics 60(4):575-577
Codell RB, Key KT, Whelan G. 1982. A Collection of Mathematical Models for dispersion in Surface Water and Ground Water. NUREG-0868, U.S. Nuclear Regulatory Commission, Washington, D.C.
Eslinger PW, Miley TB, Arimescu C. 2006. Updated User Instructions for the Systems Assessment Capability, Rev. 1, Computer Codes, PNNL- 16115, VOls. 1-2. Pacific Northwest National Laboratory, Richland, Washington.
Fulkery MJ, Jacksony D, Leonardz DRP, McKayyx K, John C. 1998. “Dose due to manmade radionuclides in terrestrial wild foods near Sellafield,” J. Radiol. Prot.18(1):3–13.
Harris S, Harper B. 1997, "A Native American Exposure Scenario," Risk Analysis, Vol. 17, No. 6, p. 789-795.
Higley KA, Domotor SL, Antonio EJ. 2003. “A kinetic-allometric approach to predicting tissue radionuclide concentrations for biota.” Journal of Environmental Radioactivity 66:61-74.
Howard BJ, Beresford NA, Barnett CL, Fesenko S. (2009) “Radionuclide transfer to animal products: revised recommended transfer coefficient values”, Journal of Environmental Radioactivity 100:263–273
International Atomic Energy Agency (IAEA). 1994. Handbook of Parameter Values for the Prediction of Radionuclide Transfer in Temperate Environments. Technical Report No. 364, International Atomic Energy Agency, Vienna, Austria.
International Atomic Energy Agency (IAEA). 2010. Handbook of Parameter Value for the Prediction of Radionuclide Transfer in Terrestrial and Freshwater Environments. Technical Report No. 472, International Atomic Energy Agency, Vienna, Austria.
28
International Atomic Energy Agency (IAEA). 2004. Sediment Distribution Coefficients and Concentration Factors for Biota in the Marine Environment. Technical Report No. 422, International Atomic Energy Agency, Vienna, Austria.
International Commission on Radiological Protection (ICRP). 1993. Protection Against Radon-222 at Home and at Work. ICRP Publication 65. Ann. ICRP 23 (2).
Layton DW, Varela ME, Edson R, Napier BA. 1997. Radionuclides in the Arctic Seas from the Former Soviet Union: Potential Health and Ecological Risks, Office of Naval Research, Washington DC.
National Council on Radiation Protection and Measurements (NCRP). 1984. Radiological Assessment: Predicting the Transport, Bioaccumulation, and Uptake by Man of Radionuclides Released to the Environment, NCRP Publication No. 76, National Council on Radiation Protection and Measurements, Bethesda, MD.
Napier BA, Roswell RL, Kennedy WE Jr, Strenge DL. 1980. ARRRG and FOOD - Computer Programs for Calculating Radiation Dose to Man from Radionuclides in the Environment. PNL-3180, Pacific Northwest Laboratory, Richland, Washington.
Napier BA. 2006. Alternative Conceptual Models for Assessing Food Chain Pathways in Biosphere Models, NUREG/CR-6910, PNNL-15872, Pacific Northwest National Laboratory, Richland, Washington.
Napier BA, Fellows RJ, Krupka KM. 2007. Soil-to-Plant Concentration Ratios for Assessing Food-Chain Pathways in Biosphere Models, NUREG/CR-6941, PNNL-16741, Pacific Northwest National Laboratory, Richland, Washington.
Napier BA, Fellows RJ, Krupka KM. 2012. Radionuclide Behavior in Soils and Soil-to-Plant Concentration Radios for Assessing Food Chain Pathways, NUREG/CR-7120, PNNL-20979, Pacific Northwest National Laboratory, Richland, Washington.
Napier BA, Fellows RJ, Minc LD. 2013. Transfer Factors for Contaminant Uptake by Tree Fruits. PNNL-xxxx, Pacific Northwest National Laboratory, Richland, Washington.
Ng YC, Colsher CS, Thompson SE, 1982b. Transfer coefficients for assessing the dose from radionuclides in meat and eggs, NUREG/CR-2976, Lawrence Livermore National Laboratory, Livermore, CA.
Ng YC, Thompson SE, Colsher CS, 1982a. Soil-to-Plant Concentration Factors for Radiological Assessments, NUREG/CR-2975, Lawrence Livermore National Laboratory, Livermore, CA.
Onishi Y. 1981a. Sediment and Contaminant Transport Model. Journal of Hydraulics Division, American Society of Civil Engineers 107: 1089-1107.
Onishi Y. 1981b. Finite Element Transport Model, FETRA, Battelle Pacific Northwest Laboratories and ICF Northwest, Richland, WA.
29
Onishi Y. 1985. Chemical Transport and Fate in Risk Assessment. In Principals of Health Risk Assessment, ed. PF Ricci. Prentice-Hall, Englewood Cliffs, NJ: 117-154.
Onishi Y, Serne RJ, Arnold EM, Cowan CE, Thompson FL. 1981. Critical Review: Radionuclide Transport, Sediment Transport and Water Quality Mathematical Modeling, and Radionuclide Sorption/Desorption Mechanisms. NUREG/CR-1322, US Nuclear Regulatory Commission, Washington, DC.
Onishi Y, Wise SE. 1982. Sediment-contaminant Transport, SERATRA. ORD Publications, Center for Environmental Research Information, US EPA, Cincinnati, OH.
Onishi Y, Whelan G, Skaggs RL. 1982a. Development of a Multi-Media Radionuclide Exposure Assessment Methodology for Low-Level Waste Management. PNL-3370, Pacific Northwest National Laboratory, Richland, WA.
Onishi Y, Yabusaki SB, Kincaid CT. 1982b. Performance Testing of Sediment-Contaminant Transport Model, SERATRA. Proceedings of the ASCE Hydraulics Conference Applying Research to Hydraulic Practice, Jackson, Mississippi, August 17-20, 1982. Ed. PF Smith American Society of Civil Engineers, New York: 623-632.
Onishi Y, Hibler LF, Sherwood CR. 1987. Review of Hydrodynamic and Transport Models and Data Collected Near the Mid-Atlantic Low-Level Radioactive Disposal Sites. PNL-6331. Pacific Northwest National Laboratory, Richland, WA.
Onishi Y., Grabe HC, Trent DS. 1993. Preliminary Modeling of Wave-Enhanced Sediment and Contaminant Transport in New Bedford Harbor, In Nearshore and Estuarine Cohesive Sediment Transport, ed. AJ Metha, Coastal Esturarine Series, Vol. 42. American Geophysical Union, Washington, DC; 541-557.
Pinder JE 3d, Adriano DC, Ciravolo TG, Doswell AC, Yehling DM. 1987. The interception and retention of 238Pu deposition by orange trees. Health Physics, 52(6):707-15
Snyder SF, BA Napier, CI Arimescu, TR Hay. 2013. Recommended Parameter Values for GENII Modeling of Radionuclides in Routine Air or Water Releases, PNNL-xxxx, Pacific Northwest National Laboratory, Richland, Washington
Strenge DL, RA Peloquin, G Whelan. 1986. LADTAP II : Technical Reference and User Guide, NUREG/CR-4013, PNL-5270, Pacific Northwest National Laboratory, Richland, Washington.
U.S. Department of Energy (DOE). 1997. Columbia River Comprehensive Impact Assessment. U.S. Department of Energy, Richland Operations, Richland, Washington.
U.S. Department of Energy (DOE). 2012. Software Evaluation of GENII V2.10 with FRAMES V1.7 for Inclusion in the DOE Safety Software Central Registry, HSS-CR-2011-001, Department of Energy, Washington, DC.
U.S. Environmental Protection Agency (EPA). 2011. Exposure Factors Handbook 2011 Edition (Final). EPA/600/R-09/052F, U.S. Environmental Protection Agency, Washington, DC.
30
U.S. Nuclear Regulatory Commission (NRC). 1977. Estimating Aquatic Dispersion of Effluent from Accidental and Routine Reactor Releases for the Purpose of Implementing Appendix I, Regulatory Guide 1.113 Revision 1, U.S. Nuclear Regulatory Commission, Washington, D.C.
U.S. Rice Federation. 2009. U.S. Rice Domestic Usage Report, http://www.usarice.com/doclib/188/231/4677.pdf
Voitsekhovitch OV, Zheleznyak MJ, Onishi Y. 1994. Chernobyl nuclear accident hydrological analyses and emergency evaluation of radionuclide distribution in the Dnieper River, Ukraine during the 1993 summer flood. PNL-9980, Pacific Northwest Laboratories, Richland, WA.
Whelan G, Castleton KJ, Buck JW, Gelston GM, Hoopes BL, Pelton MW, Strenge DL, Kickert RN. 1997. Concepts of a Framework for Risk Analysis in Multimedia Environmental Systems (FRAMES). PNNL-11748. Pacific Northwest National Laboratory, Richland WA.
Wu DW. 2003. Biosphere Model Report, MDL-MGR-MD-000001 REV 00, Bechtel SAIC Co, Inc. Las Vegas, Nevada.