additives derived from local sources for …eprints.utm.my/id/eprint/5809/1/74277.pdf · the...
TRANSCRIPT
VOT 74277
ADDITIVES DERIVED FROM LOCAL SOURCES FOR ENHANCED OIL
RECOVERY (EOR) PROCESSES
(BAHAN PENGGALAK DARIPADA SUMBER TEMPATAN UNTUK PROSES
PENGELUARAN MINYAK)
ASSOC. PROF. DR. ANI IDRIS
ASSOC. PROF. DR. MARIYAMNI AWANG
FAKULTI KEJURUTERAAN KIMIA DAN KEJURUTERAAN SUMBER ASLI
UNIVERSITI TEKNOLOGI MALAYSIA
2007
iii
ABSTRACT
The cost of chemicals prohibits many technically feasible enhanced oil recovery
methods to be applied in the oilfields. This research produced surfactants from phenols
that were extracted from the pyrolysis oil of oil palm shells which are a byproduct of the
palm oil industry. Xanthans which are imported can be produced from many available
local sources such as starches and fruits. All of the additives produced were tested for
enhanced oil recovery use and were found to have suitable properties. The recoveries for
surfactant polymer flooding measured in the laboratory were comparable with the values
reported in literature i.e. between 7 to 15 %. This work has proved that expensive
chemicals can be produced locally using local sources and byproducts, consequently
posing a potential savings in EOR processes.

iv
ABSTRAK
Kos bahan kimia telah menghalang banyak proses pengeluaran minyak tertingkat
yang baik secara teknikal untuk digunakan di lapangan minyak. Kajian ini telah
menghasilkan surfaktan daripada fenol yang dikeluarkan dari minyak pirolisis
tempurung minyak sawit yang merupakan bahan buangan industri sawit. Xanthans yang
diimpot boleh dibuat daripada bahan tempatan yang sediada seperti kanji dan buah
buahan. Kesemua bahan tambahan yang dihasilkan telah diuji untuk kegunaan
pengeluaran minyak tertingkat dan didapati mempunyai ciri–ciri yang sesuai. Perolehan
banjiran surfaktan/polimer yang diukur dalam makmal adalah baik jika dibandingkan
dengan nilai yang dilaporkan dalam literatur iaitu antara 7 hingga 15 %. Usaha ini telah
membuktikan bahan kimia boleh dikeluarkan dengan menggunakan bahan tempatan dan
bahan sampingan, sekaligus mempunyai potensi untuk mengurangkan perbelanjaan
dalam proses PMT.

ii
ACKNOWLEDGEMENTS
First and foremost, I would like to express my gratitude and appreciation to
IRPA for the grant (Vot 74277). My deep gratefulness also goes to all the researchers
and all the supporting staff in the Petroleum Laboratory, FKKKSA for their invaluable
assistance during the course of the project completion. Last but not least to all the
Research Management Centre staff who has laid their helping hands throughout the
project.

CHAPTER 1
INTRODUCTION
1.1 Overview
1.1.1 Introduction on enhanced oil recovery (EOR)
Enhanced oil recovery (EOR) refers to reservoir processes that recover oil not
produced from secondary processes. Primary recovery uses the natural energy of the
reservoir to produce oil and gas. Secondary recovery uses injectants to re-pressurize the
reservoir and to displace oil to producers. Enhanced oil recovery processes target what is
left. The processes focus on the rock/oil/injectant system on the interplay of capillary and
viscous forces (Stosur, 2003).
There are many types of EOR processes. Thermal processes are the most common
type of EOR, wherein a hot invading face, such as steam, hot water or a combustible gas, is
injected in order to increase the temperature of oil and gas in the reservoir and facilitate
their flow to the production wells. Another type of EOR process consists of injecting
miscible phase with the oil and gas into the reservoir in order to eliminate the interfacial
tension effects. The miscible phase can be miscible hydrocarbon, CO2 or an inert gas.
Another lesser used EOR technique is called chemical flooding, where chemicals are

2
injected into the reservoir. The polymer is used to improve the sweep efficiency by
changing the mobility ratio. The surfactant is used to reduce the interfacial tension between
the oil and the displacing fluid.
According to Austad and Milter (2000), chemical flooding of oil reservoirs is one of
the most successful methods to enhance oil recovery from depleted reservoirs at low
pressure. However, it is well documented in their publishing that chemical flooding is only
marginally economical, or in most cases very costly. It was concluded by most oil
companies at the end of 1980s that the method was not economical, or the financial and
technical risk was too high presenting compare to the oil price at the time. Researches
declined drastically during the 1990s. However, there are still some researchers who are
trying to improve the technique by simplifying the flooding process, improving the
efficiency of the surfactants or developing new surfactants.
Many EOR methods have been devised to squeeze the extra oil out of the rocks.
Beginning from injection of water to various types of gases and liquids, singly or in
combination, many studies have been reported to be a success technically, however the
additional cost of injection in relation to the cost of oil often kept the study at the laboratory
level. Polymer-surfactant flooding is a process of displacing oil that combined reduction of
surface tension that helped to release oil from pore spaces due to the surfactant and an
improvement in the sweep efficiency due to the high viscosity of the polymer that provides
the drive in pushing the oil towards the well. Since the 70s hydrolysed polyacrylamide
(HPAM) or xanthan are the main additives. The number of field applications of xanthan,
however, is much less than HPAM due to the higher xanthan cost. Injection of surfactant is
relatively new and much of it now is in generating foam to augment CO2 injection.
Similarly, additional cost is incurred with use of surfactant.
1.1.2 Introduction of surfactant
In 2002, Berger and Lee developed a new type of surfactant that could be used at
very low concentrations to produce ultra low interfacial tensions (IFT) for sandstone and
limestone formations. These surfactants could be used for Alkaline Surfactant Polymer
3
(ASP) floods, surfactant floods and also as an additive for water floods. These new
surfactants had their advantages, particularly their effectiveness at low concentration levels,
and their high salt tolerance and did not require alkali to produce ultra low interfacial
tensions. The authors used the olefin sulfonic acid to simultaneously alkylate and sulfonate
the aromatic compound and synthesize a new family of anionic surfactants. The aromatic
compounds that could be used include benzene, toluene, xylene, naphthalene, phenol,
diphenylether and substituted derivatives of these compounds. The authors reduced the cost
of the alkylation and sulfonation process.
Zaitoun et al. (2003) conducted a series of experiments on surfactant screening and
evaluation for surfactant flood in the Chihuido de la Sierra Negra field in Argentina. They
developed a new anionic surfactant that provides solubility in high salinities and low
interfacial tension at low concentration. They used a sulfoalkylated
nonylphenol/formaldehyde oligomer to reduce adsorption of the primary surfactant. The
synthesis of this material had been described by Berger (2002).
Purwono and Murachman (2001) described that Sodium Lignosulphonate (SLS),
which is produced as a result of sulfonation of lignin formed from the waste pulp industries
and hydrolysis of oil palm husks, had potential to be used in EOR. Surfactant or co-
surfactant from the pyrolysis of oil palm husks could also be used as EOR chemicals.
Mainly alcohols like methanol, ethanol and propanol were produced from the pyrolysis of
oil palm fibres. They used the surfactant in the form of microelmusions during the chemical
process experiment. The methane produced from the pyrolysis of palm oil fibres and fruit
stems could be used as tertiary oil recovery flood material since hydrocarbons gases were
dissolved in the oil to reduce the oil viscosity. The process is known as miscible process.
However, in their works, they did not describe the method to produce the surfactant.
Surfactant use for EOR is not a recent development in petroleum field. However, the
cost of the surfactants has been the main reason for the limited use in the EOR processes.
One problem with many surfactants is their high cost of manufacture and the raw material.
The above mentioned studies show that the research groups have paid much attention to the
alkylated and sulfonated aromatic compounds which included phenol and its derivatives to
synthesize new surfactants for EOR uses (Berger and Lee, 2002). They produced a new
series of alkylaryl sulfonic acids that did not require costly alkylation units and hazardous
4
catalyst and employed relatively inexpensive equipment. Besides, Purwono and
Murachman (2001) used the palm oil husks from industrial waste as raw materials to
develop the chemicals for EOR.
Since Malaysia is world’s largest palm oil producer, it generates significant amount
of oil palm wastes. The wastes include large amount of solid wastes and a wastewater called
palm oil mill effluent (POME). Thirty one million tons of fresh fruit bunch is locally
produced annually and processed in 265 mills, from which 14.8 million tons of oil palm
empty bunch, 9.1 million tons of fibre and 3.7 million tons of fruit shell are generated as
solid wastes, and more than 10 million tons of palm oil mill effluent (POME) are generated
as wastewater (Wong, 2002). Currently, a part of fibre and fruit shell wastes are utilized as
boiler fuels for steam generation in some palm oil mills. Unfortunately, no experiment has
been done using the oil palm wastes as the raw materials to develop the chemicals for EOR
in Malaysia.
In 1999, Islam et al. reported the pyrolysis oil from fluidized bed pyrolysis of oil
palm shell contained a high fraction of phenol based compounds. Jamil and co-worker
(2000) had described another successful fluidized bed pyrolysis technique that produced
pyrolysis oil with high contains of phenol and its derivatives from oil palm shell. Wong et
al. (2003) also concluded that there was 25.6 wt % of phenol and phenolic compounds from
oil palm shell. Extraction of the pyrolysis oil from oil palm shell yielded valuable phenolic
compounds. It was believed that the phenolic compounds can be further processed to
produce useful chemical products.
1.1.3 Introduction on xanthan gum
Malaysia has a great variety of refreshing tropical fruits. Some are seasonal while
others are available throughout the year. Conversely tropical Malaysian fruits are plentiful
all year round in Malaysia. Local fruits which are especially popular include papaya,
passion fruit, watermelon and pineapple. The possibility of using local tropical fruits and
starches as an alternative substrate for xanthan production is reported in this thesis.
5
Thirty percent of the cost of producing xanthan is estimated to be due to the carbon
source. Since Malaysia has an abundance of cheap starches and local fruits, xanthan
produced using cheap local sources poses a promising substitute to imported xanthan. For
enhanced oil recovery, the cost is expected to be further reduced since little processing of
the xanthan is needed as compared with food grade xanthan. Although the properties of
xanthan gum have been extensively studied on the variations in xanthan properties when
different operating conditions, nutrients and carbon sources were used (J. A. Casas, V.E.
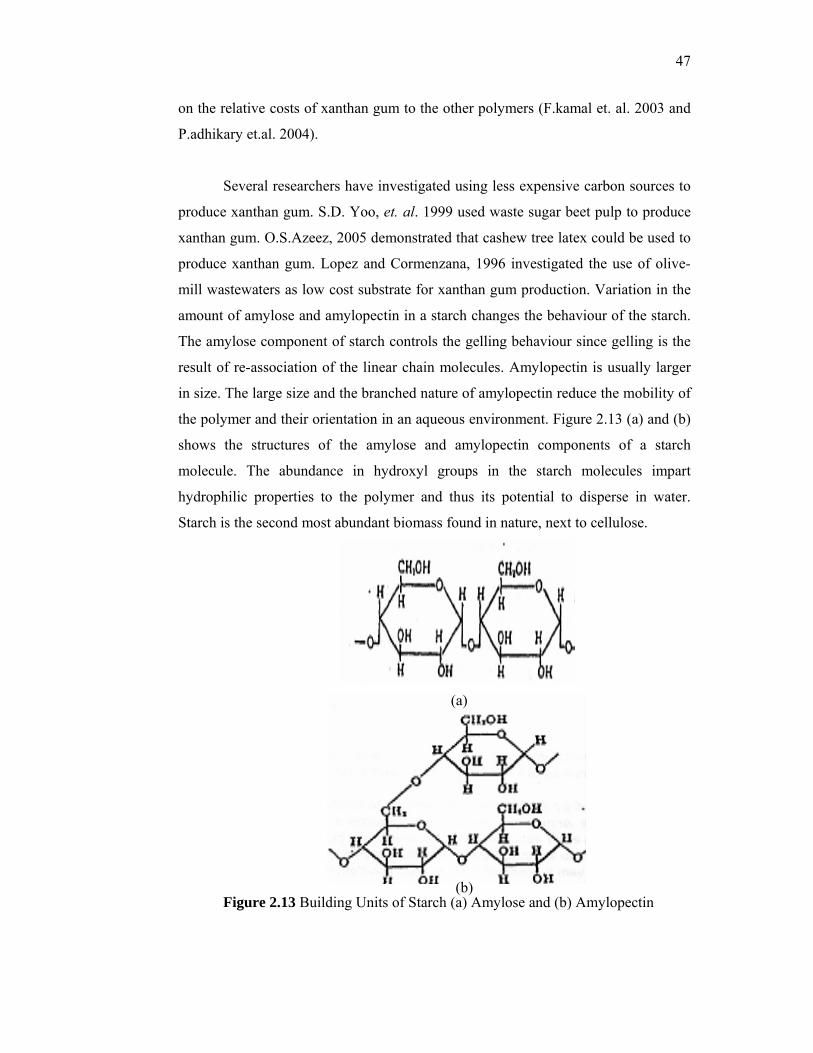
Santos and F. Garcia Ochoa, 2000). A starch consists of two major components.Chemically,
it contains amylose, a linear polymer with a molecular weight in the range of 100,000 -
500,000 and amylopectin, a highly branched polymer with a molecular weight in the range
of 1-2 million (L.S. Guinesi et al., 2006). If xanthans produced using various starches were
to result in similar xanthans, seasonal fluctuations in starch supply may be overcome and
the cheapest source may be used at any time.
In this study, we aim to produce surfactant and xanthan gum from waste and local
sources for additives in enhanced oil recovery. The surfactant was produced from pyrolysis
oil of oil palm shells. The surfactant produced from oil palm shells industries by
simultaneously alkylating and sulfonating the phenolic compounds extracted from the
pyrolysis oil of oil palm shell. There are several advantages for selecting oil palm shell as a
starting raw material to produce surfactant for EOR processes. First and foremost, it is an
inexpensive industrial waste and always readily available. Secondly, it is not a petroleum
derivative. Therefore, pyrolysis oil derived from oil palm shell has been selected as the
starting raw material. There are very few previous works on the production of surfactant
from oil palm shell by alkylating and sulfonating the phenolic compounds in pyrolysis oil.
The research on the recycling of oil palm shell to surfactant is a relatively new area. Thus,
in this work, the production of the surfactant from pyrolysis oil of oil palm shell is
presented.
We also report a laboratory study on the medium formulation and culture conditions
for the growth of X. campestris and for the production of the extracellular polysaccharide
from local fruit and starches as sole feedstock source. In this sense the objective of this
work was to determine the feasibility of producing a lower cost xanthan gum alternative
from local fruits and starches. This study also focused on the ten types of local fruits and
four starches as local carbon sources to produce economically of xanthan gum. In order to
6
make a comparative analysis of xanthan gum produced, four starches which are tapioca,
rice, sweet potato and sago as carbon sources were used to the same conditions. The local
fruits and starches were selected as a carbon sources because it was readily available and
inexpensive. In the present work also study is the determination of the amylose and
amylopectin content based on thermal degradation of starches by thermogravimetric
analysis (TGA). The flow properties of the xanthan gum and surfactant produced were
compared with a commercial xanthan used in oilfields. The additives were characterised
and applied in laboratory displacement experiments.
1.2 Statement of Problems
In this study, the new surfactant and xanthan gum as additives was developed from the
oil palm shell, local starches and fruits. The oil palm shell, local starches and fruits were
selected as a starting material because it was readily available and inexpensive. Since the
research on the production of surfactant from pyrolysis oil of oil palm shell and xanthan
gum from local starches and fruits have not been explored and developed to any significant
extent, thus, this study would solve the following problems:
1. How to extract the phenolic compounds from the pyrolysis oil?
2. How to synthesize the surfactant from the extracted phenolic compounds of the
pyrolysis oil?
3. How to produced xanthan gum from local fruits and starches as carbon sources via
shaker fermentantion and fermentation.
4. How is the oil recovery performance if the locally produced surfactant and xanthan
gum are applied in the EOR processes, such as surfactant polymer flooding?
7
1.3 Objectives
The objectives of this study are:
1. To extract the phenol and phenolic compounds from produced pyrolysis oil
2. To synthesize a surfactant from pyrolysis oil of oil palm shell and xanthan gum
from local starches and fruits via shaker fermentantion and fermentation for
enhanced oil recovery applications.
3. To characterize the locally produced surfactant and xanthan gum properties.
4. To investigate the additional incremental oil recovery by the locally produced
surfactant and xanthan gum after waterflooding through surfactant-polymer
flooding experiment.
1.5 Scopes
1. Pyrolysis oil from oil palm shell will be produced using fluidized bed pyrolysis
technique at 450 oC, particle size of 212 – 252 µm and feed rate of 0.6 kg/hr.
2. Phenol and its derivatives from the pyrolysis oil will be extracted using liquid-
liquid extraction.
3. Surfactants from the extracted phenol of pyrolysis oil from oil palm shell will be
synthesized by simultaneously alkylating and sulfonating the extracted phenol with
C14 and C16 alpha olefin sulfonic acid. The weight ratio of extracted phenol to
olefin sulfonic acid will be set to 100:30, 100:60 and 100:90. Six types of surfactant
will be produced.
4. Xanthans from local starches and fruits juice will be produced via fermentation and
shaker fermentantion. Ten types of xanthans from local fruits juice and four types
from starches will be produced.
8
5. Locally produced surfactants will be classified using Fourier Transform Infra-Red
(FTIR) analysis and the anionic active matter will be determined. Surface tension of
the surfactant at ambient temperature, 26o C, will be measured at various
concentrations. The surfactant concentration will be set to vary from 0.05 wt. % to
5.0 wt. %.
6. Oil displacement experiment in sand pack model will be conducted using the
locally produced surfactant and xanthans to test their flooding efficiency at 26 oC.
Six types of surfactant, 14 of xanthan gum will be used. The injected surfactant slug
size will be set to 2 PV and the surfactant concentration will be set to 0.5 wt%.
CHAPTER 2
LITERATURE REVIEW
2.1 Surfactant-polymer flooding
Enhanced oil recovery (EOR) consists of injecting a displacing fluid into
injection wells in order to displace the oil and gas in a reservoir towards producing
wells. The major EOR processes include thermal, miscible, and chemical methods.
Thermal recovery methods add heat to the reservoir by the use of steam or in-situ
combustion to reduce oil viscosity. Miscible recovery methods are based on injecting
solvents that will mix with the oil under reservoir conditions to dissolve and displace
more oil, such as carbon dioxide, CO2, light hydrocarbon gases and nitrogen.
Chemical EOR methods are designed to improve the sweep efficiency by adding
chemicals, such as polymer or surfactant to the injected water in order to reduce
interfacial tensions or create a favourable mobility ratio, and thus enhance oil
production.
In enhanced oil recovery, surfactants can be used in micellar polymer
flooding, surfactant flooding, alkaline surfactant polymer (ASP) flooding or in foams
for mobility control of blocking and diverting. Surfactants can be used in several
ways to enhance oil production: by reducing the interfacial tension (IFT) between oil
10
trapped in small capillary pores and the water surrounding those pores, thus allowing
the oil to be mobilized; by solubilizing oil in micellar systems; by forming emulsions
of oil and water; by changing the wettability of the oil reservoir in alkaline methods
or by simply enhancing the mobility of the oil (Taber et al., 1997).
In selecting a suitable surfactant for EOR application, one of the criteria for
economic success is minimizing surfactant loss to adsorption. Factors affecting
surfactant adsorption include temperature, pH, salinity, type of surfactants and type
of solids found in the reservoir. Usually the only factor which can be manipulated for
EOR is the type of surfactant to be used; the other factors being determined by
reservoir conditions (Laura et al., 2000).
From a technical point of view, chemical flooding of oil reservoirs is one of
the most successful methods to enhance oil recovery from depleted reservoirs at low
pressure. Surfactants and polymers are the principal components used in chemical
flooding. The surfactants lower the IFT between the reservoir oil and injected water,
while the polymer as agent to lower water mobility or water–oil mobility ratio to
create good mobility control for the surfactant slug. The oil is then displaced by the
viscous forces acting on the oil by the flowing water. The surfactant chemical floods
that involve combination of other chemical methods including:
• Micellar polymer flooding
• Surfactant polymer flooding
• Microemulsion flooding
• Alkaline surfactant polymer flooding
11
Flow direction
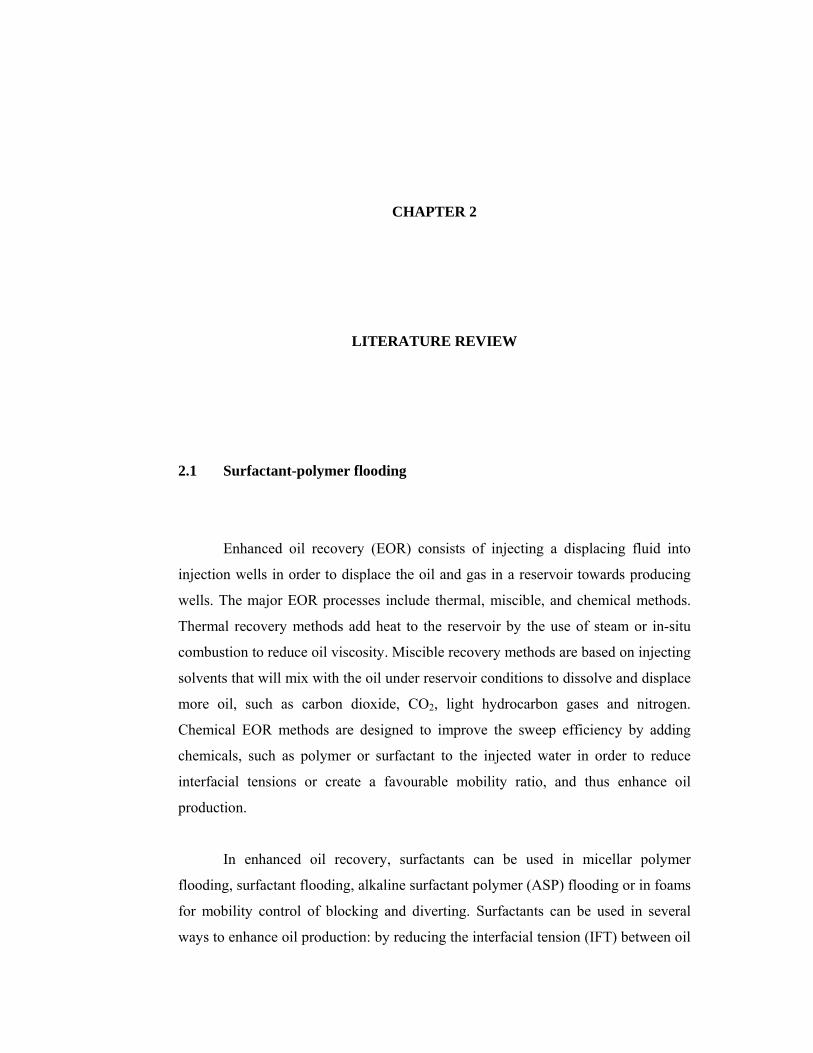
Surfactant polymer flooding is shown in Figure 2.1. The various regions of
immiscible flow during a typical displacement of oil by a surfactant solution are
illustrated. The various zones are described as:
Region 1: Water flooded residual oil saturation; only water is flowing.
Region 2: An oil bank is formed; both oil and water are flowing.
Region 3: Surfactant slug forming the low IFT region, two or three phase
flow of oil, brine, and microemulsion depending on the actual
phase behaviour.
Region 4: Polymer solution for mobility control, single phase flow of
water.
Figure 2.1 Schematic illustration of a surfactant polymer flooding
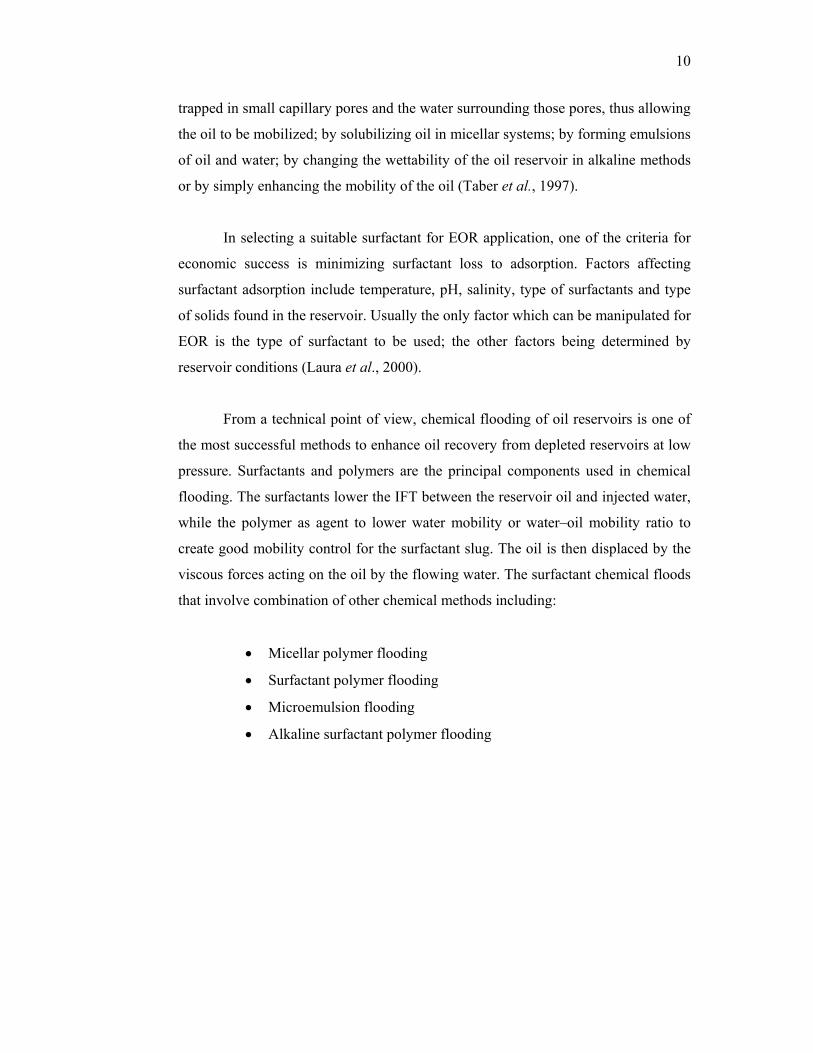
The capillary number, Nc, is related to the residual oil saturation through the
desaturation curve illustrated by Figure 2.2. Nc is defined as the ratio between the
viscous and local capillary forces and can be calculated from (Gogarty, 1976):
σµυ w
cN =
where υ is the effective flow rate, µw is the viscosity of displacing fluid, and σ is the
IFT. If the wettability preference of the rock is taken into account, the formula for Nc
becomes (Thomas et al., 1987):
θσµυ
cosw
cN =
where θ is the contact angle measured through the fluid with the highest density. The
capillary number, corresponding to the break in the desaturation curve, is designated
as the critical capillary number, N cri. Thus, to improve the oil recovery relative to a
Region 1 Sorw
Region 2 Oil Bank
Region 3 Surfactant
Region 4 Polymer
12
waterflood by using chemicals, Nc must be significantly higher than the critical
capillary number, Nc >> N cri.
For an ordinary waterflood under water-wet conditions, Nc is usually in the
range of 10-7 to 10-5. The critical capillary number may be in the range of 10-5 to
10-4, whereas complete desaturation of the nonwetting phase (oil) may occur at a
capillary number in the range of 10-2 to 10-1 (Lake, 1989). The waterflooded residual
oil saturation may be in the range of 30 to 40%. These data are mainly based on
model cores, such as Berea cores and other outcrop sandstone cores which have
never been in contact with reservoir crude oil. Much lower values are, however,
observed under mixed-wet conditions. This implies that 10 times more difficult to
remobilize capillary trapped discontinuous oil, compared to continuous oil.
Figure 2.2 Schematic capillary desaturation curve for a nonwetting phase
(Lake, 1989)
In order to be able to mobilize a significant amount of the waterflooded
residual oil, it is expected that the capillary number must be increased by a factor of
103 to 104. The only practical way to do this is to reduce the IFT between the
reservoir oil and the injected water by the same factor using surfactants, which
normally means that the IFT should be between about 0.01 and 0.001mN/m.
13
Flow direction
The goal of research on surfactant flooding during the 1990s was to develop
surfactants that can recover additional oil in a cost-effective manner during a normal
waterflood using produced brine or seawater as injection fluid. In order to avoid
many of the problems associated with complicated chemical slugs with high
concentration of surfactants and cosurfactants/ alcohols, the following criteria should
apply (Austad et al., 2000):
• The only chemicals used are surfactant and polymer
• Low chemical concentration (surfactant 0.1 – 0.5 wt%; polymer <
500ppm)
• No imposed salinity gradient or other phase gradients
• The chemicals should be insensitive to multivalent cations
• The flooding conditions should be a two-phase flood with the
surfactant and polymer present in the aqueous phase, forming an oil-
in-water microemulsion, termed Type II(-)
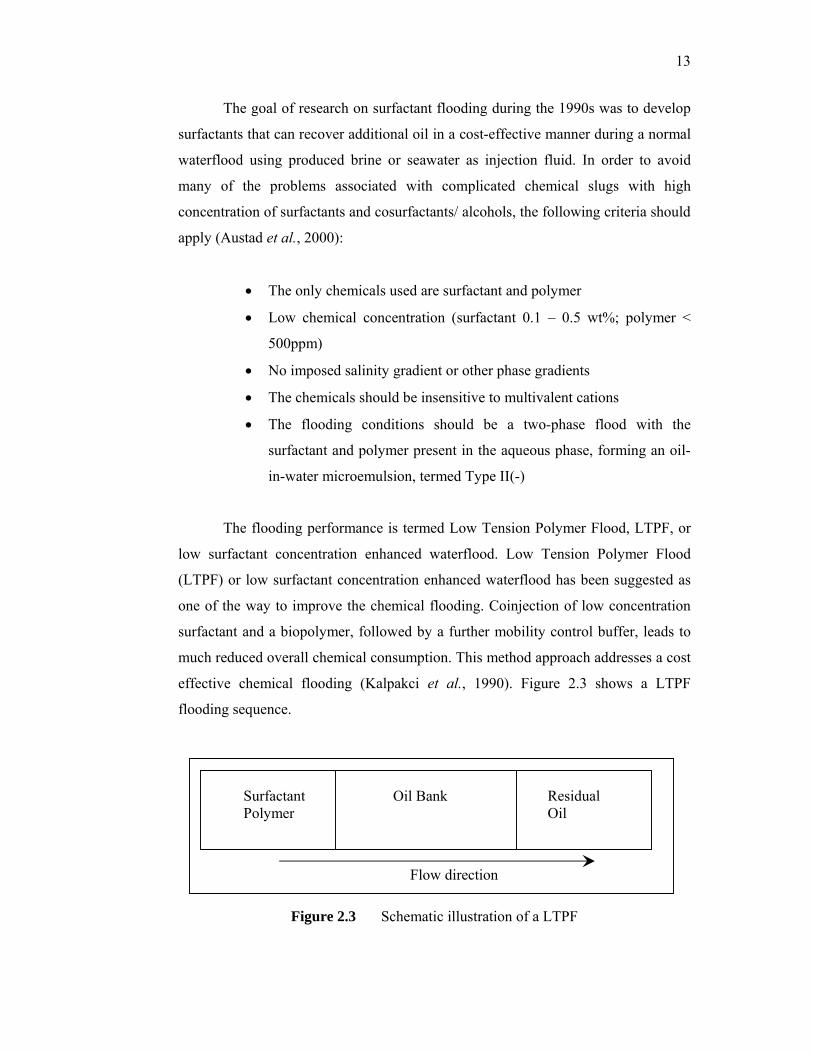
The flooding performance is termed Low Tension Polymer Flood, LTPF, or
low surfactant concentration enhanced waterflood. Low Tension Polymer Flood
(LTPF) or low surfactant concentration enhanced waterflood has been suggested as
one of the way to improve the chemical flooding. Coinjection of low concentration
surfactant and a biopolymer, followed by a further mobility control buffer, leads to
much reduced overall chemical consumption. This method approach addresses a cost
effective chemical flooding (Kalpakci et al., 1990). Figure 2.3 shows a LTPF
flooding sequence.
Figure 2.3 Schematic illustration of a LTPF
Oil Bank Residual
Oil Surfactant Polymer
14
2.1.1 Field Tests
Surfactant use for oil recovery is not a recent development in petroleum field.
Surfactant polymer flooding was tested in several pilots in 1960s. In 1967, Gogarty
of Marathon described the Maraflood Oil Recovery Process. A small pore volume
injection (5 to 15 PV) of high concentration (5 to 12 %) surfactant was injected to
displace oil and water.
Large-scale field tests of surfactant polymer flooding were carried out in the
late 1970. A large-scale application of the Maraflood oil recovery process was
applied on the (113 acres) Henry Unit in Crawford Country, Illinois (Robinson 219-
R Project). The oil recovery was around 25 % ROIP.
Vargo (1978) and Holm (1982) presented the micellar/polymer project in
Bell Creek field (40 acres) in Montana. This project was a technical success, but an
economic failure. 10 % OOIP was produced and the chemical cost was estimated to
be $12/bbl.
Gilliland and Conley (1976) reported surfactant flooding in Big Muddy (1.25
acres). The oil recovery was 36 % of ROIP. The injected chemical slug was 0.25 PV
surfactants containing 2.5 % petroleum sulfonate, 3 % isobutyl alcohol, 0–2 wt%
sodium hydroxide and 200 ppm xanthan. The chemical slug was then followed by
0.5 PV polymer drive.
Whiteley and Wave (1977) and Widmyer et al. (1979) reported on the Salem
unit LTPF project. This project used a surfactant slug containing 2 % petroleum
sulfonate in softened water (6,000 ppm each of Na2CO3 and NaCl, 1,000 ppm
sodium tripolyphosphate). The chemical slug then followed by xanthan polymer slug.
The oil recovery was in between 37 % and 43 % ROIP. Tracers were used in attempt
to determine sweep efficiency, changes in flow path distribution and chemical
utilization.
15
Maerker and Gale (1992) and Reppert et al. (1990) reported pilot test for the
Loudon field. Approximately 68 % of waterflooded residual oil was recovered by
injecting a 0.3 PV chemical slug contained 2.3 wt% of surfactant with coinjection
xanthan biopolymer without cosolvent, followed by 1.0 PV or higher polymer
viscosity polymer drive. The chemical formulation containing a blend of two PO-EO
sulfates, R–O–(PO)m–E(O)n SO3Na. The retention of surfactant was low (less than
0.08 mg/g of rock).
Michels et al. (1996) represented enhanced waterflooding design with dilute
surfactant concentrations for North Sea conditions. It was concluded that alkyl – PO
– EO gyceryl sulfonate surfactants could be used in a dilute (0.1 wt %) surfactant
flood at North Sea reservoir temperature (<120 oC) without polymer drive but with a
sacrificial agent.
Most pilot reported in 1990s were seen to have higher oil recovery than those
in 1970s and 1980s. The improvements in chemicals and understanding of process
mechanisms were the causes for these successes. These field tests indicated that
surfactant polymer flooding can be technically successful. However, the success of
surfactant flooding in EOR depends on many factors, including formulations of the
chemical used, the cost of the surfactants, the availability of chemicals,
environmental impact and oil prices in the market.
Recently, there are surfactants in particular have emerged from the literature
search as being newer, intriguing ideas for EOR applications. For example,
sulfonated alkyl aromatics have been reported as a new series of surfactants for EOR
applications (Berger and Lee, 2002). The new surfactants are different structures
where the sulfonated group is attached to the alkyl chain as opposed to the benzene
ring. One advantage claimed for this new type of surfactant is that it can be produced
in one step process.
16
Alkyl polyglycosides (APG) are suggested as being candidates for EOR
applications (Balzer, 1991). Iglauer et al. (2004) concluded that APG surfactants
may be formulated in brine solutions that can create IFT approaching 0.01 dyne/cm,
or less, versus simple alkane hydrocarbons.
The recent literatures have paid more attention to the new candidates for
EOR and to create low IFT conditions.
2.2 EOR Chemicals
EOR chemicals have to be formulated into stable products that meet the
requirements for it to be usable in the oil field. First, it has to be stable in a wide
range of temperatures, depending on storage conditions. In the oil field, it should be
easy and safe to handle with normal precautions. Viscosity is also one of the
requirements for extreme weather conditions (-10 oC to 45 oC), not exceeding 800 cP
at the lowest temperature. Other considerations, such as flash point, toxicity and
biodegradability may also be on the checklist.
Surfactant–brine–oil phase behaviour is the most important feature of a
surfactant polymer flooding. Possible combinations of oil, brine, and surfactant will
give different phase behaviour. The terminology of surfactant-system phase
behaviour has developed through Wilson (1960), Nelson and Pope (1977) and Healy
and Reed (1976). The phase behaviour of the chemical formulation has to be
evaluated to define which formulation has the best potential to recover additional oil.
The formulations are first blended with alkali and polymer. Then an equal amount of
crude oil and polymer blend are further mixed together in test tubes by a shaking
machine. The mixture of crude oil and chemicals is set for about one week of
equilibration at 60 oC. The appearance and numbers of phases are observed and
recorded. The best case is considered when only two distinct phases are observed:
one water phase and one oil phase, and no third mixed phase are seen.
17
Adsorption of surfactant on reservoir rock is another important consideration
in surfactant flooding formulations. It is well known that high equivalent molecular
weight surfactants are absorber preferentially on the rock surface while the lower
equivalent molecular weight surfactants show a very little adsorption. Since the high
equivalent weight surfactants are responsible for most interfacial tension reduction,
their losses decrease the surfactant slug ability to displace the residual oil in the
reservoir. The solution to reduce the adsorption is either adds sacrificial agents into
the formulation or pre-flood the reservoir with sacrificial agents. It is also possible to
adjust the molecular spectrum (equivalent molecular weight distribution) of the
formulation to minimize the adsorption.
In the typical adsorption test, a field core is initially flooded with 3 pore
volume (PV) of formation water to satisfy any ion exchange. Then the core is cut
into pieces and dried at 80 oC. The crushed core rocks are then mixed mildly with the
surfactant solution for 1 day and set for 7 days before the test. The adsorption is
determined using a heterogeneous titration method. The surfactant adsorption values
range normally between 100 to 450 mg of surfactant/100 g of rock. Tolerable ranges
are less than 200 mg of surfactant /100 g of rock.
Other important criteria in EOR surfactant flooding is to determine if the IFT
can be reduced enough to produce incremental oil. A spinning drop interfacial
tensiometer is usually to measure IFT. Since the spinning drop test is a dynamic test,
IFT is a function of contact time. Until recently, no single surfactant or mixture of
surfactants was able to decrease the IFT between water and oil to about 0.01 and
0.001 mN/m by adding a small concentration of surfactant (about 0.1 to 0.5 wt %) to
the water injected in an ongoing water flood.
18
2.2.1 Surfactants
A typical surfactant monomer is composed of a non polar (lypophile) portion,
or moiety, and a polar (hydrophile) moiety; the entire monomer is sometimes an
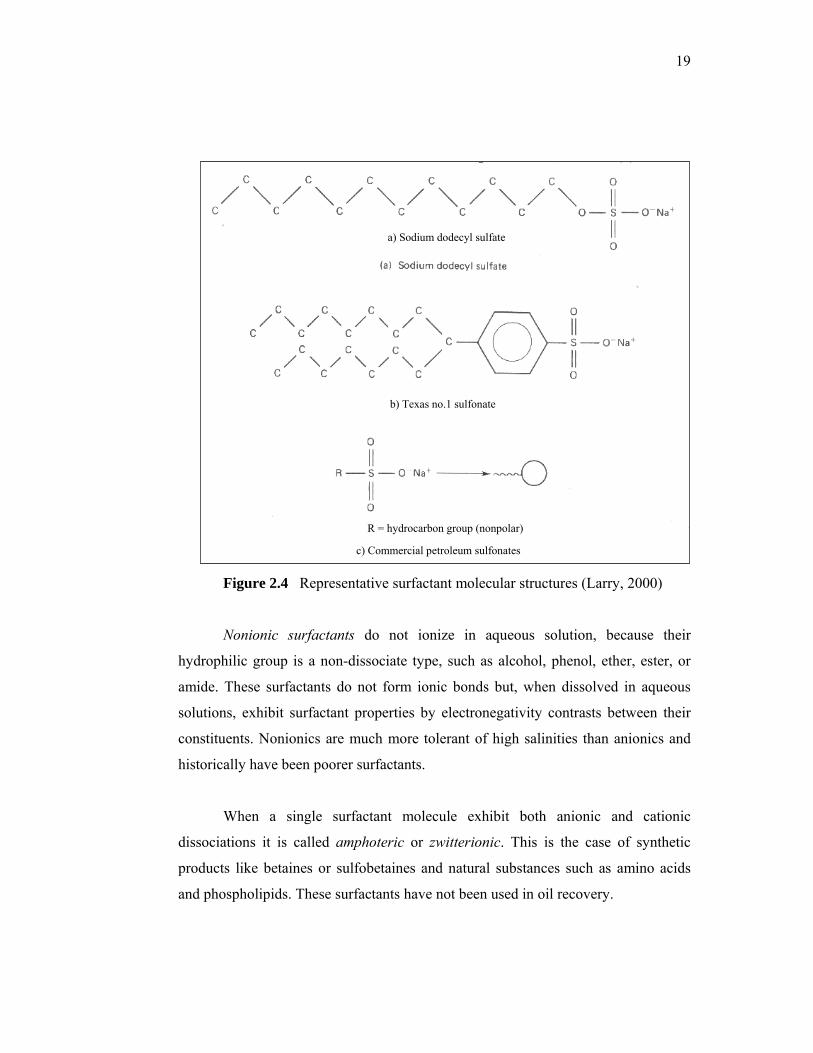
amphiphile because of this dual nature. Figure 2.4 shows the molecular structure of
two common surfactants and illustrates a shorthand notation for surfactant
monomers. The monomer is represented by a “tadpole” symbol, with the non polar
moiety being the tail and the polar being the head.
Surfactants are classified into four groups depending on their polar moieties.
Anionic surfactants are dissociated in water in an amphiphilic anion, and a cation,
which is in general an alkaline metal (Na+, K+). They are the most commonly used
surfactants. They include alklybenzene sulfonates, lauryl sulfate, di-alkyl
sulfosuccinate, lignosulfonates etc. They relatively resistant to retention, stable, and
can be made relatively cheaply.
Cationic surfactants are dissociated in water into an amphiphilic cation and
an anion, most often of the halogen type. A very large proportion of this class
corresponds to nitrogen compounds such as fatty amine salts and quaternary
ammoniums, with one or several long chains of the alkyl type, often coming from
fatty acids. These surfactants are in general more expensive than anionic, because of
a high pressure hydrogenation reaction to be carried out during their synthesis. They
are highly adsorbed by the anionic surfaces of interstitial clays.
19
Figure 2.4 Representative surfactant molecular structures (Larry, 2000)
Nonionic surfactants do not ionize in aqueous solution, because their
hydrophilic group is a non-dissociate type, such as alcohol, phenol, ether, ester, or
amide. These surfactants do not form ionic bonds but, when dissolved in aqueous
solutions, exhibit surfactant properties by electronegativity contrasts between their
constituents. Nonionics are much more tolerant of high salinities than anionics and
historically have been poorer surfactants.
When a single surfactant molecule exhibit both anionic and cationic
dissociations it is called amphoteric or zwitterionic. This is the case of synthetic
products like betaines or sulfobetaines and natural substances such as amino acids
and phospholipids. These surfactants have not been used in oil recovery.
a) Sodium dodecyl sulfate
b) Texas no.1 sulfonate
c) Commercial petroleum sulfonates
R = hydrocarbon group (nonpolar)
20
The unique amphiphilic property of surfactants has made them useful in oil
field applications. Their abilities to solubilize, emulsify/demulsify, foam, alter
interfacial tension, viscosity and friction have made them ingredients in a variety of
fluids. However, on a volume basis, the greatest potential usage would be surfactant
flooding for enhanced oil recovery (Larry, 2000). The 1970s and 1980s were active
periods for research on surfactants for EOR, and a large number of patents were
issued. The following surfactants classes are representative of the large number of
surfactant candidates for EOR:
• Alcohol ether sulfates
• Alcohol ethoxylates (alkoxylates)
• Alkyl aryl sulfonates and petroleum sulfonates
• Alkyl phenol ethoxylates
• Dialklyl sulfosuccinates
• Quaternary ammonium (cationic) surfactants
2.2.1.1 Alcohol Ether Sulfates (AES)
AES can be represented by the following structure: −−−−−− 322 )( SOOCHCHOR n
where R represents a linear or branched alkyl moiety of primary and secondary
alcohols or the alkylbenzene part of alkylphenol. Although not shown above, AES
may contain repeating units of butylene oxide, propylene oxide (PO) or mixtures of
PO and ethylene oxide (EO).
21
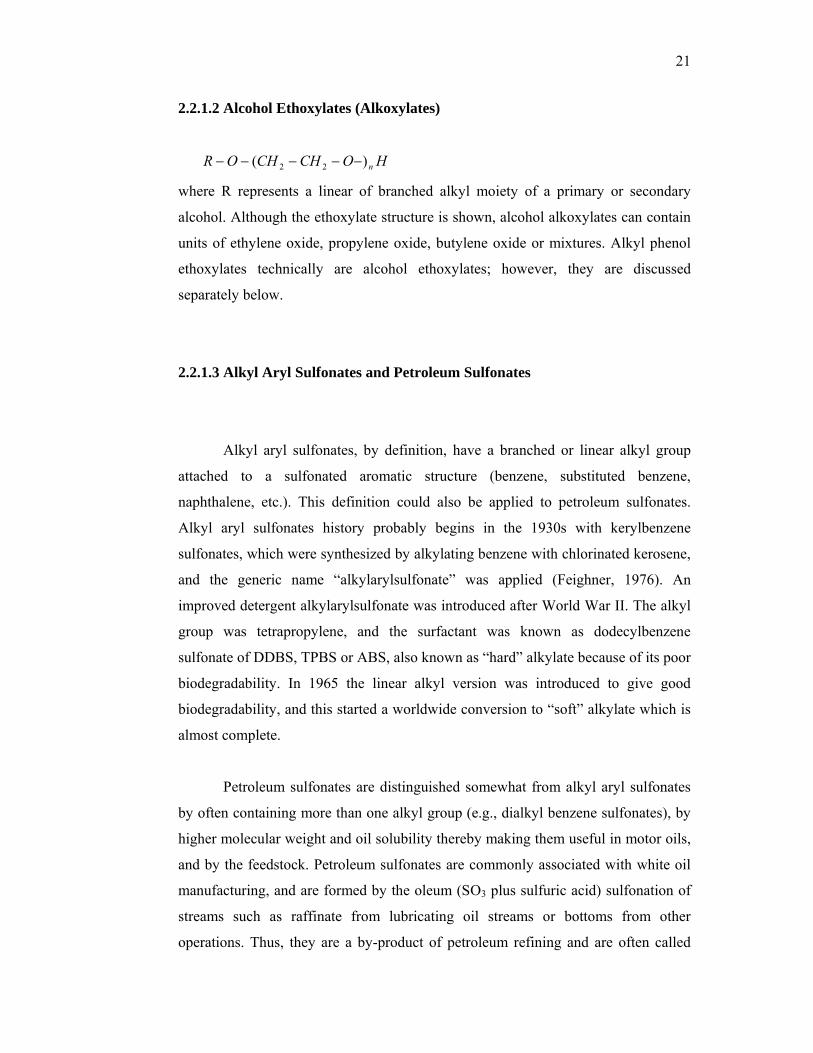
2.2.1.2 Alcohol Ethoxylates (Alkoxylates)
HOCHCHOR n)( 22 −−−−−
where R represents a linear of branched alkyl moiety of a primary or secondary
alcohol. Although the ethoxylate structure is shown, alcohol alkoxylates can contain
units of ethylene oxide, propylene oxide, butylene oxide or mixtures. Alkyl phenol
ethoxylates technically are alcohol ethoxylates; however, they are discussed
separately below.
2.2.1.3 Alkyl Aryl Sulfonates and Petroleum Sulfonates
Alkyl aryl sulfonates, by definition, have a branched or linear alkyl group
attached to a sulfonated aromatic structure (benzene, substituted benzene,
naphthalene, etc.). This definition could also be applied to petroleum sulfonates.
Alkyl aryl sulfonates history probably begins in the 1930s with kerylbenzene
sulfonates, which were synthesized by alkylating benzene with chlorinated kerosene,
and the generic name “alkylarylsulfonate” was applied (Feighner, 1976). An
improved detergent alkylarylsulfonate was introduced after World War II. The alkyl
group was tetrapropylene, and the surfactant was known as dodecylbenzene
sulfonate of DDBS, TPBS or ABS, also known as “hard” alkylate because of its poor
biodegradability. In 1965 the linear alkyl version was introduced to give good
biodegradability, and this started a worldwide conversion to “soft” alkylate which is
almost complete.
Petroleum sulfonates are distinguished somewhat from alkyl aryl sulfonates
by often containing more than one alkyl group (e.g., dialkyl benzene sulfonates), by
higher molecular weight and oil solubility thereby making them useful in motor oils,
and by the feedstock. Petroleum sulfonates are commonly associated with white oil
manufacturing, and are formed by the oleum (SO3 plus sulfuric acid) sulfonation of
streams such as raffinate from lubricating oil streams or bottoms from other
operations. Thus, they are a by-product of petroleum refining and are often called
22
natural sulfonates. These petroleum sulfonates such as alkyl orthoxylene sulfonates
are produced to replace the natural products, usually when a more defined chemical
structure is needed. The concept of producing petroleum sulfonates from crude oil,
specifically for EOR, has been investigated.
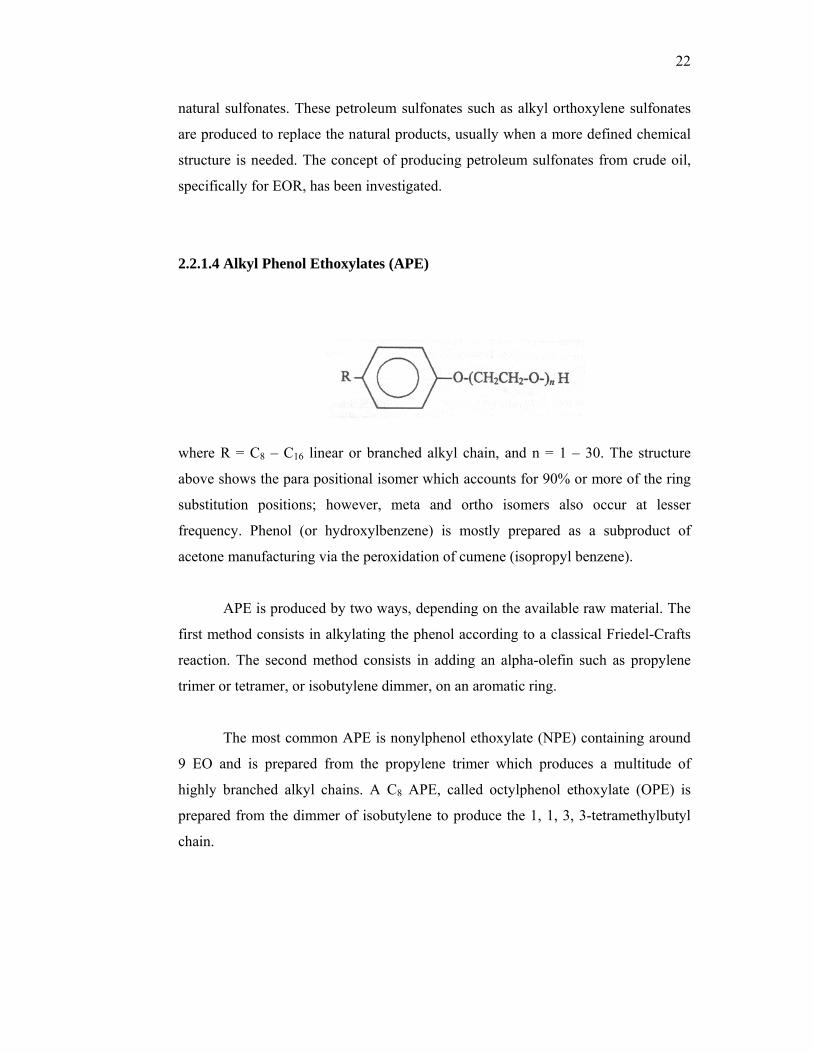
2.2.1.4 Alkyl Phenol Ethoxylates (APE)
where R = C8 – C16 linear or branched alkyl chain, and n = 1 – 30. The structure
above shows the para positional isomer which accounts for 90% or more of the ring
substitution positions; however, meta and ortho isomers also occur at lesser
frequency. Phenol (or hydroxylbenzene) is mostly prepared as a subproduct of
acetone manufacturing via the peroxidation of cumene (isopropyl benzene).
APE is produced by two ways, depending on the available raw material. The
first method consists in alkylating the phenol according to a classical Friedel-Crafts
reaction. The second method consists in adding an alpha-olefin such as propylene
trimer or tetramer, or isobutylene dimmer, on an aromatic ring.
The most common APE is nonylphenol ethoxylate (NPE) containing around
9 EO and is prepared from the propylene trimer which produces a multitude of
highly branched alkyl chains. A C8 APE, called octylphenol ethoxylate (OPE) is
prepared from the dimmer of isobutylene to produce the 1, 1, 3, 3-tetramethylbutyl
chain.
23
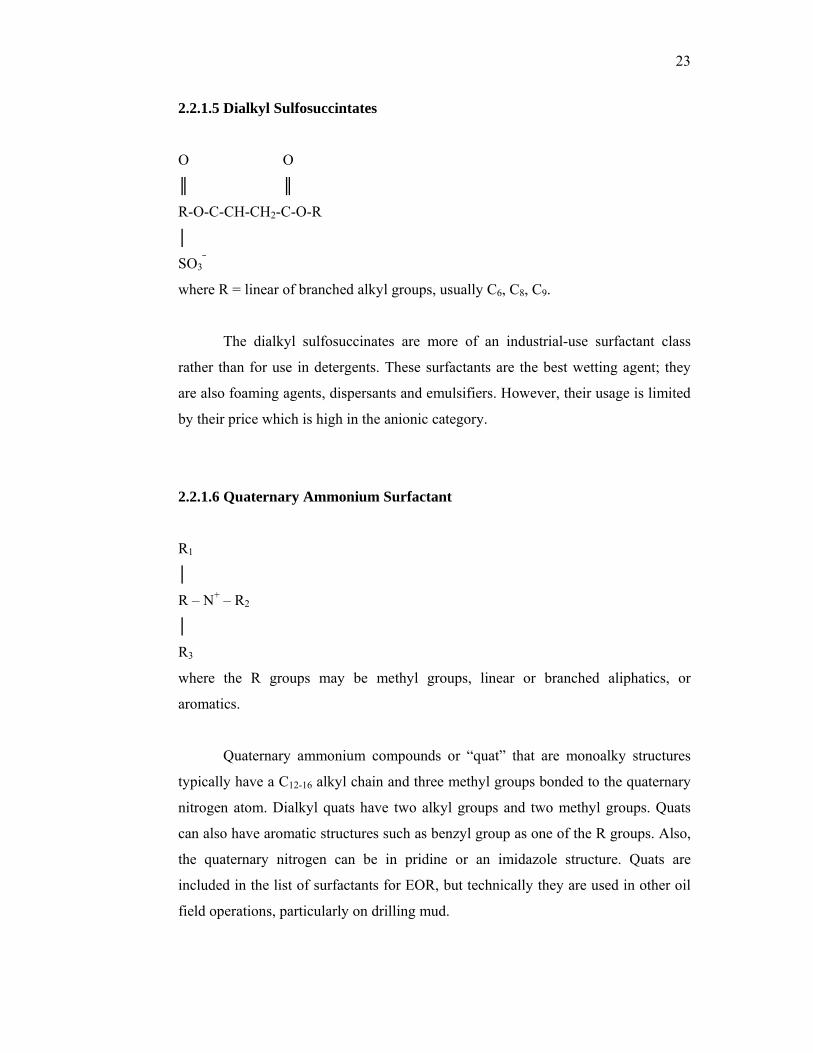
2.2.1.5 Dialkyl Sulfosuccintates
O O
║ ║
R-O-C-CH-CH2-C-O-R
│
SO3⎯
where R = linear of branched alkyl groups, usually C6, C8, C9.
The dialkyl sulfosuccinates are more of an industrial-use surfactant class
rather than for use in detergents. These surfactants are the best wetting agent; they
are also foaming agents, dispersants and emulsifiers. However, their usage is limited
by their price which is high in the anionic category.
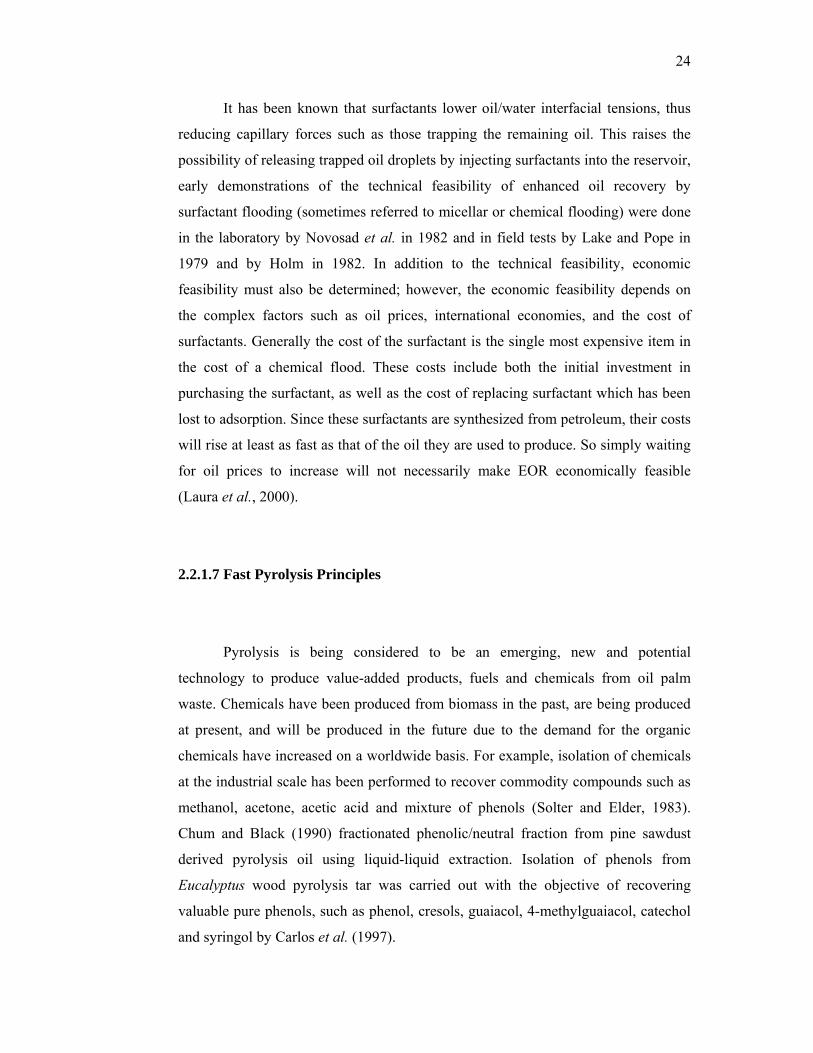
2.2.1.6 Quaternary Ammonium Surfactant
R1
│
R – N+ – R2
│
R3
where the R groups may be methyl groups, linear or branched aliphatics, or
aromatics.
Quaternary ammonium compounds or “quat” that are monoalky structures
typically have a C12-16 alkyl chain and three methyl groups bonded to the quaternary
nitrogen atom. Dialkyl quats have two alkyl groups and two methyl groups. Quats
can also have aromatic structures such as benzyl group as one of the R groups. Also,
the quaternary nitrogen can be in pridine or an imidazole structure. Quats are
included in the list of surfactants for EOR, but technically they are used in other oil
field operations, particularly on drilling mud.
24
It has been known that surfactants lower oil/water interfacial tensions, thus
reducing capillary forces such as those trapping the remaining oil. This raises the
possibility of releasing trapped oil droplets by injecting surfactants into the reservoir,
early demonstrations of the technical feasibility of enhanced oil recovery by
surfactant flooding (sometimes referred to micellar or chemical flooding) were done
in the laboratory by Novosad et al. in 1982 and in field tests by Lake and Pope in
1979 and by Holm in 1982. In addition to the technical feasibility, economic
feasibility must also be determined; however, the economic feasibility depends on
the complex factors such as oil prices, international economies, and the cost of
surfactants. Generally the cost of the surfactant is the single most expensive item in
the cost of a chemical flood. These costs include both the initial investment in
purchasing the surfactant, as well as the cost of replacing surfactant which has been
lost to adsorption. Since these surfactants are synthesized from petroleum, their costs
will rise at least as fast as that of the oil they are used to produce. So simply waiting
for oil prices to increase will not necessarily make EOR economically feasible
(Laura et al., 2000).
2.2.1.7 Fast Pyrolysis Principles
Pyrolysis is being considered to be an emerging, new and potential
technology to produce value-added products, fuels and chemicals from oil palm
waste. Chemicals have been produced from biomass in the past, are being produced
at present, and will be produced in the future due to the demand for the organic
chemicals have increased on a worldwide basis. For example, isolation of chemicals
at the industrial scale has been performed to recover commodity compounds such as
methanol, acetone, acetic acid and mixture of phenols (Solter and Elder, 1983).
Chum and Black (1990) fractionated phenolic/neutral fraction from pine sawdust
derived pyrolysis oil using liquid-liquid extraction. Isolation of phenols from
Eucalyptus wood pyrolysis tar was carried out with the objective of recovering
valuable pure phenols, such as phenol, cresols, guaiacol, 4-methylguaiacol, catechol
and syringol by Carlos et al. (1997).
25
Pyrolysis may be described as the thermal degradation of materials in the
complete absence of inadequate presence of oxygen (Bridgewater and Bridge, 1991).
Three products are usually obtained from pyrolysis process: gas, liquid and char.
Both the product yield and chemical composition of pyrolysis oil can be varied
according to the pyrolysis methods and process conditions (Soltes, 1988).
Fast pyrolysis is a high temperature process in which biomass is rapidly
heated in the absence of oxygen. As a result it decomposes to generate mostly
vapours and aerosols and some charcoal. Liquid production requires very low vapour
residence time to minimize secondary reactions of typically 1 second, although
acceptable yields can be obtained at residence times of up to 5 seconds if the vapour
temperature is kept below 400 oC. After cooling and condensation, a dark brown
mobile liquid is formed which has a heating value about half that of conventional
fuel oil. While it is related to the traditional pyrolysis processes for making charcoal,
fast pyrolysis is an advanced process which is carefully controlled to give high yields
of liquid (Bridgwater et al., 1999).
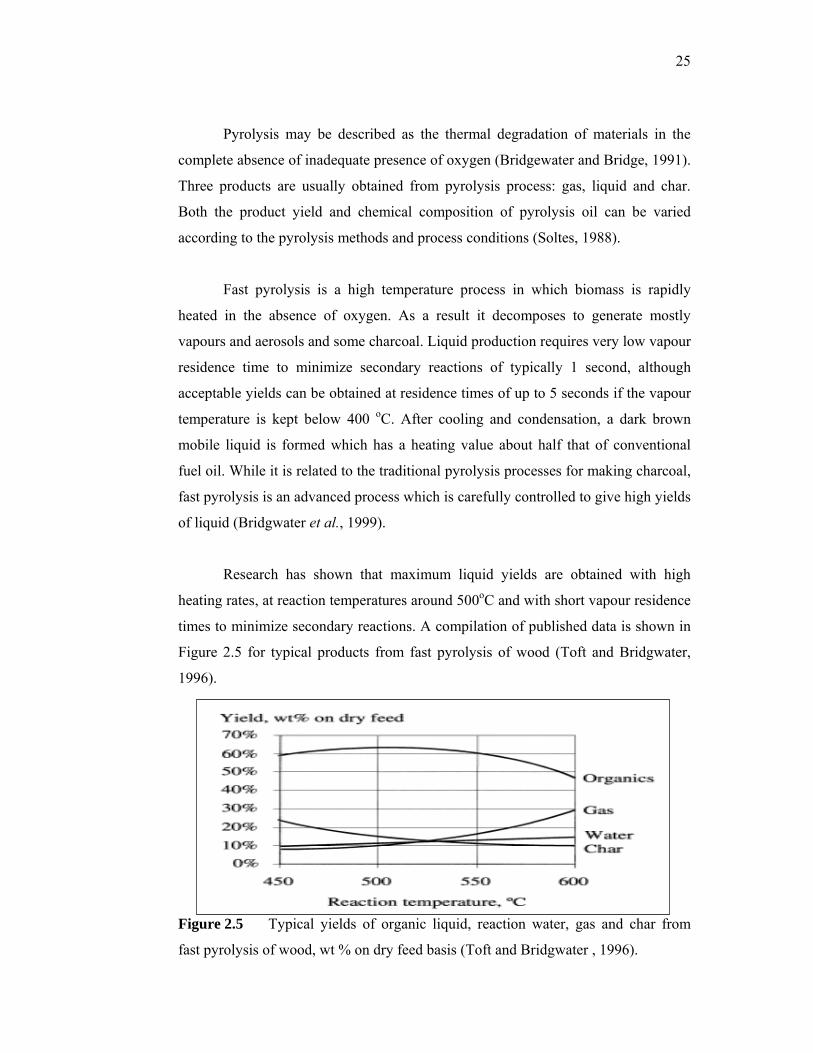
Research has shown that maximum liquid yields are obtained with high
heating rates, at reaction temperatures around 500oC and with short vapour residence
times to minimize secondary reactions. A compilation of published data is shown in
Figure 2.5 for typical products from fast pyrolysis of wood (Toft and Bridgwater,
1996).
Figure 2.5 Typical yields of organic liquid, reaction water, gas and char from
fast pyrolysis of wood, wt % on dry feed basis (Toft and Bridgwater , 1996).
26
A variety of reactor configurations have been investigated. Pyrolysis, perhaps
more than any other conversion technology, has received considerable creativity and
innovation in devising reactor systems that provide the essential ingredients of high
heating rates, moderate temperatures and short vapour product residence times for
liquids. A thorough review of the technologies has recently been completed
(Bridgwater and Peacocke, 1999). There are three main methods of achieving fast
pyrolysis.
1. Ablative pyrolysis in which wood is pressed against a heated surface and
rapidly moved during which the wood melts at the heated surface and leaves
an oil film behind which evaporates. This process uses larger particles of
wood and is typically limited by the rate of heat supply to the reactor. It leads
to compact and intensive reactors that do not need a carrier gas, but with the
penalty of a surface area controlled system and moving parts at high
temperature.
2. Fluid bed and circulating fluid bed pyrolysis which transfers heat from a heat
source to the biomass by a mixture of convection and conduction. The heat
transfer limitation is within the particle, thus, requiring very small particles of
typically not more than 3 mm to obtain good liquid yields. Substantial carrier
gas is needed for fluidization or transport.
3. Vacuum pyrolysis which has slow heating rates but removes pyrolysis
products as rapidly as in the previous methods which thus simulates fast
pyrolysis. Larger particles are needed and the vacuum leads to larger
equipment and higher costs. Total liquid yields are typically lower at up to
60±65% compared to 75±80 wt% from the previous two methods.
27
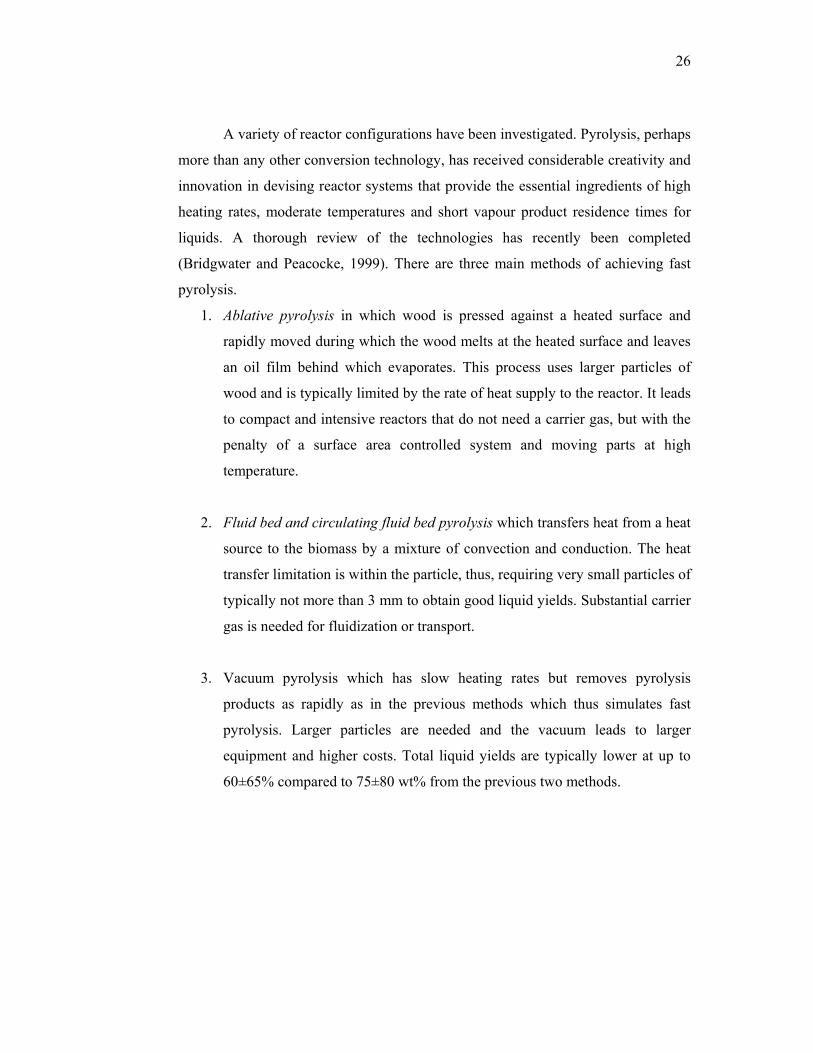
While a wide range of reactor configurations have been operated (Bridgwater,
1999), fluid beds are the most popular configurations due to their ease of operation
and ready scale-up. A typical bubbling fluid bed configuration is depicted in Figure
2.6 with utilization of the by-product gas and char to provide the process heat. The
figure includes the necessary steps of drying the feed to less than 10% water to
minimize the water in the product liquid oil, and grinding the feed to around 2 mm to
give sufficiently small particles to ensure rapid reaction. This configuration is used
below for processing waste wood.
Figure 2.6 Conceptual fluid bed fast pyrolysis process (Bridgwater and Peacocke,
1999).
2.2.1.8 Pyrolysis Oil
Biomass pyrolysis oil differs a great deal from petroleum-based fuels in both
physical properties and chemical composition. There are many applications of
pyrolysis oil, such as liquid fuel, transport fuel, and as a source of chemicals (Spitzer
and Tustin, 2001). Pyrolysis oil can be upgraded to high quality hydrocarbon fuels
and recoverable for production of valuable chemicals as well.
28
According to Diebold and Bridgwater (1997), the commercial uses of the fast
pyrolysis oil are as a source of high valued specialty chemicals in the short term and
as petroleum fuel substitute in long term. The high valued specialty chemicals
include hydroxyacetaldehyde, food flavours for meat preservation, the recovery of
levoglucosan sugars to ethanol, organic acid for road de-icing and phenolics for
phenol formaldehyde resins (Ani and Zailani, 1996).
Wong (2002) reported that as comparing phenol price at RM 3270/ton with
the production cost of palm shell based phenol at RM 923.60/ton, the price was less
71.76 %. Thus, the usage of palm shell based phenol to replace the petroleum based
phenol is very promising.
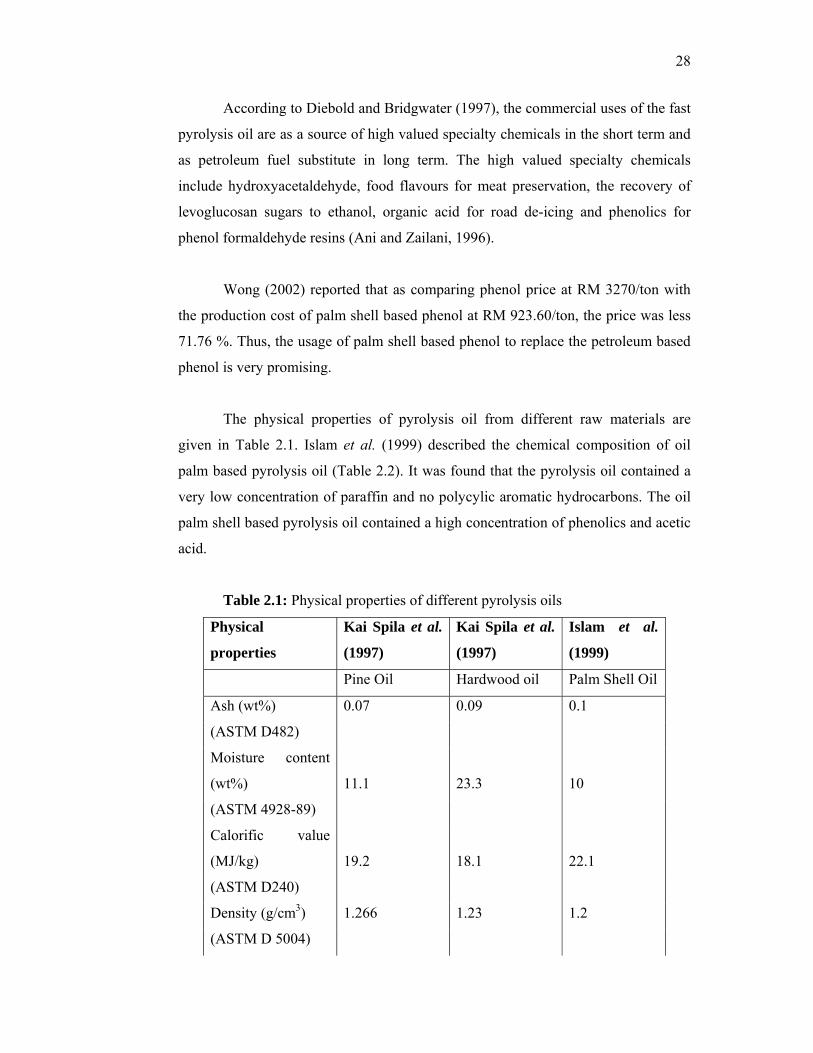
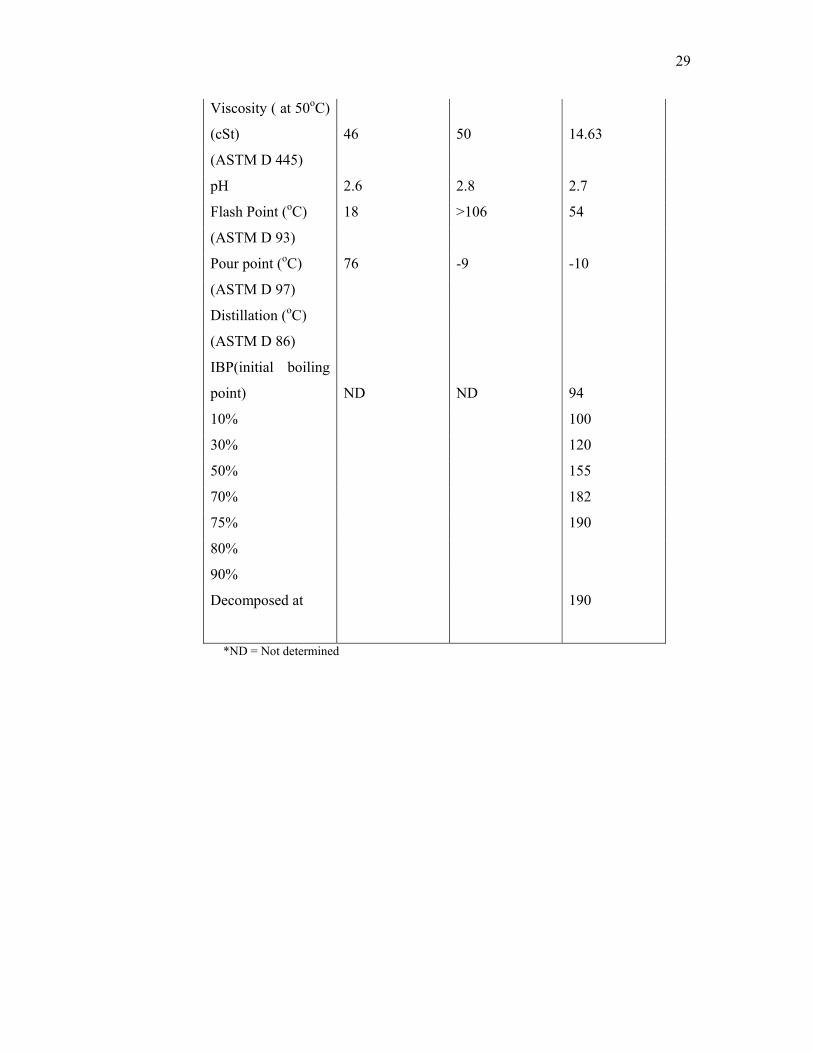
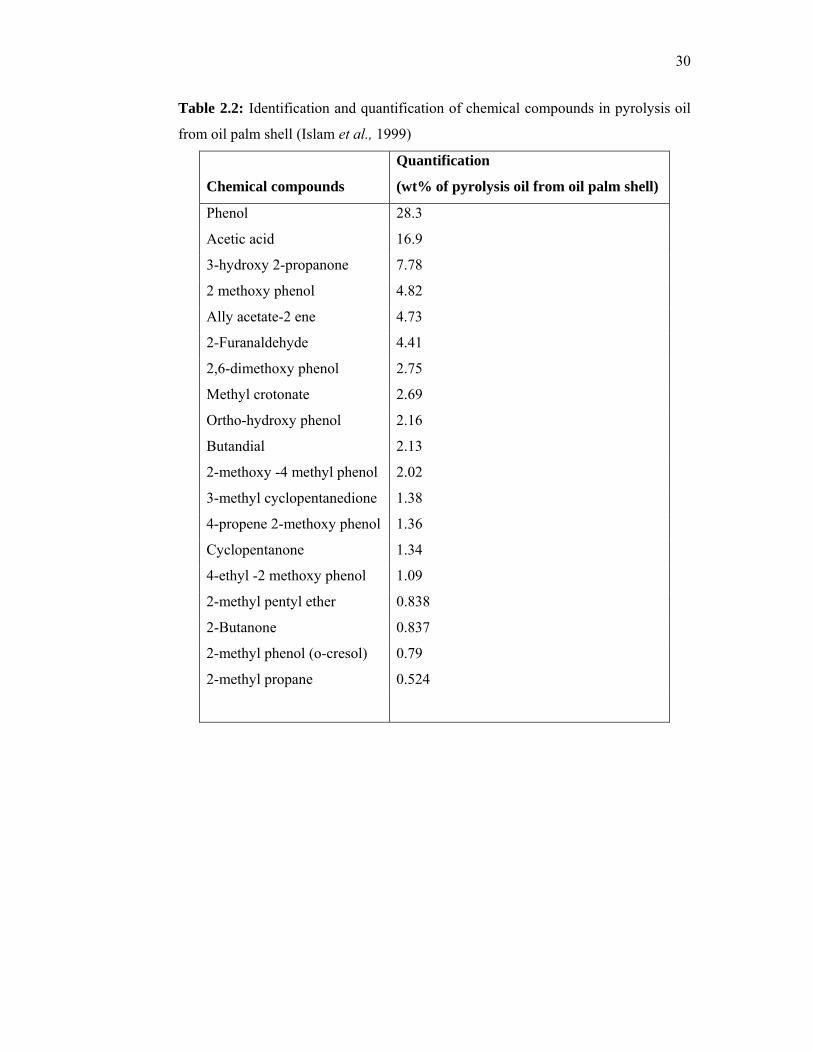
The physical properties of pyrolysis oil from different raw materials are
given in Table 2.1. Islam et al. (1999) described the chemical composition of oil
palm based pyrolysis oil (Table 2.2). It was found that the pyrolysis oil contained a
very low concentration of paraffin and no polycylic aromatic hydrocarbons. The oil
palm shell based pyrolysis oil contained a high concentration of phenolics and acetic
acid.
Table 2.1: Physical properties of different pyrolysis oils
Physical
properties
Kai Spila et al.
(1997)
Kai Spila et al.
(1997)
Islam et al.
(1999)
Pine Oil Hardwood oil Palm Shell Oil
Ash (wt%) 0.07 0.09 0.1
(ASTM D482)
Moisture content
(wt%) 11.1 23.3 10
(ASTM 4928-89)
Calorific value
(MJ/kg) 19.2 18.1 22.1
(ASTM D240)
Density (g/cm3) 1.266 1.23 1.2
(ASTM D 5004)
29
Viscosity ( at 50oC)
(cSt) 46 50 14.63
(ASTM D 445)
pH 2.6 2.8 2.7
Flash Point (oC) 18 >106 54
(ASTM D 93)
Pour point (oC) 76 -9 -10
(ASTM D 97)
Distillation (oC)
(ASTM D 86)
IBP(initial boiling
point) ND ND 94
10% 100
30% 120
50% 155
70% 182
75% 190
80%
90%
Decomposed at 190
*ND = Not determined
30
Table 2.2: Identification and quantification of chemical compounds in pyrolysis oil
from oil palm shell (Islam et al., 1999)
Chemical compounds
Quantification
(wt% of pyrolysis oil from oil palm shell)
Phenol 28.3
Acetic acid 16.9
3-hydroxy 2-propanone 7.78
2 methoxy phenol 4.82
Ally acetate-2 ene 4.73
2-Furanaldehyde 4.41
2,6-dimethoxy phenol 2.75
Methyl crotonate 2.69
Ortho-hydroxy phenol 2.16
Butandial 2.13
2-methoxy -4 methyl phenol 2.02
3-methyl cyclopentanedione 1.38
4-propene 2-methoxy phenol 1.36
Cyclopentanone 1.34
4-ethyl -2 methoxy phenol 1.09
2-methyl pentyl ether 0.838
2-Butanone 0.837
2-methyl phenol (o-cresol) 0.79
2-methyl propane 0.524

31
2.2.2 Extraction of Phenol from Pyrolysis Oil
In 1980, Gallivian and Matschei obtained a phenolic fraction from wood
pyrolysis oil by aqueous alkaline extraction, followed by acidification of the aqueous
phase. The phenols were recovered by organic solvent extraction. The biomass-
derived phenols could replace 25 – 75 % of commercial phenol used in the
production of adhesives.
In accordance with this invention the oil derived from pyrolysis of
lignocelluloses waste materials was first mixed with a strong basic solution such as a
sodium hydroxide solution. The resulting black colour mixture with a pH range of
from about 11 to about 13 was then contacted with an appropriate solvent such as
methylene chloride in a suitable extraction unit. A first extract was removed from
this unit comprising the neutral fraction of the oil which was subjected to distillate
operation to remove the solvent and recover the neutral fraction.
The raffinate from this unit was mixed with mineral acid, such as sulfuric
acid, or with carbon dioxide to lower its pH to the range of from about 7.5 to about
9.0, before it was introduced into a second extraction unit wherein it was contacted
with a solvent such as methylene chloride. By this extraction step the phenolic
fraction was removed with the solvent as the second extract which was distilled to
recover the solvent and the phenolic product. The second raffinate from the second
extraction unit was mixed with a mineral acid such as sulfuric acid to reduce its pH
to the range of from about 1.0 to about 4.0, the tarry residues separated and the
mixture was then introduced into a third extraction unit wherein it was contacted
with methylene chloride. The third extract from this unit, after the removal of the
tarry product was distilled to separate the solvent and recover the organic acids
fraction. The third raffinate from the third extraction unit was neutralized and
transported to a waste disposal system.
32
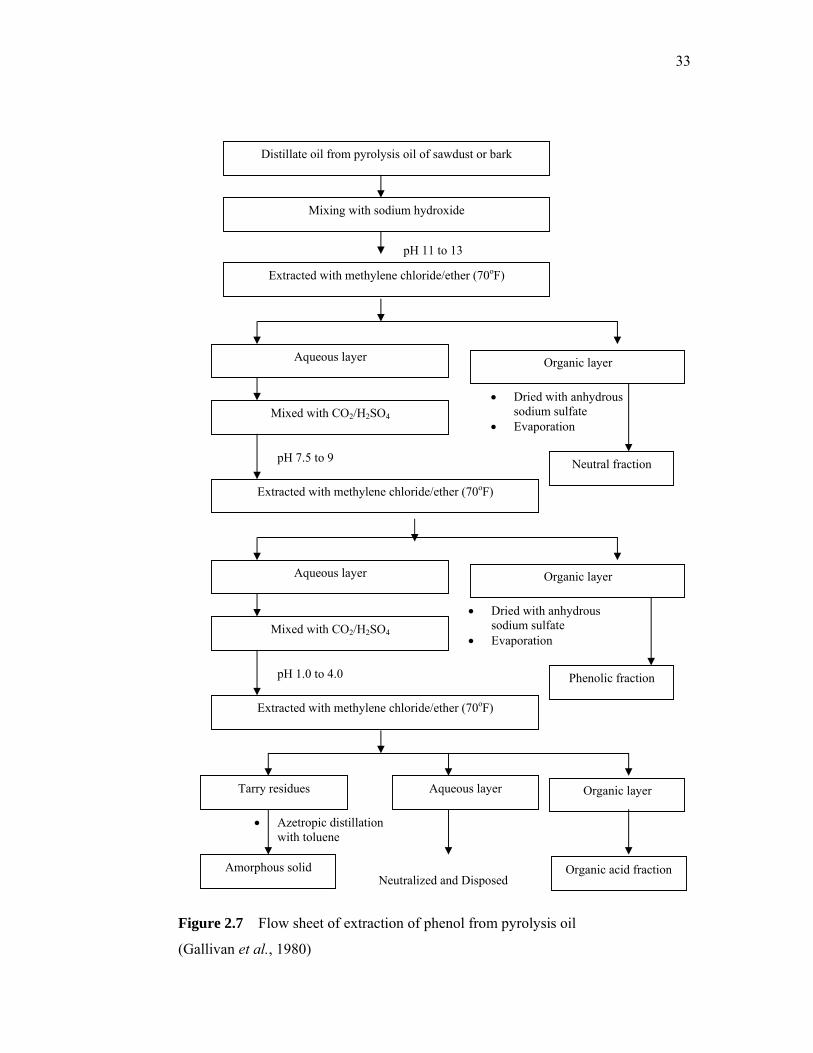
The phenolic fraction obtained by this extraction method was used as total or
partial replacement for petroleum-derived phenol in making phenol-formaldehyde
resins. Generally, the extraction method is summarized by the flow sheet in Figure
2.7.
The previous extraction method by Gallivian et al. (1980) used pyrolysis oils
which were usually formed at ill-defined temperatures and which had undergone
phase separation cracking and some condensation, and suffered from very low yields.
Chum and Black (1990) published an improved and simplified process of
fractionating fast-pyrolysis oils derived from lignocellulosic materials.
The process included mixing the oils with an organic solvent having at least a
moderate solubility parameter and good hydrogen bonding capability, the solvent
extracted the phenol and neutral fractions from the oils. The organic solvent-soluble
fraction contained the phenol and neutral fractions was separated from the mixture
and admixed with water to extract water-soluble materials.
33
pH 11 to 13
Figure 2.7 Flow sheet of extraction of phenol from pyrolysis oil
(Gallivan et al., 1980)
Distillate oil from pyrolysis oil of sawdust or bark
• Azetropic distillation with toluene
• Dried with anhydrous sodium sulfate
• Evaporation
Neutral fraction
Mixing with sodium hydroxide
Extracted with methylene chloride/ether (70oF)
Aqueous layer Organic layer
Mixed with CO2/H2SO4
pH 7.5 to 9
Extracted with methylene chloride/ether (70oF)
• Dried with anhydrous sodium sulfate
• Evaporation
Phenolic fraction
Aqueous layer Organic layer
Mixed with CO2/H2SO4
pH 1.0 to 4.0
Extracted with methylene chloride/ether (70oF)
Tarry residues Aqueous layer Organic layer
Amorphous solid Organic acid fraction Neutralized and Disposed
34
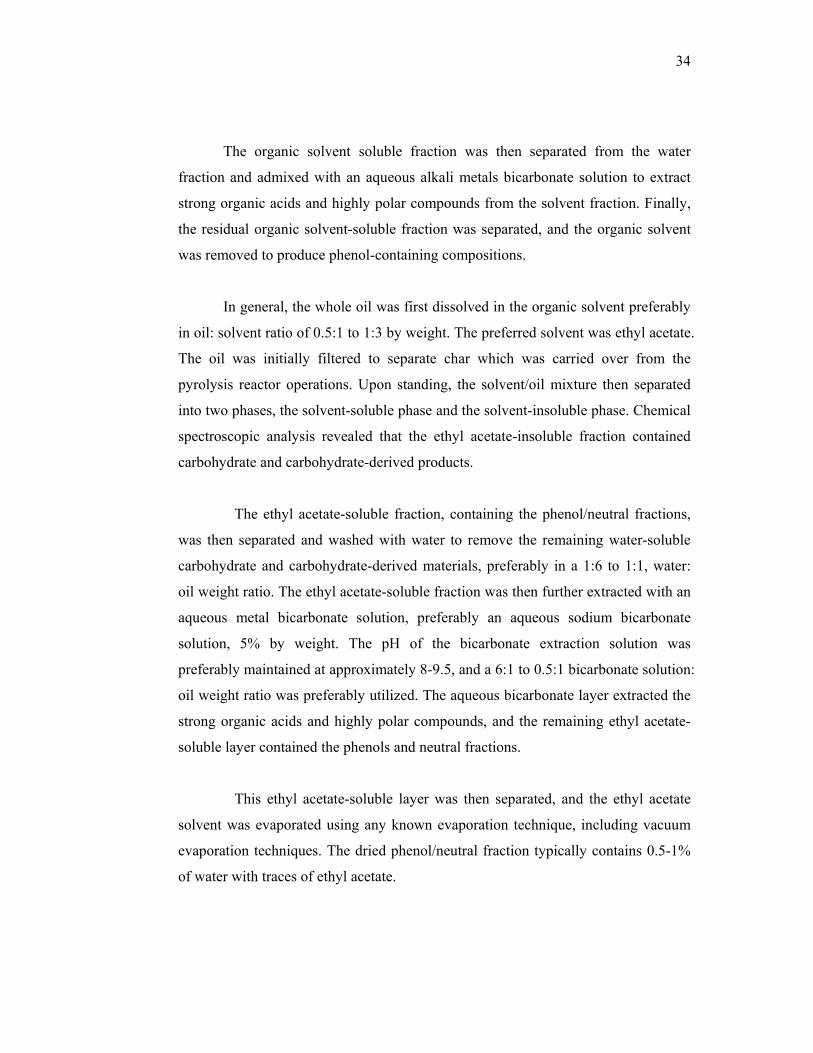
The organic solvent soluble fraction was then separated from the water
fraction and admixed with an aqueous alkali metals bicarbonate solution to extract
strong organic acids and highly polar compounds from the solvent fraction. Finally,
the residual organic solvent-soluble fraction was separated, and the organic solvent
was removed to produce phenol-containing compositions.
In general, the whole oil was first dissolved in the organic solvent preferably
in oil: solvent ratio of 0.5:1 to 1:3 by weight. The preferred solvent was ethyl acetate.
The oil was initially filtered to separate char which was carried over from the
pyrolysis reactor operations. Upon standing, the solvent/oil mixture then separated
into two phases, the solvent-soluble phase and the solvent-insoluble phase. Chemical
spectroscopic analysis revealed that the ethyl acetate-insoluble fraction contained
carbohydrate and carbohydrate-derived products.
The ethyl acetate-soluble fraction, containing the phenol/neutral fractions,
was then separated and washed with water to remove the remaining water-soluble
carbohydrate and carbohydrate-derived materials, preferably in a 1:6 to 1:1, water:
oil weight ratio. The ethyl acetate-soluble fraction was then further extracted with an
aqueous metal bicarbonate solution, preferably an aqueous sodium bicarbonate
solution, 5% by weight. The pH of the bicarbonate extraction solution was
preferably maintained at approximately 8-9.5, and a 6:1 to 0.5:1 bicarbonate solution:
oil weight ratio was preferably utilized. The aqueous bicarbonate layer extracted the
strong organic acids and highly polar compounds, and the remaining ethyl acetate-
soluble layer contained the phenols and neutral fractions.
This ethyl acetate-soluble layer was then separated, and the ethyl acetate
solvent was evaporated using any known evaporation technique, including vacuum
evaporation techniques. The dried phenol/neutral fraction typically contains 0.5-1%
of water with traces of ethyl acetate.
35
The phenols/neutrals fraction could be further fractionated into isolated
phenolics and neutrals if desired. This could be accomplished by utilizing a 5% by
weight solution of sodium hydroxide in a volume ratio of 5:1 of solution: extract.
The aqueous layer was then acidified to a pH of about 2 utilizing a 50% solution of
phosphoric acid although other acids could be used. It was then saturated with
sodium chloride and extracted with ethyl acetate. Evaporation of the solvent led to
the isolation of the phenolics fraction; evaporation of the initial ethyl acetate solution
free from phenolics led to the neutrals fraction.
In 1997, Carlos et al. investigated the possibility of isolating valuable
phenols from raw wood tar at laboratory scales with a potential application at a
higher scale. Isolation of phenols from Eucalyptus wood pyrolysis tar was carried
out with the objective of recovering valuable pure phenols, such as phenol, cresols,
guaiacol, 4-methyl guaiacol, catechol and syringol.
The procedure consisted of four main steps:
(1) The wood tar-derived oil containing the desired phenols was dissolved in
ethyl acetate;
(2) An aqueous alkaline solution was added to extract phenols by converting
them into water-soluble phenolate ions;
(3) Phenols were regenerated by acidification of the aqueous layer with sulfuric
acid; and
(4) A phenolic-rich fraction was recovered by ethyl acetate extraction of the
acidic aqueous layer. The procedure was performed at room temperature.
The detailed procedure was as follows:
a) An accurate amount of primary oil weighing between 2 and 6 g was
dissolved in ethyl acetate at a 1: 1 weight ratio to improve the flow ability
and to decrease the density of the original oil.
b) The solution was mixed with an aqueous sodium hydroxide solution in a 1: 1
ratio by weight in a 125 ml separatory funnel. The phases could be clearly
36
distinguished at this ratio. The funnel was shaken and phases were separated
on standing and pH was measured.
c) The alkaline extraction of the solvent phase was repeated five times with
fresh alkali solution.
d) The combined aqueous phases were collected in a 125 ml separatory funnel
and the phenols were regenerated by acidifying the solution with a solution
of sulfuric acid 50% by weight to a pH near 6. It had been observed that
phenols were better extracted from the aqueous phase at a pH below 7.
Ethyl acetate was used as the organic solvent to recover the phenols from the
aqueous phase. An earlier study has shown that ketones and esters were good
solvents for the removal of phenols from water (Won and Prausnitz, 1975). Ethyl
acetate in particular, had been used for the extraction of wood tar phenols with
optimum results. The extraction was repeated four times with a 0.5:1
solvent/aqueous phase weight ratio.
The extraction procedure was carried out using NaOH solutions of 2, 0.3 and
0.05 M to determine the effect of pH on the recovery of phenols. Complete recovery
of phenols was achieved at a pH of 12-13 by using a concentrated alkaline solution.
A scheme of the liquid-liquid extraction procedure is shown in Figure 2.8.
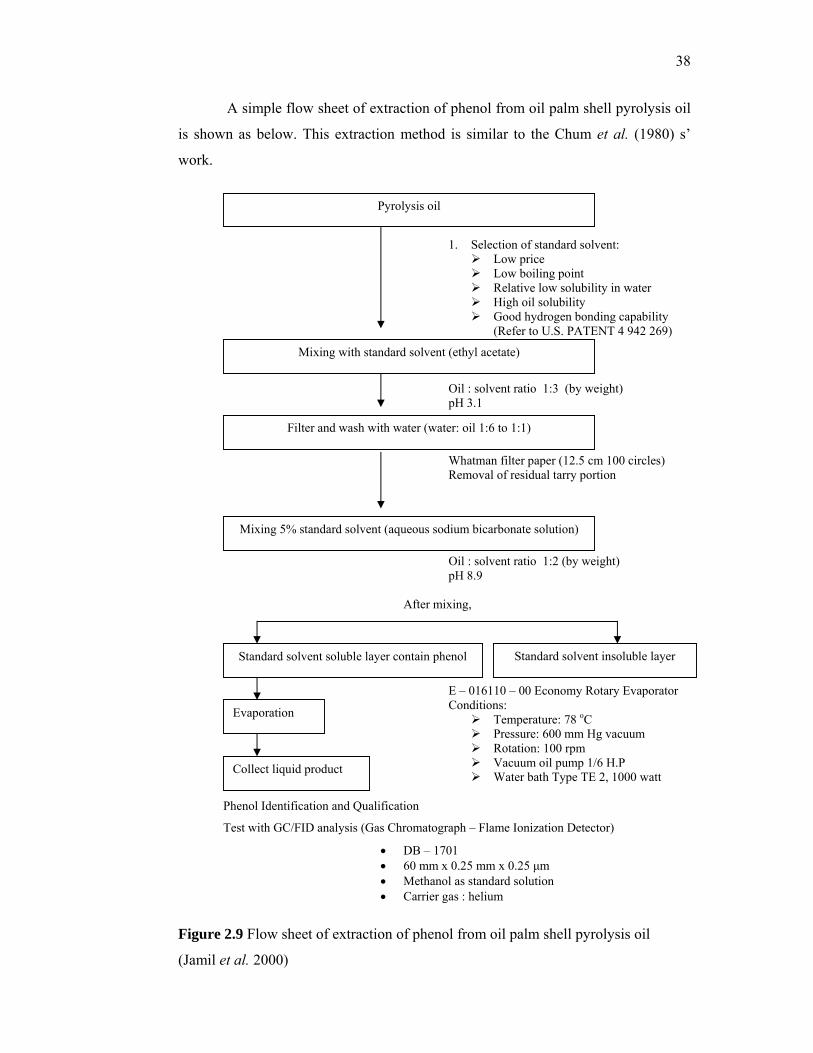
In 2000, Jamil et al. extracted the phenolic compounds from the pyrolysis of
oil palm shell. A standard solvent was selected for the purpose of extraction of
phenols from the pyrolysis oil. The requirements for the organic solvent were low
boiling point, relatively low solubility in water, high solubility in oil.
The preferred solvent was ethyl acetate. The whole oil was dissolved in the
ethyl acetate to oil: solvent ratio of 1:3 at pH of 3.1 and then filtered with Whatman
filter paper of specification 12.5 cm 100 circles. The oil solvent mixture was
collected in a separating funnel and the thick residual tarry portion was removed. A
5% sodium bicarbonate solution was mixed with the oil solvent mixture at a
proportion of 1:2 bicarbonate solution: oil weight ratio, the pH value of this standard
solution was maintained at 8.9. As a result of mixing, the mixture separated into two
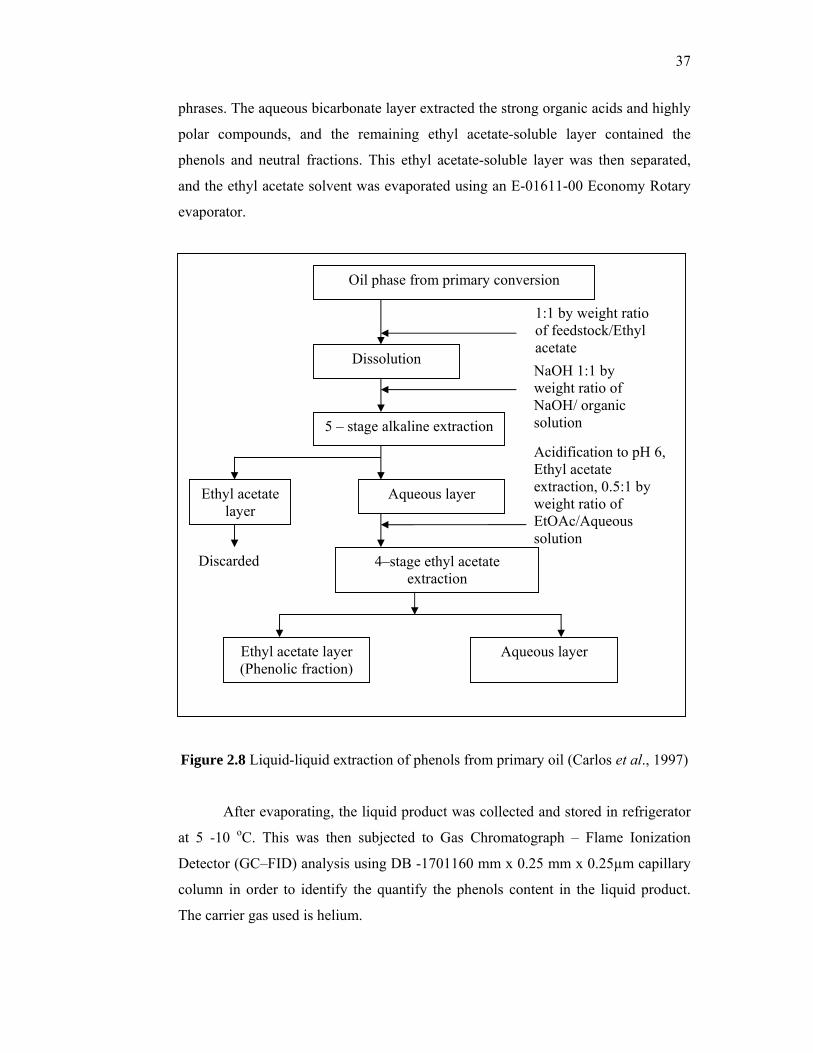
37
phrases. The aqueous bicarbonate layer extracted the strong organic acids and highly
polar compounds, and the remaining ethyl acetate-soluble layer contained the
phenols and neutral fractions. This ethyl acetate-soluble layer was then separated,
and the ethyl acetate solvent was evaporated using an E-01611-00 Economy Rotary
evaporator.
Figure 2.8 Liquid-liquid extraction of phenols from primary oil (Carlos et al., 1997)
After evaporating, the liquid product was collected and stored in refrigerator
at 5 -10 oC. This was then subjected to Gas Chromatograph – Flame Ionization
Detector (GC–FID) analysis using DB -1701160 mm x 0.25 mm x 0.25µm capillary
column in order to identify the quantify the phenols content in the liquid product.
The carrier gas used is helium.
Oil phase from primary conversion
Dissolution
5 – stage alkaline extraction
Aqueous layer
4–stage ethyl acetate extraction
Ethyl acetate layer (Phenolic fraction)
Aqueous layer
Ethyl acetate layer
1:1 by weight ratio of feedstock/Ethyl acetate
Discarded
Acidification to pH 6, Ethyl acetate extraction, 0.5:1 by weight ratio of EtOAc/Aqueous solution
NaOH 1:1 by weight ratio of NaOH/ organic solution
38
A simple flow sheet of extraction of phenol from oil palm shell pyrolysis oil
is shown as below. This extraction method is similar to the Chum et al. (1980) s’
work.
1. Selection of standard solvent: Low price Low boiling point Relative low solubility in water High oil solubility Good hydrogen bonding capability
(Refer to U.S. PATENT 4 942 269)
Oil : solvent ratio 1:3 (by weight) pH 3.1 Whatman filter paper (12.5 cm 100 circles) Removal of residual tarry portion Oil : solvent ratio 1:2 (by weight) pH 8.9 After mixing,
E – 016110 – 00 Economy Rotary Evaporator Conditions:
Temperature: 78 oC Pressure: 600 mm Hg vacuum Rotation: 100 rpm Vacuum oil pump 1/6 H.P Water bath Type TE 2, 1000 watt
Phenol Identification and Qualification
Test with GC/FID analysis (Gas Chromatograph – Flame Ionization Detector)
• DB – 1701 • 60 mm x 0.25 mm x 0.25 µm • Methanol as standard solution • Carrier gas : helium
Figure 2.9 Flow sheet of extraction of phenol from oil palm shell pyrolysis oil
(Jamil et al. 2000)
Pyrolysis oil
Evaporation
Mixing with standard solvent (ethyl acetate)
Mixing 5% standard solvent (aqueous sodium bicarbonate solution)
Filter and wash with water (water: oil 1:6 to 1:1)
Standard solvent soluble layer contain phenol Standard solvent insoluble layer
Collect liquid product
39
2.2.3 Basic Chemistry of Sulfonation and Sulfatation
Sulfonation and sulfation are major industrial chemical processes used to
make a diverse range of products, including dyes and color intensifiers, pigments,
medicinals, pesticides and organic intermediates. Additionally, almost 500,000
metric tons per year of lignin sulfonates are produced as a by-product from paper
pulping. Petroleum sulfonates are widely used as chemicals in chemical flooding in
EOR.
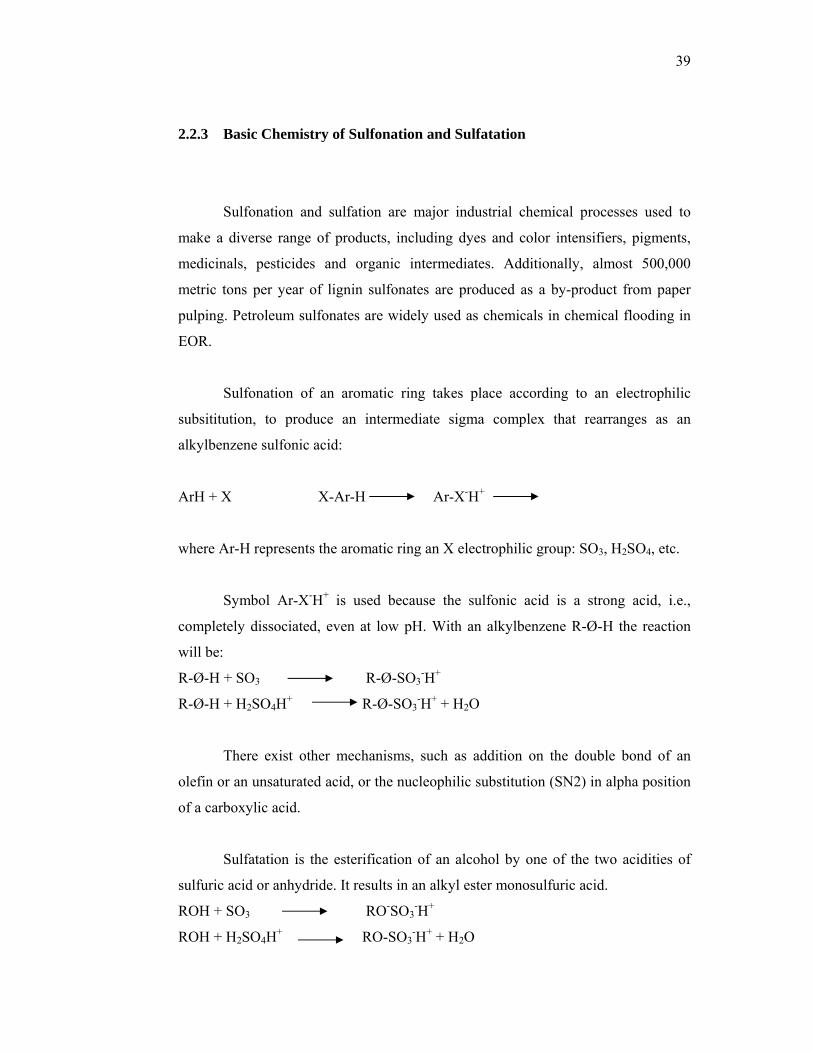
Sulfonation of an aromatic ring takes place according to an electrophilic
subsititution, to produce an intermediate sigma complex that rearranges as an
alkylbenzene sulfonic acid:
ArH + X X-Ar-H Ar-X-H+
where Ar-H represents the aromatic ring an X electrophilic group: SO3, H2SO4, etc.
Symbol Ar-X-H+ is used because the sulfonic acid is a strong acid, i.e.,
completely dissociated, even at low pH. With an alkylbenzene R-Ø-H the reaction
will be:
R-Ø-H + SO3 R-Ø-SO3-H+
R-Ø-H + H2SO4H+ R-Ø-SO3-H+ + H2O
There exist other mechanisms, such as addition on the double bond of an
olefin or an unsaturated acid, or the nucleophilic substitution (SN2) in alpha position
of a carboxylic acid.
Sulfatation is the esterification of an alcohol by one of the two acidities of
sulfuric acid or anhydride. It results in an alkyl ester monosulfuric acid.
ROH + SO3 RO-SO3-H+
ROH + H2SO4H+ RO-SO3-H+ + H2O
40
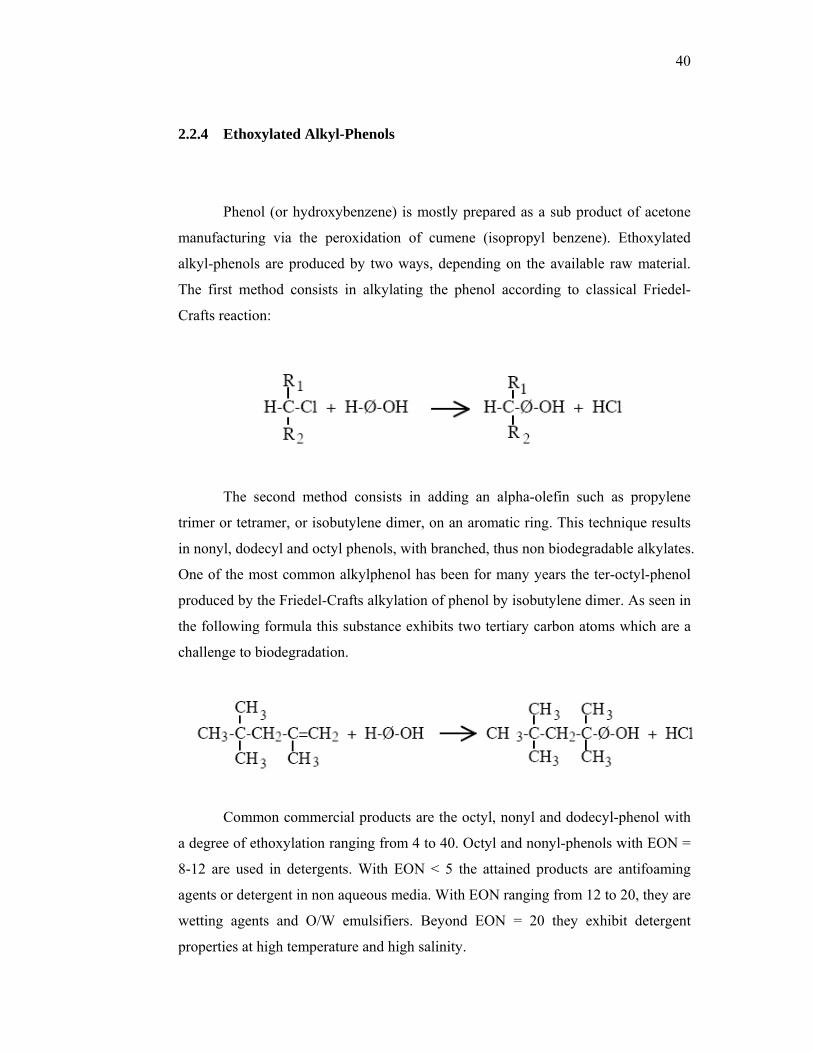
2.2.4 Ethoxylated Alkyl-Phenols
Phenol (or hydroxybenzene) is mostly prepared as a sub product of acetone
manufacturing via the peroxidation of cumene (isopropyl benzene). Ethoxylated
alkyl-phenols are produced by two ways, depending on the available raw material.
The first method consists in alkylating the phenol according to classical Friedel-
Crafts reaction:
The second method consists in adding an alpha-olefin such as propylene
trimer or tetramer, or isobutylene dimer, on an aromatic ring. This technique results
in nonyl, dodecyl and octyl phenols, with branched, thus non biodegradable alkylates.
One of the most common alkylphenol has been for many years the ter-octyl-phenol
produced by the Friedel-Crafts alkylation of phenol by isobutylene dimer. As seen in
the following formula this substance exhibits two tertiary carbon atoms which are a
challenge to biodegradation.
Common commercial products are the octyl, nonyl and dodecyl-phenol with
a degree of ethoxylation ranging from 4 to 40. Octyl and nonyl-phenols with EON =
8-12 are used in detergents. With EON < 5 the attained products are antifoaming
agents or detergent in non aqueous media. With EON ranging from 12 to 20, they are
wetting agents and O/W emulsifiers. Beyond EON = 20 they exhibit detergent
properties at high temperature and high salinity.
41
The main use of alkyl phenols is as ingredients for domestic and industrial
detergents, particularly for high electrolyte level: acid solution for metal cleaning,
detergents for dairy plants, agrochemical emulsions and styrene polymerization.
Since branched alkylates are not readily biodegradable, the trend has been in
the past decades to go into more linear products. However the additional cost has
restrained that trend, which has been susbtituted in the past decade by another way to
cut price and toxicity alike, i.e. the elimination of the benzene ring altogether, e.g.
the substitution by ethoxylated linear alcohols. The dilemma is that alcohol
ethoxylates are not as good detergents as their counterpart phenol compounds, just as
it is the case with alkylbenzene sulfonates versus alkane or olefin sulfonates.
2.2.5 Synthesis of New Alkylaryl Sulfonic Acids as Potential Surfactant for
EOR Application
The most commonly used anionic surfactants in oil recovery are synthetic
and “natural” alkylbenzene sulfonates, alkyl toluene sulfonates, alkyl xylene
sulfonates, alkyl diphenylether sulfonates, alpha-olefin sulfonates, sulfonated or
sulfated alkoxylated alkylphenols or mixtures of two or more of these surfactants.
Many of the above surfactants can be easily synthesized by simultaneously
alkylating and sulfonating the aromatics as described in Berger et al. (2002).
Berger et al. (2000) developed a new process for producing novel sulfonated
alkylaromatic compounds in which the aromatic group is sulfonated and alkylated in
one step. The new process uses an alpha-olefin sulfonic acid to alkylate and
sulfonate an aromatic compound, such as benzene or naphthalene; or a substituted
aromatic compound, or any other polycyclic aromatic compounds, such as
alkylbenzene, alkylnaphthalene, phenol, alkoxylated phenol, or alkoxylated
alkylphenol.
42
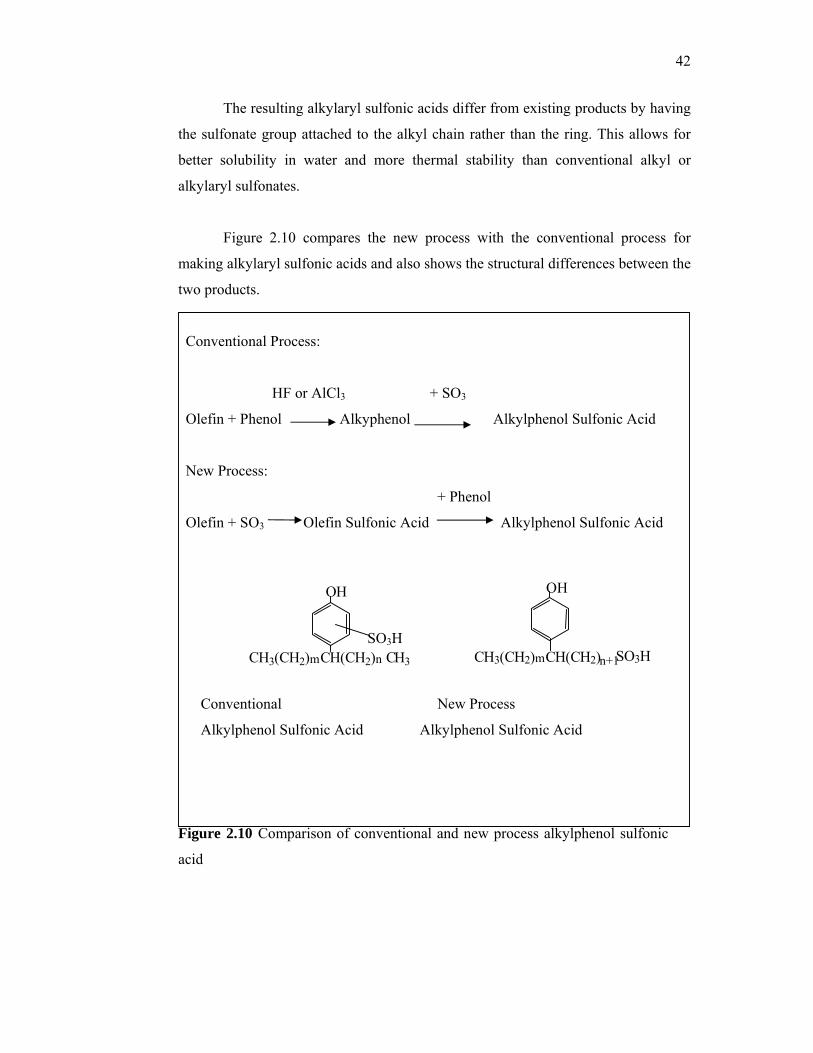
The resulting alkylaryl sulfonic acids differ from existing products by having
the sulfonate group attached to the alkyl chain rather than the ring. This allows for
better solubility in water and more thermal stability than conventional alkyl or
alkylaryl sulfonates.
Figure 2.10 compares the new process with the conventional process for
making alkylaryl sulfonic acids and also shows the structural differences between the
two products.
Conventional Process:
HF or AlCl3 + SO3
Olefin + Phenol Alkyphenol Alkylphenol Sulfonic Acid
New Process:
+ Phenol
Olefin + SO3 Olefin Sulfonic Acid Alkylphenol Sulfonic Acid
Conventional New Process
Alkylphenol Sulfonic Acid Alkylphenol Sulfonic Acid
Figure 2.10 Comparison of conventional and new process alkylphenol sulfonic
acid
OH
CH3(CH2)m CH( C H 2 ) n+1 S O 3 H
OH
C H 3 ( C H 2 ) m CH(CH2)n CH3
SO3H
43
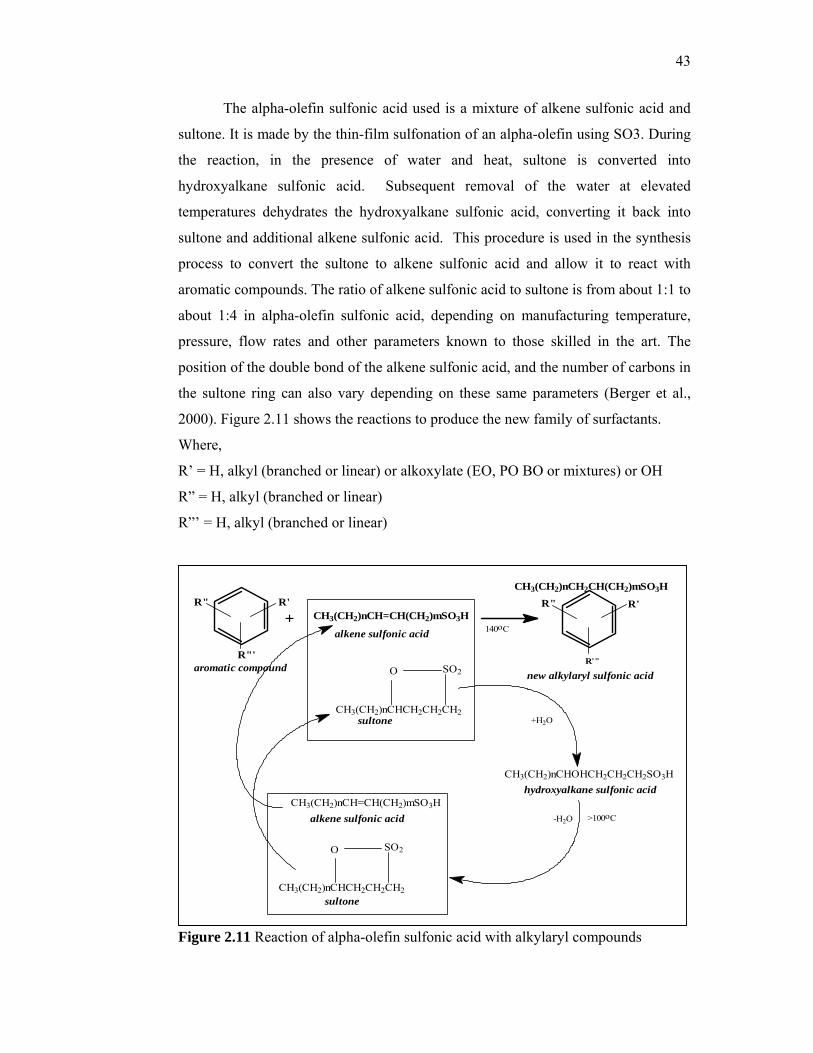
The alpha-olefin sulfonic acid used is a mixture of alkene sulfonic acid and
sultone. It is made by the thin-film sulfonation of an alpha-olefin using SO3. During
the reaction, in the presence of water and heat, sultone is converted into
hydroxyalkane sulfonic acid. Subsequent removal of the water at elevated
temperatures dehydrates the hydroxyalkane sulfonic acid, converting it back into
sultone and additional alkene sulfonic acid. This procedure is used in the synthesis
process to convert the sultone to alkene sulfonic acid and allow it to react with
aromatic compounds. The ratio of alkene sulfonic acid to sultone is from about 1:1 to
about 1:4 in alpha-olefin sulfonic acid, depending on manufacturing temperature,
pressure, flow rates and other parameters known to those skilled in the art. The
position of the double bond of the alkene sulfonic acid, and the number of carbons in
the sultone ring can also vary depending on these same parameters (Berger et al.,
2000). Figure 2.11 shows the reactions to produce the new family of surfactants.
Where,
R’ = H, alkyl (branched or linear) or alkoxylate (EO, PO BO or mixtures) or OH
R” = H, alkyl (branched or linear)
R”’ = H, alkyl (branched or linear)
Figure 2.11 Reaction of alpha-olefin sulfonic acid with alkylaryl compounds
CH3(CH2)nCH=CH(CH2)mSO3H
SO2
CH3(CH2)nCHCH2CH2CH2
alkene sulfonic acid
sultone
+H2O
-H2O
CH3(CH2)nCHCH2CH2CH2
O SO2
sultone
hydroxyalkane sulfonic acid
>100oC
CH3(CH2)nCH=CH(CH2)mSO3HR'R"
R"'
+R'R"
R'"
CH3(CH2)nCH2CH(CH2)mSO3H
new alkylaryl sulfonic acid
alkene sulfonic acid 140oC
aromatic compound O
CH3(CH2)nCHOHCH2CH2CH2SO3H
44
A catalyst may be useful to reduce the reaction temperature, the reaction time
and improve yields. Useful catalysts include sulfuric acid, methane sulfonic acid,
methane di-sulfonic acid, sulfosuccinic acid, sulfomalonic acid, and other strong acid
catalysts. Pressure may be necessary in order to reach the desired higher
temperatures when using low boiling starting materials such as benzene and to
prevent water from escaping during the early stages of the reaction. The free acid
may be further reacted with any of a number of cations such as Na, K, NH4, Ca, Mg,
Ba, Amines, etc. to form anionic surface active salts.
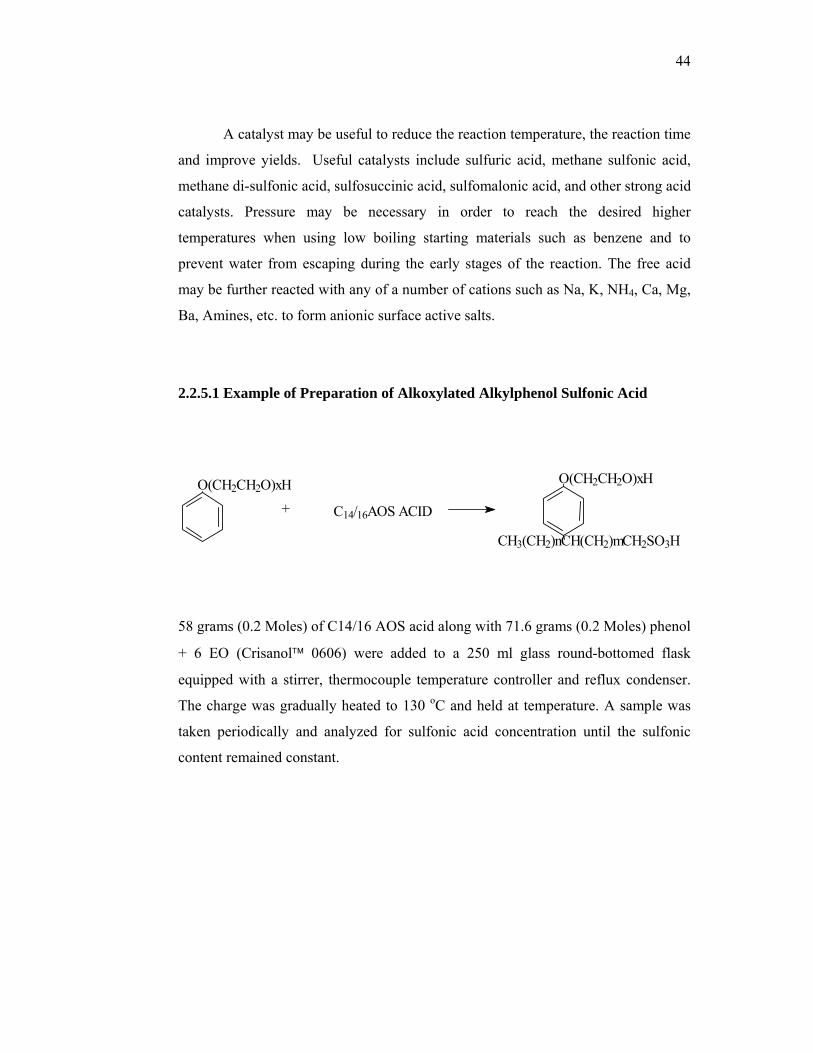
2.2.5.1 Example of Preparation of Alkoxylated Alkylphenol Sulfonic Acid
58 grams (0.2 Moles) of C14/16 AOS acid along with 71.6 grams (0.2 Moles) phenol
+ 6 EO (Crisanol™ 0606) were added to a 250 ml glass round-bottomed flask
equipped with a stirrer, thermocouple temperature controller and reflux condenser.
The charge was gradually heated to 130 oC and held at temperature. A sample was
taken periodically and analyzed for sulfonic acid concentration until the sulfonic
content remained constant.
+
O ( C H 2 C H 2 O ) x H
C H 3( C H 2) n C H ( C H 2 ) m C H 2 S O 3H
O ( C H 2 C H 2 O ) x H
C 14/ 16A O S A C I D
45
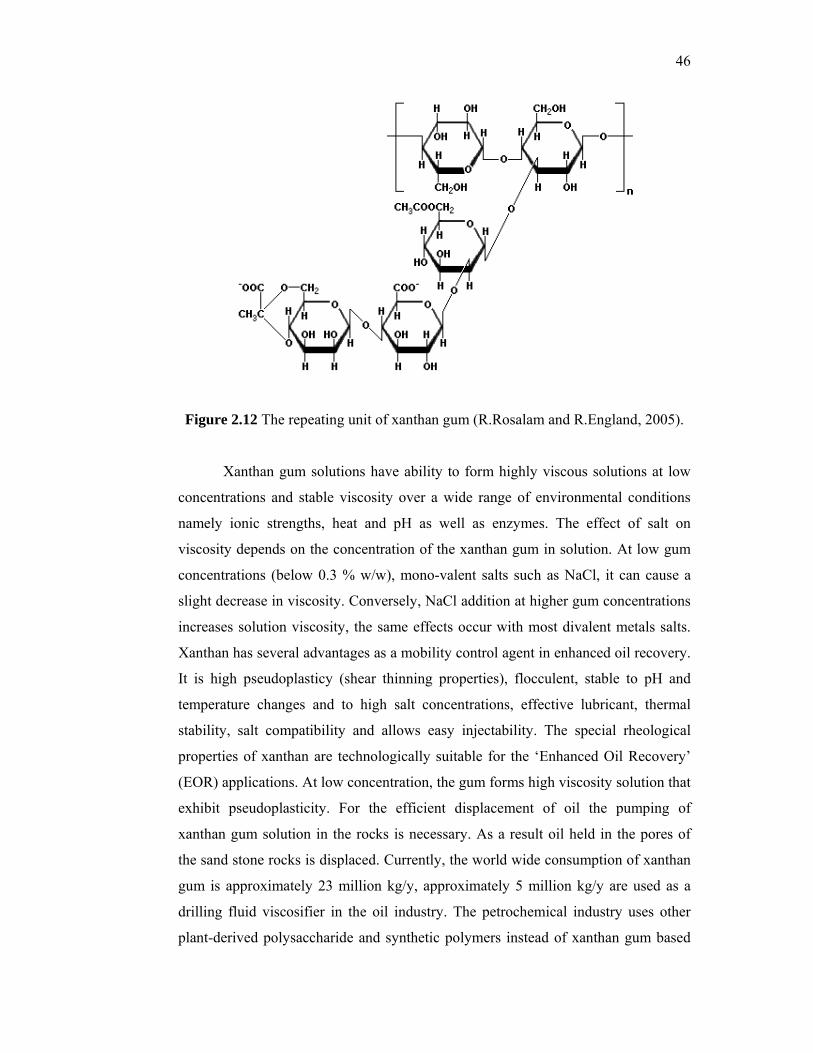
2.3 Xanthan gum
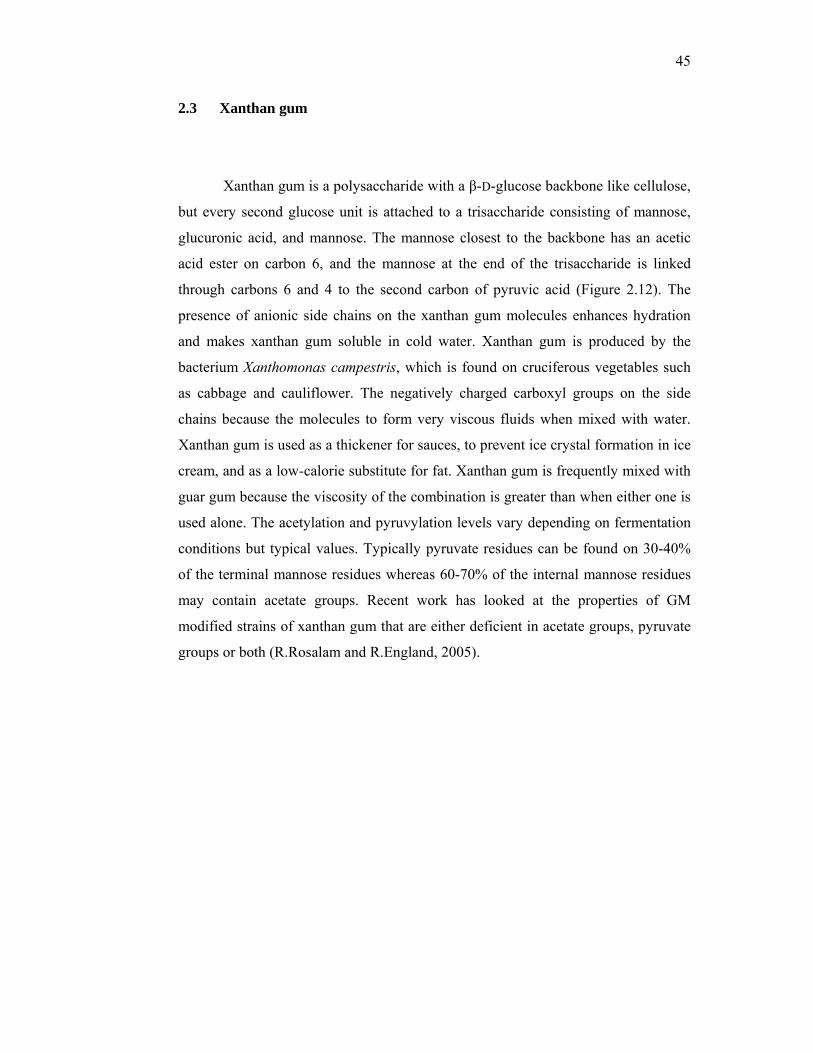
Xanthan gum is a polysaccharide with a β-D-glucose backbone like cellulose,
but every second glucose unit is attached to a trisaccharide consisting of mannose,
glucuronic acid, and mannose. The mannose closest to the backbone has an acetic
acid ester on carbon 6, and the mannose at the end of the trisaccharide is linked
through carbons 6 and 4 to the second carbon of pyruvic acid (Figure 2.12). The
presence of anionic side chains on the xanthan gum molecules enhances hydration
and makes xanthan gum soluble in cold water. Xanthan gum is produced by the
bacterium Xanthomonas campestris, which is found on cruciferous vegetables such
as cabbage and cauliflower. The negatively charged carboxyl groups on the side
chains because the molecules to form very viscous fluids when mixed with water.
Xanthan gum is used as a thickener for sauces, to prevent ice crystal formation in ice
cream, and as a low-calorie substitute for fat. Xanthan gum is frequently mixed with
guar gum because the viscosity of the combination is greater than when either one is
used alone. The acetylation and pyruvylation levels vary depending on fermentation
conditions but typical values. Typically pyruvate residues can be found on 30-40%
of the terminal mannose residues whereas 60-70% of the internal mannose residues
may contain acetate groups. Recent work has looked at the properties of GM
modified strains of xanthan gum that are either deficient in acetate groups, pyruvate
groups or both (R.Rosalam and R.England, 2005).
46
Figure 2.12 The repeating unit of xanthan gum (R.Rosalam and R.England, 2005).
Xanthan gum solutions have ability to form highly viscous solutions at low
concentrations and stable viscosity over a wide range of environmental conditions
namely ionic strengths, heat and pH as well as enzymes. The effect of salt on
viscosity depends on the concentration of the xanthan gum in solution. At low gum
concentrations (below 0.3 % w/w), mono-valent salts such as NaCl, it can cause a
slight decrease in viscosity. Conversely, NaCl addition at higher gum concentrations
increases solution viscosity, the same effects occur with most divalent metals salts.
Xanthan has several advantages as a mobility control agent in enhanced oil recovery.
It is high pseudoplasticy (shear thinning properties), flocculent, stable to pH and
temperature changes and to high salt concentrations, effective lubricant, thermal
stability, salt compatibility and allows easy injectability. The special rheological
properties of xanthan are technologically suitable for the ‘Enhanced Oil Recovery’
(EOR) applications. At low concentration, the gum forms high viscosity solution that
exhibit pseudoplasticity. For the efficient displacement of oil the pumping of
xanthan gum solution in the rocks is necessary. As a result oil held in the pores of
the sand stone rocks is displaced. Currently, the world wide consumption of xanthan
gum is approximately 23 million kg/y, approximately 5 million kg/y are used as a
drilling fluid viscosifier in the oil industry. The petrochemical industry uses other
plant-derived polysaccharide and synthetic polymers instead of xanthan gum based
47
on the relative costs of xanthan gum to the other polymers (F.kamal et. al. 2003 and
P.adhikary et.al. 2004).
Several researchers have investigated using less expensive carbon sources to
produce xanthan gum. S.D. Yoo, et. al. 1999 used waste sugar beet pulp to produce
xanthan gum. O.S.Azeez, 2005 demonstrated that cashew tree latex could be used to
produce xanthan gum. Lopez and Cormenzana, 1996 investigated the use of olive-
mill wastewaters as low cost substrate for xanthan gum production. Variation in the
amount of amylose and amylopectin in a starch changes the behaviour of the starch.
The amylose component of starch controls the gelling behaviour since gelling is the
result of re-association of the linear chain molecules. Amylopectin is usually larger
in size. The large size and the branched nature of amylopectin reduce the mobility of
the polymer and their orientation in an aqueous environment. Figure 2.13 (a) and (b)
shows the structures of the amylose and amylopectin components of a starch
molecule. The abundance in hydroxyl groups in the starch molecules impart
hydrophilic properties to the polymer and thus its potential to disperse in water.
Starch is the second most abundant biomass found in nature, next to cellulose.
Figure 2.13 Building Units of Starch (a) Amylose and (b) Amylopectin
(a)
(b)
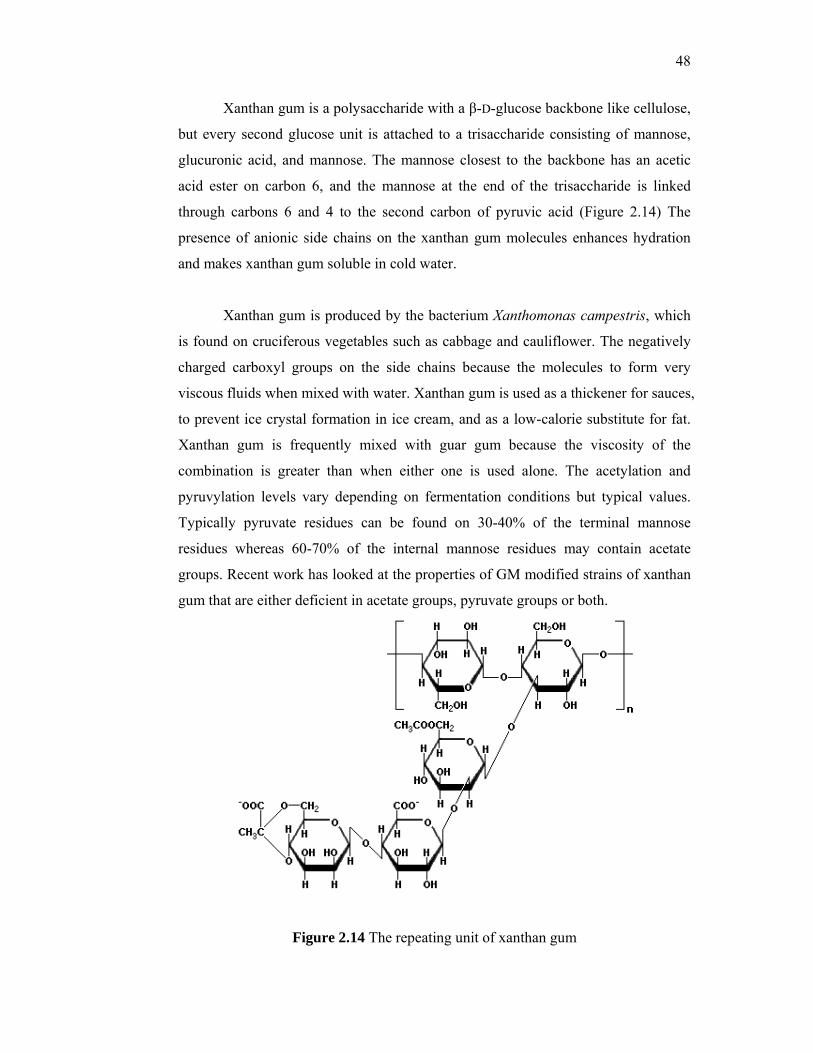
48
Xanthan gum is a polysaccharide with a β-D-glucose backbone like cellulose,
but every second glucose unit is attached to a trisaccharide consisting of mannose,
glucuronic acid, and mannose. The mannose closest to the backbone has an acetic
acid ester on carbon 6, and the mannose at the end of the trisaccharide is linked
through carbons 6 and 4 to the second carbon of pyruvic acid (Figure 2.14) The
presence of anionic side chains on the xanthan gum molecules enhances hydration
and makes xanthan gum soluble in cold water.
Xanthan gum is produced by the bacterium Xanthomonas campestris, which
is found on cruciferous vegetables such as cabbage and cauliflower. The negatively
charged carboxyl groups on the side chains because the molecules to form very
viscous fluids when mixed with water. Xanthan gum is used as a thickener for sauces,
to prevent ice crystal formation in ice cream, and as a low-calorie substitute for fat.
Xanthan gum is frequently mixed with guar gum because the viscosity of the
combination is greater than when either one is used alone. The acetylation and
pyruvylation levels vary depending on fermentation conditions but typical values.
Typically pyruvate residues can be found on 30-40% of the terminal mannose
residues whereas 60-70% of the internal mannose residues may contain acetate
groups. Recent work has looked at the properties of GM modified strains of xanthan
gum that are either deficient in acetate groups, pyruvate groups or both.
Figure 2.14 The repeating unit of xanthan gum
49
Xanthan is produced in its native state as a twin stranded, right handed five
fold helix. The stability of the helix is strongly affected by the ionic environment.
Upon heating the xanthan helix goes through a transition to a disordered state and
upon cooling it reverts to a helical structure. However it is believed that native
xanthan exists in a form where chains are paired and once that has been lost and the
xanthan molecules allowed to reorder the exact pairing cannot be retained and a
partially crosslinked structure is formed as helices twist around various neighbors.
Xanthan gum solutions have ability to form highly viscous solutions at low
concentrations and stable viscosity over a wide range of environmental conditions
namely ionic strengths, heat and pH as well as enzymes. The effect of salt on
viscosity depends on the concentration of the xanthan gum in solution. At low gum
concentrations (below 0.3 % w/w), mono-valent salts such as NaCl, it can cause a
slight decrease in viscosity. Conversely, NaCl addition at higher gum concentrations
increases solution viscosity, the same effects occur with most divalent metals salts.
Xanthan has several advantages as a mobility control agent in enhanced oil
recovery. It is high pseudoplasticy (shear thinning properties), flocculent, stable to
pH and temperature changes and to high salt concentrations, effective lubricant,
thermal stability, salt compatibility and allows easy injectability.
The special rheological properties of xanthan are technologically suitable for
the ‘Enhanced Oil Recovery’ (EOR) applications. At low concentration, the gum
forms high viscosity solution that exhibit pseudoplasticity. For the efficient
displacement of oil the pumping of xanthan gum solution in the rocks is necessary.
As a result oil held in the pores of the sand stone rocks is displaced.
The biosynthesis of microbial heteropolysaccharides such as xanthan is a
complicated process involving a multi enzyme system. The initial step in the
biosynthesis of xanthan is the uptake of carbohydrate, which may occur by active
transport or facilitated diffusion. This is followed by phosphorylation of the substrate
with a hexokinase enzyme that utilizes adenosine 5’-triphosphate. The biosynthesis

50
involves conversion of the phosphorylated substrate to the various sugar nucleotides
required for assembly of the polysaccharide-repeating unit via enzyme such as UDP-
Glc pyrophosphorylase. UDP-glucose, GDP-mannose and UDP-glucuronic acid are
necessary for the synthesis of xanthan with the appropriate repeating unit
(P.adhikary et.al 2004).
CHAPTER 3
MATERIALS AND METHODOLOGY
Production of chemicals from biomass always has been a goal of many
researchers. This chapter describes the research methodology and procedures on the
synthesis of surfactant and xanthan gum as additives from waste and local sources
that potentially used in EOR applications. The chemicals and apparatus used in the
experimental study are also presented in this chapter.
3.1 Preparation of surfactants
3.1.1 Procedures
The procedures started from the production of pyrolysis oil, physical
characterization of pyrolysis oil, extraction of phenol from pyrolysis oil, sulfonation
of the extracted phenol, and analysis of produced surfactant until surfactant polymer
flooding experiments are discussed in this chapter. Figure 3.2 shows the production
process of surfactant.
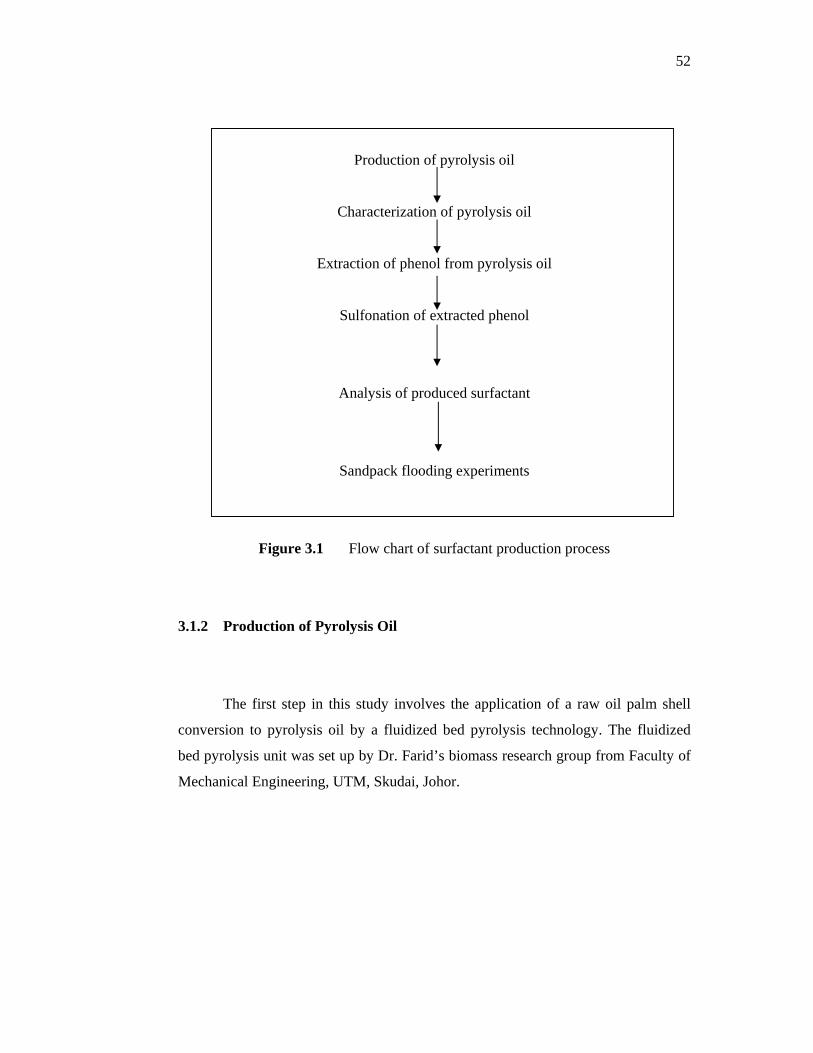
52
Production of pyrolysis oil
Characterization of pyrolysis oil
Extraction of phenol from pyrolysis oil
Sulfonation of extracted phenol
Analysis of produced surfactant
Sandpack flooding experiments
Figure 3.1 Flow chart of surfactant production process
3.1.2 Production of Pyrolysis Oil
The first step in this study involves the application of a raw oil palm shell
conversion to pyrolysis oil by a fluidized bed pyrolysis technology. The fluidized
bed pyrolysis unit was set up by Dr. Farid’s biomass research group from Faculty of
Mechanical Engineering, UTM, Skudai, Johor.
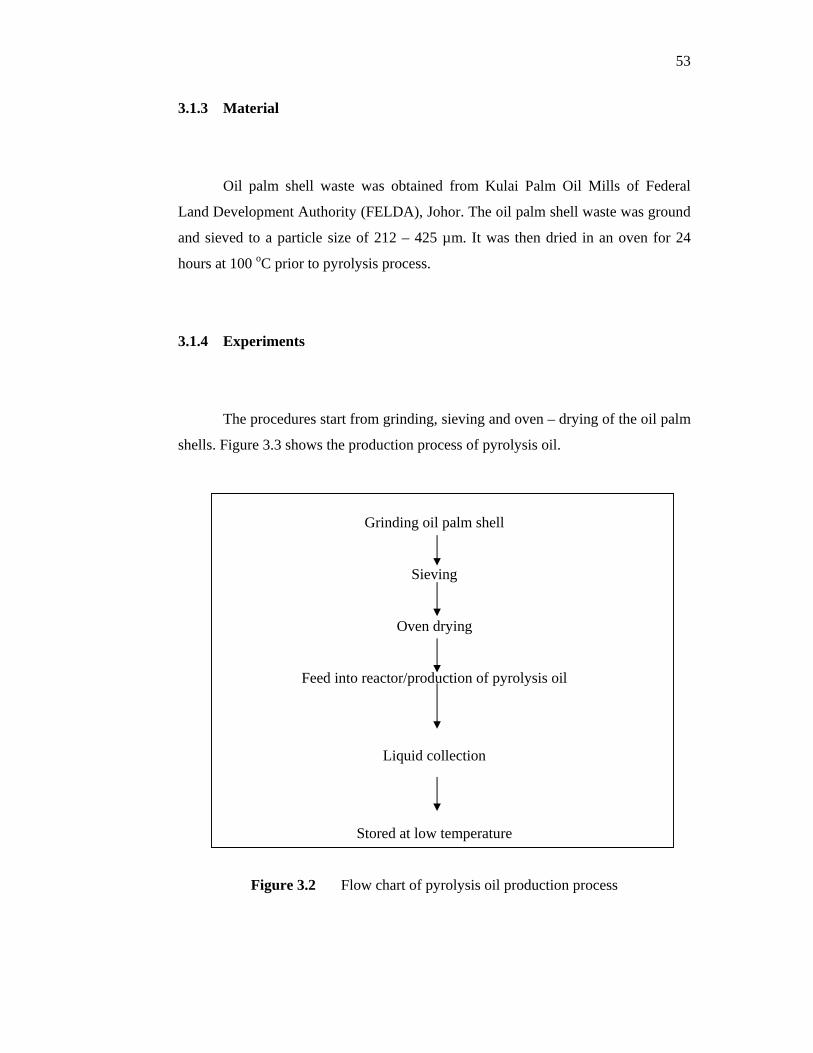
53
3.1.3 Material
Oil palm shell waste was obtained from Kulai Palm Oil Mills of Federal
Land Development Authority (FELDA), Johor. The oil palm shell waste was ground
and sieved to a particle size of 212 – 425 µm. It was then dried in an oven for 24
hours at 100 oC prior to pyrolysis process.
3.1.4 Experiments
The procedures start from grinding, sieving and oven – drying of the oil palm
shells. Figure 3.3 shows the production process of pyrolysis oil.
Grinding oil palm shell
Sieving
Oven drying
Feed into reactor/production of pyrolysis oil
Liquid collection
Stored at low temperature
Figure 3.2 Flow chart of pyrolysis oil production process
54
The equipment used to produce pyrolysis oil was a fluidized bed pyrolysis
unit with silica sand as the bed material (Figure 3.4). The reactor was 5 cm diameter
x 30 cm high, constructed of stainless still with full gas flow and temperature
control. The volume of the reactor was 520 cm3. The reactor was heated externally.
The incoming fluidizing gas was nitrogen and was preheated before entering the
reactor.
The silica sand in the fluidized bed was of mean size 256 µm diameter with a
static bed depth of 6 cm. The fluidizing velocity was 1.7-3 units of the minimum
fluidizing velocity. The biomass waster fed via a screw feeder and nitrogen gas
stream to the fluidized bed at a feed rate of 0.6 kg/hr. The motor driven screw feeder
was installed in order to feed the particles into the reactor. Two electric tubes heater,
each 1kW power, supplied the heat to the pyrolysis reactor and the gas preheat
chamber. The fluidization gas flow rate was measured and controlled by gas flow
meters.
The outlet from the fluidized bed was to a cyclone where the char was
separated by a method knows as “blown-through” mode. In this method, the char
was entrained and blown from the fluidized bed while retaining the sand in the bed.
The vapours and the gases were passed through a water-cooler condenser to ice-
cooled collectors to trap the derived liquid oil. The fluidized bed oil consisted of a
single liquid phrase.
The preparatory stages included grinding, sieving and oven drying of the oil
palm shells. It was employed the particle size of 212 – 425 µm. In this study, the
operating temperature was 450 oC. The running time of the pyrolysis process was set
to 30 min in each run at feed rate of 0.6 kg/hr. The nitrogen gas flow rate was
1.26 m3/hr. 6 kg of pyrolysis oil was prepared as a starting raw material. Each time
of the pyrolysis experiment produced around 250 g of pyrolysis oil. Total of 24 runs
were done to collect the needed oil.
The general layout of the pyrolysis process is shown in the Figure 3.3. The
real picture of fluidized bed pyrolysis unit is shown in the Figure 3.4.
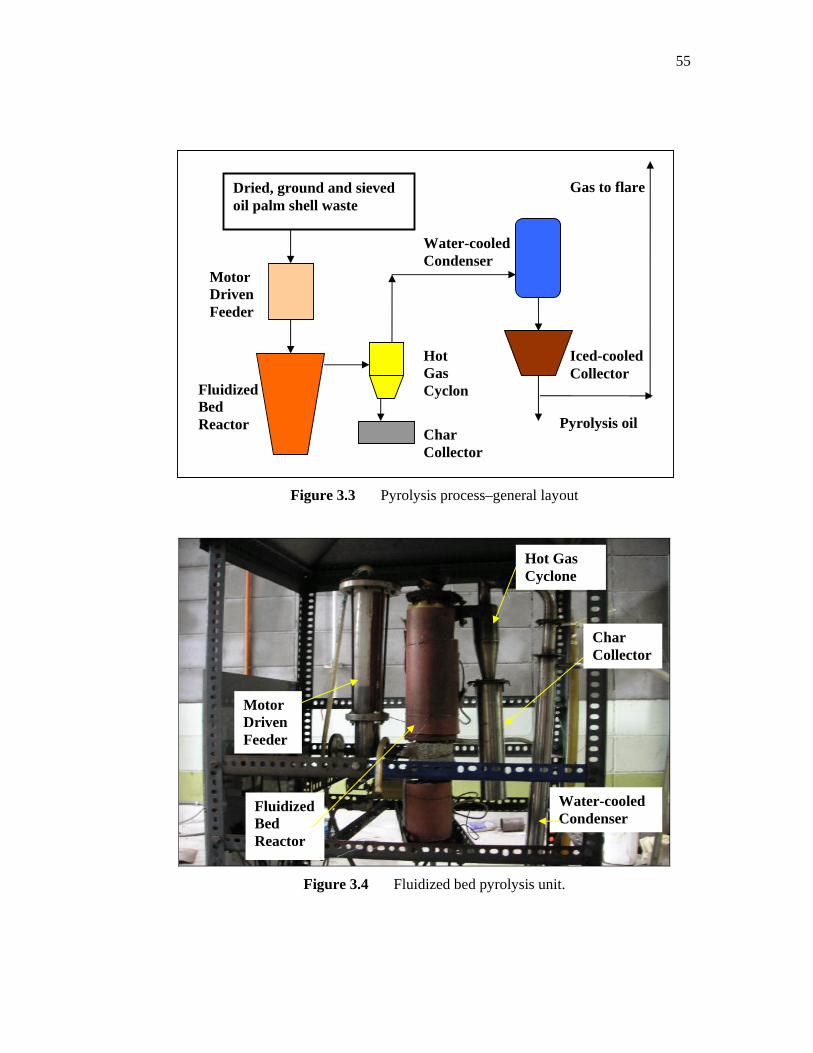
55
Figure 3.3 Pyrolysis process–general layout
Figure 3.4 Fluidized bed pyrolysis unit.
Iced-cooled Collector
Water-cooled Condenser
Char Collector
Fluidized Bed Reactor
Dried, ground and sieved oil palm shell waste
Motor Driven Feeder
Hot Gas Cyclon
Gas to flare
Pyrolysis oil
Motor Driven Feeder
Fluidized Bed Reactor
Hot Gas Cyclone
Char Collector
Water-cooled Condenser
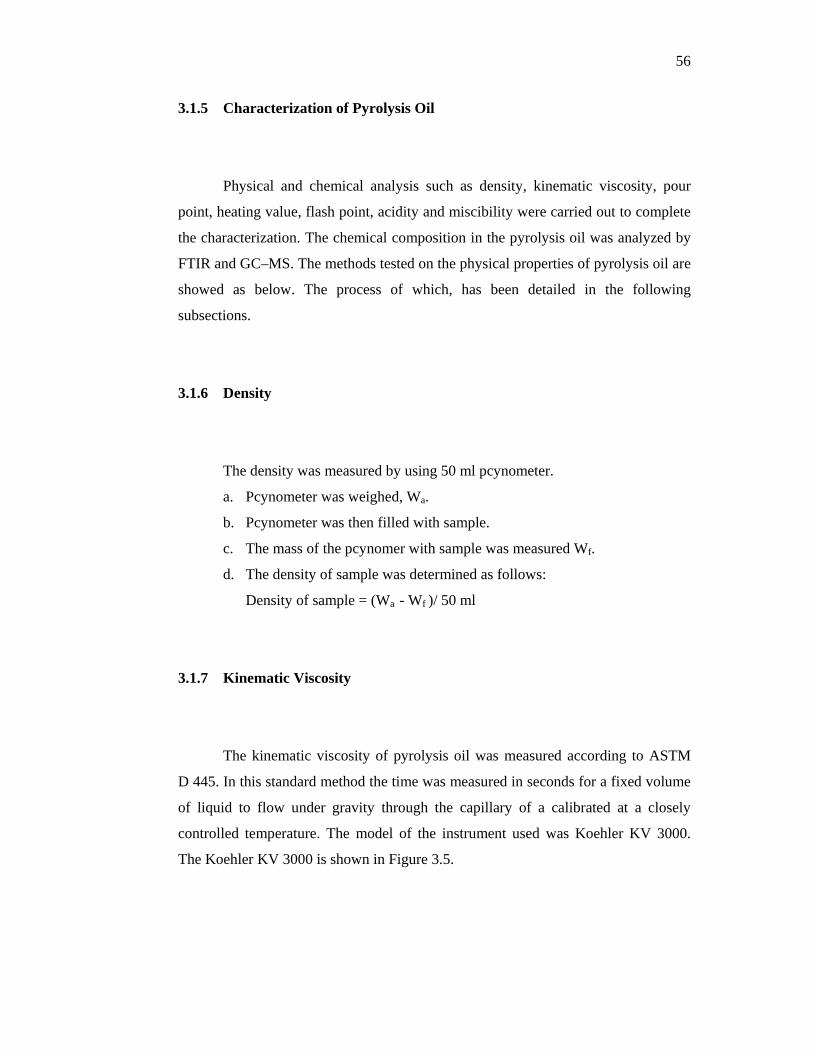
56
3.1.5 Characterization of Pyrolysis Oil
Physical and chemical analysis such as density, kinematic viscosity, pour
point, heating value, flash point, acidity and miscibility were carried out to complete
the characterization. The chemical composition in the pyrolysis oil was analyzed by
FTIR and GC–MS. The methods tested on the physical properties of pyrolysis oil are
showed as below. The process of which, has been detailed in the following
subsections.
3.1.6 Density
The density was measured by using 50 ml pcynometer.
a. Pcynometer was weighed, Wa.
b. Pcynometer was then filled with sample.
c. The mass of the pcynomer with sample was measured Wf.
d. The density of sample was determined as follows:
Density of sample = (Wa - Wf )/ 50 ml
3.1.7 Kinematic Viscosity
The kinematic viscosity of pyrolysis oil was measured according to ASTM
D 445. In this standard method the time was measured in seconds for a fixed volume
of liquid to flow under gravity through the capillary of a calibrated at a closely
controlled temperature. The model of the instrument used was Koehler KV 3000.
The Koehler KV 3000 is shown in Figure 3.5.

57
The procedure for the measurement of kinematic viscosity is shown as follows:
a. A calibrated viscometer was filled with sample.
b. The viscometer was allowed to remain in the kinematic viscosity bath long
enough to reach the test temperature, 40 oC. 30 minutes should be sufficient.
c. The head level of the test sample was adjusted by using suction to a position
in the capillary arm of the instrument about 7 mm above the first timing
mark.
d. The time required for the meniscus to pass from the first to second timing
mark was measured in seconds to within 0.1 s as the sample flowing freely. If
this flow time was less than 200 s, a viscometer with a capillary smaller
diameter would be selected and operation would be repeated.
e. The procedures from (a) – (d) were repeated to make a second measurement
of flow time. Both measurements were recorded.
f. If the two determined values of kinematic viscosity calculated from the flow
time measurements agree within determinability of ±0.20 %, the kinematic
viscosity that calculated from the average of these determined values was
reported. If not, the measurements of flow times were repeated after a
thorough cleaning and drying of the viscometers until the calculated
kinematic viscosity determinations agree with the stated determinability.
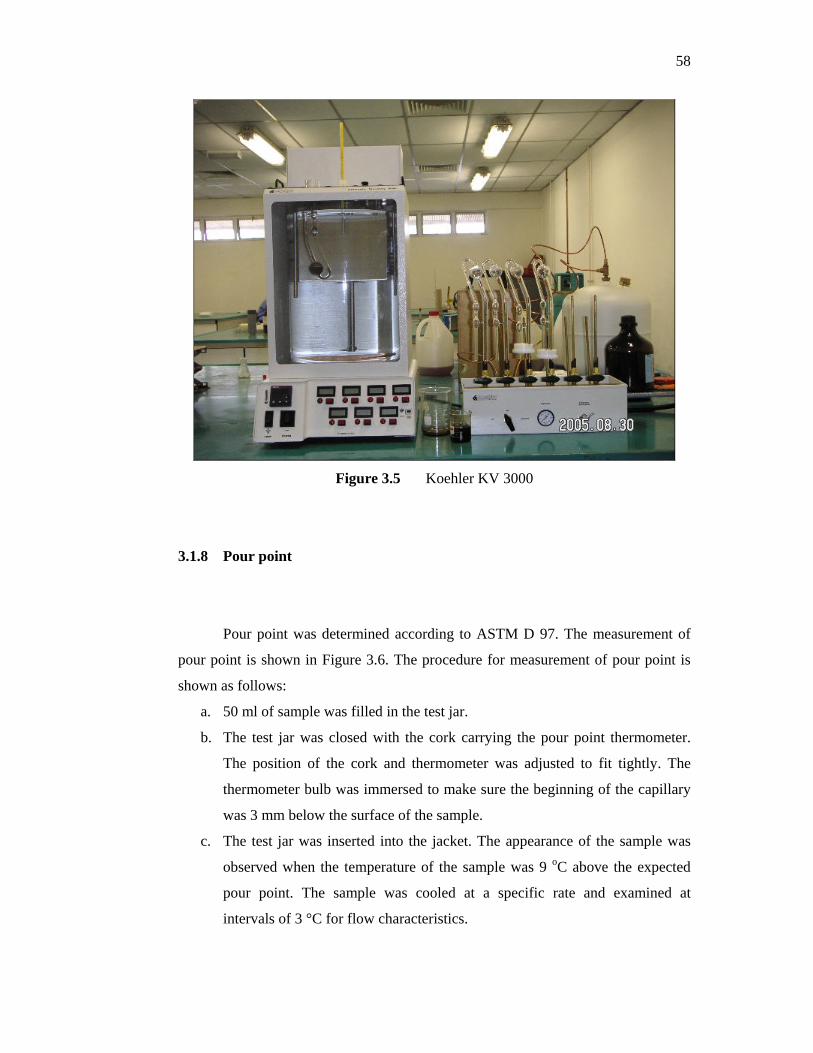
58
Figure 3.5 Koehler KV 3000
3.1.8 Pour point
Pour point was determined according to ASTM D 97. The measurement of
pour point is shown in Figure 3.6. The procedure for measurement of pour point is
shown as follows:
a. 50 ml of sample was filled in the test jar.
b. The test jar was closed with the cork carrying the pour point thermometer.
The position of the cork and thermometer was adjusted to fit tightly. The
thermometer bulb was immersed to make sure the beginning of the capillary
was 3 mm below the surface of the sample.
c. The test jar was inserted into the jacket. The appearance of the sample was
observed when the temperature of the sample was 9 oC above the expected
pour point. The sample was cooled at a specific rate and examined at
intervals of 3 °C for flow characteristics.
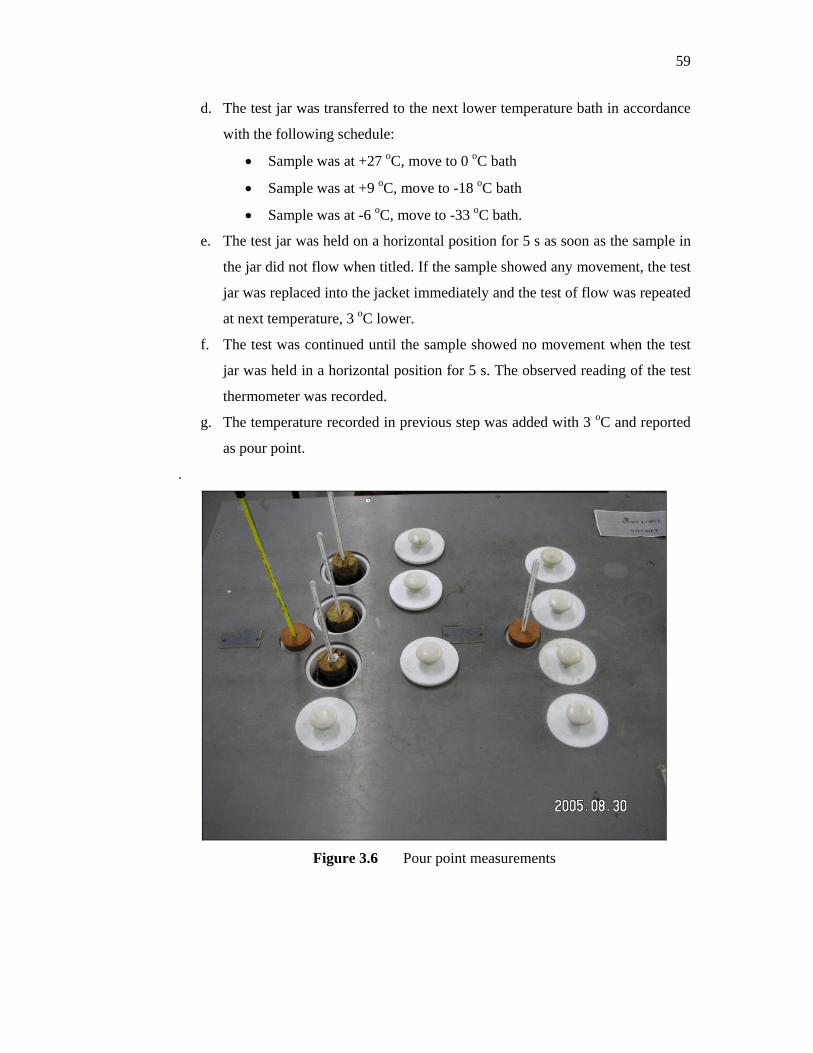
59
d. The test jar was transferred to the next lower temperature bath in accordance
with the following schedule:
• Sample was at +27 oC, move to 0 oC bath
• Sample was at +9 oC, move to -18 oC bath
• Sample was at -6 oC, move to -33 oC bath.
e. The test jar was held on a horizontal position for 5 s as soon as the sample in
the jar did not flow when titled. If the sample showed any movement, the test
jar was replaced into the jacket immediately and the test of flow was repeated
at next temperature, 3 oC lower.
f. The test was continued until the sample showed no movement when the test
jar was held in a horizontal position for 5 s. The observed reading of the test
thermometer was recorded.
g. The temperature recorded in previous step was added with 3 oC and reported
as pour point.
.
Figure 3.6 Pour point measurements
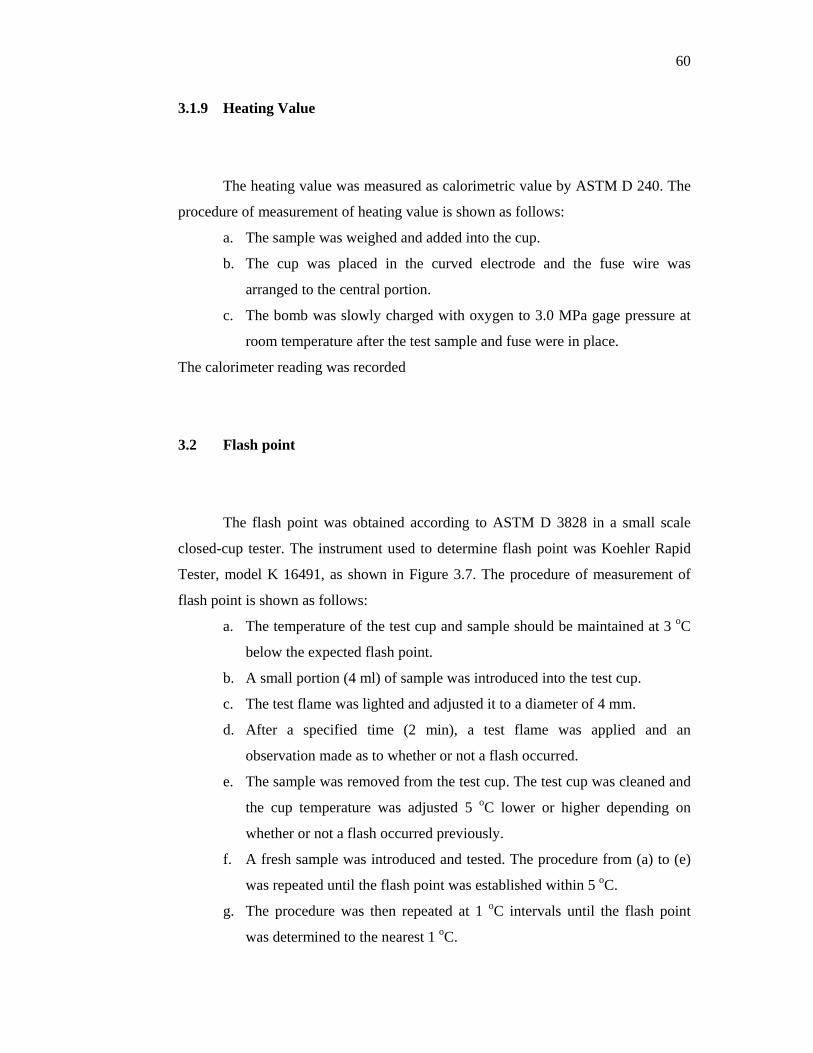
60
3.1.9 Heating Value
The heating value was measured as calorimetric value by ASTM D 240. The
procedure of measurement of heating value is shown as follows:
a. The sample was weighed and added into the cup.
b. The cup was placed in the curved electrode and the fuse wire was
arranged to the central portion.
c. The bomb was slowly charged with oxygen to 3.0 MPa gage pressure at
room temperature after the test sample and fuse were in place.
The calorimeter reading was recorded
3.2 Flash point
The flash point was obtained according to ASTM D 3828 in a small scale
closed-cup tester. The instrument used to determine flash point was Koehler Rapid
Tester, model K 16491, as shown in Figure 3.7. The procedure of measurement of
flash point is shown as follows:
a. The temperature of the test cup and sample should be maintained at 3 oC
below the expected flash point.
b. A small portion (4 ml) of sample was introduced into the test cup.
c. The test flame was lighted and adjusted it to a diameter of 4 mm.
d. After a specified time (2 min), a test flame was applied and an
observation made as to whether or not a flash occurred.
e. The sample was removed from the test cup. The test cup was cleaned and
the cup temperature was adjusted 5 oC lower or higher depending on
whether or not a flash occurred previously.
f. A fresh sample was introduced and tested. The procedure from (a) to (e)
was repeated until the flash point was established within 5 oC.
g. The procedure was then repeated at 1 oC intervals until the flash point
was determined to the nearest 1 oC.
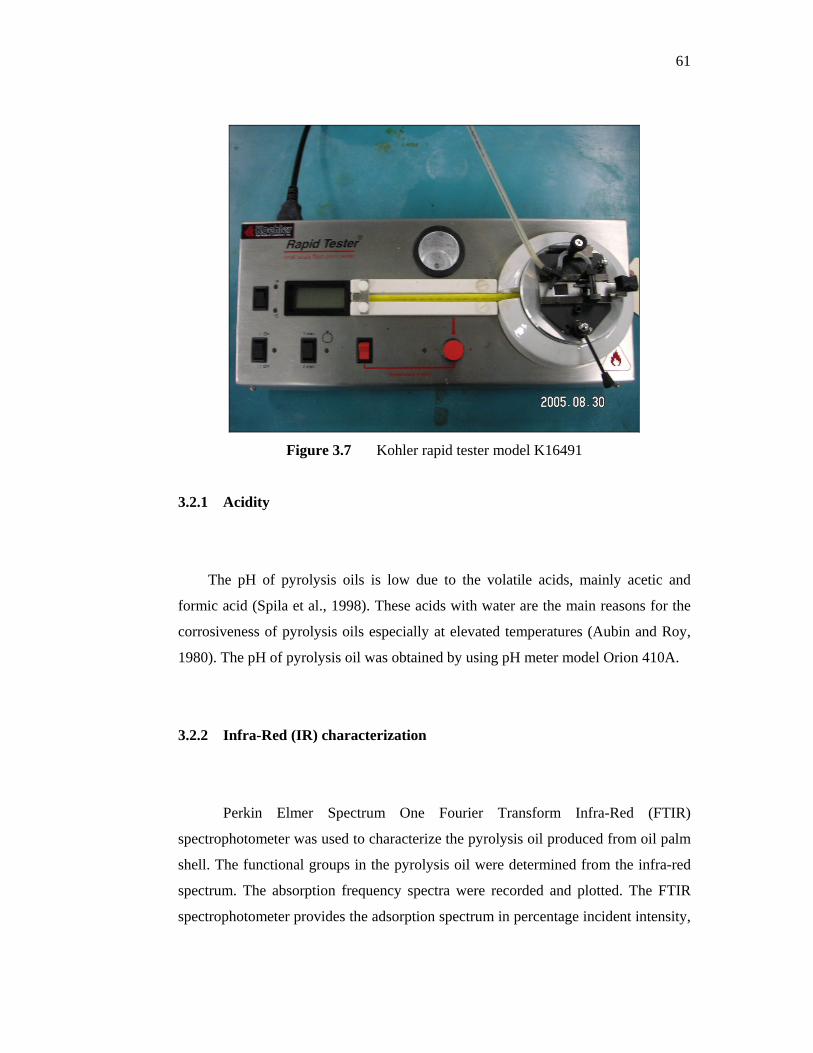
61
Figure 3.7 Kohler rapid tester model K16491
3.2.1 Acidity
The pH of pyrolysis oils is low due to the volatile acids, mainly acetic and
formic acid (Spila et al., 1998). These acids with water are the main reasons for the
corrosiveness of pyrolysis oils especially at elevated temperatures (Aubin and Roy,
1980). The pH of pyrolysis oil was obtained by using pH meter model Orion 410A.
3.2.2 Infra-Red (IR) characterization
Perkin Elmer Spectrum One Fourier Transform Infra-Red (FTIR)
spectrophotometer was used to characterize the pyrolysis oil produced from oil palm
shell. The functional groups in the pyrolysis oil were determined from the infra-red
spectrum. The absorption frequency spectra were recorded and plotted. The FTIR
spectrophotometer provides the adsorption spectrum in percentage incident intensity,
62
along the wave numbers 4400 to 370 cm-1. The standard IR spectra of hydrocarbons
were used to identify the functional group of the components of the derived liquids.
3.2.3 Miscibility
The miscibility of the pyrolysis oil with water and other solvents was tested.
a. The following solvents were used.
• Water
• Methanol
• Chloroform
• Paraffin, alpha olefin (1-hexadecene)
• NaOH (sodium hydroxide)
b. 1 ml of solvent was added into pyrolysis oil at volume ratio of 1:1, the
miscibility was observed.
3.2.4 GC–MS analysis
The GC–MS system used a J & W Scientific DB 1701 capillary column in a
HP 5989x Hewlett Packard unit. Methanol was used as the standard solvent. The
following conditions were used for the DB 1701 column. The library search was
Wiley Database.
Column dimensions : 60 m x 0.25 mm
Film thickness : 0.25 µm
GC condition : Inlet system: split injector, He, 250 oC.
Oven temperature: 40 oC isotherm for 4 min, 3 oC min-1 to
280 oC. Detection: FID/MS, 280 oC.
63
3.3 Extraction of Phenols from Pyrolysis Oil
In this study, liquid-liquid extraction (solvent extraction) was used to extract
the phenol and phenolic compounds from the pyroysis oil. Evaporation method was
used to remove the solvent being used. The procedure of extraction is outlined as
follows:
1. 250 g of pyrolysis oil derived from oil palm shell was dissolved in 250 g of
ethyl acetate with the oil to solvent in weight ratio of 1:1.
2. The mixture was filtered with Whatman filter paper of specification of 12.5
cm x 100 circles.
3. The filtered oil–ethyl acetate mixture was then collected in a separating
funnel as shown in Figure 3.8.
4. A 5 wt % of sodium bicarbonate solution was prepared and the pH of the
solution was maintained at approximately 8 – 9.5.
5. 500 g of 5 wt % sodium bicarbonate solution was mixed with the oil–ethyl
acetate mixture in the separating funnel with the oil-ethyl acetate mixture to
sodium bicarbonate solution in weight ratio of 1:1.
6. A resulting aqueous bicarbonate layer which contained strong organic acids
and highly polar compounds was discharged. The ethyl-acetate soluble
fraction contained phenol, phenolic compounds and neutral fractions.
7. The ethyl-acetate soluble fraction was then filtered.
8. The filtered ethyl-acetate soluble fraction was evaporated using E-01611-00
Economy Rotary Evaporator. The evaporation was carried out at 60 oC with
rotation speed of 90 rpm.
9. The phenol and neutral fractions could be further fractionated into isolated
phenolics and neutrals if desired. The ethyl-acetate soluble fraction from step
7 was added with 5 wt % sodium hydroxide solution in a 1:1 ratio by weight
in a separating funnel. The 5 wt % sodium hydroxide solution was
maintained at pH 12 – 13.
10. The funnel was shaken and phases were separated.
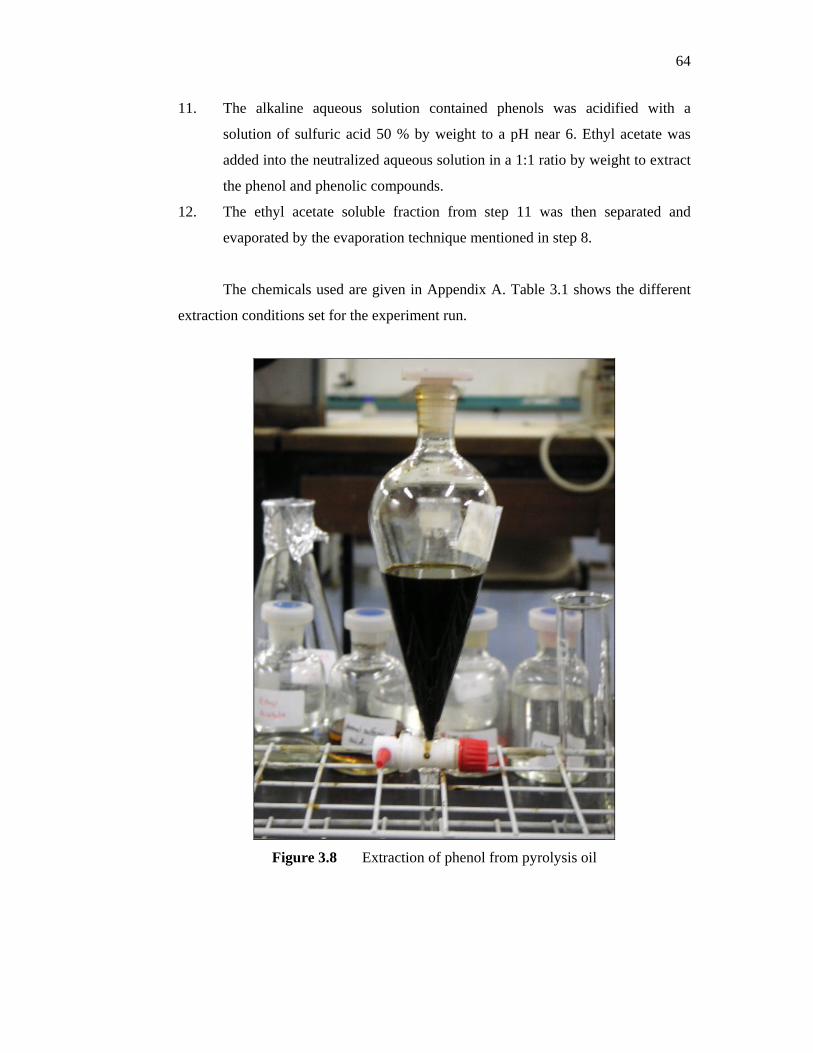
64
11. The alkaline aqueous solution contained phenols was acidified with a
solution of sulfuric acid 50 % by weight to a pH near 6. Ethyl acetate was
added into the neutralized aqueous solution in a 1:1 ratio by weight to extract
the phenol and phenolic compounds.
12. The ethyl acetate soluble fraction from step 11 was then separated and
evaporated by the evaporation technique mentioned in step 8.
The chemicals used are given in Appendix A. Table 3.1 shows the different
extraction conditions set for the experiment run.
Figure 3.8 Extraction of phenol from pyrolysis oil
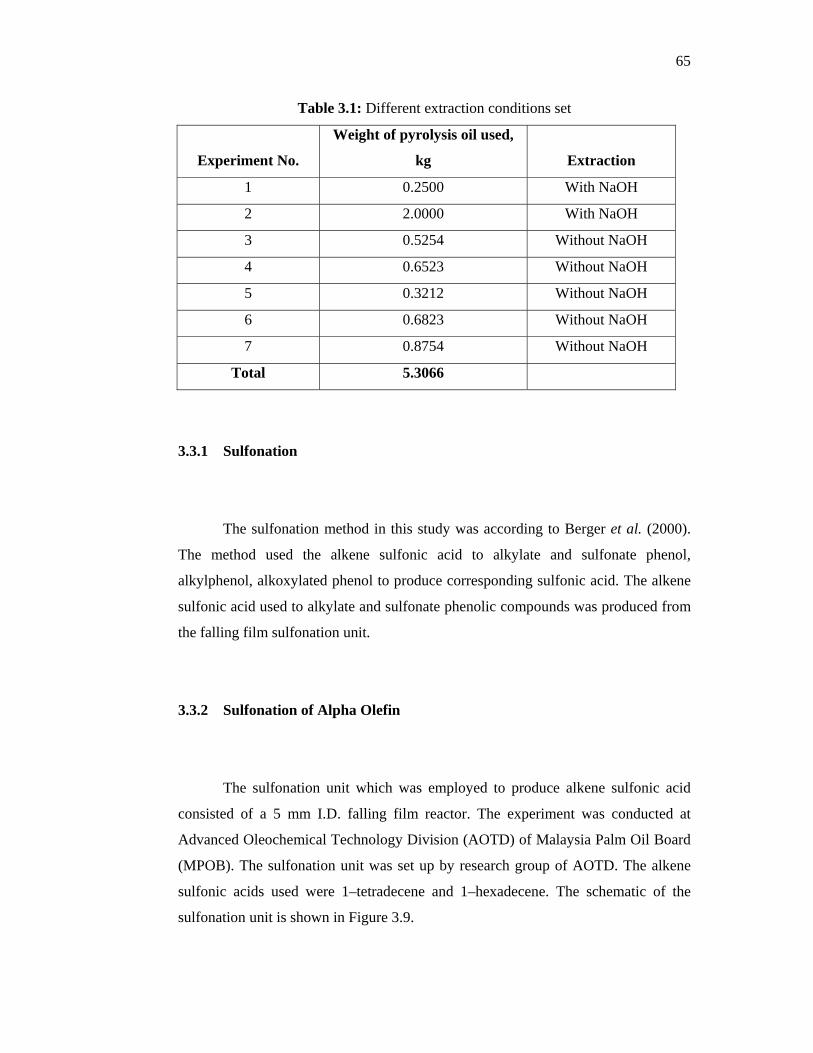
65
Table 3.1: Different extraction conditions set
Experiment No.
Weight of pyrolysis oil used,
kg Extraction
1 0.2500 With NaOH
2 2.0000 With NaOH
3 0.5254 Without NaOH
4 0.6523 Without NaOH
5 0.3212 Without NaOH
6 0.6823 Without NaOH
7 0.8754 Without NaOH
Total 5.3066
3.3.1 Sulfonation
The sulfonation method in this study was according to Berger et al. (2000).
The method used the alkene sulfonic acid to alkylate and sulfonate phenol,
alkylphenol, alkoxylated phenol to produce corresponding sulfonic acid. The alkene
sulfonic acid used to alkylate and sulfonate phenolic compounds was produced from
the falling film sulfonation unit.
3.3.2 Sulfonation of Alpha Olefin
The sulfonation unit which was employed to produce alkene sulfonic acid
consisted of a 5 mm I.D. falling film reactor. The experiment was conducted at
Advanced Oleochemical Technology Division (AOTD) of Malaysia Palm Oil Board
(MPOB). The sulfonation unit was set up by research group of AOTD. The alkene
sulfonic acids used were 1–tetradecene and 1–hexadecene. The schematic of the
sulfonation unit is shown in Figure 3.9.
66
Operation procedure:
1. The heaters and circulators were switched on.
2. The bottle was filled up with oleum.
3. The pumping rate for oleum was set to be 0 g/min.
4. The peristaltic pump was switched on and the pumping rate of sample was
adjusted to 600 g/hr.
5. Sample was allowed to flow through the thin film reactor for three minutes.
6. The nitrogen was flowed into the system. The amount of total of nitrogen
pushed in was measured and adjusted to give the SO3 diluted to 5 % weight
in nitrogen by using manometer.
7. The weight balance of sample injected into the thin film reactor was
measured in every minute and adjusted to the desired feed rate.
8. The oleum was injected and the peristaltic pump rate was adjusted to the
desired feed rate.
9. The reaction could be observed by the change in the colour of sample. The
sample was in dark colour after reaction had been taken place. The
temperature was also increased during the reaction.
10. The weight of the sample and oleum was recorded in every minute.
11. The alpha olefin sulfonic acid was collected directly from the falling film
sulfonation unit and chilled to 0 oC. It was then immediately transferred to a
freezer for storage until used.
The calculations of the feed rate of sample, oleum and nitrogen are given in
Appendix B and Appendix C.
3.3.3 Sulfonation and Alkylation of Extracted Pyrolysis Oil
Procedure:
1. 100 g of extracted pyrolysis oil was added to a 500 ml round-bottom flask
equipped with magnetic stirrer, thermometer, and water condenser.
2. 30 g of C14 alpha olefin sulfonic acid was then added while the extracted
pyrolysis oil was heated to 90 oC.
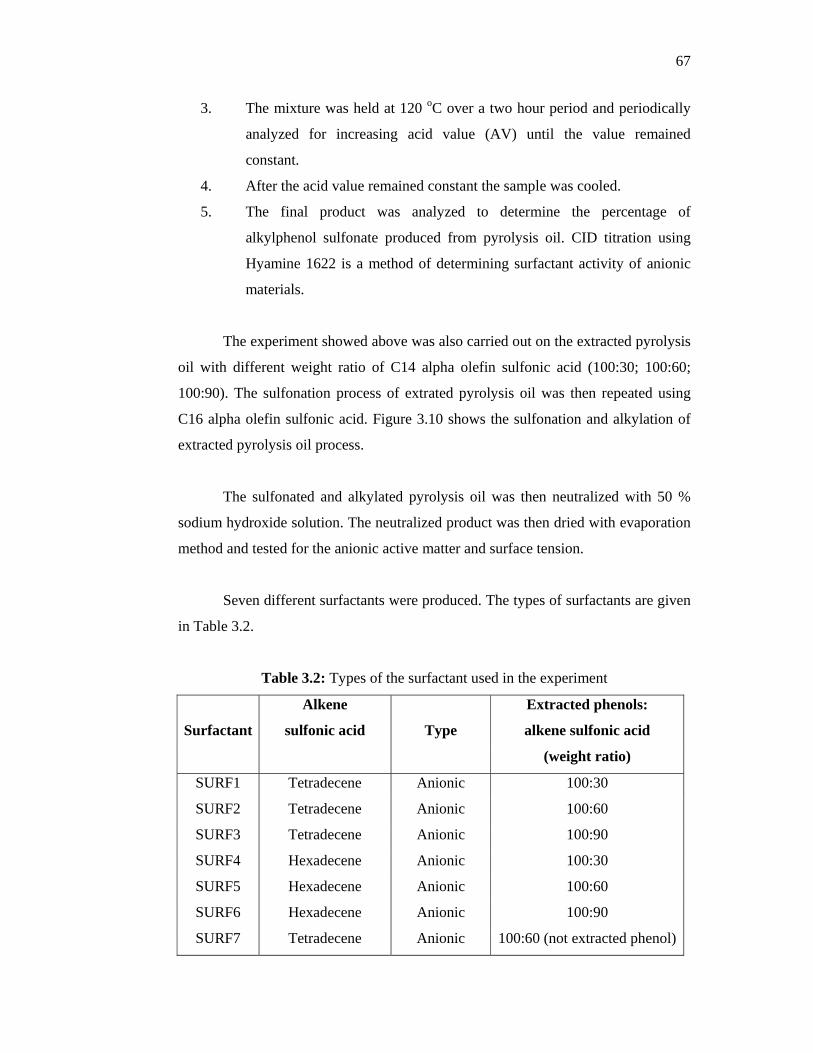
67
3. The mixture was held at 120 oC over a two hour period and periodically
analyzed for increasing acid value (AV) until the value remained
constant.
4. After the acid value remained constant the sample was cooled.
5. The final product was analyzed to determine the percentage of
alkylphenol sulfonate produced from pyrolysis oil. CID titration using
Hyamine 1622 is a method of determining surfactant activity of anionic
materials.
The experiment showed above was also carried out on the extracted pyrolysis
oil with different weight ratio of C14 alpha olefin sulfonic acid (100:30; 100:60;
100:90). The sulfonation process of extrated pyrolysis oil was then repeated using
C16 alpha olefin sulfonic acid. Figure 3.10 shows the sulfonation and alkylation of
extracted pyrolysis oil process.
The sulfonated and alkylated pyrolysis oil was then neutralized with 50 %
sodium hydroxide solution. The neutralized product was then dried with evaporation
method and tested for the anionic active matter and surface tension.
Seven different surfactants were produced. The types of surfactants are given
in Table 3.2.
Table 3.2: Types of the surfactant used in the experiment
Surfactant
Alkene
sulfonic acid Type
Extracted phenols:
alkene sulfonic acid
(weight ratio)
SURF1 Tetradecene Anionic 100:30
SURF2 Tetradecene Anionic 100:60
SURF3 Tetradecene Anionic 100:90
SURF4 Hexadecene Anionic 100:30
SURF5 Hexadecene Anionic 100:60
SURF6 Hexadecene Anionic 100:90
SURF7 Tetradecene Anionic 100:60 (not extracted phenol)
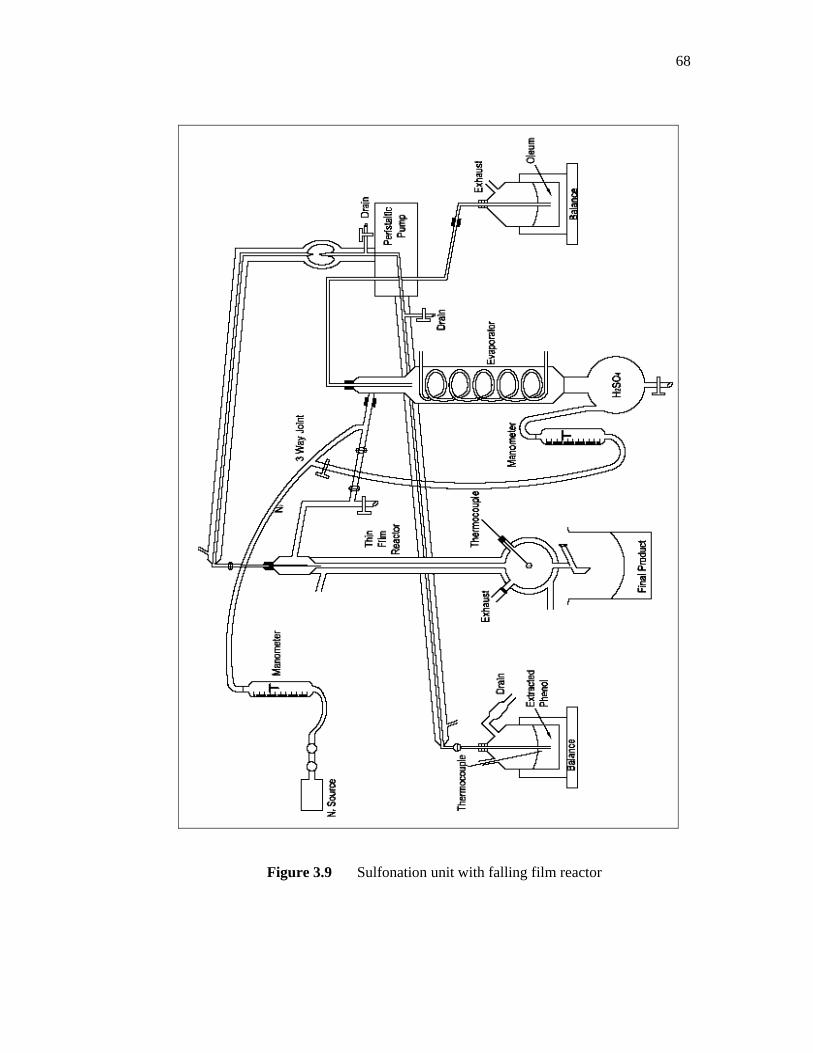
68
Figure 3.9 Sulfonation unit with falling film reactor
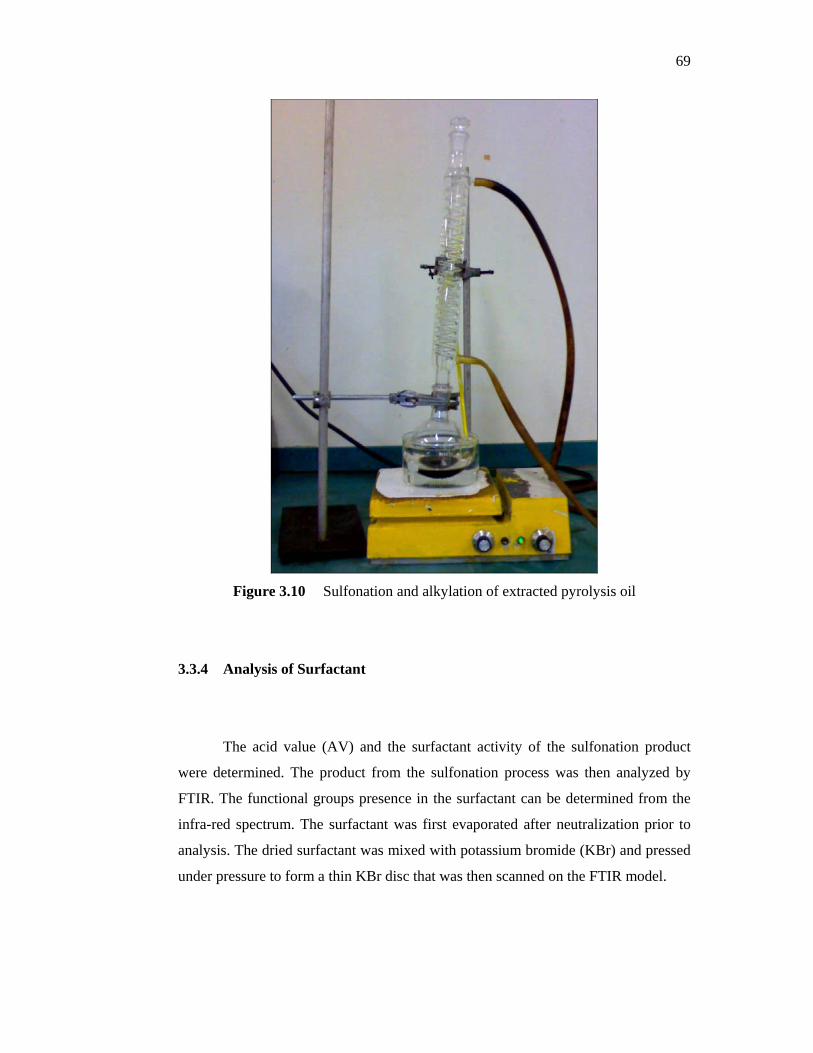
69
Figure 3.10 Sulfonation and alkylation of extracted pyrolysis oil
3.3.4 Analysis of Surfactant
The acid value (AV) and the surfactant activity of the sulfonation product
were determined. The product from the sulfonation process was then analyzed by
FTIR. The functional groups presence in the surfactant can be determined from the
infra-red spectrum. The surfactant was first evaporated after neutralization prior to
analysis. The dried surfactant was mixed with potassium bromide (KBr) and pressed
under pressure to form a thin KBr disc that was then scanned on the FTIR model.

70
3.3.5 Acid Value
The following reagents were prepared:
Reagent A: 2 g of sodium hydroxide was dissolved in 500 ml methyl alcohol.
The actual normality was determined by neutralization with potassium
hydrogen phthalate by using 1 % of phenolphthalein as the indicator
accurately.
Reagent B: 250 ml of isopropyl alcohol was added in the equal volumes of
toluene. The mixture was then neutralized with reagent A by using 1 % of
phenolphthalein as the indicator.
Procedure:
1. The size of sample was determined from the Table 3.3.
Table 3.3: Estimation of sample size for acid value determination
Acid value Approx. wt of sample, g Accuracy of weighing
0 – 5 20 ± 0.05 g
5 – 15 10 ± 0.05 g
15 – 30 5 ± 0.05 g
30 – 100 2.5 ± 0.001 g
100 and over 1.0 ± 0.001 g
2. 1 g of sulfonated pyrolysis oil was weighed into Erlenmeyer flask.
Approximately 100 ml of reagent B and 1 ml of indicator were added and
mixed until the sample was completely dissolved.
3. The mixture from step 2 was titrated with the standard alkali solution
which was reagent A mentioned above. It was shaken vigorously to the
appearance of the first permanent pink colour of the same intensity as that
of the neutralized solvent before addition. The colour must persist for 1
min.The formula for calculation of acid value is shown in Appendix D.
71
3.3.6 Hyamine Titration for Anionic Active Matter using Methylene Blue
Indicator
The following reagents were used:
Reagent A: Chloroform, reagent grade
Reagent B: Ethanol, reagent grade, denatured was diluted to 50 % with
deionised or distilled water
Reagent C: Indicator solution was prepared by adding 0.03 g methylene blue
HCl, 12 g of 96 wt% of sulfuric acid (reagent grade), 50 g of sodium sulfate
(reagent grade) into 100 ml distilled water. The solution was then diluted to 1
liter with distilled water.
Reagent D: 2.1g Hyamine 1622 was added into 1 litre distilled water for
preparation of 0.0045 Molar Hyamine solution. The solution was then titrated
with 99 wt % of sodium dodecylsulfate to determine the actual molarity.
Procedure:
1. The neutralized sulfonated pyrolysis oil was weighed into a 250 ml
volumetric flask.
2. A little reagent B (2 to 5 ml) was dispersed into the sample and diluted to
250 ml with distilled water. 50 % ethanol was used to break foam as
necessary. The aliquot was mixed well.
3. 10 ml of aliquot from step 2 was pipette into a 100 ml glass stopper cylinder.
4. 15 ml of reagent A and 25 ml of reagent C were added into the 100 ml glass
stopper cylinder.
5. The sample was titrated with reagent D. It was shaking well between each
addition.
6. The endpoint was reached when the intensity of the blue indicator was equal
in the water and chloroform layers.
7. The methylene blue indicator would dissolved in the chloroform (bottom)
layer until the endpoint was near and it would went completely into water

72
(upper) layer if the endpoint was passed. The formula for calculation of
anionic active matter is shown in Appendix D.
3.3.7 Surface Tension Measurements
Surface tensions of different surfactant concentrations’ solutions were measured
by using a KRÜSS tensiometer at room temperature, 26 oC. The KRÜSS tensiometer
K6 is shown in Figure 3.11.
Figure 3.11 Tensiometer K6
73
3.4 Preparation of xanthan gum
3.4.1 Microorganism
Xanthomonas campestris (NRRL B-1459) is the bacteria employed for
xanthan production. Xanthomonas campestris was obtained from Northern Regional
Research Laboratory, US Department of Agriculture. The bacteria were maintained
on YM agar plates (3 g/L yeast extract, 3 g/L malt extract, 5 g/L peptone, 10 g/L
glucose (dextrose), 20 g/L agar). Commercial xanthan gum was purchased from
Fluka.
3.4.2 Slant Culture Inoculum
A lyophil preparation of Xanthomonas campestris was opened aseptically
and suspended in 7 mL sterile YM (Figure 3.12).This suspension was incubated at
28° C for 24 hours and streaked on agar plates to check culture viability and purity
(Figure 3.13) . Culture was grown on an agar slant and maintained at 4° C for future
use. At two to three weeks intervals, the culture was transferred to a fresh YM agar
slant, incubated for 20 to 24 hours and stored at 4° C.
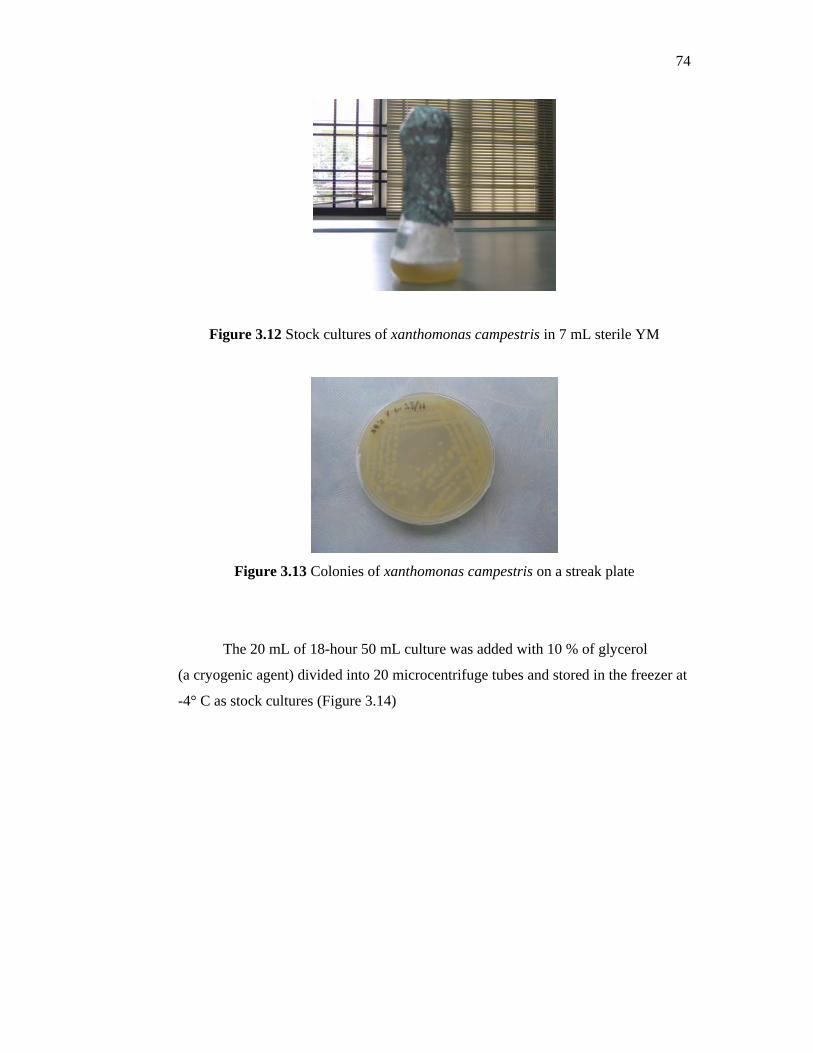
74
Figure 3.12 Stock cultures of xanthomonas campestris in 7 mL sterile YM
Figure 3.13 Colonies of xanthomonas campestris on a streak plate
The 20 mL of 18-hour 50 mL culture was added with 10 % of glycerol
(a cryogenic agent) divided into 20 microcentrifuge tubes and stored in the freezer at
-4° C as stock cultures (Figure 3.14)
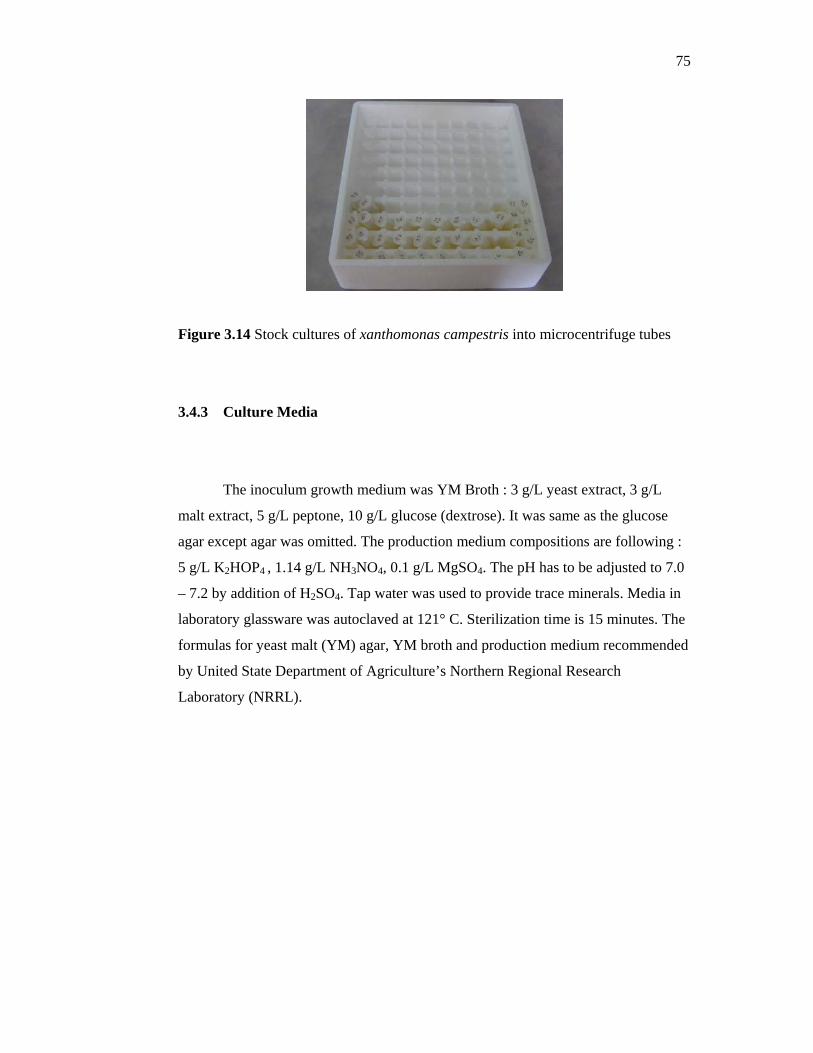
75
Figure 3.14 Stock cultures of xanthomonas campestris into microcentrifuge tubes
3.4.3 Culture Media
The inoculum growth medium was YM Broth : 3 g/L yeast extract, 3 g/L
malt extract, 5 g/L peptone, 10 g/L glucose (dextrose). It was same as the glucose
agar except agar was omitted. The production medium compositions are following :
5 g/L K2HOP4 , 1.14 g/L NH3NO4, 0.1 g/L MgSO4. The pH has to be adjusted to 7.0
– 7.2 by addition of H2SO4. Tap water was used to provide trace minerals. Media in
laboratory glassware was autoclaved at 121° C. Sterilization time is 15 minutes. The
formulas for yeast malt (YM) agar, YM broth and production medium recommended
by United State Department of Agriculture’s Northern Regional Research
Laboratory (NRRL).
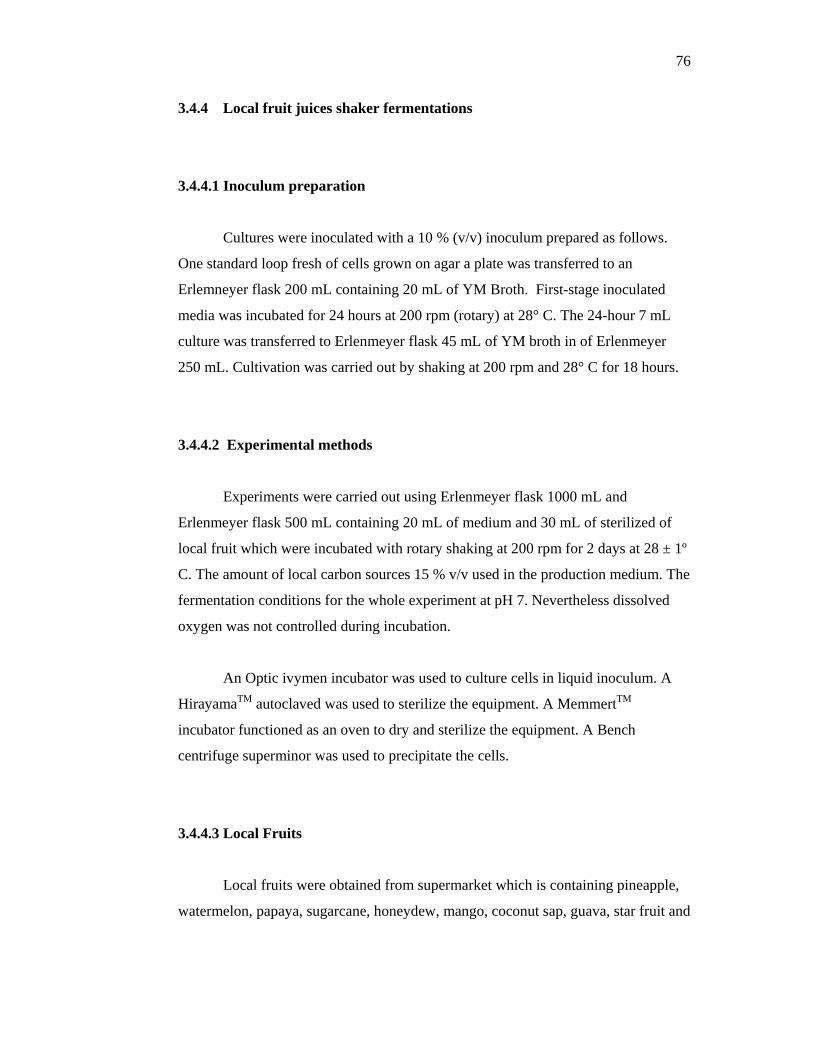
76
3.4.4 Local fruit juices shaker fermentations
3.4.4.1 Inoculum preparation
Cultures were inoculated with a 10 % (v/v) inoculum prepared as follows.
One standard loop fresh of cells grown on agar a plate was transferred to an
Erlemneyer flask 200 mL containing 20 mL of YM Broth. First-stage inoculated
media was incubated for 24 hours at 200 rpm (rotary) at 28° C. The 24-hour 7 mL
culture was transferred to Erlenmeyer flask 45 mL of YM broth in of Erlenmeyer
250 mL. Cultivation was carried out by shaking at 200 rpm and 28° C for 18 hours.
3.4.4.2 Experimental methods
Experiments were carried out using Erlenmeyer flask 1000 mL and
Erlenmeyer flask 500 mL containing 20 mL of medium and 30 mL of sterilized of
local fruit which were incubated with rotary shaking at 200 rpm for 2 days at 28 ± 1º
C. The amount of local carbon sources 15 % v/v used in the production medium. The
fermentation conditions for the whole experiment at pH 7. Nevertheless dissolved
oxygen was not controlled during incubation.
An Optic ivymen incubator was used to culture cells in liquid inoculum. A
HirayamaTM autoclaved was used to sterilize the equipment. A MemmertTM
incubator functioned as an oven to dry and sterilize the equipment. A Bench
centrifuge superminor was used to precipitate the cells.
3.4.4.3 Local Fruits
Local fruits were obtained from supermarket which is containing pineapple,
watermelon, papaya, sugarcane, honeydew, mango, coconut sap, guava, star fruit and
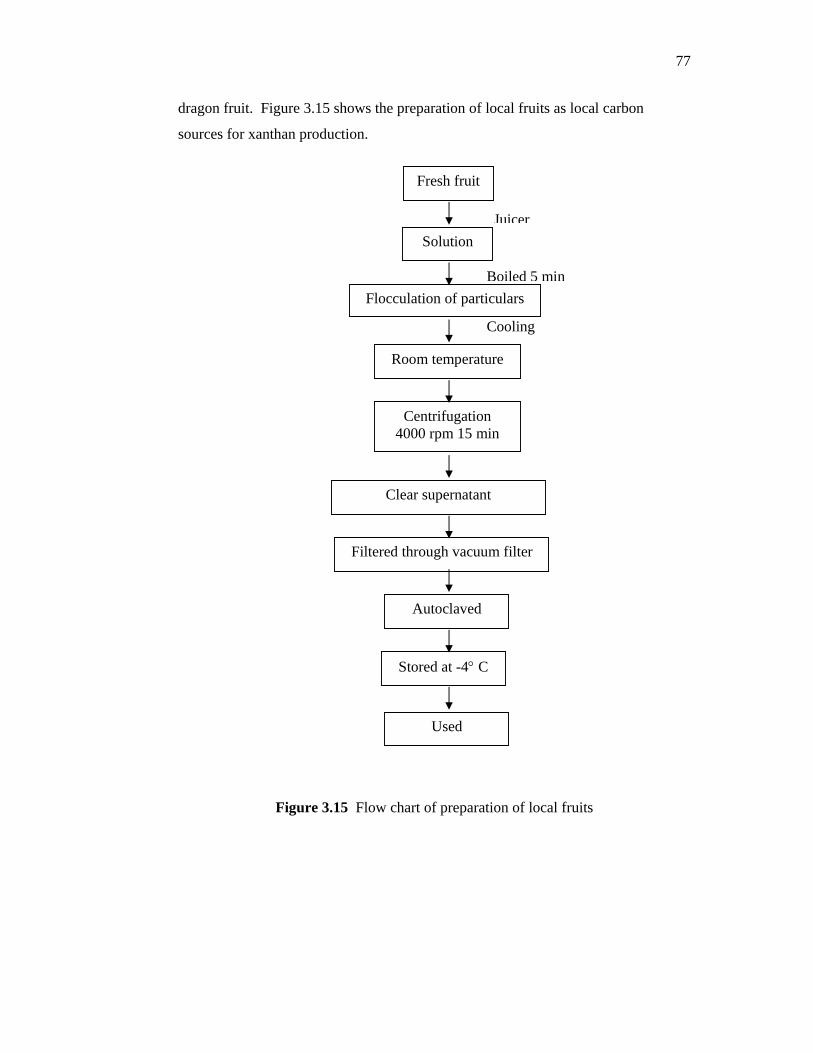
77
dragon fruit. Figure 3.15 shows the preparation of local fruits as local carbon
sources for xanthan production.
Figure 3.15 Flow chart of preparation of local fruits
Solution
Flocculation of particulars
Room temperature
Centrifugation 4000 rpm 15 min
Filtered through vacuum filter
Autoclaved
Clear supernatant
Fresh fruit
Stored at -4° C
Juicer
Cooling
Boiled 5 min
Used
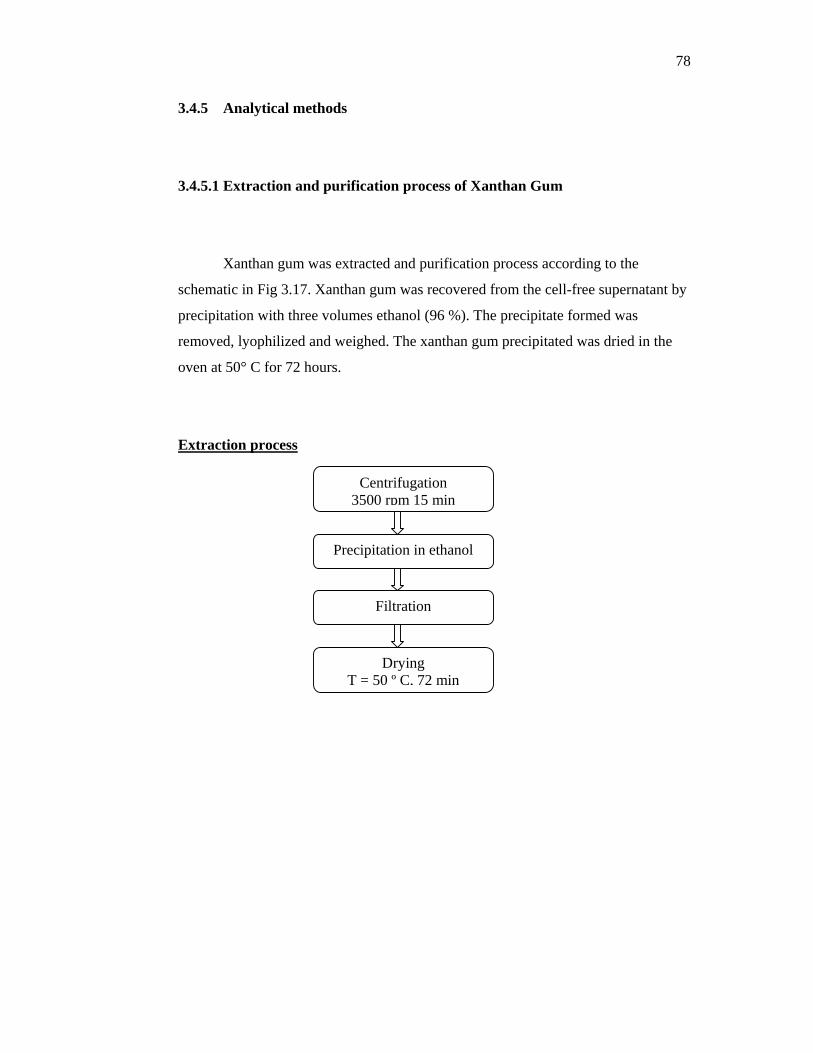
78
3.4.5 Analytical methods
3.4.5.1 Extraction and purification process of Xanthan Gum
Xanthan gum was extracted and purification process according to the
schematic in Fig 3.17. Xanthan gum was recovered from the cell-free supernatant by
precipitation with three volumes ethanol (96 %). The precipitate formed was
removed, lyophilized and weighed. The xanthan gum precipitated was dried in the
oven at 50° C for 72 hours.
Extraction process
Precipitation in ethanol
Drying T = 50 º C, 72 min
Centrifugation 3500 rpm 15 min
Filtration
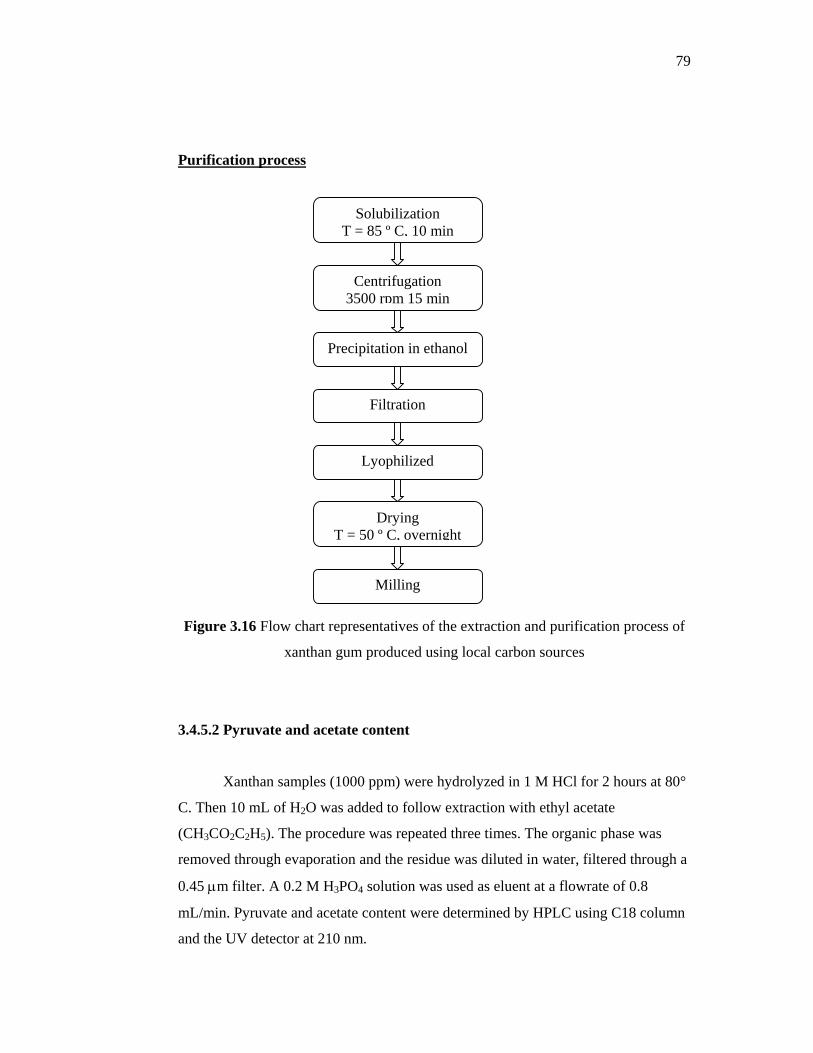
79
Purification process
Figure 3.16 Flow chart representatives of the extraction and purification process of
xanthan gum produced using local carbon sources
3.4.5.2 Pyruvate and acetate content
Xanthan samples (1000 ppm) were hydrolyzed in 1 M HCl for 2 hours at 80°
C. Then 10 mL of H2O was added to follow extraction with ethyl acetate
(CH3CO2C2H5). The procedure was repeated three times. The organic phase was
removed through evaporation and the residue was diluted in water, filtered through a
0.45 µm filter. A 0.2 M H3PO4 solution was used as eluent at a flowrate of 0.8
mL/min. Pyruvate and acetate content were determined by HPLC using C18 column
and the UV detector at 210 nm.
Solubilization T = 85 º C, 10 min
Centrifugation 3500 rpm 15 min
Precipitation in ethanol
Drying T = 50 º C, overnight
Filtration
Milling
Lyophilized
80
3.4.5.3 Gelatinization of refined xanthan gum
Chromium (III) acetate was added into refined xanthan gum (1500 ppm) with
ratio 10 : 1. The mixture was stirred slowly at room temperature until it is fully
dissolved. The solution was added into small glass bottle. Then, solution was placed
into oven at 60º C. The observation was done within for 9 days. The strength of gel
based on gel strength code.
3.4.5.4 Viscosity measurements
The viscosity of the cell-free fermentation broth was measured with a
Brookfield Engineering Laboratories Inc. viscometer (Model CPS) using spindle 18
in the range of 0.1 – 120 S-1. Viscosity measurements were carried out at room
temperature. The viscosity was then compared between xanthan gum commercial in
distilled water and distilled water with 0.2 w/w % and 0.4 w/w % NaCl. The xanthan
gums produced with concentration 1000 ppm were fully dissolved before viscosity
was measured [12].
3.4.5.5 FTIR analysis
The infrared spectra of xanthan gum were run in KBr discs using a Perkin
Elmer spectrum one FTIR spectrophotometer in the frequency range of 4000 – 400
cm-1. The dry polymer was mixed with potassium bromide (KBr) and pressed into
pellets under pressure to form a thin KBr disc. Differential spectra of xanthan gum
purified were also recorded.

81
3.4.5.6 Glucose Concentration
The glucose concentration of local fruit was determined by using a glucose
analyzer ( Model YHI 2700). The fruit juices from local fruit were presented to the
needle port for automatic sample injection. The analysis is based on membrane
glucose.
3.4.5.7 Solid-state NMR Spectrocopy
The molecular structure of xanthan gum produced was recorded using 13C
NMR spectra. The 13C NMR spectra were acquired using Bruker Avance 400. The
sample was packed in 4 mm zirconia rotors using Kel-F end caps and spun at speeds
of 7 kHz.
3.4.5.8 Oil Displacement Experiment
Brine and paraffin were used as the aqueous and oleic phases in the
experiments. Brine was 3 wt % NaCl solution. Sand pack flooding was conducted at
the ambient temperature. Sand pack holder of 2.4 cm in diameter and length of 30
cm were used. A SageTM Pump – Model M362 and pressure gauge were used. For
each test, 150 – 250 µm of clean silica sand was packed. The silica sand was used
only once for each run. The porosity of the sand pack was 44 – 49 %, and the
absolute permeability to water was approximately 7.0 – 8.5 Darcy. The displacement
tests were conducted horizontally. The polymer used in this study was xanthan from
Fluka. The experiment included waterflooding succeeded by surfactant solution
injection then followed by polymer flood. This was proposed to quantify the
surfactant polymer flooding recovery as a tertiary method for water flooding.
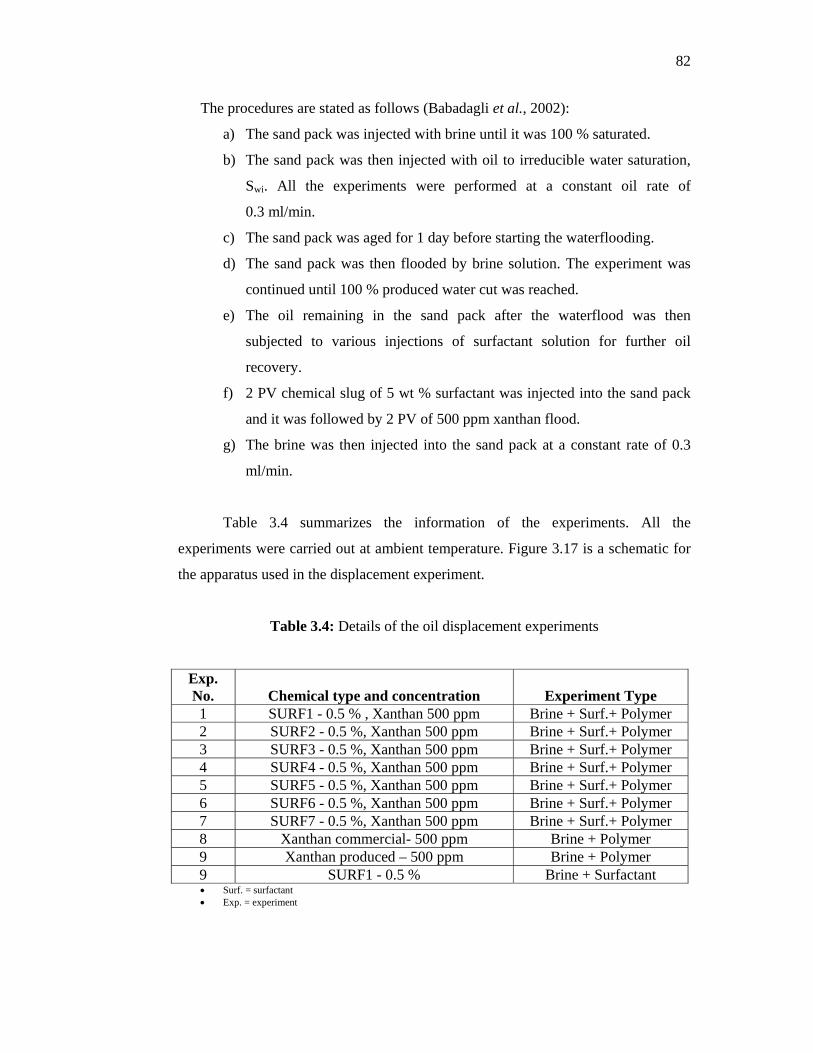
82
The procedures are stated as follows (Babadagli et al., 2002):
a) The sand pack was injected with brine until it was 100 % saturated.
b) The sand pack was then injected with oil to irreducible water saturation,
Swi. All the experiments were performed at a constant oil rate of
0.3 ml/min.
c) The sand pack was aged for 1 day before starting the waterflooding.
d) The sand pack was then flooded by brine solution. The experiment was
continued until 100 % produced water cut was reached.
e) The oil remaining in the sand pack after the waterflood was then
subjected to various injections of surfactant solution for further oil
recovery.
f) 2 PV chemical slug of 5 wt % surfactant was injected into the sand pack
and it was followed by 2 PV of 500 ppm xanthan flood.
g) The brine was then injected into the sand pack at a constant rate of 0.3
ml/min.
Table 3.4 summarizes the information of the experiments. All the
experiments were carried out at ambient temperature. Figure 3.17 is a schematic for
the apparatus used in the displacement experiment.
Table 3.4: Details of the oil displacement experiments
Exp. No. Chemical type and concentration Experiment Type 1 SURF1 - 0.5 % , Xanthan 500 ppm Brine + Surf.+ Polymer 2 SURF2 - 0.5 %, Xanthan 500 ppm Brine + Surf.+ Polymer 3 SURF3 - 0.5 %, Xanthan 500 ppm Brine + Surf.+ Polymer 4 SURF4 - 0.5 %, Xanthan 500 ppm Brine + Surf.+ Polymer 5 SURF5 - 0.5 %, Xanthan 500 ppm Brine + Surf.+ Polymer 6 SURF6 - 0.5 %, Xanthan 500 ppm Brine + Surf.+ Polymer 7 SURF7 - 0.5 %, Xanthan 500 ppm Brine + Surf.+ Polymer 8 Xanthan commercial- 500 ppm Brine + Polymer 9 Xanthan produced – 500 ppm Brine + Polymer 9 SURF1 - 0.5 % Brine + Surfactant • Surf. = surfactant • Exp. = experiment
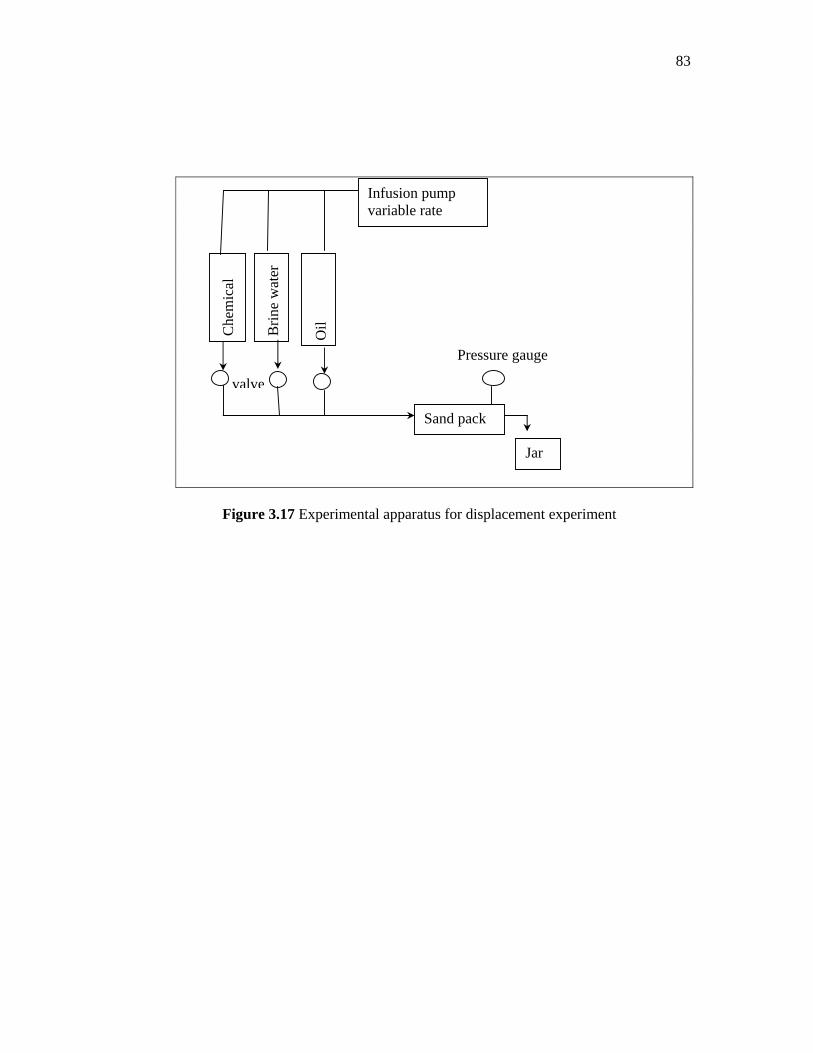
83
Figure 3.17 Experimental apparatus for displacement experiment
Che
mic
al
Brin
e w
ater
Infusion pump variable rate
Sand pack
Jar
Pressure gauge
Oil
valve
CHAPTER 4
RESULTS AND DISCUSSION
This chapter presents the production of surfactant and xanthan gum as
additives for enhanced oil recovery. It was also included the physical properties and
the chemical compositional analysis of surfactant through fluidized bed reactor
technology and xanthan gum through shaker fermentation. The extraction of
phenolic compounds from pyrolysis oil and the production of surfactant are
described. Next, the results of the analysis of the produced surfactant and xanthan
gum are also presented. The analyses include the volumetric estimation of surfactant
and the identification by FTIR. This chapter also describes the surfactant polymer
flooding using the produced surfactants and xanthan gum. The results were
evaluated in terms of the final oil recovery.
4.1 Production of surfactants
4.1.1 Physical and Chemical Characterization of Pyrolysis Oil
The products obtained from the pyrolysis oil palm shell were liquid, gas and
char. The liquid yield was found to be 40 wt % of the dry feedstock. The pyrolysis
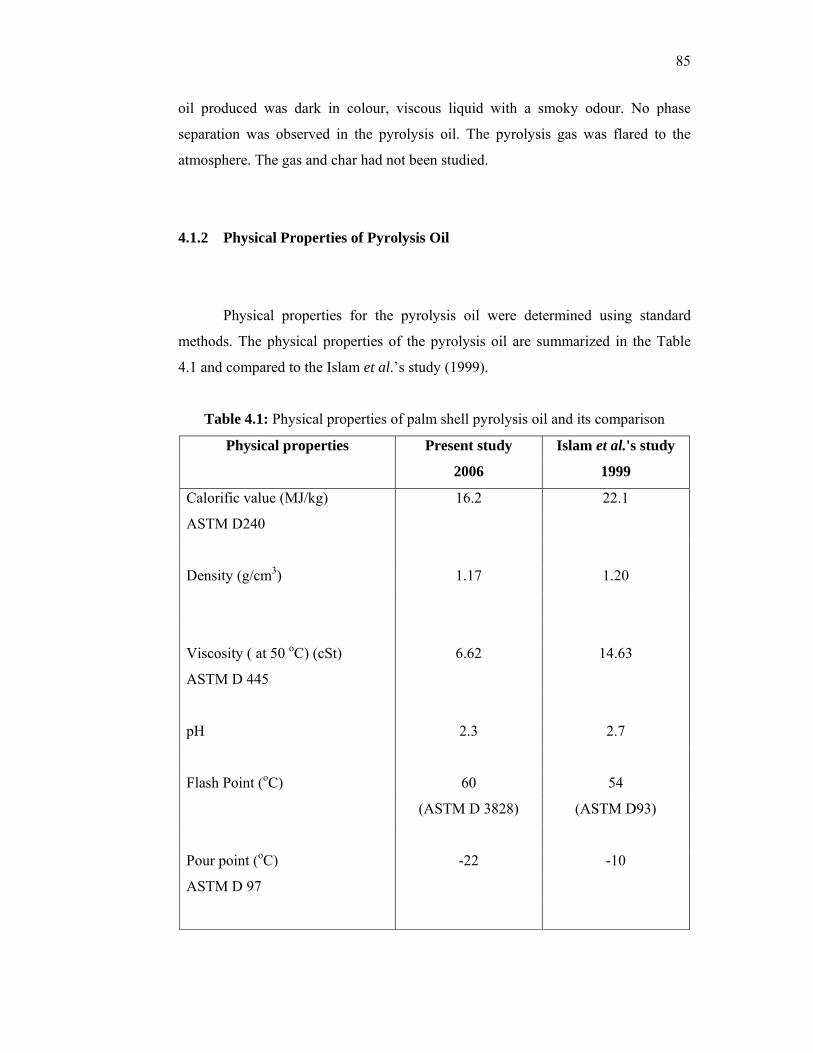
85
oil produced was dark in colour, viscous liquid with a smoky odour. No phase
separation was observed in the pyrolysis oil. The pyrolysis gas was flared to the
atmosphere. The gas and char had not been studied.
4.1.2 Physical Properties of Pyrolysis Oil
Physical properties for the pyrolysis oil were determined using standard
methods. The physical properties of the pyrolysis oil are summarized in the Table
4.1 and compared to the Islam et al.’s study (1999).
Table 4.1: Physical properties of palm shell pyrolysis oil and its comparison
Physical properties Present study Islam et al.'s study
2006 1999
Calorific value (MJ/kg) 16.2 22.1
ASTM D240
Density (g/cm3) 1.17 1.20
Viscosity ( at 50 oC) (cSt) 6.62 14.63
ASTM D 445
pH 2.3 2.7
Flash Point (oC) 60 54
(ASTM D 3828) (ASTM D93)
Pour point (oC) -22 -10
ASTM D 97
86
When comparing the viscosity obtained from Islam et al. (1999) which was
14.63 cp, the viscosity of the pyrolysis oil in this study was lower (6.62 cp). The
lower viscosity was due to the higher water content in the pyrolysis oil. The heating
value of the pyrolysis oil was affected by the composition of the oil. The higher
heating value of palm shell pyrolysis oil in this study was lower than previous study,
which was 16.2 MJ/kg due to the presence of high percentage of moisture
components. The water was not removed from the pyrolysis oil prior to the analysis.
Extra cost is needed if fractionation of the oil was carried out. Pyrolysis oil contains
low-boiling (below 100 oC) water-soluble compounds and hence conventional drying
methods cannot be used. The amount of volatile water-soluble compounds in the
pyrolysis oil is high and hence xylene distillation [ASTM D 95] in which the water is
distilled away with a co-solvent, cannot be used too. (Oasmaa and Peacocke, 2001).
The density of pyrolysis oil was 1.167 g/cm3, which was relatively low as
well. For the pyrolysis liquids analyzed the low viscosity was an indication of a low
pour point. The lower viscosity, 6.62 cp at 50 oC, with a low pour point -22 oC, was
explained by the high water content and lower proportional of water-insoluble of the
oil. The pyrolysis oil had a low pH value of 2.3. The pH was affected mainly by
volatile acids and the diluting effect of water. The flash point was 60 oC, which mean
it can be stored safety at room temperature.
The pyrolysis oil was acidic, unstable when heated, had a low heating value
and contained more water. The properties of the pyrolysis liquids analyzed vary a lot
depending on the feedstock and the pyrolysis process conditions. The oil palm shell
in this study was stored in open air condition prior to the pyrolysis process.
Exposure of the raw material to the atmosphere can be attributed to the difference in
the properties of feedstock, e.g., loss of some light compounds and oxygen to the air.
In addition, Islam et al. (1999) obtained the pyrolysis oil at a fluidized bed
temperature of 500 oC, which is different with the reaction temperature in this study,
450 oC. In this study, the fluidized bed temperature could not be increased due to the
limitation of the maximum current that could be achieved by the system. The system
would be unstable if the heater was overheated.
87
Four stages were observed when heating the pyrolysis oil.
1. First stage, the viscosity of the pyrolysis oil increased due to the
polymerization reactions.
2. Second stage, an aqueous phase was separated out from the heavy lignin
– rich phase. The liquid started boiling at 99 oC (below 100 oC).
3. Third stage, gummy formation from the heavy lignin – rich phase when
the temperature was raised to about 150 oC.
4. Fourth stage, char or coke formation from the gummy phase at the
temperature above 150 oC. The char or coke was a black shining material.
The observation above is in agreement with the work by Oasmaa and
Peacocke (2001). The distillation curve was not reported. Flashing occurred
immediately when giving away 50 % of the volume at 150 oC.
4.1.3 Solubility with Water and Other Solvents
The pyrolysis oil from oil palm shell was semi–soluble in water. Water was
easily added into the pyrolysis oil from oil palm shell. However, black sticky
material formed and stuck to the wall of the test tube when adding excess water into
the oil. A phase separation occurred when adding more water to the pyrolysis oil.
The water insoluble lignin derived fraction separated out of the aqueous phase. The
physical appearance of the black sticky material showed that the water-insoluble
fraction was separated.
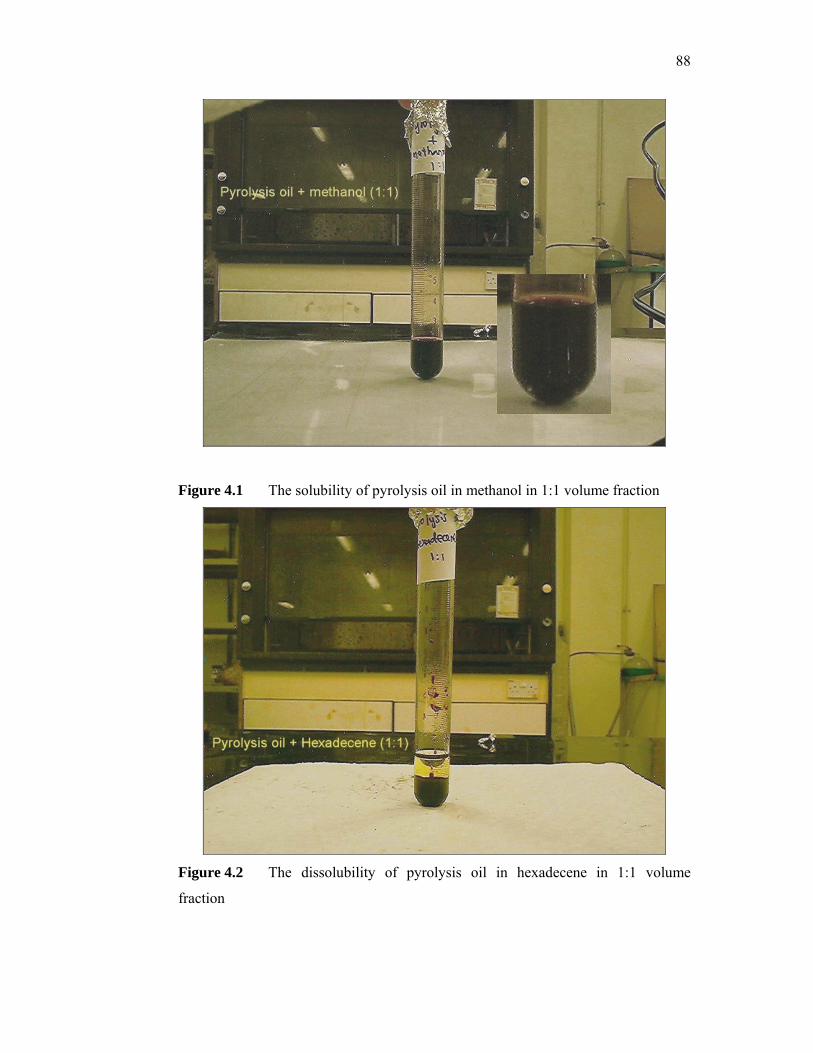
88
Figure 4.1 The solubility of pyrolysis oil in methanol in 1:1 volume fraction
Figure 4.2 The dissolubility of pyrolysis oil in hexadecene in 1:1 volume
fraction
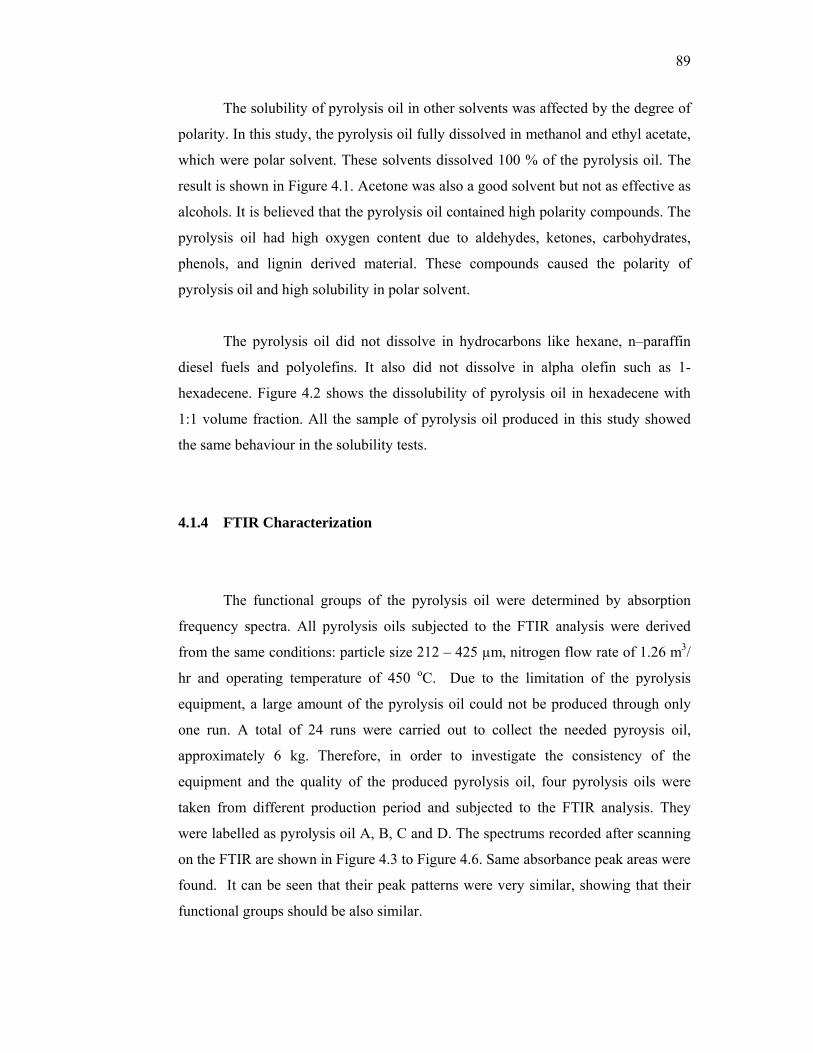
89
The solubility of pyrolysis oil in other solvents was affected by the degree of
polarity. In this study, the pyrolysis oil fully dissolved in methanol and ethyl acetate,
which were polar solvent. These solvents dissolved 100 % of the pyrolysis oil. The
result is shown in Figure 4.1. Acetone was also a good solvent but not as effective as
alcohols. It is believed that the pyrolysis oil contained high polarity compounds. The
pyrolysis oil had high oxygen content due to aldehydes, ketones, carbohydrates,
phenols, and lignin derived material. These compounds caused the polarity of
pyrolysis oil and high solubility in polar solvent.
The pyrolysis oil did not dissolve in hydrocarbons like hexane, n–paraffin
diesel fuels and polyolefins. It also did not dissolve in alpha olefin such as 1-
hexadecene. Figure 4.2 shows the dissolubility of pyrolysis oil in hexadecene with
1:1 volume fraction. All the sample of pyrolysis oil produced in this study showed
the same behaviour in the solubility tests.
4.1.4 FTIR Characterization
The functional groups of the pyrolysis oil were determined by absorption
frequency spectra. All pyrolysis oils subjected to the FTIR analysis were derived
from the same conditions: particle size 212 – 425 µm, nitrogen flow rate of 1.26 m3/
hr and operating temperature of 450 oC. Due to the limitation of the pyrolysis
equipment, a large amount of the pyrolysis oil could not be produced through only
one run. A total of 24 runs were carried out to collect the needed pyroysis oil,
approximately 6 kg. Therefore, in order to investigate the consistency of the
equipment and the quality of the produced pyrolysis oil, four pyrolysis oils were
taken from different production period and subjected to the FTIR analysis. They
were labelled as pyrolysis oil A, B, C and D. The spectrums recorded after scanning
on the FTIR are shown in Figure 4.3 to Figure 4.6. Same absorbance peak areas were
found. It can be seen that their peak patterns were very similar, showing that their
functional groups should be also similar.
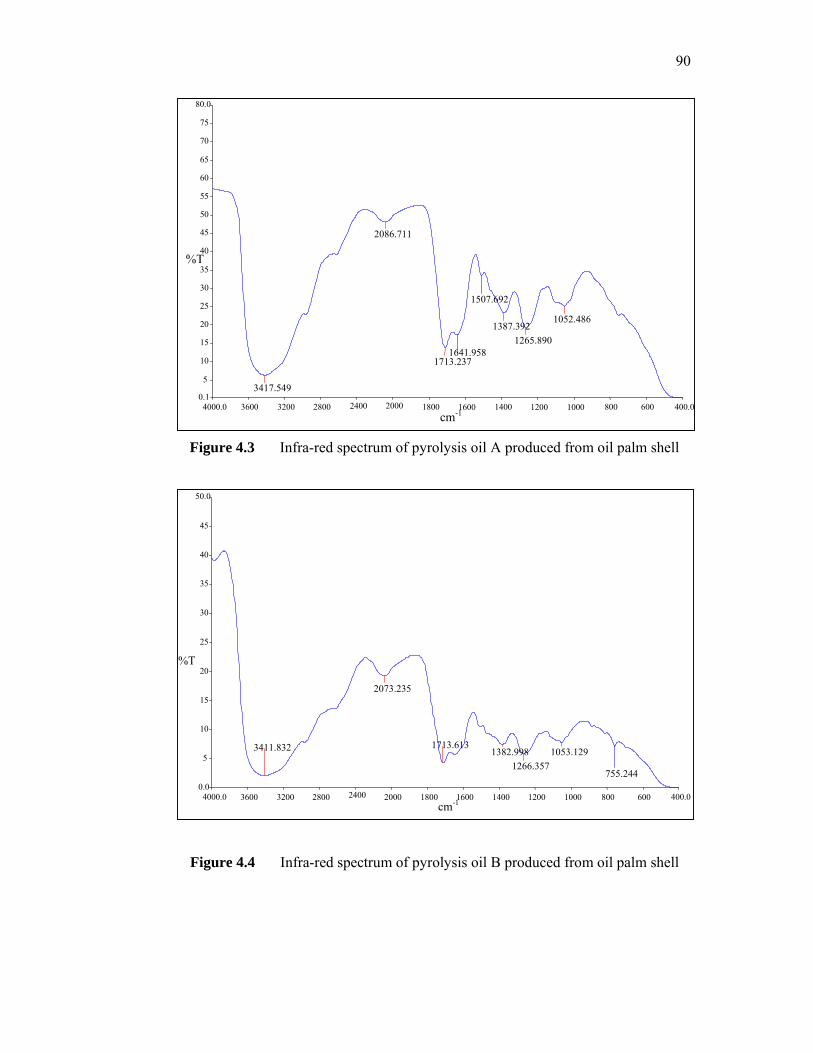
90
Figure 4.3 Infra-red spectrum of pyrolysis oil A produced from oil palm shell
Figure 4.4 Infra-red spectrum of pyrolysis oil B produced from oil palm shell
4000.0 3600 3200 2800 2400 2000 1800 1600 1400 1200 1000 800 600 400.00.0
5
10
15
20
25
30
35
40
45
50.0
cm-1
%T
3411.832
2073.235
1713.6131382.998
1266.3571053.129
755.244
4000.0 3600 3200 2800 2400 2000 1800 1600 1400 1200 1000 800 600 400.00.1
5
10
15
20
25
30 35 40 45 50 55
60
65 70
75
80.0
cm-1
%T
3417.549
2086.711
1713.237
1387.3921265.890
1052.486
1641.958
1507.692
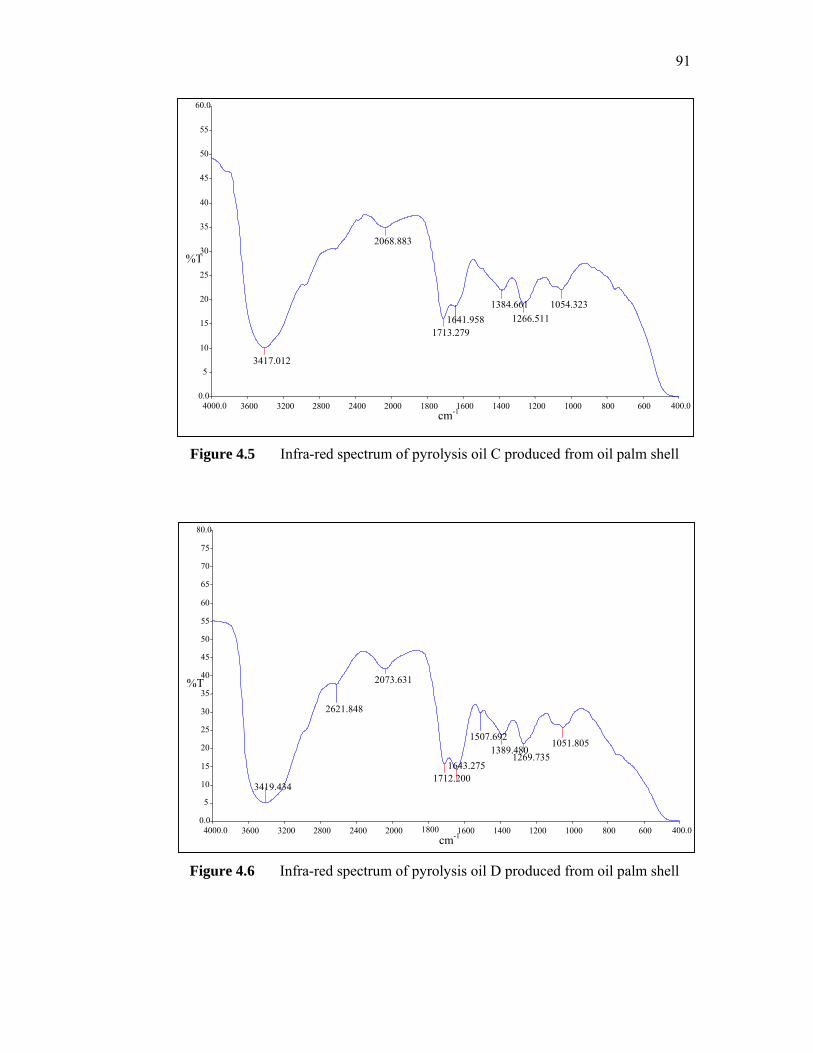
91
Figure 4.5 Infra-red spectrum of pyrolysis oil C produced from oil palm shell
Figure 4.6 Infra-red spectrum of pyrolysis oil D produced from oil palm shell
4000.0 3600 3200 2800 2400 2000 1800 1600 1400 1200 1000 800 600 400.00.0
5
10
15
20
25
30
35
40
45
50
55
60
65
70
75
80.0
cm-1
%T
3419.434
2073.631
1712.2001643.275
1389.4801269.735
1051.805
2621.848
1507.692
4000.0 3600 3200 2800 2400 2000 1800 1600 1400 1200 1000 800 600 400.00.0
5
10
15
20
25
30
35
40
45
50
55
60.0
cm-1
%T
3417.012
2068.883
1713.279
1384.6611266.511
1054.323 1641.958
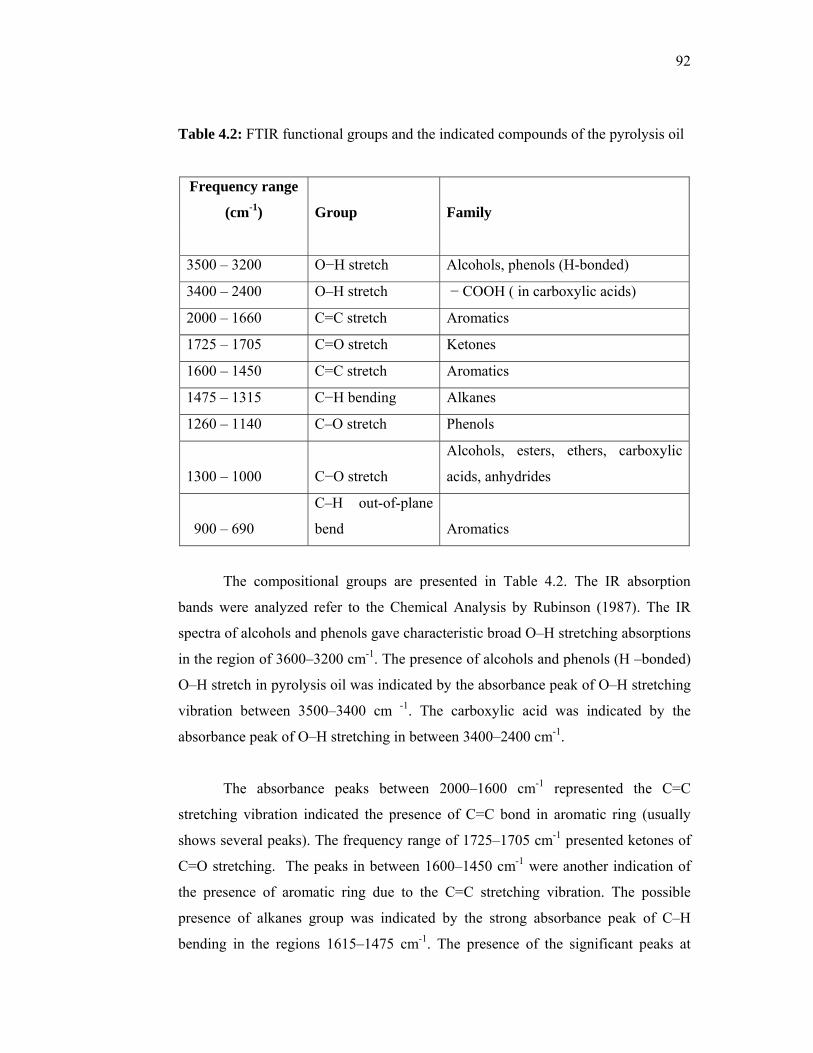
92
Table 4.2: FTIR functional groups and the indicated compounds of the pyrolysis oil
Frequency range
(cm-1) Group Family
3500 – 3200 O−H stretch Alcohols, phenols (H-bonded)
3400 – 2400 O–H stretch − COOH ( in carboxylic acids)
2000 – 1660 C=C stretch Aromatics
1725 – 1705 C=O stretch Ketones
1600 – 1450 C=C stretch Aromatics
1475 – 1315 C−H bending Alkanes
1260 – 1140 C–O stretch Phenols
1300 – 1000 C−O stretch
Alcohols, esters, ethers, carboxylic
acids, anhydrides
900 – 690
C–H out-of-plane
bend Aromatics
The compositional groups are presented in Table 4.2. The IR absorption
bands were analyzed refer to the Chemical Analysis by Rubinson (1987). The IR
spectra of alcohols and phenols gave characteristic broad O–H stretching absorptions
in the region of 3600–3200 cm-1. The presence of alcohols and phenols (H –bonded)
O–H stretch in pyrolysis oil was indicated by the absorbance peak of O–H stretching
vibration between 3500–3400 cm -1. The carboxylic acid was indicated by the
absorbance peak of O–H stretching in between 3400–2400 cm-1.
The absorbance peaks between 2000–1600 cm-1 represented the C=C
stretching vibration indicated the presence of C=C bond in aromatic ring (usually
shows several peaks). The frequency range of 1725–1705 cm-1 presented ketones of
C=O stretching. The peaks in between 1600–1450 cm-1 were another indication of
the presence of aromatic ring due to the C=C stretching vibration. The possible
presence of alkanes group was indicated by the strong absorbance peak of C–H
bending in the regions 1615–1475 cm-1. The presence of the significant peaks at
93
1640 and 1700 cm-1 could be ascribed to C–O (carbonyl) stretching vibrations
indicative of the ketones, phenols or aldehydes, or represent C=C stretching
vibrations indicative of alkenes and aromatics. Absorptions due to the C–O
stretching for alcohols and phenols also occurs in the fingerprint region, but can
sometimes be distinguished since they tend to be stronger than surrounding
absorptions. They occurred in the regions 1260–1140 cm-1 for phenols. C–H
stretching and bending vibrations between 1475–1315 cm-1 indicated the presence of
alkane groups in pyrolysis oil. The band at 1389 cm-1 was ascribable to bending
vibrations for CH3 groups. The peaks between 1200–1000 cm-1 were indication of
the presence of primary, secondary, tertiary alcohols, ethers and esters due to C–O
stretching. Absorbance peaks of C–H out of plane bending between 900–650 cm-1
indicated the presence of single, polycyclic and substituted aromatic compounds.
4.1.5 GC – MS Characterization
The results of the FTIR were confirmed with the GC–MS analysis. Two
samples were subjected to GC–MS for the chemical compound identification, which
are pyrolysis oil A and B. Both were produced at the same conditions: particle size
212 – 425 µm, nitrogen flow rate of 1.26 m3/ hr and operating temperature of 450 oC
but in different production period. GC–MS analysis was carried on these two
samples in order to get an idea of the type of organic compounds in the pyrolysis oils
which produced at the same conditions. Table 4.3 and Table 4.4 show the detailed
analysis of the pyrolysis oil. The GC–MS chromatograms of the pyrolysis oils are
given in Appendix E.
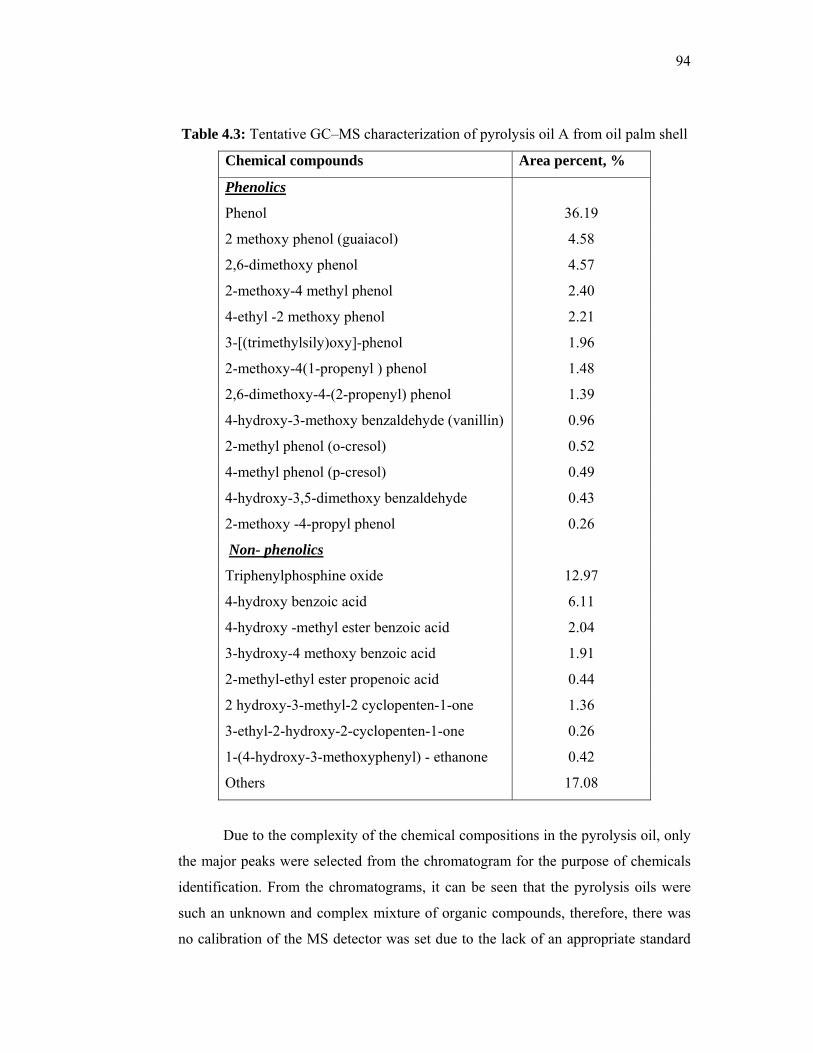
94
Table 4.3: Tentative GC–MS characterization of pyrolysis oil A from oil palm shell
Chemical compounds Area percent, %
Phenolics
Phenol 36.19
2 methoxy phenol (guaiacol) 4.58
2,6-dimethoxy phenol 4.57
2-methoxy-4 methyl phenol 2.40
4-ethyl -2 methoxy phenol 2.21
3-[(trimethylsily)oxy]-phenol 1.96
2-methoxy-4(1-propenyl ) phenol 1.48
2,6-dimethoxy-4-(2-propenyl) phenol 1.39
4-hydroxy-3-methoxy benzaldehyde (vanillin) 0.96
2-methyl phenol (o-cresol) 0.52
4-methyl phenol (p-cresol) 0.49
4-hydroxy-3,5-dimethoxy benzaldehyde 0.43
2-methoxy -4-propyl phenol 0.26
Non- phenolics
Triphenylphosphine oxide 12.97
4-hydroxy benzoic acid 6.11
4-hydroxy -methyl ester benzoic acid 2.04
3-hydroxy-4 methoxy benzoic acid 1.91
2-methyl-ethyl ester propenoic acid 0.44
2 hydroxy-3-methyl-2 cyclopenten-1-one 1.36
3-ethyl-2-hydroxy-2-cyclopenten-1-one 0.26
1-(4-hydroxy-3-methoxyphenyl) - ethanone 0.42
Others 17.08
Due to the complexity of the chemical compositions in the pyrolysis oil, only
the major peaks were selected from the chromatogram for the purpose of chemicals
identification. From the chromatograms, it can be seen that the pyrolysis oils were
such an unknown and complex mixture of organic compounds, therefore, there was
no calibration of the MS detector was set due to the lack of an appropriate standard
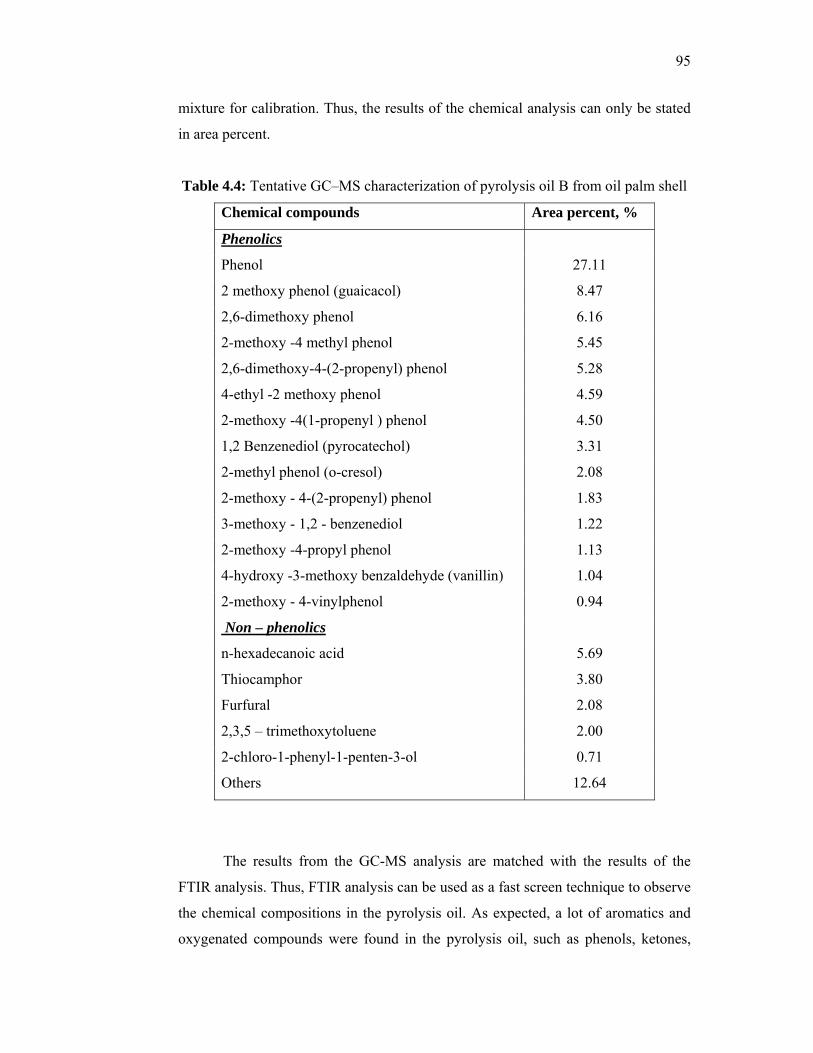
95
mixture for calibration. Thus, the results of the chemical analysis can only be stated
in area percent.
Table 4.4: Tentative GC–MS characterization of pyrolysis oil B from oil palm shell
Chemical compounds Area percent, %
Phenolics
Phenol 27.11
2 methoxy phenol (guaicacol) 8.47
2,6-dimethoxy phenol 6.16
2-methoxy -4 methyl phenol 5.45
2,6-dimethoxy-4-(2-propenyl) phenol 5.28
4-ethyl -2 methoxy phenol 4.59
2-methoxy -4(1-propenyl ) phenol 4.50
1,2 Benzenediol (pyrocatechol) 3.31
2-methyl phenol (o-cresol) 2.08
2-methoxy - 4-(2-propenyl) phenol 1.83
3-methoxy - 1,2 - benzenediol 1.22
2-methoxy -4-propyl phenol 1.13
4-hydroxy -3-methoxy benzaldehyde (vanillin) 1.04
2-methoxy - 4-vinylphenol 0.94
Non – phenolics
n-hexadecanoic acid 5.69
Thiocamphor 3.80
Furfural 2.08
2,3,5 – trimethoxytoluene 2.00
2-chloro-1-phenyl-1-penten-3-ol 0.71
Others 12.64
The results from the GC-MS analysis are matched with the results of the
FTIR analysis. Thus, FTIR analysis can be used as a fast screen technique to observe
the chemical compositions in the pyrolysis oil. As expected, a lot of aromatics and
oxygenated compounds were found in the pyrolysis oil, such as phenols, ketones,
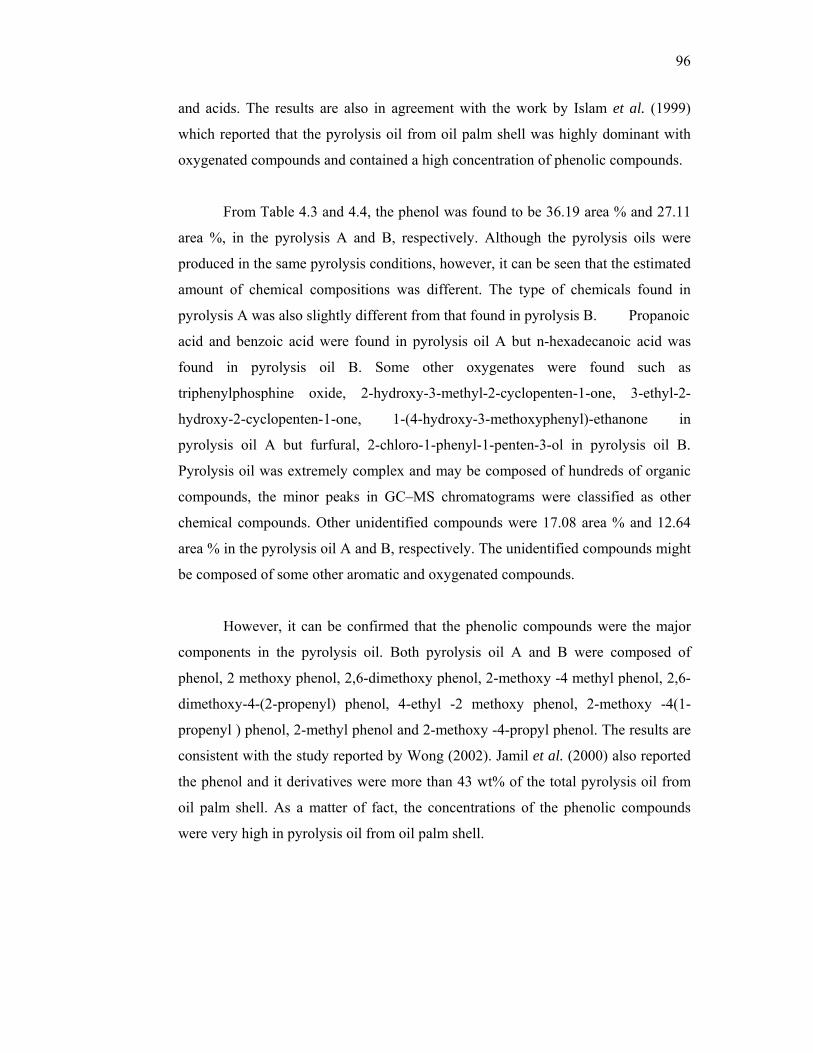
96
and acids. The results are also in agreement with the work by Islam et al. (1999)
which reported that the pyrolysis oil from oil palm shell was highly dominant with
oxygenated compounds and contained a high concentration of phenolic compounds.
From Table 4.3 and 4.4, the phenol was found to be 36.19 area % and 27.11
area %, in the pyrolysis A and B, respectively. Although the pyrolysis oils were
produced in the same pyrolysis conditions, however, it can be seen that the estimated
amount of chemical compositions was different. The type of chemicals found in
pyrolysis A was also slightly different from that found in pyrolysis B. Propanoic
acid and benzoic acid were found in pyrolysis oil A but n-hexadecanoic acid was
found in pyrolysis oil B. Some other oxygenates were found such as
triphenylphosphine oxide, 2-hydroxy-3-methyl-2-cyclopenten-1-one, 3-ethyl-2-
hydroxy-2-cyclopenten-1-one, 1-(4-hydroxy-3-methoxyphenyl)-ethanone in
pyrolysis oil A but furfural, 2-chloro-1-phenyl-1-penten-3-ol in pyrolysis oil B.
Pyrolysis oil was extremely complex and may be composed of hundreds of organic
compounds, the minor peaks in GC–MS chromatograms were classified as other
chemical compounds. Other unidentified compounds were 17.08 area % and 12.64
area % in the pyrolysis oil A and B, respectively. The unidentified compounds might
be composed of some other aromatic and oxygenated compounds.
However, it can be confirmed that the phenolic compounds were the major
components in the pyrolysis oil. Both pyrolysis oil A and B were composed of
phenol, 2 methoxy phenol, 2,6-dimethoxy phenol, 2-methoxy -4 methyl phenol, 2,6-
dimethoxy-4-(2-propenyl) phenol, 4-ethyl -2 methoxy phenol, 2-methoxy -4(1-
propenyl ) phenol, 2-methyl phenol and 2-methoxy -4-propyl phenol. The results are
consistent with the study reported by Wong (2002). Jamil et al. (2000) also reported
the phenol and it derivatives were more than 43 wt% of the total pyrolysis oil from
oil palm shell. As a matter of fact, the concentrations of the phenolic compounds
were very high in pyrolysis oil from oil palm shell.

97
4.1.6 Extraction of Phenolic Compounds
The chemical composition analysis of the pyrolysis oil showed that there
were several chemical compounds in the pyrolysis oil, such as acids, ketones,
phenolics and other oxygenated compounds. Since the phenolic compounds are the
major constituents in the oil, they have been looked as a potential substitute for
petroleum-based phenol and can be used as the starting material in the synthesis of
surfactant.
4.1.7 Liquid–liquid Extraction of Phenols from Pyrolysis Oil
As shown in Table 3.1 previously, experiment run no.1, liquid–liquid
extraction was performed by using 5 wt % of sodium hydroxide in a weight ratio of
1:1 to isolate the phenolic and neutral fractions. The alkaline aqueous solution,
containing the phenols, was acidified with 50 % sulphuric acid and lastly extracted
with ethyl acetate. In the step of extraction with aqueous sodium bicarbonate
solution, a precipitate was formed (5 wt %) along with the soluble acid fractions.
The precipitate was the salt produced from the neutralization process where the
strong organic acid reacted with sodium bicarbonate. Carbon dioxide gas was
released during the extraction process.
Table 4.5: Yields of pyrolysis oil based on starting oil in experiment run no.1
Yields of pyrolysis oil based on starting oil, wt %
EtOAc Insol. Organic Acids Phenol
Pyrolsys oil 0 * 9.09
Solids: 5 EtOAC Insol. = ethyl acetate insoluble
* Not Determined
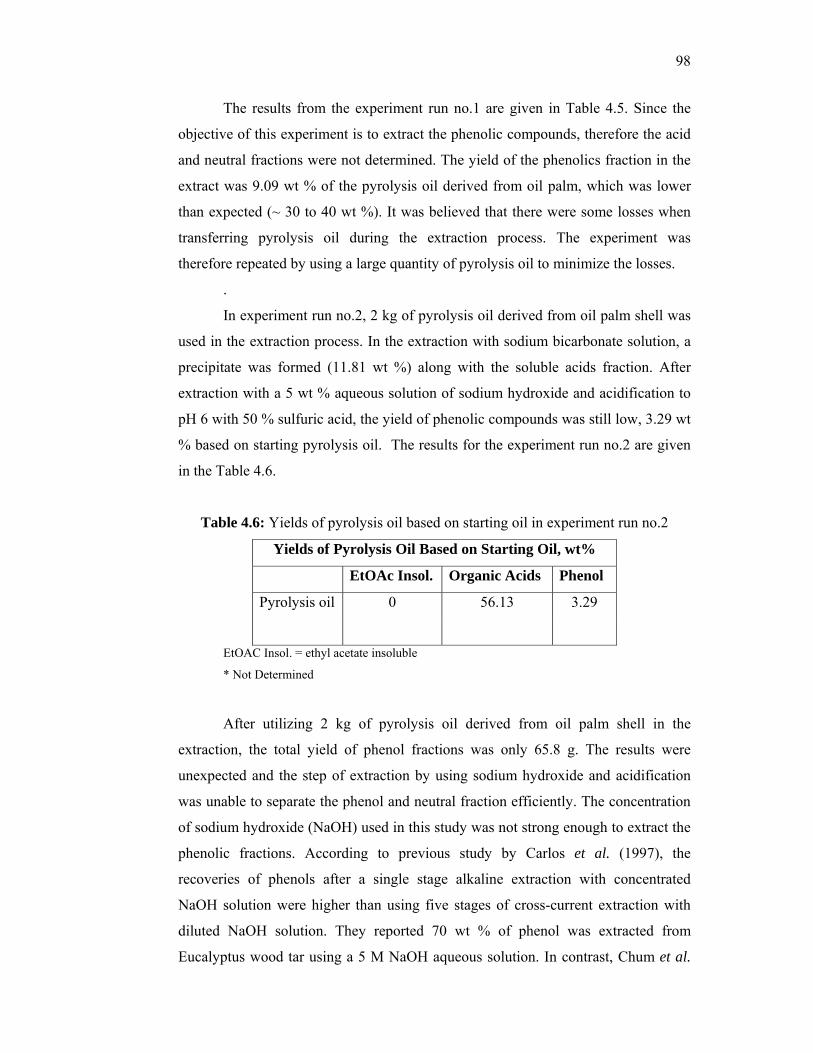
98
The results from the experiment run no.1 are given in Table 4.5. Since the
objective of this experiment is to extract the phenolic compounds, therefore the acid
and neutral fractions were not determined. The yield of the phenolics fraction in the
extract was 9.09 wt % of the pyrolysis oil derived from oil palm, which was lower
than expected (~ 30 to 40 wt %). It was believed that there were some losses when
transferring pyrolysis oil during the extraction process. The experiment was
therefore repeated by using a large quantity of pyrolysis oil to minimize the losses.
.
In experiment run no.2, 2 kg of pyrolysis oil derived from oil palm shell was
used in the extraction process. In the extraction with sodium bicarbonate solution, a
precipitate was formed (11.81 wt %) along with the soluble acids fraction. After
extraction with a 5 wt % aqueous solution of sodium hydroxide and acidification to
pH 6 with 50 % sulfuric acid, the yield of phenolic compounds was still low, 3.29 wt
% based on starting pyrolysis oil. The results for the experiment run no.2 are given
in the Table 4.6.
Table 4.6: Yields of pyrolysis oil based on starting oil in experiment run no.2
Yields of Pyrolysis Oil Based on Starting Oil, wt%
EtOAc Insol. Organic Acids Phenol
Pyrolysis oil 0 56.13 3.29
EtOAC Insol. = ethyl acetate insoluble
* Not Determined
After utilizing 2 kg of pyrolysis oil derived from oil palm shell in the
extraction, the total yield of phenol fractions was only 65.8 g. The results were
unexpected and the step of extraction by using sodium hydroxide and acidification
was unable to separate the phenol and neutral fraction efficiently. The concentration
of sodium hydroxide (NaOH) used in this study was not strong enough to extract the
phenolic fractions. According to previous study by Carlos et al. (1997), the
recoveries of phenols after a single stage alkaline extraction with concentrated
NaOH solution were higher than using five stages of cross-current extraction with
diluted NaOH solution. They reported 70 wt % of phenol was extracted from
Eucalyptus wood tar using a 5 M NaOH aqueous solution. In contrast, Chum et al.
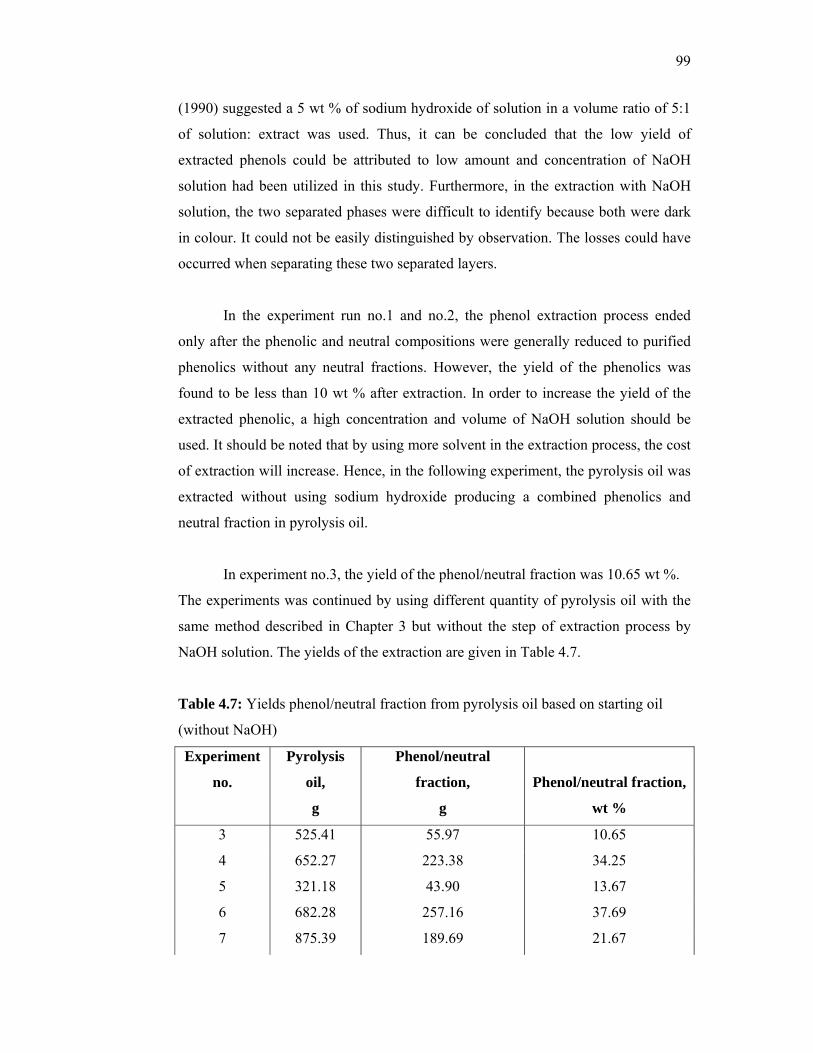
99
(1990) suggested a 5 wt % of sodium hydroxide of solution in a volume ratio of 5:1
of solution: extract was used. Thus, it can be concluded that the low yield of
extracted phenols could be attributed to low amount and concentration of NaOH
solution had been utilized in this study. Furthermore, in the extraction with NaOH
solution, the two separated phases were difficult to identify because both were dark
in colour. It could not be easily distinguished by observation. The losses could have
occurred when separating these two separated layers.
In the experiment run no.1 and no.2, the phenol extraction process ended
only after the phenolic and neutral compositions were generally reduced to purified
phenolics without any neutral fractions. However, the yield of the phenolics was
found to be less than 10 wt % after extraction. In order to increase the yield of the
extracted phenolic, a high concentration and volume of NaOH solution should be
used. It should be noted that by using more solvent in the extraction process, the cost
of extraction will increase. Hence, in the following experiment, the pyrolysis oil was
extracted without using sodium hydroxide producing a combined phenolics and
neutral fraction in pyrolysis oil.
In experiment no.3, the yield of the phenol/neutral fraction was 10.65 wt %.
The experiments was continued by using different quantity of pyrolysis oil with the
same method described in Chapter 3 but without the step of extraction process by
NaOH solution. The yields of the extraction are given in Table 4.7.
Table 4.7: Yields phenol/neutral fraction from pyrolysis oil based on starting oil
(without NaOH)
Experiment
no.
Pyrolysis
oil,
Phenol/neutral
fraction, Phenol/neutral fraction,
g g wt %
3 525.41 55.97 10.65
4 652.27 223.38 34.25
5 321.18 43.90 13.67
6 682.28 257.16 37.69
7 875.39 189.69 21.67
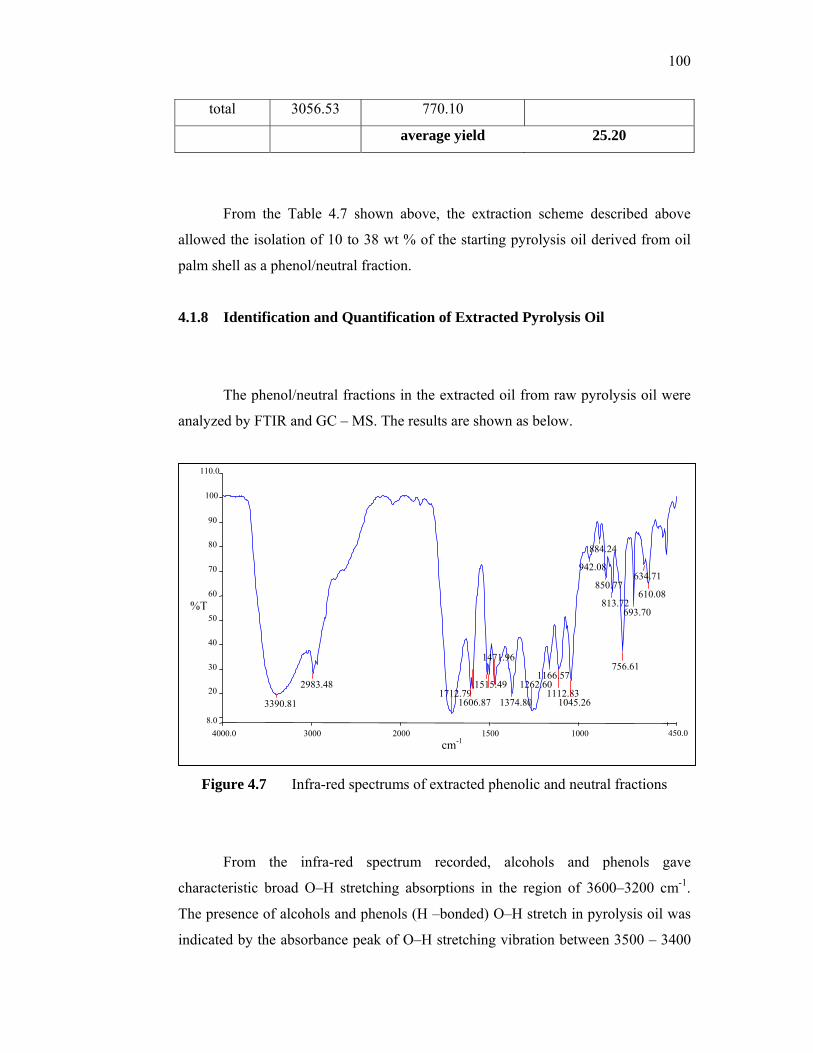
100
total 3056.53 770.10
average yield 25.20
From the Table 4.7 shown above, the extraction scheme described above
allowed the isolation of 10 to 38 wt % of the starting pyrolysis oil derived from oil
palm shell as a phenol/neutral fraction.
4.1.8 Identification and Quantification of Extracted Pyrolysis Oil
The phenol/neutral fractions in the extracted oil from raw pyrolysis oil were
analyzed by FTIR and GC – MS. The results are shown as below.
Figure 4.7 Infra-red spectrums of extracted phenolic and neutral fractions
From the infra-red spectrum recorded, alcohols and phenols gave
characteristic broad O–H stretching absorptions in the region of 3600–3200 cm-1.
The presence of alcohols and phenols (H –bonded) O–H stretch in pyrolysis oil was
indicated by the absorbance peak of O–H stretching vibration between 3500 – 3400
4000.0 3000 2000 1500 1000 450.08.0
20
30
40
50
60
70
80
90
100
110.0
cm-1
%T
3390.81
2983.481712.79
1606.87
1515.49
1471.96
1374.80
1262.601166.57
1112.83 1045.26
942.08
884.24
850.77
813.72
756.61
693.70
634.71
610.08
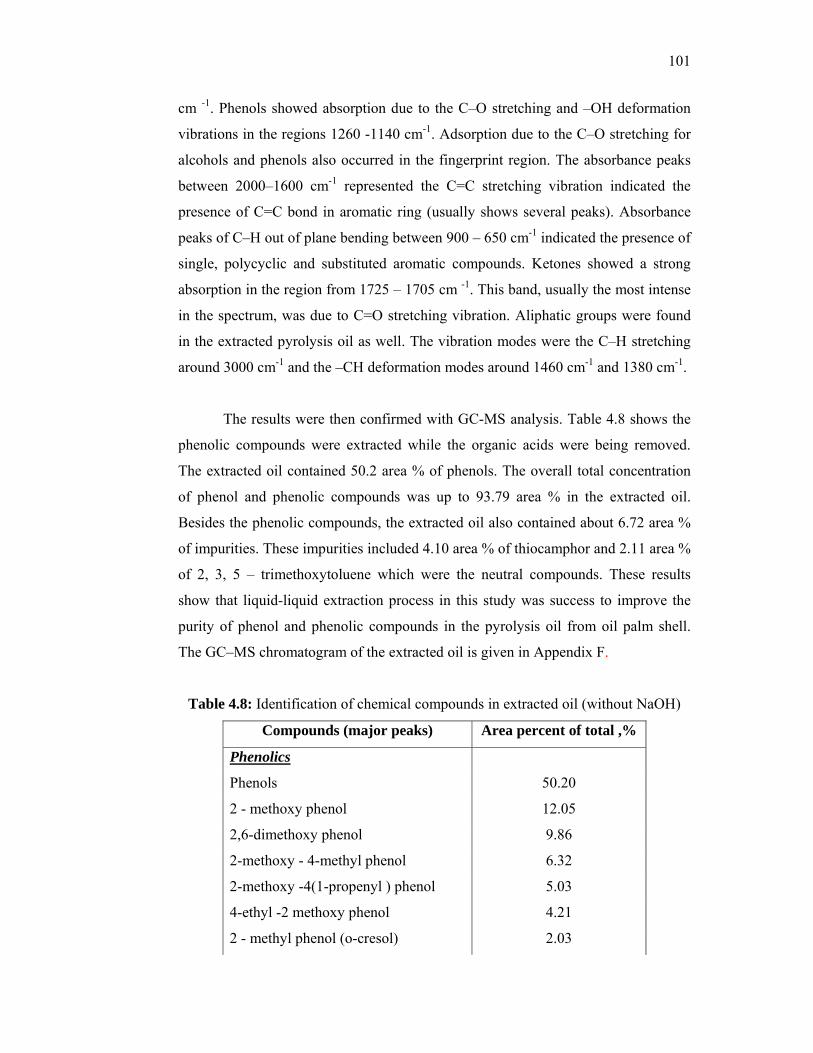
101
cm -1. Phenols showed absorption due to the C–O stretching and –OH deformation
vibrations in the regions 1260 -1140 cm-1. Adsorption due to the C–O stretching for
alcohols and phenols also occurred in the fingerprint region. The absorbance peaks
between 2000–1600 cm-1 represented the C=C stretching vibration indicated the
presence of C=C bond in aromatic ring (usually shows several peaks). Absorbance
peaks of C–H out of plane bending between 900 – 650 cm-1 indicated the presence of
single, polycyclic and substituted aromatic compounds. Ketones showed a strong
absorption in the region from 1725 – 1705 cm -1. This band, usually the most intense
in the spectrum, was due to C=O stretching vibration. Aliphatic groups were found
in the extracted pyrolysis oil as well. The vibration modes were the C–H stretching
around 3000 cm-1 and the –CH deformation modes around 1460 cm-1 and 1380 cm-1.
The results were then confirmed with GC-MS analysis. Table 4.8 shows the
phenolic compounds were extracted while the organic acids were being removed.
The extracted oil contained 50.2 area % of phenols. The overall total concentration
of phenol and phenolic compounds was up to 93.79 area % in the extracted oil.
Besides the phenolic compounds, the extracted oil also contained about 6.72 area %
of impurities. These impurities included 4.10 area % of thiocamphor and 2.11 area %
of 2, 3, 5 – trimethoxytoluene which were the neutral compounds. These results
show that liquid-liquid extraction process in this study was success to improve the
purity of phenol and phenolic compounds in the pyrolysis oil from oil palm shell.
The GC–MS chromatogram of the extracted oil is given in Appendix F.
Table 4.8: Identification of chemical compounds in extracted oil (without NaOH)
Compounds (major peaks) Area percent of total ,%
Phenolics
Phenols 50.20
2 - methoxy phenol 12.05
2,6-dimethoxy phenol 9.86
2-methoxy - 4-methyl phenol 6.32
2-methoxy -4(1-propenyl ) phenol 5.03
4-ethyl -2 methoxy phenol 4.21
2 - methyl phenol (o-cresol) 2.03
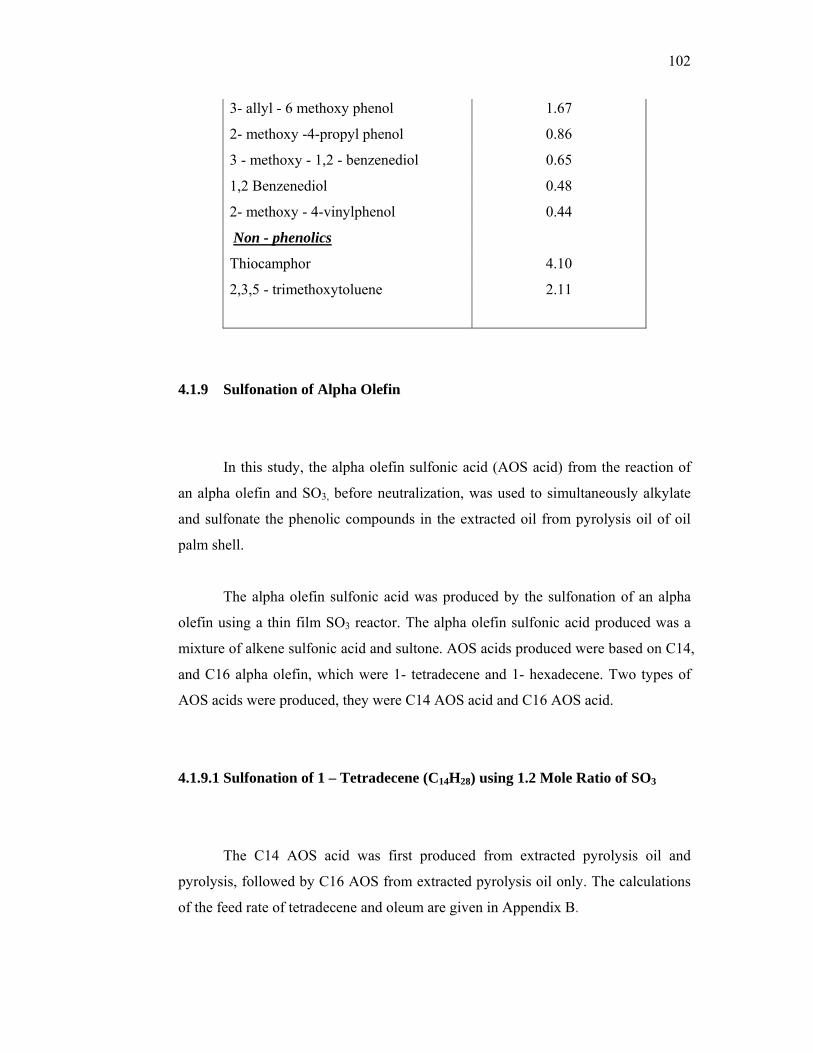
102
3- allyl - 6 methoxy phenol 1.67
2- methoxy -4-propyl phenol 0.86
3 - methoxy - 1,2 - benzenediol 0.65
1,2 Benzenediol 0.48
2- methoxy - 4-vinylphenol 0.44
Non - phenolics
Thiocamphor 4.10
2,3,5 - trimethoxytoluene 2.11
4.1.9 Sulfonation of Alpha Olefin
In this study, the alpha olefin sulfonic acid (AOS acid) from the reaction of
an alpha olefin and SO3, before neutralization, was used to simultaneously alkylate
and sulfonate the phenolic compounds in the extracted oil from pyrolysis oil of oil
palm shell.
The alpha olefin sulfonic acid was produced by the sulfonation of an alpha
olefin using a thin film SO3 reactor. The alpha olefin sulfonic acid produced was a
mixture of alkene sulfonic acid and sultone. AOS acids produced were based on C14,
and C16 alpha olefin, which were 1- tetradecene and 1- hexadecene. Two types of
AOS acids were produced, they were C14 AOS acid and C16 AOS acid.
4.1.9.1 Sulfonation of 1 – Tetradecene (C14H28) using 1.2 Mole Ratio of SO3
The C14 AOS acid was first produced from extracted pyrolysis oil and
pyrolysis, followed by C16 AOS from extracted pyrolysis oil only. The calculations
of the feed rate of tetradecene and oleum are given in Appendix B.
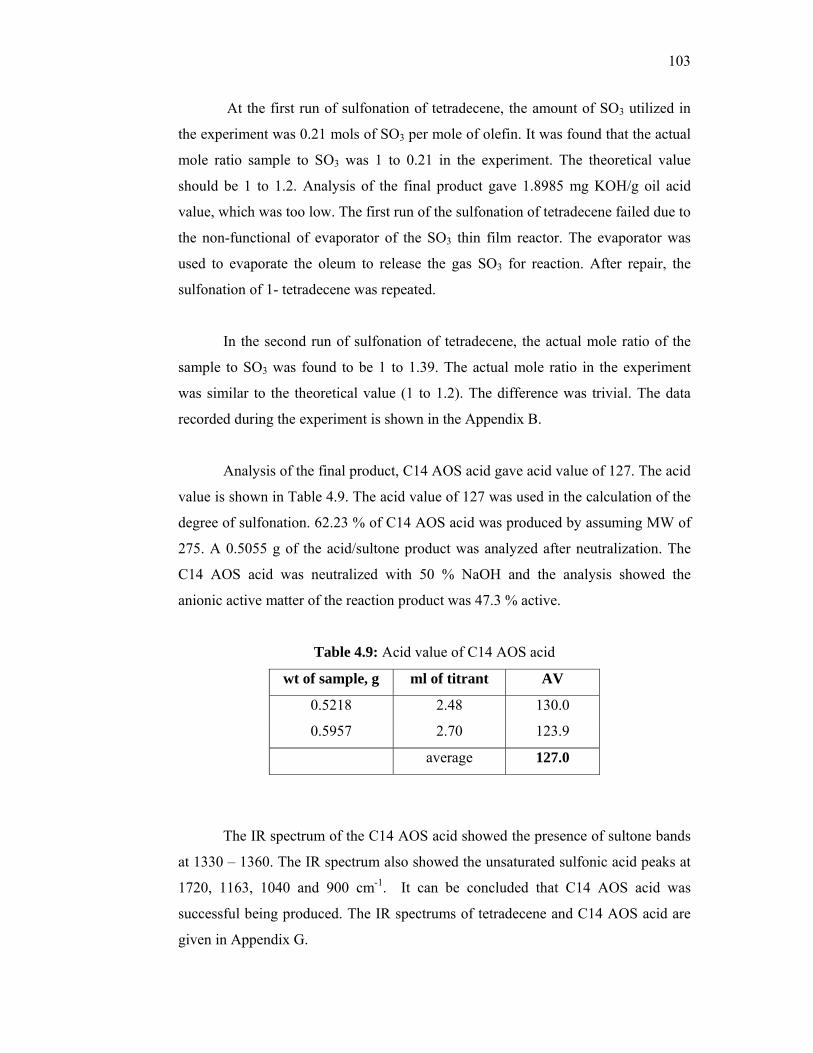
103
At the first run of sulfonation of tetradecene, the amount of SO3 utilized in
the experiment was 0.21 mols of SO3 per mole of olefin. It was found that the actual
mole ratio sample to SO3 was 1 to 0.21 in the experiment. The theoretical value
should be 1 to 1.2. Analysis of the final product gave 1.8985 mg KOH/g oil acid
value, which was too low. The first run of the sulfonation of tetradecene failed due to
the non-functional of evaporator of the SO3 thin film reactor. The evaporator was
used to evaporate the oleum to release the gas SO3 for reaction. After repair, the
sulfonation of 1- tetradecene was repeated.
In the second run of sulfonation of tetradecene, the actual mole ratio of the
sample to SO3 was found to be 1 to 1.39. The actual mole ratio in the experiment
was similar to the theoretical value (1 to 1.2). The difference was trivial. The data
recorded during the experiment is shown in the Appendix B.
Analysis of the final product, C14 AOS acid gave acid value of 127. The acid
value is shown in Table 4.9. The acid value of 127 was used in the calculation of the
degree of sulfonation. 62.23 % of C14 AOS acid was produced by assuming MW of
275. A 0.5055 g of the acid/sultone product was analyzed after neutralization. The
C14 AOS acid was neutralized with 50 % NaOH and the analysis showed the
anionic active matter of the reaction product was 47.3 % active.
Table 4.9: Acid value of C14 AOS acid
wt of sample, g ml of titrant AV
0.5218 2.48 130.0
0.5957 2.70 123.9
average 127.0
The IR spectrum of the C14 AOS acid showed the presence of sultone bands
at 1330 – 1360. The IR spectrum also showed the unsaturated sulfonic acid peaks at
1720, 1163, 1040 and 900 cm-1. It can be concluded that C14 AOS acid was
successful being produced. The IR spectrums of tetradecene and C14 AOS acid are
given in Appendix G.
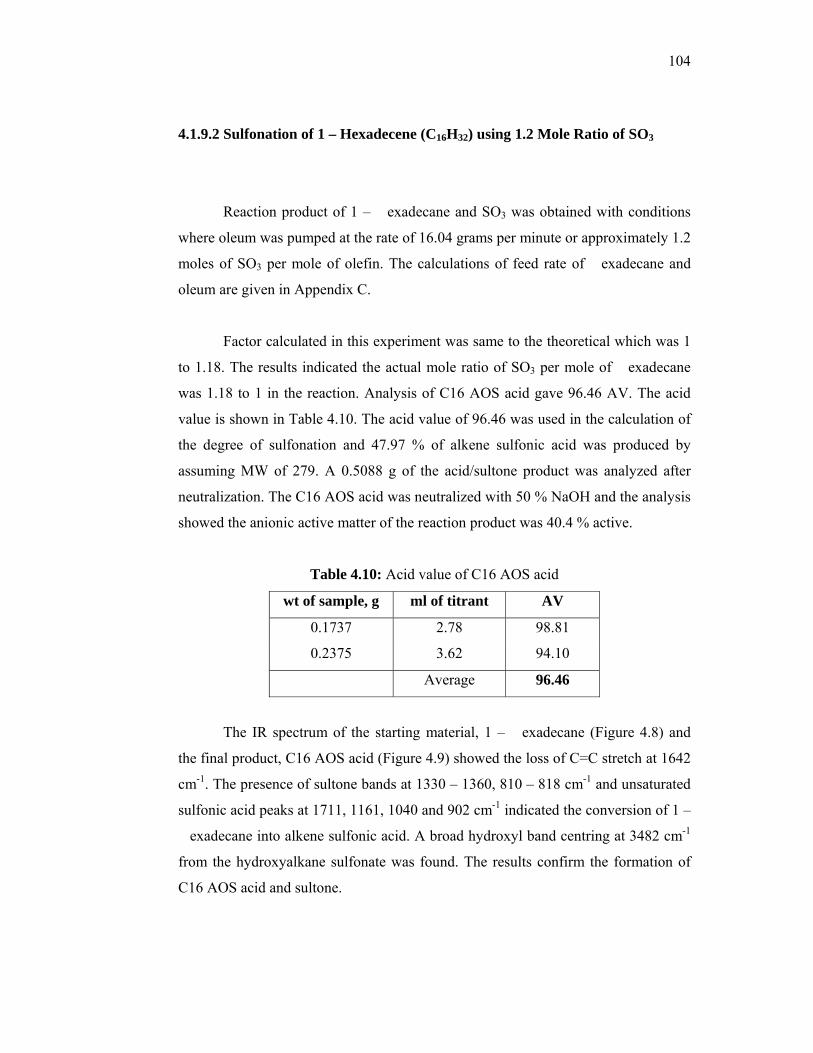
104
4.1.9.2 Sulfonation of 1 – Hexadecene (C16H32) using 1.2 Mole Ratio of SO3
Reaction product of 1 – �exadecane and SO3 was obtained with conditions
where oleum was pumped at the rate of 16.04 grams per minute or approximately 1.2
moles of SO3 per mole of olefin. The calculations of feed rate of �exadecane and
oleum are given in Appendix C.
Factor calculated in this experiment was same to the theoretical which was 1
to 1.18. The results indicated the actual mole ratio of SO3 per mole of �exadecane
was 1.18 to 1 in the reaction. Analysis of C16 AOS acid gave 96.46 AV. The acid
value is shown in Table 4.10. The acid value of 96.46 was used in the calculation of
the degree of sulfonation and 47.97 % of alkene sulfonic acid was produced by
assuming MW of 279. A 0.5088 g of the acid/sultone product was analyzed after
neutralization. The C16 AOS acid was neutralized with 50 % NaOH and the analysis
showed the anionic active matter of the reaction product was 40.4 % active.
Table 4.10: Acid value of C16 AOS acid
wt of sample, g ml of titrant AV
0.1737 2.78 98.81
0.2375 3.62 94.10
Average 96.46
The IR spectrum of the starting material, 1 – �exadecane (Figure 4.8) and
the final product, C16 AOS acid (Figure 4.9) showed the loss of C=C stretch at 1642
cm-1. The presence of sultone bands at 1330 – 1360, 810 – 818 cm-1 and unsaturated
sulfonic acid peaks at 1711, 1161, 1040 and 902 cm-1 indicated the conversion of 1 –
�exadecane into alkene sulfonic acid. A broad hydroxyl band centring at 3482 cm-1
from the hydroxyalkane sulfonate was found. The results confirm the formation of
C16 AOS acid and sultone.
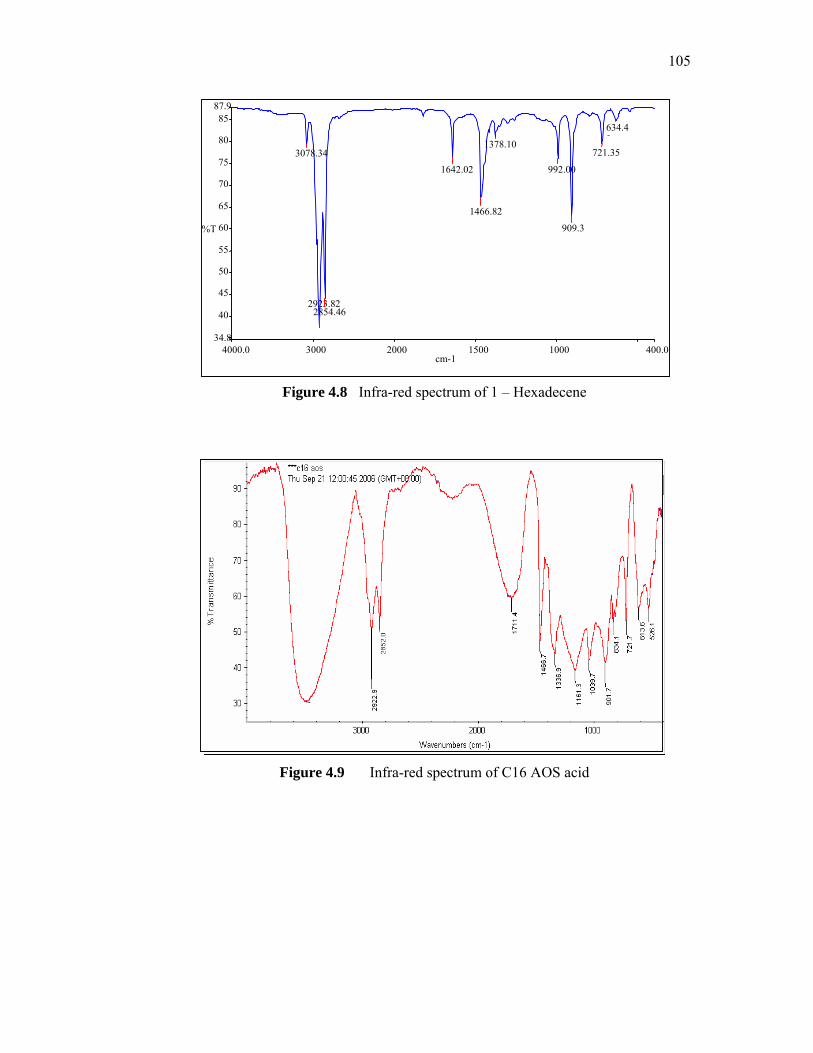
105
Figure 4.8 Infra-red spectrum of 1 – Hexadecene
Figure 4.9 Infra-red spectrum of C16 AOS acid
4000.0 3000 2000 1500 1000 400.034.8
40
45
50
55
60
65
70
75
80
85 87.9
cm-1
%T
3078.34
2923.822854.46
1642.02
1466.82
1378.10
992.00
909.3
721.35
634.42
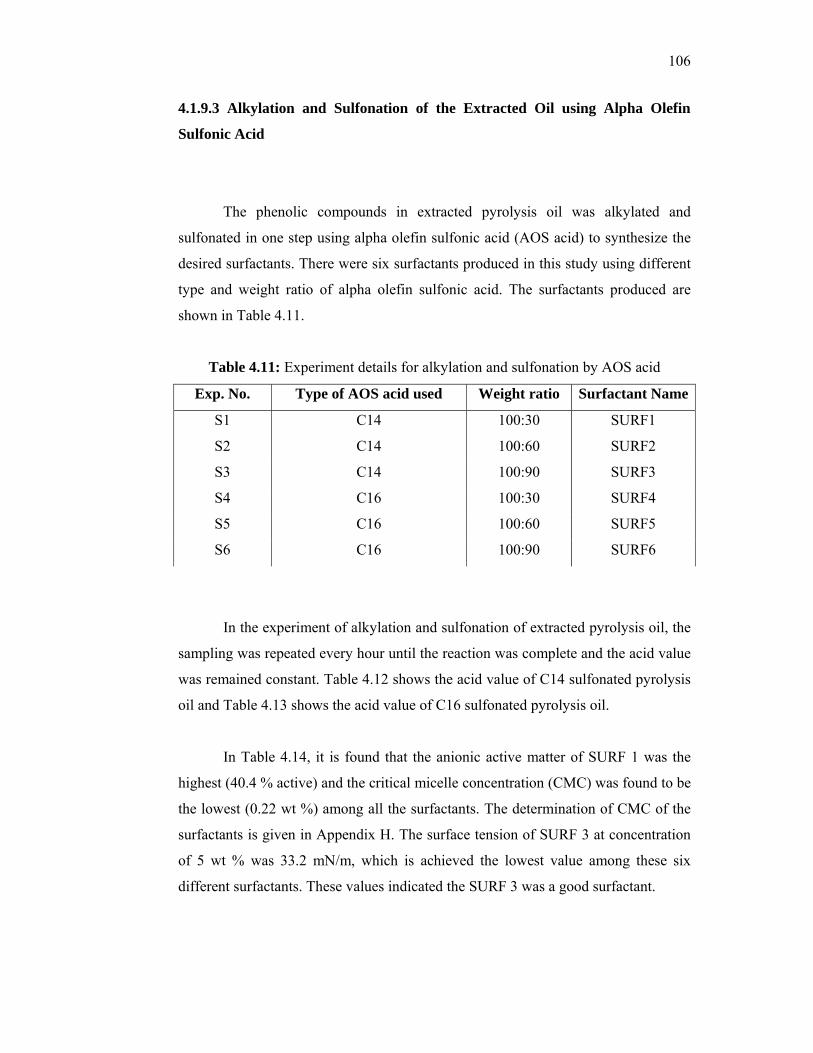
106
4.1.9.3 Alkylation and Sulfonation of the Extracted Oil using Alpha Olefin
Sulfonic Acid
The phenolic compounds in extracted pyrolysis oil was alkylated and
sulfonated in one step using alpha olefin sulfonic acid (AOS acid) to synthesize the
desired surfactants. There were six surfactants produced in this study using different
type and weight ratio of alpha olefin sulfonic acid. The surfactants produced are
shown in Table 4.11.
Table 4.11: Experiment details for alkylation and sulfonation by AOS acid
Exp. No. Type of AOS acid used Weight ratio Surfactant Name
S1 C14 100:30 SURF1
S2 C14 100:60 SURF2
S3 C14 100:90 SURF3
S4 C16 100:30 SURF4
S5 C16 100:60 SURF5
S6 C16 100:90 SURF6
In the experiment of alkylation and sulfonation of extracted pyrolysis oil, the
sampling was repeated every hour until the reaction was complete and the acid value
was remained constant. Table 4.12 shows the acid value of C14 sulfonated pyrolysis
oil and Table 4.13 shows the acid value of C16 sulfonated pyrolysis oil.
In Table 4.14, it is found that the anionic active matter of SURF 1 was the
highest (40.4 % active) and the critical micelle concentration (CMC) was found to be
the lowest (0.22 wt %) among all the surfactants. The determination of CMC of the
surfactants is given in Appendix H. The surface tension of SURF 3 at concentration
of 5 wt % was 33.2 mN/m, which is achieved the lowest value among these six
different surfactants. These values indicated the SURF 3 was a good surfactant.
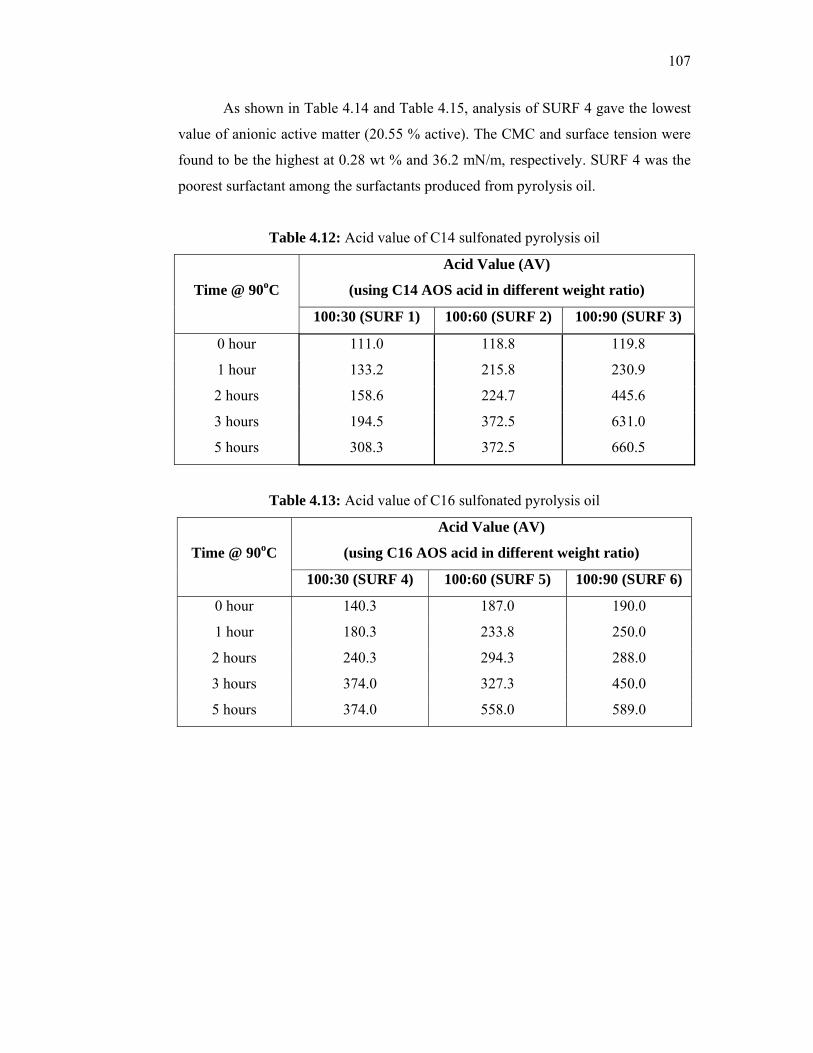
107
As shown in Table 4.14 and Table 4.15, analysis of SURF 4 gave the lowest
value of anionic active matter (20.55 % active). The CMC and surface tension were
found to be the highest at 0.28 wt % and 36.2 mN/m, respectively. SURF 4 was the
poorest surfactant among the surfactants produced from pyrolysis oil.
Table 4.12: Acid value of C14 sulfonated pyrolysis oil
Time @ 90oC
Acid Value (AV)
(using C14 AOS acid in different weight ratio)
100:30 (SURF 1) 100:60 (SURF 2) 100:90 (SURF 3)
0 hour 111.0 118.8 119.8
1 hour 133.2 215.8 230.9
2 hours 158.6 224.7 445.6
3 hours 194.5 372.5 631.0
5 hours 308.3 372.5 660.5
Table 4.13: Acid value of C16 sulfonated pyrolysis oil
Time @ 90oC
Acid Value (AV)
(using C16 AOS acid in different weight ratio)
100:30 (SURF 4) 100:60 (SURF 5) 100:90 (SURF 6)
0 hour 140.3 187.0 190.0
1 hour 180.3 233.8 250.0
2 hours 240.3 294.3 288.0
3 hours 374.0 327.3 450.0
5 hours 374.0 558.0 589.0
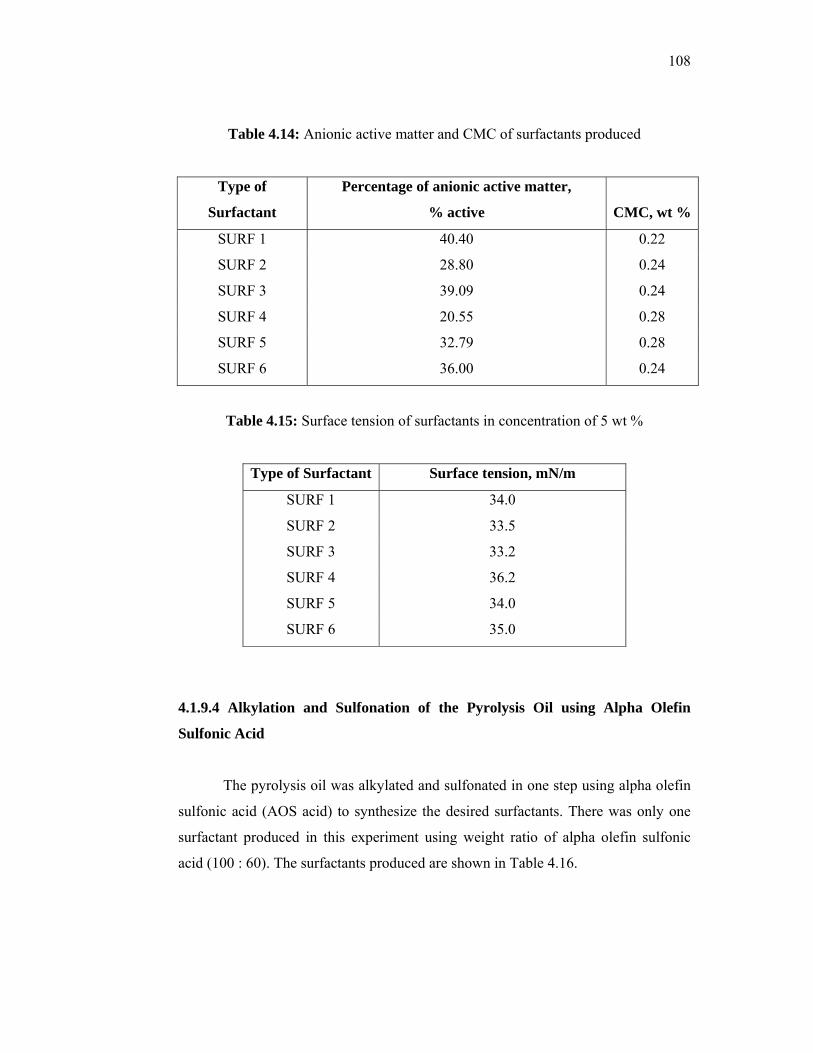
108
Table 4.14: Anionic active matter and CMC of surfactants produced
Type of
Surfactant
Percentage of anionic active matter,
% active CMC, wt %
SURF 1 40.40 0.22
SURF 2 28.80 0.24
SURF 3 39.09 0.24
SURF 4 20.55 0.28
SURF 5 32.79 0.28
SURF 6 36.00 0.24
Table 4.15: Surface tension of surfactants in concentration of 5 wt %
Type of Surfactant Surface tension, mN/m
SURF 1 34.0
SURF 2 33.5
SURF 3 33.2
SURF 4 36.2
SURF 5 34.0
SURF 6 35.0
4.1.9.4 Alkylation and Sulfonation of the Pyrolysis Oil using Alpha Olefin
Sulfonic Acid
The pyrolysis oil was alkylated and sulfonated in one step using alpha olefin
sulfonic acid (AOS acid) to synthesize the desired surfactants. There was only one
surfactant produced in this experiment using weight ratio of alpha olefin sulfonic
acid (100 : 60). The surfactants produced are shown in Table 4.16.
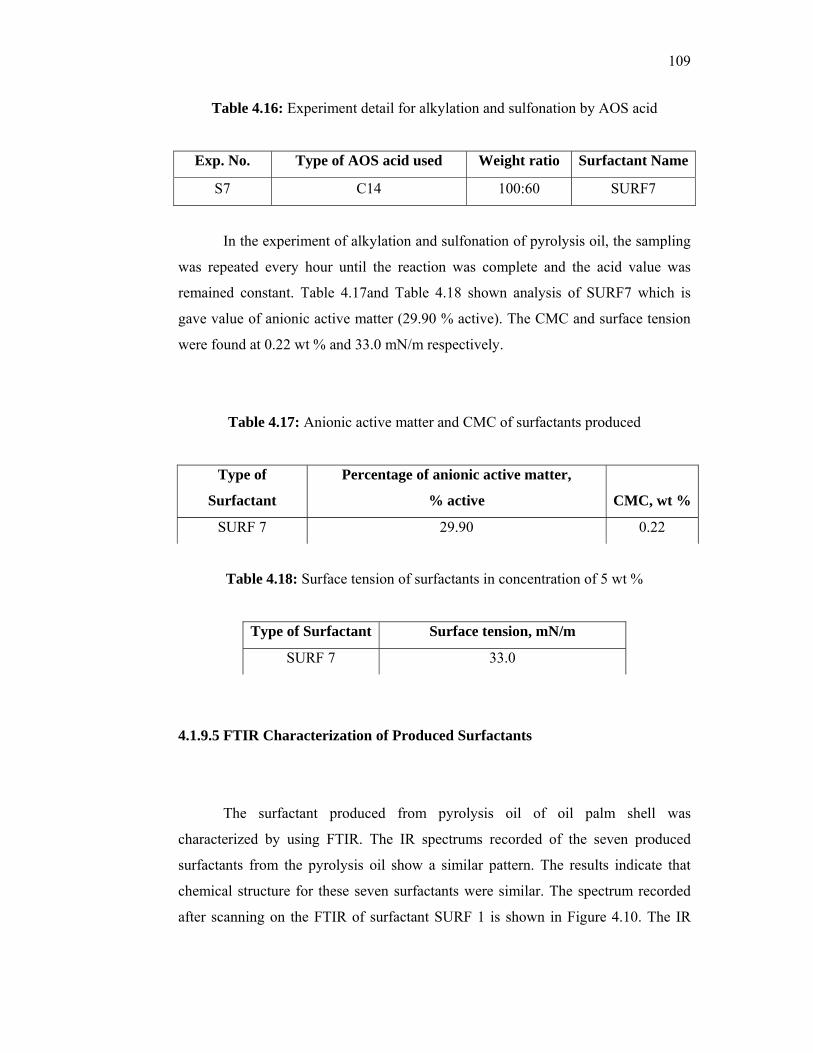
109
Table 4.16: Experiment detail for alkylation and sulfonation by AOS acid
Exp. No. Type of AOS acid used Weight ratio Surfactant Name
S7 C14 100:60 SURF7
In the experiment of alkylation and sulfonation of pyrolysis oil, the sampling
was repeated every hour until the reaction was complete and the acid value was
remained constant. Table 4.17and Table 4.18 shown analysis of SURF7 which is
gave value of anionic active matter (29.90 % active). The CMC and surface tension
were found at 0.22 wt % and 33.0 mN/m respectively.
Table 4.17: Anionic active matter and CMC of surfactants produced
Type of
Surfactant
Percentage of anionic active matter,
% active CMC, wt %
SURF 7 29.90 0.22
Table 4.18: Surface tension of surfactants in concentration of 5 wt %
Type of Surfactant Surface tension, mN/m
SURF 7 33.0
4.1.9.5 FTIR Characterization of Produced Surfactants
The surfactant produced from pyrolysis oil of oil palm shell was
characterized by using FTIR. The IR spectrums recorded of the seven produced
surfactants from the pyrolysis oil show a similar pattern. The results indicate that
chemical structure for these seven surfactants were similar. The spectrum recorded
after scanning on the FTIR of surfactant SURF 1 is shown in Figure 4.10. The IR
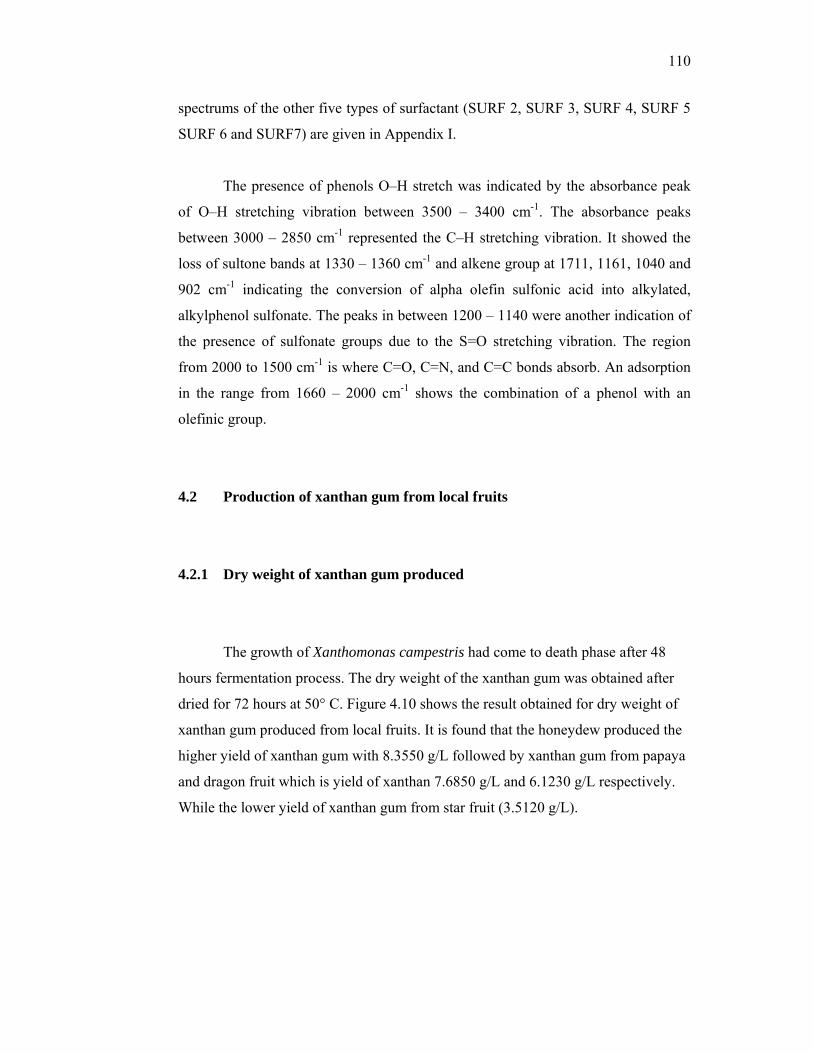
110
spectrums of the other five types of surfactant (SURF 2, SURF 3, SURF 4, SURF 5
SURF 6 and SURF7) are given in Appendix I.
The presence of phenols O–H stretch was indicated by the absorbance peak
of O–H stretching vibration between 3500 – 3400 cm-1. The absorbance peaks
between 3000 – 2850 cm-1 represented the C–H stretching vibration. It showed the
loss of sultone bands at 1330 – 1360 cm-1 and alkene group at 1711, 1161, 1040 and
902 cm-1 indicating the conversion of alpha olefin sulfonic acid into alkylated,
alkylphenol sulfonate. The peaks in between 1200 – 1140 were another indication of
the presence of sulfonate groups due to the S=O stretching vibration. The region
from 2000 to 1500 cm-1 is where C=O, C=N, and C=C bonds absorb. An adsorption
in the range from 1660 – 2000 cm-1 shows the combination of a phenol with an
olefinic group.
4.2 Production of xanthan gum from local fruits
4.2.1 Dry weight of xanthan gum produced
The growth of Xanthomonas campestris had come to death phase after 48
hours fermentation process. The dry weight of the xanthan gum was obtained after
dried for 72 hours at 50° C. Figure 4.10 shows the result obtained for dry weight of
xanthan gum produced from local fruits. It is found that the honeydew produced the
higher yield of xanthan gum with 8.3550 g/L followed by xanthan gum from papaya
and dragon fruit which is yield of xanthan 7.6850 g/L and 6.1230 g/L respectively.
While the lower yield of xanthan gum from star fruit (3.5120 g/L).
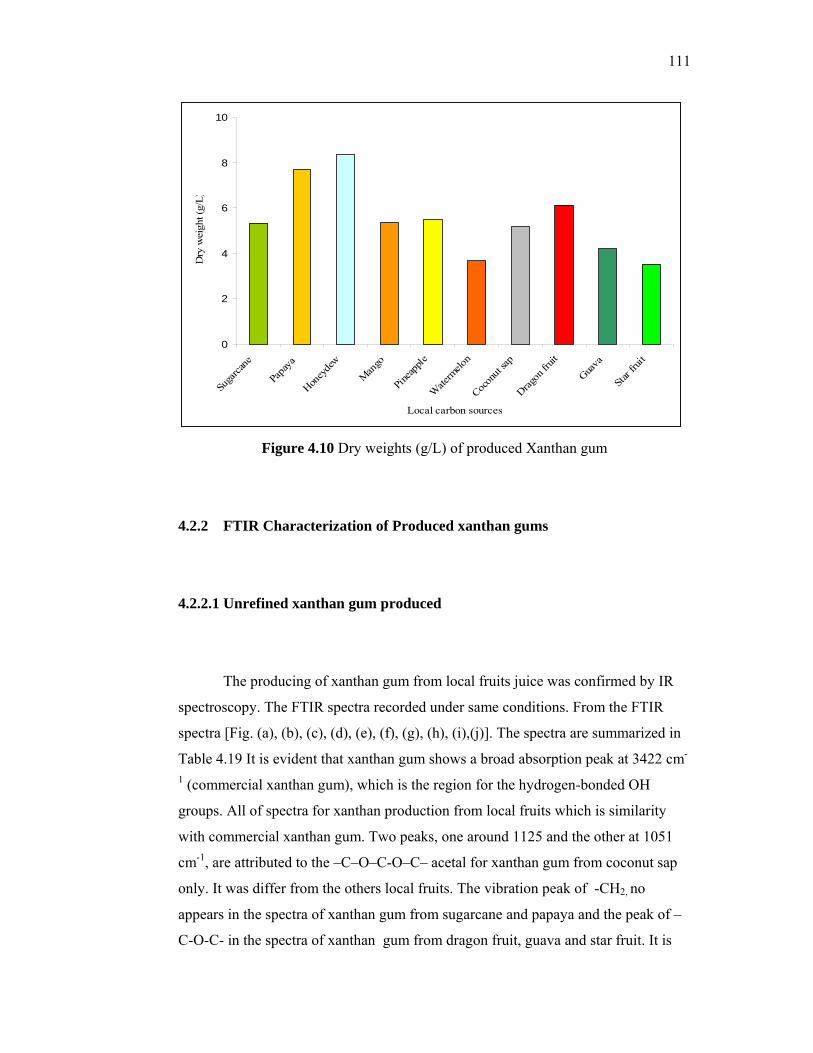
111
0
2
4
6
8
10
Suga
rcane
Papa
ya
Honey
dew
Mango
Pineap
ple
Wate
rmelo
n
Cocon
ut sap
Dragon
fruit
Guava
Star f
ruit
Local carbon sources
Dry
wei
ght (
g/L)
Figure 4.10 Dry weights (g/L) of produced Xanthan gum
4.2.2 FTIR Characterization of Produced xanthan gums
4.2.2.1 Unrefined xanthan gum produced
The producing of xanthan gum from local fruits juice was confirmed by IR
spectroscopy. The FTIR spectra recorded under same conditions. From the FTIR
spectra [Fig. (a), (b), (c), (d), (e), (f), (g), (h), (i),(j)]. The spectra are summarized in
Table 4.19 It is evident that xanthan gum shows a broad absorption peak at 3422 cm-
1 (commercial xanthan gum), which is the region for the hydrogen-bonded OH
groups. All of spectra for xanthan production from local fruits which is similarity
with commercial xanthan gum. Two peaks, one around 1125 and the other at 1051
cm-1, are attributed to the –C–O–C-O–C– acetal for xanthan gum from coconut sap
only. It was differ from the others local fruits. The vibration peak of -CH2, no
appears in the spectra of xanthan gum from sugarcane and papaya and the peak of –
C-O-C- in the spectra of xanthan gum from dragon fruit, guava and star fruit. It is
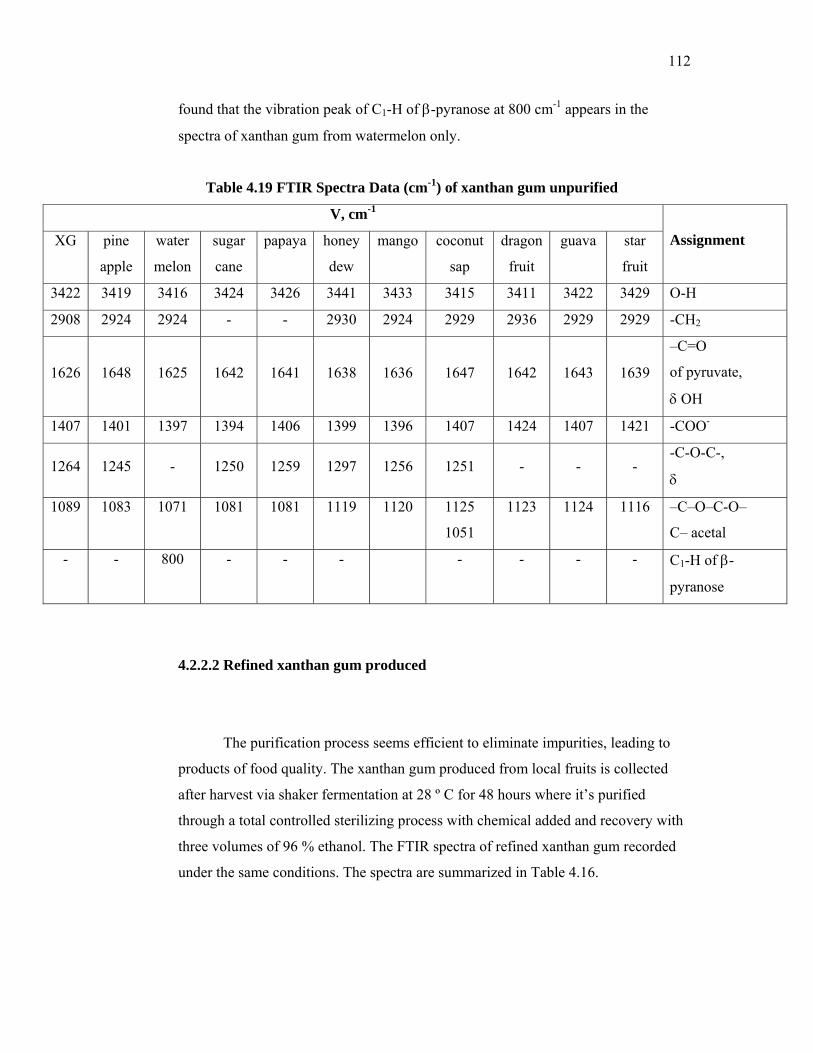
112
found that the vibration peak of C1-H of β-pyranose at 800 cm-1 appears in the
spectra of xanthan gum from watermelon only.
Table 4.19 FTIR Spectra Data (cm-1) of xanthan gum unpurified
V, cm-1
XG pine
apple
water
melon
sugar
cane
papaya honey
dew
mango coconut
sap
dragon
fruit
guava star
fruit
Assignment
3422 3419 3416 3424 3426 3441 3433 3415 3411 3422 3429 O-H
2908 2924 2924 - - 2930 2924 2929 2936 2929 2929 -CH2
1626 1648 1625 1642 1641 1638 1636 1647 1642 1643 1639
–C=O
of pyruvate,
δ OH
1407 1401 1397 1394 1406 1399 1396 1407 1424 1407 1421 -COO-
1264 1245 - 1250 1259 1297 1256 1251 - - - -C-O-C-,
δ
1089 1083 1071 1081 1081 1119 1120 1125
1051
1123 1124 1116 –C–O–C-O–
C– acetal
- - 800 - - - - - - - C1-H of β-
pyranose
4.2.2.2 Refined xanthan gum produced
The purification process seems efficient to eliminate impurities, leading to
products of food quality. The xanthan gum produced from local fruits is collected
after harvest via shaker fermentation at 28 º C for 48 hours where it’s purified
through a total controlled sterilizing process with chemical added and recovery with
three volumes of 96 % ethanol. The FTIR spectra of refined xanthan gum recorded
under the same conditions. The spectra are summarized in Table 4.16.
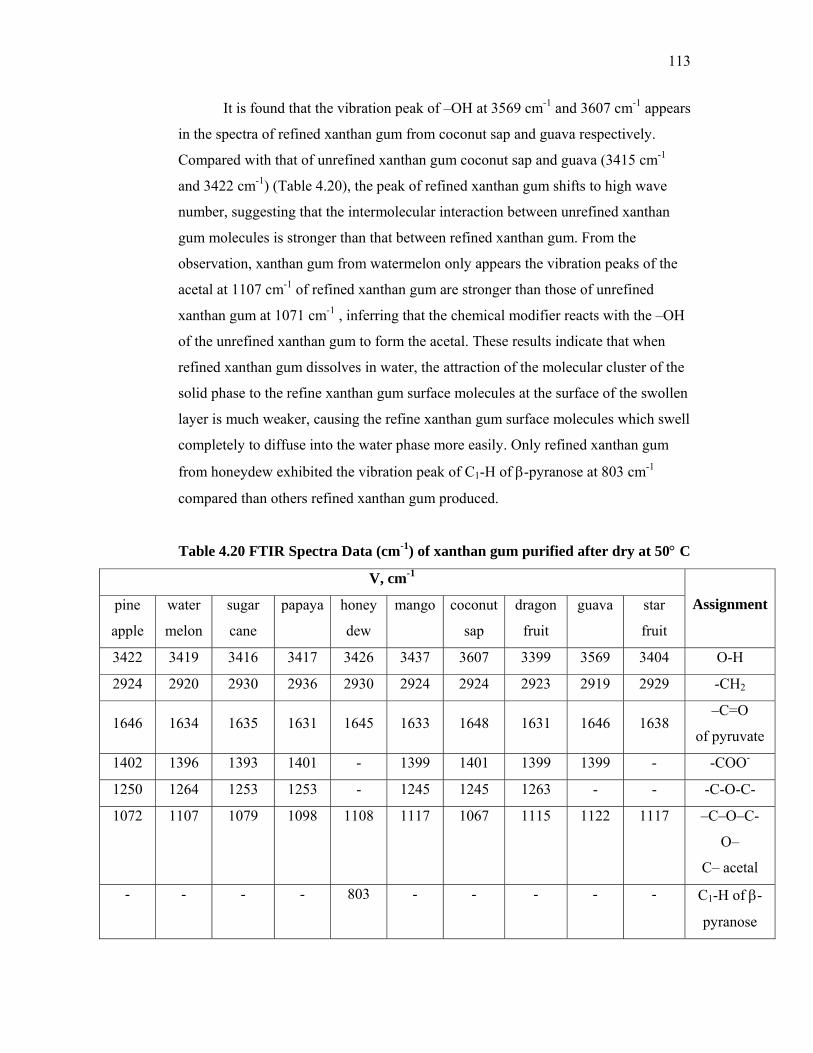
113
It is found that the vibration peak of –OH at 3569 cm-1 and 3607 cm-1 appears
in the spectra of refined xanthan gum from coconut sap and guava respectively.
Compared with that of unrefined xanthan gum coconut sap and guava (3415 cm-1
and 3422 cm-1) (Table 4.20), the peak of refined xanthan gum shifts to high wave
number, suggesting that the intermolecular interaction between unrefined xanthan
gum molecules is stronger than that between refined xanthan gum. From the
observation, xanthan gum from watermelon only appears the vibration peaks of the
acetal at 1107 cm-1 of refined xanthan gum are stronger than those of unrefined
xanthan gum at 1071 cm-1 , inferring that the chemical modifier reacts with the –OH
of the unrefined xanthan gum to form the acetal. These results indicate that when
refined xanthan gum dissolves in water, the attraction of the molecular cluster of the
solid phase to the refine xanthan gum surface molecules at the surface of the swollen
layer is much weaker, causing the refine xanthan gum surface molecules which swell
completely to diffuse into the water phase more easily. Only refined xanthan gum
from honeydew exhibited the vibration peak of C1-H of β-pyranose at 803 cm-1
compared than others refined xanthan gum produced.
Table 4.20 FTIR Spectra Data (cm-1) of xanthan gum purified after dry at 50° C
V, cm-1
pine
apple
water
melon
sugar
cane
papaya honey
dew
mango coconut
sap
dragon
fruit
guava star
fruit
Assignment
3422 3419 3416 3417 3426 3437 3607 3399 3569 3404 O-H
2924 2920 2930 2936 2930 2924 2924 2923 2919 2929 -CH2
1646 1634 1635 1631 1645 1633 1648 1631 1646 1638 –C=O
of pyruvate
1402 1396 1393 1401 - 1399 1401 1399 1399 - -COO-
1250 1264 1253 1253 - 1245 1245 1263 - - -C-O-C-
1072 1107 1079 1098 1108 1117 1067 1115 1122 1117 –C–O–C-
O–
C– acetal
- - - - 803 - - - - - C1-H of β-
pyranose
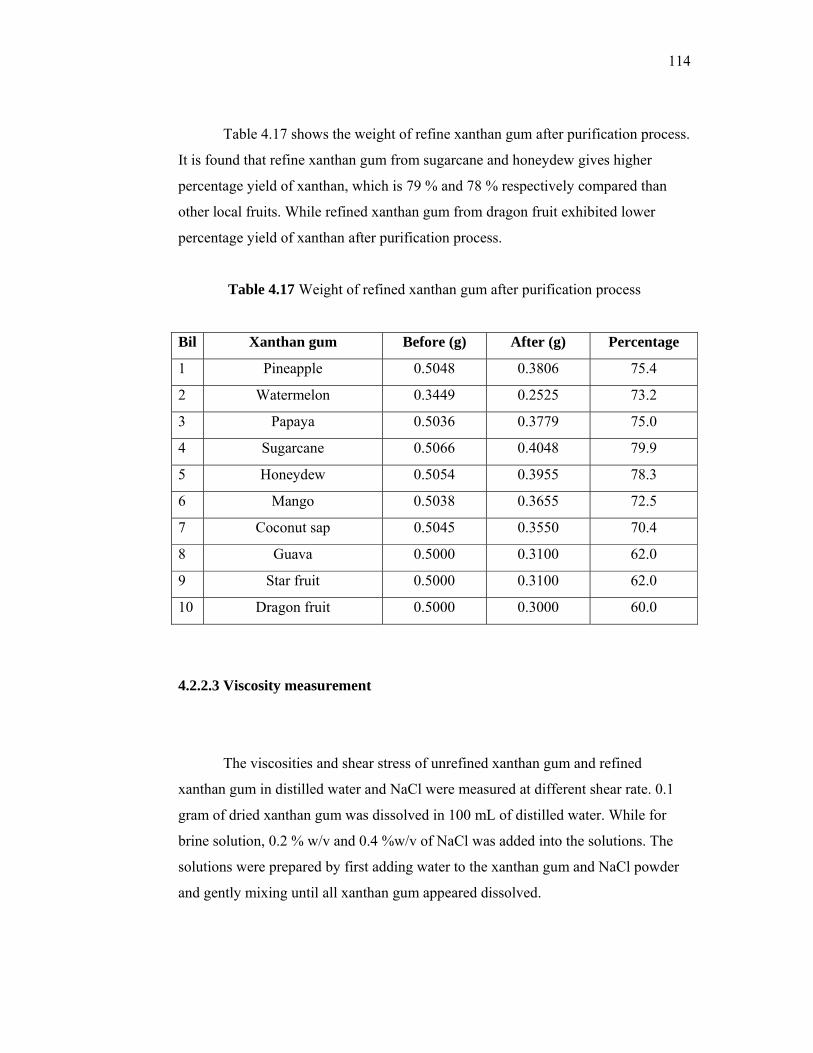
114
Table 4.17 shows the weight of refine xanthan gum after purification process.
It is found that refine xanthan gum from sugarcane and honeydew gives higher
percentage yield of xanthan, which is 79 % and 78 % respectively compared than
other local fruits. While refined xanthan gum from dragon fruit exhibited lower
percentage yield of xanthan after purification process.
Table 4.17 Weight of refined xanthan gum after purification process
Bil Xanthan gum Before (g) After (g) Percentage
1 Pineapple 0.5048 0.3806 75.4
2 Watermelon 0.3449 0.2525 73.2
3 Papaya 0.5036 0.3779 75.0
4 Sugarcane 0.5066 0.4048 79.9
5 Honeydew 0.5054 0.3955 78.3
6 Mango 0.5038 0.3655 72.5
7 Coconut sap 0.5045 0.3550 70.4
8 Guava 0.5000 0.3100 62.0
9 Star fruit 0.5000 0.3100 62.0
10 Dragon fruit 0.5000 0.3000 60.0
4.2.2.3 Viscosity measurement
The viscosities and shear stress of unrefined xanthan gum and refined
xanthan gum in distilled water and NaCl were measured at different shear rate. 0.1
gram of dried xanthan gum was dissolved in 100 mL of distilled water. While for
brine solution, 0.2 % w/v and 0.4 %w/v of NaCl was added into the solutions. The
solutions were prepared by first adding water to the xanthan gum and NaCl powder
and gently mixing until all xanthan gum appeared dissolved.
115
The result of the viscosities and shear stress measurement indicates that the
unrefined xanthan gum from local fruits more viscous than commercial xanthan gum
at room temperature (Figure 4.11 and 4.12) . This shows that unrefined xanthan gum
contributed to a better characteristic compared commercial xanthan gum. The
difference characteristic may due by dissimilarity content of sucrose, glucose and
others. Local fruits juice sources contain polysaccharide and disaccharide and need
to hydrolyze to become monosaccharide for metabolism process in order to grow.
When the demand of glucose for the metabolism process is fulfilled, the microbe
will transform the remaining starches into xanthan gum as energy storage. Thus, it
can be noticed that the substrates used would affect the properties and the structure
of the produced biopolymer.
The comparison of the unrefined xanthan gum in 0.2 % w/v and 0.4 % w/v
NaCl, the viscosities and shear stress was shown as Figure 4.13, 4.14, 4.15 and 4.16.
Meanwhile refined xanthan gum in 0.2 % w/v and 0.4 % w/v of NaCl, for their
viscosities and shear stress was shown in Figure 4.17, 4.18, 4.19 and 4.20. In general,
unrefined xanthan gum and refined xanthan gum in 0.2 % w/v of NaCl was higher
compared than 0.4 % w/v of NaCl. Conversely it does not show significant
difference for their viscosities and shear stress at any time.
The viscosities and shear stress of refined xanthan gum solutions from all of
local fruits was higher than that of unrefined xanthan gum in distilled water and
NaCl at any time as shown in Figure. It was also found that the refined xanthan gum
dispersed very rapidly to give lump free solution.

116
0.0
20.0
40.0
60.0
80.0
0.1 1.0 10.0 100.0 1000.0
Shear rate (S-1)
App
aren
t Visc
osity
(Cp)
commercial pineapple watermelon sugarcane honeydew papayamango coconut sap guava starfruit dragonfruit
Figure 4.11 Comparison viscosity graph for xanthan gum commercial and unrefined
in distilled water (DW)
0.00
1.00
2.00
3.00
4.00
5.00
6.00
7.00
8.00
0.0 20.0 40.0 60.0 80.0 100.0 120.0 140.0
Shear rate (S-1)
Shea
r stre
ss(D
/cm
2 )
commercial pineapple watermelon sugarcane honeydew papaya mango
coconut sap guava starfruit dragonfruit
Figure 4.12 Comparison shear stress graph for xanthan gum commercial
and unrefined xanthan gum in distilled water (DW)
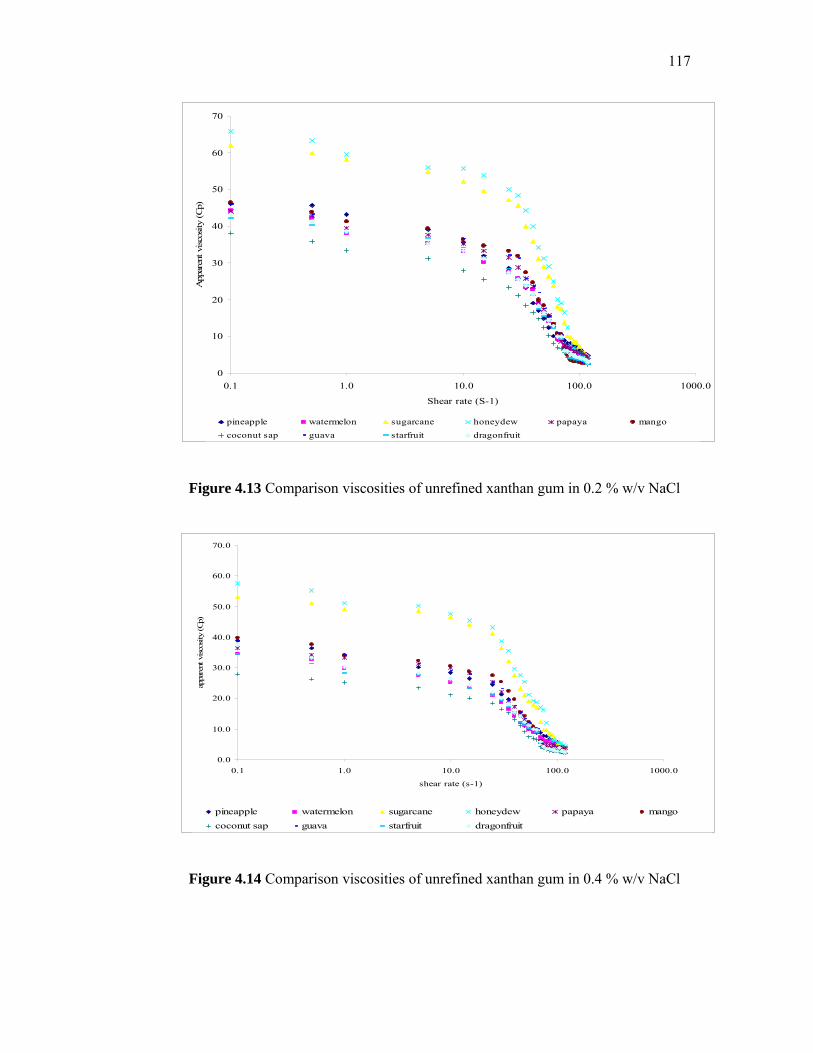
117
0
10
20
30
40
50
60
70
0.1 1.0 10.0 100.0 1000.0
Shear rate (S-1)
App
aren
t visc
osity
(Cp)
pineapple watermelon sugarcane honeydew papaya mangococonut sap guava starfruit dragonfruit
Figure 4.13 Comparison viscosities of unrefined xanthan gum in 0.2 % w/v NaCl
0.0
10.0
20.0
30.0
40.0
50.0
60.0
70.0
0.1 1.0 10.0 100.0 1000.0
shear rate (s-1)
appa
rent
visc
osity
(Cp)
pineapple watermelon sugarcane honeydew papaya mangococonut sap guava starfruit dragonfruit
Figure 4.14 Comparison viscosities of unrefined xanthan gum in 0.4 % w/v NaCl
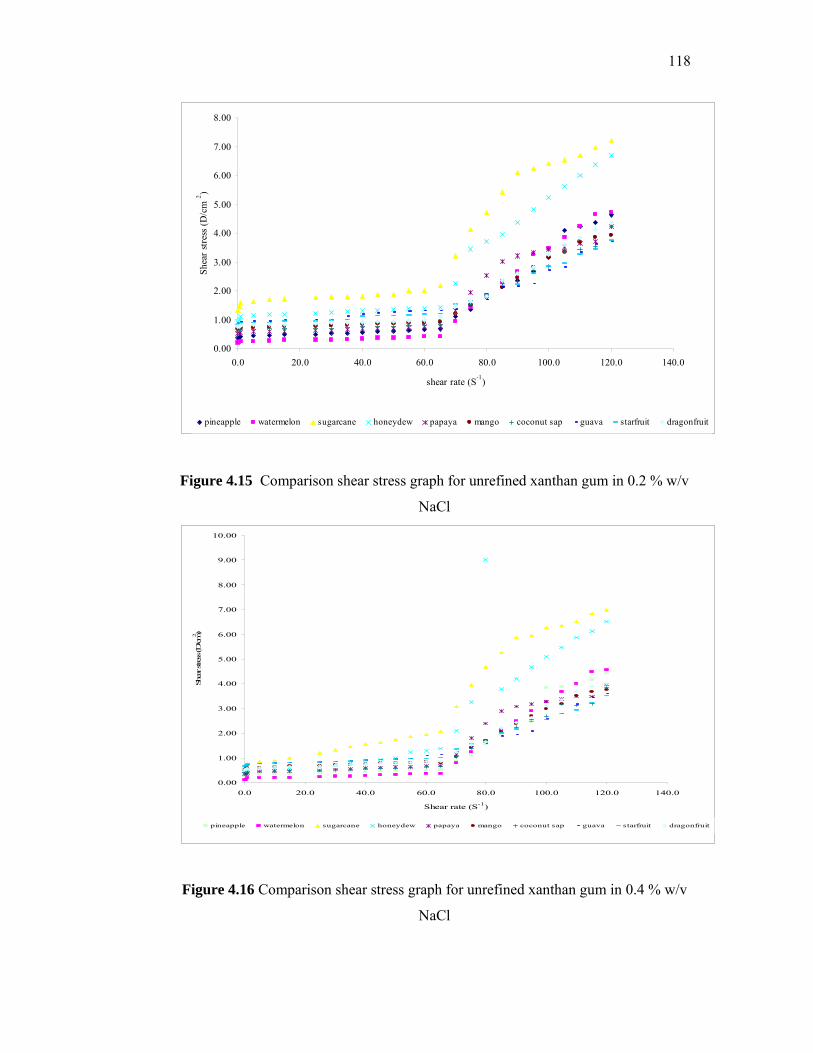
118
0.00
1.00
2.00
3.00
4.00
5.00
6.00
7.00
8.00
0.0 20.0 40.0 60.0 80.0 100.0 120.0 140.0
shear rate (S-1)
Shea
r stre
ss (D
/cm
2 )
pineapple watermelon sugarcane honeydew papaya mango coconut sap guava starfruit dragonfruit
Figure 4.15 Comparison shear stress graph for unrefined xanthan gum in 0.2 % w/v
NaCl
0.00
1.00
2.00
3.00
4.00
5.00
6.00
7.00
8.00
9.00
10.00
0.0 20.0 40.0 60.0 80.0 100.0 120.0 140.0
Shear rate (S-1)
Shea
r stre
ss (D
/cm2 )
pineapple watermelon sugarcane honeydew papaya mango coconut sap guava starfruit dragonfruit
Figure 4.16 Comparison shear stress graph for unrefined xanthan gum in 0.4 % w/v
NaCl
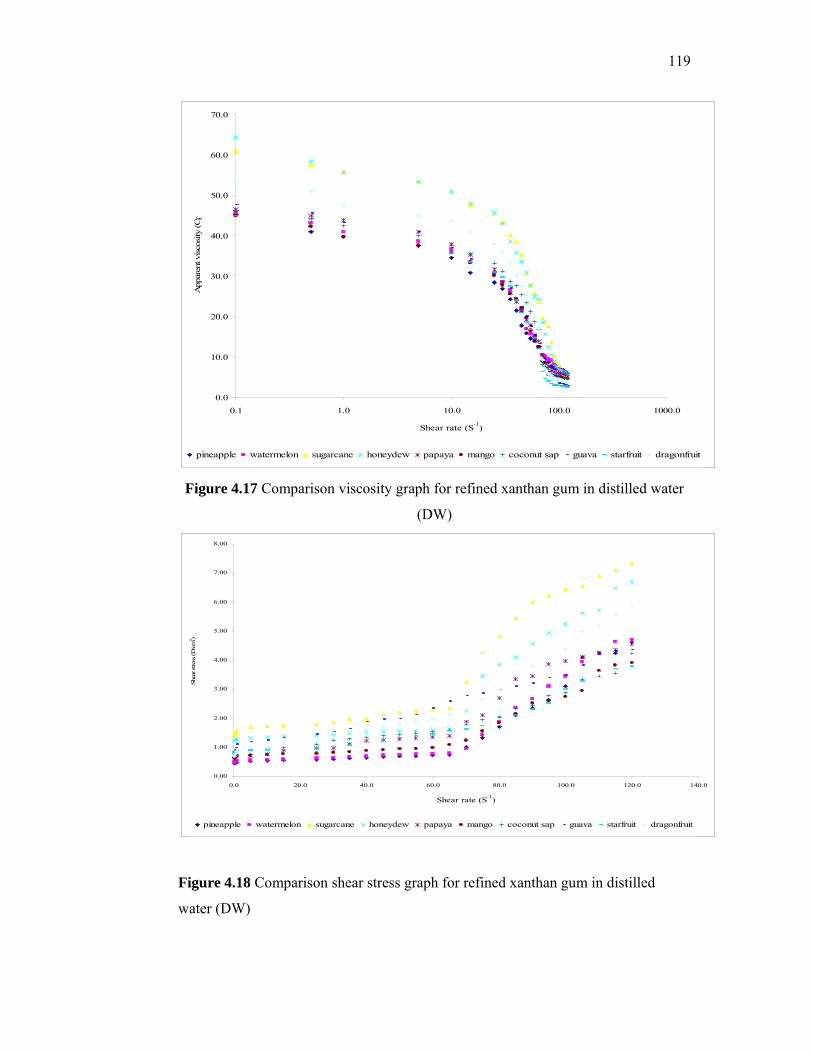
119
0.0
10.0
20.0
30.0
40.0
50.0
60.0
70.0
0.1 1.0 10.0 100.0 1000.0
Shear rate (S-1)
App
aren
t vis
cosi
ty (C
p
pineapple watermelon sugarcane honeydew papaya mango coconut sap guava starfruit dragonfruit
Figure 4.17 Comparison viscosity graph for refined xanthan gum in distilled water
(DW)
0.00
1.00
2.00
3.00
4.00
5.00
6.00
7.00
8.00
0.0 20.0 40.0 60.0 80.0 100.0 120.0 140.0
Shear rate (S-1)
Shea
r stre
ss (D
/cm
2 )
pineapple watermelon sugarcane honeydew papaya mango coconut sap guava starfruit dragonfruit
Figure 4.18 Comparison shear stress graph for refined xanthan gum in distilled
water (DW)
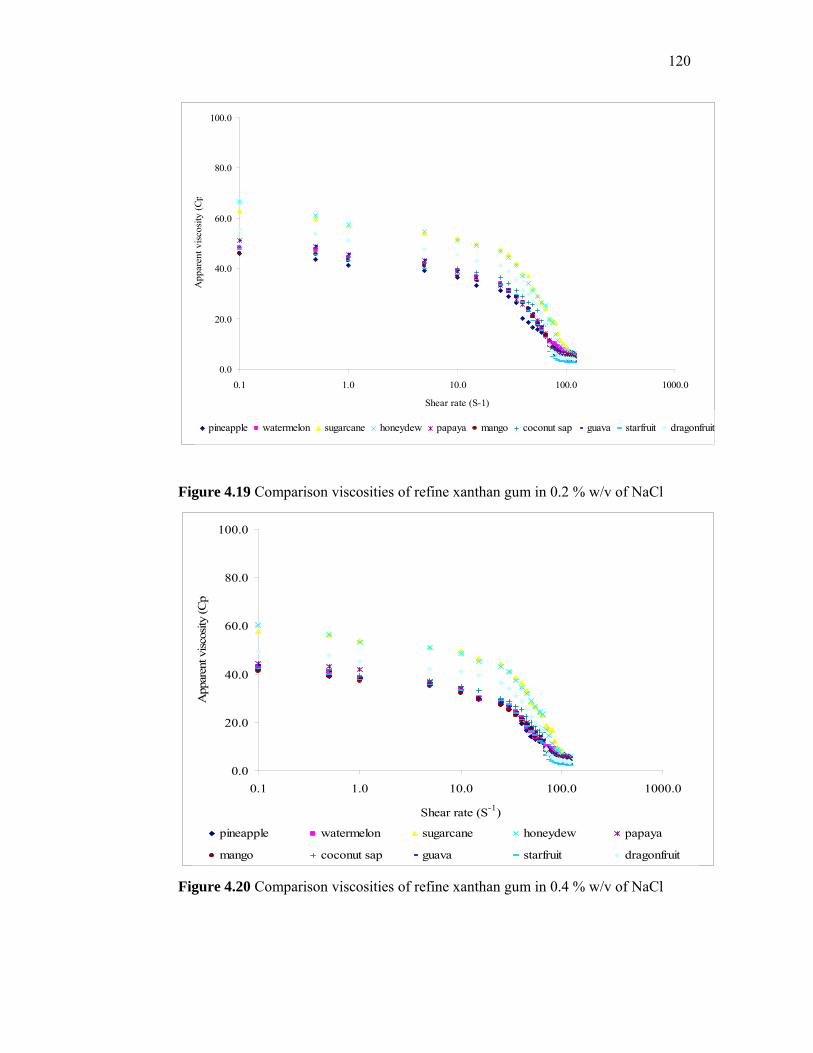
120
0.0
20.0
40.0
60.0
80.0
100.0
0.1 1.0 10.0 100.0 1000.0
Shear rate (S-1)
App
aren
t vis
cosi
ty (C
p
pineapple watermelon sugarcane honeydew papaya mango coconut sap guava starfruit dragonfruit
Figure 4.19 Comparison viscosities of refine xanthan gum in 0.2 % w/v of NaCl
0.0
20.0
40.0
60.0
80.0
100.0
0.1 1.0 10.0 100.0 1000.0
Shear rate (S-1)
App
aren
t visc
osity
(Cp)
pineapple watermelon sugarcane honeydew papaya
mango coconut sap guava starfruit dragonfruit
Figure 4.20 Comparison viscosities of refine xanthan gum in 0.4 % w/v of NaCl
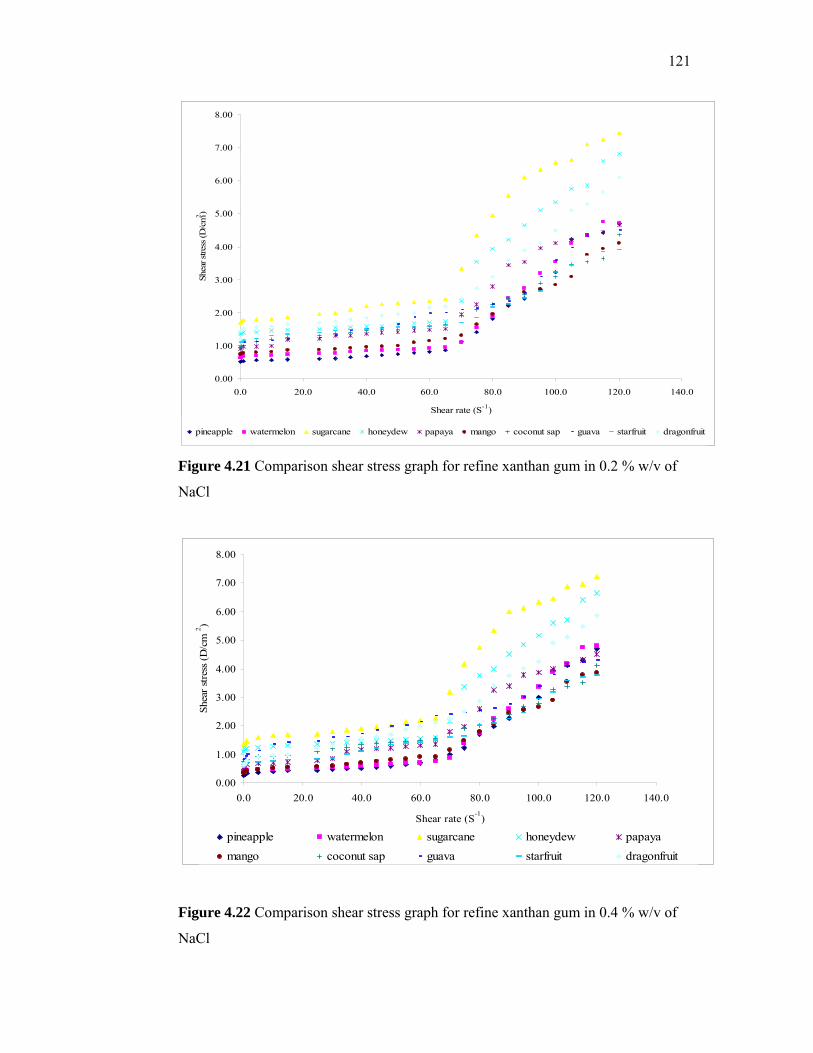
121
0.00
1.00
2.00
3.00
4.00
5.00
6.00
7.00
8.00
0.0 20.0 40.0 60.0 80.0 100.0 120.0 140.0
Shear rate (S-1)
Shea
r stre
ss (D
/cm2 )
pineapple watermelon sugarcane honeydew papaya mango coconut sap guava starfruit dragonfruit
Figure 4.21 Comparison shear stress graph for refine xanthan gum in 0.2 % w/v of
NaCl
0.00
1.00
2.00
3.00
4.00
5.00
6.00
7.00
8.00
0.0 20.0 40.0 60.0 80.0 100.0 120.0 140.0
Shear rate (S-1)
Shea
r stre
ss (D
/cm
2 )
pineapple watermelon sugarcane honeydew papayamango coconut sap guava starfruit dragonfruit
Figure 4.22 Comparison shear stress graph for refine xanthan gum in 0.4 % w/v of
NaCl
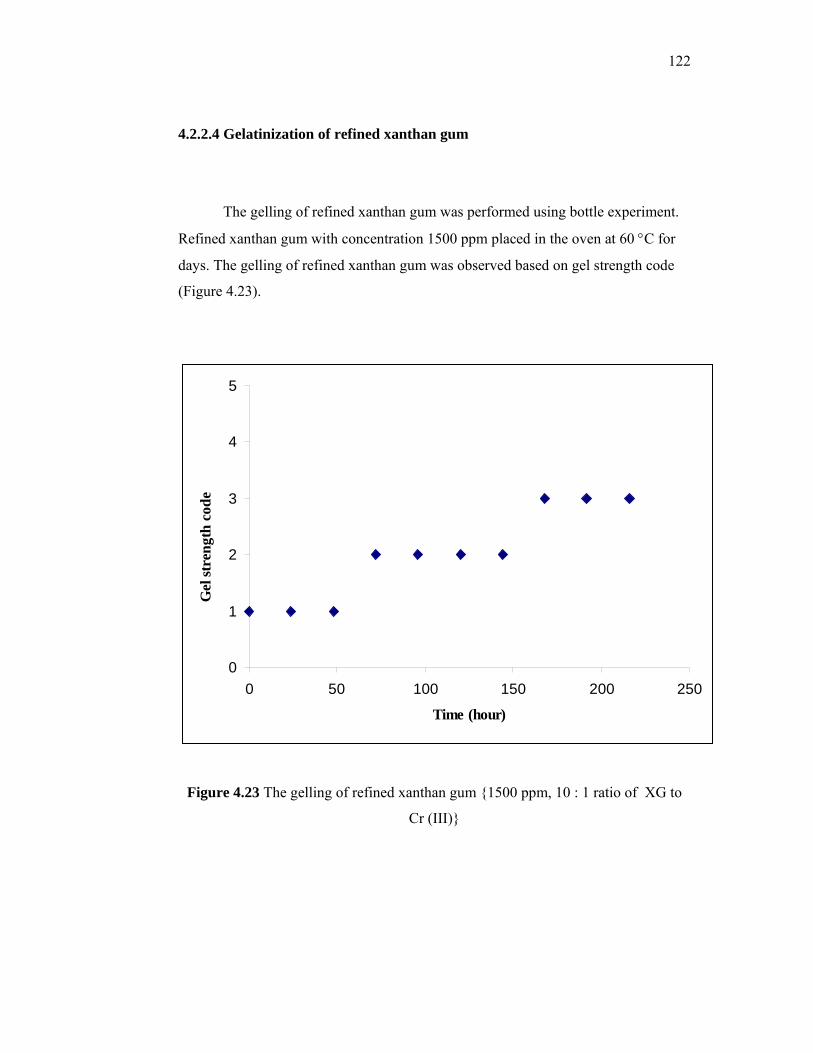
122
4.2.2.4 Gelatinization of refined xanthan gum
The gelling of refined xanthan gum was performed using bottle experiment.
Refined xanthan gum with concentration 1500 ppm placed in the oven at 60 °C for
days. The gelling of refined xanthan gum was observed based on gel strength code
(Figure 4.23).
0
1
2
3
4
5
0 50 100 150 200 250
Time (hour)
Gel
stre
ngth
cod
e
Figure 4.23 The gelling of refined xanthan gum {1500 ppm, 10 : 1 ratio of XG to
Cr (III)}
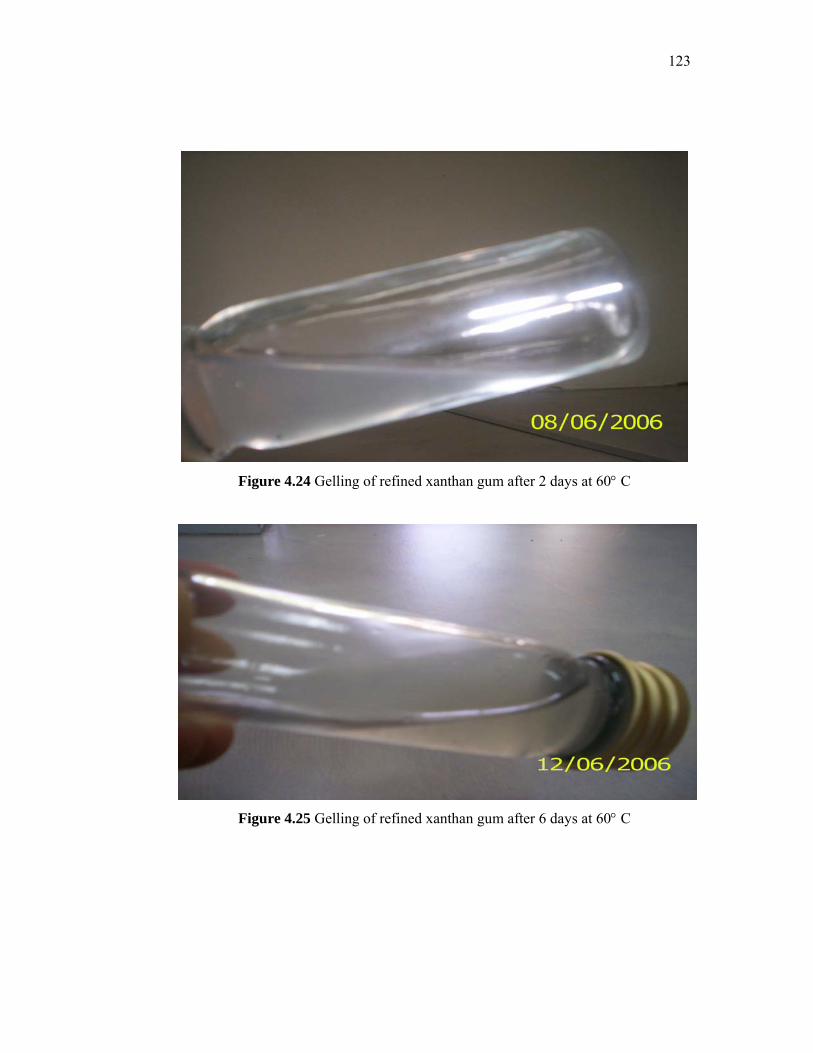
123
Figure 4.24 Gelling of refined xanthan gum after 2 days at 60° C
Figure 4.25 Gelling of refined xanthan gum after 6 days at 60° C
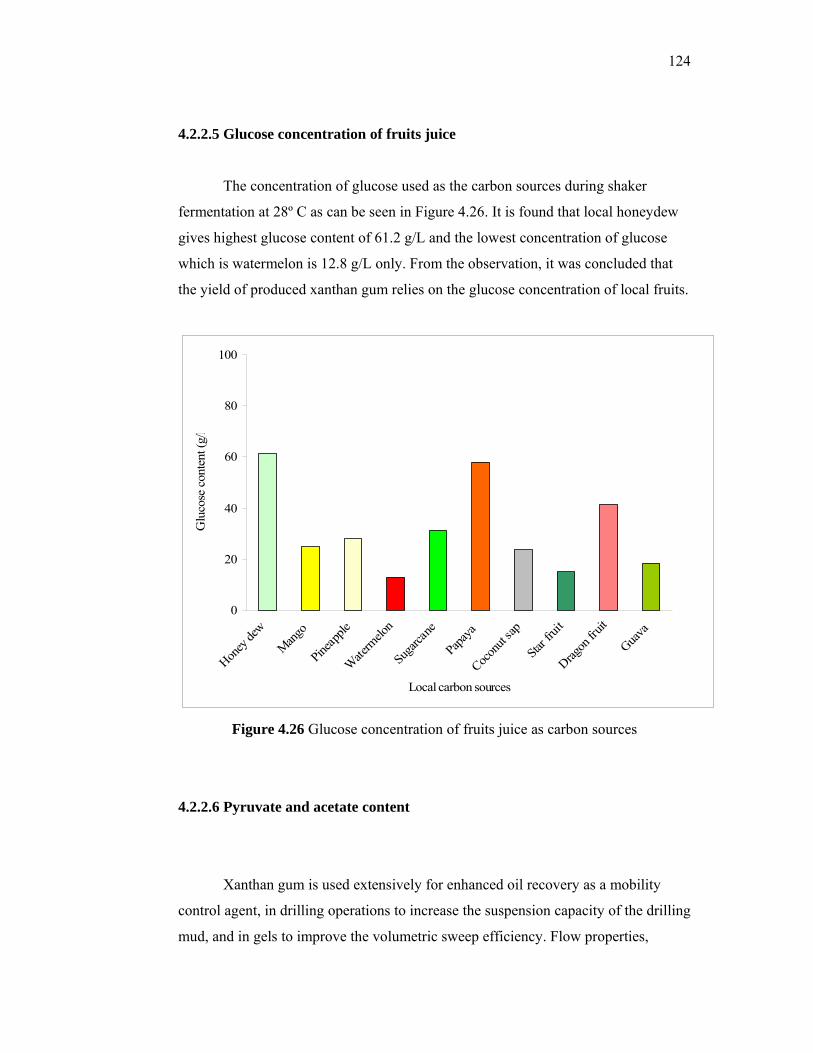
124
4.2.2.5 Glucose concentration of fruits juice
The concentration of glucose used as the carbon sources during shaker
fermentation at 28º C as can be seen in Figure 4.26. It is found that local honeydew
gives highest glucose content of 61.2 g/L and the lowest concentration of glucose
which is watermelon is 12.8 g/L only. From the observation, it was concluded that
the yield of produced xanthan gum relies on the glucose concentration of local fruits.
0
20
40
60
80
100
Honey
dew
Mango
Pinea
pple
Wate
rmelo
n
Suga
rcane
Papa
ya
Cocon
ut sap
Star f
ruit
Dragon
fruit
Guava
Local carbon sources
Glu
cose
con
tent
(g/L
Figure 4.26 Glucose concentration of fruits juice as carbon sources
4.2.2.6 Pyruvate and acetate content
Xanthan gum is used extensively for enhanced oil recovery as a mobility
control agent, in drilling operations to increase the suspension capacity of the drilling
mud, and in gels to improve the volumetric sweep efficiency. Flow properties,

125
injectivity, and adsorption characteristics depend on acetate and pyruvate content of
xanthan. The degree of pyruvilation and acetylation of xanthan gum was determined
using High Performance Liquid Chromatograpy (HPLC). There is no significant
difference in the acetate and pyruvate content of difference local carbon sources as
shown in Figure 4.27 and Figure 4.28 respectively. It shows that xanthan gum
produced from papaya and mango refined exhibited highest content of acetate with
0.07 g/mL. Meanwhile the lowest of acetate content which is xanthan gum produced
from pineapple and honeydew with 0.01 g/mL. It was similar with pyruvate content
from xanthan gum refined from local fruits. From the observation, xanthan gum
produced from sugarcane exhibited highest of pyruvate with 1.12 g/mL and followed
by xanthan gum produced from pineapple with 0.66 g/mL. While xanthan gum
produced from papaya exhibited lowest concentration of pyruvate with 0.45 g/mL.
0
0.02
0.04
0.06
0.08
0.1
Pineapple Watermelon Papaya Sugarcane Mango Honeydew
local carbon sources
Ace
tate
con
tent
(g/m
L)
Figure 4.27 Acetate content of 72 h xanthan samples from shaker fermentor
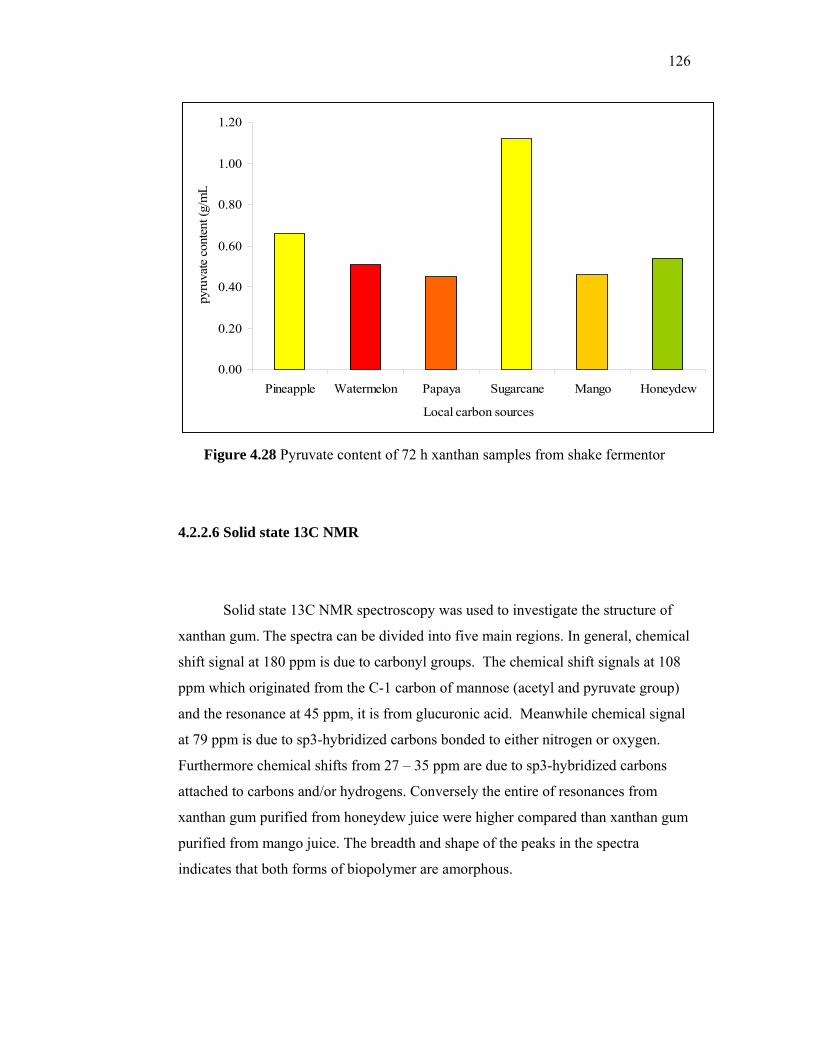
126
0.00
0.20
0.40
0.60
0.80
1.00
1.20
Pineapple Watermelon Papaya Sugarcane Mango Honeydew
Local carbon sources
pyru
vate
con
tent
(g/m
L
Figure 4.28 Pyruvate content of 72 h xanthan samples from shake fermentor
4.2.2.6 Solid state 13C NMR
Solid state 13C NMR spectroscopy was used to investigate the structure of
xanthan gum. The spectra can be divided into five main regions. In general, chemical
shift signal at 180 ppm is due to carbonyl groups. The chemical shift signals at 108
ppm which originated from the C-1 carbon of mannose (acetyl and pyruvate group)
and the resonance at 45 ppm, it is from glucuronic acid. Meanwhile chemical signal
at 79 ppm is due to sp3-hybridized carbons bonded to either nitrogen or oxygen.
Furthermore chemical shifts from 27 – 35 ppm are due to sp3-hybridized carbons
attached to carbons and/or hydrogens. Conversely the entire of resonances from
xanthan gum purified from honeydew juice were higher compared than xanthan gum
purified from mango juice. The breadth and shape of the peaks in the spectra
indicates that both forms of biopolymer are amorphous.
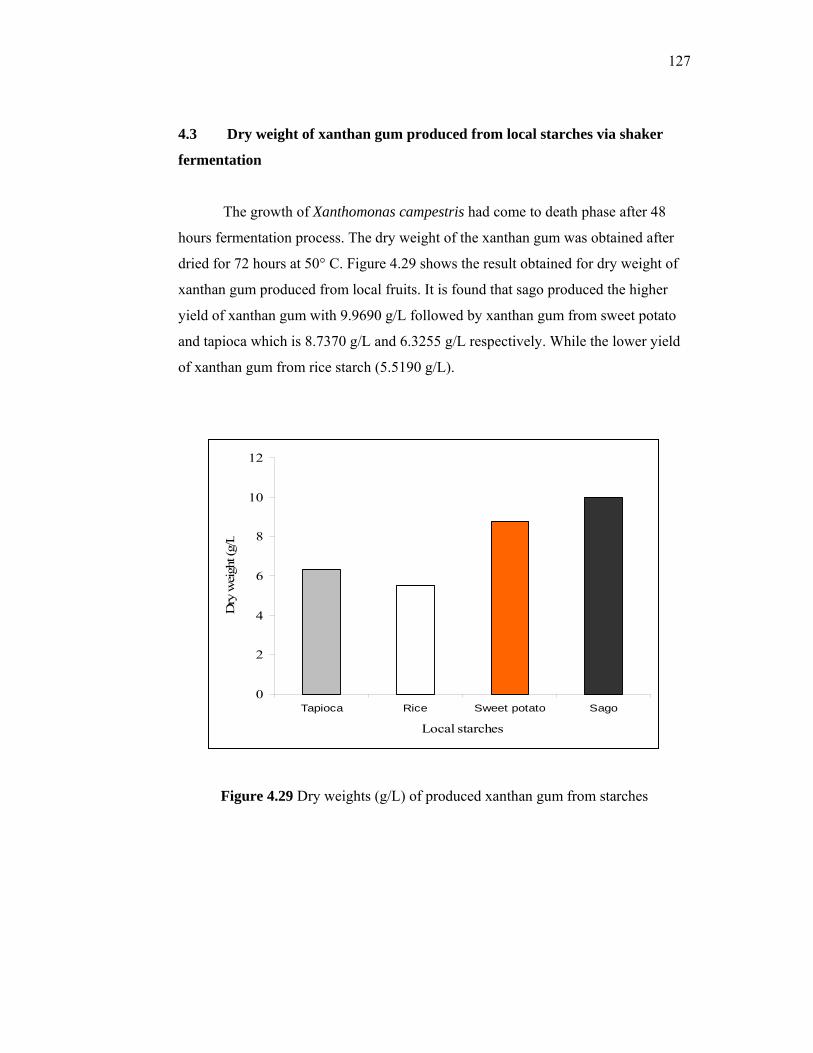
127
4.3 Dry weight of xanthan gum produced from local starches via shaker
fermentation
The growth of Xanthomonas campestris had come to death phase after 48
hours fermentation process. The dry weight of the xanthan gum was obtained after
dried for 72 hours at 50° C. Figure 4.29 shows the result obtained for dry weight of
xanthan gum produced from local fruits. It is found that sago produced the higher
yield of xanthan gum with 9.9690 g/L followed by xanthan gum from sweet potato
and tapioca which is 8.7370 g/L and 6.3255 g/L respectively. While the lower yield
of xanthan gum from rice starch (5.5190 g/L).
0
2
4
6
8
10
12
Tapioca Rice Sweet potato Sago
Local starches
Dry
wei
ght (
g/L
Figure 4.29 Dry weights (g/L) of produced xanthan gum from starches
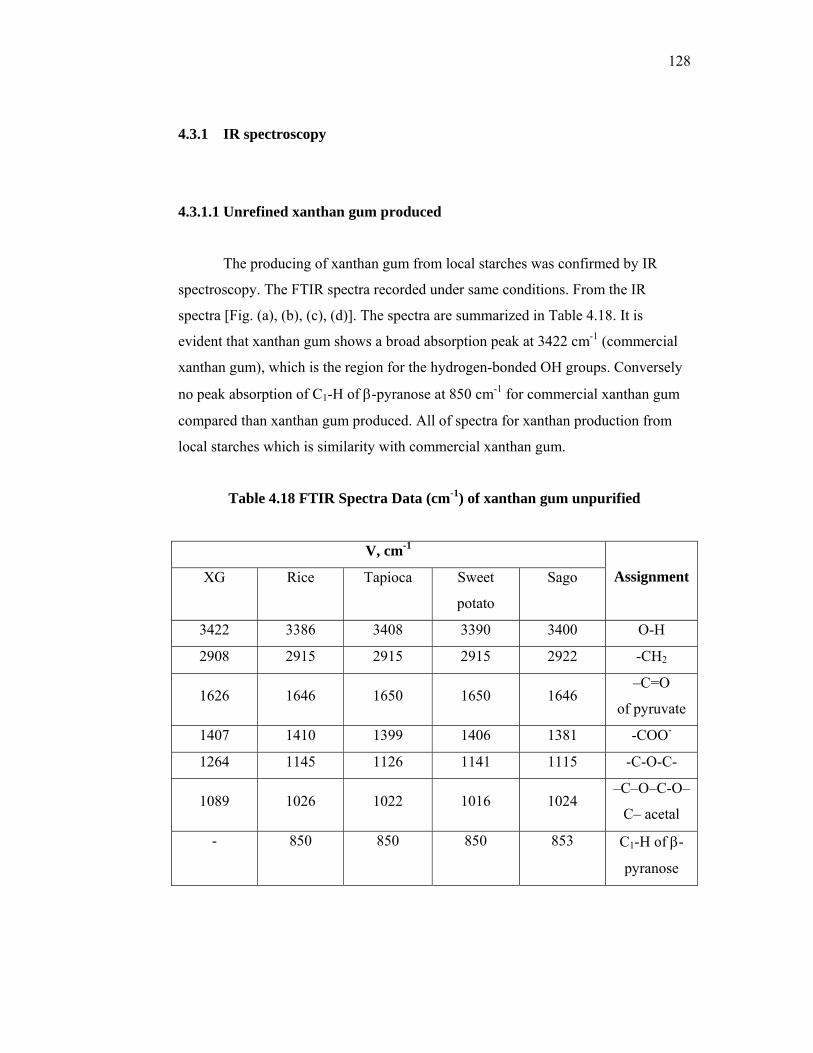
128
4.3.1 IR spectroscopy
4.3.1.1 Unrefined xanthan gum produced
The producing of xanthan gum from local starches was confirmed by IR
spectroscopy. The FTIR spectra recorded under same conditions. From the IR
spectra [Fig. (a), (b), (c), (d)]. The spectra are summarized in Table 4.18. It is
evident that xanthan gum shows a broad absorption peak at 3422 cm-1 (commercial
xanthan gum), which is the region for the hydrogen-bonded OH groups. Conversely
no peak absorption of C1-H of β-pyranose at 850 cm-1 for commercial xanthan gum
compared than xanthan gum produced. All of spectra for xanthan production from
local starches which is similarity with commercial xanthan gum.
Table 4.18 FTIR Spectra Data (cm-1) of xanthan gum unpurified
V, cm-1
XG Rice Tapioca Sweet
potato
Sago Assignment
3422 3386 3408 3390 3400 O-H
2908 2915 2915 2915 2922 -CH2
1626 1646 1650 1650 1646 –C=O
of pyruvate
1407 1410 1399 1406 1381 -COO-
1264 1145 1126 1141 1115 -C-O-C-
1089 1026 1022 1016 1024 –C–O–C-O–
C– acetal
- 850 850 850 853 C1-H of β-
pyranose
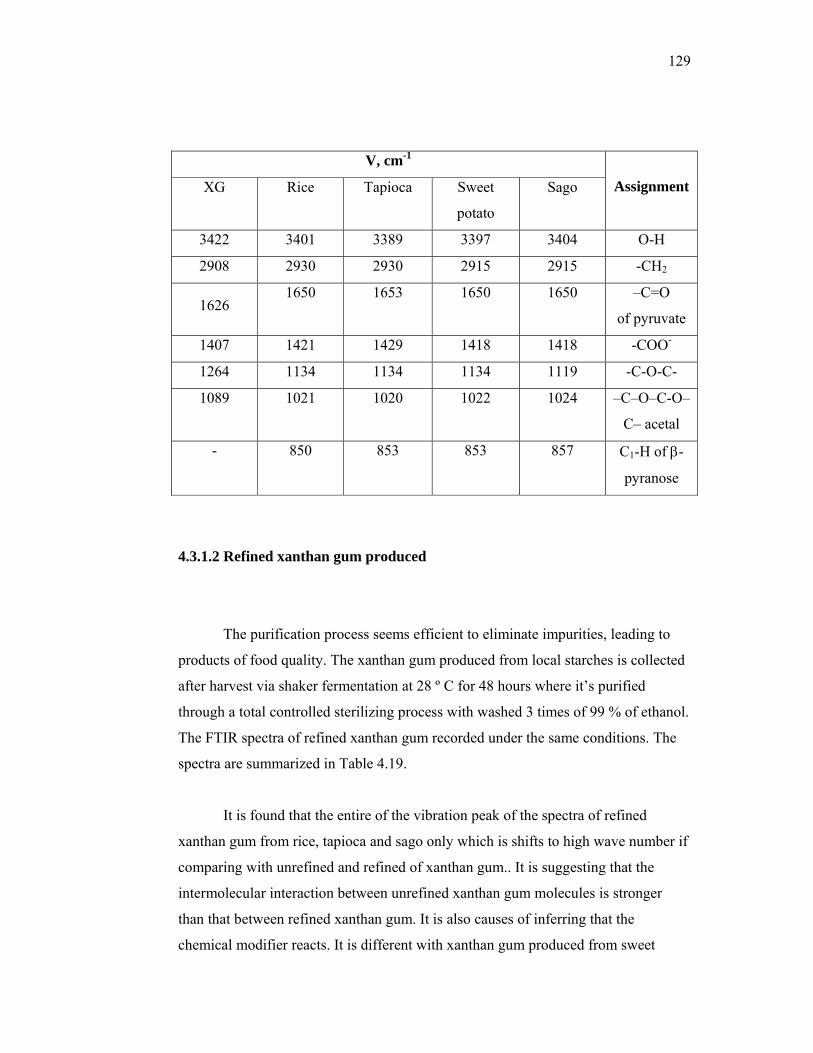
129
V, cm-1
XG Rice Tapioca Sweet
potato
Sago Assignment
3422 3401 3389 3397 3404 O-H
2908 2930 2930 2915 2915 -CH2
1626 1650 1653 1650 1650 –C=O
of pyruvate
1407 1421 1429 1418 1418 -COO-
1264 1134 1134 1134 1119 -C-O-C-
1089 1021 1020 1022 1024 –C–O–C-O–
C– acetal
- 850 853 853 857 C1-H of β-
pyranose
4.3.1.2 Refined xanthan gum produced
The purification process seems efficient to eliminate impurities, leading to
products of food quality. The xanthan gum produced from local starches is collected
after harvest via shaker fermentation at 28 º C for 48 hours where it’s purified
through a total controlled sterilizing process with washed 3 times of 99 % of ethanol.
The FTIR spectra of refined xanthan gum recorded under the same conditions. The
spectra are summarized in Table 4.19.
It is found that the entire of the vibration peak of the spectra of refined
xanthan gum from rice, tapioca and sago only which is shifts to high wave number if
comparing with unrefined and refined of xanthan gum.. It is suggesting that the
intermolecular interaction between unrefined xanthan gum molecules is stronger
than that between refined xanthan gum. It is also causes of inferring that the
chemical modifier reacts. It is different with xanthan gum produced from sweet
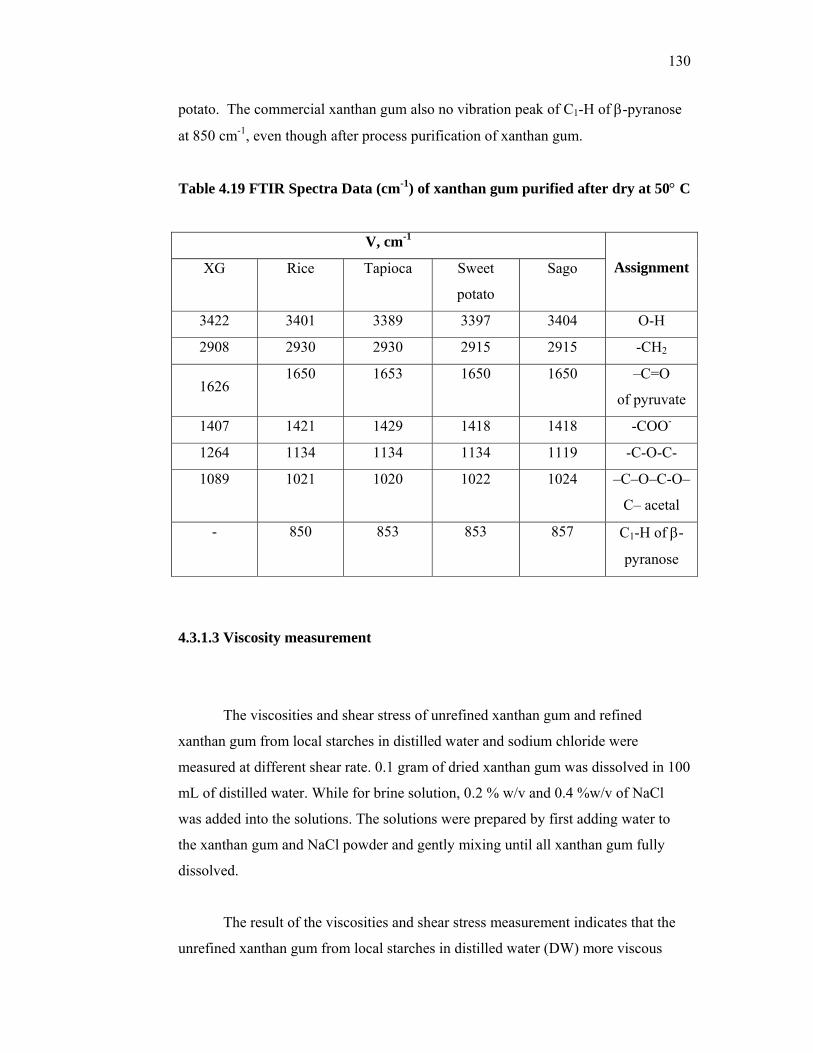
130
potato. The commercial xanthan gum also no vibration peak of C1-H of β-pyranose
at 850 cm-1, even though after process purification of xanthan gum.
Table 4.19 FTIR Spectra Data (cm-1) of xanthan gum purified after dry at 50° C
V, cm-1
XG Rice Tapioca Sweet
potato
Sago Assignment
3422 3401 3389 3397 3404 O-H
2908 2930 2930 2915 2915 -CH2
1626 1650 1653 1650 1650 –C=O
of pyruvate
1407 1421 1429 1418 1418 -COO-
1264 1134 1134 1134 1119 -C-O-C-
1089 1021 1020 1022 1024 –C–O–C-O–
C– acetal
- 850 853 853 857 C1-H of β-
pyranose
4.3.1.3 Viscosity measurement
The viscosities and shear stress of unrefined xanthan gum and refined
xanthan gum from local starches in distilled water and sodium chloride were
measured at different shear rate. 0.1 gram of dried xanthan gum was dissolved in 100
mL of distilled water. While for brine solution, 0.2 % w/v and 0.4 %w/v of NaCl
was added into the solutions. The solutions were prepared by first adding water to
the xanthan gum and NaCl powder and gently mixing until all xanthan gum fully
dissolved.
The result of the viscosities and shear stress measurement indicates that the
unrefined xanthan gum from local starches in distilled water (DW) more viscous

131
than commercial xanthan gum at room temperature (Figure 4.30 and 4.31) . This
shows that unrefined xanthan gum contributed to a better characteristic compared to
commercial of xanthan gum. The difference characteristic may due by dissimilarity
content of sucrose, glucose and others. Local starches sources contain
polysaccharide and disaccharide and need to hydrolyze to become monosaccharide
for metabolism process in order to grow. When the demand of glucose for the
metabolism process is fulfilled, the microbe will transform the remaining starches
into xanthan gum as energy storage. Thus, it can be noticed that the substrates used
would affect the properties and the structure of the produced biopolymer.
The comparison of the refined xanthan gum in between 0.2 % w/v and 0.4 %
w/v of NaCl, the viscosities and shear stress was shown as Figure 4.32, 4.33, 4.34
and 4.35 respectively. In general, refined xanthan gum in 0.2 % w/v of NaCl was
higher viscous compared than refined xanthan gum in distilled water (DW) and 0.4
% w/v of NaCl . Conversely it does not show significant differences for their
viscosities and shear stress at any time.
0.0
10.0
20.0
30.0
40.0
50.0
60.0
70.0
0.1 1.0 10.0 100.0 1000.0
Shear rate (S-1)
App
aren
t Vis
cosi
ty (C
p)
tapioca sweet potato rice sagu
Figure 4.30 Comparison viscosity graph for xanthan gum refined in distilled water
(DW)
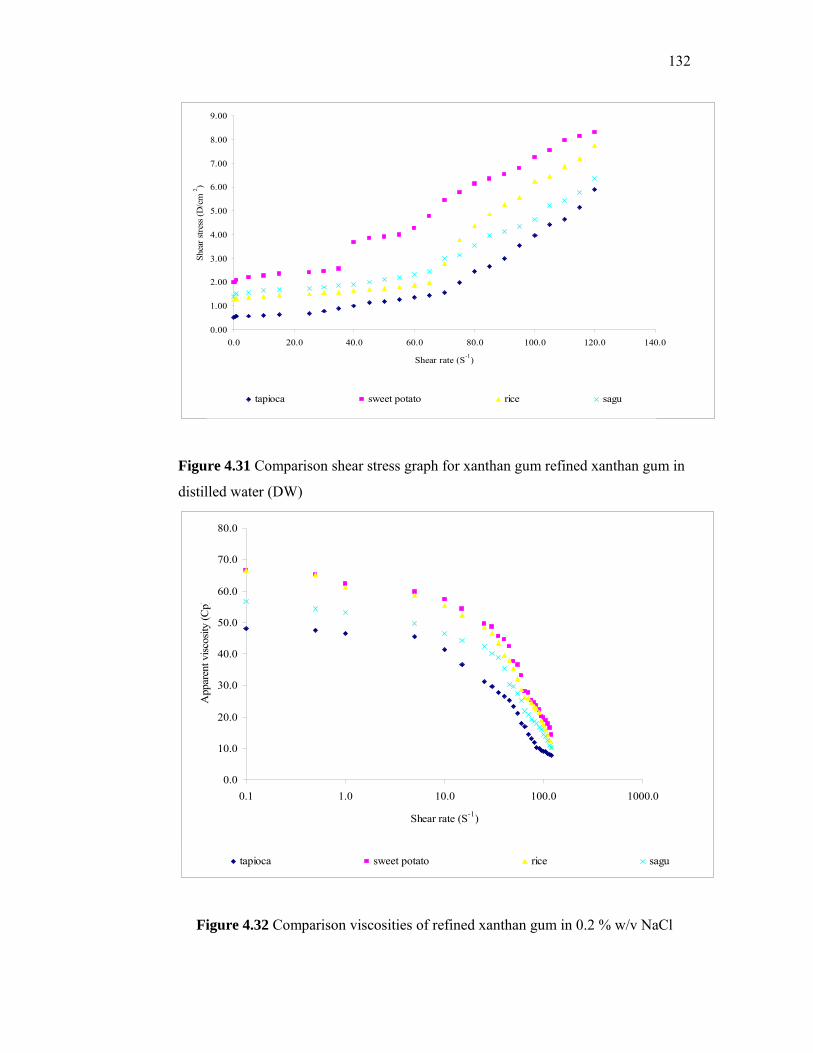
132
0.00
1.00
2.00
3.00
4.00
5.00
6.00
7.00
8.00
9.00
0.0 20.0 40.0 60.0 80.0 100.0 120.0 140.0
Shear rate (S-1)
Shea
r stre
ss (D
/cm
2 )
tapioca sweet potato rice sagu
Figure 4.31 Comparison shear stress graph for xanthan gum refined xanthan gum in
distilled water (DW)
0.0
10.0
20.0
30.0
40.0
50.0
60.0
70.0
80.0
0.1 1.0 10.0 100.0 1000.0
Shear rate (S-1)
App
aren
t visc
osity
(Cp)
tapioca sweet potato rice sagu
Figure 4.32 Comparison viscosities of refined xanthan gum in 0.2 % w/v NaCl
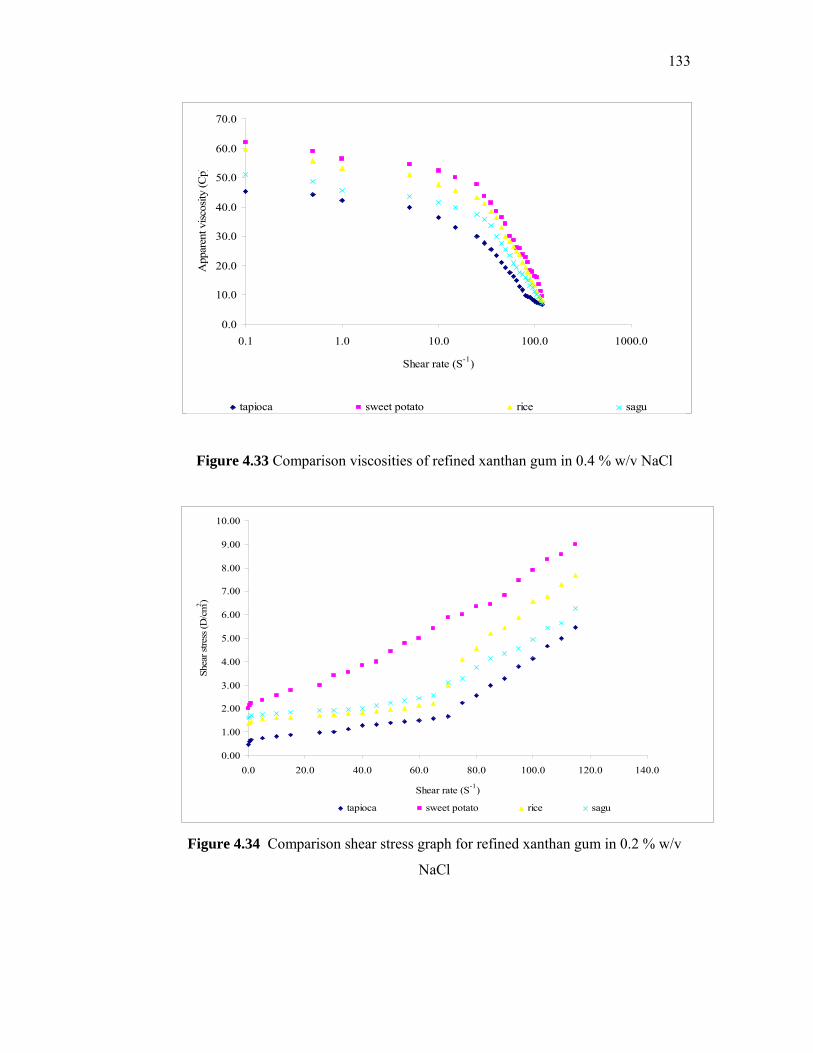
133
0.0
10.0
20.0
30.0
40.0
50.0
60.0
70.0
0.1 1.0 10.0 100.0 1000.0
Shear rate (S-1)
App
aren
t visc
osity
(Cp)
tapioca sweet potato rice sagu
Figure 4.33 Comparison viscosities of refined xanthan gum in 0.4 % w/v NaCl
0.00
1.00
2.00
3.00
4.00
5.00
6.00
7.00
8.00
9.00
10.00
0.0 20.0 40.0 60.0 80.0 100.0 120.0 140.0
Shear rate (S-1)
Shea
r stre
ss (D
/cm2 )
tapioca sweet potato rice sagu
Figure 4.34 Comparison shear stress graph for refined xanthan gum in 0.2 % w/v
NaCl
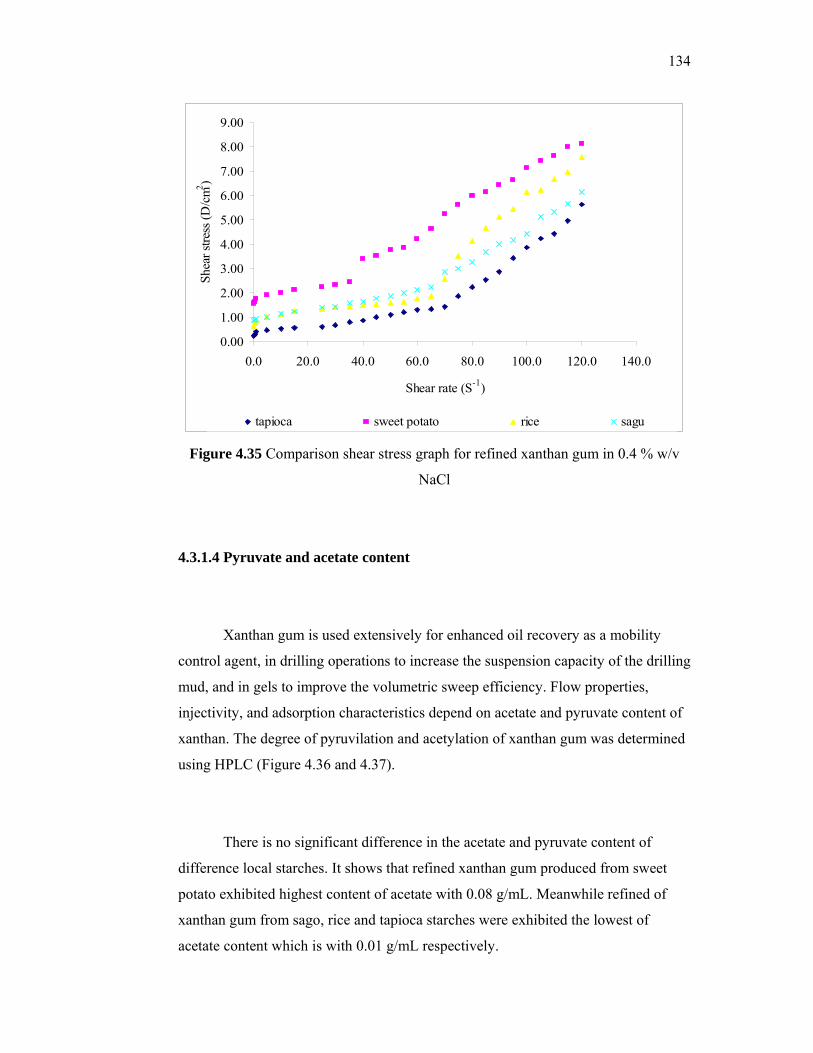
134
0.00
1.00
2.00
3.00
4.00
5.00
6.00
7.00
8.00
9.00
0.0 20.0 40.0 60.0 80.0 100.0 120.0 140.0
Shear rate (S-1)
Shea
r stre
ss (D
/cm2 )
tapioca sweet potato rice sagu
Figure 4.35 Comparison shear stress graph for refined xanthan gum in 0.4 % w/v
NaCl
4.3.1.4 Pyruvate and acetate content
Xanthan gum is used extensively for enhanced oil recovery as a mobility
control agent, in drilling operations to increase the suspension capacity of the drilling
mud, and in gels to improve the volumetric sweep efficiency. Flow properties,
injectivity, and adsorption characteristics depend on acetate and pyruvate content of
xanthan. The degree of pyruvilation and acetylation of xanthan gum was determined
using HPLC (Figure 4.36 and 4.37).
There is no significant difference in the acetate and pyruvate content of
difference local starches. It shows that refined xanthan gum produced from sweet
potato exhibited highest content of acetate with 0.08 g/mL. Meanwhile refined of
xanthan gum from sago, rice and tapioca starches were exhibited the lowest of
acetate content which is with 0.01 g/mL respectively.
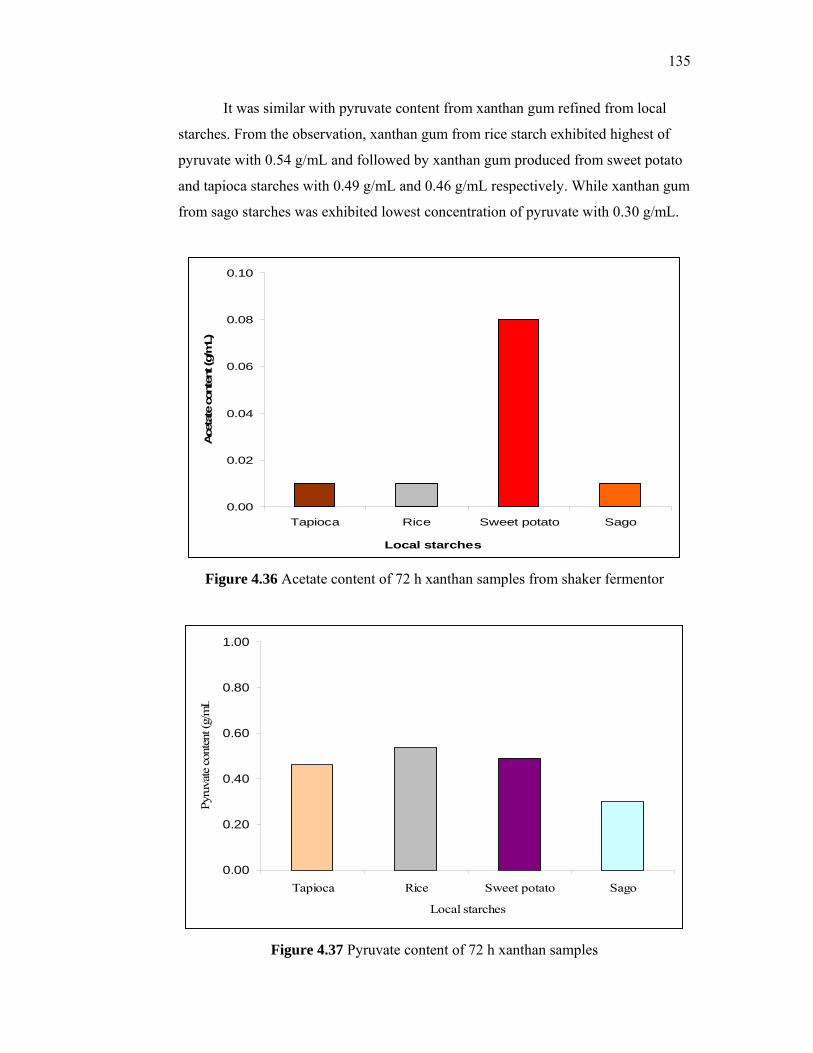
135
It was similar with pyruvate content from xanthan gum refined from local
starches. From the observation, xanthan gum from rice starch exhibited highest of
pyruvate with 0.54 g/mL and followed by xanthan gum produced from sweet potato
and tapioca starches with 0.49 g/mL and 0.46 g/mL respectively. While xanthan gum
from sago starches was exhibited lowest concentration of pyruvate with 0.30 g/mL.
0.00
0.02
0.04
0.06
0.08
0.10
Tapioca Rice Sweet potato Sago
Local starches
Ace
tate
con
tent
(g/m
L)
Figure 4.36 Acetate content of 72 h xanthan samples from shaker fermentor
0.00
0.20
0.40
0.60
0.80
1.00
Tapioca Rice Sweet potato Sago
Local starches
Pyru
vate
con
tent
(g/m
L
Figure 4.37 Pyruvate content of 72 h xanthan samples
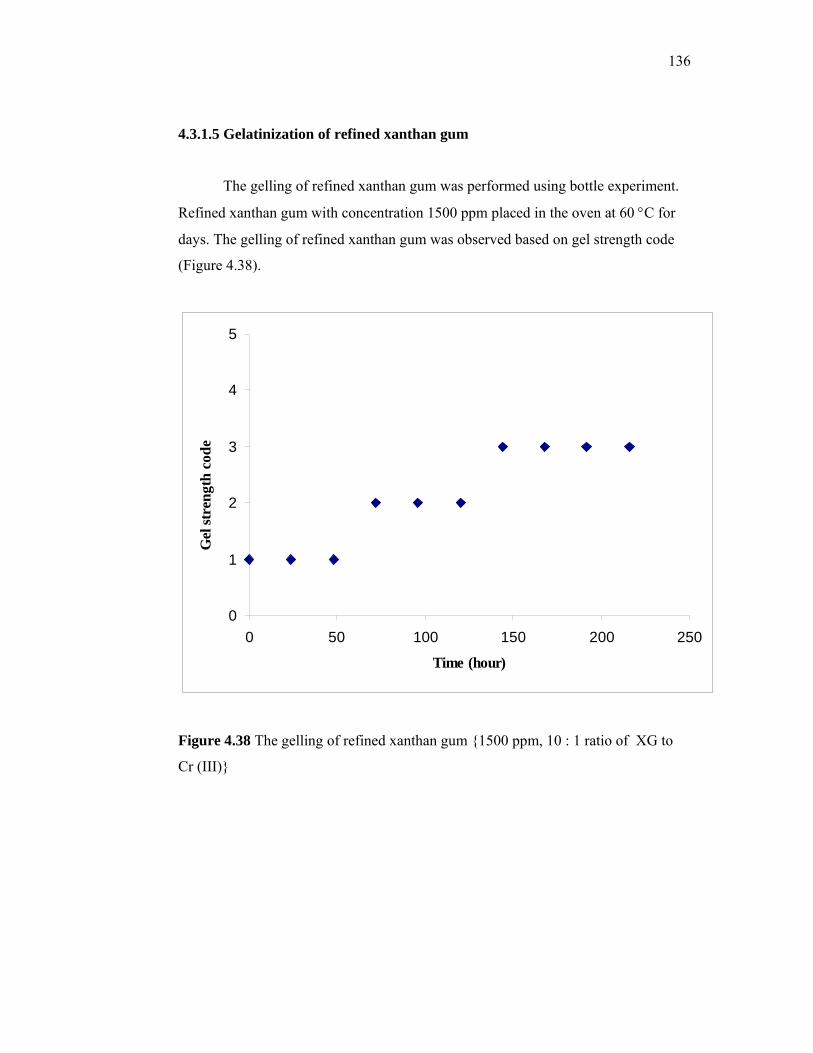
136
4.3.1.5 Gelatinization of refined xanthan gum
The gelling of refined xanthan gum was performed using bottle experiment.
Refined xanthan gum with concentration 1500 ppm placed in the oven at 60 °C for
days. The gelling of refined xanthan gum was observed based on gel strength code
(Figure 4.38).
0
1
2
3
4
5
0 50 100 150 200 250
Time (hour)
Gel
stre
ngth
cod
e
Figure 4.38 The gelling of refined xanthan gum {1500 ppm, 10 : 1 ratio of XG to
Cr (III)}
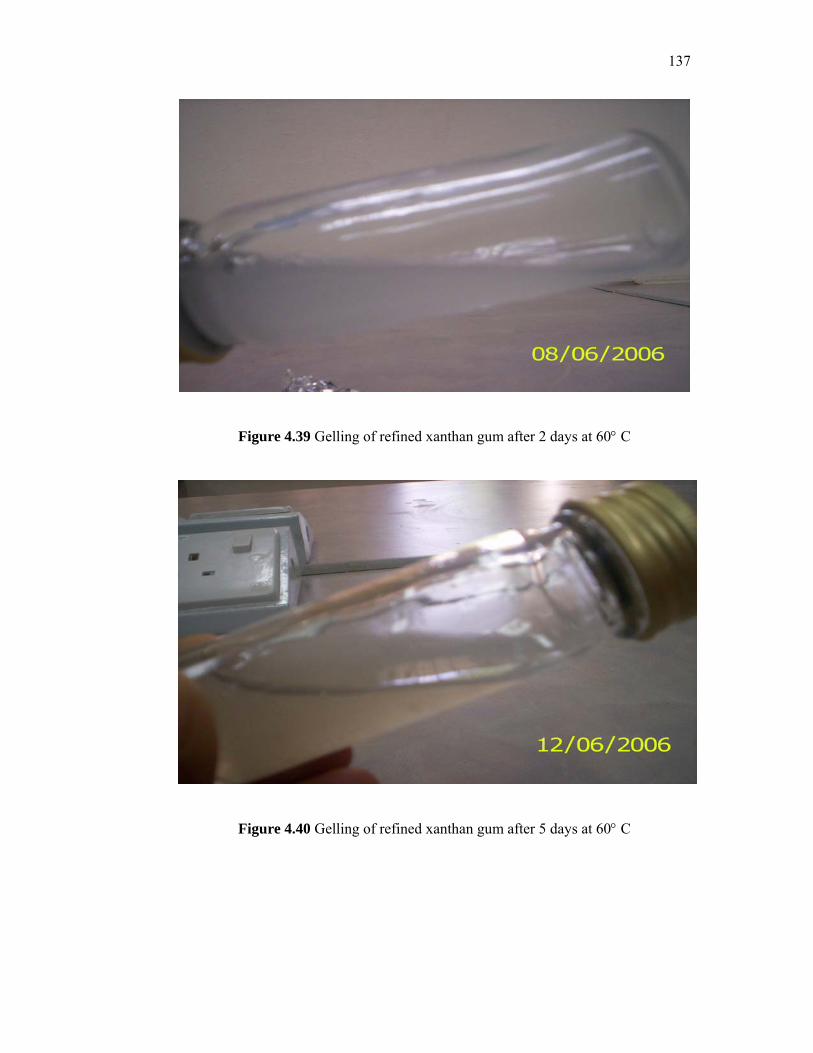
137
Figure 4.39 Gelling of refined xanthan gum after 2 days at 60° C
Figure 4.40 Gelling of refined xanthan gum after 5 days at 60° C
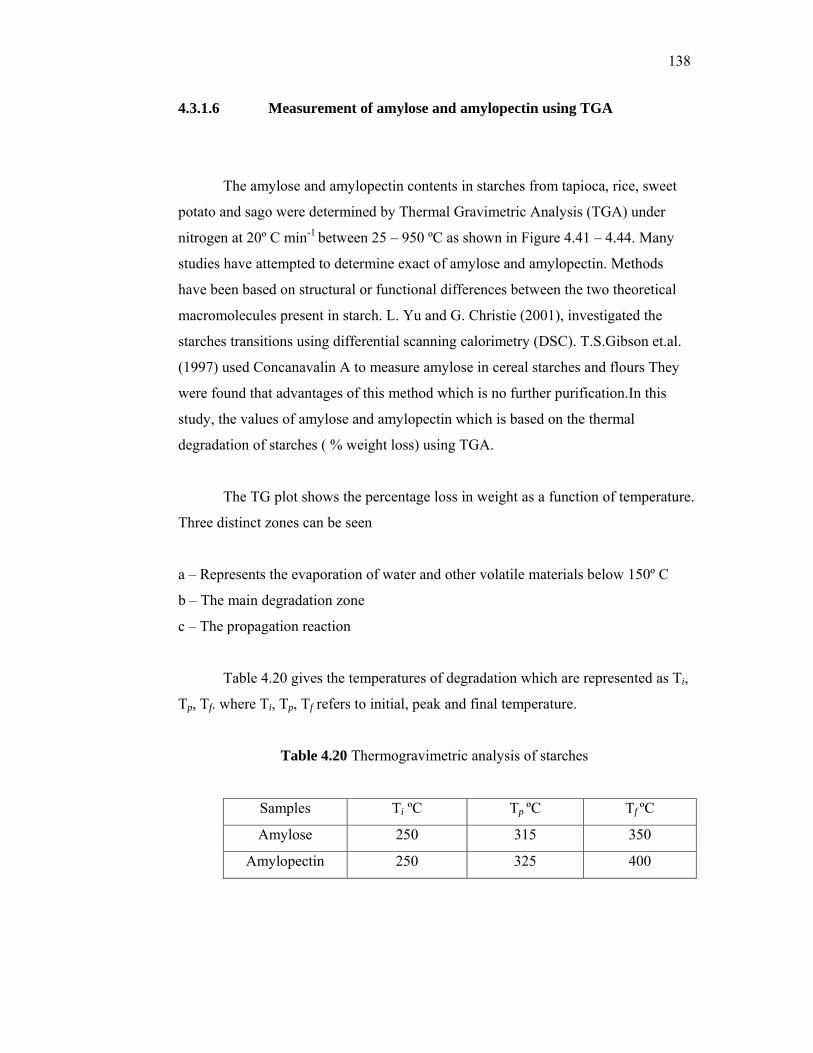
138
4.3.1.6 Measurement of amylose and amylopectin using TGA
The amylose and amylopectin contents in starches from tapioca, rice, sweet
potato and sago were determined by Thermal Gravimetric Analysis (TGA) under
nitrogen at 20º C min-1 between 25 – 950 ºC as shown in Figure 4.41 – 4.44. Many
studies have attempted to determine exact of amylose and amylopectin. Methods
have been based on structural or functional differences between the two theoretical
macromolecules present in starch. L. Yu and G. Christie (2001), investigated the
starches transitions using differential scanning calorimetry (DSC). T.S.Gibson et.al.
(1997) used Concanavalin A to measure amylose in cereal starches and flours They
were found that advantages of this method which is no further purification.In this
study, the values of amylose and amylopectin which is based on the thermal
degradation of starches ( % weight loss) using TGA.
The TG plot shows the percentage loss in weight as a function of temperature.
Three distinct zones can be seen
a – Represents the evaporation of water and other volatile materials below 150º C
b – The main degradation zone
c – The propagation reaction
Table 4.20 gives the temperatures of degradation which are represented as Ti,
Tp, Tf. where Ti, Tp, Tf refers to initial, peak and final temperature.
Table 4.20 Thermogravimetric analysis of starches
Samples Ti ºC Tp ºC Tf ºC
Amylose 250 315 350
Amylopectin 250 325 400
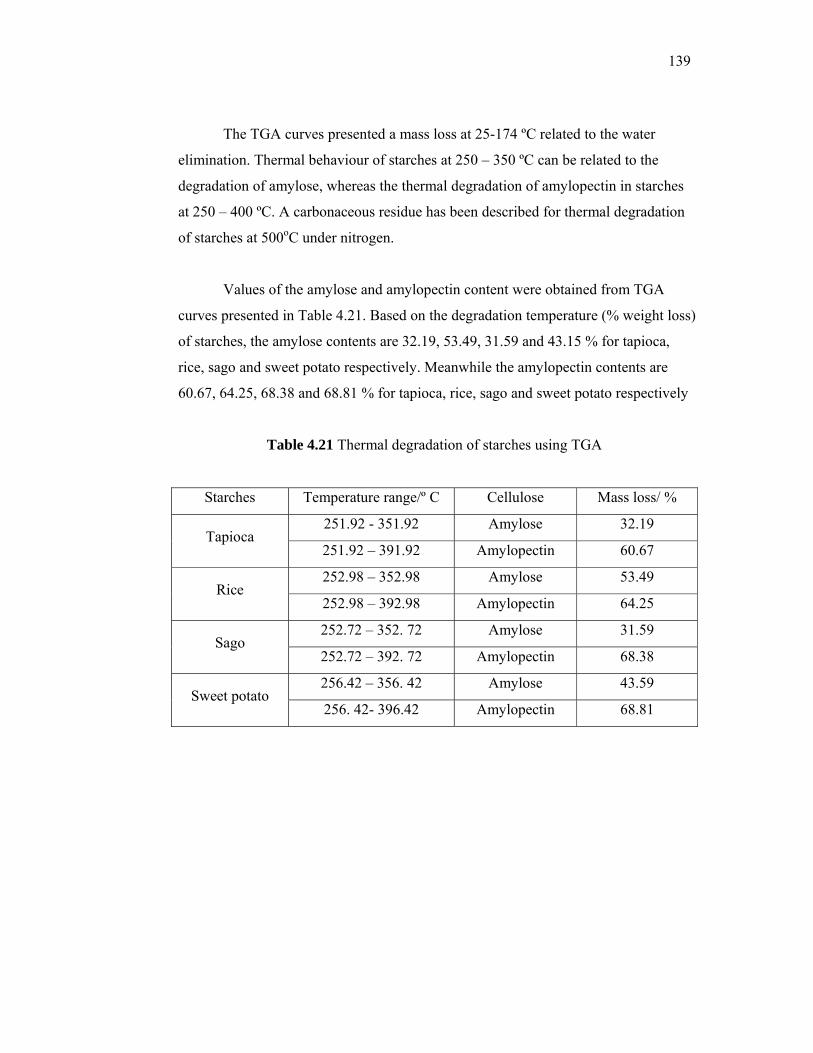
139
The TGA curves presented a mass loss at 25-174 ºC related to the water
elimination. Thermal behaviour of starches at 250 – 350 ºC can be related to the
degradation of amylose, whereas the thermal degradation of amylopectin in starches
at 250 – 400 ºC. A carbonaceous residue has been described for thermal degradation
of starches at 500oC under nitrogen.
Values of the amylose and amylopectin content were obtained from TGA
curves presented in Table 4.21. Based on the degradation temperature (% weight loss)
of starches, the amylose contents are 32.19, 53.49, 31.59 and 43.15 % for tapioca,
rice, sago and sweet potato respectively. Meanwhile the amylopectin contents are
60.67, 64.25, 68.38 and 68.81 % for tapioca, rice, sago and sweet potato respectively
Table 4.21 Thermal degradation of starches using TGA
Starches Temperature range/º C Cellulose Mass loss/ %
251.92 - 351.92 Amylose 32.19 Tapioca
251.92 – 391.92 Amylopectin 60.67
252.98 – 352.98 Amylose 53.49 Rice
252.98 – 392.98 Amylopectin 64.25
252.72 – 352. 72 Amylose 31.59 Sago
252.72 – 392. 72 Amylopectin 68.38
256.42 – 356. 42 Amylose 43.59 Sweet potato
256. 42- 396.42 Amylopectin 68.81
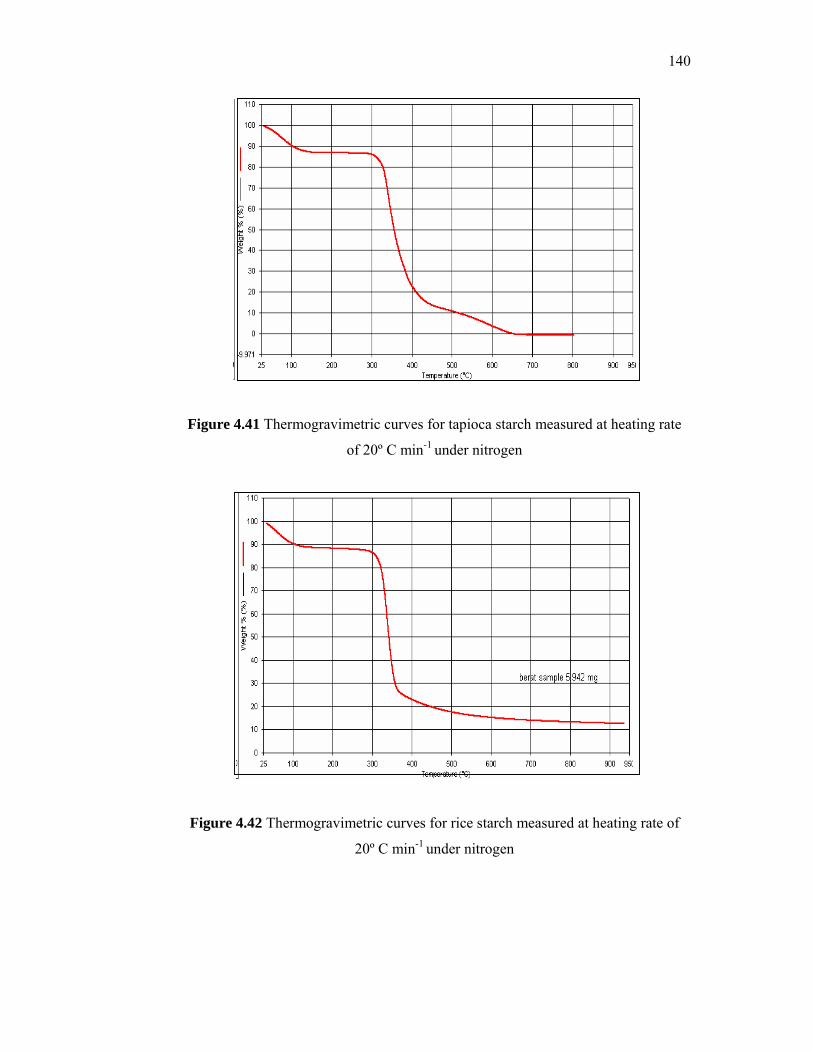
140
Figure 4.41 Thermogravimetric curves for tapioca starch measured at heating rate
of 20º C min-1 under nitrogen
Figure 4.42 Thermogravimetric curves for rice starch measured at heating rate of
20º C min-1 under nitrogen

141
Figure 4.43 Thermogravimetric curves for Sago starch measured at heating rate of
20º C min-1 under nitrogen
Figure 4.44 Thermogravimetric curves for Sweet potato starch measured at heating
rate of 20º C min-1 under nitrogen
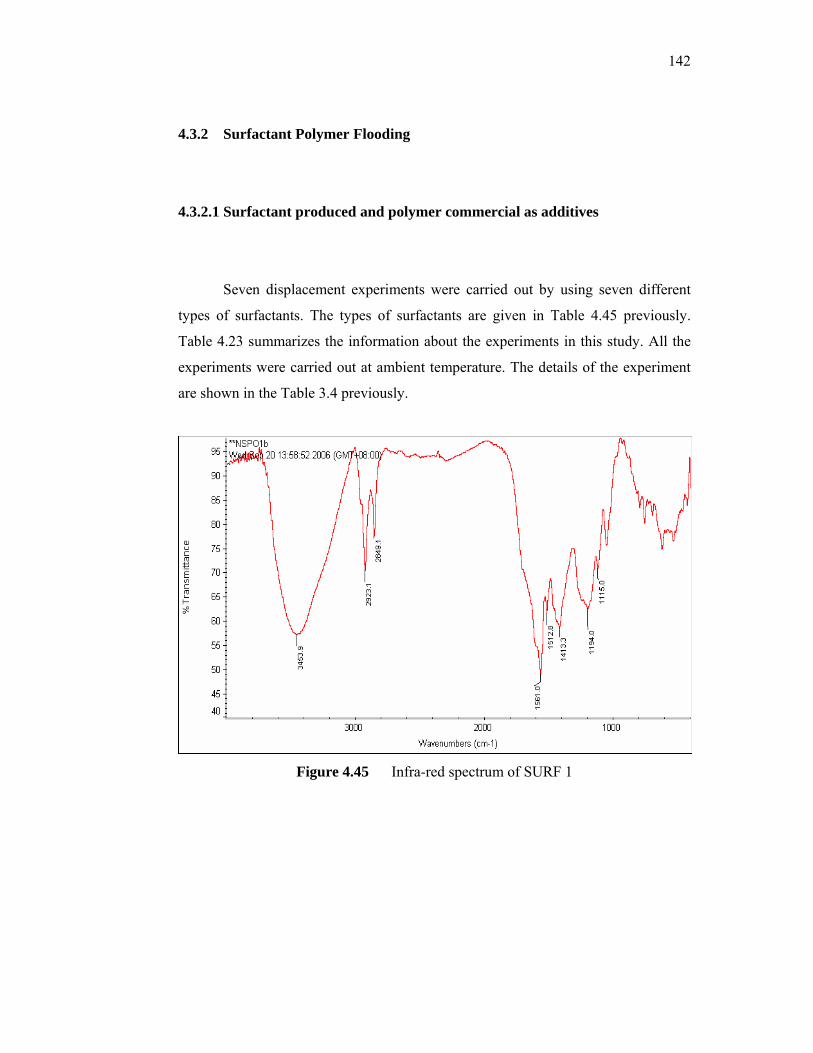
142
4.3.2 Surfactant Polymer Flooding
4.3.2.1 Surfactant produced and polymer commercial as additives
Seven displacement experiments were carried out by using seven different
types of surfactants. The types of surfactants are given in Table 4.45 previously.
Table 4.23 summarizes the information about the experiments in this study. All the
experiments were carried out at ambient temperature. The details of the experiment
are shown in the Table 3.4 previously.
Figure 4.45 Infra-red spectrum of SURF 1
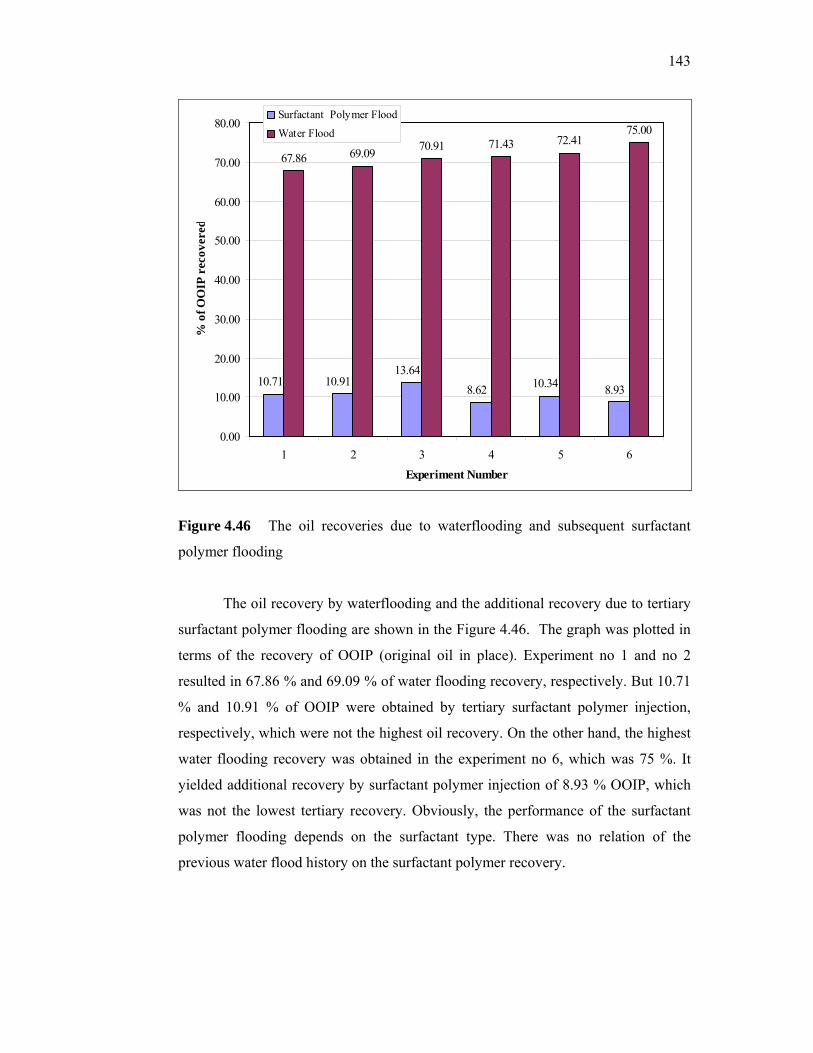
143
67.86 69.09 70.91 71.43 72.4175.00
10.34 8.9310.71 10.91
8.6213.64
0.00
10.00
20.00
30.00
40.00
50.00
60.00
70.00
80.00
1 2 3 4 5 6Experiment Number
% o
f OO
IP r
ecov
ered
Surfactant Polymer Flood
Water Flood
Figure 4.46 The oil recoveries due to waterflooding and subsequent surfactant
polymer flooding
The oil recovery by waterflooding and the additional recovery due to tertiary
surfactant polymer flooding are shown in the Figure 4.46. The graph was plotted in
terms of the recovery of OOIP (original oil in place). Experiment no 1 and no 2
resulted in 67.86 % and 69.09 % of water flooding recovery, respectively. But 10.71
% and 10.91 % of OOIP were obtained by tertiary surfactant polymer injection,
respectively, which were not the highest oil recovery. On the other hand, the highest
water flooding recovery was obtained in the experiment no 6, which was 75 %. It
yielded additional recovery by surfactant polymer injection of 8.93 % OOIP, which
was not the lowest tertiary recovery. Obviously, the performance of the surfactant
polymer flooding depends on the surfactant type. There was no relation of the
previous water flood history on the surfactant polymer recovery.
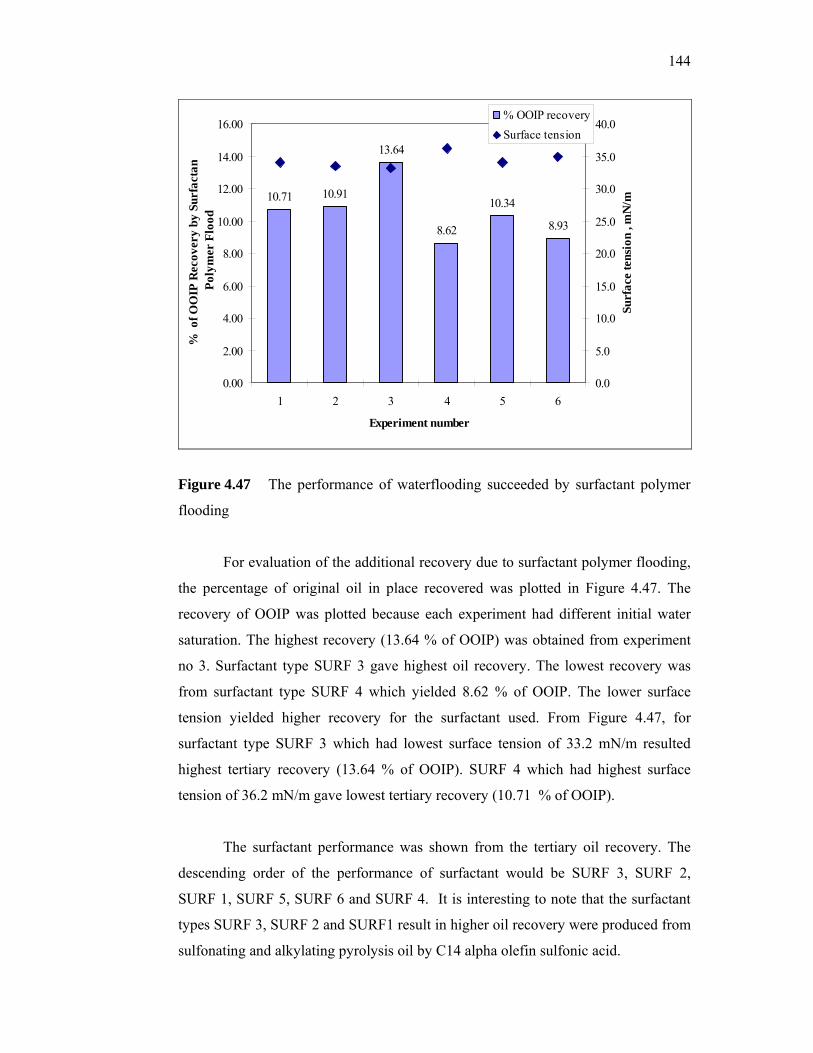
144
10.71 10.91
13.64
8.62
10.34
8.93
0.00
2.00
4.00
6.00
8.00
10.00
12.00
14.00
16.00
1 2 3 4 5 6
Experiment number
% o
f OO
IP R
ecov
ery
by S
urfa
ctan
Poly
mer
Flo
od
0.0
5.0
10.0
15.0
20.0
25.0
30.0
35.0
40.0
Surf
ace
tens
ion
, mN
/m
% OOIP recoverySurface tension
Figure 4.47 The performance of waterflooding succeeded by surfactant polymer
flooding
For evaluation of the additional recovery due to surfactant polymer flooding,
the percentage of original oil in place recovered was plotted in Figure 4.47. The
recovery of OOIP was plotted because each experiment had different initial water
saturation. The highest recovery (13.64 % of OOIP) was obtained from experiment
no 3. Surfactant type SURF 3 gave highest oil recovery. The lowest recovery was
from surfactant type SURF 4 which yielded 8.62 % of OOIP. The lower surface
tension yielded higher recovery for the surfactant used. From Figure 4.47, for
surfactant type SURF 3 which had lowest surface tension of 33.2 mN/m resulted
highest tertiary recovery (13.64 % of OOIP). SURF 4 which had highest surface
tension of 36.2 mN/m gave lowest tertiary recovery (10.71 % of OOIP).
The surfactant performance was shown from the tertiary oil recovery. The
descending order of the performance of surfactant would be SURF 3, SURF 2,
SURF 1, SURF 5, SURF 6 and SURF 4. It is interesting to note that the surfactant
types SURF 3, SURF 2 and SURF1 result in higher oil recovery were produced from
sulfonating and alkylating pyrolysis oil by C14 alpha olefin sulfonic acid.
145
Because of the complexity of the chemical compound in the extracted
phenols, the molecular weight of the extracted phenols in this study was not
determined. If reactants are not mixed in the right mole ratio, yield is limited by one
of the reactants. It is believed that complete reaction occurred in producing SURF 3
(extracted phenol: C14 sulfonic acid, 100: 90 in weight ratio) and SURF 5 (extracted
phenol: C16 sulfonic acid, 100: 60 in weight ratio). A complete reaction is one
which proceeds completely to the right; it is a reaction which will use up all reactants
completely if they are present in stoichiometrically equivalent amounts. There might
be some moles of the reactant in excess left over after the reaction has gone to
completion in producing SURF 6 (extracted phenol: C16 sulfonic acid, 100: 90 in
weight ratio). Thus, it affected the purity and the quality of the surfactant produced.
To determine whether the flooding with surfactant polymer is more effective
than without surfactant and polymer, two further experiments were conducted. One
was surfactant flooding without using polymer and the other one was polymer
flooding without surfactant. The results were compared in Table 4.22.
Table 4.22: Displacement recovery performance of different surfactants
Surfactant type and
concentration
Tertiary recovery
( % OOIP) Experiment type
SURF1 - 0.5 % 10.71 Brine + Surf.+ Polymer
SURF2 - 0.5 % 10.91 Brine + Surf.+ Polymer
SURF3 - 0.5 % 13.64 Brine + Surf.+ Polymer
SURF4 - 0.5 % 8.62 Brine + Surf.+ Polymer
SURF5 - 0.5 % 10.34 Brine + Surf.+ Polymer
SURF6 - 0.5 % 8.93 Brine + Surf.+ Polymer
- 8.33 Brine + Polymer
SURF1 - 0.5 % 3.57 Brine + Surfactant
146
It was found that the polymer flooding obtained 8.33 % of OOIP only. The
oil recovery for surfactant flooding without using polymer was found to be 3.57 %
OOIP. Field practice has shown that polymer flooding can increase recovery by
more than 12% OOIP (Tabary and Bazin , 2007). Obviously, it yielded lower oil
recovery if single chemical was used. Surfactant was required to reduce the
interfacial tension between the residual oil while mobility control by polymer was
also strongly required for better displacement and sweep efficiency. It is technically
possible to perform a low tension water flood at 5 wt % of surfactant produced from
oil palm shell by using 500 ppm polymer to control the mobility. From the
experiments, the surfactant polymer flooding recovered the original oil saturation in
the range of 8 – 14 %. In field application, surfactant polymer flooding has been
used extensively worldwide and has been successful in recovering an additional 10
to 20 % of OOIP (Yassin, 1988). The results in this study are matched with the
theoretical results.
4.3.2.2 Surfactant and polymer produced from local starches as additives
Displacement experiments were carried out by using four different polymer
and surfactant. All the experiments were carried out at ambient temperature. Table
4.23 illustrated that the summary of sandpack flood tests.
Table 4.23 Summary of sandpack flood tests
Test number Waterflood
recovery
(% IOIP)
Final recovery
(% OOIP)
Experiment type
P1 (sago)-500 ppm 52.69 15.43 Brine + Polymer
P2 (tapioca)-500 ppm 50.00 16.56 Brine + Polymer
P3 (sweet potato)-500 ppm 54.96 18.67 Brine + Polymer
P4 (rice)-500 ppm 51.34 15.76 Brine + Polymer
SURF7- 0.5 % 64.29 10.76 Brine + Surfactant
SURF7 – 0.5 % P3 – 500 ppm 70.50 20.21 Brine + Surf.+ Polymer
147
The oil recovery by water flooding and the additional recovery due to tertiary
surfactant polymer flooding are shown in the Fig.4.48 and 4.49. The graph was
plotted in terms of the recovery of OOIP (original oil in place). Experiment P1, P2,
P3 and P4 was resulted in 52.69 %, 50.00 % 54.96 % and 51.34 % of water flooding
respectively. Conversely 15.43 %, 16.56 %, 18.67 % and 15.76 % were obtained by
tertiary polymer injection respectively, which were not the highest oil recovery. It
was also found that the oil recoveries of polymer produced for polymer flooding
more highest compared than polymer commercial which is only 8.33 % of OOIP. It
yielded lower oil recovery if single chemical was used.
Surfactant was required to reduce the interfacial tension between the residual
oil while mobility control by polymer was also strongly required for better
displacement and sweep efficiency. Furthermore the oil recovery for surfactant
flooding without using polymer was 3.76 % OOIP and 64.29 % of water flooding. In
order that the highest water flooding recovery was obtained in the experiment
SURF7P3 which is 70.50 %. It yielded oil recovery by surfactant-polymer injection
of 20.21 % of OOIP. Obviously the performance of the polymer surfactant flooding
depends on the polymer type. There was no relation of the previous water flood
history on the surfactant-polymer recovery.
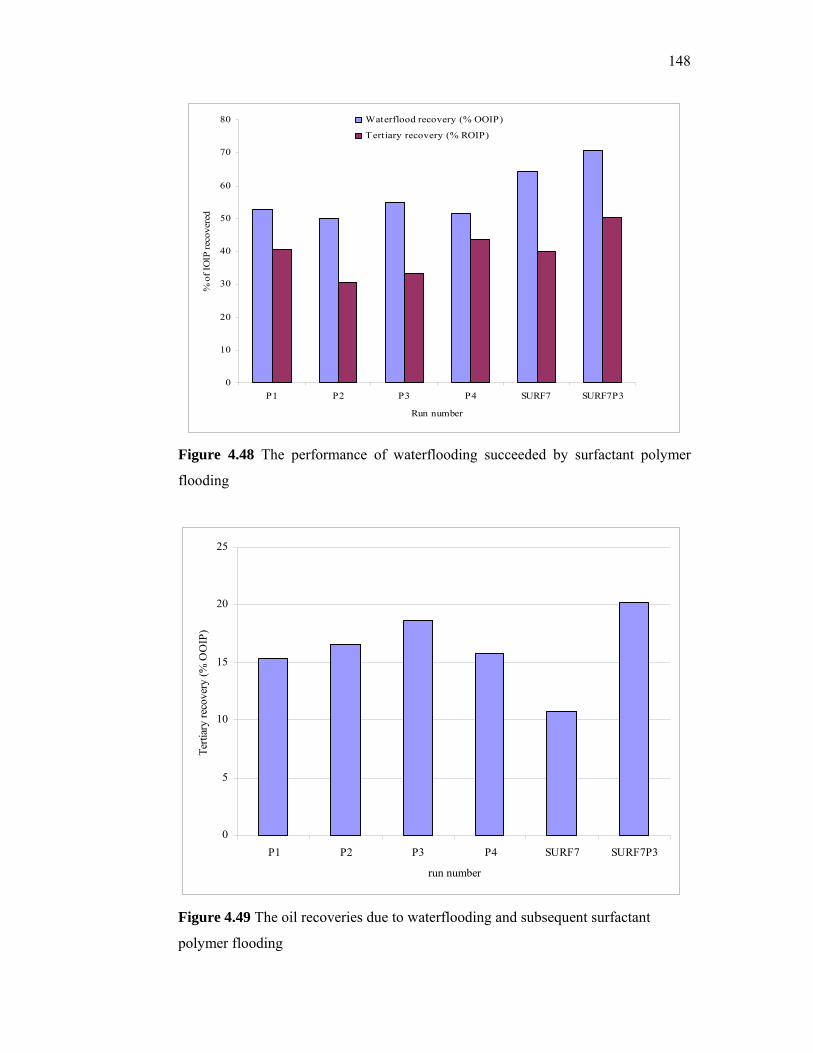
148
0
10
20
30
40
50
60
70
80
P1 P2 P3 P4 SURF7 SURF7P3
Run number
% o
f IO
IP re
cove
red
Waterflood recovery (% OOIP)
Tertiary recovery (% ROIP)
Figure 4.48 The performance of waterflooding succeeded by surfactant polymer
flooding
0
5
10
15
20
25
P1 P2 P3 P4 SURF7 SURF7P3
run number
Terti
ary
reco
very
(% O
OIP
)
Figure 4.49 The oil recoveries due to waterflooding and subsequent surfactant
polymer flooding
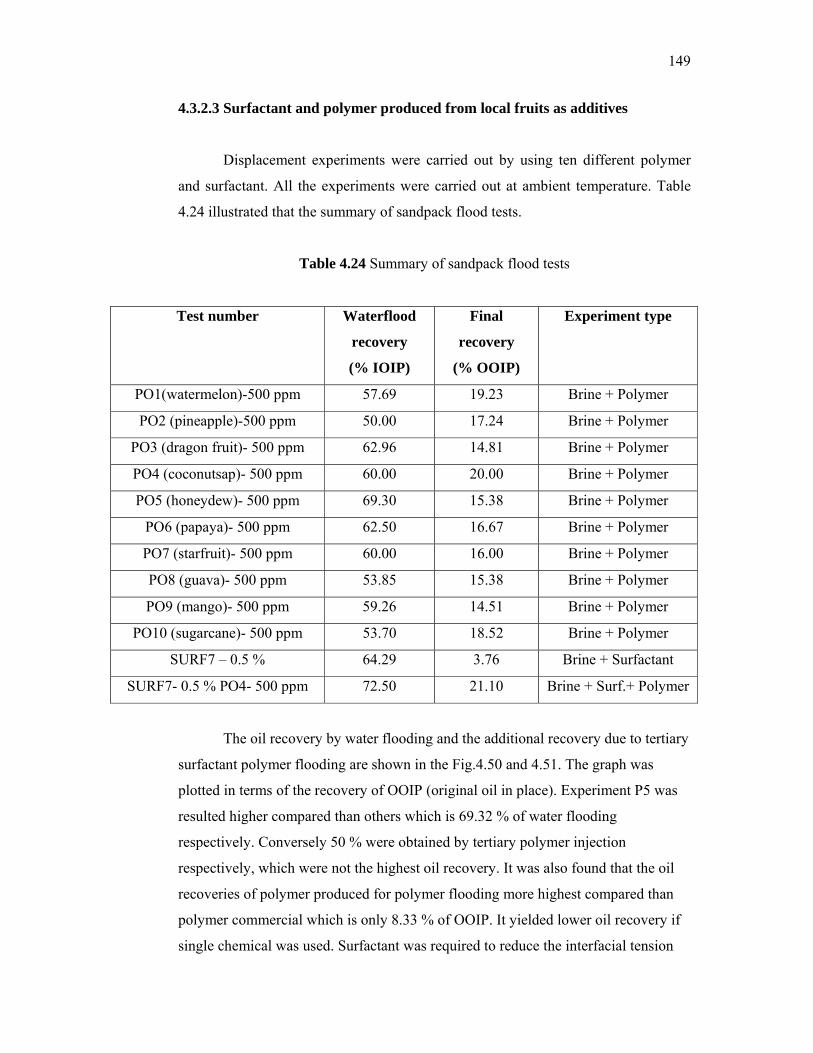
149
4.3.2.3 Surfactant and polymer produced from local fruits as additives
Displacement experiments were carried out by using ten different polymer
and surfactant. All the experiments were carried out at ambient temperature. Table
4.24 illustrated that the summary of sandpack flood tests.
Table 4.24 Summary of sandpack flood tests
Test number Waterflood
recovery
(% IOIP)
Final
recovery
(% OOIP)
Experiment type
PO1(watermelon)-500 ppm 57.69 19.23 Brine + Polymer
PO2 (pineapple)-500 ppm 50.00 17.24 Brine + Polymer
PO3 (dragon fruit)- 500 ppm 62.96 14.81 Brine + Polymer
PO4 (coconutsap)- 500 ppm 60.00 20.00 Brine + Polymer
PO5 (honeydew)- 500 ppm 69.30 15.38 Brine + Polymer
PO6 (papaya)- 500 ppm 62.50 16.67 Brine + Polymer
PO7 (starfruit)- 500 ppm 60.00 16.00 Brine + Polymer
PO8 (guava)- 500 ppm 53.85 15.38 Brine + Polymer
PO9 (mango)- 500 ppm 59.26 14.51 Brine + Polymer
PO10 (sugarcane)- 500 ppm 53.70 18.52 Brine + Polymer
SURF7 – 0.5 % 64.29 3.76 Brine + Surfactant
SURF7- 0.5 % PO4- 500 ppm 72.50 21.10 Brine + Surf.+ Polymer
The oil recovery by water flooding and the additional recovery due to tertiary
surfactant polymer flooding are shown in the Fig.4.50 and 4.51. The graph was
plotted in terms of the recovery of OOIP (original oil in place). Experiment P5 was
resulted higher compared than others which is 69.32 % of water flooding
respectively. Conversely 50 % were obtained by tertiary polymer injection
respectively, which were not the highest oil recovery. It was also found that the oil
recoveries of polymer produced for polymer flooding more highest compared than
polymer commercial which is only 8.33 % of OOIP. It yielded lower oil recovery if
single chemical was used. Surfactant was required to reduce the interfacial tension
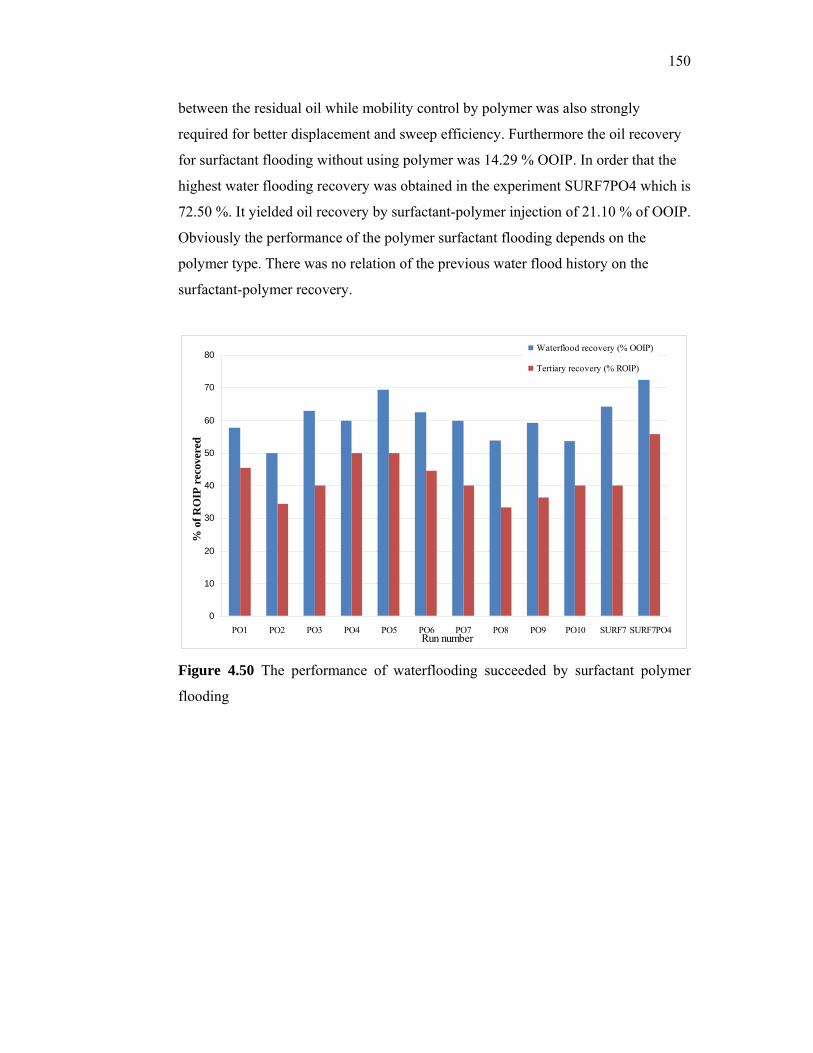
150
between the residual oil while mobility control by polymer was also strongly
required for better displacement and sweep efficiency. Furthermore the oil recovery
for surfactant flooding without using polymer was 14.29 % OOIP. In order that the
highest water flooding recovery was obtained in the experiment SURF7PO4 which is
72.50 %. It yielded oil recovery by surfactant-polymer injection of 21.10 % of OOIP.
Obviously the performance of the polymer surfactant flooding depends on the
polymer type. There was no relation of the previous water flood history on the
surfactant-polymer recovery.
0
10
20
30
40
50
60
70
80
PO1 PO2 PO3 PO4 PO5 PO6 PO7 PO8 PO9 PO10 SURF7 SURF7PO4Run number
% o
f RO
IP r
ecov
ered
Waterflood recovery (% OOIP)
Tertiary recovery (% ROIP)
Figure 4.50 The performance of waterflooding succeeded by surfactant polymer
flooding
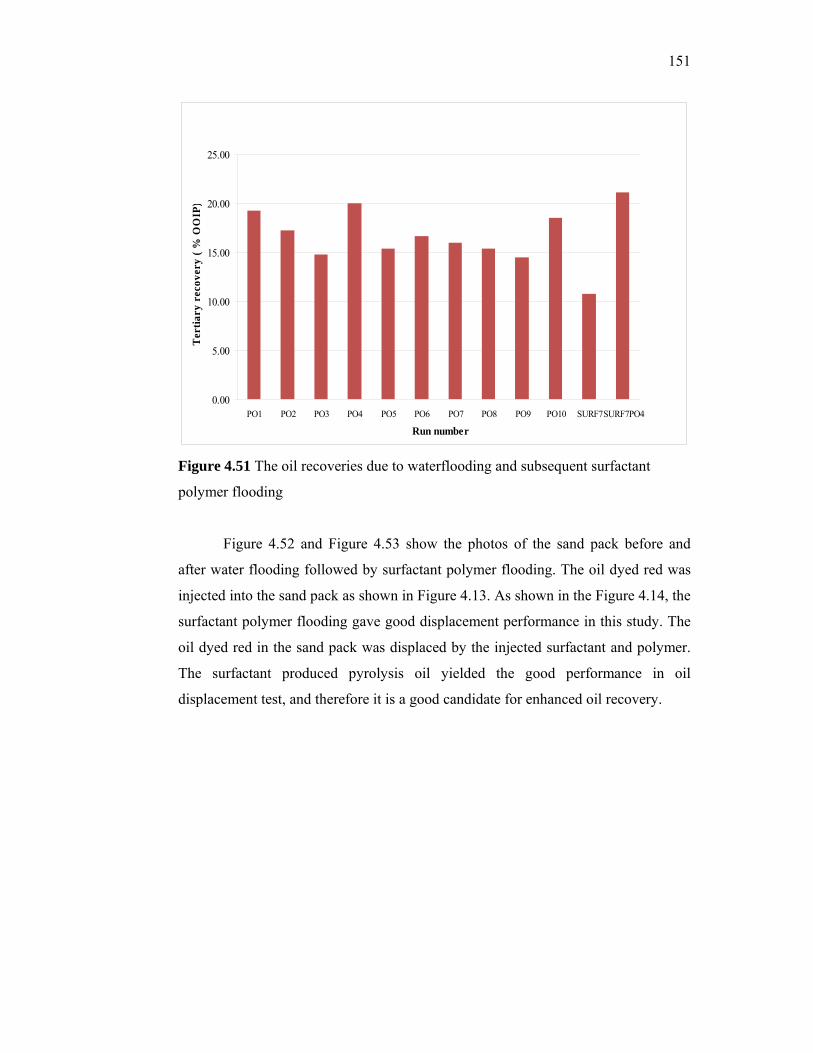
151
0.00
5.00
10.00
15.00
20.00
25.00
PO1 PO2 PO3 PO4 PO5 PO6 PO7 PO8 PO9 PO10 SURF7SURF7PO4
Run number
Ter
tiary
rec
over
y ( %
OO
IP)
Figure 4.51 The oil recoveries due to waterflooding and subsequent surfactant
polymer flooding
Figure 4.52 and Figure 4.53 show the photos of the sand pack before and
after water flooding followed by surfactant polymer flooding. The oil dyed red was
injected into the sand pack as shown in Figure 4.13. As shown in the Figure 4.14, the
surfactant polymer flooding gave good displacement performance in this study. The
oil dyed red in the sand pack was displaced by the injected surfactant and polymer.
The surfactant produced pyrolysis oil yielded the good performance in oil
displacement test, and therefore it is a good candidate for enhanced oil recovery.
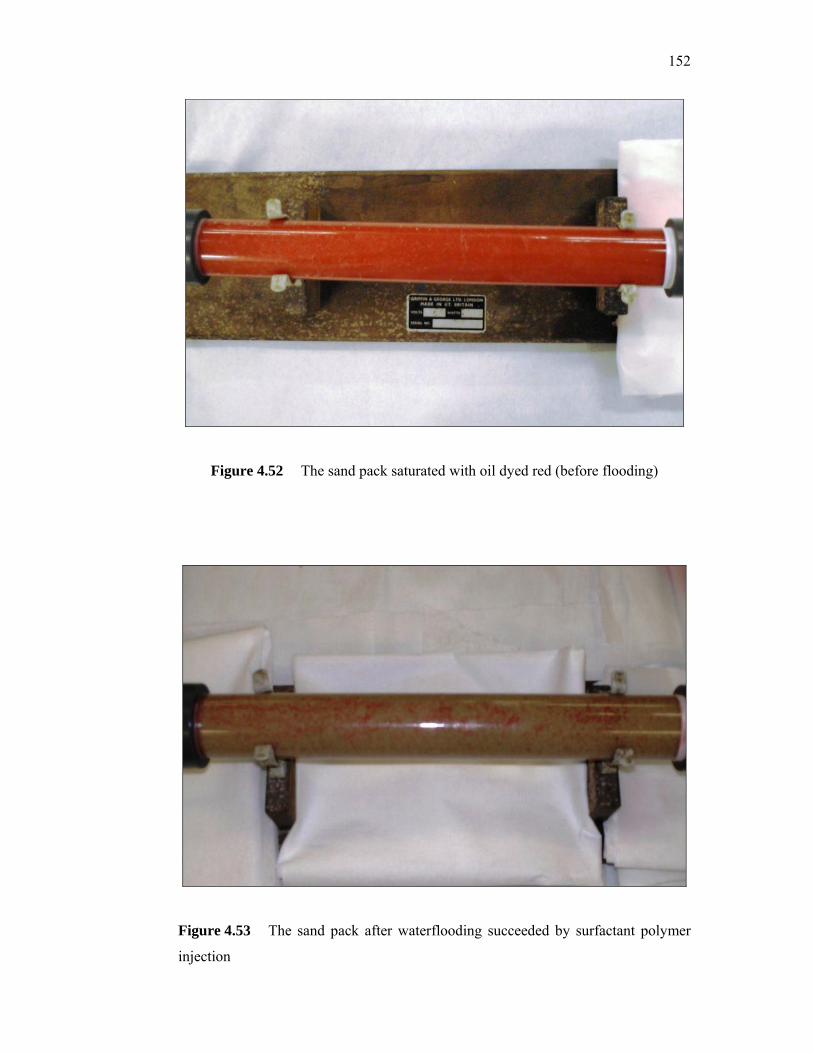
152
Figure 4.52 The sand pack saturated with oil dyed red (before flooding)
Figure 4.53 The sand pack after waterflooding succeeded by surfactant polymer
injection
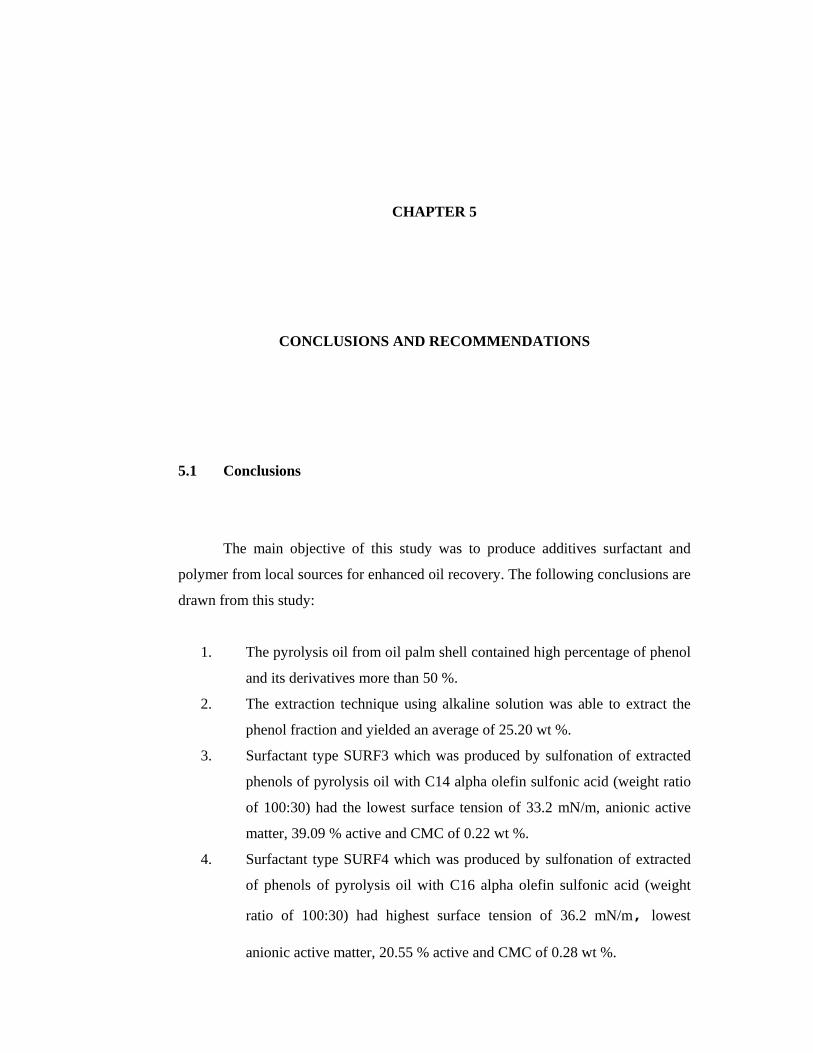
CHAPTER 5
CONCLUSIONS AND RECOMMENDATIONS
5.1 Conclusions
The main objective of this study was to produce additives surfactant and
polymer from local sources for enhanced oil recovery. The following conclusions are
drawn from this study:
1. The pyrolysis oil from oil palm shell contained high percentage of phenol
and its derivatives more than 50 %.
2. The extraction technique using alkaline solution was able to extract the
phenol fraction and yielded an average of 25.20 wt %.
3. Surfactant type SURF3 which was produced by sulfonation of extracted
phenols of pyrolysis oil with C14 alpha olefin sulfonic acid (weight ratio
of 100:30) had the lowest surface tension of 33.2 mN/m, anionic active
matter, 39.09 % active and CMC of 0.22 wt %.
4. Surfactant type SURF4 which was produced by sulfonation of extracted
of phenols of pyrolysis oil with C16 alpha olefin sulfonic acid (weight
ratio of 100:30) had highest surface tension of 36.2 mN/m, lowest
anionic active matter, 20.55 % active and CMC of 0.28 wt %.

154
5. Surfactant type SURF7 which was produced by direct sulfonation of
pyrolysis oil with C14 alpha olefin sulfonic acid (weight ratio of 100:60)
had surface tension of 33.0 mN/m, anionic active matter 29.90 % active
and CMC of 0.22 wt %.
6. Polymer type PO5 which was produced from honeydew juice had highest
dried weight of 8.3550 g/L while polymer type PO7 which was produced
from starfruit juice had the lowest of dried weight of 3.5120 g/L.
7. Polymer type P1 which was produced from sago starch had highest dried
weight of 9.9690 g/L while polymer type P4 had the lowest of dried
weight of 5.5190 g/L.
8. FTIR and NMR characterization were given similarity characteristic of
xanthan gum produced which was compared than commercial of xanthan
gum.
9. The result of the viscosities measurement indicates that xanthan gum
which was produced from local starches and fruits likely more viscous
than commercial of xanthan gum.
10. Additives type SURF7PO4 yielded the highest recovery of 21.10 % of
OOIP due to the lowering of the surface tension of the residual oil in the
pore space followed by additives type SURF7P3 yielded the recovery of
20.21 % OOIP due to the surface tension reductions was not sufficient
enough overcome the oil layer surrounding the sand particles.
11. Surfactant produced from pyrolysis oil resulted in additional oil recovery
from 8 to 14 % of OOIP. Additional oil recovery in the displacement test
using surfactant produced from pyrolysis oil of oil palm shell showed that
it is a good candidate for EOR.
155
5.2 Recommendations
Several recommendations are made for future works:
1. More testing on the properties of additives should be done, such as
adsorption and interfacial tension. Experiments should be designed and
performed in the laboratory to determine the amount of additives adsorbed in
reservoir rock and the interfacial tension between the oil and surfactant.
2. Phase behavior of the additives and the optimal salinity should be
investigated.
3. Slug size and concentration of additives should be considered as important
factors in the surfactant polymer flooding process. Experiments should be
designed and performed to study the effect of different injection strategies on
the oil recovery performance.
REFERENCES
Aisha A.A.Soliman et.al. (1997). “ Thermal Behaviour of Starch and Oxidized
Starch” Thermochimica Acta, 296, 149 – 153.
Ani, F.N. and Zailani, R. (1996). Characteristics of Pyrolysis Oil and Char from
Oil Palm Shells. In: Bridgewater, A.V. and Boocook, D.G.B. (Ed).
Developments in Thermo-chemical Biomass Conversion Volume 1.
London: Blackie Academic and Professional. 425-432.
Aubin, H. and Roy, C (1980). Study on the Corrosiveness of Wood Pyrolysis Oils.
Fuel Science and Technology International. Vol 8: 77 – 86.
Austad, T and Milter, J. (2000). Surfactant Flooding in Enhanced Oil Recovery.
Surfactants: Fundamentals and Applications in the Petroleum Industry.
UK: Cambridge University Press. 203 – 250
Babadagli, T., Al-Bemani, A., Boukadi, F. and Al-Maamari, R (2002). A Laboratory
Feasibility Study of Dilute Surfactant Injection for the Yibal Field, Oman.
SPE 78352. Proceedings of the SPE EUROPEC. Oct. 29-31. Aberdeen, UK.
Balzer, D. (1991). Alkylpolygcosides, their Physio-chemical Properties and
their Uses. Tenside Surf. Det. ,38. 419 – 427
Berger, P.D. and Lee, C.H. (2002). New Anionic Surfactants Based on Olefin
Sulfonic Acids. Journal of Surfactants and Detergents. Vol.5.No.1,
January.

157
Berger, P.D. and Lee, C.H. (2002). Ultra-low Concentration Surfactants for
Sandstone and Limestone Floods. SPE 75186 presented at the SPE/DOE
Improved Oil Recovery Symposium. 13-17 April. Tulsa, Oklahoma.
Berger, P.D., Berger, C.H. and Herron, S.J. (2000). Chemistry of Olefin Acids.
1. Alkylation of Aromatic Sulfonic Acids. Proceedings of the 5th World
Surfactants Congress. May 29 – 2 Jun. Florence, Italy.
Berger, P.D., Berger, C.H. and Hsu, I.K. (2000), Anionic Surfactants Based on
Alkene Sulfonic Acid. (United States Patent 6,043,391)
Bridgwater, A.V and Bridge, S.A. (1991). A Review of Biomass Pyrolysis and
Pyrolysis Technologies. Biomass Pyrolysis Liquids, Upgrading and
Utilization. London: Elsevier Applied Science.
Bridgwater, A.V. and Peacocke, G.V.C., (1999). Fast Pyrolysis Processes for
Biomass. Sustainable and Renewable Energy Reviews. Vol 4. 1 – 73.
Bridgwater, A.V., Meier, D. and Radlein, D. (1999). An Overview of Fast
Pyrolysis of Biomass. Organic Geochemistry 30. London: Elsevier
Applied Science. 1479 – 1493
C.T. Andrade. et.al (1999). “Solution Properties Of The Galactomannans Extracted
From The Seeds Of Caesalpinia Pulcherrima And Cassia Javanica :
Comparison With Locust Bean Gum”. International J.l of Bio.l
Macromolecules 26, 181–185
C.Y. Lii, et.al. (2002). “Xanthan gum-gelation complexes” European Polymer
Journal. 38. 1377- 1381.
Carlos Amen- Chen, Pakdel, H. and Roy, C. (1997). Separation of Phenols from
Eucalyptus Wood Tar. Biomass and Bioenergy. Vol 13, Number 1: 25-
37.
158
Chum, H.L. and Black, S.K. (1990). Process for Fractionating Fast-Pyrolysis
Oils, and Products Derived Therefrom. (United States Patent 4,942,269)
Diebold, J.P. and Bridgwater, A.V. (1997). Overview of Fast Pyrolysis of the
Production of Liquid Fuels. In: Bridgwater, A.V. and Boocock,
D.G.B.(Ed.). Developments in Thermo- chemical Biomass Conversion
Volume 1. London: Blackie Academic and Professional. 5 – 23.
F.kamal et.al (2003). “Mutagenesis of Xanthomonas campestris and selection of
Strains with Enhanced Xanthan Production”. Iran. Biomed. Journal. 7 (3) 91-98.
Feighner, G.C. (1976). Anionic Surfactants, Vol.1. In: Linfield, W.M., Ed. New
York: Marcel Dekker. 253 – 314.
Gallivan, R.M. and Matschei, P.K. (1980). Fractionation of Oil Obtained by
Pyrolysis of Lignocellulosic Materials to Recover a Phenolic Fraction
for Use in Making Phenol Formaldehyde Rresin. (US Patent 4,209,647).
Gilliland, H.E. and Conley, F.R. (1976). Pilot Flood Mobilizes Residual Oil. Oil
and Gas Journal (Jan) 19. 43 – 48.
Gogarty, W.B and Tosch, W.C. (1968). Miscible–type Waterflooding: Oil
Recovery with Micellar Solutions. JPT (Dec). 1407 –1412.
Gogarty, W.B. (1976). Status of surfactant or micellar methods. Journal of
Petroleum Technology. Volume 28: 93–102
Goh Meng Seng (2002). Projek Sarjana Muda Kejuruteraan Petroleum UTM.
Greminger, D. C., Burns, G. P., Lynn, S., Hanson, D. N. and King, C. J.,(1982).
Solvent Extraction of Phenols from Water. Industrial & Engineering
Chemistry Process Design and Development, 21. 5l -54.
159
Healy, R.N. and Reed, R.L. (1977). Immiscible Microemulsion Flooding. SPEJ
(April). 129 –139.
Hernandez, Clara; Chacon, L.J., Anselmi, L., Baldonedo, A., Qi, J., Pitts, M.J.
(2001). ASP System Design for an Offshore Application in the La Salina
Field, Lake Maracaibo. SPE 69544 presented at the SPE Latin American
and Caribbean Petroleum Engineering Conference. 25 –28 March.
Buenos Aires, Argentina.
Hirasaki, G.J. (1981). Application of the Theory of Multicomponent,
Multiphase Displacement to Three - Component, Two – Phase
Surfactant Flooding. SPEJ (April). 191 – 204.
Holm, L.W. (1982). Design, Performance , and Evaluation of the Uniflood
Micellar-Polymer Process – Bell Creek Field. Paper SPE 11196.
Proceedings of the 57th Annual Fall Technical Conference of SPE. .New
Orleans, LA.
Iglauer, S., Wu., Y., Shuler, P.J., Blanco, M., Tang, Y., and Goddard III, W.A.
(2004). Alkyl Polyglycoside Surfactans for Improved Oil Recovery. SPE
89472 presented at 2004 SPE/DOE Fourteenth Symposium on Improved
Oil Recovery. 17 – 21 April. Tulsa, Oklahoma, U.S.A.
Islam, M.N., Zailani, R., and Ani, F.N. (1999). Pyrolytic Oil from Fluidized bed
Pyrolysis of Oil Palm Shell and Its Characterization. Renewable Energy.
Vol.17. 73 – 84.
J.A. Casas, V.E. Santos and F. Garcia-Ochoa (2000). “Xanthan gum production
under several operational conditions: molecular structure and rheological
properties”. Enzyme and Microbial Tech. 26. 282 – 291.
160
J.W. Lubach et.al. (2004). “Solid State NMR Studies of Pharmaceutical Solids In
Polymer Matrices”. Anal. Bioanal.Chem, 378, 1504 – 1510.
Jakobsen, S.R. and Hovland, F. (1994). Surfactant Flooding: Technical and
Economical Conditions to Succeed. SPE 27824 presented at the
SPE/DOE Ninth Symposium on Improved Oil Recovery. 17-20 April.
Tulsa, Oklahoma, U.S.A.
Jamil, M.K., Ani, F.N. (2000). Oil Palm Shell as a Source of Phenol. Journal of
Oil Palm Research. Vol.12 No.1. 86-84.
Kai Spila , Eeva Kuoppala, Leena Fagernae and Anja Oasmaa (1998),
Characterization of Biomass-Based Flash Pyrolysis Oil. Biomass and
Bioenergy. Vol. 14, No. 2. 103 – 113.
Kalpakci, B., Arf, T.G., Barker. J.W., Krupa, A.S., Morgan. J.C. and Neira, R.D.
(1990). The Low Tension Polymer Flood Approach to Cost Effective
Chemical EOR. SPE/DOE paper 20220. 7th Symposium on Enhanced Oil
Recovery. 22 – 25 April.Tulsa, Oklahoma.
Kishore Nadkarni, R.A. (2000). Guide to ASTM Test Methods for the Analysis
of Petroleum Products and Lubricants. ASTM International, West
Conshohocken, PA.
L.S.Guinesi, et.al. (2006). “Kinetics of Thermal Degradation Applied to Starches
from Different Botanical Origins by Non-isothermal Procedures”.
Thermochimica Acta.
L.Su, W.K. Ji, W.Z. Lan and X.Q. Dong. (2003) “Chemical modification of xanthan
gum to increase dissolution rate” Carbohydrate Polymers, 53, 497-499.
L.Yu and G.Christie. (2001). “Measurement of Starch Thermal Transitions Using
Differential Scanning Calorimetry”. Carbohydrate Polymers. 46. 179-184
161
Lake, L.W. (1989). Enhanced Oil Recovery. New Jersey: Prentice Hall, Inc.
Lake, L.W. and Pope, G.W. (1979). Status of Micellar – Polymer Field Tests.
Petroleum Engineer International. 38 – 60.
Larry, N.B. (2000). Toxicity and Persistence of Surfactants Used in the
Petroleum Industry. Surfactants: Fundamentals and Applications in the
Petroleum Industry. Cambridge University Press. 541 – 565.
Laura, L.W., Jeffrey, H.H. (2000). Surfactant Adsorption in Porous Medium,
Surfactants: Fundamentals and Applications in the Petroleum Industry.
UK: Cambridge University Press. 121 – 158.
M.J. Lopez and A.R.-Cormenzana. (1996). “Xanthan Production from Olive-Mill
Wastewaters”. Elsevier, 263-270.
M.Papagianni et.al. (2001).”Xanthan production by Xanthomonas Campestris in
Batch Cultures”. Process Biochemistry. 37, 73-80.
M.Papagianni et.al. (2001).”Xanthan production by Xanthomonas Campestris in
Batch Cultures”. Process Biochemistry. 37, 73-80.
Maerker, J.M. and Gale, W.W. (1992). Surfactant Flood Process Design for
Loudon, SPE Reservoir Eng. (Feb). 36 – 44.
Michels, A.M., Djojosoeparto, R.S., Haas, H., Mattern, R.B, Can der Weg., P.B
and Schulte, W.M. (1996). Enhanced Water Flooding Design Using
Dilute Surfactant Concentrations for North Sea Condition. SPE /DOE
35372 presented at the 10th SPE/DOE symposium in Improved Oil
Recovery. 21 -24 April. Tulsa, Oklahoma.
162
Nelson, R.C. and Pope, G.A. (1978). Phase Relationships in Chemical Flooding.
SPEJ 18, No.5. 325 – 338.
O.S. Azeez. (2005). “Production of Gum from Cashew Tree Latex”. Leonardo
Electronic J. of Practices and Tech, 7, 17-22.
Oasmaa, A and Peacocke, C. (2001). A Guide to Physical property
Characterisation of Biomass Derived Fast Pyrolysis Liquids.
Espoo,Finland: VTT Publication 450.
P. Adhikary and R.P. Singh. (2004). “Synthesis, Characterization and Flocculation
Characteristics of Hydrolyzed and Unhydrolyzed Polyacrylamide Grafted Xanthan
Gum”. J. of Applied Polymer Sci. 94, 1411-1419.
P. Aggarwal and D. Dollimore. (1997). “The Combustion of Starch, Cellulose And
Cationically Modified Products Of These Compounds Investigated Using Thermal
Analysis” Thermochimica Acta. 291. 65 -72.
Pope, G.A. and Nelson, R.C. (1978). A Chemical Flooding Compositional
Simulator. SPEJ Oct, vol 18. 339 – 354.
Rasheed, K., Carvey, R., Berger, P.D. and O’Brien, E. (1991). Alkoxylated Alkyl
Substituted Phenol Sulfonates Compounds and Compositions, the
Preparation thereof and Their Use in Various Applications. (United States
Patent 5,049,311)
Reppert, T.R., Bragg, J.R., Wilkinson, J.R., Snow, T.M., Maer Jr, N.K. and
Gale, W.W. (1990). Second Ripley Surfactant Flood Pilot Test. SPE/DOE
20219 presented at SPE/DOE Symposium on Enhanced Oil Recovery.
Tulsa, Oklahoma.
Rubinson, K.A. (1987). Chemical Analysis. Toronto: Little, Brown and
Company.
163
S.D.Yoo and S.W. Harcum (1999). “Xanthan Gum Production From Waste Sugar
Beet Pulp” Bioresource Tech. 70, 105-109.
S.Rosalam & R. England. (2005). “Review Of Xanthan Gum Production from
Unmodified Starches By Xanthomonas Campestris Sp”. Enzyme & Microbial
Tech. In press.
Sipila, K, Kuoppala, E, Fagernas, L, Oasmaa, A. (1998). Characterization of
Biomass-based Flash Pyrolysis Oils. Biomass and Bioenergy. Volume 14,
Number 2: 103-113.
Soltes, E.J (1988). Pyrolysis Oils from Biomass, Producing, Analyzing and
Upgrading. American Chemical Society Symposium Series 376. 1- 7.
Soltes, E.J and Elder, T.J (1983). Pyrolysis in Organic Chemicals from
Biomass. (Goldstein, I.S.ed.). Boca Raton, FL: CRC Press.
State of the Environment in Malaysia. Consumers’ Association of Penang.
Stosur, G.J. (2003). EOR: Past, Present and What the Next 25 Years May Bring.
SPE paper 84864. SPE International Improved Oil Recovery Conference.
20 – 21 Oct. K.L, Malaysia.
Suryo Purwono and Bardi Murachman (2002). Development of Surfactants and
Co-surfactants for EOR from Pyrolysis of Oil Palm Husks Lignin.
Proceedings of the 6th Asia Pacific international Symposium on
Combustion and energy Utilization. 20-22 May. Kuala Lumpur.
T.S.Gibson et. al. (1997).”A Procedure to Measure Amylose in Cereal Starches and
Flours with Concanavalin A”. J. of Cereal Sci. 25. 111-119.
Tabary, R., Bazin, B. (2007). Advances in Chemical Flooding. IFP - OAPEC
Joint Seminar "Improved Oil Recovery (IOR) Techniques and Their Role in
Boosting The Recovery Factor. 26-28 June 2007. Rueil-Malmaison, France.
164
Taber, J.J., Martin, F.D. and Seright, R.S. (1997). EOR Screening
CriteriaRevisited—Part 2: Applications and Impact of Oil Prices. SPERE
Aug. 199-205
Thomas, L.K., Dixon, T.N., Evans, C.E. and Vienot, M.E. (1987). Ekofisk
Waterflood Simulation. JPT Feb. 221-232.
Tiong Swee Tin (2003). Projek Sarjana Muda Kejuruteraan Petroleum UTM
Toft, A.J. and Bridgwater, A.V. (1996). Biomass Gasification and Pyrolysis.
Conference Papers for Applications of Bioenergy Technologies. NZ Forest
Research Institute, Rotorua, New Zealand. 78-90:
Toth, L.(1980). Separation and Analysis of Phenol Fractions from Smokehouse.
Fleischwjirtsch., 60. 728-736.
Vargo, J.J. (1978). Site Selection, Reservoir Definition and Estimation of
Tertiary target Oil for the Bell Creek Unit “A” Micellar Polymer Project.
SPE 7072. Proceedings of the 5th Symposium on Improved Methods for
Oil Recovery of the SPE of AIME. 16 -19 April. Tulsa, OK.
Wellington, S.L. and Richardson, E. A. (1995). Low Surfactant Concentration
Enhanced Water Flooding. SPE 30748. 70th Annual Technical Conference
& Exhibition of the SPE. Oct. 22-25. Dallas, T.
Whiteley, R.C. and Ware, J.W. (1977). Low Tension Water Flood Pilot at the
Salem Unit, Marion Country, Illinois – Part I: Field Implementation and
Results. JPT Aug. 925 –932.
Widmyer, R.H., G.D. Frazier, L.K. Strange, and Talash, A.W (1979). Low
Tension Water Flood at Salem Unit: Post Pilot Evaluation. JPT Sep. 1185
–1190.
165
Wilson, J.F. (1960). Miscible Displacement – Flow Behavior and Phase
Relationships for a Partially Depleted Reservoir. Trans, AIME 219.
Won, K.W. and Prausnitz, J.M. (1975). Distribution of Phenolic Solutes
between water and Polar Organic Solvents. Journal of Chemistry
Thermodynamic, 7. 661 – 670.
Wong Chuan Chin (2002). Thermochemical Recycling of Oil Palm Shell to
Phenolic Resin. Universiti Teknologi Malaysia: Master Thesis.
Wong, C.C., Ani, F.N. and Nor, H.M. (2003). Quantification of Extracted
Pyrolysis Oil from Oil Palm Shells. Proceedings of International
Conference on Chemical and Bioprocess Engineering. 27-29 August. 39-
43.
Y.Brummer , W.Cui and Q.Wang. (2003). “Extraction, Purification and
Physicochemical Characterization of Fenugreek Gum”, Food hydrocolloids, 17,
229-236.
Yassin, A.A.M. (1988). Enhanced Oil Recovery in Malaysia. SPE 17693.
Proceedings of the 7th Offshore South East Asia Conference. 2 – 5
February. Singapore.
Yatim, B.B (1996). Energy: Options for Malaysia’s Industrial Development, in
State of the Environment in Malaysia. Consumers’ Association of Penang.
Zaitoun, A. and Berger, P. (2003). New Surfactant for Chemical Flood in High
Salinity Reservoir. SPE 80237. SPE International Symposium on Oilfield
Chemistry. 5 – 7 February. Houston, Texas.
166
\
LIST OF PUBLICATIONS
Goh Meng Seng, Mariyamni Awang, Lim Xin Yi, Farid NasirAni (2006).
“Production of Pyrolytic oil for Enhanced Oil Recovery. 1st International
Conference on Natural Resources Engineering and Technology (INRET-2006),
24-25 July, Putrajaya Malaysia
v
TABLE OF CONTENTS
CHAPTER TITLE PAGE
TITLE
ACKNOWLEGMENTS
ABSTRACT
ABSTRAK
TABLE OF CONTENTS
LIST OF TABLE
LIST OF FIGURES
LIST OF SYMBOLS
LIST OF ABBREVIATIONS
i
ii
iii
iv
v
xi
xiv
xx
xxi
1 INTRODUCTION 1
1.1 Overview 1
1.1.1 Introduction on enhanced oil recovery (EOR) 1
1.1.2 Introduction on surfactant 2
1.1.3 Introduction on xanthan gum 4
1.2 Statement of Problems 6
1.3 Objectives 7
1.4 Scopes 7
vi
2 LITERATURE REVIEW 9
2.1 Surfactant Polymer Flooding 9
2.1.1 Field Tests 14
2.2 EOR Chemicals 16
2.2.1 Surfactants 18
2.2.1.1 Alcohol Ether Sulfates (AES) 20
2.2.1.2 Alcohol Ethoxylates
(Alkoxylates) 21
2.2.1.3 Alkyl Aryl Sulfonates and
Petroleum Sulfonates 21
2.2.1.4 Alkyl Phenol Ethoxylates
(APE) 22
2.2.1.5 Dialkyl Sulfosuccintates 23
2.2.1.6 Quaternary Ammonium
Surfactant 23
2.2.1.7 Fast Pyrolysis Principles 24
2.2.1.8 Pyrolysis Oil 27
2.2.2 Extraction of Phenol from
Pyrolysis Oil 31
2.2.3 Basic Chemistry of Sulfonation and
Sulfatation 39
2.2.4 Ethoxylated Alkyl-Phenols 40
2.2.5 Synthesis of New Alkylaryl Sulfonic
Acids as Potential Surfactant for
EOR Application 41
2.2.5.1 Example of Preparation of
Alkoxylated Alkylphenol
Sulfonic Acid 44
2.3 Xanthan gum 45
vii
3 MATERIALS AND METHODOLOGY 51
3.1 Preparation of surfactants 51
3.1.1 Procedures 51
3.1.2 Production of pyrolysis oil 52
3.1.3 Material 53
3.1.4 Experiments 53
3.1.5 Characterization of Pyrolysis Oil 56
3.1.6 Density 56
3.1.7 Kinematic Viscosity 56
3.1.8 Pour Point 58
3.1.9 Heating Value 60
3.2 Flash Point 60
3.2.1 Acidity 61
3.2.2 Infra – Red (IR) Characterization 61
3.2.3 Miscibility 62
3.2.4 GC – MS Analysis 62
3.3 Extraction of Phenols from Pyrolysis Oil 63
3.3.1 Sulfonation 65
3.3.2 Sulfonation of Alpha Olefin 65
3.3.3 Sulfonation and Alkylation of
Extracted Pyrolysis Oil 66
3.3.4 Analysis of Surfactant 69
3.3.5 Acid Value 70
3.3.6 Hyamine Titration for Anionic
Active Matter Using Methylene
Blue Indicator 71
3.3.7 Surface Tension Measurements 72
3.4 Preparation of xanthan gum 73
3.4.1 Microorganisms 73
viii
3.4.2 Slant Culture Inoculum 73
3.4.3 Culture Media 75
3.4.4 Local fruit juices shaker fermentations 76
3.4.4.1 Inoculum preparation 76
3.4.4.2 Experiment method 76
3.4.4.3 Local fruits 76
3.4.5 Analytical methods 78
3.4.5.1 Extraction and purification
process of Xanthan Gum 78
3.4.5.2 Pyruvate and acetate content 79
3.4.5.3 Gelatinization of refined
xanthan gum 80
3.4.5.4 Viscosity measurements 80
3.4.5.5 FTIR analysis 80
3.4.5.6 Glucose Concentration 81
3.4.5.7 Solid-state NMR Spectrocopy 81
3.4.5.8 Oil Displacement Experiment 81
4 RESULTS AND DISCUSSION 84
4.1 Production of surfactant 84
4.2.1 Physical and Chemical Characterization
of Pyrolysis Oil 84
4.1.2 Physical Properties of Pyrolysis Oil 85
4.1.3 Solubility with Water and
Other Solvents 87
4.1.4 FTIR Characterization 89
4.1.5 GC – MS Characterization 93
4.1.6 Extraction of Phenolic Compounds 97
4.1.7 Liquid-liquid Extraction of Phenols
from Pyrolysis Oil 97
4.1.8 Identification and Quantification
of Extracted Pyrolysis Oil 100
ix
4.1.9 Sulfonation of Alpha Olefin 102
4.1.9.1 Sulfonation of 1-Tetradecene using
1.2 Mole Ratio of SO3 102
4.1.9.2 Sulfonation of 1-Hexadecene using
1.2 Mole Ratio of SO3 104
4.1.9.3 Alkylation and Sulfonation
of the Extracted Oil Using Alpha
Olefin Sulfonic Acid 106
4.1.9.4 Alkylation and Sulfonation of
the Pyrolysis Oil using Alpha
Olefin Sulfonic Acid 108
4.1.9.4 FTIR Characterization of Produced 109
Surfactants
4.2 Production of Xanthan Gum from Local Fruits 110
4.2.1 Dry weight of xanthan gum produced 110
4.2.2 FTIR Characterization of Produced Xanthan
Gum 111
4.2.2.1 Unrefined Xanthan Gum Produced 111
4.2.2.2 Refined Xanthan Gum Produced 112
4.2.2.3 Viscosity Measurements 114
4.2.2.4 Gelatinization of Refined
Xanthan Gum 122
4.2.2.5 Glucose Concentration of
Fruits juice 124
4.2.2.6 Pyruvate and Acetate Content 124
4.2.2.7 Solid State 13C NMR 126
4.3 Dry weight of Xanthan Gum Produced from
local starches via shaker fermentation 127
4.3.1 IR Spectroscopy 128
4.3.1.1 Unrefinen Xanthan Gum Produced 128
4.3.1.2 Refined Xanthan Gum Produced 129
4.3.1.3 Viscosity Measurement 130
4.3.1.4 Pyruvate and acetate content 134

x
4.3.1.5 Gelatinization of refined
xanthan gum 136
4.3.1.6 Measurement of Amylose
And Amylopection using TGA 138
4.3.2 Surfactant Polymer Flooding 142
4.3.2.1 Surfactant Produced and Polymer
Commercial as Additive 142
4.3.2.2 Surfactant And Polymer Produced From
Local Starches As Additive 146
4.3.2.3 Surfactant And Polymer Produced From
Local Fruits As Additive 149 5 CONCLUSIONS AND RECOMMENDATIONS 153
5.1 Conclusions 153
5.2 Recommendations 155
REFERENCES 156
LIST OF PUBLICATIONS 166
xi
LIST OF TABLES
TABLE NO. TITLE PAGE
2.1 Physical properties of different pyrolysis oils 27
2.2 Identification and quantification of chemical
compounds in pyrolysis oil from oil palm shell
(Islam et al., 1999) 30
3.1 Different extraction conditions set 65
3.2 Types of the surfactant used in the experiment 67
3.3 Estimation of sample size for acid value
determination 70
3.4 Details of the oil displacement experiment 82
4.1 Physical properties of palm shell pyrolysis oil
and its comparison 85
4.2 FTIR functional groups and the indicated
compounds of the pyrolysis oil 92
4.3 Tentative GC – MS characterization of
pyrolysis oil A from oil palm shell 94
4.4 Tentative GC – MS characterization of
pyrolysis oil B from oil palm shell 95
4.5 Yields of pyrolysis oil based on starting oil
In experiment run no.1 97
4.6 Yields of pyrolysis oil based on starting oil
xii
in experiment run no.2 98
4.7 Yields of phenol/neutral fraction based on
starting oil (without NaOH) 99
4.8 Identification of chemical compounds in
extracted oil (without NaOH) 101
4.9 Acid value of C14 AOS acid 103
4.10 Acid value of C16 AOS acid 104
4.11 Experiment details for alkylation and
sulfonation by AOS acid 106
4.12 Acid value of C14 sulfonated pyrolysis oil 107
4.13 Acid value of C16 sulfonated pyrolysis oil 107
4.14 Anionic active matter and CMC of
surfactants produced 108
4.15 Surface tension of surfactants in
concentration of 5 wt% 108
4.1.6 Experiment detail for alkylation and sulfonation
by AOS acid 109
4.17 Anionic active matter and CMC of surfactants produced 109
4.18 Surface tension of surfactants in concentration of 5 wt % 109
4.19 FTIR Spectra Data (cm-1) of xanthan gum unpurified 112
4.20 FTIR Spectra Data (cm-1) of xanthan gum purified
after dry at 50° C 113
4.16 Displacement recovery performance of
different surfactants 109
4.17 Weight of refined xanthan gum after purification process 114
4.18 FTIR Spectra Data (cm-1) of xanthan gum unpurified 128
4.19 FTIR Spectra Data (cm-1) of xanthan gum

xiii
purified after dry at 50° C 130
4.20 Thermogravimetric analysis of starches 138
4.21 Thermal degradation of starches using TGA 139
4.22 Displacement recovery performance of different surfactants 145
4.23 Summary of sandpack flood tests 146
4.24 Summary of sandpack flood tests 149
xiv
LIST OF FIGURES
FIGURE NO. TITLE PAGE
2.1 Schematic illustration of a surfactant polymer
flooding 11
2.2 Schematic capillary desaturation curve for a
nonwetting phase (Lake, 1989) 12
2.3 Schematic illustration of a LTPF 13
2.4 Representative surfactant molecular structures
(Larry, 2000) 19
2.5 Typical yields of organic liquid, reaction water,
gas and char from fast pyrolysis of wood, wt% on
dry feed basis (Toft and Bridgwater, 1996) 25
2.6 Conceptual fluid bed fast pyrolysis process
(Bridgwater and Peacocke, 1999) 27
2.7 Flow sheet of extraction of phenol from
pyrolysis oil (Gavillian et al., 1980) 33
2.8 Liquid-liquid extraction of phenols from
primary oil (Carlos et al., 1997) 38
xv
2.9 Flow sheet of extraction of phenol from oil palm
shell pyrolysis oil (Jamil et al., 2000) 33
2.10 Comparison of conventional and new
process alkylphenol sulfonic acid 42
2.11 Reaction of alpha olefin sulfonic acid
with alkylaryl compounds 43
2.12 The repeating unit of xanthan gum 46
2.13 Building Units of Starch (a) Amylose and
(b) Amylopectin 47
2.14 The repeating unit of xanthan gum 48
3.1 Flow chart of surfactant production process 52
3.2 Flow chart of pyrolysis production process 53
3.3 Pyrolysis process – general layout 55
3.4 Fludized bed pyrolysis unit 55
3.5 Koehler KV 3000 58
3.6 Pour point measurements 59
3.7 Koehler rapid tester model K16491 61
3.8 Extraction of phenol from pyrolysis oil 64
3.9 Sulfonation unit with falling film reactor 68
3.10 Sulfonation and alkylation of extracted
pyrolysis oil 69
3.11 Tensiometer K6 72
3.12 Stock cultures of xanthomonas campestris
in 7 mL sterile YM 74
3.13 Colonies of xanthomonas campestris on a streak plate 74
3.14 Stock cultures of xanthomonas campestris
xvi
microcentrifuge tubes 75
3.15 Flow chart of preparation of local fruits 77
3.16 Flow chart representatives of the extraction
and purification process of xanthan gum
produced using local carbon sources 79
3.17 Experimental apparatus for displacement experiment 83
4.1 The solubility of pyrolysis oil in methanol in
1:1 volume fraction 88
4.2 The dissolubility of pyrolysis oil in hexadecene in
1:1 volume fraction 88
4.3 Infra-red spectrum of pyrolysis A from
oil palm shell 90
4.4 Infra-red spectrum of pyrolysis B from
oil palm shell 90
4.5 Infra-red spectrum of pyrolysis C from
oil palm shell 91
4.6 Infra-red spectrum of pyrolysis D from
oil palm shell 91
4.7 Infra-red spectrum of extracted phenolic and
neutral fractions 100
4.8 Infra-red spectrum of 1- Hexadecene 105
4.9 Infra-red spectrum of C16 AOS acid 105
4.10 Dry weights (g/L) of produced Xanthan gum 111
4.11 Comparison viscosity graph for xanthan gum
commercial and unrefined in distilled water (DW) 116
4.12 Comparison shear stress graph for xanthan gum commercial
xvii
and unrefined xanthan gum in distilled water (DW) 116
4.13 Comparison viscosities of unrefined
xanthan gum in 0.2 % w/v NaCl 117
4.14 Comparison viscosities of unrefined
xanthan gum in 0.4 % w/v NaCl 117
4.15 Comparison shear stress graph for
unrefined xanthan gum in 0.2 % w/v NaCl 118
4.16 Comparison shear stress graph
for unrefined xanthan gum in 0.4 % w/v NaCl 118
4.17 Comparison viscosity graph for refined
xanthan gum in distilled water (DW) 119
4.18 Comparison shear stress graph for
refined xanthan gum in distilled water (DW) 119
4.19 Comparison viscosities of refine
xanthan gum in 0.2 % w/v of NaCl 120
4.20 Comparison viscosities of refine
xanthan gum in 0.4 % w/v of NaCl 120
4.21 Comparison shear stress graph
for refine xanthan gum in 0.2 % w/v of NaCl 121
4.22 Comparison shear stress graph for
refine xanthan gum in 0.4 % w/v of NaCl 121
4.23 The gelling of refined xanthan gum
{1500 ppm, 10 : 1 ratio of XG to Cr (III)} 122
4.24 Gelling of refined xanthan gum after 2 days at 60° C 123
4.25 Gelling of refined xanthan gum after 6 days at 60° C 123
4.26 Glucose concentration of fruits juice as carbon sources 124
4.27 Acetate content of 72 h xanthan samples
from shaker fermentor 125
4.28 Pyruvate content of 72 h xanthan samples
from shake fermentor 126
4.29 Dry weights (g/L) of produced xanthan gum from starches 127
4.30 Comparison viscosity graph for xanthan gum
refined in distilled water (DW) 131
xviii
4.31 Comparison shear stress graph for xanthan gum
refined xanthan gum in distilled water (DW) 132
4.32 Comparison viscosities of refined
xanthan gum in 0.2 % w/v NaCl 132
4.33 Comparison viscosities of refined
xanthan gum in 0.4 % w/v NaCl 133
4.34 Comparison shear stress graph for
refined xanthan gum in 0.2 % w/v NaCl 133
4.35 Comparison shear stress graph for
refined xanthan gum in 0.4 % w/v NaCl 134
4.36 Acetate content of 72 h xanthan samples
from shaker fermentor 135
4.37 Pyruvate content of 72 h xanthan samples 135
4.38 The gelling of refined xanthan gum
{1500 ppm, 10 : 1 ratio of XG to Cr (III)} 136
4.39 Gelling of refined xanthan gum after 2 days at 60° C 137
4.40 Gelling of refined xanthan gum after 5 days at 60° C 137
4.41 Thermogravimetric curves for tapiocastarch measured
at heating rate of 20º C min-1 under nitrogen 140
4.42 Thermogravimetric curves for rice starch measured
at heating rate of 20º C min-1 under nitrogen 140
4.43 Thermogravimetric curves for Sago starch measured
at heating rate of 20º C min-1 under nitrogen 141
4.44 Thermogravimetric curves for Sweet potato starch
measured at heating rate of 20º C min-1 under nitrogen 141
4.45 Infra-red spectrum of SURF 1 142
4.46 The oil recoveries due to waterflooding
and subsequent surfactant polymer flooding 143
xix
4.47 The performance of waterflooding succeeded
by surfactant polymer flooding 144
4.48 The performance of waterflooding succeeded
by surfactant polymer flooding 148
4.49 The oil recoveries due to waterflooding
and subsequent surfactant polymer flooding 148
4.50 The performance of waterflooding succeeded
by surfactant polymer flooding 150
4.51 The oil recoveries due to waterflooding and subsequent
surfactant polymer flooding 151
4.52 The sand pack saturated with oil dyed red
(before flooding) 152
4.53 The sand pack after waterflooding succeeded
by surfactant polymer injection 152
xx
LIST OF SYMBOLS
Nc - Capillary number
Ncri - Critical capillary number
Wa - Weight of pcynometer
Wf - Weight of pcynometer with sampel
µw - Viscosity of displacing fluid
θ - Contact angle
ν - Effective flow rate
σ - Interfacial tension
Sorw - Residual oil saturation

xxi
LIST OF ABBREVIATIONS
AES - Alcohol ether sulfates
AOS - Alpha olefin sulfonate
APE - Alkyl phenol ethoxylates
APG - Alkyl polyglycosides
ASP - Alkaline surfactant polymer
AV - Acid value
BO - Butylene oxide
CMC - Critical micelle concentration
DDBS - Dodecylbenzene sulfonate
EO - Ethylene oxide
EON - Ethylene oxide number
EOR - Enhanced oil recovery
FTIR - Fourier transform infra-red
GC– MS - Gas chromatography – mass spectrometry
I.D. - Inner diameter
IFT - Interfacial tension
IR - Infra-red
LTPF - Low tension polymer flood
M - Molarity
N - Normality
NPE - Nonylphenol ethoxylate
OOIP - Original oil in place
OPE - Octylphenol ethoxylate
O/W - Oil/water
PO - Propylene oxide
POME - Palm oil mill effluent
ppm - Part per million
PV - Pore volume
ROIP - Residual oil in place
rpm - Revolutions per minute
UTM - Universiti Teknologi Malaysia
wt - Weight