addressing coastal vulnerabilities and mitigating losses · addressing coastal vulnerabilities and...
TRANSCRIPT

Addressing Coastal Vulnerabilities and Mitigating Losses
July 19, 2016

Webinar Outline
• Introduction to Research
• Mabel A. Rodriguez• State and Local Resiliency Efforts• Public Officials Survey Results
• Matt Walker• Public Sector Response Typology• Innovation Competitions
• Dr. Maria Ilcheva• Residential Survey Results

Research Focus
9 Counties:
• Miami-Dade
• Broward
• Palm Beach
• Pinellas
• Hillsborough
• Manatee
• Pasco
• Duval
• St. Johns
Source: Geology.com

Top Florida Zip Codes At Risk From SLR, < 3 ft.
Source: Strauss, 2014. Florida and the Surging Sea: A Vulnerability Assessment with Projections for Sea Level Rise and Coastal Flood Risk

Top Florida Zip Codes At Risk From SLR, < 6 ft.
Source: Strauss, 2014. Florida and the Surging Sea: A Vulnerability Assessment with Projections for Sea Level Rise and Coastal Flood Risk

Infrastructure Interdependencies
Source: Wilbanks, 2012. Climate Change and Infrastructure, Urban Systems, and Vulnerabilities

State Efforts – Land Use Policy & Regulatory Measures

• In 2011, the Florida legislature added to Chapter 163 the term “Adaptation Action Area” and authorized local governments to enact code provisions within their comprehensive plans.
• In 2015, the Florida Senate passed SB 1094, which is the first time that state law has required local governments to take into account future forms of flooding, including flooding from sea-level rise, when doing development, redevelopment and engineering plans in coastal areas.
• In 2016, the Board of Directors of The Florida Association of the American Institute of Architects (AIA Florida) unanimously adopted a new position advocating building and community design based on inevitable sea-level rise. As a general guideline, they recommend that building designs, codes, and infrastructure accommodate three feet of sea level rise for projects in all low-lying areas, even those farther inland and up tidal rivers.
State Efforts – Land Use Policy & Regulatory Measures

Local Efforts – Mitigation & Adaptation Measures
Examples of measures that have been implemented in cities across Florida include: • Zoning and coding improvements• Retrofitting existing structures• Utilizing natural barriers such as dunes and mangrove forests• Installing stormwater pumps• Water efficiency upgrades• Strengthening and raising roads and seawalls to a minimum elevation• Installing black flow preventers and duckbill valves due to nuisance flooding• Increasing stormwater fees for system improvements• Incentivizing and/or requiring adaptation on private property • Sustainability programs within the community and government operations such as:
polystyrene bans, recycling ordinances, litter ordinances, energy and water conservation, public transit initiatives, increasing electric vehicle charging stations network and greenhouse gas emissions inventories.
• Increasing public awareness and engagement by informing and incentivizing residents, businesses and organizations to assist the community with these best practices.

In May of 2016, Miami-Dade County Mayor
Carlos A. Gimenez, Miami Mayor Tomás P.
Regalado, and Miami Beach Mayor Philip
Levine, joined by The Rockefeller Foundation
Chief Operating Officer Peter Madonia and
Amy Armstrong, Director of City
Relationships at 100 Resilient Cities,
celebrated their region’s selection to the 100
Resilient Cities (100RC) global network. The
mayors noted that by participating in the
100RC network, the Miami region will be
better equipped to solve local challenges
around transportation, economic equality,
sea level rise, aging infrastructure, and more
(The Miami Foundation, 2016).
Miami Highlight – 100RC Network
Source: 100ResilientCities.org

Public Officials Survey ResultsThe FIU Metropolitan Center interviewed 27 public officials, 18 being from the Southeast region.
• Most of the interviewed officials have a clear understanding of the hazards specific to their communities.
• Over half of them are directly involved in a climate change committee or more specifically, a sea-level rise committee, and those participating in the Compact have a Chief Resiliency Officer or equivalent in place.
• The majority work with the leads of their climate initiatives to integrate climate change into their Local Mitigation Strategy, Land Use Plans, Sustainability Plans, Master Plans and Emergency Management Plans.
• Many communities in Florida are implementing similar measures to build resilience, particularly between the Compact counties which are guided by the U.S. Army Corps of Engineers projections.
• Regarding formal evaluations and modeling, the majority stated that either their county officials and/or outside consulting firms have conducted hazard vulnerability and risk assessments or resiliency studies.
• Major Finding: All Regional Planning Councils (RPCs) utilize the Sea, Lake and Overland Surge from Hurricanes (SLOSH) model for evacuation planning which does not include sea level rise projections.
• Most Florida counties have received limited funding for studies and distinct planning projects from agencies such as the DEP and NOAA and the Emergency Management Division receives FEMA and DHS funding.

Public Officials Survey Conclusion
• The need for a coordinated, well-funded approach involving federal, state and local collaboration.
• Leaders at all levels of government have to take seriously the risks facing communities, the urgency of the issues and the need for sustainable action.
• A wide array of solutions that fall into three categories: defending against the sea, accommodating rising water and retreating from the immediate shoreline.
• There is an awareness of what needs to be done and many communities are implementing similar mitigation and adaptation measures, particularly between the Compact counties— Miami-Dade, Broward, Palm Beach and Monroe.
• As for hurricane damage in the context of sea-level rise, the focus has been on defending against the sea (e.g. hard and soft protection) and accommodating rising water (e.g. retrofitting, updating design standards and stormwater management) rather than limiting new development in high-risk areas.
• Overall, the various approaches for risk management that are emerging from initiatives at the state, county and city level can continue to propel Florida in the right direction.

HUD-Innovation Competitions
Project Locale Awarded
Big U Manhattan, NY $335 Million
Resist, Delay,
Store, Discharge Hoboken, NJ $230 Million
New Meadowlands Meadowlands, NJ $150 Million
Living with the Bay Long Island, NY $125 Million
Living Breakwaters Staten Island, NY $60 Million
Hunts Point
Lifelines Bronx, NY $20 Million
Total $930 Million
Rebuild by Design Winners
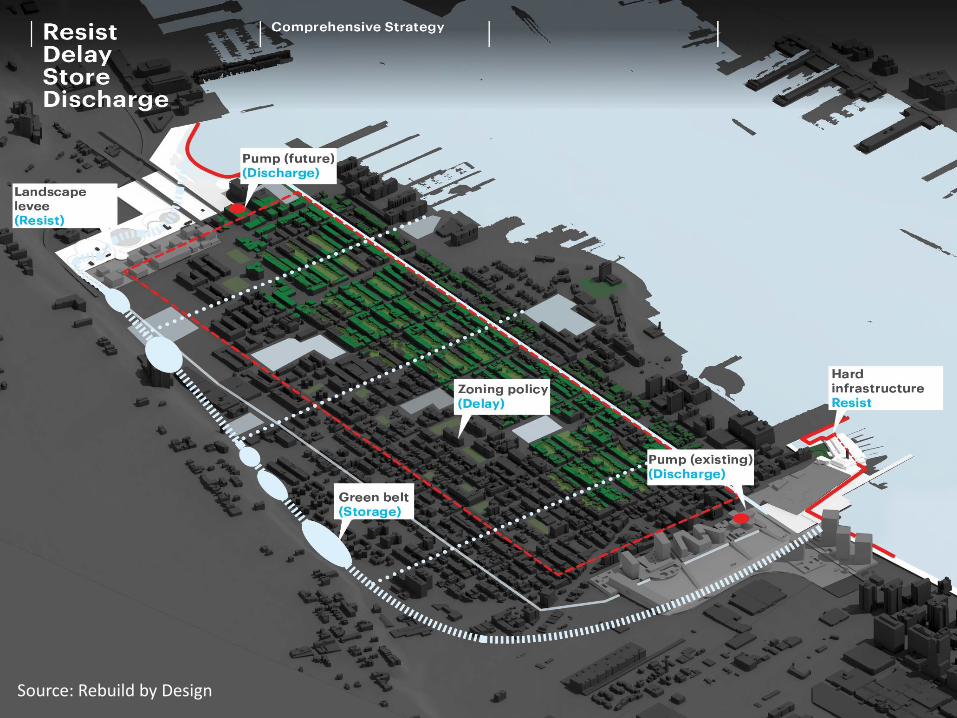
Source: Rebuild by Design

HUD-Innovation Competitions
Project Awarded Project Awarded
New York City, NY $176,000,000 Shelby County, TN $60,445,163
New Orleans, LA $141,260,569 Connecticut $54,277,359
Virginia $120,549,000 Tennessee $44,502,374
Iowa $96,887,177 New York $35,800,000
Louisiana $92,629,249 Springfield, MA $17,056,880
Minot, ND $74,340,770 New Jersey $15,000,000
California $70,359,459
Total $1 Billion
National Disaster Resilience Competition

Source: Rebuild by Design

Making a Matrix of Solutions
• Combine multiple tools and policies to create multifaceted long-term plans and strategies
• Rethink traditional methods and utilize national and international innovation and creativity
• Involve community to formulate solutions (residents, public and private stakeholders)
How to Use:
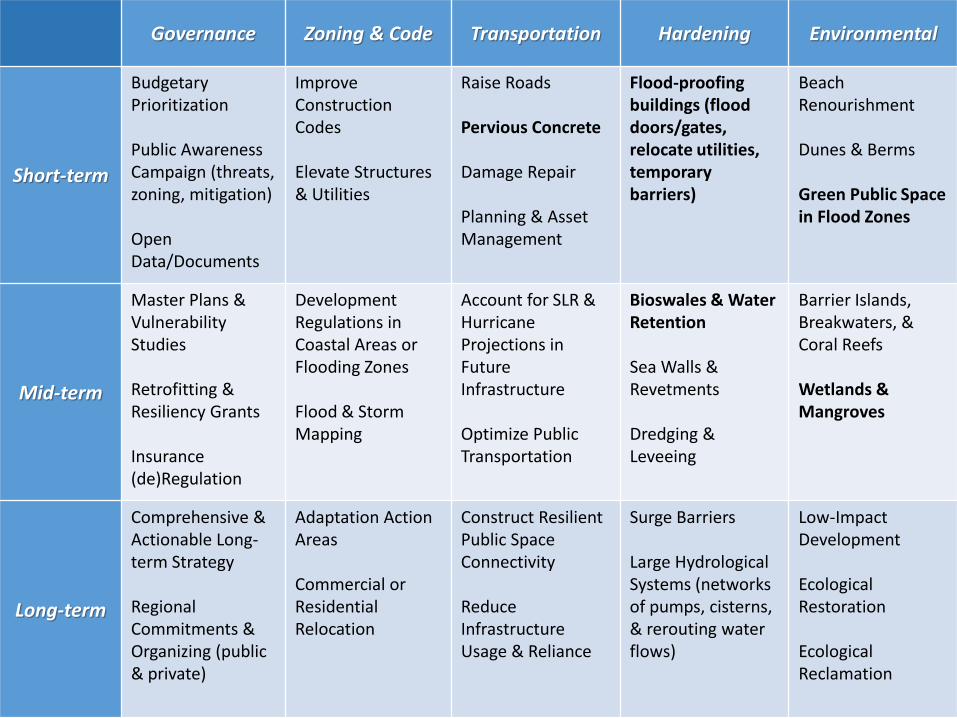
Governance Zoning & Code Transportation Hardening Environmental
Short-term
Budgetary Prioritization
Public Awareness Campaign (threats, zoning, mitigation)
Open Data/Documents
Improve Construction Codes
Elevate Structures & Utilities
Raise Roads
Pervious Concrete
Damage Repair
Planning & Asset Management
Flood-proofing buildings (flood doors/gates, relocate utilities, temporary barriers)
BeachRenourishment
Dunes & Berms
Green Public Space in Flood Zones
Mid-term
Master Plans &VulnerabilityStudies
Retrofitting & Resiliency Grants
Insurance (de)Regulation
Development Regulations in Coastal Areas or Flooding Zones
Flood & Storm Mapping
Account for SLR & Hurricane Projections in Future Infrastructure
Optimize Public Transportation
Bioswales & Water Retention
Sea Walls & Revetments
Dredging & Leveeing
Barrier Islands,Breakwaters, & Coral Reefs
Wetlands &Mangroves
Long-term
Comprehensive & Actionable Long-term Strategy
Regional Commitments & Organizing (public & private)
Adaptation ActionAreas
Commercial or Residential Relocation
Construct ResilientPublic Space Connectivity
Reduce Infrastructure Usage & Reliance
Surge Barriers
Large Hydrological Systems (networks of pumps, cisterns, & rerouting water flows)
Low-Impact Development
Ecological Restoration
Ecological Reclamation

Pervious Concrete
Source: Tarmac (UK)

Flood Proofing Buildings
Source: Flood Panel

Flood Proofing Buildings

Bioswales & Water Retention
Source: St. Johns Riverkeeper

Public Space as a Flood Zone
Source: DE URBANISTEN

Public Space as a Flood Zone
Source: DE URBANISTEN

Wetlands & Mangroves
Source: WAVES, World Bank Group

Source: WAVES, World Bank Group
Wetlands & Mangroves

Governance Zoning & Code Transportation Hardening Environmental
Short-term
Budgetary Prioritization
Public Awareness Campaign (threats, zoning, mitigation)
Open Data/Documents
Improve Construction Codes
Elevate Structures & Utilities
Raise Roads
Pervious Concrete
Damage Repair
Planning & Asset Management
Flood-proofing buildings (flood doors/gates, relocate utilities, temporary barriers)
BeachRenourishment
Dunes & Berms
Green Public Space in Flood Zones
Mid-term
Master Plans &VulnerabilityStudies
Retrofitting & Resiliency Grants
Insurance (de)Regulation
Development Regulations in Coastal Areas or Flooding Zones
Flood & Storm Mapping
Account for SLR & Hurricane Projections in Future Infrastructure
Optimize Public Transportation
Bioswales & Water Retention
Sea Walls & Revetments
Dredging & Leveeing
Barrier Islands,Breakwaters, & Coral Reefs
Wetlands &Mangroves
Long-term
Comprehensive & Actionable Long-term Strategy
Regional Commitments & Organizing (public & private)
Adaptation ActionAreas
Commercial or Residential Relocation
Construct ResilientPublic Space Connectivity
Reduce Infrastructure Usage & Reliance
Surge Barriers
Large Hydrological Systems (networks of pumps, cisterns, & rerouting water flows)
Low-Impact Development
Ecological Restoration
Ecological Reclamation

Florida Resident Perceptions
• Track changes in homeowner perceptions of hurricane threat, risk and potential mitigation measures
• Sea Level Rise – any effect?
• Trend analysis of hurricane risk in coastal counties

Respondent Characteristics
600 respondents from coastal counties
20 percent of interviews in Spanish
67 percent in single family homes
74 percent homeowners
78 percent residing in Florida for 10+ years
Hurricane Experience:Tropical Storm: 27%Hurricane (1 or 2): 15%Hurricane (3 and higher): 27% None: 32%
Hurricane Damage:21% had their home damaged, the majority with moderate or major damage (windows or roof)
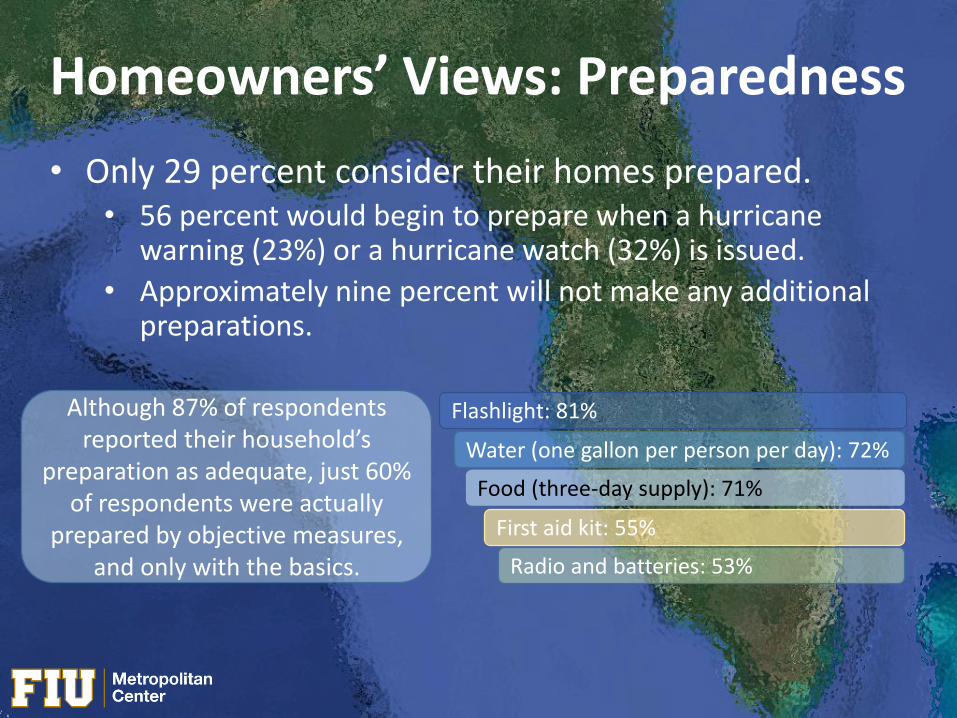
Homeowners’ Views: Preparedness
• Only 29 percent consider their homes prepared. • 56 percent would begin to prepare when a hurricane
warning (23%) or a hurricane watch (32%) is issued.
• Approximately nine percent will not make any additional preparations.
Although 87% of respondents reported their household’s
preparation as adequate, just 60% of respondents were actually
prepared by objective measures, and only with the basics.
Flashlight: 81%
Water (one gallon per person per day): 72%
Food (three-day supply): 71%
Radio and batteries: 53%
First aid kit: 55%
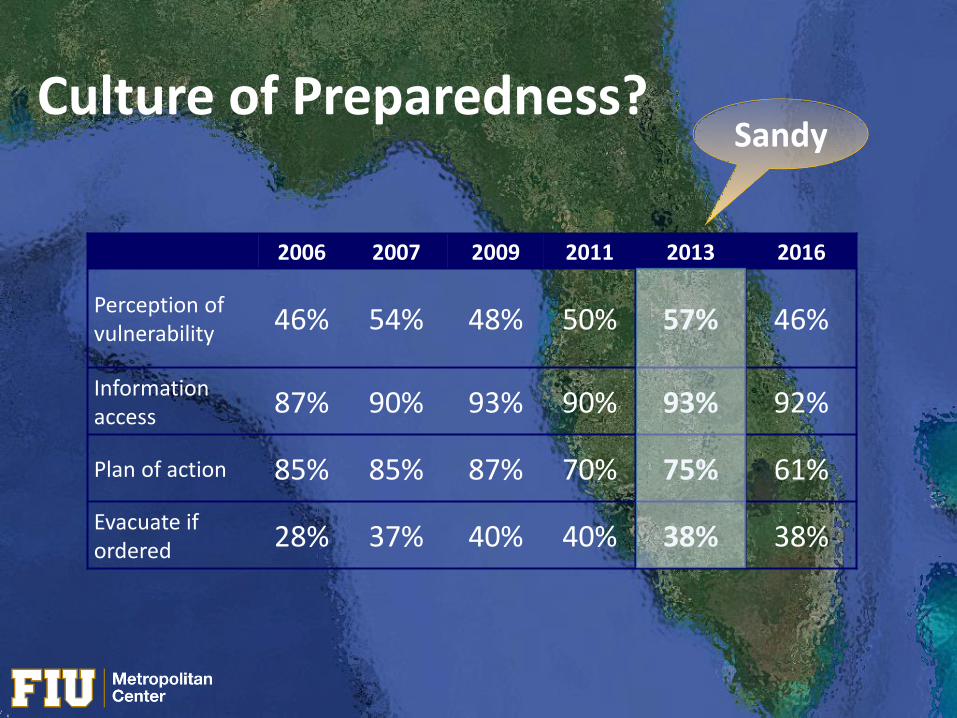
Culture of Preparedness?
2006 2007 2009 2011 2013 2016
Perception of vulnerability 46% 54% 48% 50% 57% 46%
Information access 87% 90% 93% 90% 93% 92%
Plan of action 85% 85% 87% 70% 75% 61%
Evacuate if ordered 28% 37% 40% 40% 38% 38%
Sandy
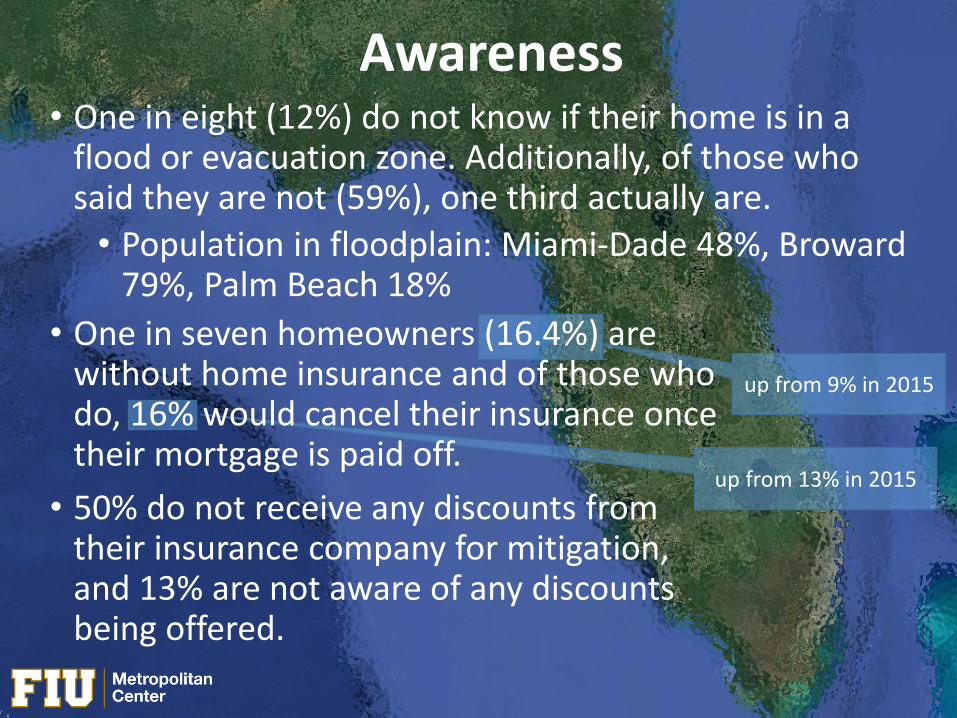
up from 9% in 2015
up from 13% in 2015
Awareness• One in eight (12%) do not know if their home is in a
flood or evacuation zone. Additionally, of those who said they are not (59%), one third actually are.
• Population in floodplain: Miami-Dade 48%, Broward 79%, Palm Beach 18%
• One in seven homeowners (16.4%) are without home insurance and of those who do, 16% would cancel their insurance once their mortgage is paid off.
• 50% do not receive any discounts from their insurance company for mitigation, and 13% are not aware of any discounts being offered.

Sea Level Rise
• Half either do not believe sea level rise is happening or they do not know.
• Only 22 percent think they will be affected.
How much do you think each of these actors should do to reduce the effects of rising sea level in the future?
A great deal(leading role)
Some(supporting role)
A little (minor role)
Nothing
Federal Government
52% 27% 6% 16%
State government and agencies
53% 26% 7% 14%
Local governments near the coast
61% 20% 5% 14%
Businesses near the coast
42% 30% 10% 17%
Homeowners near the coast
48% 26% 10% 16%
Real estate developers
48% 25% 7% 20%
General public 42% 30% 11% 17%Scientists 66% 15% 6% 13%
Up from 41%
Up from 35%Up from 52% in 2015

17%
25%
25%
37%
40%
44%
Utilize land purchase/buyoutprograms.
Develop a climate adaptation plan.
Utilize private land for public good [i.e.natural buffers such as dunes]
Create a national fund to helphomeowners and local governments
take action on sea level rise.
Implement stricter elevation plans forhomes in vulnerable areas.
Establish a legislative authority tobetter regulate development.
The majority of those who believe government should take the leading role are willing to have taxes increased.• 8% income• 31% property• 19% both income and
property
What should governments do?
Overview of Trends
• Coastal development continues despite the risk.
• There has been a decline in risk awareness and preparedness.
• The majority of Florida homeowners are not aware of the effect of sea level rise or they do not believe they will be affected.
• There is a growing expectation that government, especially local government, should play a leading role in reducing the effects of rising sea level in the future.

Conclusions
• Florida’s vulnerability to disasters and their increased impact as a result of sea level rise is encouraging local governments to step up their efforts to understand disaster preparedness and implement measures to mitigate the risks.
• However, market forces are continuing to increase the property and population risks.
• Florida does not have a culture of preparedness as efforts are subject to individual experiences, news cycles and population characteristics.

1101 Brickell Ave, South Tower 206
Miami, FL 33131
Website: metropolitan.fiu.edu
Connect with us: