addressing rater error in performance assessments measurement in analyzing the reliability of an...
TRANSCRIPT

Addressing Rater Error in Performance AssessmentsBringing the Many Facet Rasch Model (MFRM) to Assessment
Myrah R. Stockdale, M.S.
Objectives
Participants will be able to:
• describe the impact of rater variability on score validity and fairness
• recognize benefits of Many Facet Rasch Model (MFRM) in performance assessment contexts
• explain ways to improve performance assessments and scores

Presentation Outline
• Introduce Performance Assessments (PA)
• Issues Presented by Rater / Judge Variability
• Influence of Norm- vs. Criterion-Referenced Assessment on PAs
• Assessing Score Reliability with the Many-Facet Rasch Model (MFRM)

Performance Assessments
A Brief Introduction
Performance Assessment
• What is it?
• What are some examples?
• Why is it important?

Performance Assessment
Performance Assessment is
• Evaluation of student performance on a given formative assessmenttask.
• Comprised of a task and a rubric
• Students showing judges, raters, instructors what they know
• Often used in conjunction with other assessments and tests
… and is not
• Looking at how to teach (looks at how to assess learning)
• Usually summative assessment

Performance Assessment
Test Formats:
• Constructed Response
• Essay
• Demonstration
• Oral Presentation
• Role-Playing
• Exhibits
• Portfolios
• Direct Observations
Performance Assessment
Benefits
• Examinees can demonstrate skills that are not easily assessed with multiple-choice (MC) items (Messick, 1996).
• Such as higher order thinking and/or problem solving skills (Muraki, Hombo, & Lee, 2000)
• Considered more authentic and relevant to real-life situations (Haertel & Linn, 1996; Sax, 1997).

Performance Assessment
Trade-offs
• Typical PAs have less items/tasks for examinees to complete; statistically this negatively affects reliability.
• However, there are ways to introduce ancillary exam information from other sources to increase reliability (Ackerman, 1991; Luecht & Miller, 1992)
• PAs can be more resource intensive than traditional exams

Variability and Validity
And A Little About Context

Performance Assessments and Rater Error
• Raters regularly provide
inconsistent ratings and
judgements.
• Variation in ratings/judgement
can have significant impacts on:
• Examinees’ grades
• Validity
• NOTE: Validity is not a property
of the assessment, but rather of
the meaning of the scores.

Assessment Contexts
Norm-Referenced
Assessment
• Performance is relative to peers
• Arguably inappropriate for performance assessment in higher education assessment contexts
Criterion-Referenced Assessment
• Performance is compared relative to a particular standard

Rater Error
Type of Error Tendency for Rater to
Halo Effect Give student the benefit of the doubt and provides high score
Gestalt Phenomenon Provide ratings that are based on the overall impressions because
the rater is unable to differentiate various aspects of the student’s
performance
Leniency Consistently provide inflated ratings
Scale Interpretation Provide inappropriate ratings because the rater misunderstands
the scale and perceives a rating to mean something different
Skimming Evaluate only a limited portion of a performance and assign a
score
Severity Consistently provide overly critical ratings
(Royal & Hecker, 2015)
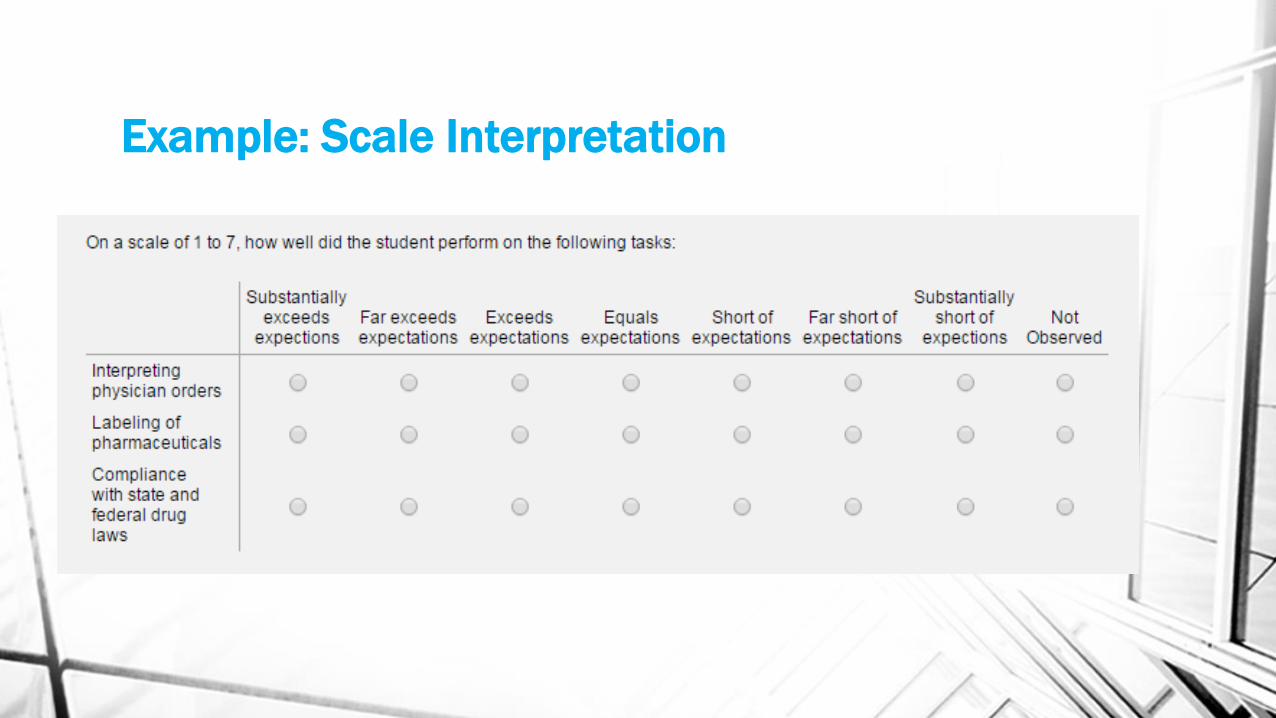
Example: Scale Interpretation

Improving Validity
• Make sure objectives are clearly defined and operationalized.
• Match assessment measures to objectives.
• Get students involved; have the students look over the assessment for troublesome wording, interpretation issues, or other difficulties.
• If possible, compare your measure with other measures, or data that may be available.

The Many Facet Rasch Model
A Measurement Model

Measurement vs. Statistics
Measurement
• Focuses on:
• Meaningfulness of numbers (Falmange & Narens, 1983)
• Individual processes and relations within the variables (Duncan, 1992)
• Imposes strong requirements on data quality in order to achieve a common metric (Cohen, 1994)
Statistics
• Focuses on:
• group processes and relationships among variables (Fisher, 2010)
• Makes assumption about factors beyond its control

Rasch Family of Models
• In the Rasch model, the probability of a specified response (e.g. right/wrong answer) is modeled as a function of person and item parameters.
• The models represent the structure which data should exhibit in order to obtain measurements from the data

Many-Facet Rasch Model Formula
• log𝑃𝑛𝑖𝑗𝑘
𝑃𝑛𝑖𝑗𝑘−1= 𝐵𝑛 − 𝐷𝑖 − 𝐶𝑗 − 𝐹𝑘
where
• 𝑃𝑛𝑖𝑗𝑘 is the probability of examinee n being awarded on item I by judge j a
rating of k
• 𝑃𝑛𝑖𝑗𝑘−1 is the probability of examinee n being awarded on item I by judge j a
rating of k-1
• Bn is the ability of examinee n
• Di is the difficulty of item I
• Cj is the severity of judge j
• Fk is the difficulty of step up from category k-1 to category k
Many-Facet Rasch Model
• MFRM can be used to evaluate a number of specific hypotheses related to potential sources of rater error that represent threats to the validity of ratings.
• It is recommended that the MFRM be considered a priori rather than post hoc
• Why? Identifying and labeling the elements being measured will help with data analysis, data cleaning, and interpretation

Many-Facet Rasch Model
Person 10 has a
logistic measure of 1.0.
Person 9 and 17 have a
logistic measure of 0.0.
Logit
Diff.
%
Success
Logit
Diff.
%
Success
5.0 99% -5.0 1%
4.0 98% -4.0 2%
3.0 95% -3.0 5%
2.2 90% -2.2 10%
2.0 88% -2.0 12%
1.0 73% -1.0 27%
0.0 50%
Essay 3 has a logistic
measure of 0.0.
Person 29 has a logistic
measure of -1.0.
Logit-to-Probability Conversion Table

Presentation and Measurement Perspectives on a Representative Rating Scale
Deficient
1
Poor
2
Medium
3
Good
4
Excellent
5
(Word Label)
(Numerical Label)
The scale as it is printed:
Deficient
. . . . .____________|
1
0
Poor
|____|
2
1
Medium
|_______________________|
3
2
Good
|_______|
4
3
Excellent
|_____________. . . .
5
4
(Word Label)
(Estimated Location)
(Numerical Label)
(Qualitative Steps)
The scale as it functions:
(Linacre, 1993)
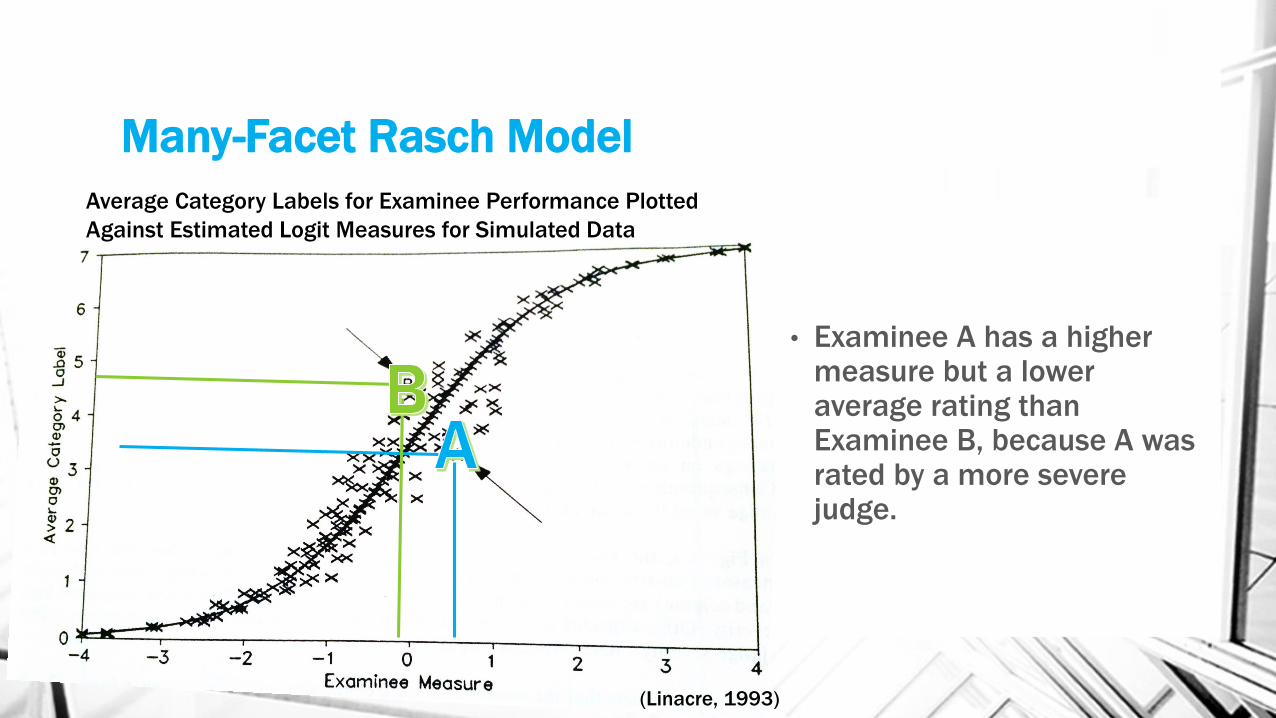
• Examinee A has a higher measure but a lower average rating than Examinee B, because A was rated by a more severe judge.
(Linacre, 1993)
Many-Facet Rasch Model
Average Category Labels for Examinee Performance Plotted
Against Estimated Logit Measures for Simulated Data

Test Reliability Analysis
MFRM
• Provides detailed information about what caused the inconsistency or where the disagreement is
• The analysis of rating data with the MFRM does not require all judges to rate all items to arrive at an estimate of interrater reliability.
Classical Test Theory
• Cronbach’s alpha is used to determine how consistent elements (e.g., judges) are.
• Generates a sketchy picture of the internal consistency of the test and inter-rater agreement
• For a detailed example see: Haiyang, S (2010). An application of Classical Test Theory and Many-Facet Rasch Measurement in Analyzing the Reliability of an English Test for Non-English Major Graduates

Final Remarks
• Validity is of the utmost importance when designing and implementing performance assessments
• Use a criterion-references context
• Train raters and judges
• The Many-Facet Rasch Model (MFRM), is a powerful tool that can help in pinpointing the location of inconsistencies and/or discrepancies among a number of elements
References• Ackerman, T.A. (1991). The use of unidimensional parameter estimates of
multidimensional items in adaptive testing. Applied Psychological Measurement, 15, 13-24.
• Andrich, D (1989). Distinction between assumptions and requirements in measurement in the social sciences. In J.A. Keats, R. Taft, R.A. Health & S.H. Lovibond (Eds.), Mathematical and Theoretical Systems: Vol 4 (pp7-16). North –Holland: Elsevier Science Publishers
• Basturk, R. (2008). Applying the Many-Facet Rasch Model to Evaluate PowerPoint Presentation Performance in Higher Education. Assessment & Evaluation in Higher Education, 33(4), 431-444. doi:10.1080/02302930701562775
• Cohen, J. (1994). The earth is round (p < 0.05). American Psychologist, 49, 997-1003
• Duncan, O.D. (1992). What if? Contemporary Sociology, 21(5), 667-667
• Fisher, W.P. JR. (2010) Statistics and Measurement: Clarifying the differences, Rasch Measurement Transactions, 2010, 23:4, 1229-1230
• Hammersley, M. (1989) The dilemma of qualitative method: Herbert Blumerand the Chicago Tradition. New York: Routledge
• Haertel, E. H., & Linn, R. L. (1996). Comparability. In G. W. Phillips (Ed.), Technical issues in large-scale performance assessment (pp. 59–78). Washington DC: National Center for Education Statistics
• Linacre, J. M. (1993). Many-Facet Rasch Measurement. Chicago, IL: MESA Press.
• Luecht, R. M. & Miller, T. R. (1992). Unidimensional calibrations and interpretations of composite traits for multidimensional tests. Applied Psychological Measurement, 16(3), 279‐293.
• Lynch, B. K., & McNamara, T. F. (1998). Using G-Theory and Many-Facet Rasch Measurement in the development of performance assessment in the ESL speaking skills of immigrants. Language Testing, 15(2), 158-180.
• Messick, S. (1996). Validity of performance assessment. In G. W. Phillips (Ed.), Technical issues in large-scale performance assessment (pp. 1–18). Washington DC: National Center for Education Statistics.
• Moskal, B.M., & Leydens, J.A. (2000). Scoring rubric development: Validity and reliability. Practical Assessment, Research & Evaluation, 7(10). [Available online: http://pareonline.net/getvn.asp?v=7&n=10].
• Muraki, E., Hombo, C. M., & Lee, Y. W. (2000). Equating and linking of performance assessments. Applied Psychological Measurement, 24(4), 325-337.
• Royal, K. D., & Guskey, T. R. (2015). Does Mathematical Precision Ensure Valid Grades? What Every Veterinary Medical Educator Should Know. Journal of Veterinary Medical Education, 42(3), 242-244. doi:10.3138/jvme.0115-005R1
• Royal, K. D., & Hecker, K. G. (2015). Rater Errors in Clinical Performance Assessments. Journal of Veterinary Medical Education, 1-4. doi:10.3138/jvme.0715-112R
• Sax, G. (1997). Principles of educational and psychological measurement and evaluation (4th ed.). Belmont CA: Wadsworth.
• Stiggins, R. J. (1987). An NCME Instructional Module on Design and Development of Performance Assessments. Instructional Topics in Educational Measurement, 33-42
Resources
• Program for running MFRM : FACETS (Trial Version: MiniFac)
• Tutorials on How to Run MFRM by Michael Linacre
• Tutorial 1 Software operation and basic concepts
• Tutorial 2 Fit analysis and measurement models
• Tutorial 3 Estimation and interactions
• Tutorial 4 Anchoring