addressing the challenges associated with canadian crudes
TRANSCRIPT

© 2010 Baker Hughes Incorporated. All Rights Reserved.
Addressing the Challenges Associated with Canadian CrudesXiomara PriceCrude Oil Quality Association February 11, 2010New Orleans

© 2010 Baker Hughes Incorporated. All Rights Reserved.2
Outline
•Why bother?•What is different about these crudes?•Program strategies employed by Baker Petrolite•Case histories
xmp1

© 2010 Baker Hughes Incorporated. All Rights Reserved.3
Outline
•Why bother?•What is different?•Program strategies employed by Baker Petrolite•Case histories

© 2010 Baker Hughes Incorporated. All Rights Reserved.4
Oil Import to the U.S.
Country 9-Nov 9-OctYTD
20098-Nov
YTD 2008
CANADA 2,527 2,363 2,447 2,534 2,482MEXICO 1,083 1,136 1,237 1,406 1,308
VENEZUELA 890 955 1,099 1,236 1,191SAUDI ARABIA 848 943 1,023 1,514 1,535
NIGERIA 980 869 783 827 993IRAQ 458 499 461 476 636
ALGERIA 400 491 483 677 554
ANGOLA 431 450 477 450 509RUSSIA 425 385 570 445 473
COLOMBIA 237 292 282 176 201
UNITED KINGDOM 190 278 249 245 242
VIRGIN ISLANDS 205 215 275 338 323
ECUADOR 155 180 187 229 217BRAZIL 268 174 319 286 261
AZERBAIJAN 74 134 69 71 74
Note: The data in the tables above exclude oil imports into the U.S. territories.
Total Imports of Petroleum (Top 15 Countries)(Thousand Barrels per Day)
Source: U.S. Energy Information Administration
© 2010 Baker Hughes Incorporated. All Rights Reserved.5
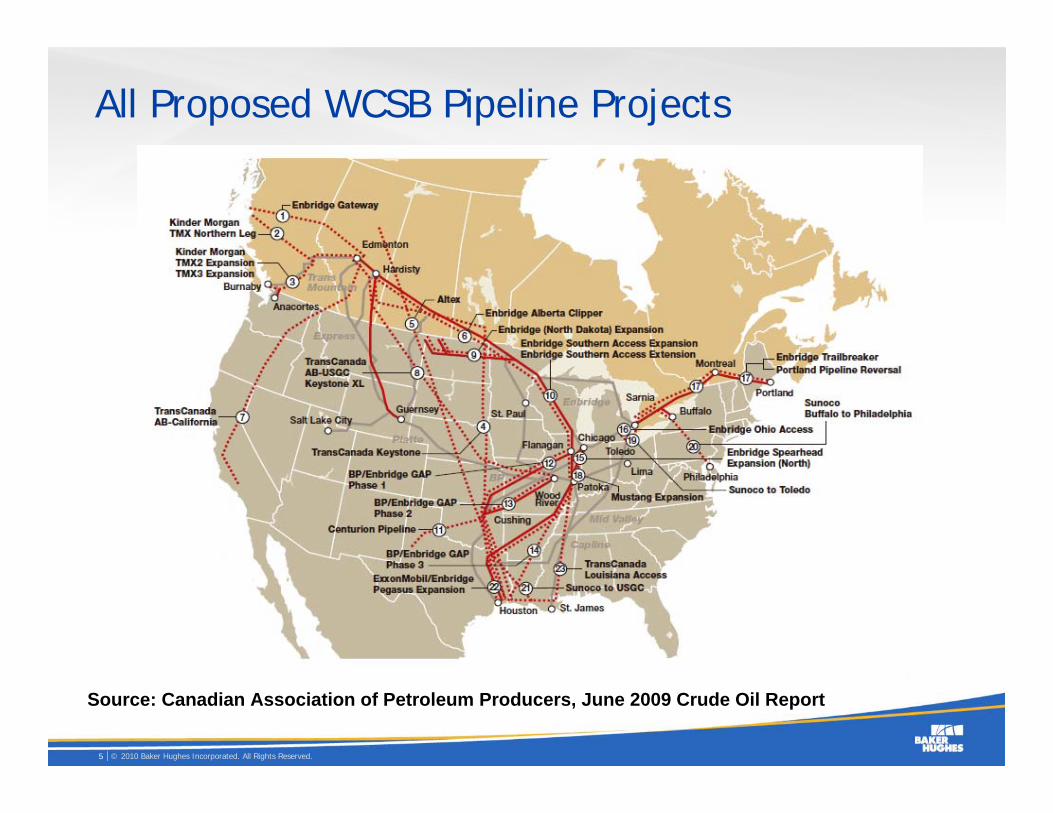
All Proposed WCSB Pipeline Projects
Source: Canadian Association of Petroleum Producers, June 2009 Crude Oil Report

© 2010 Baker Hughes Incorporated. All Rights Reserved.6
Projected Growth in WCSB Supply
Source: Canadian Association of Petroleum Producers, June 2009 Crude Oil Report
Bitumen blend forecasted to increase to 2.4 MM BPD by 2025

© 2010 Baker Hughes Incorporated. All Rights Reserved.7
Wide Variety of Crudes Available
•Traditional production•Thermal, other in-situ production methods•Mining operations•Output from upgraders
– Hydrotreated premium products– Various other blends
•Bitumen blends– Dil Bits– Syn Bits– Syn Dil Bits

© 2010 Baker Hughes Incorporated. All Rights Reserved.8
Outline
•Why bother?•What is different about these crudes?•Program strategies employed by Baker Petrolite•Case histories

© 2010 Baker Hughes Incorporated. All Rights Reserved.9
Crude Quality• Wide variability
– Solids– Asphaltenes– Non-extractable salts– Amines – H2S scavengers– TAN
• Process challenges– Wide stable emulsion– Poorer dehydration
• Poor desalting– Higher oil in the effluent– Potential increase in overhead corrosion– Higher risk for high temperature corrosion

© 2010 Baker Hughes Incorporated. All Rights Reserved.10
Outline
•Why bother?•What is different?•Program strategies employed by Baker Petrolite•Case histories

© 2010 Baker Hughes Incorporated. All Rights Reserved.11
Desalting: Tools used for Program Optimization
•Review of operational variables impacting performance
– Tank farm practice– Slop addition practice– Wash water – Mixing energy– Mud wash practices
•Evaluation of feedstock– EDDA screening – Asphaltene stability study using ASIT™ technology
ASIT is a trademark of Baker Hughes Incorporated

© 2010 Baker Hughes Incorporated. All Rights Reserved.12
Crude Oil Management
•Crude oil tank farm pre-treatment – Does not require water draw in tank– Improves solids control– Stabilizes asphaltenes– Reduces oil under carry
•Proper slop handling– Segregation– Injection practice– Treatment
• Dehydration• Solids removal
Pretreatment Chemical
Crude OilStorage Tanks
PIER
COMPOSITE SAMPLER
Pretreatment Chemical
Crude OilStorage Tanks
PIER
COMPOSITE SAMPLER
Crude OilStorage Tanks
PIER
COMPOSITE SAMPLER
Crude OilStorage Tanks
PIER
COMPOSITE SAMPLER

© 2010 Baker Hughes Incorporated. All Rights Reserved.13
Wash Water
• Injection rates– 6 to 9% for improved
dehydration and solids removal
•Wash water pH– 5 to 8 acceptable
Naphthenic acids impact on oil/ water emulsion stability at various pH.

© 2010 Baker Hughes Incorporated. All Rights Reserved.14
Mixing Energy
•Wide range of mixing energy is used •Determining best setting is key
– Dehydration and salt removal– Solids removal

© 2010 Baker Hughes Incorporated. All Rights Reserved.15
Mud Wash Practices
•Solids can rapidly build in desalter vessel
•Mud can harden with time
•Best to use recycled effluent water– Need mud wash pump
– Don’t starve wash water
•Desired frequency is at least daily– Western Canadian experience
• 15 minutes per shift
• Continuous
Design of a Typical DesalterMudwash System
TO SEWER &WASTE WATER
TREATMENT PLANT
MUDWASH HEADER &
NOZZLES
INTERFACE LEVELIN VESSEL
DESALTER EFFLUENTWATER HEADER
MUDWASHPUMP
LEVELCONTROLLER
ALTERNATE MUD WASHWATER SOURCE

© 2010 Baker Hughes Incorporated. All Rights Reserved.16
Feedstock Evaluation
•Pre-screen blends, individual crudes – Bench top “EDDA” screenings for emulsion resolution speed,
efficiency• Oil soluble emulsion breakers
– Includes Baker Petrolite’s new XERIC™ Heavy Oil Demulsifiers
• Solids wetting agents • Water soluble polymers, when required
XERIC is a trademark of Baker Hughes Incorporated

© 2010 Baker Hughes Incorporated. All Rights Reserved.17
ASIT Test Indicates Asphaltene Instability
•Some WCSB crudes and blends can contain unstable asphaltenes
– High asphaltene bitumens
– Paraffinic materials used to dilute bitumens
•Several potential problems– Precipitation in tankage
– Desalter upsets
– Fouling
– Foaming
•Can be used to identify unstable blends
•Also used to screen most effective asphaltene stabilizing chemicals

© 2010 Baker Hughes Incorporated. All Rights Reserved.18
0
200
400
600
800
1000
1200
0 50 100 150 200 250
ASI
INTE
NS
ITY
WCSB Base Blend Base Blend/WCSB (80/20) Crude #1/WCSB (90/10) Base Blend/WCSB (80/20) + BPR34744
Additives canincrease the
stability of an oil
ASIT Test Results
Unstable < 130 Moderately Stable 130-200 Stable >200

© 2010 Baker Hughes Incorporated. All Rights Reserved.19
Corrosion: Crude Tower and Overhead System
•WCSB crudes can increase tower and overhead system corrosion potential in two key ways:
– Non-desaltable chlorides in WCSB blends• Higher chloride loadings in the tower and overhead system
– Low boiling organic acids from thermal degradation of high TAN crudes• Higher organic acid loadings in the tower and overhead system
• Naphthenic acids also increase hydrolysis of inorganic chloride salts in the desalted crude
– Both mechanisms increase neutralizing agent demand
– Both mechanisms increase the risk of neutralizer-hydrochloride salt fouling and under-deposit corrosion

© 2010 Baker Hughes Incorporated. All Rights Reserved.20
Corrosion: Tools Employed for Troubleshooting and OptimizationTOPGUARD Overhead Corrosion Control
• Review of Operational Data– Correlate effect of operational and crude slate changes
• Non desaltable chlorides
• Review of Traditional Monitoring Methods– Identify variations in corrosion rates via coupons and probes
• Analytical Techniques– Compositional sample analyses to identify corrodents present– Metallurgy analyses of coupons to identify mechanism of attack
• Ionic Modeling Calculations– Ammonium and amine chloride salt formation risk– pH profile– Water wash requirements
TOPGUARD is a trademark of Baker Hughes Incorporated

© 2010 Baker Hughes Incorporated. All Rights Reserved.
Ionic Model Thermodynamic Simulations
•Acid corrosion– Dictated by pH– Most severe at dew point– Rigorous electrolyte simulation to
determine pH profile
•Under-salt corrosion– Dictated by salt deposition– Salts are acidic, absorb water– Thermodynamic data for organic
amine-HCl salts
© 2010 Baker Hughes Incorporated. All Rights Reserved.22
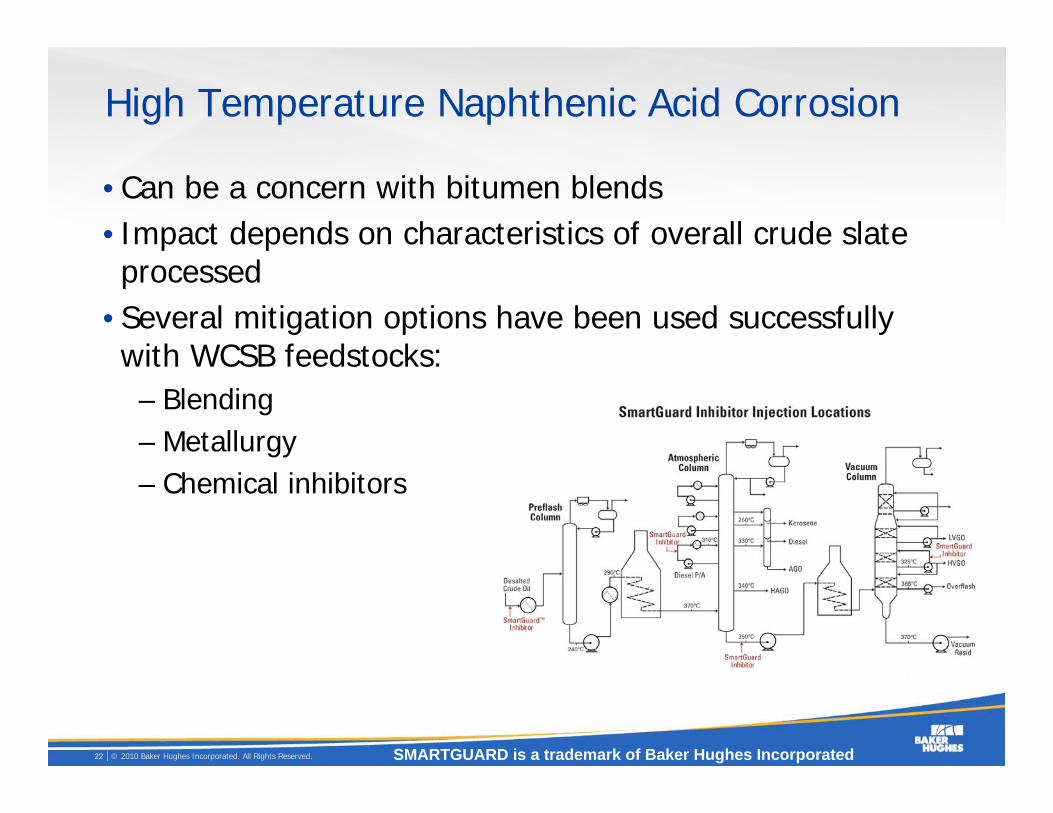
High Temperature Naphthenic Acid Corrosion
•Can be a concern with bitumen blends • Impact depends on characteristics of overall crude slate processed
•Several mitigation options have been used successfully with WCSB feedstocks:
– Blending– Metallurgy– Chemical inhibitors
SMARTGUARD is a trademark of Baker Hughes Incorporated
© 2010 Baker Hughes Incorporated. All Rights Reserved.23
Use Conventional Approaches to NAC Control
•Assessment
– Process equipment evaluation
– Feedstock/process stream characterization
•Mitigation
– Crude blending to TAN limit
– Metallurgy upgrade
– Chemical inhibition
•Surveillance/Monitoring
– Design effective monitoring protocols
– Use data to optimize corrosion management program

© 2010 Baker Hughes Incorporated. All Rights Reserved.24
Outline
•Why bother?•What is different?•Program strategies employed by Baker Petrolite•Case histories

© 2010 Baker Hughes Incorporated. All Rights Reserved.25
WSCB Case History 1
•Refinery’s ability to process heavy Canadian crude limited – Poor dehydration– Poor brine quality
•Tested crude blend samples to select best chemical treatment program
– Asphaltene stabilizer– Oil-soluble emulsion-breaking chemical– Solids wetting agent in wash water
© 2010 Baker Hughes Incorporated. All Rights Reserved.26
Case History 1 Program Results
•More than doubled the amount of heavy Canadian crude being processed
– 7.5 KBPD to 17.5 KBPD
•Maintained salt removal efficiency
•Dehydration performance maintained

© 2010 Baker Hughes Incorporated. All Rights Reserved.27
Case History 1 Program Results
Salt Removal Efficiency
85.0
87.0
89.0
91.0
93.0
95.0
97.0
99.0
101.0
103.0
105.0
11/14/07 2/22/08 6/1/08 9/9/08 12/18/08 3/28/09 7/6/09 10/14/09 1/22/10 5/2/10
Salt Removal Efficiency
Trial #1 WCSB up to 15 KBD Trial #2 WCSB up to 17.5 KBD
Improper tank switch

© 2010 Baker Hughes Incorporated. All Rights Reserved.28
Case History 1 Program Results Cont.Second Stage Desalter A BS&W Out
0
0.1
0.2
0.3
0.4
0.5
0.6
0.7
0.8
0.9
1
1/2/
2008
2/2/
2008
3/2/
2008
4/2/
2008
5/2/
2008
6/2/
2008
7/2/
2008
8/2/
2008
9/2/
2008
10/2
/200
8
11/2
/200
8
12/2
/200
8
1/2/
2009
2/2/
2009
3/2/
2009
4/2/
2009
5/2/
2009
6/2/
2009
7/2/
2009
8/2/
2009
9/2/
2009
10/2
/200
9
11/2
/200
9
12/2
/200
9
1/2/
2010
1st Set BS&W Out
Trial #1 WCSB up to 15 KBD Trial #2 WCSB up to 17.5 KBD
Maintained Performance

© 2010 Baker Hughes Incorporated. All Rights Reserved.29
Case History 1 Program Results Cont.Second Stage Desalter B BS&W Out
0
0.1
0.2
0.3
0.4
0.5
0.6
0.7
0.8
0.9
1
1/2/
2008
2/2/
2008
3/2/
2008
4/2/
2008
5/2/
2008
6/2/
2008
7/2/
2008
8/2/
2008
9/2/
2008
10/2
/200
8
11/2
/200
8
12/2
/200
8
1/2/
2009
2/2/
2009
3/2/
2009
4/2/
2009
5/2/
2009
6/2/
2009
7/2/
2009
8/2/
2009
9/2/
2009
10/2
/200
9
11/2
/200
9
12/2
/200
9
1/2/
2010
2nd Set BS&W Out
Trial #1 WCSB up to 15 KBD Trial #2 WCSB up to 17.5 KBD
Maintained Performance
© 2010 Baker Hughes Incorporated. All Rights Reserved.30
WCSB Case History 2
•Refinery upgraded desalter for heavy Canadian crudes– Poor desalter effluent water quality– Low dissolved oxygen in WWTP
•Pre-screened crude blend samples to select chemical treatment program
– Oil soluble emulsion-breaking chemical– Solids wetting agent in wash water– Polymer when needed
•Desalter operating variables optimized in the field

© 2010 Baker Hughes Incorporated. All Rights Reserved.31
Program Results: D.O. in WWTP
Waste Water Treatment Plant Dissolved Oxygen
0.0
1.0
2.0
3.0
4.0
5.0
6.0
7.0
Daily
Dis
solv
ed O
xyge
n, p
pm
dissolved O2
Competitive average
Baker Petrolite Average
Before Baker Petrol ite After Baker Petroli te

© 2010 Baker Hughes Incorporated. All Rights Reserved.32
WCSB Case History 2 Program Results
•Can run 250 PTB solids in crude charge– Salt removal and dehydration maintained
•Filterable solids removal remained at 80%
•WWTP operation improved– COD reduced
– DO increased
– No longer affected by oily brine
•Overall chemical usage dropped nearly 50%

© 2010 Baker Hughes Incorporated. All Rights Reserved.33
WCSB Case History 3Crude Oil Pretreatment Program•Desalter upsets when processing heavy oil sands crude oil
– Up to 3,000 ppm oil in desalter effluent water– Caused problems in WWTP
•Implemented crude oil pretreatment program– With pretreatment, effluent water oil content decreased to
an average of 140 ppm– Improved WWTP operation– Odor emissions reduced– Filterable solids removal efficiency increased from 27% to
42%

© 2010 Baker Hughes Incorporated. All Rights Reserved.34
WCSB Case History 3 – Program Results
Desalter Effluent Water - Before Pretreatment Program
Desalter Effluent Water - After Pretreatment Program

© 2010 Baker Hughes Incorporated. All Rights Reserved.35
WCSB Case History 4Asphaltene Stabilizer
•Desalter problems–High current draw–Water carryover–Solids, oil in desalter effluent water–WWTP overloaded
•Root cause analysis–Asphaltene destabilization–Sour Canadian crude, high in asphaltenes

© 2010 Baker Hughes Incorporated. All Rights Reserved.36
WCSB Case History 4Chemical Treatment Recommendations
•Continuous crude oil pretreatment using surfactants
•Used asphaltene stabilizer for heavy sour crude shipments
•Continued emulsion breaking chemical use on crude unit,
but at reduced rate (~50% reduction)

© 2010 Baker Hughes Incorporated. All Rights Reserved.37
WCSB Case History 4Program Results and Benefits
•Allowed more aggressive crude blending
•Significant reduction in oil under-carry
•WWTP no longer burdened with oily effluent water
• Increased unit throughput
•Significant return on incremental chemical treatment
program investment

© 2010 Baker Hughes Incorporated. All Rights Reserved.38
Rising to Canadian Crudes Challenges
•Many realized benefits for improving your Canadian crude processing capabilities
– Reduced feedstock costs
– Increased feedstock flexibility
– Increased unit throughput
– Improved refinery profitability
•These benefits are being achieved while minimizing operating risk
– Maintain unit integrity and reliability
– Ensure product quality
– Ensure environmental compliance