addressing the role of mitochondrial thioredoxin reductase
TRANSCRIPT
A thesis submitted for the Doctoral degree (Dr. rer. nat.) to the Faculty of Biology at the
Luidwig-Maximilians-University, Munich, Germany
Addressing the Role of Mitochondrial Thioredoxin Reductase and xCT in the Maintenance of Redox Homeostasis
Tamara Perisic
Helmholtz Zentrum München, German Reasearch Center for Environmental Health
Institute of Clinical Molecular Biology and Tumor Genetics
Munich, October 2009
Ehrenwörtliche Versicherung
Ich versichere hiermit ehrenwörtlich, dass die Dissertation von mir selbständig,
ohne unerlaubte Beihilfe angefertigt ist.
Die vorliegende Dissertation wurde weder ganz, noch teilweise bei einer anderen
Prüfungskommission eingereicht.
Ich habe noch zu keinem früheren Zeitpunkt versucht eine Dissertation
einzureichen oder an einer Doktorprüfung teilzunehmen.
.....................................................................
(Tamara Perisic)
Dissertation eingereicht am 8. Oktober 2009
1. Gutachter: Prof. Dr. Dirk Eick 2. Gutachter: Dr. Daniel Krappmann 3. Gutachter: Prof. Dr. Hans-Ulrich Koop
4. Protokoll: Prof. Dr. Michael Boshart
Tag der mündlichen Prüfung: 23. 03. 2010
Table of contents
LIST OF ABREVIATIONS I
1. INTRODUCTION 1
1.1. Biological sources of ROS and its role in diverse biological processes 1
1.2. Selenoproteins 2
1.2.1. Incorporation of selenium 3
1.2.2. Family of thioredoxin reductases 5
1.2.3 Mammalian thioredoxin system 7
1.3. Peroxiredoxins 13
1.3.1. The catalytic mechanisms of peroxiredoxins 15
1.3.2. The role of sulfiredoxin (Srx) 17
1.4. System xC− 19
1.5. Objectives 21
2. MATERIALS AND METHODS 23
2.1. Materials 23
RT-PCR 28
Expression and Targeting Vectors 28
2.2. Methods 31
2.2.1. Cell culture 31
2.2.2.Gene-transfer methods 34
2.2.3. Molecular biology techniques 35
2.2.4. Flow cytometry 46
2.2.5. Biochemical methods 49
2.2.6. ES cell technology 50
I
3. RESULTS 53
3.1. Functional analysis of mitochondrial thioredoxin reductase (Txnrd2) 53
3.1.1. Phenotype of primary MEFs lacking Txnrd2 53
3.1.3. Antioxidants rescue loss of Txnrd2 54
3.1.4. Intracellular ROS are augmented in cells lacking Txnrd2 55
3.1.5. Susceptibility of Txnrd2−/− cells towards pro-oxidants and genotoxic agents 56
3.1.6. Sensitivity of Txnrd2−/− cells towards inhibition of de novo GSH biosynthesis 59
3.1.7. Expression of mitochondrial peroxiredoxins is increased in Txnrd2−/− cells 61
3.1.8. Time-dependent increase of Prx III levels in response to H2O2 62
3.1.9. Ectopic expression of Txnrd2 and Txnrd1 in Txnrd2−/− cells 64
3.1.10. Stable expression of Txnrd1 in Txnrd2 knock-out cells 65
3.1.11. Add-back of mitoTxnrd2 rescues Txnrd2−/− cells from cell death induced by
GSH depletion 67
3.1.12. The role of Txnrd2 in normal physiology and disease 69
3.2. The role of system xC− in maintenance of intracellular GSH levels and
cystine/cysteine redox balance in cultured cells 75
3.2.1. The protective role of system xC− in Burkitt lymphoma (BL) cells 75
3.2.2. The thioredoxin system as the possible driving force for the cystine/cysteine
redox cycle 76
3.3. Generation of conditional xCT-knock-in mice 80
3.3.1 Gene targeting in ES cells 80
3.3.2. Analysis of the functionality of the neoR-STOP-xCT cassette 82
3.3.3. Generation of R26mxCTflSTOP/CreERT2 mice 82
3.3.4. Breeding of xCT-transgenic mice with the Tam-inducible CreERT2-Deleter
mouse 84
3.3.4. Phenotypic analysis of R26mxCTflSTOP/CreERT2 mice 84
4. DISCUSSION 93
4.1. Absence of Txnrd2 causes high ROS accumulation, increased sensitivity towards pro-oxidants and impaired cell growth 93
II
4.2. Compensatory up-regulation of mitochondrial peroxiredoxins III and V in response to Txnrd2 disruption 98
4.3. Txnrd1 and Txnrd2 do not show functional redundancy in vivo 99
4.4. Txnrd2 is dispensable for maintaining the Cys/(Cys)2 cycle 101
4.5. Txnrd2 protects myocardial tissue from oxidative damage and is implicated in the pathogenesis of Dilatative Cardiomyopathy 103
4.6. Inducible overexpression of xCT in mice is not protective, but causes spleen, thymus and testis atrophy and defective erythropoiesis 104
5. SUMMARY 109
6. REFERENCES 111
7. APPENDIX 129
7.1. Acknowledgements 129
7.2. Curriculum vitae 131
III
i
List of Abreviations
2-ME β-mercaptoethanol
Amp Ampicillin
AmpR Ampicillin resistance gene (ß-lactamase)
AMV Avian myeloblastosis virus
ATP Adenosine-5'-triphosphate
BOOH t-butylhydroperoxide
BSA Bovine serum albumin
BSO L-buthionine sulfoximine
CDK Cycline dependent kinase
CMV Cytomegalovirus
Cre Cre recombinase
Cys Cysteine
(Cys)2 Cystine (oxidised Cys dimer)
DAPI 4´,6-diamidino-2-phenylindole, dihydrochloride
DCFH-DA Dichlorofluorescin diacetate
DCM Dilated cardiomyopathy
DIOs Iodothyronine deiodinases
DMEM Dulbecco's Modified Eagle Medium
DMSO Dimethylsulfoxide
DNA Deoxyribonucleic acid
dNTP Deoxyribonucleotide
DTT Dithiothreitol
EDTA Ethylenediamine-N,N,N’,N’-tetra-acetic acid
EFSec Sec-specific elongation factor
EGF Epidermal growth factor
eGFP Enhanced green fluorescence protein
EpRE Electrophile response element
ERK Extracellular signal-regulated kinase
ES cells Embryonic stem cells
FACS Fluorescence activated cell sorting
FAD Flavin adenine dinucleotide
FCS Fetal calf serum
GpAATs Glycoprotein-associated amino acid transporters
GPx Glutathione peroxidase
GR Glutathione reductase
GRx Glutaredoxin
GSH Glutathione
GSS Glutathione synthetase
GSSG Oxidized glutathione
GTP Guanosine-5'-triphosphate
H2O2 Hydrogen peroxide
HO• Hydroxyl radical
HO2• Hydroperoxy radical
HPRT Hypoxanthine-guanine phosphoribosyltransferase
IRES Internal ribosomal entry site
LMP agarose Low melting point agarose
LTR Long terminal repeat
MAPK mitogen activated protein kinase
MCM MERCreMER
MEFs Murine embryonic fibroblasts
MitoPY Mitochondrial Peroxi-yellow
MLS Mitochondrial leader sequence
NAC N-Acetyl-L-cysteine
NADPH Nicotinamide adenine dinucleotide phosphate
NeoR Neomycin phosphotransferase
NESs Nuclear export signals
NFκB Nuclear factor κB
NLS Nuclear localization signal
Nrf2 NF-E2-related factor 2
NTAPe-tag N-terminal tandem affinity purification enhanced tag
nucmemb Nuclear membrane anchor
O2− Superoxide anion
OVA Ovalbumin
pA PolyA signal
ii
PAGE Polyacrylamide gel electrophoresis
PBS Phosphate buffered saline
PDGF Platelet-derived growth factor
PEITC Phenyl ethyl isothiocyanate
PFA Paraformaldehyde
PI Propidium iodide
PRE Post regulatory element
Prx Peroxiredoxin
PS Phosphatidylserine
PuroR Puromycin N-acetyltransferase gene
Py ori Polyoma origin of replication
PYAM Peroxi-yellow acetoxy methyl-ester
PYME Peroxi-yellow methyl-ester
RFP Red fluorescence protein
RNA Ribonucleic acid
RO• Alkoxyl radical
RO2• Peroxyl radical
ROS Reactive oxygen species
rpL30 Ribosomal protein L30
rT3 Reverse-triiodothyronine
SA Splice acceptor
SBP2 SECIS-binding protein 2
SDS Sodium dodecyl sulfate
Se Selenium
Sec Selenocysteine
SECIS Selenocysteine insertion sequence
Secp43 43 kDa RNA-binding protein
-SeH Selenol group
SFFV Spleen focus forming virus
SF-tag Strep-FLAG-tag
SIN Self-inactivating 3’ LTR
SLA Soluble liver antigen protein
SOD Superoxide dismutase
Srx Sulfiredoxin
iii
SV40 SV-40 promoter
T3 Triiodothyronine
T4 Thyroxine
Tam Tamoxifen
TGR Thioredoxin-glutathione reductase (Txnrd3)
TNF Tumour necrosis factor
TPx Thioredoxin peroxidases
Trsp Selenocysteine-specific tRNA gene
Trx Thioredoxin
Txnrd Murine thioredoxin reductase
TXNRD Human thioredoxin reductase
UGA “opal“ stop codon
wt Wild-type
γ-GCS γ-glutamylcysteine synthetase
iv
Introduction
1
1. Introduction
1.1. Biological sources of ROS and its role in diverse biological processes
Reactive oxygen species (ROS) is a collective term and includes superoxide anion (O2–),
hydrogen peroxide (H2O2), hydroxyl radical (HO•), hydroperoxy radical (HO2•), peroxyl radical
(RO2•) and alkoxyl radical (RO•). Among them, hydrogen peroxide (H2O2) is the most
extensively studied one. Most biological sources of H2O2 involve the spontaneous or catalytic
breakdown of superoxide anion (O2−), generated by the partial reduction of oxygen during
mitochondrial respiration (Boveris, 1984) . Also, exposure of cells to a variety of physical,
chemical, and biological agents causes ROS accumulation. For instance, immune cells
activate the NADPH oxidase complex to generate superoxide and hydrogen peroxide as a
cytotoxic agent during microbial defence. Furthermore, UV light and ionising radiation causes
oxidative stress as well. There is increasing evidence that cells produce H2O2 transiently in
response to the activation of various cell-surface receptors. Various growth factors and
cytokines, including PDGF, EGF, insulin, angiotensin II, and TNFα, generate hydrogen
peroxide in target cells (D'Autreaux and Toledano, 2007; Geiszt and Leto, 2004; Park et al.,
2004a) . Thus, beyond its toxic effects H2O2 has been recognized as an important
intracellular messenger that modifies protein function through the oxidation of critical cysteine
residues of many proteins including protein tyrosine phosphatases (Choi et al., 2005;
DeYulia et al., 2005; Finkel, 1998; Rhee, 1999; Rhee et al., 2000; Rhee et al., 2005). If the
physiological threshold level of H2O2 is not exceeded, it will have an affirmative effect on the
cell processes, such as receptor-mediated cell signalling pathways, normal cell proliferation,
and transcriptional activation. On the contrary, the chronic presence of peroxides and oxygen
radicals is a risk factor to cells because they may damage cellular components, which is
often associated with the initiation and progression of many degenerative diseases.
Therefore, it is no surprise that the generation of H2O2 and other reactive oxygen species
(ROS) is a tightly regulated process.
In addition to non-enzymatic antioxidants, among which glutathione (GSH), cysteine, vitamin
C and E are well known, cells contain a variety of antioxidant enzymes which contribute to
controlling the level of cellular ROS. The major antioxidant enzymes involved in the catalytic
breakdown of ROS are superoxide dismutase (SOD), catalase, thioredoxin reductase
(Txnrd), peroxiredoxins (Prx) and glutathione peroxidase (GPx). Catalase is a highly efficient
enzyme that utilizes a heme prosthetic group, while the catalytic reduction of hydrogen
Introduction
peroxide by thioredoxin peroxidases involves the oxidation of catalytic cysteine residues. The
catalytic mechanism of thioredoxin reductases and glutathione peroxidases involves the
cyclic oxidation/reduction of catalytic cysteine and selenocysteine residues.
1.2. Selenoproteins
Selenium (Se) is an essential trace element whose deficiency in mammals interferes with
normal embryonic development and fertility or may even favour the development of certain
cancers (Beck and Levander, 1998). Evidence for a molecular link between selenium
deficiency and biological disorders was provided by knock-out mouse studies. Targeted
disruption of the mouse selenocysteine-specific tRNA gene, Trsp, leads to early embryonic
lethality, confirming that selenoprotein synthesis is essential for mammals (Bosl et al., 1997).
Further studies carried out with knock-out mice for individual selenoproteins underlined the
long-discussed protective role of selenium in form of selenocysteine against free radicals and
different pathologies (Bondareva et al., 2007; Brigelius-Flohe and Banning, 2006; Conrad et
al., 2004; Crack et al., 2001; Hill et al., 2007; Jakupoglu et al., 2005; Rohrbach et al., 2006;
Rundlof and Arner, 2004; Schneider et al., 2009; Schweizer et al., 2004; Seiler et al., 2008;
Soerensen et al., 2008; Yamamoto et al., 1993; Yoshida et al., 1997). The amino acid
selenocysteine (Sec) is the major biological form of selenium in bacteria and animals. It is
normally found in the active site of selenoproteins and is directly involved in the catalytic
reaction. In this regard, the capacity of the selenol group (-SeH) to become ionized at
physiological pH is higher than that for the cysteine thiol group (-SH), which usually requires
a higher pH. This fact has been considered to account for the higher rate of selenoenzyme
catalysis (Stadtman, 1991). Few selenoprotein families have been characterized so far in
mammals. Thioredoxin reductase and glutathione peroxidase families are crucially involved
in the scavenging of ROS and maintaining the redox status of the cell. The iodothyronine
deiodinases (DIOs) family consists of three Sec-containing oxidoreductases (DIO1, DIO2,
DIO3) that catalyze the activation (DIO1 and DIO2) and inactivation (DIO3) of the thyroid
hormones thyroxine (T4), triiodothyronine (T3) and reverse-triiodothyronine (rT3) by
removing distinct iodine moieties. Mammals express various other selenoproteins whose
functions are still widely unknown; likewise, knowledge on structural data is still very limited
(SelH, SelI, SelO, SelT, SelV-function unknown; SelK, SelR, SelW-antioxidant enzymes;
SelM, SelN, SelS-protein folding and SelP has a function of transport and storage of
selenium). The reason for the lack of knowledge is either their very recent discovery or
general technical difficulties in the analysis of selenoprotein function due to their relatively
low abundance in cells and tissues.
2
Introduction
1.2.1. Incorporation of selenium
Available evidence suggests that the principle of selenoprotein synthesis has been
conserved during evolution (Atkins and Gesteland, 2000; Birringer et al., 2002; Driscoll and
Copeland, 2003; Hirosawa-Takamori et al., 2004; Hirosawa-Takamori et al., 2000; Low and
Berry, 1996). Sec is encoded by an in-frame UGA codon (opal codon), implying the
existence of a machinery capable of distinguishing the UGA codon from a translational stop.
Decoding UGA as Sec requires the presence of a Sec-specific tRNA, the Sec insertion
sequence (SECIS) element and several protein factors acting in trans (Figure 1).
The Sec-specific tRNA is designated as tRNA[Ser]Sec. In contrast to the other 20 amino acids,
the 21st proteinogenic amino Sec is synthesised directly on the tRNA by incorporation of
selenium into the amino acid serine. Seryl-tRNA synthetase attaches serine to tRNA[Ser]Sec to
yield seryl-tRNA[Ser]Sec. The phosphoseryl-tRNA kinase phosphorylates this complex to give
phosphoseryl-tRNA[Ser]Sec. It is believed that the phosphate of phosphoseryl-tRNA[Ser]Sec is
replaced by the selenium donor selenide (H2Se-P) which is activated by selenophosphate
synthetase. The resulting selenocysteyl-tRNA[Ser]Sec provides the Sec for the growing
polypeptide chain (Xu et al., 2007).
One more essential factor for Sec incorporation is the SECIS element, a stem-loop-like
secondary structure located in the 3'-untranslated region of selenoprotein mRNAs (Low and
Berry, 1996). SECIS elements from different selenoproteins in general display low sequence
similarities; however, their secondary structures are very similar and they contain consensus
sequences that are necessary for Sec incorporation (Krol, 2002).
Besides these two elements, Sec-decoding requires the concerted action of several factors
acting in trans. In mammals these are: the SECIS-binding protein 2 (SBP2) (Copeland and
Driscoll, 1999; Copeland et al., 2000), the Sec-specific elongation factor (EFSec) (Fomenko
and Gladyshev, 2003; Tujebajeva et al., 2000), ribosomal protein L30 (rpL30) (Chavatte et
al., 2005), the 43-kDa RNA-binding protein (Secp43) and the soluble liver antigen protein
(SLA) or Sec synthase (Figure 1) (Xu et al., 2005). Of these, SBP2 is the best characterised
component of the UGA decoding machinery. SBP2 itself is a selenoprotein in organisms
which do express selenoproteins. It is ubiquitously expressed in tissues and may be encoded
by several transcripts (Copeland et al., 2000). SBP2 contains an RNA-binding domain
(RBD), through which it binds to one of the consensus sequences within the SECIS elements
(Fletcher et al., 2001; Walczak et al., 1998) and thereby interacts with the 28s ribosomal
RNA (Copeland et al., 2001). Moreover, SBP2 contains a few other functional motifs: an
3
Introduction
N-terminal nuclear localization signal (NLS) (Papp et al., 2006), a C-terminal NLS (de Jesus
et al., 2006), two C-terminal nuclear export signals (NESs) (Papp et al., 2006), a functional
domain dispensable for SECIS binding but required for Sec incorporation activity (Copeland
et al., 2001), and a ribosomal interaction domain (Copeland et al., 2001; Kinzy et al., 2005).
EFSec is the Sec-specific elongation factor that simultaneously interacts with Sec-tRNA[Ser]Sec
and SBP2 (Fagegaltier et al., 2000; Tujebajeva et al., 2000). The role of Sec-tRNA[Ser]Sec has
a stabilizing effect on the elongation factor in building the SBP2-EFSec complex (Zavacki et
al., 2003), which might form in the nucleus as well as in the cytoplasm (Small-Howard et al.,
2006).
Another trans-acting factor of the UGA translation machinery is the ribosomal protein L30.
This element has an RNA-binding motif (Chen et al., 2003), which belongs to the same RBD
type as the RBD of SPS2. Recent molecular and biochemical studies with rpL30 revealed
that it binds specifically to the SECIS element, and thereby stimulates UGA codon read-
through (Chavatte et al., 2005). It seems, however, that rpL30 and SBP2 do not bind to the
SECIS element simultaneously. Rather, they mutually bind the SECIS element in a
competitive manner and are able to displace each other from the SECIS element (Chavatte
et al., 2005). RpL30 appears to bind preferentially to a conformationally altered SECIS
element. A model has been proposed, in which rpL30-binding to the SECIS element leads to
a conformational change, inducing SBP2 release and thus promoting the delivery of Sec-
tRNA[Ser]Sec to the ribosomal A site (Figure 1).
The roles for SECp43 and SLA in selenoprotein synthesis were recently characterized.
Soluble liver antigen (SLA) was isolated by autoantibody precipitation (Gelpi et al., 1992) and
the protein was found to be associated with a Sec-tRNA[Ser]Sec. SECp43 was identified
independently, based on its ability to specifically precipitate Sec-tRNA[Ser]Sec from mammalian
cell lysates. One of the identified SECp43 binding partners was a 48-kDa protein (Ding and
Grabowski, 1999) now referred to as SLA (Xu et al., 2007; Xu et al., 2005). SECp43 has two
ribonucleoprotein-binding domains (RNPs). Like SLA and Sec tRNA[Ser]Sec, SECp43 form a
complex in cell lysates, and depletion of either SECp43 or SLA decreases the binding of the
remaining protein to the Sec-tRNA[Ser]Sec (Xu et al., 2005). SECp43 normally resides in the
nuclear compartment and is able to sequester SLA from the cytoplasm. Combined depletion
of both proteins causes a global decrease in selenoprotein synthesis (Xu et al., 2005).
Another study has shown that SECp43 plays an important role in the formation or
stabilization of the EFSec–SBP2–Sec tRNA[Ser]Sec complex (Small-Howard et al., 2006). All
these studies suggest that SECp43 and SLA are involved in the mechanism of Sec
biosynthesis and Sec incorporation.
4
Introduction
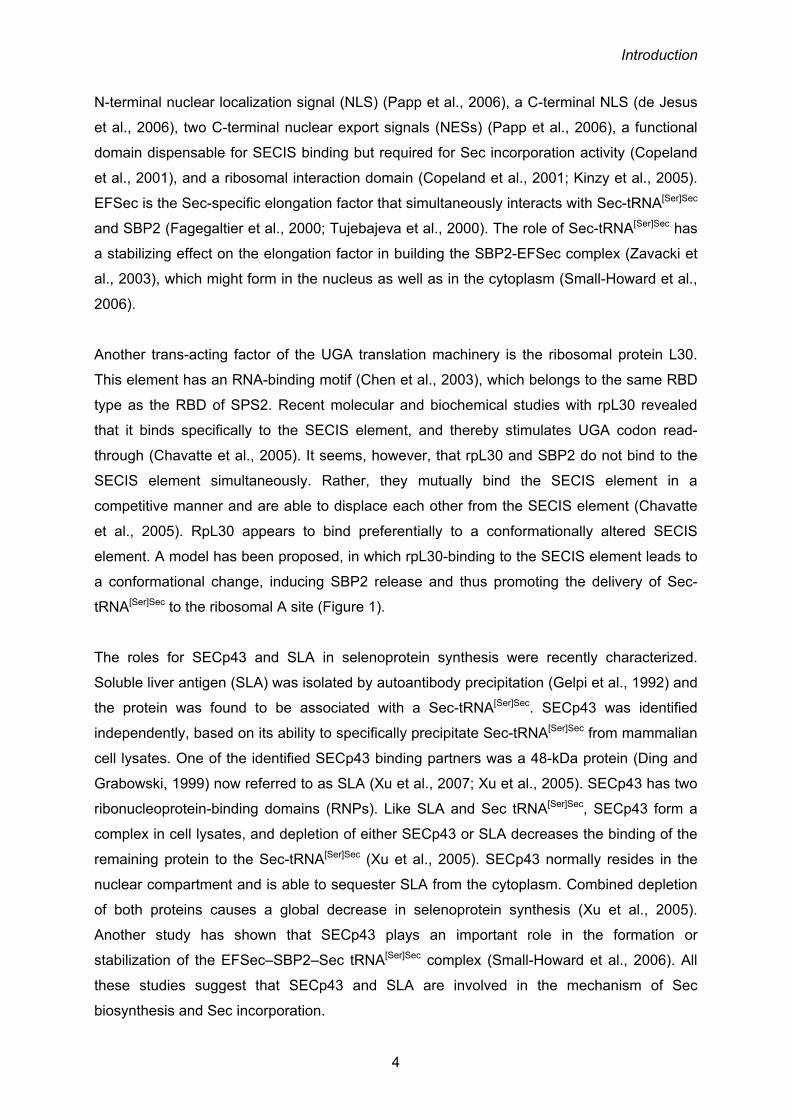
Figure 1. Mechanism of co-translational Sec incorporation. The tRNA (red), carrying Sec (yellow) is depicted in the complex required for co-translational Sec incorporation: EFsec (light green), SBP2 (blue), SLA (dark green), SECp43 (pink) and rpL30 (grey) and the SECIS element (black hairpin loop). Only when these factors are present and arranged in this manner, the opal codon (UGA) serves as a Sec codon, and Sec can be co-translationally incorporated into the nascent polypeptide chain. Translational start and stop codons of the mRNA are indicated by green and red arrows, respectively. The ribosome (large green) contains three RNA binding sites, designated as A, P, and E. The A site binds a tRNA bound to an amino acid; the P site binds a tRNA bound to the peptide being synthesized; and the E site binds a free tRNA before it exits the ribosome.
1.2.2. Family of thioredoxin reductases
The three members of the mammalian thioredoxin reductase family are homodimeric
flavoproteins in which each monomer binds FAD as a prosthetic group. Each monomer has
one NADPH binding site, an interface for dimerization, and two catalytic sites localised at the
N- and C- termini (Holmgren, 1989).
Thioredoxin reductases differ fundamentally between lower and higher organisms. The
enzyme in eukaryotic organisms is more closely related to glutathione reductase (GR) than
to bacterial thioredoxin reductase, being larger, having broader substrate specificity and an
additional redox-active motif, which, at least in mammals, contains Sec (Gladyshev et al.,
1996; Papp et al., 2006).
The main substrates of thioredoxin reductases are oxidized thioredoxins (Trx) (Figure 2).
There are two major thioredoxins in mammals, one primarily localised in the cytosol (Trx1)
and one in mitochondria (Trx2). The expression of these relatively small (12 kDa),
redox-active proteins is essential for embryonic development as knock-out for both Trx1 and
5
Introduction
Trx2 is embryonic lethal at E6.5 and E10.5, respectively (Matsui et al., 1996; Nonn et al.,
2003b). Thioredoxins are characterised by a conserved -Trp-Cys-Gly-Pro-Cys-Lys- catalytic
site that undergoes reversible oxidation/reduction of the two Cys residues. The redox activity
of this catalytic site is necessary for the biological activity of Trx (Freemerman et al., 1999;
Gasdaska et al., 1994).
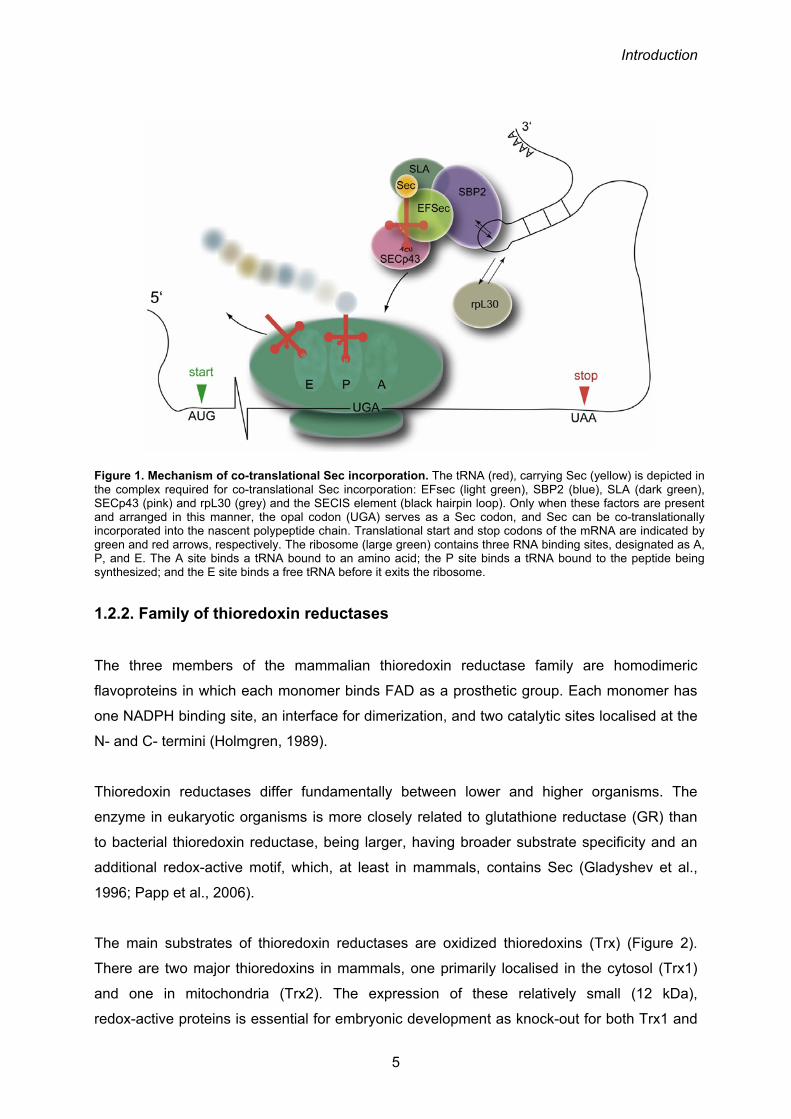
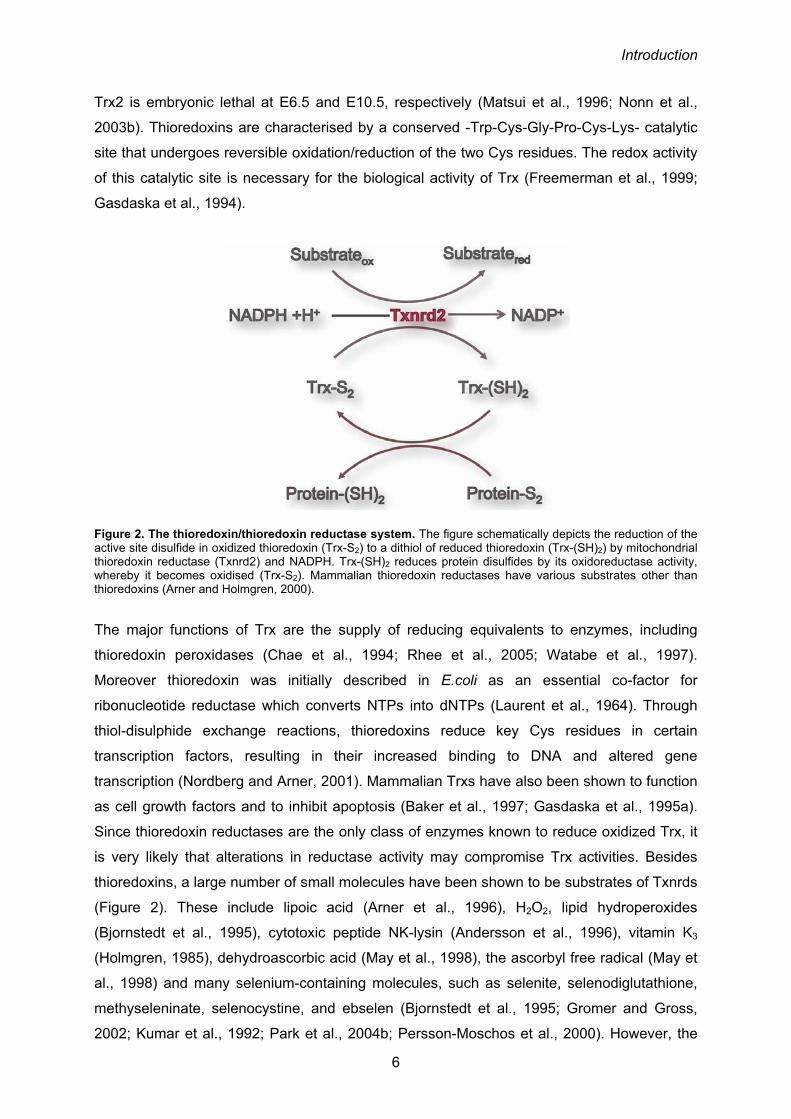
Figure 2. The thioredoxin/thioredoxin reductase system. The figure schematically depicts the reduction of the active site disulfide in oxidized thioredoxin (Trx-S2) to a dithiol of reduced thioredoxin (Trx-(SH)2) by mitochondrial thioredoxin reductase (Txnrd2) and NADPH. Trx-(SH)2 reduces protein disulfides by its oxidoreductase activity, whereby it becomes oxidised (Trx-S2). Mammalian thioredoxin reductases have various substrates other than thioredoxins (Arner and Holmgren, 2000).
The major functions of Trx are the supply of reducing equivalents to enzymes, including
thioredoxin peroxidases (Chae et al., 1994; Rhee et al., 2005; Watabe et al., 1997).
Moreover thioredoxin was initially described in E.coli as an essential co-factor for
ribonucleotide reductase which converts NTPs into dNTPs (Laurent et al., 1964). Through
thiol-disulphide exchange reactions, thioredoxins reduce key Cys residues in certain
transcription factors, resulting in their increased binding to DNA and altered gene
transcription (Nordberg and Arner, 2001). Mammalian Trxs have also been shown to function
as cell growth factors and to inhibit apoptosis (Baker et al., 1997; Gasdaska et al., 1995a).
Since thioredoxin reductases are the only class of enzymes known to reduce oxidized Trx, it
is very likely that alterations in reductase activity may compromise Trx activities. Besides
thioredoxins, a large number of small molecules have been shown to be substrates of Txnrds
(Figure 2). These include lipoic acid (Arner et al., 1996), H2O2, lipid hydroperoxides
(Bjornstedt et al., 1995), cytotoxic peptide NK-lysin (Andersson et al., 1996), vitamin K3
(Holmgren, 1985), dehydroascorbic acid (May et al., 1998), the ascorbyl free radical (May et
al., 1998) and many selenium-containing molecules, such as selenite, selenodiglutathione,
methyseleninate, selenocystine, and ebselen (Bjornstedt et al., 1995; Gromer and Gross,
2002; Kumar et al., 1992; Park et al., 2004b; Persson-Moschos et al., 2000). However, the
6
Introduction
physiological relevance in the reduction of most of these substrates by thioredoxin reductase
is not known.
Three distinct mammalian thioredoxin reductases have been identified: cytosolic thioredoxin
reductase (Txnrd1) (Tamura and Stadtman, 1996), mitochondrial thioredoxin reductase
(Txnrd2) (Gasdaska et al., 1999b; Lee et al., 1999; Miranda-Vizuete et al., 1999; Watabe et
al., 1999) and a testis-specific enzyme thioredoxin-glutathione reductase (Txnrd3/TGR) (Sun
et al., 2001a; Sun et al., 1999). Mammalian thioredoxin reductases are encoded by three
distinctive genes; yet, they share general domain organization (Figure 3).
Both Txnrd1 and Txnrd2 express various isoforms some of which are well characterised. An
evolutionary conserved genetic mechanism contributes to the heterogeneity of Txnrds and
suggests the existence of a greater variety of Txrnd species with different regulation and
cellular functions (Rundlof and Arner, 2004; Rundlof et al., 2000; Rundlof et al., 2007; Su and
Gladyshev, 2004; Sun et al., 2001b; Turanov et al., 2006). Both cytosolic and mitochondrial
Txnrd are essential for murine embryogenesis. The genetic deletion of either gene was
shown to cause embryonic lethality (Bondareva et al., 2007; Conrad et al., 2004; Jakupoglu
et al., 2005).
1.2.3 Mammalian thioredoxin system
1.2.3.1. Cytosolic thioredoxin reductase (Txnrd1)
Txnrd1 is the most studied enzyme of the thioredoxin reductase family. Predominantly
localised in cytosol, this enzyme has a wide range of functions in cells, including the
regulation of cell proliferation and differentiation, modulation of the immune system,
antioxidant defence, redox control of transcription factors, and in the development of cancer
(Arner and Holmgren, 2006; Gromer et al., 2004).
Transcription of cytosolic thioredoxin reductase involves complex alternative splicing and
transcription initiation leading to a large number of different isoforms that differ from each
other at their N-termini (Rundlof et al., 2007; Su and Gladyshev, 2004; Sun et al., 2001b). A
study by Sun QA and colleagues provided evidence for first alternative exon splicing, thus
yielding various different forms of mouse and rat Txnrd1 mRNA. Three alternative forms of
Txnrd1 mRNA were described from a single Txnrd1 gene by transcription initiation at exons
1, 2, or 3 (Sun et al., 2001b). The next study identified six human TXNRD1 isoforms that
were derived from a large number of transcripts and differed in their N-terminal sequences
(Su and Gladyshev, 2004). Similarly, the study by Rundlof AK et al., provided evidence for a
7
Introduction
core promoter region of TXNRD1 in A549 and HeLa cells. This study identified several
TXNRD1 transcripts in the 5′-region using cDNA derived from different tissues. The results
show that the core promoter governs transcription of the majority of TXNRD1 transcripts but
also shows that alternative promoters may be activated under rare conditions or in specific
cell types. Furthermore, extensive alternative splicing occurred in the 5′ region of TXNRD1.
In total, 21 different transcripts were identified, potentially encoding five isoforms of TXNRD1
carrying alternative N-terminal domains (Rundlof et al., 2007).
1.2.3.2. Txnrd3
The thioredoxin reductase isoenzyme TGR, encoded by the Txnrd3 gene, is similar to the
two other reductases, although Txnrd3 appears to be evolutionary more distant than Txnrd1
and Txnrd2. At the N-terminus it contains a monothiol Grx extension conferring both
glutathione and glutaredoxin reductase activity (Sun et al., 2001a; Sun et al., 1999). The
Txnrd3 enzyme is mainly expressed in early spermatids, and is suggested to participate in
redox reactions required during sperm maturation (Su et al., 2005; Sun et al., 2001a; Sun et
al., 2005).
1.2.3.3. Mitochondrial thioredoxin reductase (Txnrd2)
1.2.3.3.1. The molecular structure and catalytic mechanism of Txnrd2
For the time being, four papers describing mouse, human, rat and bovine mitochondrial
thioredoxin reductase, have been reported (Gasdaska et al., 1999a; Gasdaska et al., 1999b;
Lee et al., 1999; Miranda-Vizuete et al., 1999; Watabe et al., 1999). When it was cloned, it
was shown that Txnrd2 has more than 50% sequence identity to both rat (Zhong et al., 1998)
and human (Gasdaska et al., 1995b) Txnrd1 (Lee et al., 1999). However, Txnrd2 contains 36
additional amino acid residues at its N-terminus, which displays features typical of a
mitochondrial leader sequences. Furthermore, rat Txnrd2 shows 50% similarity to the human
glutathione reductase (Lee et al., 1999; Watabe et al., 1999; Zhong et al., 2000)(Figure 3).
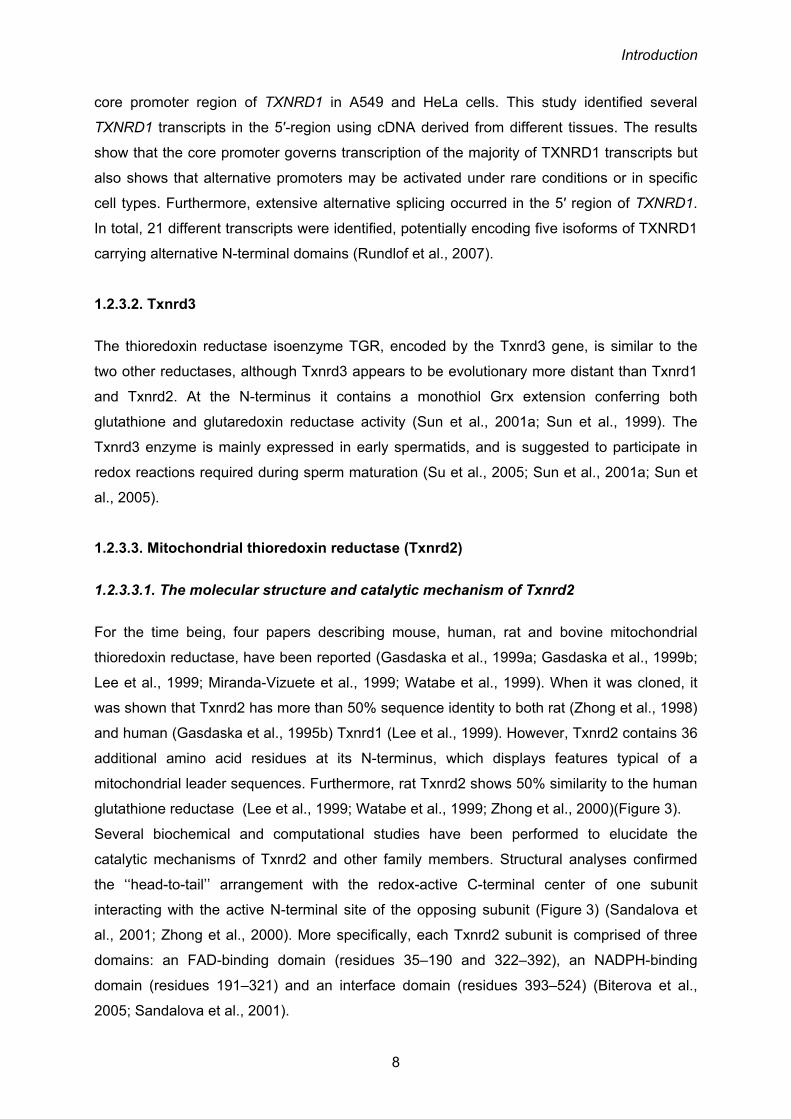
Several biochemical and computational studies have been performed to elucidate the
catalytic mechanisms of Txnrd2 and other family members. Structural analyses confirmed
the ‘‘head-to-tail’’ arrangement with the redox-active C-terminal center of one subunit
interacting with the active N-terminal site of the opposing subunit (Figure 3) (Sandalova et
al., 2001; Zhong et al., 2000). More specifically, each Txnrd2 subunit is comprised of three
domains: an FAD-binding domain (residues 35–190 and 322–392), an NADPH-binding
domain (residues 191–321) and an interface domain (residues 393–524) (Biterova et al.,
2005; Sandalova et al., 2001).
8
Introduction
Figure 3. Model of mammalian Txnrd structure. The structure of mammalian Txnrd is based on the homology to GR. Model of Txnrd with FAD (light green), NADPH (purple) and interface domains (green) (adapted from (Zhong et al., 2000). Active-site cysteines and the Sec (filled circles) are indicated. FAD is represented only with isoalloxazine ring and NADPH with the adenosine structure.
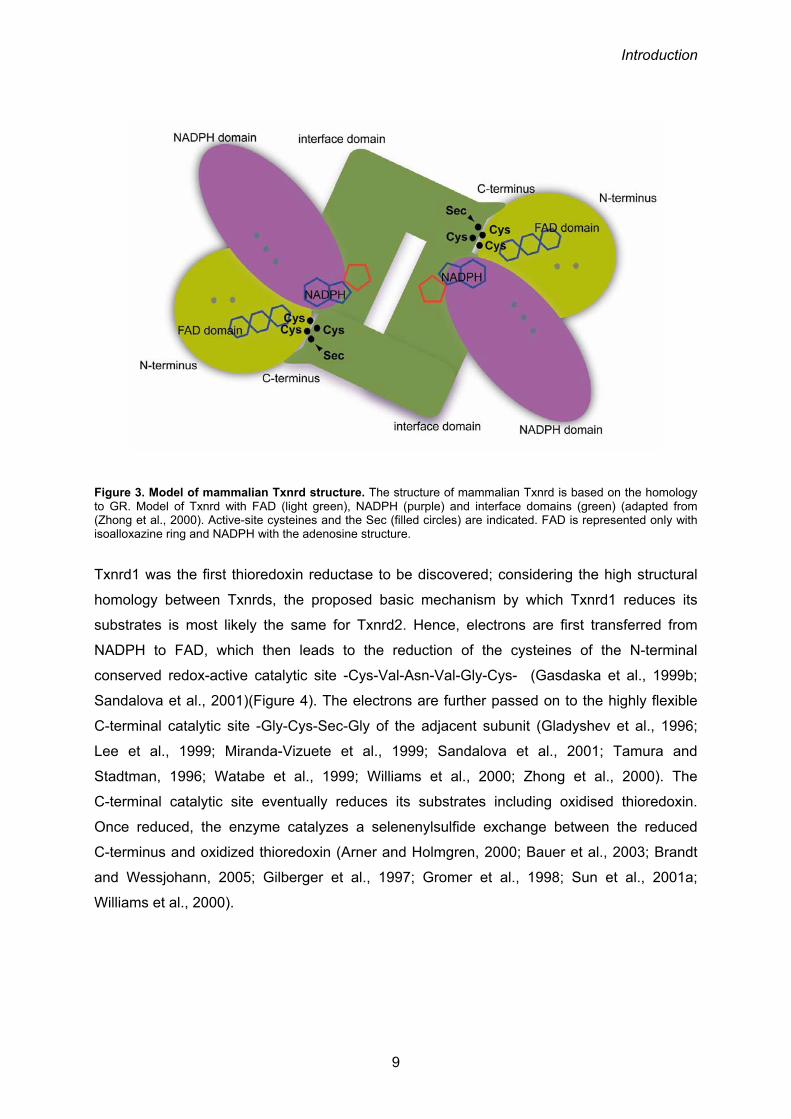
Txnrd1 was the first thioredoxin reductase to be discovered; considering the high structural
homology between Txnrds, the proposed basic mechanism by which Txnrd1 reduces its
substrates is most likely the same for Txnrd2. Hence, electrons are first transferred from
NADPH to FAD, which then leads to the reduction of the cysteines of the N-terminal
conserved redox-active catalytic site -Cys-Val-Asn-Val-Gly-Cys- (Gasdaska et al., 1999b;
Sandalova et al., 2001)(Figure 4). The electrons are further passed on to the highly flexible
C-terminal catalytic site -Gly-Cys-Sec-Gly of the adjacent subunit (Gladyshev et al., 1996;
Lee et al., 1999; Miranda-Vizuete et al., 1999; Sandalova et al., 2001; Tamura and
Stadtman, 1996; Watabe et al., 1999; Williams et al., 2000; Zhong et al., 2000). The
C-terminal catalytic site eventually reduces its substrates including oxidised thioredoxin.
Once reduced, the enzyme catalyzes a selenenylsulfide exchange between the reduced
C-terminus and oxidized thioredoxin (Arner and Holmgren, 2000; Bauer et al., 2003; Brandt
and Wessjohann, 2005; Gilberger et al., 1997; Gromer et al., 1998; Sun et al., 2001a;
Williams et al., 2000).
9
Introduction
Figure 4. Postulated mechanism of Trx reduction. (1) The catalytic reaction starts by reduction of the selenenylsulfide to yield the selenolate (Se−) anion. The selenenylsulfide receives electrons from NADPH via FAD and the N-terminal redox-active dithiol of the first subunit to generate 2) a sulfhydryl and a selenol (-SeH) or selenolate anion (-Se−) at the C-terminus of the second subunit. The selenolate anion (-Se−) performs a nucleophilic attack of the disulfide of Trx. The resulting enzyme-substrate mixed selenenylsulfide 3) is attacked by the neighbouring “releasing” Cys to release fully reduce Trx, thereby forming the selenenylsulfide. The latter 4) is then reduced by the N-terminal active-site thiolate from the other subunit. During the catalytic reaction cycle, the active-site dithiol maintains the selenol in the reduced state. The selenolate anion is both a better nucleophile and a better leaving group than the thiolate anion. Because of the low pKa of the selenol, the selenolate anion is considered to be the predominant form under physiological conditions (adopted from (Zhong et al., 2000)
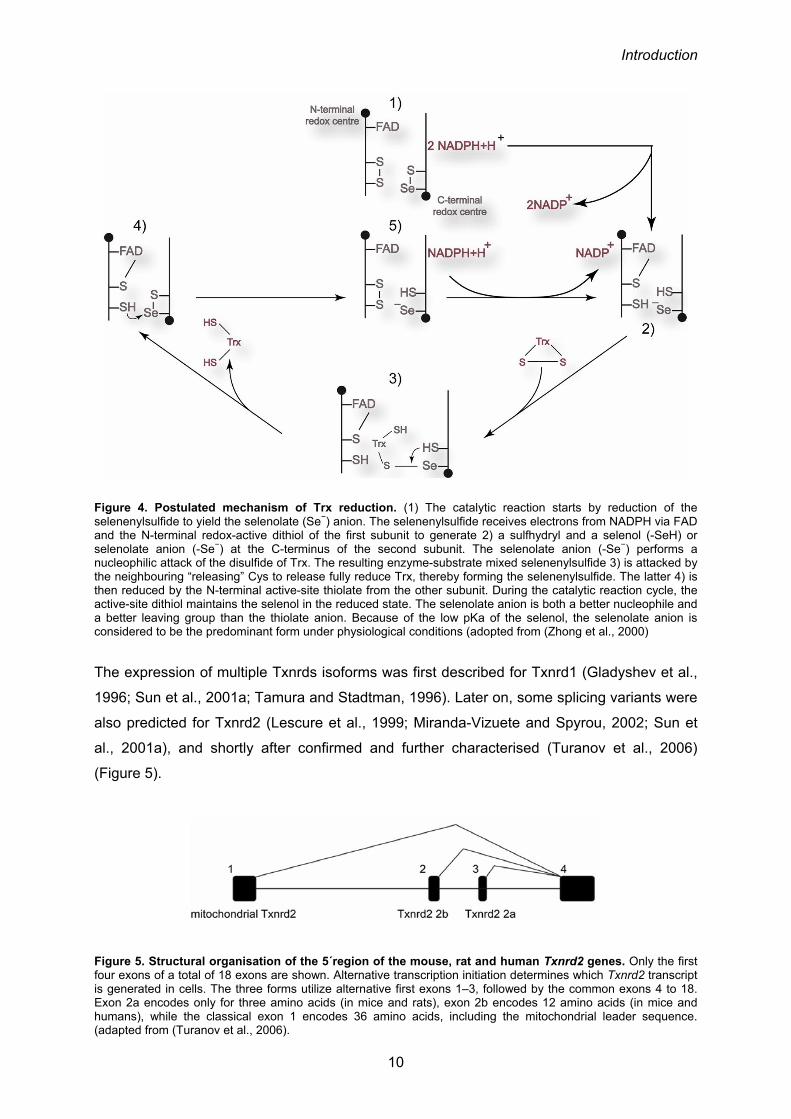
The expression of multiple Txnrds isoforms was first described for Txnrd1 (Gladyshev et al.,
1996; Sun et al., 2001a; Tamura and Stadtman, 1996). Later on, some splicing variants were
also predicted for Txnrd2 (Lescure et al., 1999; Miranda-Vizuete and Spyrou, 2002; Sun et
al., 2001a), and shortly after confirmed and further characterised (Turanov et al., 2006)
(Figure 5).
Figure 5. Structural organisation of the 5´region of the mouse, rat and human Txnrd2 genes. Only the first four exons of a total of 18 exons are shown. Alternative transcription initiation determines which Txnrd2 transcript is generated in cells. The three forms utilize alternative first exons 1–3, followed by the common exons 4 to 18. Exon 2a encodes only for three amino acids (in mice and rats), exon 2b encodes 12 amino acids (in mice and humans), while the classical exon 1 encodes 36 amino acids, including the mitochondrial leader sequence. (adapted from (Turanov et al., 2006).
10
Introduction
The three Txnrd2 isoforms are generated by alternative transcription initiation at the 5´
region. Hence, the Txnrd2 variants differ in their N-termini (Turanov et al., 2006). The same
genomic organisation and the same Txnrd2 variants were also detected in mouse, human
and rat, suggesting a high conservation of alternative splicing among the different organisms.
The predominant form of Txnrd2 contains a N-terminal signal peptide necessary for
mitochondrial targeting (mitochondrial leader sequence, MLS) (Figure 5, mitochondrial
Txnrd2) (Lee et al., 1999; Watabe et al., 1999; Zhong et al., 2000). The two other isoforms
(Figure 5, cytoplasmatic Txnrd2 2b and 2a) have shorter N-terminal sequences and are
localised in cytosol. Additionally, it was shown that the protein Txnrd2 2b resides neither in
the endoplasmic reticulum nor in lysosomes (Turanov et al., 2006).
1.2.3.3.2. Cellular functions of Trx2 and Txnrd2
Eukaryotic mitochondria are equipped with a thioredoxin system, composed of mitochondrial
thioredoxin (Trx2) and mitochondrial thioredoxin reductase (Txnrd2). Both enzymes are
essential in mammals (Conrad et al., 2004; Nonn et al., 2003b); however the physiological
functions of Trx2 and Txnrd2 are far less understood than that for the cytoplasmatic
thioredoxin system, consisting of Txnrd1 and Trx1.
In fact, it has been proposed that the main function of the mitochondrial thioredoxin-
dependent system is to act as the major antioxidant device, controlling the level of ROS in
mitochondria. The antioxidant function of mitochondrial thioredoxin either relies on its direct
scavenging properties (Tanaka et al., 2002) or by reducing the mitochondrial thioredoxin-
dependent peroxidases (Araki et al., 1999; Pedrajas et al., 2000; Watabe et al., 1995;
Watabe et al., 1997). Nalvarte et al. showed ex vivo, that cytochrome c is reduced by Txnrd2
(Nalvarte et al., 2004b). Thus it was proposed that in vivo Trx2 may recruit cytochrome c to
keep it in closer proximity to Txnrd2, which would allow electrons to bypass complex III
during cytochrome c reduction. This hypothesis might be valuable in understanding the
pathophysiology of diseases induced by dysfunctional mitochondrial respiration, such as
cardiomyopathies and encephalomyopathies (Keightley et al., 2000; Lerman-Sagie et al.,
2001). Moreover, Txnrd2 may also be involved in the redox regulation of the mitochondrial
estrogen receptor (Nalvarte et al., 2004b).
Furthermore, using a Tet-off expression system for an alternative splicing variant of TXNRD2
it was found that this form impaired Txnrd2 activity altered cellular ROS levels and increased
apoptosis (Chang et al., 2005). By using a very similar system, when cells were expressing a
dominant-negative form of TXNRD2 (DNTXNRD2) were stimulated with epidermal growth
factor (EGF), they were found to produce more H2O2 than normal cells (Kim et al., 2003b).
11
Introduction
Overexpression of dominant-negative Txnrd2 was shown to perturb proper electron flow from
NADPH via Trx2 to Prx III, thus impinging on cellular redox imbalance. Stimulation of these
cells with EGF then alters the cellular redox status and affects signalling pathways mediated
through tyrosine phosphorylation of ERKs (extracellular signal-regulated kinases).
Furthermore, another laboratory reported that overexpressing either Trx2 or Txnrd2 reduces
p42/p44 MAPK signalling (Zhou et al., 2008). Collectively, these results indicate that the
forced expression of Trx2 and Txnrd2 decreases intracellular ROS, leading to reduced cell
growth. Contrary, the overexpression of DNTXNRD2 accelerates transition of the cells from
G1 to S phase and expression of some cyclins (A, B, D3), CDKs (2, 4), and p27 (Kim et al.,
2003b).
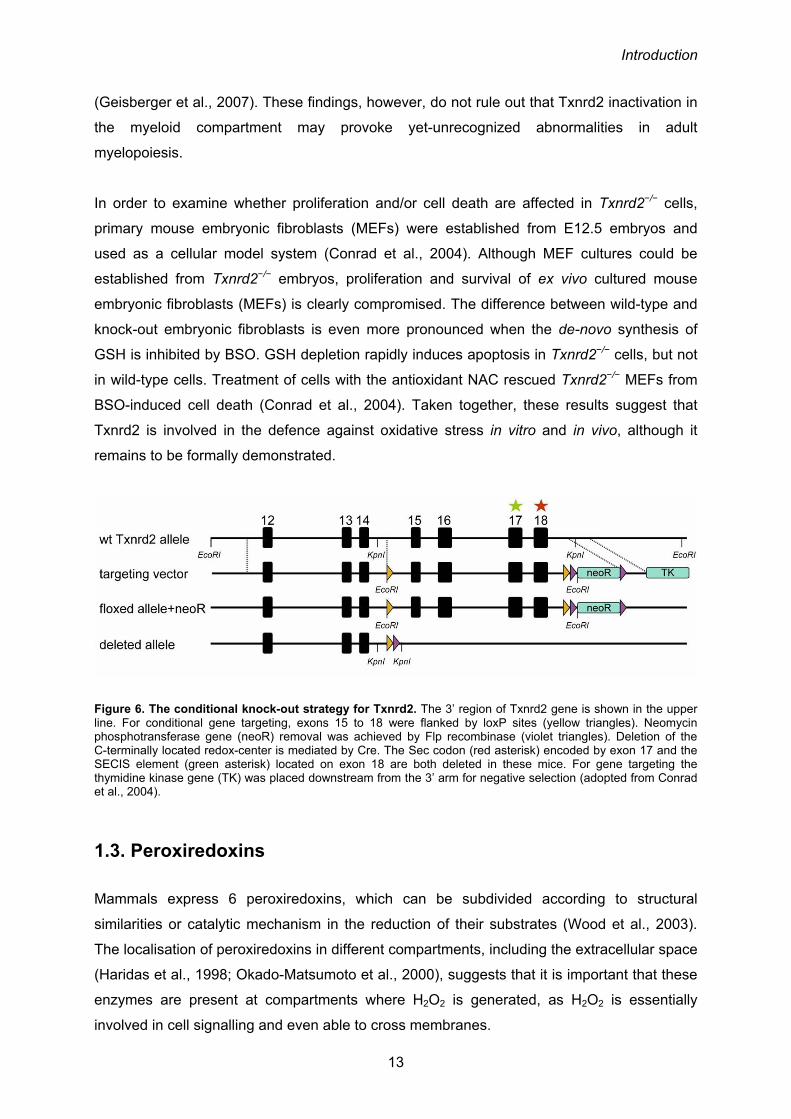
1.2.3.3.3. Knock-out mouse model for Txnrd2
Mice with spatiotemporal inactivation of Txnrd2 were established in our laboratory (Conrad et
al., 2004). To this end, the last four exons of Txnrd2 gene were flanked by loxP sites.
Cre-mediated deletion leads to removal of the C-terminal catalytic site including the Sec
codon, which is encoded by exon 17, the SECIS element and the polyA termination signal,
both encoded by the last exon (Figure 6). In the same work, it was shown that ubiquitous
deletions of both Txnrd2 alleles leads to embryonic lethality around E13.5 most likely due to
severe defects in foetal haematopoiesis and improper heart development. More specifically,
Txnrd2−/− embryos displayed an increased number of apoptotic cells in the foetal
haematopoietic compartment and an impaired proliferative capacity of isolated
haematopoietic stem cells isolated from foetal liver. Moreover, heart-specific Txnrd2
knock-out animals died just after birth. The knock-out mice showed thinning of the ventricular
walls, and a perturbation in the heart muscle architecture. On the cellular level,
cardiomyocytes showed swelling of mitochondria along with a destruction of mitochondrial
cristae of cardiomyocytes. All these phenotypes are hallmarks of dilated cardiomyopathy
(DCM). This suggests that Txnrd2 plays a pivotal role in both foetal haematopoiesis and
cardiac development and function. To bypass postnatal lethality of heart-specific Txnrd2−/−
mice, mice with Tamoxifen (Tam) inducible, cardiac tissue-restricted disruption of Txnrd2
(Figure 6) were generated (Kiermayer et al., 2007). Interestingly, inducible adult
heart-specific Txnrd2 null mice are fully viable, and cardiac tissue did not display any signs of
severe histopathological abnormalities in induced knock-out mice, at least in young animals.
Additionally, a conditional Txnrd2 knock-out mouse (Figure 6) lacking Txnrd2 expression in
CD4−- and CD19-positive T- and B-lymphocytes were generated using CD4−- and CD19- Cre
transgenic mice, respectively. However, the development and differentiation of both cell
types in thymus and bone marrow was not impaired. In addition, B-cell proliferation and
activation in response to CD40 and IL-4 was unaltered in Txnrd2-deficient B-cells
12
Introduction
(Geisberger et al., 2007). These findings, however, do not rule out that Txnrd2 inactivation in
the myeloid compartment may provoke yet-unrecognized abnormalities in adult
myelopoiesis.
In order to examine whether proliferation and/or cell death are affected in Txnrd2−/− cells,
primary mouse embryonic fibroblasts (MEFs) were established from E12.5 embryos and
used as a cellular model system (Conrad et al., 2004). Although MEF cultures could be
established from Txnrd2−/− embryos, proliferation and survival of ex vivo cultured mouse
embryonic fibroblasts (MEFs) is clearly compromised. The difference between wild-type and
knock-out embryonic fibroblasts is even more pronounced when the de-novo synthesis of
GSH is inhibited by BSO. GSH depletion rapidly induces apoptosis in Txnrd2−/− cells, but not
in wild-type cells. Treatment of cells with the antioxidant NAC rescued Txnrd2−/− MEFs from
BSO-induced cell death (Conrad et al., 2004). Taken together, these results suggest that
Txnrd2 is involved in the defence against oxidative stress in vitro and in vivo, although it
remains to be formally demonstrated.
Figure 6. The conditional knock-out strategy for Txnrd2. The 3’ region of Txnrd2 gene is shown in the upper line. For conditional gene targeting, exons 15 to 18 were flanked by loxP sites (yellow triangles). Neomycin phosphotransferase gene (neoR) removal was achieved by Flp recombinase (violet triangles). Deletion of the C-terminally located redox-center is mediated by Cre. The Sec codon (red asterisk) encoded by exon 17 and the SECIS element (green asterisk) located on exon 18 are both deleted in these mice. For gene targeting the thymidine kinase gene (TK) was placed downstream from the 3’ arm for negative selection (adopted from Conrad et al., 2004).
1.3. Peroxiredoxins
Mammals express 6 peroxiredoxins, which can be subdivided according to structural
similarities or catalytic mechanism in the reduction of their substrates (Wood et al., 2003).
The localisation of peroxiredoxins in different compartments, including the extracellular space
(Haridas et al., 1998; Okado-Matsumoto et al., 2000), suggests that it is important that these
enzymes are present at compartments where H2O2 is generated, as H2O2 is essentially
involved in cell signalling and even able to cross membranes.
13
Introduction
Previously, peroxiredoxins were named thioredoxin peroxidases (TPx), since Trx and Txnrd
were initially considered to be the sole reducing systems for peroxiredoxins. But later on it
was shown that mammalian cells express peroxiredoxins with only one conserved
peroxidatic cysteine, capable of reducing peroxides in the presence of DTT (dithiothreitol) but
not in the presence of Trx. For this reason thioredoxin peroxidases (TPx) were then
redefined and named peroxiredoxins (Prx). All peroxiredoxins act as “head-to-tail” dimers, in
which the larger N-terminal domain of one subunit folds over the smaller C-terminal domain
of the other subunit to form an active site (Choi et al., 1998; Hirotsu et al., 1999).
Prxs I–IV belong to the category of 2-Cys Prxs and they share high sequence homology
(60-80%). Prx VI is a member of the 1-Cys group. Peroxiredoxin V, for now, is the only
representative of an atypical 2-Cys protein (Seo et al., 2000). Also, Prx I-IV belong to the
thioredoxin peroxidase subfamily (TPx) and require thioredoxin (Trx) as an electron source,
while Prx V and VI can use other cellular reducing agents, such as GSH or DTT (Fisher et
al., 1999; Seo et al., 2000). Prx I, Prx II, and Prx VI are localised in the cytoplasm and in the
nucleus (Kinnula et al., 2002; Mizusawa et al., 2000; Oberley et al., 2001). Other than these,
Prx VI displays other cellular localisations including lysosomes and cytoplasmic vesicles. Prx
IV has an N-terminal secretion signal sequence and is found in the endoplasmic reticulum as
well as in the extracellular space (Okado-Matsumoto et al., 2000). Prx III and V are both
expressed in the mitochondrion, although Prx V is additionally detected as a short form in
peroxisomes (Seo et al., 2000) and in nuclei (Kinnula et al., 2002). Prx III and Prx V use the
mitochondrial thioredoxin system (Trx2 and Txnrd2) as the main electron source for its
peroxidase activity (Watabe et al., 1995; Watabe et al., 1997), but they may also use
electrons from DTT in vitro. The specific localization of Prx III in mitochondria, along with the
mitochondria-specific reducing system Trx2 and Txnrd2, suggests that these three proteins
possibly together with Prx V provide a primary line of defence against H2O2 produced by the
mitochondrial respiratory chain. The precise in vivo roles of Prx III and Prx V and their
contribution to the maintenance of normal mitochondrial and cellular function are, however,
still sparely investigated. Specific inactivation of both Prxs has been reported to increase
their sensitivity to apoptosis (Araki et al., 1999; Chang et al., 2004b; Watabe et al., 1995;
Watabe et al., 1997; Zhou et al., 2000). Lowering Prx III expression increases the sensitivity
of cells to TNFα- or staurosporine-induced apoptosis (Chang et al., 2004b). Studies with Prx
III knock-out mice revealed that Prx III is not required for embryonic development; rather the
knock-out mice were more sensitive to LPS-induced severe lung injury due to augmented
levels of intracellular ROS. Thus, it has been proposed that Prx III acts as an important ROS
scavenger, particularly under stress–inducing conditions (Li et al., 2007). Mice
14
Introduction
overexpressing Prx III were shown to have decreased left ventricular remodelling and cardiac
failure in response to myocardial infarction due to reduced mitochondrial oxidative stress
(Matsushima et al., 2006; Tsutsui et al., 2009). Furthermore, overexpression of Prx III in
thymoma cells was shown to dampen cellular H2O2 levels, leading to decreased growth rates
and increased resistance to apoptosis induced either by high H2O2, hypoxia, t-
butylhydroperoxide and the anticancer drug imexon (Nonn et al., 2003a). Overexpression of
Prx III has been reported to protect rat hippocampal neurons from excitotoxic injury (Hattori et
al., 2005b). Up-regulation of Prx VI and Prx III within skeletal muscles of neuronal nitric oxide
synthase (nNOS) knock-out mice functionally compensates for the absence of nNOS in
superoxide scavenging (Da Silva-Azevedo et al., 2009). Increased expression of Prx V in
Chinese hamster ovary cells was found to decrease mtDNA damages caused by
exogenously added hydrogen peroxide (Banmeyer et al., 2005). Furthermore, Prx I and Prx II
are prime candidates to regulate H2O2 signalling of cell-surface receptors after activation with
platelet-derived growth factor (PDGF) or tumor necrosis factor (TNF) (Choi et al., 2005; Egler
et al., 2005; Jin et al., 1997; Kang et al., 1998b; Kang et al., 2004; Kim et al., 2008; Kwon et
al., 2004; Veal et al., 2004; Zhang et al., 1997; Zhao et al., 2009).
Furthermore, Prx expression is increased in several human cancers. Prx I levels are
increased relative to normal tissue in oral cancer (Yanagawa et al., 2000), in follicular
(Yanagawa et al., 2000), in breast cancer (Noh et al., 2001), and in lung cancer (Kim et al.,
2003a). Noh DY et al. have shown that Prx II and III are increased in breast cancer (Noh et
al., 2001), while increased expression of all peroxiredoxins has been observed in
mesothelioma (Kinnula et al., 2002).
1.3.1. The catalytic mechanisms of peroxiredoxins
The catalytic mechanisms by which 2-Cys and 1-Cys Prx enzymes remove peroxides
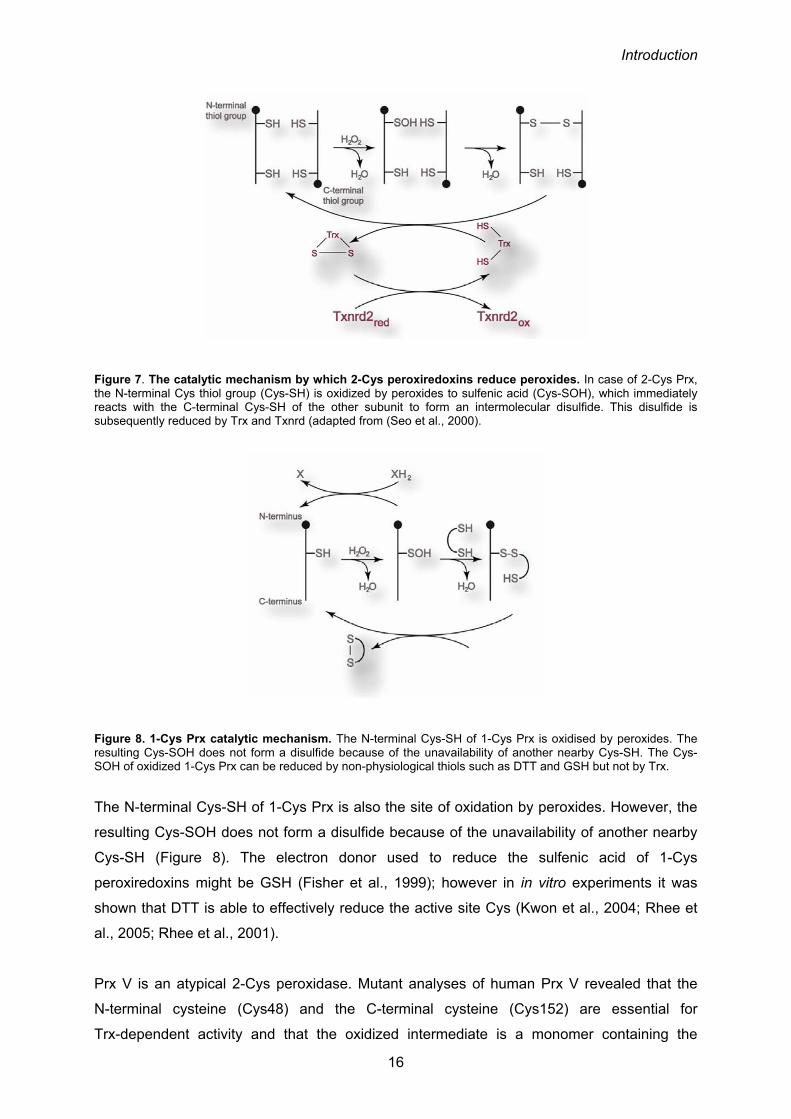
diverge (Kang et al., 1998a). In case of 2-Cys Prx (Figure 7), the N-terminal thiol group
(Cys-SH) is oxidized by peroxides to sulfenic acid (Cys-SOH), which immediately reacts with
the C-terminal Cys-SH of the other subunit to form an intermolecular disulfide. This disulfide
is subsequently reduced by Trx and Txnrd (Seo et al., 2000). Kang et al showed that mutant
2-Cys Prx proteins that lack either the N-terminal or C-terminal Cys residues do not exhibit
Trx-dependent peroxidase activity (Kang et al., 1998a).
15
Introduction
Figure 7. The catalytic mechanism by which 2-Cys peroxiredoxins reduce peroxides. In case of 2-Cys Prx, the N-terminal Cys thiol group (Cys-SH) is oxidized by peroxides to sulfenic acid (Cys-SOH), which immediately reacts with the C-terminal Cys-SH of the other subunit to form an intermolecular disulfide. This disulfide is subsequently reduced by Trx and Txnrd (adapted from (Seo et al., 2000).
Figure 8. 1-Cys Prx catalytic mechanism. The N-terminal Cys-SH of 1-Cys Prx is oxidised by peroxides. The resulting Cys-SOH does not form a disulfide because of the unavailability of another nearby Cys-SH. The Cys-SOH of oxidized 1-Cys Prx can be reduced by non-physiological thiols such as DTT and GSH but not by Trx.
The N-terminal Cys-SH of 1-Cys Prx is also the site of oxidation by peroxides. However, the
resulting Cys-SOH does not form a disulfide because of the unavailability of another nearby
Cys-SH (Figure 8). The electron donor used to reduce the sulfenic acid of 1-Cys
peroxiredoxins might be GSH (Fisher et al., 1999); however in in vitro experiments it was
shown that DTT is able to effectively reduce the active site Cys (Kwon et al., 2004; Rhee et
al., 2005; Rhee et al., 2001).
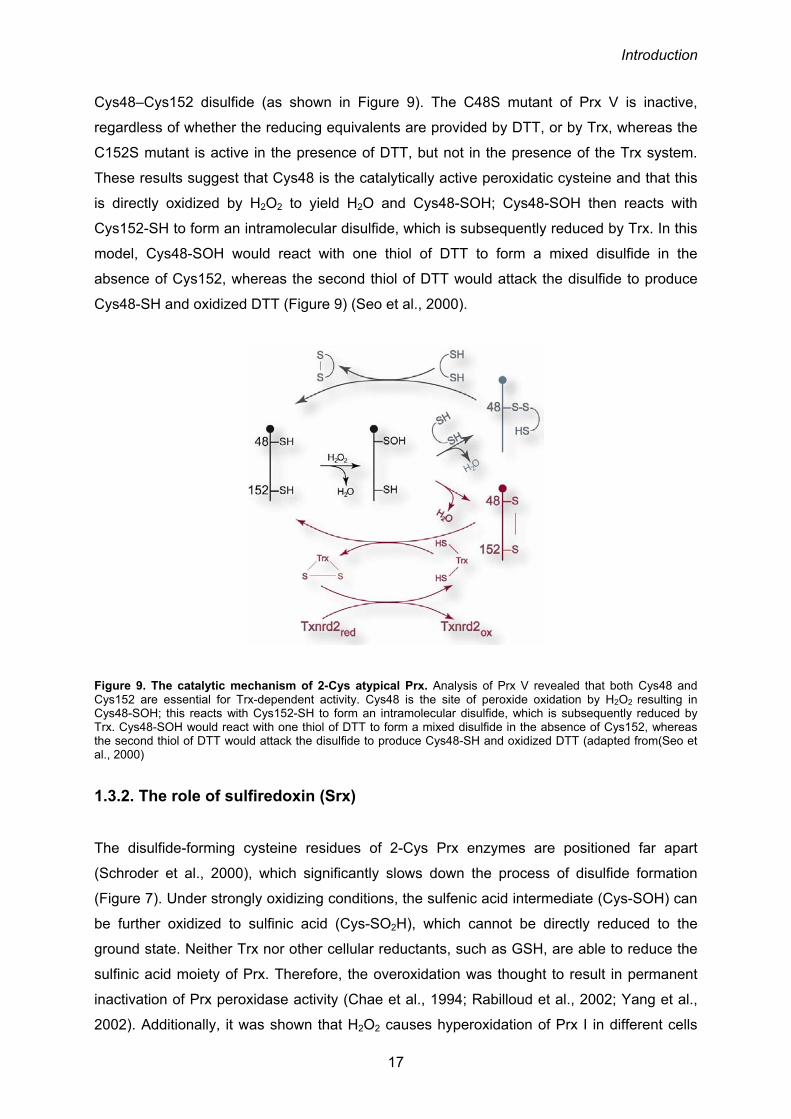
Prx V is an atypical 2-Cys peroxidase. Mutant analyses of human Prx V revealed that the
N-terminal cysteine (Cys48) and the C-terminal cysteine (Cys152) are essential for
Trx-dependent activity and that the oxidized intermediate is a monomer containing the
16
Introduction
Cys48–Cys152 disulfide (as shown in Figure 9). The C48S mutant of Prx V is inactive,
regardless of whether the reducing equivalents are provided by DTT, or by Trx, whereas the
C152S mutant is active in the presence of DTT, but not in the presence of the Trx system.
These results suggest that Cys48 is the catalytically active peroxidatic cysteine and that this
is directly oxidized by H2O2 to yield H2O and Cys48-SOH; Cys48-SOH then reacts with
Cys152-SH to form an intramolecular disulfide, which is subsequently reduced by Trx. In this
model, Cys48-SOH would react with one thiol of DTT to form a mixed disulfide in the
absence of Cys152, whereas the second thiol of DTT would attack the disulfide to produce
Cys48-SH and oxidized DTT (Figure 9) (Seo et al., 2000).
Figure 9. The catalytic mechanism of 2-Cys atypical Prx. Analysis of Prx V revealed that both Cys48 and Cys152 are essential for Trx-dependent activity. Cys48 is the site of peroxide oxidation by H2O2 resulting in Cys48-SOH; this reacts with Cys152-SH to form an intramolecular disulfide, which is subsequently reduced by Trx. Cys48-SOH would react with one thiol of DTT to form a mixed disulfide in the absence of Cys152, whereas the second thiol of DTT would attack the disulfide to produce Cys48-SH and oxidized DTT (adapted from(Seo et al., 2000)
1.3.2. The role of sulfiredoxin (Srx)
The disulfide-forming cysteine residues of 2-Cys Prx enzymes are positioned far apart
(Schroder et al., 2000), which significantly slows down the process of disulfide formation
(Figure 7). Under strongly oxidizing conditions, the sulfenic acid intermediate (Cys-SOH) can
be further oxidized to sulfinic acid (Cys-SO2H), which cannot be directly reduced to the
ground state. Neither Trx nor other cellular reductants, such as GSH, are able to reduce the
sulfinic acid moiety of Prx. Therefore, the overoxidation was thought to result in permanent
inactivation of Prx peroxidase activity (Chae et al., 1994; Rabilloud et al., 2002; Yang et al.,
2002). Additionally, it was shown that H2O2 causes hyperoxidation of Prx I in different cells
17
Introduction
which was gradually reduced to the catalytically active thiol form (Woo et al., 2003a; Woo et
al., 2003b). This implied that in cells there must be a system demonstrated the ability of
mammalian cells to reduce protein sulfinic acid. Subsequently, Toledano’s laboratory
identified sulfiredoxin (Srx) in yeast capable of reducing sulfinylated Prx and thus returning it
into its fully reduced ground state (Biteau et al., 2003). Srx was initially identified as its
expression is rapidly induced by high H2O2 concentrations. These studies further showed that
Prx reduction requires a conserved cysteine residue in Srx, ATP or GTP hydrolysis, Mg2+ and
a thiol group as an electron donor (Trx or DTT) (Biteau et al., 2003). The reductase activity of
rat Srx was shown to be equally efficient with GSH or Trx as electron source (Chang et al.,
2004c). Reduction of sulfinic acid by mammalian Srx is specific to 2-Cys Prx isoforms (Woo
et al., 2005). Thus, the cycle of thiol to sulfinic acid might represent a redox switch by which
the function of a wide variety of proteins is regulated in response to a strongly changing
intracellular redox status. It was also shown that the conserved cysteine of Srx from various
species is essential for enzyme activity. The catalytically active cysteine is thought to serve
as the phosphate carrier in the reducing reaction (Roussel et al., 2008):
Prx-SO2H + ATP → Prx-SO2-PO3-2 + ADP
or as the removing site for phosphate in the thiol-transferase reaction:
Prx-SO2-PO32- + Srx-S → Prx-S(O)-S-Srx + PO4
3-
Even when cells are exposed to high H2O2 concentrations Srx is not inactivated. Srx is able
to keep peroxiredoxins in their reduced states, because Srx turnover by ATP is highly
efficient, similar to the reduction of Trx by Txnrd2 (Chang et al., 2004c). It has been
speculated that the slow rate of Prx reactivation via Srx-dependent reduction has been
evolved to regulate the basal levels H2O2 so that it can confer its intracellular second
messenger-like function (Bondareva et al., 2007; Chang et al., 2004c; Woo et al., 2003a;
Woo et al., 2003b). Rapid reactivation of the inactivated Prx enzymes would reduce the time
window needed for H2O2 accumulation and thus propagating the signal. Although sulfiredoxin
is mainly localised in the cytoplasm, it was shown that in vitro Srx reduces not only sulfinic
acids of cytosolic Prxs (I and II) but also sulfinic acid of mitochondrial Prx III (Noh et al.,
2009; Woo et al., 2005). In response to oxidative stress, sulfiredoxin was shown to
translocate from the cytosol to mitochondria. Moreover, overexpression of mitochondrion-
targeted Srx promotes the regeneration of overoxidised Prx III and results in cellular
resistance to apoptosis, accompanied by enhanced elimination of mitochondrial H2O2 and
decreased rates of mitochondrial membrane breakdown. Therefore, Srx appear to play a
18
Introduction
crucial role in maintaining the balance between mitochondrial H2O2 production and
elimination (Noh et al., 2009).
1.4. System xC−
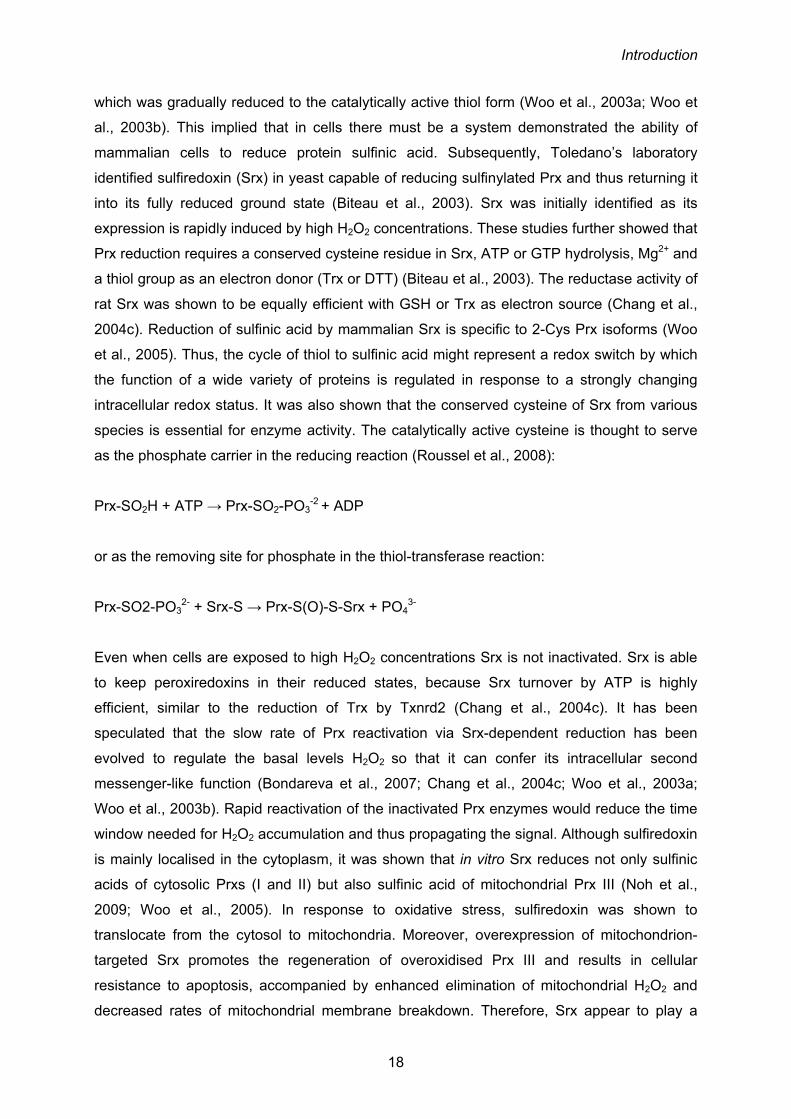
Cysteine is an essential amino acid and as such is indispensable for normal cell proliferation,
including cultured cells. Moreover, cysteine (Cys) is unstable in the extracellular environment
and becomes readily oxidised to yield cystine, (Cys)2 (Toohey, 1975).
Figure 10. The Cys/(Cys)2 circuit. Cysteine (CySH) is unstable in the extracellular environment and is readily oxidised to cystine (Cys)2. Cysteine transport is mediated by the neutral amino acid transport system ASC, while the transport of cystine is mediated by system xC
−. System xC− is an antiporter for cystine and glutamate. Cystine,
taken up via system xC−, is rapidly reduced to cysteine in the intracellular reducing environment, which is then
used for protein synthesis or GSH biosynthesis. The driving force of this circuit that actually reduces cystine to cysteine is considered to be GSH, by forming mixed disulfides; yet experimental proof is still lacking.
Cysteine transport is mediated by the neutral amino acid transport system ASC, whereas the
transport of cystine, the predominant form of cysteine in the extracellular space and body
fluids, is accomplished by system xC− (Bannai and Kasuga, 1985; Sato et al., 2000). System
xC− is a member of the glycoprotein-associated amino acid transporters (gpAATs) (Shih and
Murphy, 2001). gpAAT functions as heterodimeric transmembrane proteins consisting of a
highly glycosylated heavy chain (4F2hc/CD98) that is common to all gpAATs, and a light
chain. The light chain component of system xC− is xCT which confers high substrate
specificity for cystine (Bannai, 1986; Bannai and Ishii, 1982; Sato et al., 2000). System xC−
carries one mole of cysteine and at the same time releases one mole of glutamate. Upon
uptake, cystine is rapidly reduced to cysteine inside cells, which is subsequently used for the
synthesis of GSH or proteins (Bannai and Ishii, 1982). Since intracellular cysteine
concentrations are the substrate-limiting step in GSH biosynthesis, the intracellular GSH
level is considered to be coupled to systems xC− activity, at least in cell culture.
19
Introduction
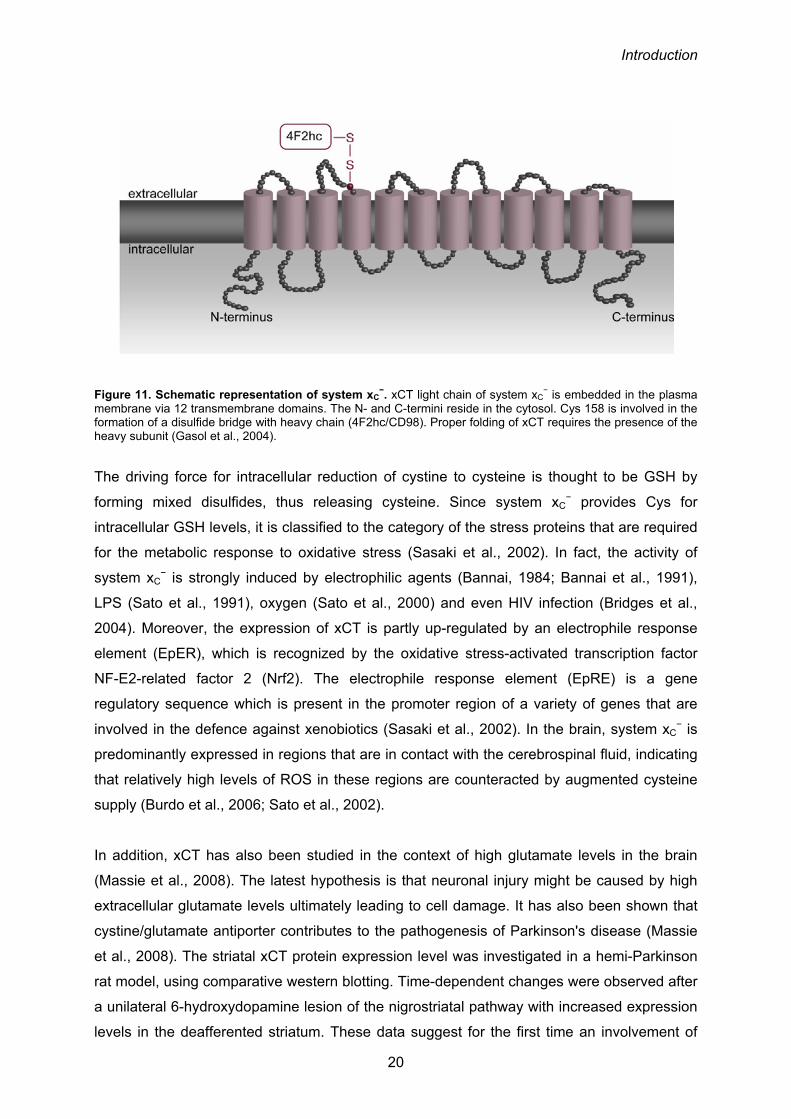
Figure 11. Schematic representation of system xC
−. xCT light chain of system xC− is embedded in the plasma
membrane via 12 transmembrane domains. The N- and C-termini reside in the cytosol. Cys 158 is involved in the formation of a disulfide bridge with heavy chain (4F2hc/CD98). Proper folding of xCT requires the presence of the heavy subunit (Gasol et al., 2004).
The driving force for intracellular reduction of cystine to cysteine is thought to be GSH by
forming mixed disulfides, thus releasing cysteine. Since system xC− provides Cys for
intracellular GSH levels, it is classified to the category of the stress proteins that are required
for the metabolic response to oxidative stress (Sasaki et al., 2002). In fact, the activity of
system xC− is strongly induced by electrophilic agents (Bannai, 1984; Bannai et al., 1991),
LPS (Sato et al., 1991), oxygen (Sato et al., 2000) and even HIV infection (Bridges et al.,
2004). Moreover, the expression of xCT is partly up-regulated by an electrophile response
element (EpER), which is recognized by the oxidative stress-activated transcription factor
NF-E2-related factor 2 (Nrf2). The electrophile response element (EpRE) is a gene
regulatory sequence which is present in the promoter region of a variety of genes that are
involved in the defence against xenobiotics (Sasaki et al., 2002). In the brain, system xC− is
predominantly expressed in regions that are in contact with the cerebrospinal fluid, indicating
that relatively high levels of ROS in these regions are counteracted by augmented cysteine
supply (Burdo et al., 2006; Sato et al., 2002).
In addition, xCT has also been studied in the context of high glutamate levels in the brain
(Massie et al., 2008). The latest hypothesis is that neuronal injury might be caused by high
extracellular glutamate levels ultimately leading to cell damage. It has also been shown that
cystine/glutamate antiporter contributes to the pathogenesis of Parkinson's disease (Massie
et al., 2008). The striatal xCT protein expression level was investigated in a hemi-Parkinson
rat model, using comparative western blotting. Time-dependent changes were observed after
a unilateral 6-hydroxydopamine lesion of the nigrostriatal pathway with increased expression
levels in the deafferented striatum. These data suggest for the first time an involvement of
20
Introduction
the cystine/glutamate antiporter in determining the aberrant glutamate neurotransmission in
the striatum of a parkinsonian brain (Massie et al., 2008).
On the other hand, high xCT expression levels have been shown to negatively correlate with
the potency of the anti-tumor drug cisplatin, as shown in cisplatin-resistant human ovarian
cancer cell line (Okuno et al., 2003). Accordingly, the inhibition of system xC− abolished the
growth of primary brain tumours (Chung et al., 2005; Savaskan et al., 2008). Enforced
expression of xCT protects Burkitt’s lymphoma cells from cell death induced by oxidative
stress and GSH depletion (Banjac et al., 2008). The studies by Banjac et al. provided strong
evidence that the cystine/cysteine redox couple represents an efficient redox system, which
may also act independently from intracellular GSH (Banjac et al., 2008).
It is noteworthy, that mice lacking xCT are born at the Mendelian ratio and are healthy in
appearance (Sato et al., 2005). Most interestingly, xCT-deficient MEFs rapidly die in normal
cell culture, if not supplemented with thiol-containing compounds, such as GSH or NAC
(Qiao et al., 2008; Sato et al., 2005). This is a perfect example that one has to be extremely
careful when conclusions are drawn from in vitro experiments, particularly when dealing with
oxidative stress and redox signalling - very often in vitro results do not really reflect the in
vivo situation, which calls for more specific transgenic mouse models for redox enzymes.
1.5. Objectives
The importance of the overall cellular redox balance on many cell processes has been
recognized in recent years. However, the redox control of distinct cellular pathways is still
poorly understood and still at its infancy. This is also supported by the fact, that interacting
partners, as well as substrates of redox enzymes, are widely unknown.
To date, in ex vivo studies investigating the role of peroxiredoxins (Prx) in cellular redox
system, the focus was placed on the biochemical characterisation of reactions which
included Trx2 and Txnrd2. It was found that Trx2 is needed for maintenance of Prx in the
active state. Also, form these experiments it is known that this reaction was possible only in
the presence of Txnrd2. Given that a confirmation of these results in vivo is lacking, one of
our research aims was to demonstrate that the mechanisms proposed are also operable in
the cells.
Furthermore, in order to dissect the contribution of the thioredoxin 2 dependent system on
the redox balance and effect on the overall physiology and pathophysiology of tissues and
21
Introduction
organs, a mice with targeted deficiencies in mitochondrial thioredoxin reductase (Txnrd2)
were created (Conrad et al., 2004). Ubiquitous inactivation of Txnrd2 revealed that
mitochondrial thioredoxin reductase is essential for embryonic development, increased
apoptosis of haematopoietic cells and perturbed cardiac development. Additionally, heart-
specific Txnrd2 ablation shows perturbed myocyte organisation and leads to fatal cardiac
insufficiency (Conrad et al., 2004). Hence, unbalanced levels of ROS due to Txnrd2 absence
are probably a cause for the failing myocardium and lethality among ubiquitous and heart-
specific Txnrd2 knock-out mice. The use of cells isolated from the embryos lacking Txnrd2
(MEFs and eEPCs) would therefore help us reveal the mechanisms behind cell and tissue
pathological modifications caused by absence of Txnrd2. The next aim of the present study
was to clone the tagged mitochondrial and cytoplasmatic isoforms of Txnrd2 and to confirm
their function in vivo, by using the cells which lack respective enzymes. Furthermore, we
have used the constructs to investigate more in detail cellular localisation of Txnrd2 isoforms,
since the data on their subcellular arrangement is sparse. Moreover, it was interesting to see
whether there is in vitro functional overlap between Txnrd1 and Txnrd2. In order to elucidate
biological implications of mutation in mitochondrial Txnrd2 found in DCM patients, we have
designed two different mutants and performed a functional analysis in transfected cells, as
well as the repercussions of introduced changes on the protein localisation.
Over recent decades genetically manipulated mouse models have proven themselves as
valuable tools to study human disease and as models to study disease mechanisms.
Cystine/glutamate transporter, designated as system xc−, mediates cystine entry in exchange
for intracellular glutamate in mammalian cells. Overexpression of xCT plays a role in
maintaining the GSH intracellular levels (Bannai, 1986). As shown by Banjac et al,
overexpression of xCT in vitro in Burkit lymphoma cells protects them from BSO-induced cell
death (Banjac et al., 2008). Moreover, it is suggested that Cys/(Cys)2 biochemical system
functions independently and could be induced by oxidative stress, mediated by electrophilic
agents and by oxygen (Bannai et al., 1989; Hattori et al., 2005a) surmounting the effects of
oxidative stress. In this work our aim was to extend the study of Banjac et al and to clarify the
physiological roles of xCT transporter in vivo. Thus, we successfully generated mice
overexpressing xCT. For that purpose Rosa26 locus was used. This is a mouse locus
commonly used to knock-in different constructs for ubiquitous or conditional gene expression
in transgenic mice. Also, since, molecular mechanisms of potential cross-talk between
system xC− and Txnrd2 remain obscure, we sought to perform a comprehensive analysis of
Txnrd-deficient cells and a putative overlap between Txnrd2 and system xC− seeking for the
truly driving force of the Cys/(Cys)2 circuit.
22
Materials & Methods
23
2. Materials and Methods
2.1. Materials
Chemicals Company Catalog-No. 4-Hydroxytamoxifen (Tam) Sigma-Aldrich GmbH, Taufkirchen, Germany H7904
Acrylamide Roth Carl GmbH & Co., Karlsruhe, Germany 3426
Agarose Invitrogen, Karlsruhe, Germany 15510-027
Agarose, low melting point Fermentas GmbH, St. Leon-Rot, Germany R0801
Albumin Fraction V Roth Carl GmbH & Co., Karlsruhe, Germany 2923225
Ammonia (30%) Merck KGaA, Darmstadt, Germany 1054231000
Ammonium persulfate Sigma-Aldrich GmbH, Taufkirchen, Germany A3678
Ampicillin sodium salt Sigma-Aldrich GmbH, Taufkirchen, Germany A9518
ANTI-FLAG M2 Affinity Gel Sigma-Aldrich GmbH, Taufkirchen, Germany A2220
Antimycin A Sigma-Aldrich GmbH, Taufkirchen, Germany A0274
Bacto yeast extracts Difco Laboratories, Michigan, USA
BODIPY581/591 C11 Invitrogen, Karlsruhe, Germany D-3861
Boric acid Merck KGaA, Darmstadt, Germany 203667
Bromophenol Blue sodium salt Sigma-Aldrich GmbH, Taufkirchen, Germany B8026
L-Buthionine Sulfoximine (BSO) Sigma-Aldrich GmbH, Taufkirchen, Germany B2640
Calcium chloride Sigma-Aldrich GmbH, Taufkirchen, Germany C7902
Chloroquine diphosphate salt Sigma-Aldrich GmbH, Taufkirchen, Germany C6628
cis-Platinum(II) dichloride Sigma-Aldrich GmbH, Taufkirchen, Germany P4394
Citric acid Sigma-Aldrich GmbH, Taufkirchen, Germany C4540
DAPI Invitrogen, Karlsruhe, Germany D1306
DCF, DCFDA Invitrogen, Karlsruhe, Germany C-13293
Dimethyl sulfoxide (DMSO) Sigma-Aldrich GmbH, Taufkirchen, Germany D2650
Disodium hydrogen ortophosphat Merck KGaA, Darmstadt, Germany 1065855000
Dithiothreitol (DTT) Sigma-Aldrich GmbH, Taufkirchen, Germany D8161
dNTP/dUTP Mix Fermentas GmbH, St. Leon-Rot, Germany R0241
Doxorubicin hydrochloride Sigma-Aldrich GmbH, Taufkirchen, Germany D1515
ECL GE Healthcare, Freiburg, Germany RPN2106
Ethanol p.a Merck KGaA, Darmstadt, Germany 1.00983.2500
Ethidium bromide Merck KGaA, Darmstadt, Germany 70257083
EDTA Sigma-Aldrich GmbH, Taufkirchen, Germany E9884
Foetal Bovine Serum (FCS) PAA, Pasching, Austria A15-043
Formaldehyde (38%) Sigma-Aldrich GmbH, Taufkirchen, Germany F8775
Formamide Merck KGaA, Darmstadt, Germany 344205
Gelatine from porcine skin Sigma-Aldrich GmbH, Taufkirchen, Germany G2500
Glacial acetic acid Merck KGaA, Darmstadt, Germany 8187552500
Glutaraldehyd (25%) Merck KGaA, Darmstadt, Germany 354400
Glutathione (GSH) Sigma-Aldrich GmbH, Taufkirchen, Germany G6013
Materials & Methods
Chemicals Company Catalog-No. Glycerol Sigma-Aldrich GmbH, Taufkirchen, Germany G8773
Glycine Merck KGaA, Darmstadt, Germany 2002722
HEPES Invitrogen, Karlsruhe, Germany 15630-080
Hydroperoxide Sigma-Aldrich GmbH, Taufkirchen, Germany H1009
Iodoacetamide Sigma-Aldrich GmbH, Taufkirchen, Germany I6125
Isopropanol p.a. Merck KGaA, Darmstadt, Germany 1.09634.2511
LIF (ESGRO) Millipore, Billerica, MA, USA ESG1107
Luria Broth Base Invitrogen, Karlsruhe, Germany 12795-019
Magnesium sulfate Merck KGaA, Darmstadt, Germany 105886
Mounting medium Dako Cytomation, Hamburg, Germany S3023
N-Acetyl-L-cysteine (NAC) Sigma-Aldrich GmbH, Taufkirchen, Germany A9165
Oligonucleotides Metabion international AD, Martinsried, Germany
Paraformaldehyde (PFA) Roth Carl GmbH & Co., Karlsruhe, Germany 0335.3
Penicillin-Streptomycin solution Invitrogen, Karlsruhe, Germany 15140-122
Perchloric acid (70%) Merck KGaA, Darmstadt, Germany 1005191001
Phenethyl isothiocyanate (PEITC) Fluka Chemie GmbH, Buchs, Switzerland 77972
Phenol/Chloroform/Isoamyl alcohol Roth Carl GmbH & Co., Karlsruhe, Germany A156
Ponceau S Sigma-Aldrich GmbH, Taufkirchen, Germany P3504
Potassium acetate Merck KGaA, Darmstadt, Germany 1048201000
Potassium dihydrogen phosphate Merck KGaA, Darmstadt, Germany 104873
Propidium iodide (PI) Sigma-Aldrich GmbH, Taufkirchen, Germany P4170
Puromycin dihydrochloride Sigma-Aldrich GmbH, Taufkirchen, Germany P7255
RPMI 1640 medium Invitrogen, Karlsruhe, Germany 31870025
Rubidium chloride Sigma-Aldrich GmbH, Taufkirchen, Germany 215260
Silver nitrate Sigma-Aldrich GmbH, Taufkirchen, Germany S8157
Skim Milk Powder Fluka Chemie GmbH, Buchs, Switzerland 70166
Sodium acetate Sigma-Aldrich GmbH, Taufkirchen, Germany S8750
Sodium chloride MP Biomedicals, Eschwege, Germany 194848
Sodium deoxycholate Sigma-Aldrich GmbH, Taufkirchen, Germany D6750
Sodium dodecyl sulfate (SDS) Fluka Chemie GmbH, Buchs, Switzerland 71729
Sodium hydroxide Roth Carl GmbH & Co., Karlsruhe, Germany 2151855
Sodium phosphate Merck KGaA, Darmstadt, Germany 567550
Sodium pyrophosphate tetrabasic Sigma-Aldrich GmbH, Taufkirchen, Germany S6422
Sodium selenite Sigma-Aldrich GmbH, Taufkirchen, Germany S5261
Tetramethylethylenediamine (TEMED)Fluka Chemie GmbH, Buchs, Switzerland 87689
Trichloroacetic acid Sigma-Aldrich GmbH, Taufkirchen, Germany T8657
Tris(hydroxymethyl)aminomethane Merck KGaA, Darmstadt, Germany 108382 Tris-sodium citrate Merck KGaA, Darmstadt, Germany 1110371000
Triton X-100 GE Healthcare, Freiburg, Germany 17-1315-01
Trypan Blue (0.4%) Sigma-Aldrich GmbH, Taufkirchen, Germany T8154
Trypsin-EDTA Invitrogen, Karlsruhe, Germany 25300
Tryptone Difco Laboratories, Michigan, USA
Tween 20 Sigma-Aldrich GmbH, Taufkirchen, Germany P5927
ß-Mercaptoethanol (2-ME) Invitrogen, Karlsruhe, Germany 31350-010
α-Tocopherol (Toc) Sigma-Aldrich GmbH, Taufkirchen, Germany T3251
24
Materials & Methods
Radioactive Isotopes Company Catalog-No. [gamma-32P]-dCTP GE Healthcare, Freiburg, Germany PT10165
L-[14C (U)] Cystine Perkin Elmer Life Sciences Inc., Boston, USA NEC465050UC
Bacteria Company__ TOP 10 E.coli cells Invitrogen, Karlsruhe, Germany
Enzymes Company Catalog-No. DNA Polymerase I (Klenow) New England Biolabs GmbH, Frankfurt, Germany M0210S
Pfx DNA Polymerase Invitrogen, Karlsruhe, Germany 11708-013
Phosphatase, alkaline Roche Diagnostics, Mannheim, Germany 713 023
Protease Inhibitor Cocktail Tablets Roche Diagnostics, Mannheim, Germany 1 697 498
Proteinase K Roth Carl GmbH & Co., Karlsruhe, Germany 7528.1
Restriction Endonucleases MBI Fermentas GmbH, St. Leon-Rot, Germany
Restriction Endonucleases New England Biolabs GmbH, Frankfurt, Germany
RNAse A QIAGEN GmbH, Hilden, Germany 19101
T4 DNA Ligase Promega GmbH, Mannheim, Germany M180A
Taq DNA Polymerase Invitrogen, Karlsruhe, Germany 18038-026
Antibodies Company Catalog-No. anti-actin Santa Cruz Biotechnology, Heidelberg, Germany sc-58679
anti-FLAG Sigma-Aldrich GmbH, Taufkirchen, Germany F2555
anti-mause-HRP conjugate Santa Cruz Biotechnology, Heidelberg, Germany sc-2354
anti-mouse-Alexa Fluor 488 Invitrogen, Karlsruhe, Germany A-11001
anti-peroxiredoxin-III LabFrontier, Seoul Korea LP-PA0030
anti-peroxiredoxin-SO3 LabFrontier, Seoul Korea LF-PA0004
anti-rabbit-HRP conjugate Santa Cruz Biotechnology, Heidelberg, Germany sc-2768
anti-rat-HRP conjugat Santa Cruz Biotechnology, Heidelberg, Germany sc-2006
anti-Txnrd1 polyclonal antisera Dr. Vladim Gladyshev, University of Nebraska, Lincoln, USA
anti-Txnrd2 monoclonal antisera Dr. Elisabeth Kremmer, Helmholtz Zentrum München, Germany
anti-Txnrd2 polyclonal antisera Dr. Vladim Gladyshev, University of Nebraska, Lincoln, USA
anti-xCT monoclonal antisera Dr. Elisabeth Kremmer, Helmholtz Zentrum München, Germany
anti-α-tubulin Sigma-Aldrich GmbH, Taufkirchen, Germany T6199
Disposables and Kits Company Catalog-No. CEA RP NEW CEA AB, Martinsried, Germany C011824
DC Protein Assay Bio-Rad, Munich, Germany 500-0112
DMEM lacking L-cystine Invitrogen, Karlsruhe, Germany 21013
DMEM Invitrogen, Karlsruhe, Germany 41966
Gel Extraction Kit QIAGEN GmbH, Hilden, Germany 28704
Hybond-C super membrane GE Healthcare, Freiburg, Germany RPN203G
Illustra MicroSpin™ Columnx GE Healthcare, Freiburg, Germany 27-3565-01
Immobilon-Ny+ Millipore, Schwalbach, Germany HAHY13750
JETstar Plasmid purification system Genomed GmbH, Loehne, Germany 220020
LightCycler Capillaries Roche Diagnostics, Mannheim, Germany 11 909339 001
25
Materials & Methods
Disposables and Kits Company Catalog-No. LightCycler FastStart DNA MasterPLUSRoche Diagnostics, Mannheim, Germany 03515869001
LS 5000 TA Scintillation Counter Beckman Coulter GmbH, Krefeld, Germany
Parafilm M® Pechiney Plastic Packaging Company
PCR Cloning Kit QIAGEN GmbH, Hilden, Germany 231122
Plasmid Maxi Kit QIAGEN GmbH, Hilden, Germany 12163
Random Prime DNA Labeling Kit Roche Diagnostics, Manheim, Germany 11 004 760 001
Reverse Transcription System Promega GmbH, Mannheim, Germany A3500
RNase-Free DNase Set QIAGEN GmbH, Hilden, Germany 79254
RNeasy Mini Kit QIAGEN GmbH, Hilden, Germany 74104
Equipment Company Catalog-No. 250/SE 260 Mini-Vertical Gel Unit GE Healthcare Europe GmbH, Freiburg, Germany
Axiovert 200M Carl Zeiss, Jena GmbH, Germany
Bench-top radioisotope counter Bioscan, Washington D.C., USA
Eurostar RW16, IKA-Labortechnik IKA Werke GmbH, Staufen, Germany 2572100
FACS Calibur BD GmbH, Heidelberg, Germany
GenAmp PCR system 2700 Applied Biosystems, Darmstadt, Germany
Gene Pulser II System Bio-Rad, Munich, Germany
GenPulser Cuvettes, 0.4 cm gap Bio-Rad, Munich, Germany
Heraeus Incubator, Modell B 5060 Heraeus Holding GmbH, Hanau, Germany
Leica DM IRBE confocal microscopeLeica Microsystems GmbH, Wetzlar, Germany
Leica TCS SP2 scanner Leica Microsystems GmbH, Wetzlar, Germany
Light-Cycler 1.5 Roche Diagnostics, Mannheim, Germany
Microscope Axiovert 135 Carl Zeiss Jena GmbH, Germany
Mini-PROTEAN 3 Electrophoresis CellBio-Rad, Munich, Germany
Mini-Sub Cell GT Electrophoresis CellBio-Rad, Munich, Germany
OTD Combi Ultracentrifuge Sorvall, Langenselbold, Germany
Overhead stirrer Eurostar RW, IKA-Labortechnik, Staufen, Germany 2572100
Photometer Bio Eppendorf, Hamburg, Germany
PowerPac 200 Power Supply Bio-Rad, Munich, Germany
RF-10A XL Spectrophotometer Shimadzu, Duisburg, Germany
Sephadex G-50 columns GE Healthcare, Freiburg, Germany 27-5330-01
Spectrophotometer DU-64 Beckman Coulter GmbH, Krefeld, Germany
Stereomicroscope Nikon, Tokyo, Japan
Supelclean LC-18 columns Sigma-Aldrich, Stockholm, Sweden 57012
Trans-Blot Semi-Dry Bio-Rad, Munich, Germany
UZ-PA-38,5-1 Ultracentrifuge TubesKisker GbR, Steinfurt, Germany
X-ray film GE Healthcare, Freiburg, Germany RPN16778K
Oligonucleotides Sequence
Genotyping Cre D 5’-CACGACCAAGTGACAGCAATGCTG-3’
Cre E 5’-CAGGTAGTTATTCGGATCATCAGC-3’
TR2_Del_for 5’-TGCTTCCAGGCCCAGTGCTCTGACTGG-3’
26
Materials & Methods
Oligonucleotides Sequence
Genotyping TR2_Del_rev 5’-CAGGCTCCTGTAGGCCCATTAAGGTGC-3'
TR2_flox_for 5’-CAGGTCACTAGGCTGTAGAGTTTGC-3’
TR2_flox_rev 5’-ATGTCCCAGTGTACTTATGATGAATC-3’
TrxR2E15 5’-TTCACGGTGGCGGATAGGGATGC-3’
TrxR2E18 5’-TGCCCAGGCCATCATCATCTGACG-3’
xCT for 5’-CCTGAAACATAGAATGAATGCA-3’
xCT for1 5’-GGCACCGTCATCGGATCAGGCATC-3’
xCT KO for I 5’-TCACGACCGAACAGTGATCAGTC-3’
xCT KO rev I 5’-ATCCGATGACGGTGCCGATGATG-3’
xCT KO rev II 5’-GCTCATATTGCCCTGCAGGTAAC-3’
xCT rev 5’-CCTTTGGAGATGGTGGCCA-3’
xCT rev1 5’-CACGAGCTTGATTGCAAGTTCAGG-3’
Cloning Olig_SECI_BglII_for 5’-TCTCAGAGATCTGAGAAGATGTGGATGGAAC-3’
Oligo TR2 A59T for 5’-AGCGGGAATCGATTATAAAGAT-3’
Oligo TR2 A59T rev 5’-GCCAGAAGCTTTCTTGCCTTGATAGC-3’
Oligo TR2 G375R for 5’-GCTATCAAGGCAAGAAAGCTTCTGGC-3’
Oligo TR2 G375R rev 5’-GCCAGAAGCTTTCTTGCCTTGATAGC-3’
Oligo_ClaI_for 5’-TCGCCGCCACCATCGATTATAAAGATGA-3’
Oligo_ClaI_rev 5’-TCATCTTTATAATCGATGGTGGCGGCGA-3’
Oligo_KpnI_for 5’-CAGCCAGAAGATGTCGTCACTTGTGAT-3’
Oligo_mTxnrd2_Cla I 5’-ATTGAATTCCATGGCGGCGATGGTGGCGGCGA-3’
Oligo_SECIS_rev 5’-GTTTGAACCCCTGGCATTTCTAGAGCACT-3’
Oligo_TR2_NheI_&_SacI_rev 5’-ATGAGCTCGCTAGCAGATCAAAGCTCTGCTGCCC-3’
Oligo_Txnrd2_ATG_MLS_EcoRI 5’-ATTGAATTCCATGGCGGCGATGGTGGCGGCGA-3’
RT-PCR 18s RNA for 5’-GGACAGGATTGACAGATTGATAG-3’
18s RNA rev 5’-CTCGTTCGTTATCGGAATTAAC-3’
Prx I for 5’-GGGAATTGAACCTGGGTCTT-3’
Prx I rev 5’-CGAAAAACAAAAGGCCAACT-3’
Prx II for 5’-TTGACTGTGATCTGGCGAAGG-3’
Prx II rev 5’-CTCTTGCTCACGCAGTCATGG-3’
Prx III fov 5’-GTCTGCCTCTGCCCAAGGAAA-3’
Prx III rev 5’-CTTGGTGTGTTGATCCAGGCA-3’
Prx IV for 5’-CACAAAGGTCAAATCCAGTGGG-3’
Prx IV rev 5’-TTAGCTGGCTGCCTGGCGGAGG-3’
Prx V for 5’-AATCTCATCAAAGTTCCTGCCC-3’
Prx V rev 5’-ACCACAGAACTTGGCAGAGCTGC-3’
Prx VI for 5’-CCGATCAAGGTGGGAGATGCC-3’
Prx VI rev 5’-TCTGGCTCCACGTTCAGTGCC-3’
TrxR2E15 5’-TTCACGGTGGCGGATAGGGATGC3’
27
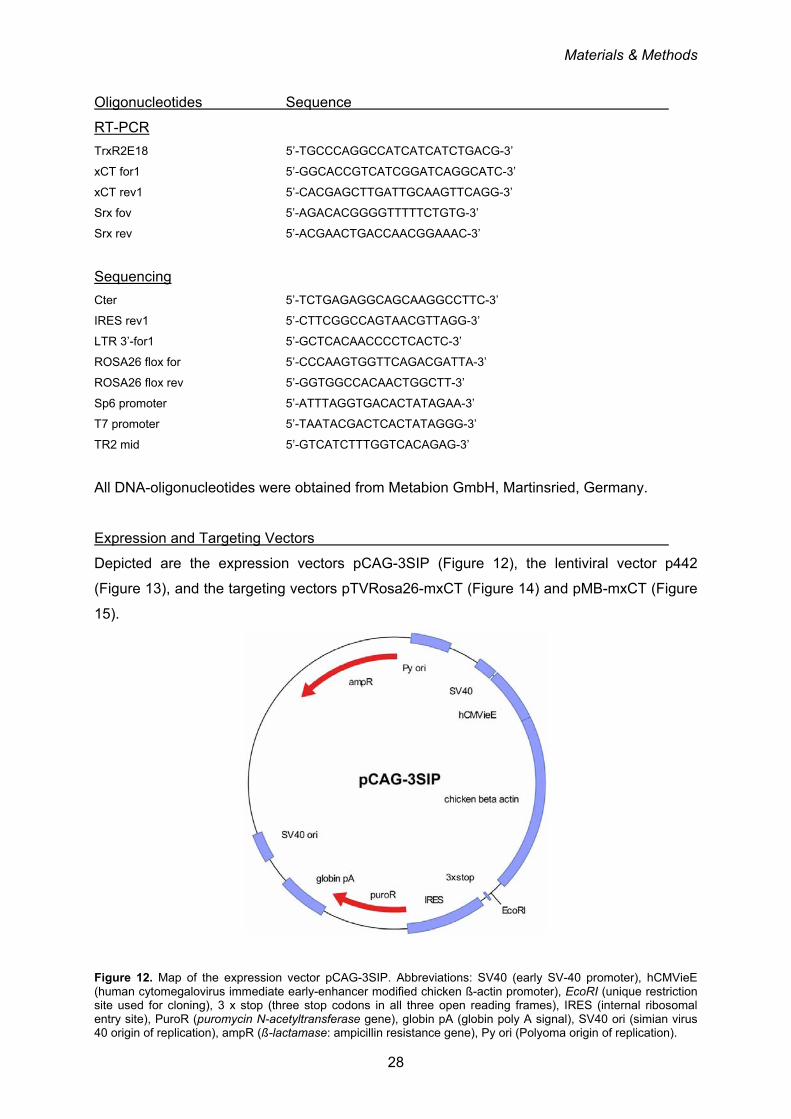
Materials & Methods
Oligonucleotides Sequence
RT-PCR TrxR2E18 5’-TGCCCAGGCCATCATCATCTGACG-3’
xCT for1 5’-GGCACCGTCATCGGATCAGGCATC-3’
xCT rev1 5’-CACGAGCTTGATTGCAAGTTCAGG-3’
Srx fov 5’-AGACACGGGGTTTTTCTGTG-3’
Srx rev 5’-ACGAACTGACCAACGGAAAC-3’
Sequencing Cter 5’-TCTGAGAGGCAGCAAGGCCTTC-3’
IRES rev1 5’-CTTCGGCCAGTAACGTTAGG-3’
LTR 3’-for1 5’-GCTCACAACCCCTCACTC-3’
ROSA26 flox for 5’-CCCAAGTGGTTCAGACGATTA-3’
ROSA26 flox rev 5’-GGTGGCCACAACTGGCTT-3’
Sp6 promoter 5’-ATTTAGGTGACACTATAGAA-3’
T7 promoter 5’-TAATACGACTCACTATAGGG-3’
TR2 mid 5’-GTCATCTTTGGTCACAGAG-3’
All DNA-oligonucleotides were obtained from Metabion GmbH, Martinsried, Germany.
Expression and Targeting Vectors
Depicted are the expression vectors pCAG-3SIP (Figure 12), the lentiviral vector p442
(Figure 13), and the targeting vectors pTVRosa26-mxCT (Figure 14) and pMB-mxCT (Figure
15).
Figure 12. Map of the expression vector pCAG-3SIP. Abbreviations: SV40 (early SV-40 promoter), hCMVieE (human cytomegalovirus immediate early-enhancer modified chicken ß-actin promoter), EcoRI (unique restriction site used for cloning), 3 x stop (three stop codons in all three open reading frames), IRES (internal ribosomal entry site), PuroR (puromycin N-acetyltransferase gene), globin pA (globin poly A signal), SV40 ori (simian virus 40 origin of replication), ampR (ß-lactamase: ampicillin resistance gene), Py ori (Polyoma origin of replication).
28
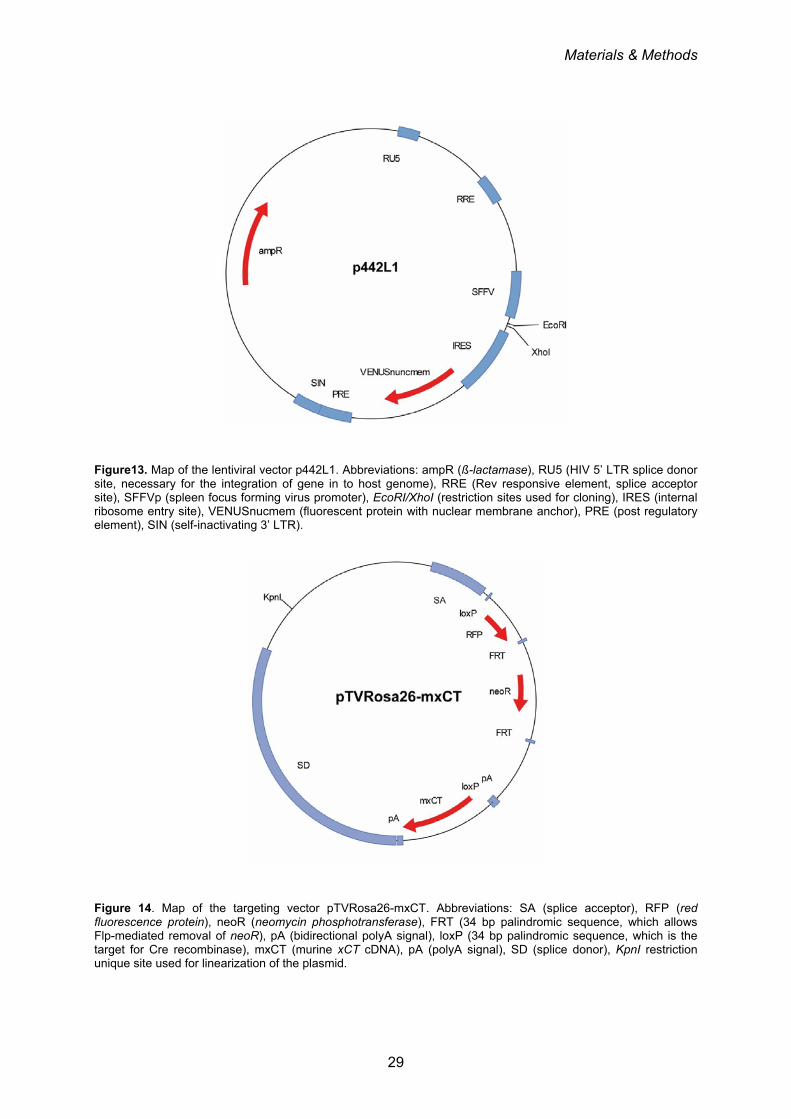
Materials & Methods
Figure13. Map of the lentiviral vector p442L1. Abbreviations: ampR (ß-lactamase), RU5 (HIV 5’ LTR splice donor site, necessary for the integration of gene in to host genome), RRE (Rev responsive element, splice acceptor site), SFFVp (spleen focus forming virus promoter), EcoRI/XhoI (restriction sites used for cloning), IRES (internal ribosome entry site), VENUSnucmem (fluorescent protein with nuclear membrane anchor), PRE (post regulatory element), SIN (self-inactivating 3’ LTR).
Figure 14. Map of the targeting vector pTVRosa26-mxCT. Abbreviations: SA (splice acceptor), RFP (red fluorescence protein), neoR (neomycin phosphotransferase), FRT (34 bp palindromic sequence, which allows Flp-mediated removal of neoR), pA (bidirectional polyA signal), loxP (34 bp palindromic sequence, which is the target for Cre recombinase), mxCT (murine xCT cDNA), pA (polyA signal), SD (splice donor), KpnI restriction unique site used for linearization of the plasmid.
29
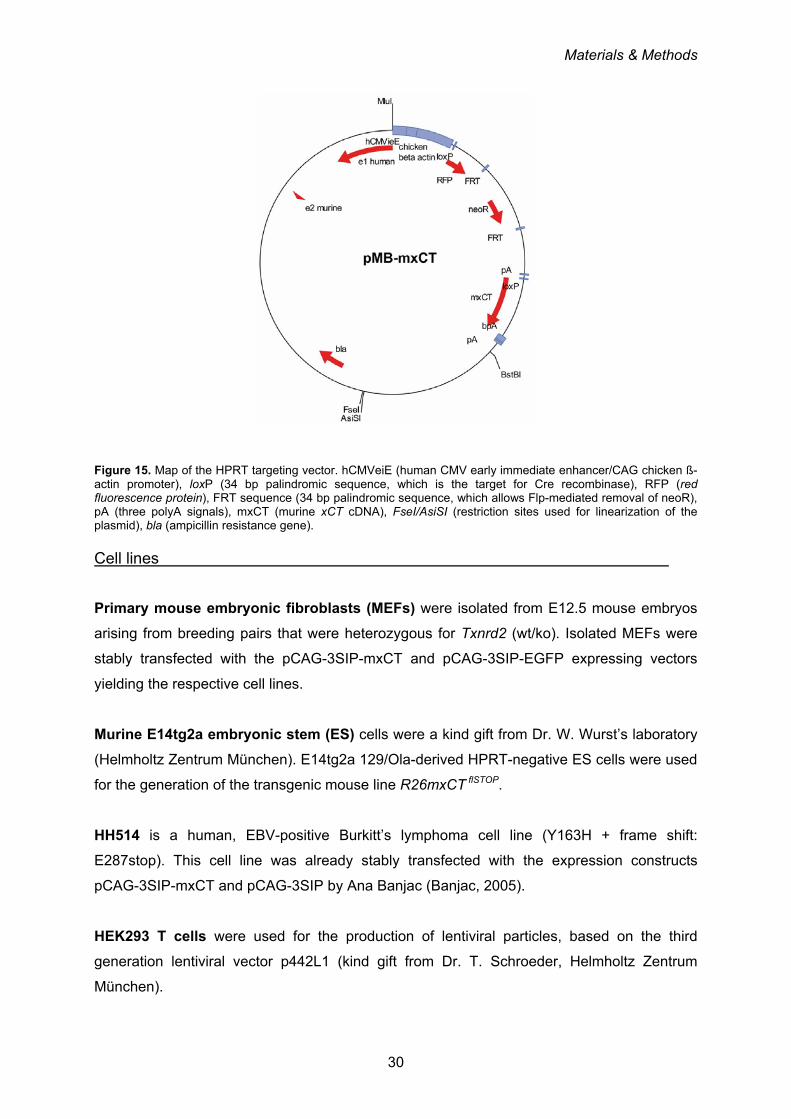
Materials & Methods
Figure 15. Map of the HPRT targeting vector. hCMVeiE (human CMV early immediate enhancer/CAG chicken ß-actin promoter), loxP (34 bp palindromic sequence, which is the target for Cre recombinase), RFP (red fluorescence protein), FRT sequence (34 bp palindromic sequence, which allows Flp-mediated removal of neoR), pA (three polyA signals), mxCT (murine xCT cDNA), FseI/AsiSI (restriction sites used for linearization of the plasmid), bla (ampicillin resistance gene). Cell lines
Primary mouse embryonic fibroblasts (MEFs) were isolated from E12.5 mouse embryos
arising from breeding pairs that were heterozygous for Txnrd2 (wt/ko). Isolated MEFs were
stably transfected with the pCAG-3SIP-mxCT and pCAG-3SIP-EGFP expressing vectors
yielding the respective cell lines.
Murine E14tg2a embryonic stem (ES) cells were a kind gift from Dr. W. Wurst’s laboratory
(Helmholtz Zentrum München). E14tg2a 129/Ola-derived HPRT-negative ES cells were used
for the generation of the transgenic mouse line R26mxCT flSTOP.
HH514 is a human, EBV-positive Burkitt’s lymphoma cell line (Y163H + frame shift:
E287stop). This cell line was already stably transfected with the expression constructs
pCAG-3SIP-mxCT and pCAG-3SIP by Ana Banjac (Banjac, 2005).
HEK293 T cells were used for the production of lentiviral particles, based on the third
generation lentiviral vector p442L1 (kind gift from Dr. T. Schroeder, Helmholtz Zentrum
München).
30
Materials & Methods
Probes for Southern Blot analysis
The Rosa26-Probe was a kind gift from Dr. Cornelia Hoemig (Hömig, 2005). A 550 bp long
fragment encompassing the first intron of the Rosa26 locus was cloned via EcoR und PacI
sites into the plasmid pBSIIKS.
The Neo-Probe was a kind gift from Dr. Cornelia Hoemig (Hömig, 2005).The probe (466 bp)
was isolated with RsrII and PstI from the pBSIIKS-Neo plasmid.
Probes for Northern Blot analysis
The mxCT-Probe was amplified by PCR using the pCAG-mxCT plasmid as template and
xCT for1/xCT rev1 as primer pair.
2.2. Methods
2.2.1. Cell culture
Bacterial cells
The bacterial strain TOP10 was cultured either on LB agar plates or in LB liquid medium, in
an incubator at 37°C over night. Selection of transformed bacteria on agar plates or in liquid
medium was achieved by use of the corresponding antibiotics.
LB medium: 20 mM MgSO4, 10 mM KCl, 1% (w/v) Tryptone, 0.5% (w/v) Bacto yeast extracts, 0.5%
(w/v) NaCl
LB agar: 20 mM MgSO4, 10 mM KCl, 1% (w/v) Tryptone, 0.5% (w/v) Bacto yeast extracts, 0.5% (w/v)
NaCl, 1.2% (w/v) Bacto-agar
Murine embryonic fibroblasts (MEFs)
Hemizygous Txnrd2 knock-out mice were mated and females were checked daily for vaginal
mucous plugs. A vaginal mucous plug was considered as embryonic day 0.5 (E0.5).
Pregnant mice were sacrificed at E12.5 by cervical dislocation. Uterine horns were dissected
under sterile conditions and placed into a Petri dish containing PBS. Each embryo was
separated from its placenta and surrounding membranes. The body trunk was dissected from
the organs and washed with fresh PBS to remove blood and other tissue debris. Embryo tails
were used for determination of the genotype by using TR2_Del_for/TR2_Del_rev and
31
Materials & Methods
TR2_flox_for/TR2_flox_rev primer pairs. Only when the floxed allele is deleted by Cre
recombinase, the distance between TR2_Del_for/TR2_Del_rev primer binding sites is small
enough to be amplified by standard PCR. The second primer pair,
TR2_flox_for/TR2_flox_rev, was used to detect the wt allele, and thus to determine genotype
(either Txnrd2−/− or Txnrd2+/−) of the cells. By using two forceps embryo trunks were minced,
suspended in trypsin-EDTA and incubated at 37°C for 15 min. The suspension was
homogenized by vigorous pipetting, the cells were collected by centrifugation (1,200 rpm/5
min) and washed in Standard DMEM to remove trypsin. After washing, the cells were plated
in 6 cm diameter cell culture dishes (referred to as passage No. 0). Cells were cultured at
37°C in a 5% O2, 5% CO2 water-saturated atmosphere. After the cell lines reached
confluency, they were split at a ratio of 1:3 on to a larger cell culture dishes. Cells from early
passage numbers were harvested by trypsinization and aliquots were stored by
cryo-conservation in liquid nitrogen. Primary cells cultured in Standard DMEM were routinely
split by trypsinization at a ratio of 1:3 every 4th to 5th day.
PBS: 80.0 g NaCl, 2.0 g KCL, 14.4 g Na2HPO4, 2.4 g KH2PO4 in 1 l H2O, pH 7.4
Standard DMEM: DMEM, 10% FCS, 1% glutamine, 50 U/ml penicillin G, 50 µg/ml streptomycin
HH514 Burkitt’s lymphoma cell line
The Burkitt’s lymphoma cell line HH514 was cultured at 37°C and 6% CO2 under water-
saturated atmosphere. Cells were grown in Standard RPMI medium and routinely split at a
ratio of 1:3 every 3rd day.
Standard RPMI: RPMI 1640-medium, 10% FCS, 1% glutamine, 50 U/ml penicillin G,
50 µg/ml streptomycin
HEK293 T cells
Cells were cultured at 37°C in a 5% O2, 5% CO2 water-saturated atmosphere in Standard
DMEM. HEK293 T cells were routinely split by trypsinization at a ratio of 1:5 every 2nd or 3rd
day.
Determination of cell number
Cells were detached from cell culture dishes by trypsinization and suspended by adding
2.5 volumes of Standard DMEM. Thereafter, 30 µl of the cell suspension was mixed with an
equal volume of 0.4% trypan blue solution, and cells were counted using the
32
Materials & Methods
Fuchs-Rosenthal haemocytometer. Trypan blue is excluded from viable cells, whereas dead
cells stain blue due to plasma membrane disruption.
Cryo-conservation and thawing of cells
Cells were grown in 10 cm diameter culture dishes until they reached approximately 80%
confluency, trypsinized, and collected by centrifugation. The cell pellets were resuspended in
FCS containing 10% DMSO, transferred to cryo-vials in 1 ml aliquots and frozen in propanol
containers at −80°C over night. On the following day, vials were transferred to a liquid
nitrogen tank. Stocks of all cell lines were stored in liquid nitrogen.
When needed, frozen cells were defrosted in a water bath at 37°C, immediately transferred
to 5 ml Standard DMEM and collected by centrifugation. Cell pellets were resuspended in
10 ml Standard DMEM and plated in 10 cm diameter cell culture dish.
Cell fractionation by digitonin method
For the purpose of cell fractioning, cells were collected from 15 cm cell culture dishes. The
medium was aspirated and cells were washed two times with ice cold PBS. Cells were
scraped off with a cell scraper and were resuspended in Digi-buffer. For plasma membrane
rupture digitonin was added in Digi-buffer in the final concentration of 0,007%. Cells were
incubated on ice for 15-30 min. Plasma membrane rupture was followed by staining cells
with Trypan Blue. When the majority of cells (> 95%) were Trypan Blue-positive, they were
centrifuged for 15 min/4°C/15,000 rpm. The supernatant (cytoplasmic fraction) was stored at
−20°C until needed. The cell pellet containing plasma membranes and organelles was
washed in ~200 µl of Digi-buffer and centrifuged once more at 4°C/15,000 rpm. The resulting
supernatant was discarded, and the cell pellet was lysed in 50-100 µl of LCW and stored at
−20°C until further needed.
Digi-buffer: 100 mM HEPES (pH 7.4), 250 mM Saccarose, protease inhibitor
100X digitonin: 0.7% in DMSO (freshly prepared)
LCW: 0.5% TritonX-100, 0.5% Sodium Deoxocholate Salt, 150 mM NaCl, 20 mM Tris, 10 mM EDTA,
30 mM Na-Pyrophosphate, pH 7.5
33
Materials & Methods
2.2.2.Gene-transfer methods
Electroporation of MEFs
Cells were grown on 15 cm cell culture dishes to ~80% confluency, harvested by
trypsinization, washed in PBS and resuspended in 800 µl DMEM. Primary MEFs were
electroporated with a Gene Pulser II (Bio Rad, Munich, Germany) at 240 V, 1,000 μF in
cuvettes with 0.4 cm gap width. For each transfection, ~20 µg plasmid DNA was used.
Immediately after the pulse, FCS (500 µl) was applied to the cells. The cell suspension was
plated in a 10 cm diameter cell culture dish in Standard DMEM. Selection for antibiotic
resistance was initiated 24 h after electroporation with 0.5 µg/ml puromycin, gradually
increasing to 2 µg/ml over a period of one to three weeks.
Lentiviral infection
Lentiviruses are retroviruses capable of integrating DNA into the target cells. Lentiviruses
enter the nucleus of dividing and resting cells and are therefore one of the most efficient
methods for gene delivery into cells. Lentiviral particles were produced in HEK293 T cells
using a third generation lentiviral packaging system, which provides maximal biosafety. For
lentivirus production, four different plasmids were co-transfected into the producer cell line
(HEK293 T). Three plasmids encode all necessary and structural proteins for lentivirus
production: (i) pEcoEnv-IRES-puro expresses the structural gen env, which encodes the
surface and transmembrane glycoprotein; (ii) plasmid pMDLg_pRRE expresses the structural
gene gag that encodes for capsid and matrix proteins and also the enzyme cluster Pol which
encodes for provirus-integrase, reverse transcriptase, as well as the protease indispensable
for post-translational modification of the fusion proteins; and (iii) pRSV_Rev plasmid which
expresses rev (regulator of virion), which promotes the cytoplasmic accumulation of
unspliced and single spliced viral transcripts. Third generation packaging systems are
Tat-independent, as the transfer vector pRRL.PPT.SF.IRES-VENUSnucmem (p442L1)
contains an additional SFFV promoter.
For the generation of lentiviruses, 5 x 10⁶ human embryonic kidney cells (HEK293 T) were
plated in Standard DMEM in 10 cm diameter cell culture dishes and incubated for 24 h.
Plasmids (2 µg pEcoEnv-IRES-puro, 5 µg pMDLg_pRRE, 10 µg pRSV_Rev, 5 µg
p442-based vector) were diluted in 450 µl 12.5 mM CaCl2 and mixed with 500 µl HBS by
air-bubbling. Cell culture medium was replaced with TF medium, in which chloroquine was
added to a final concentration of 25 µM. For calcium phosphate transfection, the plasmid mix
34
Materials & Methods
was vortexed, incubated for 20 min at room temperature and applied drop wise onto the
HEK293 T cells. Cells were incubated for another 8-12 h. The transfection medium was
replaced with fresh TF medium, and the transfected packaging cells were incubated for
further 36 h. Virus-enriched TF medium was recovered from the cell culture dish, filtrated
through a 0.22 µm sterile filter and ultracentrifuged in a swing rotor for at least 16 h at
10,000 x g. The virus-containing pellet was resuspended in 200 µl Standard DMEM and
stored at −80°C until used.
1 x 10⁵ MEFs were transduced in a 3.5 cm diameter cell culture dish by adding 30 µl of the
virus concentrate, followed by another incubation period for 48 h. Infection efficiency was
monitored by flow cytometry (BD FACSCalibur), with excitation wavelength at 488 nm and
analysed using CellQuestTM software (Becton Dickinson). In experiments where the
p442L1-based vectors, which contain an IRES-puromycin N-acetyl-transferase cassette,
were used, infected cells were selected with 0.5 µg/ml puromycin 24 h after infection,
gradually increasing from 0.5 µg/ml puromycin to 1 µg/ml over a period of one to two weeks.
1000X chloroquine : 25 mM chloroquine in PBS
2X HBS: 50 mM HEPES, 280 mM NaCl, 1.5 mM Na2HPO4, pH 7.05 adjusted with NaOH
TF medium: Standard DMEM, 20 mM HEPES
2.2.3. Molecular biology techniques
Cloning
Preparation of competent bacterial cells
The E.coli TOP10 bacterial strain (Invitrogen) was grown on LB plates at 37°C overnight. A
single colony from the plate was used to inoculate 2.5 ml medium in a loose-capped vessel
with constant shaking. An overnight culture was diluted 1:100 (250 ml) in LB medium
containing 100 mM KCl and 200 mM MgCl2. Bacterial cells were grown in 1 l flasks until A600
reached 0.4-0.6. Bacteria were harvested by centrifugation (4,000 rpm/10 min/4°C). The
pellet was resuspended in ~40% of the original volume of ice cold TFB1. For the remaining
steps the cells were kept on ice. Finally, bacterial cells were concentrated in 0.04 original
volume of ice-cold TFB2. Aliquots of 100 µl of the bacterial suspension were snap-frozen in
liquid nitrogen and stored at −80°C until further use.
TFB1: 15% (w/v) glycerol, 100 mM RbCl, 10 mM CaCl2, 50 mM MgCl2, 30 mM KAc. Adjust pH to 5.8
with acetic acid. Filter-sterilize (0.45 µm) and store at room temperature.
35
Materials & Methods
TFB2: 10 mM MOPS or PIPES (pH 6.5), 75 mM CaCl2, 10 mM RbCl, 15% glycerol. Adjust pH to 6.5
with 1 M KOH. Filter-sterilize (0.45 μm) and store at room temperature.
Transformation of bacteria by heat shock
Aliquots of frozen competent cells were removed from –80°C and thawed on ice. The cells
were gently mixed by flicking the tube. For transformation, 100 μl of competent cells were
transferred to pre-chilled sterile polypropylene tubes and either 10 µl of the ligation mixture
(see below) or 1-10 pg purified plasmid DNA was added to the cell suspension. After
incubation on ice for 15-20 min, cells were heated to 42°C for 1-2 min and placed on ice for
10 min. 1 ml of LB medium was added to the cell suspension and incubated with shaking
(~750 rpm) for 45 min at 37°C. Cells were harvested by centrifugation (4,500 rpm for 5 min),
and LB excess was discarded. The transformation mixture was resuspended in 200 µl of LB
and plated on an LB plate containing 50 µg/ml ampicillin (all plasmids used in this study
expressed ß-lactamase for selection). Plates were incubated for 12-16 h at 37°C until single
cell colonies became visible.
Preparation of plasmids by the alkaline lysis method
After transformation, single colonies were inoculated in 2.5 ml LB medium, containing
100 µg/ml ampicillin. The inoculum was incubated with vigorous shaking (~200 rpm) at 37°C
for 5-7 h or overnight. The volume of 2 ml of the bacterial suspension was centrifuged at
4,500 rpm for 5 min. The remaining cell suspension (~500 µl) was stored at 4°C until needed.
The cell pellet was resuspended in 200 µl E1 resuspension buffer by vortexing. E2 lysis
buffer (200 µl) was added to the cell suspension, mixed by inverting the tubes and incubated
no longer than 5 min at room temperature. 200 µl of neutralisation buffer E3 was added,
mixed by inverting the tubes and centrifuged for 8 min at 15,000 rpm. For DNA precipitation
0.7 volumes of isopropanol was added to the supernatant, and the plasmid DNA was
recovered by centrifugation (15,000 rpm) for 15 min at 4°C. The DNA pellet was washed with
70% ethanol, air-dried at room temperature and resuspended in 30 µl TE.
The isolated plasmids were subjected to analytic restriction digestions to identify the correct
construct and orientation of the insert. After identification of positive clones, the amount of
plasmid DNA was augmented using the Qiagen Plasmid Maxi Kit. Plasmid concentrations
were quantified by measuring the absorbance at 260 nm in a spectrophotometer
(Spectrophotometer DU-64, Beckman Coulter GmbH, Krefeld, Germany).
36
Materials & Methods
E1 (resuspension buffer): 50 mM Tris, 10 mM EDTA, pH 8.0
E2 (lysis buffer): 200 mM NaOH, 10% w/v SDS, RNAseA 7,000 U/ml E3 (neutralisation buffer): 3.1 M potassium acetate, adjust to pH 5.5 with acetic acid
TE: 10 mM Tris pH 7.5; 1 mM EDTA
Restriction digestion
DNA restriction digestion was performed with respective endonucleases according to
manufacturer’s instructions (New England Biolabs GmbH or MBI Fermentas GmbH).
For cloning, DNA fragments were separated and visualised by electrophoresis in a 0.8% low
melting point (LMP) agarose gel, stained with ethidium bromide, at 50 V in 1X TAE buffer.
The desired fragment was isolated from the gel with a scalpel and processed with a Qiagen
Gel Extraction Kit, according to the manufacturers’ instructions. For analytical purposes,
digested DNA was separated and visualised by electrophoresis in a 1-2% agarose gel at
80 V in 1X TAE buffer.
50X TAE: 2 M Tris-acetate (2 M Tris and 5.71% v/v acetic acid); 50 mM EDTA/NaOH pH 8.0
Phenol/chloroform extraction and precipitation of DNA
DNA fragments, obtained from enzyme digestions or other modifications, such as
dephosporylation reactions or fill-in reactions by Klenow DNA polymerase, were purified by
phenol/chloroform/isoamylalcohol treatment and ethanol precipitation. An equal volume of
phenol/chloroform/isoamyl alcohol (ratio of 25:24:1) was added to the digestion reaction,
briefly vortexed and centrifuged for 8 min at 15,000 rpm. The upper aqueous phase was
recovered and the DNA was precipitated by adding 2 volumes of absolute ethanol and 0.1
volume of 3 M sodium acetate (pH 5.5; adjusted with potassium acetate), followed by
centrifugation at 4°C, 15,000 rpm for 15 min. The DNA precipitate was washed with 70%
ethanol, centrifuged as above for 10 min and air-dried at room temperature. The DNA was
dissolved in 30 µl TE, incubated at 65°C for 10 min in order to fully dissolve the DNA and
stored at −20°C.
DNA ligation
Ligation reactions were prepared with T4 DNA ligase (New England Biolabs GmbH)
according to standard procedures as described in the manufacturers’ instructions. Depending
on the size of the fragments to be ligated, the protocol was adjusted to optimize the
insert:vector ratio for ligation. The ligation mix was incubated at 16°C for 12-24 h. To quantify
37
Materials & Methods
the specificity of the ligation reaction, respective backbone and insert DNA were subjected to
separate control ligations. The ligation reactions were used in subsequent heat shock
transformation of competent bacteria and further analysed.
Klenow fragment fill-in reaction
For blunt-end cloning DNA fragments were treated with DNA Polymerase I (Klenow
fragment) according to the manufacturers’ instructions (New England Biolabs GmbH). The
Klenow fragment retains polymerization fidelity and 3’-5’ exonuclease activity, but is devoid
of 5’-3’ exonuclease activity. Hence, the Klenow fragment forms blunt ends by either filling-in
5’-overhangs or by removing 3’-overhangs. Linearised DNA was subjected to fill-in reaction
by Klenow DNA polymerase for 30 min at room temperature.
Dephosphorylation of linearized plasmid DNA
Dephosphorylation of backbone DNA favours the integration of DNA inserts with
phosphorylated 5’ ends, since re-ligation of the backbone is prevented. Vector DNA was
dephosphorylated with CIP (calf alkaline phosphatase) (Roche Diagnostics). Pico-mol of 3´or
5´ ends were calculated according to the average molecular weight of a nucleotide pair (660
Da), concentration (µg/µl) of DNA to be used and the size of the fragment (bp) to be used.
One unit of CIP per 1 pmol 3´or 5´terminal phosphorylated DNA fragments was used, and
the reaction was incubated for 1 h at 37°C. After dephosphorylation of DNA fragments,
phenol/chloroform/isoamyl alcohol extraction was performed to remove CIP.
Polymerase chain reaction (PCR)
The standard polymerase reaction (PCR) was performed according to manufacturer’s
instructions (Invitrogen). The individual PCR steps were optimized for each template and
primer pair combination. For standard (analytical) amplifications, Taq polymerase (Invitrogen)
was used, whereas the high fidelity polymerase, Platinum Taq DNA Polymerase (Invitrogen)
was used for cloning purposes according to the manufacturers’ instructions. The DNA to be
amplified (1-20 ng) was mixed with 1-2.5 units DNA polymerase, 0.5 µM oligonucleotide
primers (Metabion International AG), 0.2 mM each dNTP (Fermentas GmbH), 1X PCR buffer
(Invitrogen) and 1.5 mM MgCl2 (Invitrogen). After PCR amplification, the product was
analyzed for size, quantity, and/or sequence and used in further experimental procedures.
38
Materials & Methods
Site-directed Txnrd2 mutagenesis Exchange of single amino acids within Txnrd2 was performed by site-directed PCR
mutagenesis in a final volume of 50 µl. Primers of 21 nucleotides were designed such that
the primer sequence contains a mutated codon approximately in the centre of the primer.
Codons were chosen according to the highest murine codon usage of the respective amino
acid. Prior to transformation of competent bacteria, PCR products were digested with DpnI.
DpnI cleaves only methylated DNA, and is thus suitable to remove template DNA prior to
transformation of the PCR products in bacteria. Mutations were verified by sequencing.
cDNA preparation
Isolated RNA was first reverse-transcribed to cDNA to provide the necessary DNA template
for Taq polymerase. Single-stranded cDNA was synthesized from 1 µg of isolated mRNA by
Reverse Transcription System (Promega) according to manufacturers’ instructions (0.5 U/µl
Avian myeloblastosis virus (AMV) reverse transcriptases, 1 U/µl RNAsin® broad-spectrum
RNase inhibitor, 50 ng random primer, 0.25 mM each dNTP, 1X reaction buffer and 5 mM
MgCl2). The incubation time was extended to 60 min to obtain more abundant transcripts.
The cDNA amplification was performed with random primers at 42°C. After elongation the
samples were denatured at 95°C for 5 min and than placed on ice for 5 min. The 20 µl
first-strand cDNA synthesis reaction mix was finally diluted to 100 µl with nuclease-free water
and subjected to semi-quantitative and quantitative PCR.
Real-time PCR
For expression analysis the LightCycler FastStart DNA MasterPLUS SYBR Green I Kit in
combination with LightCycler 1.5 System (Roche) was used. Each RT-PCR reaction mix
contained the respective primer pair, cDNA and the LightCycler Master Mixes (Taq DNA
polymerase and SYBR Green I dye for detection) according to manufacturers’ instructions
(Roche). During each PCR cycle, SYBR Green I intercalates specifically into the double
strand of the amplified PCR products; ongoing amplification is monitored by measuring the
increase in fluorescence after each cycle. RT-PCR primers were designed with software
Primer3 (Rozen and Skaletsky, 2000), standardizing optimal TM of approximately 58°C and a
product size of 200-300 bp. If possible, primer pairs hybridizing on different exons were used
to minimize unspecific amplification of possible genomic DNA contaminations. Expression
levels of the target gene were normalized on 18s or aldolase expression levels. To control
the specificity of the RT-PCR reaction, the synthesized PCR product was correlated to a
39
Materials & Methods
specific melting point, which was assessed by running a melting curve program after the final
cycle.
primer mix: oligonucleotide primer stock solution 5 µM for each primer
Cloning of expression and targeting vectors
pCAG-3SIP-based vectors (xCT, EGFP,MCM)
pCAG-3SIP-based vectors contain a strong hybrid promoter, consisting of the chicken β-actin
promoter and the CMV enhancer, which is highly active in many cell types and organisms
(Sawicki et al., 1998).
The pCAG-3SIP-based vectors, expressing EGFP or xCT, were a kind gift from Dr. Ana
Banjac (pCAG-3SIP-EGFP and pCAG-3SIP-mxCT (Banjac, 2005) and Dr. Alexander Seiler
(pCAG-3SIP-MCM) (Seiler, 2008) (Figure 12). The vector pCAG-3SIP-mxCT contained the
coding region of murine xCT-light chain, pCAG-3SIP-EGFP contained the red-shifted variant
of wild-type GFP and pCAG-3SIP-MCM is a vector expressing the Cre recombinase with
murine estrogen receptor binding domains (Mer) fused at both the N- and C-terminus of Cre.
This MerCreMer recombinase does not bind to estrogen but retains binding activity to
tamoxifen (Tam, selective estrogen receptor modulator). In the absence of Tam the
MerCreMer fusion protein is bound to the hsp90 complex, and thus retained in the
cytoplasm. Upon Tam administration the hsp90-MerCreMer complex dissociates and the Cre
translocates from the cytoplasm to the nucleus, where Cre-mediated removal of the loxP-
flanked cassette occurs.
p442L1-based Txnrd2 expression vectors
The vector pGEM-Teasy-mTxnrd2 was a kind gift from Dr. Antonio Miranda-Vizuete (Centro
Andaluz de Biología del Desarrollo, Espania). The vector contained the partial 5´ sequence
of murine Txnrd2. 3’-UTR region containing the SECIS element was missing. The remaining
part was amplified from murine liver cDNA with the primes “Olig_SECI_BglII_for” and
“Oligo_SECIS_rev”. The resulting 160 bp PCR product including the entire SECIS element
was purified, cloned into pDrive (Qiagen, Hilden, Germany) to give SECIS-pDrive and
sequenced. The SECIS element coding sequence was isolated from the SECIS-pDrive with
PaeI and BglII and inserted into the same restriction enzyme sites of pGEM-T-Easy-Txnrd2
(4702 bp), yielding pGEM-T-Easy-Txnrd2-SECIS.
40
Materials & Methods
To generate a cytoplasmic version of Txnrd2 (cyto-Txnrd2) (see also Turanov et al 2005), a
second PCR was performed with primers “Oligo_TR2_NheI_&_SacI_rev” and
“Oligo_KpnI_for”. This amplified the 5´ region of Txnrd2 (551 bp), which, however, lacks the
coding sequence for the MLS. The PCR was designed as such that a SacI site and NheI site
were generated (NheI was needed for cloning into the NTAPe vector). The purified PCR
product was digested with SacI and KpnI and ligated into the same sites of
pGEM-T-Easy-Txnrd2-SECIS, yielding pGEM-T-Easy-cyto-Txnrd2.
For purification of protein complexes, Txnrd2 was additionally tagged with a Tandem Affinity
Purification enhanced (TAPe) tag, which was a kind gift from Dr. Marius Ueffing and Dr.
Johannes Gloeckner (Helmholtz Zentrum München). pcDNA3-NTAPe and
pGEM-T-Easy-cyto-Txnrd2 were digested with NheI and XhoI. The resulting backbone of
pcDNA3-NTAPe and the corresponding fragment of pGEM-T-Easy-cyto-Txnrd2
(cyto-Txnrd2) were ligated to obtain pcDNA-NTAPe-cyto-Txnrd2.
To create the TAPe-tagged mitochondrial version of Txnrd2, the start codon of the NTAP had
to be removed prior to fusing the MLS of Txnrd2 to the 5´end of the TAPe. At first, the MLS
was amplified by PCR with pGEM-TEasy-mTxnrd2 as template and the primer pair:
“Oligo_Txnrd2_ATG_MLS_EcoRI” / “Oligo_mTxnrd2_ClaI”. Since a ClaI site was included in
the resulting 136 bp fragment, encoding the MLS, the product was cut with EcoRI and ClaI.
In parallel, the start codon of the NTAPe in pcDNA-NTAPe was removed by means of
site-directed mutagenesis (primer par “Oligo_ClaI_for” / “Oligo_ClaI_rev”), yielding the vector
pcDNA3-NoMetNTAPe. Subsequently, pcDNA3-NoMetNTAPe was digested with EcoRI and
ClaI and ligated with MLS to generate pcDNA3-MLS-NoMetNTAPe. pcDNA3-MLS-
NoMetNTAPe and pcDNA-NTAPe-cyto-Txnrd2 were then digested with EcoRI and NheI, and
the 7156 bp backbone of the pcDNA-NTAPe-cyto-Txnrd2 vector and the 249 bp fragment of
pcDNA3-MLS-NoMetNTAPe were ligated to obtain pcDNA3-NTAPe-mito-Txnrd2.
The expression vector p442L1 (kind gift from Dr. Tim Schroeder, Helmholtz Zentrum
München) was used for efficient gene transfer and protein expression in MEFs by viral
transduction.
Two fragments carrying mitochondrial (1992 bp) or cytosolic (1887 bp) NTAP-tagged
versions of Txnrd2 were cloned via EcoRI and XhoI into the backbone of p442L1 (7870 bp)
to generate p442L1-NTAPe-cyto-Txnrd2 and p442L1-NTAPe-mito-Txnrd2. In any of these
vectors the VENUS nuclear membrane anchor protein (VENUSnucmem) was replaced by
the puromycin resistance cassette. This cassette was isolated from the plasmid
41
Materials & Methods
p442L1-NTAPe-Txnrd1 (kind gift from Pankaj Kumar Mandal, PhD thesis, 2009) using the
restriction enzymes BsrGI and SnaBI. This fragment replaced VENUSnucmem in the
p442L1-NTAPe-cyto-Txnrd2 and p442L1-NTAPe-mito-Txnrd2 plasmids to gain the
p442L1-NTAPe-cyto-Txnrd2-puro and p442L1-NTAPe-mito-Txnrd2-puro vectors.
Generation of the xCT knock-in targeting vector (Rosa26 locus)
Murine xCT cDNA was isolated from the pCAG-3SIP-xCT. To this end, the vector was first
linearised with EcoRI, blunt-ended by Klenow fill-in reaction, and the resulting vector was
digested with NheI to obtain a 1653 bp long xCT-containing fragment. This fragment was
ligated into the dephosphorylated backbone of the pBSIIKS-LMP1 (3133 bp) generated with
PmeI and XbaI. pBSIIKS-mxCT was digested with AscI and the resulting 1913 bp fragment
was then ligated into the AscI-digested and dephosphorylated pTVRosa26-EBNA1 (Hömig,
2005). The pTVRosa26-mxCT vector was then used for gene targeting in ES cells.
Generation of the xCT knock-in targeting vector (HPRT locus)
A 1913 bp long fragment containing the murine xCT cDNA was isolated from pBSIIKS-mxCT
using AscI. The fragment was then ligated into the AscI-digested and dephosphorylated
backbone pCAG-3SIP-STOP-EBNA1. The resulting vector pCAG-3SIP-STOP-mxCT was
finally digested with MluI and BstBI to obtain the hCMVieE/chicken β-actin promoter, mxCT
cDNA, neoR cassette that was then cloned into the backbone of pMB digested with MluI and
BstBI. The vector pMB-mxCT was used for gene targeting.
Analysis of genomic DNA, RNA and proteins
Isolation of genomic DNA Tissues and cultured cells were lysed in buffer containing 50 µg/ml proteinase K. After lysis
at 55°C overnight, DNA was subjected to phenol/chloroform/isoamyl alcohol extraction.
Lysis buffer: 10 mM Tris pH 7.6; 10 mM EDTA; 0.5% SDS; 10 mM NaCl
Proteinase K buffer: 50 mM Tris-HCl, pH 7.6, 5 mM EDTA pH 8
RNA isolation
For Northern blot analysis and RT-PCR total RNA from cultured cells (up to 1 x 10⁶) or
tissues (approx. 30 mg) was isolated with RNeasy Mini Kit (Qiagen) according to
42
Materials & Methods
manufacturers’ instructions. In brief, the samples were lysed and homogenized in the
appropriate amount of the denaturing guanidine-thiocyanate containing buffer, which
immediately inactivates RNAses to ensure purification of intact RNA. Ethanol was added to
provide the proper binding conditions. The sample was then applied onto RNeasy Mini spin
column, where the total RNA binds to the column and contaminants can be efficiently
removed. To avoid DNA contaminations, on-column DNase digestion with the RNase-Free
DNase Set (Qiagen) was performed. Total RNA was then eluted in 30–100 µl RNAse-free
water. RNA is generally stable at −80°C for up to one year without degradation.
Final RNA concentrations were determined by measuring the absorbance at 260 nm in a
spectrophotometer in triplicate (Spectrophotometer DU-64, Beckman Coulter GmbH, Krefeld,
Germany).
Radioactive labelling of DNA fragment
Radioactively labelled DNA probes were used for Southern and Northern blots. The DNA
fragments were labelled using Random Primed DNA Labeling Kit (Roche Diagnostics) and
50 µCi [gamma-32P]-dCTP (3,000 Ci/mmol, 10 mCi/ml, GE Healthcare) according to
manufacturers’ instructions. The method of “random primed” DNA labelling (Feinberg et al
1983) is based on the hybridization of a mixture of all possible hexanucleotides to the DNA to
be labelled. In brief, ~25 ng of linearised DNA template, dATP, dGTP, dTTP (25 µM each),
hexanucleotide primer mixture, 1X reaction buffer, 50 µCi [gamma-32P]-dCTP and
2 U Klenow enzyme were mixed in this order with denatured probe and incubated for 1 h at
37°C. Non-incorporated nucleotides were separated from the labelled probe by using
Sephadex G-50 columns (GE Healthcare). Labelling efficiency was detected by using a
bench-top radioisotope counter (Bioscan, Washington D.C., USA). Immediately before
hybridisation, the probe was heat-denatured at 95°C for 5 min and placed on ice to prevent
re-annealing of the labelled fragments.
Northern blot
Total RNA was isolated with RNeasy Mini Kit (Qiagen) according to manufacturers’
instructions. Briefly, 10 µg of total RNA was dissolved in 1X volume of RNA loading buffer
and incubated at 65°C for 5 min to minimize RNA secondary structures. RNA was separated
on a 1% denaturing agarose gel, containing 2.2 M formaldehyde. Gels were run in 20 mM
MOPS overnight in 1X MOPS buffer at 20 V. Upon separation equal loading of RNA samples
was assessed by visualisation of the gel using UV (254 nm) trans-illuminator. Afterwards,
RNA was transferred to an Immobilon-Ny+ membrane by capillary forces using 10X SSC
43
Materials & Methods
solution. The gel was placed up-side down on a glass plate and Whatman filter papers
(dipped in reservoirs with 10X SSC solution). On top of the gel, the Immobilon-Ny+
membrane (humidified in deionised water), two Whatman filter papers and several layers of
paper towel were placed. Finally, a glass plate and a weight were put on top of the staple. On
the next day the RNA was cross-linked to the membrane by UV light (1,200 J/cm2), and
thereafter pre-hybridised in Church buffer at 62°C for at least 1 h. Hybridisation was
performed at 62°C overnight in 15-20 ml of fresh Church buffer, containing radioactively
labelled probe. The membrane was washed twice with 2X SSC, 1% SDS for 15 min at 62°C
and then twice with 0.1X SSC, 0.5% SDS for 10 min at 62°C. Subsequently, the membrane
was exposed to an X-ray film (Amersham HyperfilmTMMP) overnight at −80°C.
Formaldehyde agarose gel: 2.2 M formaldehyde, 20 mM MOPS, 1% (w/v) agarose
MOPS buffer: 0.4 M MOPS (free acid), 100 mM Na-acetate, 10 mM EDTA/NaOH pH 8.0, pH 7.0
adjusted with 10 N NaOH
RNA loading buffer: 50% (v/v) formamide, 2.2 M formaldehyde, 1X MOPS buffer, 50 µg/ml ethidium
bromide, 0.2% (w/v)
20X SSC: 3 M NaCl, 300 mM Tris-sodium citrate/NaOH pH 7.0
Immunoblotting
For Western blotting, tissue and cell lysates were prepared in LCW lysis buffer containing
Protease Inhibitor Cocktail (Roche Diagnostics), sonicated (50% duty cycle and 5 ms of
pulse width) and incubated for 15 min on ice. Prior to sonication tissue was additionally
minced by using an overhead stirrer (Eurostar RW16, IKA-Labortechnik). Cell debris was
removed by centrifugation at 15,000 rpm/4°C for 20 min. The protein concentration was
determined by the DC Protein Assay (Bio-Rad) according to manufacturers’ instructions.
Equal amounts of protein lysates were mixed with sample loading buffer and heated for
5 min at 95°C prior to gel electrophoresis. The proteins were separated by 12% SDS-PAGE
at constant 100 V in a 250/SE 260 Mini-Vertical Gel electrophoresis unit (Bio-Rad). After
electrophoresis the proteins were transferred to a Hybond-C super nitrocellulose membrane
(GE Healthcare) in blotting buffer with a Trans-Blot Semi-Dry Blotter (Bio-Rad) at ~800 µA
constant current per 1 cm2 of membrane for 1 h. The efficiency of protein transfer from the
gel to the membrane was confirmed by staining the membrane with Ponceau S. The blots
were blocked with 5% skim milk in TBST for 60 min and hybridized with a primary antibody in
5% BSA 1X TBS-T at 4°C overnight. On the next day, the blots were incubated with a
HRP-conjugated secondary antibody for 60 min at room temperature. Afterwards, they were
washed three times in 1X TBS-T for 15 min and visualized by ECL detection on Hyperfilm.
Stripping of Hybond-C super membranes was performed with 0.2 M NaOH for 15 min at
44
Materials & Methods
room temperature. Prior to second hybridisation, the blots were blocked with 5% skim milk in
1X TBS-T for 60 min. All following steps were performed as described above.
6X sample loading buffer: 375 mM Tris pH 6.8, 9% (w/v) SDS, 9% (v/v) β-mercaptoethanol,
50% (v/v) Glycerol, 0.03% (w/v) Bromophenol Blue
10X running buffer: 250 mM Tris, 1% SDS, 2.5 M Glycine
Blotting buffer: 1X Running Buffer (10X), 20% Methanol
Ponceau S: 2% (w/v) Ponceau S in 30% TCA TBS-T: 25 mM Tris, 125 mM NaCl, 0.1% Tween-20, pH 8.0
The production of antibodies against xCT and murine Txnrd2
The generation of antibodies, specific for human xCT, murine xCT and murine Txnrd2, was
performed in collaboration with Dr. Elisabeth Kremmer (Helmholtz Zentrum München).
Antibodies were raised against the different peptide sequences in rats. The peptides
HHHHGRLPSLGNKEPPGQEKVGLKC and HHHHDKKPRWFRIMSEKITRC (both human
xCT) and the peptides HHHHGRLPSMGDQEPPGQEKVVLKC and
HHHHDKKPKWFRRLSDRITRC (both murine xCT) were used to immunize rats. One peptide
sequence was used to raise monoclonal antibodies for Txnrd2: VKLHISKRSGLEPTVTG.
The peptides were obtained from Peptide Specialty Laboratories, Heidelberg, Germany and
were coupled to ovalbumin (OVA) or bovine serum albumin (BSA) at the C-terminus
(peptide-OVA/KLH). Monoclonal antibodies were produced by hybridoma fusion technology.
Two hybridoma clones that produced antibodies specific for human xCT and six for Txnrd2
were identified among numerous supernatants that were tested by immunblotting.
Immunocytochemistry and confocal microscopy
MEFs were plated on cover slips in 6-well cell culture dishes at ~75,000 cells per well and
cultured in standard DMEM. For fixation, the medium was aspirated from the cell culture
dish, and the cover slips were rinsed with PBS. The cells were fixed for 15 min in a 2% PFA
solution. The cover slips were washed with PBS, and the cells were permeabilized three
times for 5 min with 0.15% Triton X-100 in PBS. Subsequently, unspecific binding was
blocked by using PBS+ three times for 10 min. The cover slips were incubated overnight with
the primary antibody at 4°C in a humidified chamber. Thereafter, cover slips were washed for
5 min with PBS and subsequently with PBS/Triton (0.15%) for 10 min twice and finally for
10 min in PBS+. Cells were then incubated with a fluorophore-labelled secondary antibody in
the dark for 45 min. Cover slips were washed twice for 5 min in PBS/Triton (0.15%) and twice
for 7 min in PBS. Finally, DAPI-solution was added for 90 s, and the cells were subjected to
45
Materials & Methods
two final washing steps with PBS for 2 min. The glasses were mounted onto microscope
slides, using mounting medium (Dako, Cytomation). The slides were dried overnight at 4°C,
protected from light and sealed with nail polish. The pictures were taken by confocal
microscopy with Leica DM IRBE microscope, Leica TCS SP2 scanner by using Leica
Confocal software.
2% PFA: 2% (w/v) PFA in PBS
PBS+: 1% (w/v) BSA, 0.15% (w/v) Glycin in PBS
DAPI-solution: 1:10,000 in PBS
2.2.4. Flow cytometry
Detection of intracellular ROS
Dichlorofluorescin diacetate (DCFH-DA, Invitrogen) was used as an indicator for monitoring
intracellular ROS. DCFH-DA is cell permeable and diffuses across cell membranes,
whereupon it is hydrolysed by intracellular esterases to yield dichlorofluorescin (DCFH), a
nonfluorescent compound. DCFH can be oxidized by various types of ROS to the fluorescent
compound DCF. In order to monitor cellular ROS, cells (~5,5 x 10⁴) were plated and
incubated with 2 μM dichlorofluorescin diacetate (DCFH-DA) in DMEM for 1 h at 37°C, 5%
CO2 in a water-saturated atmosphere in the dark. After incubation cells were harvested,
transferred into the round bottom polypropylene tubes, washed in PBS and resuspended in
~200 µl PBS. Cellular fluorescence intensity was measured in a flow cytometer (BD
FACSCalibur) using an excitation wavelength of 448 nm and measured at 530 nm emission
(FL-1). The recorded results were analysed using CellQuestTM software (Becton Dickinson).
As a cut-off value for obtaining significant values the number of at least 8,000 cells was used.
DCFH-DA solution: 2 mM DCFH-DA in ethanol
Detection of lipid peroxidation
BODIPY581/591 C11 is a lipophilic fluorescent compound that readily intercalates into
membranes and upon oxidation shifts its fluorescence from red to green. Thus, it can be
used to efficiently monitor lipid peroxidation. For this purpose, ~5,5 x 10⁴ cells were plated
and incubated with 2 µM BODIPY in DMEM for 1 h at 37°C in a 5% CO2 water-saturated
atmosphere in the dark. After incubation, the cells were harvested and treated as described
above (2.5.1). Cellular fluorescence intensity was measured in a flow cytometer (BD
46
Materials & Methods
FACSCalibur) in the FL-1 (green) and FL-3 (red) channels. Cell populations of interest were
gated and analysed using CellQuestTM software (Becton Dickinson). As a cut-off value for
obtaining significant values the number of at least 8,000 cells was used.
BODIPY581/591 C11 solution: 2 mM BODIPY581/591 C11 in DMSO
Specific detection of hydrogen peroxide in living cells
New boronate-based compounds (kind gift of Dr. Christopher J. Chang, University of
California, Berkeley, California (Chang et al., 2004a; Dickinson and Chang, 2008; Miller et
al., 2005) allow the specific detection of H2O2 within the cell, which is produced due to
environmental stress and/or accumulate due to genetic manipulation of antioxidant enzymes.
These new fluorophores allow to measure H2O2 levels also in different subcellular
compartments including mitochondria (mitochondria peroxy yellow 1). For H2O2
determination by flow cytometry, ~5,5 x 10⁴ cells were plated one day prior to analysis. After
overnight cultivation, the standard medium was exchanged with DMEM. The cells were
incubated with 2.5 µM of Peroxi-yellow acetoxy methyl-ester (PYAM), Peroxi-yellow methyl-
ester (PYME) and mitochondrial Peroxi-yellow (mitoPY) for 1 h at 37°C in a 5% CO2
water-saturated atmosphere protected from the light. After incubation, cells were treated as
described under 2.5.3. Cellular fluorescence intensity was measured with a flow cytometer
(BD FACSCalibur) in FL-1 (green) channel with an excitation wavelength of 450 nm. Cells
were gated and analysed using CellQuestTM software (Becton Dickinson). As a cut-off value
for obtaining significant values the number of at least 8,000 cells was used.
Boronate-based compounds: 2 mM in DMSO
Determination of cell viability by flow cytometry
Assessment of cellular DNA content
To measure genomic DNA fragmentation and nuclear DNA content, propidium iodide (PI)
staining of DNA was used. The cells were harvested by trypsinisation, washed with PBS and
fixed in 2% of formaldehyde for 30 min on ice. After fixation, cells were permeabilised with
ice cold 100% ethanol for 15 min, pelleted and resuspended in PBS containing RNAase A
(40 µg/ml). After 30 min incubation at 37°C, cells were harvested and diluted in ~200 µl of
PBS. The cells prepared in this way are stable for 1 month at 4°C. The fluorogenic dye PI
intercalates into double-stranded DNA. Cell suspensions were excited with 488 nm and PI
emission was recorded on channel FL3 at 661 nm.
47
Materials & Methods
2% formaldehyde: 2% v/w formaldehyde in PBS
PI solution: 1 mg/ml PI in PBS
Staining of apoptotic cells by Annexin V-FITC/PI
One hallmark of apoptotic cells is the translocation of the membrane glycerophospholipid,
phosphatidylserine (PS), from the inner to the outer leaflet of the plasma membrane.
Annexin V is a 35-36 kDa Ca2+-dependent phospholipid-binding protein that has high affinity
for PS. Annexin V is very sensitive and detects PS exposure occurring early in the onset of
apoptotic cells. Annexin V–FITC is typically used in conjunction with a dye that stains for
dead cells, such as propidium iodide (PI), to distinguish early apoptotic cells
(Annexin V-FITC-positive, PI-negative) from late cell death (Annexin V–FITC-positive, PI-
positive). During the various steps of classical apoptosis, cells are first Annexin V-FITC-
positive/PI-negative and then during late phases Annexin V-FITC-/PI-double positive. In
non-classical forms of apoptotic cell death, it has been described that
Annexin V-FITC-positive/PI-negative can never be detected and only
Annexin V-FITC-/PI-double positive cells are evident. To detect apoptotic cells,
approximately 1 x 10⁵ cells were harvested and washed with PBS. Collected cells were
resuspended in ~150 µl binding buffer containing Annexin V-FITC at a concentration of
1 mg/ml and incubated in the dark at room temperature. After 30 min of incubation, 50 µg/ml
propidium iodide (PI) in PBS was added and cells were subjected to flow cytometry
(BD FACSCalibur) with FL-1 (green) and FL-3 (red) channels with an excitation wavelength
of 488 nm. Cell populations of interest were analysed using CellQuestTM software (Becton
Dickinson). Data were collected from at least 8,000 cells.
10X Annexin V binding buffer: 0.1 M Hepes/NaOH (pH 7.4), 1.4 M NaCl, 25 mM CaCl; Store at 4 °C.
Microscopy pictures
Pictures of cells were taken with Axiovert Microscopes (Carl Zeiss, Jena GmbH, Germany)
and processed using Improvision Openlab 3.0.8 software.
48
Materials & Methods
2.2.5. Biochemical methods
Determination of cellular cystine uptake activity
Cystine uptake activity was determined by measuring the time-dependent increase of
radioactively labelled L-[14C(U)] cystine inside cells as described (Bannai and Kasuga, 1985).
Approximately 1 x 10⁶ cells were plated per 6 cm cell culture dish in DMEM, and incubated
for 24 h. Cells were washed with pre-warmed PBS(+), followed by the addition of 500 µl
uptake solution and further incubation at 37°C for 90 s. To control for the specific uptake
activity of system xC−, 2.5 mM glutamate was added to the uptake solution. The uptake
solution was aspirated, cells were quickly washed with ice-cold PBS and lysed in 500 µl
0.5 M NaOH overnight. The protein concentration of the samples was determined by the DC
Protein Assay (Bio Rad). Then, 200 µl cell lysate, 3 ml scintillation cocktail and 100 µl 0.2 M
Tris-HCl were mixed in a scintillation tube. The amount of L-[14C (U)] cystine was determined
by a LS 500 TA Scintillation Counter. To correlate cystine concentration and radioactivity, 5
µl Uptake Solution (50 µM cystine) was mixed with 500 µl 0.5 M NaOH and the “specific
activity” of L-[14C (U)] cystine was measured. The cellular cystine uptake activity is expressed
as nmol cystine min−1 mg−1.
Uptake solution: 50 µM cystine, 0.2 µCi/ml [14C(U)] cystine, 10% glucose, 1% CaCl2, 1% MgCl2 in
PBS. 5 mM cystine stock solution was dissolved in 0.05 M HCL with stirring for several hours at room
temperature.
PBS(+): PBS, 10% glucose, 1% CaCl2, 1% MgCl2
GSH determination by HPLC
Estimation of glutathione was done by method described for estimation of homocysteine with
slight modification (Feussner et al., 1997).The HPLC system consisted of a System Gold 126
pump, connected to a System Gold 508 autosampler (both Beckman Coulther GmbH,
Krefeld, Germany) and a RF-10A XL fluorescence spectrophotometer (Shimadzu, Duisburg,
Germany). The mobile phase consisted of 95% of 30 mM ammonium-formiate, 40 mM
ammonium-nitrate buffer (adjusted to pH 3.65 with formic acid) and 5% of acetonitrile. The
column effluent was monitored by fluorescence detection with an excitation wavelength of
385 nm and an emission of wavelength of 515 nm.
Intracellular GSH levels were measured in Txnrd2 knock-out cells. Cells were plated 24 h
prior to GSH measurements in 10 cm diameter dishes. Cells were harvested from cell culture
dishes with the cell scraper, washed in PBS, resuspended in 500 µl Borate Buffer 1 and
49
Materials & Methods
homogenized by sonication (50% duty cycle, 5 ms of pulse width). For GSH determinations,
samples (200 µl) were treated on ice with 20 µl 100 µl/l tri-n-butylphosphine in
dimethylformamide for 30 min in order to reduce thiols and liberate them from proteins. 200
µl perchloric acid was added to the samples, mixed and incubated for 10 min on ice. Proteins
were removed by centrifugation at 10,000 x g for 10 min at 0°C. 100 µl of the supernatant,
250 µl Borate Buffer 2 and 100 µl (SBDF) were mixed and incubated at 60°C for 60 min. To
terminate the SBDF derivatization step, the solutions were snap-cooled on ice and
transferred to a pre-cooled autosampler vial. Aliquots of 50 µl were injected into the column.
Standard samples of GSH (1 to 25 µM) were prepared by serial dilution in Borate Buffer 1.
Borate buffer 1: 0.2 M boric acid, containing 2 mM Na2EDTA, pH 9.5
Borate buffer 2: 0.2 M boric acid, containing 5 mM Na2EDTA, pH 10.5 Perchloric acid: 0.5 M perchloric acid, containing 1 mM Na2EDTA
SBDF: 1.0 g/l 7-fluoro- benzo-2-oxa-1.3-diazole-4- sulphonate in 0.1 M Borate Buffer 1
2.2.6. ES cell technology
E14tg2a ES cell line
The maintenance of ES cell cultures is far more elaborate than that of many other cell lines.
The major reason for this is to maintain the pluripotent state of ES cells. The E14tg2a ES cell
line had been previously adapted for the growth on 0.1% gelatine-coated cell culture dishes.
ES cells were cultured at 37°C in a 5% CO2 water-saturated atmosphere in E14 media
containing LIF (leukaemia inhibitory factor) to prevent differentiation of ES cells. To minimize
the risk of differentiation, ES cells were plated as a single cell suspension of approximately
1.5 x 10⁵ - 4 x 10⁵ cells per cm2. The medium was replaced every day and the cells were
generally split every other day at ~80% confluency at ratios between 1:4 and 1:10.
ES cell medium: Stempan medium (PAN-Biotech GmbH, Stempan GMEM prepared mix:
L-Glutamine, 3.7 g/l NaHCO), ESGRO (LIF) 500 U/ml
Gene targeting in E14tg2a ES cells
ES cells were grown to ~80% confluency and harvested by trypsinization. A small aliquot
was taken to determine the cell number. The rest of the cells were collected by
centrifugation, resuspended in PBS to a density of 7 x 10⁶ and washed two times in PBS and
kept on ice. Twenty µg of linearised targeting vector was used for each transfection using an
electric pulse of 240 V and a capacitance of 500 µF in electroporation cuvettes with 0.4 cm
50
Materials & Methods
gap width (Bio-Rad). After transfection, cells were allowed to recover at room temperature for
10 min. The cell suspension was transferred into E14 medium and plated in 10 cm diameter
cell culture dishes coated with 0.1% gelatine. Selection for antibiotic resistance was initiated
36 h after electroporation with 200 µg/ml G418-Sulfate. As a control, one plate of non-
transfected ES cells was plated and treated as transfected cells. Cells were kept under
selection pressure for the next 9-10 days. Neomycin-resistant single cell colonies appeared
and were visible by eye. Approximately 10 days after electroporation, individual ES cell
clones were picked with a pipette and transferred to a gelatine-coated 96-well containing ES
cell medium. The clones were left over night to attach to the dish, and on the next day they
were washed in PBS and trypsinized to obtain singe cells. These were re-plated in a fresh
96-well plate and allowed to grow until ~80% confluency was reached. Afterwards, cells were
split 1:3. Two replica plates were frozen after they reached ~80% confluency for expansion of
positive clones. One replica plate was further expanded (1:3) for Southern blot analysis in
order to identify the clones with homologous recombination.
E14 medium: Stempan medium (PAN-Biotech GmbH; Stempan GMEM already prepared mix:
L-Glutamine, 3.7 g/l NaHCO), ESGRO (LIF) 100 U/ml)
Freezing of ES cells in 96 well plates
ES cells that were used for further electroporation or used in blastocyst injection were frozen
in E14 medium containing 10% DMSO. ES cell clones that were picked after electroporation
with the targeting construct and selection were frozen in E14 medium containing 10% DMSO
directly in the 96 plates. After reaching proper confluency cells were washed with PBS,
trypsinized in 25 µl trypsin and resuspended. 200 µl of 10% DMSO E14 medium was used to
inactivate the trypsin and as a freezing medium. The 96-well dishes were wrapped with
Laboratory Parafilm M (Pechiney Plastic Packaging Company) and paper towels and stored
at –80°C not longer than 6 weeks.
Isolation of genomic DNA
To screen for homologous recombination of the targeting construct by Southern blot,
genomic DNA was isolated directly from 96 wells. The amount of DNA obtained with this
method is sufficient for Southern blot analysis in a 96 well format. After cell lysis overnight,
DNA was precipitated in 2X volumes of 100% ethanol/150 mM NaCl at constant shaking for
15 min at room temperature. DNA was collected by centrifugation of the 96 well plates at
1,000 rpm for 5 min at 4°C. Afterwards, the DNA was washed three times with 70% ethanol.
51
Materials & Methods
After air-drying, DNA samples were dissolved in 50 µl 1X TE and stored at −20°C until further
analysis.
Southern blot
Approximately 10 µg of DNA was digested with the corresponding endonuclease at 37°C
overnight. Since DNA isolated in described way (as described in subsection 2.2.3.) was not
very pure, spermidine (4 mM final concentration) was added to allow more efficient DNA
digestion. The next day DNA fragments were separated on a 1% 1X TAE ethidium
bromide-stained agarose gel in 1X TAE. Before blotting the DNA on the Immobilon-Ny+
membrane (Millipore), the gel was incubated in 0.25 N HCl with gentle shaking for 15 min
and for DNA denaturation for 1 h in denaturation buffer. DNA was transferred to the
Immobilon-Ny+ membrane by capillary forces overnight. After blotting, the membrane was
shortly washed in 2X SSC and pre-hybridised for at least 1 h at 62°C in Church buffer
(hybridisation buffer). Finally radioactively labelled probe was added to the hybridisation
buffer and hybridised overnight at 62°C in hybridisation buffer. The next day the membrane
was washed three times for 10 min in washing buffer at 62°C and exposed to an X-ray film
(Amersham HyperfilmTMMP) overnight at −80°C.
Denaturation buffer: 1.5 M NaCl, 0.5 N NaOH 20X SSC: 3 M NaCl, 300 mM Trinatriumcitrat, NaOH pH 7.0-optional
Church buffer (hybridisation buffer): 200 mM NaH2PO4, 400 mM Na2HPO4, 7% (w/v) SDS, 1 mM
EDTA, pH 7.1-7.2
Washing buffer: 0.5% SDS, 0.2X SSC
Blastocyst injection of ES cells
Clones with successful homologous recombination were identified by Southern blot (as
described in section 2.2.3). Positive clones were thawed and individually expanded for
blastocyst injection. The clone was split 1:2 24 h before blastocyst injection. On the day of
blastocyst injection the cells were harvested in the usual way, washed in PBS and injected
into C57BL/6 blastocysts at the Institute of Experimental Genetics (IEG), Helmholtz Zentrum
München. Embryonic Stem cells reintroduced into host blastocysts can contribute to all adult
tissues, including germ cells, if the cells used for blasocyst injection were still pluripotent.
After injection, 15-20 manipulated blastocysts were re-implanted in pseudo-pregnant foster
mice. Chimeric mice were born and subsequently bred with C57BL/6 for germ line
transmission.
52
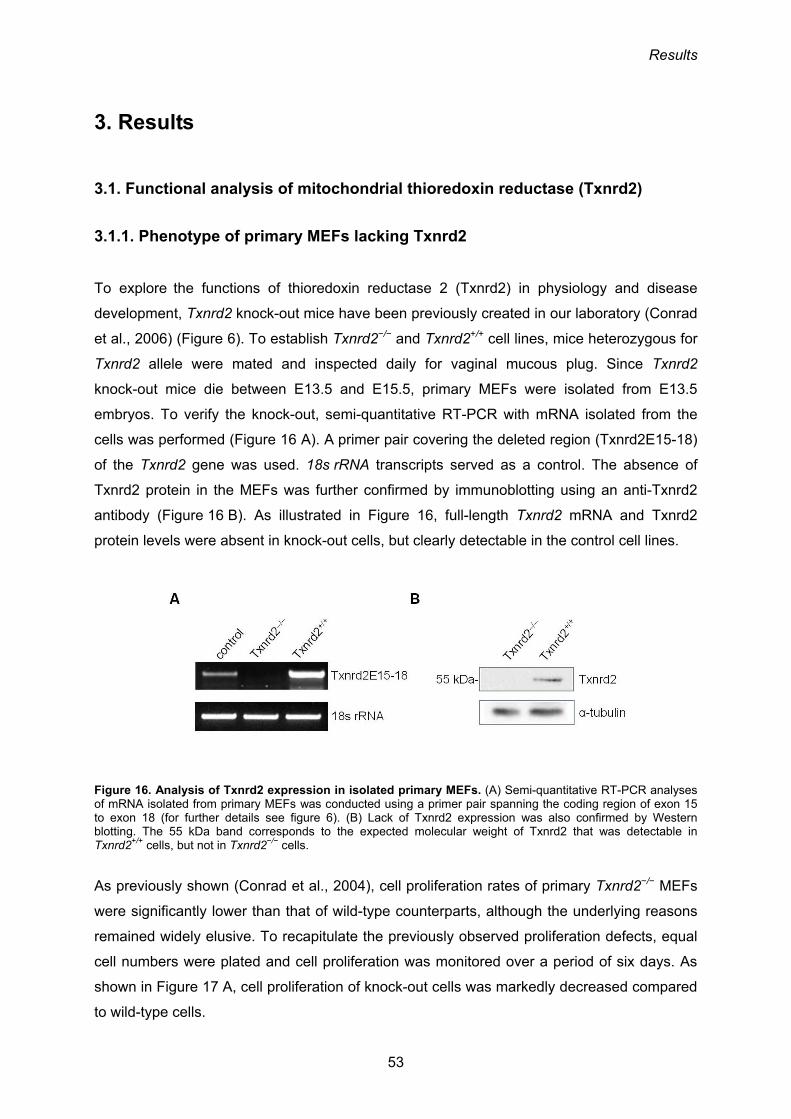
Results
53
3. Results
3.1. Functional analysis of mitochondrial thioredoxin reductase (Txnrd2)
3.1.1. Phenotype of primary MEFs lacking Txnrd2
To explore the functions of thioredoxin reductase 2 (Txnrd2) in physiology and disease
development, Txnrd2 knock-out mice have been previously created in our laboratory (Conrad
et al., 2006) (Figure 6). To establish Txnrd2−/− and Txnrd2+/+ cell lines, mice heterozygous for
Txnrd2 allele were mated and inspected daily for vaginal mucous plug. Since Txnrd2
knock-out mice die between E13.5 and E15.5, primary MEFs were isolated from E13.5
embryos. To verify the knock-out, semi-quantitative RT-PCR with mRNA isolated from the
cells was performed (Figure 16 A). A primer pair covering the deleted region (Txnrd2E15-18)
of the Txnrd2 gene was used. 18s rRNA transcripts served as a control. The absence of
Txnrd2 protein in the MEFs was further confirmed by immunoblotting using an anti-Txnrd2
antibody (Figure 16 B). As illustrated in Figure 16, full-length Txnrd2 mRNA and Txnrd2
protein levels were absent in knock-out cells, but clearly detectable in the control cell lines.
Figure 16. Analysis of Txnrd2 expression in isolated primary MEFs. (A) Semi-quantitative RT-PCR analyses of mRNA isolated from primary MEFs was conducted using a primer pair spanning the coding region of exon 15 to exon 18 (for further details see figure 6). (B) Lack of Txnrd2 expression was also confirmed by Western blotting. The 55 kDa band corresponds to the expected molecular weight of Txnrd2 that was detectable in Txnrd2+/+ cells, but not in Txnrd2−/− cells.
As previously shown (Conrad et al., 2004), cell proliferation rates of primary Txnrd2−/− MEFs
were significantly lower than that of wild-type counterparts, although the underlying reasons
remained widely elusive. To recapitulate the previously observed proliferation defects, equal
cell numbers were plated and cell proliferation was monitored over a period of six days. As
shown in Figure 17 A, cell proliferation of knock-out cells was markedly decreased compared
to wild-type cells.
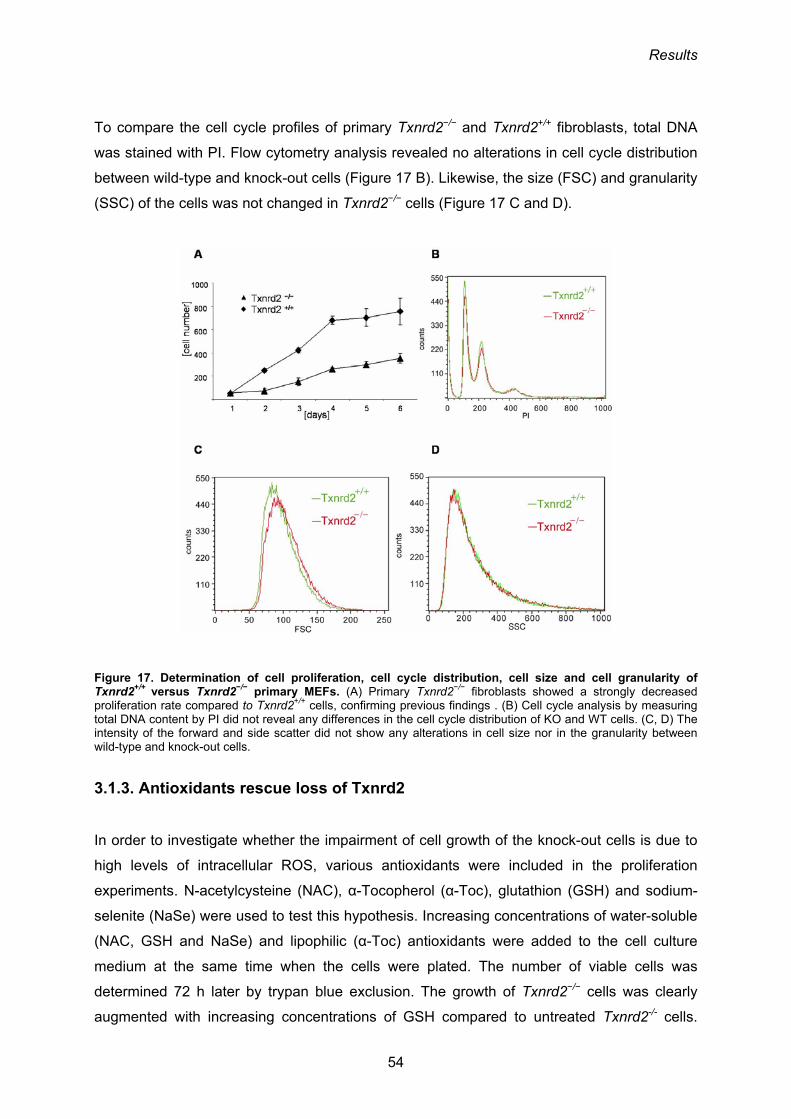
Results
To compare the cell cycle profiles of primary Txnrd2−/− and Txnrd2+/+ fibroblasts, total DNA
was stained with PI. Flow cytometry analysis revealed no alterations in cell cycle distribution
between wild-type and knock-out cells (Figure 17 B). Likewise, the size (FSC) and granularity
(SSC) of the cells was not changed in Txnrd2−/− cells (Figure 17 C and D).
Figure 17. Determination of cell proliferation, cell cycle distribution, cell size and cell granularity of Txnrd2+/+ versus Txnrd2−/− primary MEFs. (A) Primary Txnrd2−/− fibroblasts showed a strongly decreased proliferation rate compared to Txnrd2+/+ cells, confirming previous findings . (B) Cell cycle analysis by measuring total DNA content by PI did not reveal any differences in the cell cycle distribution of KO and WT cells. (C, D) The intensity of the forward and side scatter did not show any alterations in cell size nor in the granularity between wild-type and knock-out cells.
3.1.3. Antioxidants rescue loss of Txnrd2
In order to investigate whether the impairment of cell growth of the knock-out cells is due to
high levels of intracellular ROS, various antioxidants were included in the proliferation
experiments. N-acetylcysteine (NAC), α-Tocopherol (α-Toc), glutathion (GSH) and sodium-
selenite (NaSe) were used to test this hypothesis. Increasing concentrations of water-soluble
(NAC, GSH and NaSe) and lipophilic (α-Toc) antioxidants were added to the cell culture
medium at the same time when the cells were plated. The number of viable cells was
determined 72 h later by trypan blue exclusion. The growth of Txnrd2−/− cells was clearly
augmented with increasing concentrations of GSH compared to untreated Txnrd2-/- cells.
54
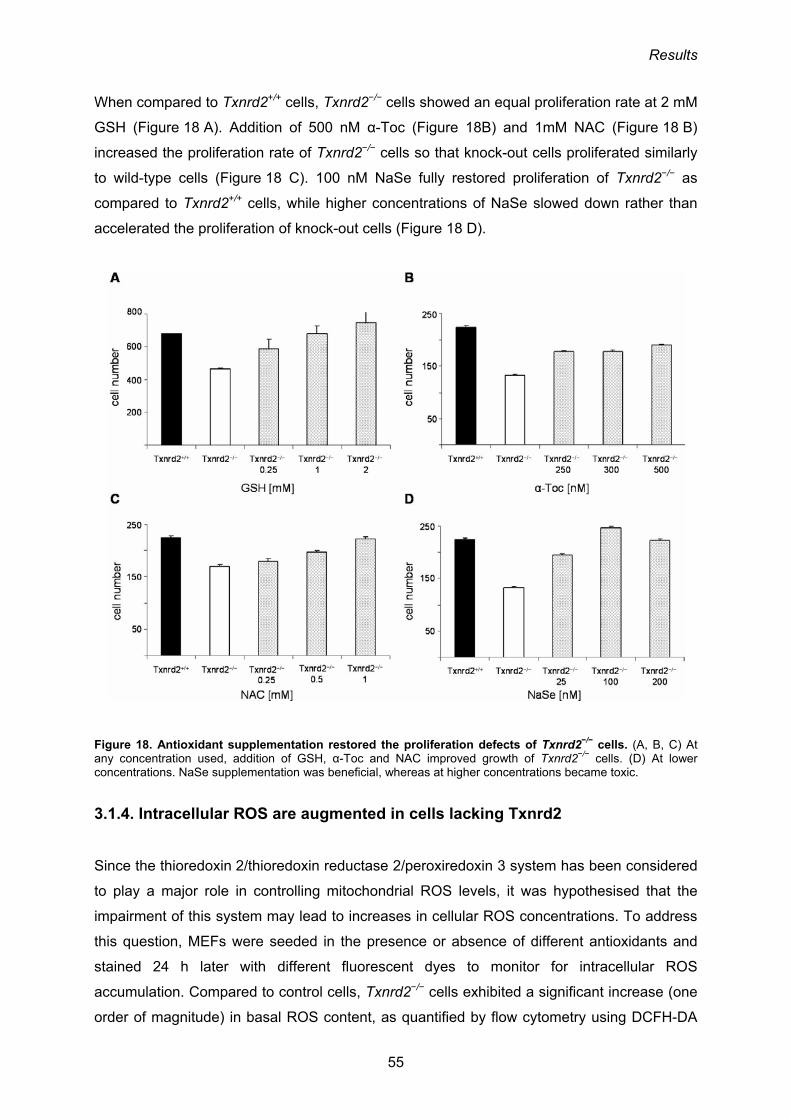
Results
When compared to Txnrd2+/+ cells, Txnrd2−/− cells showed an equal proliferation rate at 2 mM
GSH (Figure 18 A). Addition of 500 nM α-Toc (Figure 18B) and 1mM NAC (Figure 18 B)
increased the proliferation rate of Txnrd2−/− cells so that knock-out cells proliferated similarly
to wild-type cells (Figure 18 C). 100 nM NaSe fully restored proliferation of Txnrd2−/− as
compared to Txnrd2+/+ cells, while higher concentrations of NaSe slowed down rather than
accelerated the proliferation of knock-out cells (Figure 18 D).
Figure 18. Antioxidant supplementation restored the proliferation defects of Txnrd2−/− cells. (A, B, C) At any concentration used, addition of GSH, α-Toc and NAC improved growth of Txnrd2−/− cells. (D) At lower concentrations. NaSe supplementation was beneficial, whereas at higher concentrations became toxic.
3.1.4. Intracellular ROS are augmented in cells lacking Txnrd2
Since the thioredoxin 2/thioredoxin reductase 2/peroxiredoxin 3 system has been considered
to play a major role in controlling mitochondrial ROS levels, it was hypothesised that the
impairment of this system may lead to increases in cellular ROS concentrations. To address
this question, MEFs were seeded in the presence or absence of different antioxidants and
stained 24 h later with different fluorescent dyes to monitor for intracellular ROS
accumulation. Compared to control cells, Txnrd2−/− cells exhibited a significant increase (one
order of magnitude) in basal ROS content, as quantified by flow cytometry using DCFH-DA
55
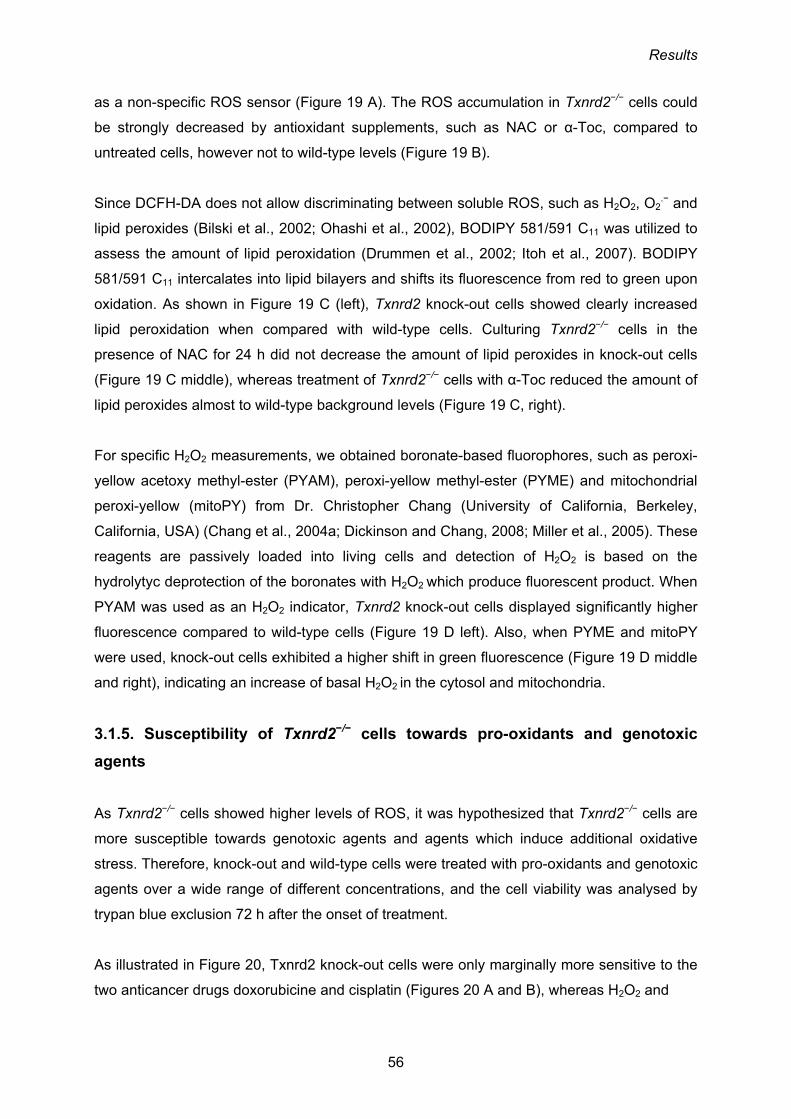
Results
as a non-specific ROS sensor (Figure 19 A). The ROS accumulation in Txnrd2−/− cells could
be strongly decreased by antioxidant supplements, such as NAC or α-Toc, compared to
untreated cells, however not to wild-type levels (Figure 19 B).
Since DCFH-DA does not allow discriminating between soluble ROS, such as H2O2, O2.− and
lipid peroxides (Bilski et al., 2002; Ohashi et al., 2002), BODIPY 581/591 C11 was utilized to
assess the amount of lipid peroxidation (Drummen et al., 2002; Itoh et al., 2007). BODIPY
581/591 C11 intercalates into lipid bilayers and shifts its fluorescence from red to green upon
oxidation. As shown in Figure 19 C (left), Txnrd2 knock-out cells showed clearly increased
lipid peroxidation when compared with wild-type cells. Culturing Txnrd2−/− cells in the
presence of NAC for 24 h did not decrease the amount of lipid peroxides in knock-out cells
(Figure 19 C middle), whereas treatment of Txnrd2−/− cells with α-Toc reduced the amount of
lipid peroxides almost to wild-type background levels (Figure 19 C, right).
For specific H2O2 measurements, we obtained boronate-based fluorophores, such as peroxi-
yellow acetoxy methyl-ester (PYAM), peroxi-yellow methyl-ester (PYME) and mitochondrial
peroxi-yellow (mitoPY) from Dr. Christopher Chang (University of California, Berkeley,
California, USA) (Chang et al., 2004a; Dickinson and Chang, 2008; Miller et al., 2005). These
reagents are passively loaded into living cells and detection of H2O2 is based on the
hydrolytyc deprotection of the boronates with H2O2 which produce fluorescent product. When
PYAM was used as an H2O2 indicator, Txnrd2 knock-out cells displayed significantly higher
fluorescence compared to wild-type cells (Figure 19 D left). Also, when PYME and mitoPY
were used, knock-out cells exhibited a higher shift in green fluorescence (Figure 19 D middle
and right), indicating an increase of basal H2O2 in the cytosol and mitochondria.
3.1.5. Susceptibility of Txnrd2−/− cells towards pro-oxidants and genotoxic agents
As Txnrd2−/− cells showed higher levels of ROS, it was hypothesized that Txnrd2−/− cells are
more susceptible towards genotoxic agents and agents which induce additional oxidative
stress. Therefore, knock-out and wild-type cells were treated with pro-oxidants and genotoxic
agents over a wide range of different concentrations, and the cell viability was analysed by
trypan blue exclusion 72 h after the onset of treatment.
As illustrated in Figure 20, Txnrd2 knock-out cells were only marginally more sensitive to the
two anticancer drugs doxorubicine and cisplatin (Figures 20 A and B), whereas H2O2 and
56
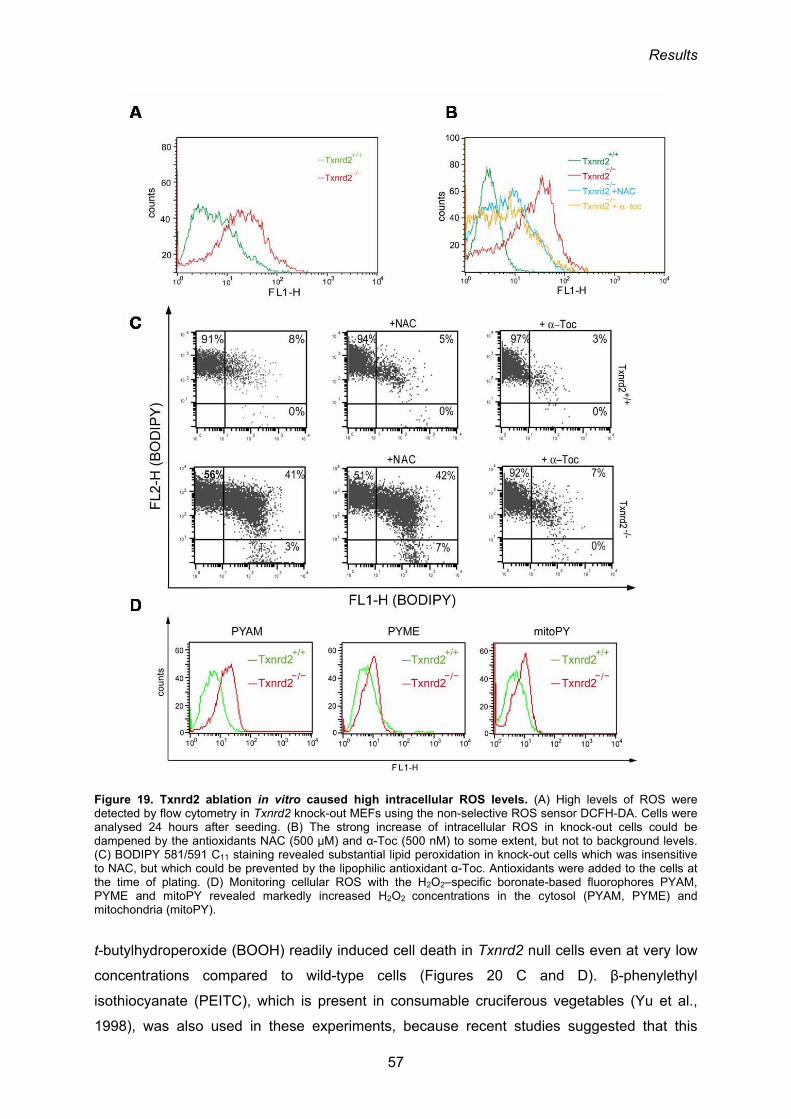
Results
Figure 19. Txnrd2 ablation in vitro caused high intracellular ROS levels. (A) High levels of ROS were detected by flow cytometry in Txnrd2 knock-out MEFs using the non-selective ROS sensor DCFH-DA. Cells were analysed 24 hours after seeding. (B) The strong increase of intracellular ROS in knock-out cells could be dampened by the antioxidants NAC (500 µM) and α-Toc (500 nM) to some extent, but not to background levels. (C) BODIPY 581/591 C11 staining revealed substantial lipid peroxidation in knock-out cells which was insensitive to NAC, but which could be prevented by the lipophilic antioxidant α-Toc. Antioxidants were added to the cells at the time of plating. (D) Monitoring cellular ROS with the H2O2–specific boronate-based fluorophores PYAM, PYME and mitoPY revealed markedly increased H2O2 concentrations in the cytosol (PYAM, PYME) and mitochondria (mitoPY).
t-butylhydroperoxide (BOOH) readily induced cell death in Txnrd2 null cells even at very low
concentrations compared to wild-type cells (Figures 20 C and D). β-phenylethyl
isothiocyanate (PEITC), which is present in consumable cruciferous vegetables (Yu et al.,
1998), was also used in these experiments, because recent studies suggested that this
57
Results
compound increases ROS and induces apoptosis in cancer cell lines (Trachootham et al.,
2006; Wu et al., 2005; Yu et al., 1998; Zhang et al., 2003). In addition, it was shown that
PEITC causes rapid oxidation of mitochondrial Prx III (Brown et al., 2008). Similarly to H2O2
and t-butylhydroperoxide, Txnrd2−/− cells were clearly more vulnerable to increasing PEITC
concentrations than wild-type cells (Figure 20 E).
The antibiotic antimycin A interrupts the electron flow from semiquinone to ubiquinone in the
Q-cycle of complex III of the respiratory chain. Antimycin A is thus regarded to trigger the
formation of large quantities of superoxide anion. When Txnrd2−/− cells were treated with
antimycin A, they died already at very low concentrations, while wild-type cells were clearly
more resistant to antimycin A (Figure 20 F).
Figure 20. Txnrd2−/− cells are highly sensitive to pro-oxidants, but almost equally resistant to genotoxic agents. The same number of the knock-out and wild-type cells was seeded in the presence of different pro-oxidants and genotoxic agents, and cell viability was determined 72 h later by trypan blue exclusion. (A, B) Txnrd2−/− and Txnrd2+/+ control cells were almost equally resistant to the anticancer drugs doxorubicin and cisplatin. (C, D) Txnrd2−/− MEFs rapidly died in response to increasing concentrations of H2O2 and t-butylhydroperoxide and to a lesser extent when PEITC was used (E). (F) Antimycin A triggered rapid cell death in Txnrd2−/− cells already at very low concentrations. Each value represents the mean±S.D from triplicate assays.
58
Results
From these findings one can conclude that Txnrd2−/− cells show high levels of overall cellular
ROS, which can be partially blunted by antioxidants, and that Txnrd2−/− cells are highly
susceptible to pro-oxidants but not to genotoxic agents.
3.1.6. Sensitivity of Txnrd2−/− cells towards inhibition of de novo GSH biosynthesis
Reportedly, Txnrd2 knock-out cells are highly susceptible to GSH depletion induced by
L-buthionine sulfoximine (BSO), a highly specific and irreversible inhibitor of
γ-glutamyl-cysteinyl-synthetase (γ-GCS) (Conrad et al., 2004). γ-GCS catalyses the first and
rate-limiting step of GSH synthesis. To test whether Txnrd2−/− cells may show differences in
basal intracellular GSH concentrations, total (GSH) and oxidised (GSSG) GSH levels were
determined by HPLC analysis. Interestingly, Txnrd2+/+ cells showed considerably higher level
of GSH than knock-out cells, while GSSG levels were comparable in both cell types
(Figure 21 A). As the ratio between the level of glutathion (GSH) and oxidised glutathione
(GSSG) determines the capability of the cells to buffer an increase in ROS, this finding
explains the highly increased sensitivity of Txnrd2−/− cells to additional exogenous oxidative
stress.
Next, the effects of experimental GSH depletion on cell survival and cell death was
investigated more thoroughly. Preferential killing of the Txnrd2−/− cells was further
demonstrated by treatment of the cells with increasing BSO concentrations. As illustrated in
Figure 21 B, Txnrd2−/− cells rapidly died already at very low BSO concentrations. 72 h after
treatment, 5 µM BSO caused cell death in 59% of the knock-out cells and only in 16% of
Txnrd2+/+ cells. Overall, Txnrd2+/+ cells were much more resistant to BSO: about 50% of
Txnrd2+/+ cells were still viable at 20 µM BSO, whereas Txnrd2−/− cells had invariably been
killed by this BSO concentration (Figure 21 B).
Next, total ROS levels were measured in wild-type and knock-out cells by DCFH-DA in
response to BSO-induced GSH depletion. Treatment of Txnrd2−/− cells with increasing
concentrations of BSO caused a strong increase of ROS in these cells (almost 2 orders of
magnitude) compared to untreated knock-out and wild-type as well as BSO-treated wild-type
cells (Figure 22 A). Interestingly, ROS levels in Txnrd2+/+ cells treated with 15 µM BSO were
comparable to that of untreated Txnrd2−/− cells (Figure 22 B).
In order to address whether Txnrd2 knock-out cells die in an apoptotic manner in response to
BSO-mediated GSH depletion, cells were stained with AnnexinV-FITC/PI and analysed by
59
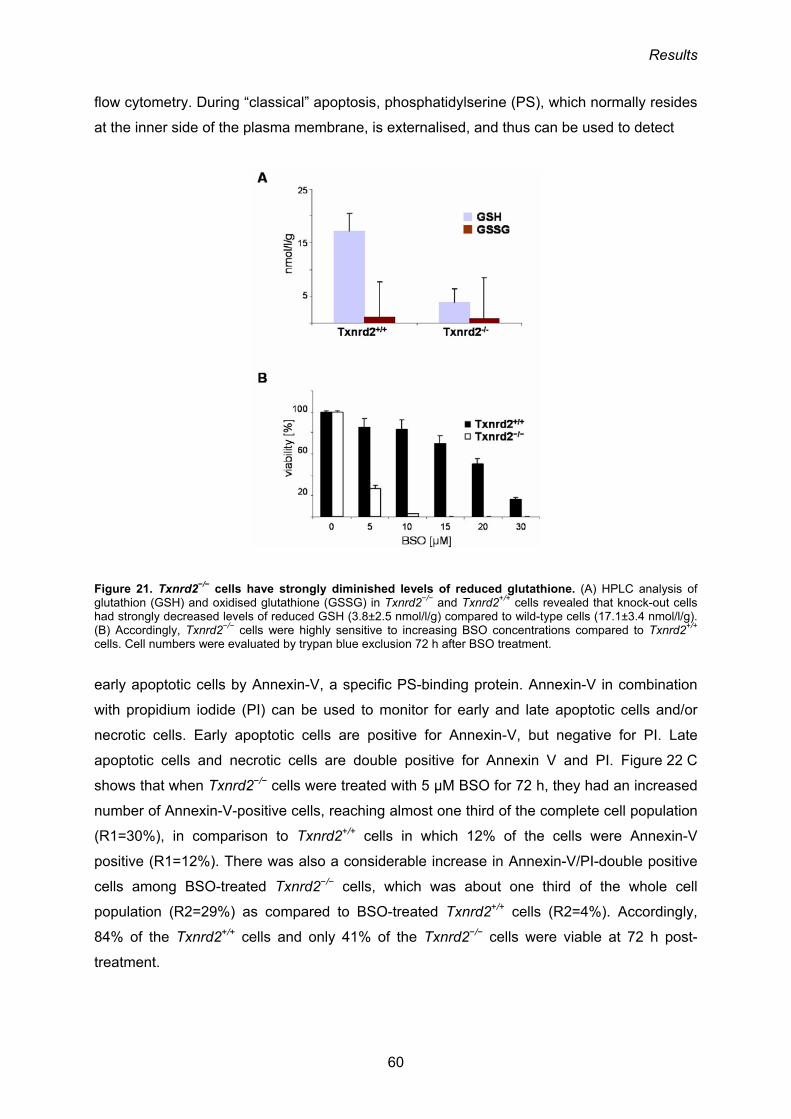
Results
flow cytometry. During “classical” apoptosis, phosphatidylserine (PS), which normally resides
at the inner side of the plasma membrane, is externalised, and thus can be used to detect
Figure 21. Txnrd2−/− cells have strongly diminished levels of reduced glutathione. (A) HPLC analysis of glutathion (GSH) and oxidised glutathione (GSSG) in Txnrd2−/− and Txnrd2+/+ cells revealed that knock-out cells had strongly decreased levels of reduced GSH (3.8±2.5 nmol/l/g) compared to wild-type cells (17.1±3.4 nmol/l/g). (B) Accordingly, Txnrd2−/− cells were highly sensitive to increasing BSO concentrations compared to Txnrd2+/+ cells. Cell numbers were evaluated by trypan blue exclusion 72 h after BSO treatment.
early apoptotic cells by Annexin-V, a specific PS-binding protein. Annexin-V in combination
with propidium iodide (PI) can be used to monitor for early and late apoptotic cells and/or
necrotic cells. Early apoptotic cells are positive for Annexin-V, but negative for PI. Late
apoptotic cells and necrotic cells are double positive for Annexin V and PI. Figure 22 C
shows that when Txnrd2−/− cells were treated with 5 µM BSO for 72 h, they had an increased
number of Annexin-V-positive cells, reaching almost one third of the complete cell population
(R1=30%), in comparison to Txnrd2+/+ cells in which 12% of the cells were Annexin-V
positive (R1=12%). There was also a considerable increase in Annexin-V/PI-double positive
cells among BSO-treated Txnrd2−/− cells, which was about one third of the whole cell
population (R2=29%) as compared to BSO-treated Txnrd2+/+ cells (R2=4%). Accordingly,
84% of the Txnrd2+/+ cells and only 41% of the Txnrd2−/− cells were viable at 72 h post-
treatment.
60
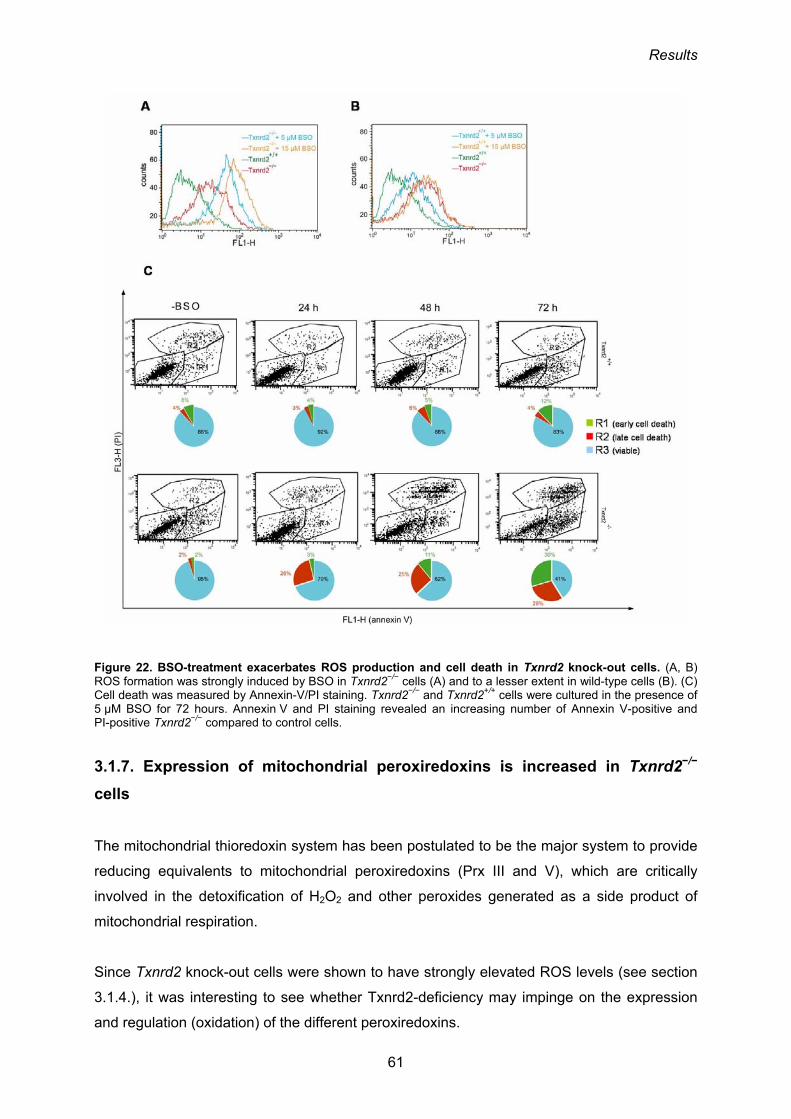
Results
Figure 22. BSO-treatment exacerbates ROS production and cell death in Txnrd2 knock-out cells. (A, B) ROS formation was strongly induced by BSO in Txnrd2−/− cells (A) and to a lesser extent in wild-type cells (B). (C) Cell death was measured by Annexin-V/PI staining. Txnrd2−/− and Txnrd2+/+ cells were cultured in the presence of 5 µM BSO for 72 hours. Annexin V and PI staining revealed an increasing number of Annexin V-positive and PI-positive Txnrd2−/− compared to control cells.
3.1.7. Expression of mitochondrial peroxiredoxins is increased in Txnrd2−/− cells
The mitochondrial thioredoxin system has been postulated to be the major system to provide
reducing equivalents to mitochondrial peroxiredoxins (Prx III and V), which are critically
involved in the detoxification of H2O2 and other peroxides generated as a side product of
mitochondrial respiration.
Since Txnrd2 knock-out cells were shown to have strongly elevated ROS levels (see section
3.1.4.), it was interesting to see whether Txnrd2-deficiency may impinge on the expression
and regulation (oxidation) of the different peroxiredoxins.
61
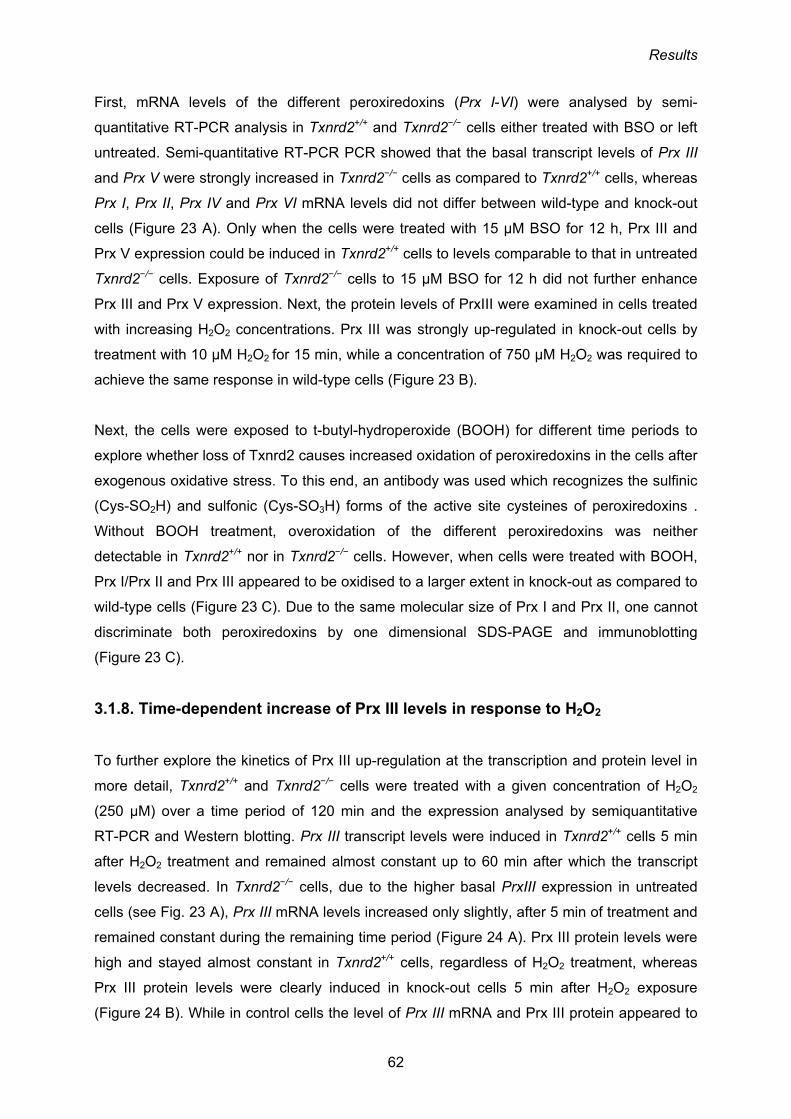
Results
First, mRNA levels of the different peroxiredoxins (Prx I-VI) were analysed by semi-
quantitative RT-PCR analysis in Txnrd2+/+ and Txnrd2−/− cells either treated with BSO or left
untreated. Semi-quantitative RT-PCR PCR showed that the basal transcript levels of Prx III
and Prx V were strongly increased in Txnrd2−/− cells as compared to Txnrd2+/+ cells, whereas
Prx I, Prx II, Prx IV and Prx VI mRNA levels did not differ between wild-type and knock-out
cells (Figure 23 A). Only when the cells were treated with 15 µM BSO for 12 h, Prx III and
Prx V expression could be induced in Txnrd2+/+ cells to levels comparable to that in untreated
Txnrd2−/− cells. Exposure of Txnrd2−/− cells to 15 µM BSO for 12 h did not further enhance
Prx III and Prx V expression. Next, the protein levels of PrxIII were examined in cells treated
with increasing H2O2 concentrations. Prx III was strongly up-regulated in knock-out cells by
treatment with 10 µM H2O2 for 15 min, while a concentration of 750 µM H2O2 was required to
achieve the same response in wild-type cells (Figure 23 B).
Next, the cells were exposed to t-butyl-hydroperoxide (BOOH) for different time periods to
explore whether loss of Txnrd2 causes increased oxidation of peroxiredoxins in the cells after
exogenous oxidative stress. To this end, an antibody was used which recognizes the sulfinic
(Cys-SO2H) and sulfonic (Cys-SO3H) forms of the active site cysteines of peroxiredoxins .
Without BOOH treatment, overoxidation of the different peroxiredoxins was neither
detectable in Txnrd2+/+ nor in Txnrd2−/− cells. However, when cells were treated with BOOH,
Prx I/Prx II and Prx III appeared to be oxidised to a larger extent in knock-out as compared to
wild-type cells (Figure 23 C). Due to the same molecular size of Prx I and Prx II, one cannot
discriminate both peroxiredoxins by one dimensional SDS-PAGE and immunoblotting
(Figure 23 C).
3.1.8. Time-dependent increase of Prx III levels in response to H2O2
To further explore the kinetics of Prx III up-regulation at the transcription and protein level in
more detail, Txnrd2+/+ and Txnrd2−/− cells were treated with a given concentration of H2O2
(250 µM) over a time period of 120 min and the expression analysed by semiquantitative
RT-PCR and Western blotting. Prx III transcript levels were induced in Txnrd2+/+ cells 5 min
after H2O2 treatment and remained almost constant up to 60 min after which the transcript
levels decreased. In Txnrd2−/− cells, due to the higher basal PrxIII expression in untreated
cells (see Fig. 23 A), Prx III mRNA levels increased only slightly, after 5 min of treatment and
remained constant during the remaining time period (Figure 24 A). Prx III protein levels were
high and stayed almost constant in Txnrd2+/+ cells, regardless of H2O2 treatment, whereas
Prx III protein levels were clearly induced in knock-out cells 5 min after H2O2 exposure
(Figure 24 B). While in control cells the level of Prx III mRNA and Prx III protein appeared to
62
Results
decrease 60 min after treatment, in knock-out cells both mRNA and protein levels were
increased irrespective of H2O2 treatment (see Figure 23 A and 24 B).
Figure 23. Mitochondrial Prx III and Prx V are strongly up-regulated in Txnrd2 knock-out cells. (A) Semi-quantitative RT-PCR analysis showed that Prx III and Prx V are strongly up-regulated in Txnrd2-/- cells in a manner similar to wild-type cells treated with 15 µM BSO for 12 hours. Treatment of Txnrd2-/- cells with BSO did not further induce Prx III and Prx V expression. 18s rRNA served as control. (B) Treatment of Txnrd2+/+ and Txnrd2−/− fibroblasts with increasing H2O2 concentrations (0.01, 0.05, 0.1, 0.25, 0.5, 0.75 and 1 mM) for 15 min strongly induced Prx III protein levels in Txnrd2−/− fibroblasts at very low concentrations. (C) Txnrd2+/+ and Txnrd2−/− cells were treated with 500 µM t-butyl-hydroperoxide for 10 and 60 min. Immunoblot analysis with a sulfinylation/sulfonylation-specific antibody (Prx-SO3) revealed overoxidation of Prx I/Prx II and Prx III, which appeared to be stronger in Txnrd2-/- than in Txnrd2+/+ wild-type cells.
Reduction of the sulfinic acid in the active site cysteine of peroxiredoxins, formed under
prolonged exposure to oxidants, was shown to require sulfiredoxin (Srx) (Biteau et al., 2003;
Bondareva et al., 2007; Jeong et al., 2006; Jonsson et al., 2008; Lim et al., 2008; Rhee et al.,
2007; Roussel et al., 2008). It was thus hypothesised that the level of Srx might be elevated
in the knock-out cells at high H2O2 concentration. Indeed, when the cells were treated for
different time intervals with H2O2, Srx transcript levels were higher in Txnrd2−/− than in control
cells, while the Srx mRNA levels in the Txnrd2+/+ control cells were not affected
(Figure 24 A).
63
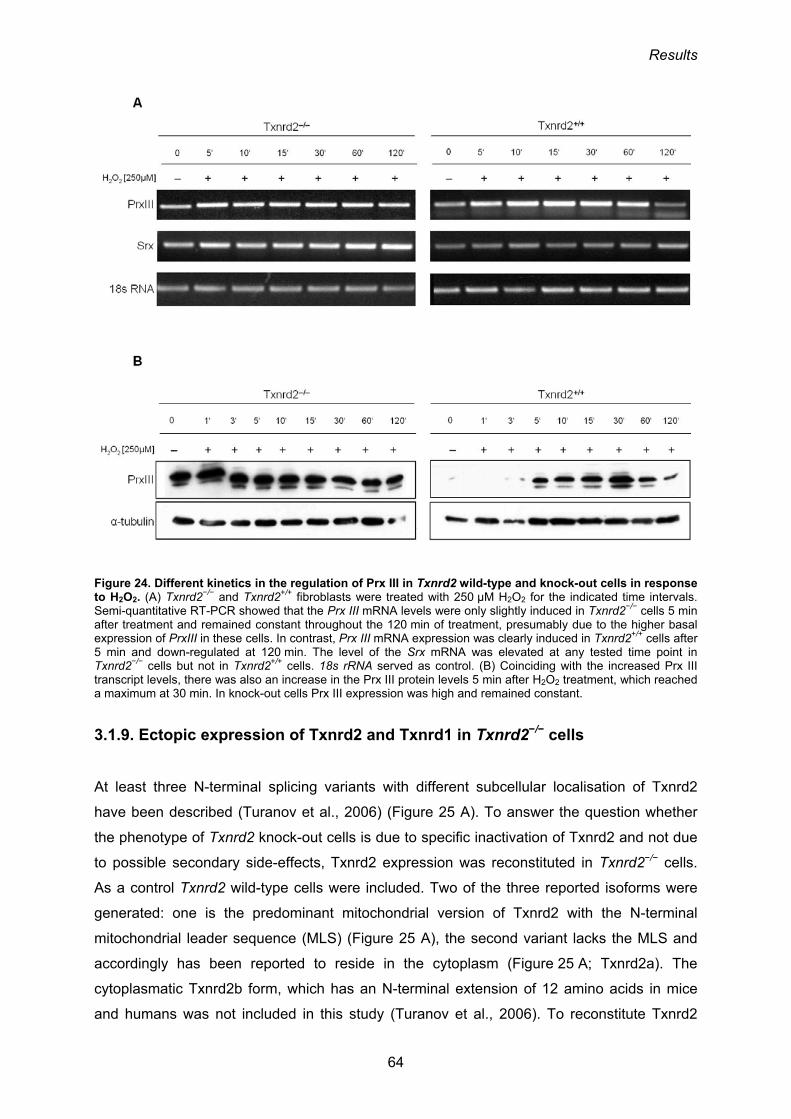
Results
Figure 24. Different kinetics in the regulation of Prx III in Txnrd2 wild-type and knock-out cells in response to H2O2. (A) Txnrd2−/− and Txnrd2+/+ fibroblasts were treated with 250 µM H2O2 for the indicated time intervals. Semi-quantitative RT-PCR showed that the Prx III mRNA levels were only slightly induced in Txnrd2−/− cells 5 min after treatment and remained constant throughout the 120 min of treatment, presumably due to the higher basal expression of PrxIII in these cells. In contrast, Prx III mRNA expression was clearly induced in Txnrd2+/+ cells after 5 min and down-regulated at 120 min. The level of the Srx mRNA was elevated at any tested time point in Txnrd2−/− cells but not in Txnrd2+/+ cells. 18s rRNA served as control. (B) Coinciding with the increased Prx III transcript levels, there was also an increase in the Prx III protein levels 5 min after H2O2 treatment, which reached a maximum at 30 min. In knock-out cells Prx III expression was high and remained constant.
3.1.9. Ectopic expression of Txnrd2 and Txnrd1 in Txnrd2−/− cells
At least three N-terminal splicing variants with different subcellular localisation of Txnrd2
have been described (Turanov et al., 2006) (Figure 25 A). To answer the question whether
the phenotype of Txnrd2 knock-out cells is due to specific inactivation of Txnrd2 and not due
to possible secondary side-effects, Txnrd2 expression was reconstituted in Txnrd2−/− cells.
As a control Txnrd2 wild-type cells were included. Two of the three reported isoforms were
generated: one is the predominant mitochondrial version of Txnrd2 with the N-terminal
mitochondrial leader sequence (MLS) (Figure 25 A), the second variant lacks the MLS and
accordingly has been reported to reside in the cytoplasm (Figure 25 A; Txnrd2a). The
cytoplasmatic Txnrd2b form, which has an N-terminal extension of 12 amino acids in mice
and humans was not included in this study (Turanov et al., 2006). To reconstitute Txnrd2
64
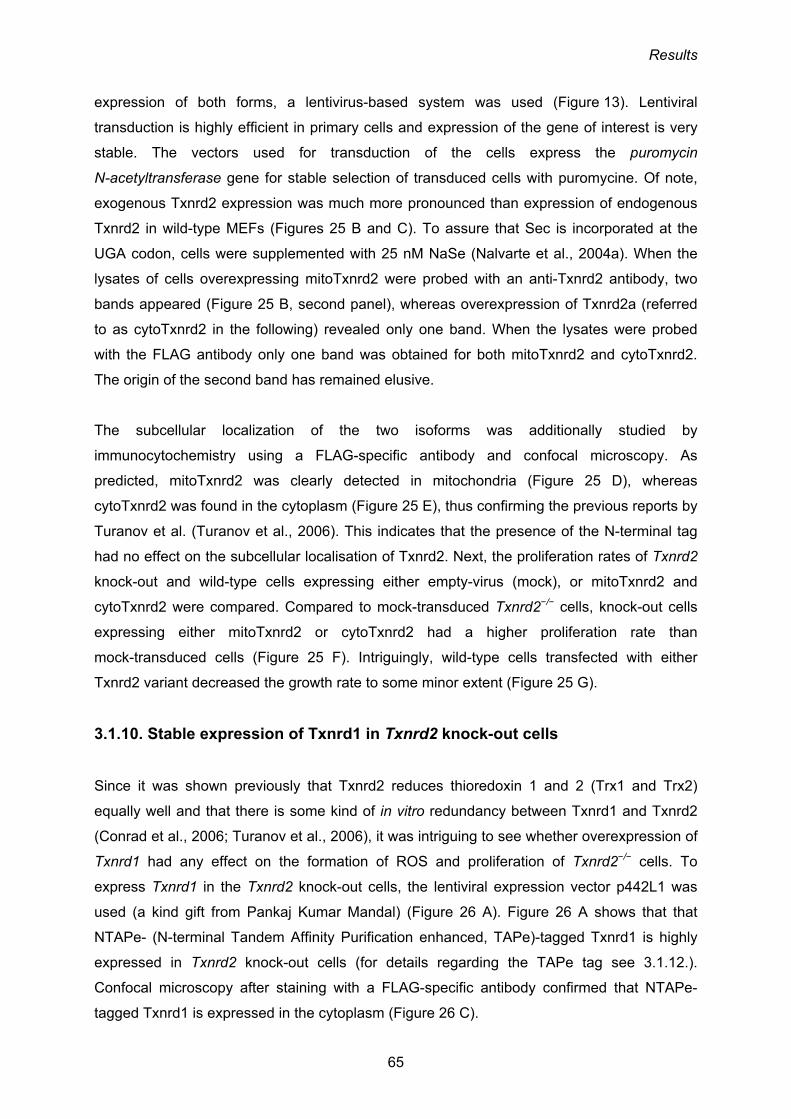
Results
expression of both forms, a lentivirus-based system was used (Figure 13). Lentiviral
transduction is highly efficient in primary cells and expression of the gene of interest is very
stable. The vectors used for transduction of the cells express the puromycin
N-acetyltransferase gene for stable selection of transduced cells with puromycine. Of note,
exogenous Txnrd2 expression was much more pronounced than expression of endogenous
Txnrd2 in wild-type MEFs (Figures 25 B and C). To assure that Sec is incorporated at the
UGA codon, cells were supplemented with 25 nM NaSe (Nalvarte et al., 2004a). When the
lysates of cells overexpressing mitoTxnrd2 were probed with an anti-Txnrd2 antibody, two
bands appeared (Figure 25 B, second panel), whereas overexpression of Txnrd2a (referred
to as cytoTxnrd2 in the following) revealed only one band. When the lysates were probed
with the FLAG antibody only one band was obtained for both mitoTxnrd2 and cytoTxnrd2.
The origin of the second band has remained elusive.
The subcellular localization of the two isoforms was additionally studied by
immunocytochemistry using a FLAG-specific antibody and confocal microscopy. As
predicted, mitoTxnrd2 was clearly detected in mitochondria (Figure 25 D), whereas
cytoTxnrd2 was found in the cytoplasm (Figure 25 E), thus confirming the previous reports by
Turanov et al. (Turanov et al., 2006). This indicates that the presence of the N-terminal tag
had no effect on the subcellular localisation of Txnrd2. Next, the proliferation rates of Txnrd2
knock-out and wild-type cells expressing either empty-virus (mock), or mitoTxnrd2 and
cytoTxnrd2 were compared. Compared to mock-transduced Txnrd2−/− cells, knock-out cells
expressing either mitoTxnrd2 or cytoTxnrd2 had a higher proliferation rate than
mock-transduced cells (Figure 25 F). Intriguingly, wild-type cells transfected with either
Txnrd2 variant decreased the growth rate to some minor extent (Figure 25 G).
3.1.10. Stable expression of Txnrd1 in Txnrd2 knock-out cells
Since it was shown previously that Txnrd2 reduces thioredoxin 1 and 2 (Trx1 and Trx2)
equally well and that there is some kind of in vitro redundancy between Txnrd1 and Txnrd2
(Conrad et al., 2006; Turanov et al., 2006), it was intriguing to see whether overexpression of
Txnrd1 had any effect on the formation of ROS and proliferation of Txnrd2−/− cells. To
express Txnrd1 in the Txnrd2 knock-out cells, the lentiviral expression vector p442L1 was
used (a kind gift from Pankaj Kumar Mandal) (Figure 26 A). Figure 26 A shows that that
NTAPe- (N-terminal Tandem Affinity Purification enhanced, TAPe)-tagged Txnrd1 is highly
expressed in Txnrd2 knock-out cells (for details regarding the TAPe tag see 3.1.12.).
Confocal microscopy after staining with a FLAG-specific antibody confirmed that NTAPe-
tagged Txnrd1 is expressed in the cytoplasm (Figure 26 C).
65
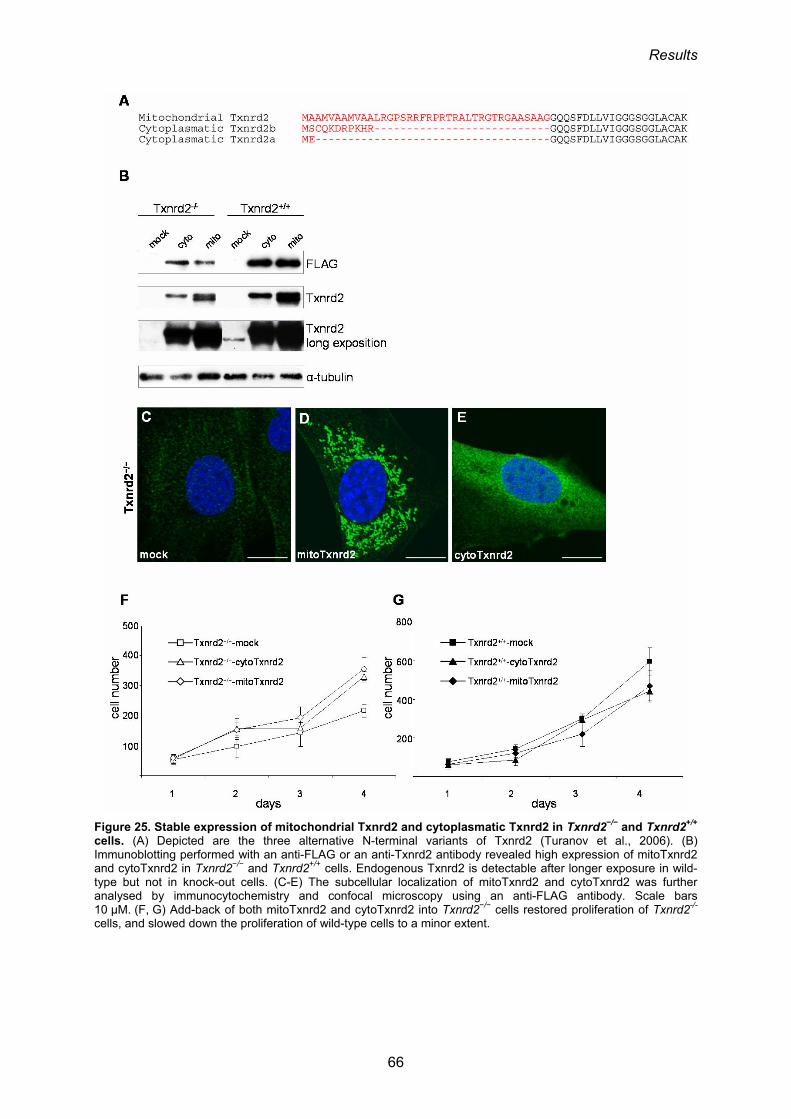
Results
Figure 25. Stable expression of mitochondrial Txnrd2 and cytoplasmatic Txnrd2 in Txnrd2−/− and Txnrd2+/+ cells. (A) Depicted are the three alternative N-terminal variants of Txnrd2 (Turanov et al., 2006). (B) Immunoblotting performed with an anti-FLAG or an anti-Txnrd2 antibody revealed high expression of mitoTxnrd2 and cytoTxnrd2 in Txnrd2−/− and Txnrd2+/+ cells. Endogenous Txnrd2 is detectable after longer exposure in wild-type but not in knock-out cells. (C-E) The subcellular localization of mitoTxnrd2 and cytoTxnrd2 was further analysed by immunocytochemistry and confocal microscopy using an anti-FLAG antibody. Scale bars 10 µM. (F, G) Add-back of both mitoTxnrd2 and cytoTxnrd2 into Txnrd2−/− cells restored proliferation of Txnrd2-/- cells, and slowed down the proliferation of wild-type cells to a minor extent.
66
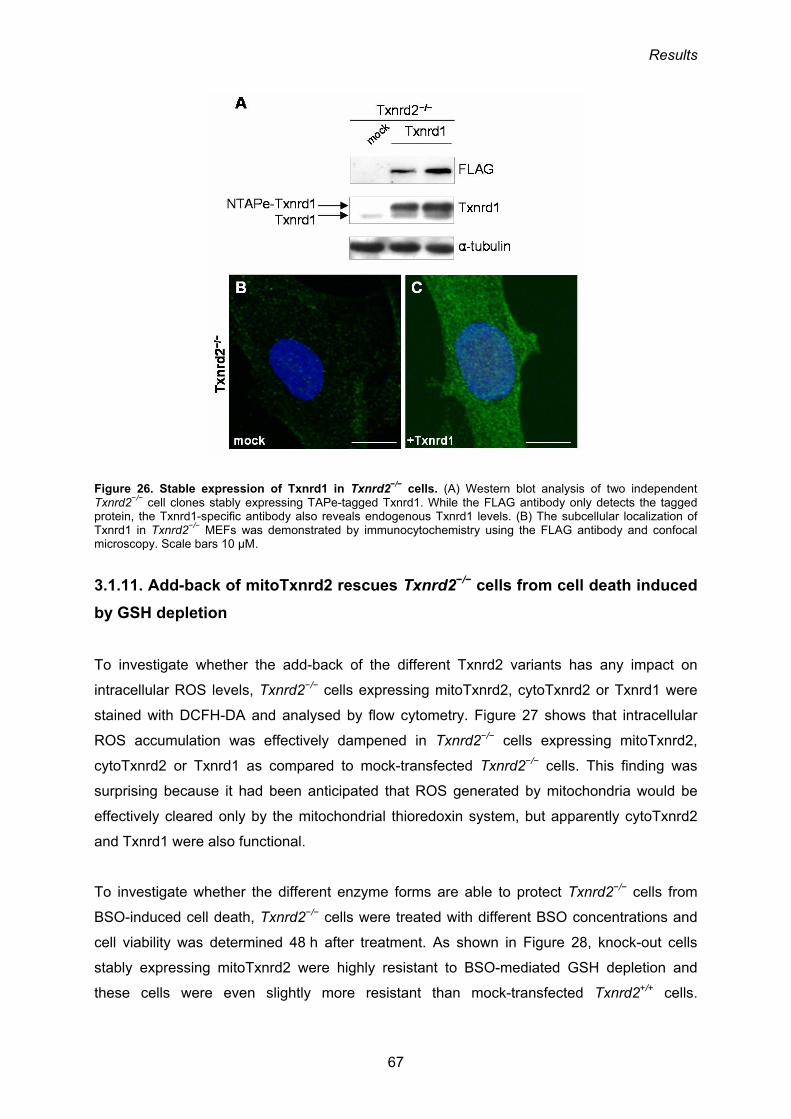
Results
Figure 26. Stable expression of Txnrd1 in Txnrd2−/− cells. (A) Western blot analysis of two independent Txnrd2−/− cell clones stably expressing TAPe-tagged Txnrd1. While the FLAG antibody only detects the tagged protein, the Txnrd1-specific antibody also reveals endogenous Txnrd1 levels. (B) The subcellular localization of Txnrd1 in Txnrd2−/− MEFs was demonstrated by immunocytochemistry using the FLAG antibody and confocal microscopy. Scale bars 10 µM.
3.1.11. Add-back of mitoTxnrd2 rescues Txnrd2−/− cells from cell death induced by GSH depletion
To investigate whether the add-back of the different Txnrd2 variants has any impact on
intracellular ROS levels, Txnrd2−/− cells expressing mitoTxnrd2, cytoTxnrd2 or Txnrd1 were
stained with DCFH-DA and analysed by flow cytometry. Figure 27 shows that intracellular
ROS accumulation was effectively dampened in Txnrd2−/− cells expressing mitoTxnrd2,
cytoTxnrd2 or Txnrd1 as compared to mock-transfected Txnrd2−/− cells. This finding was
surprising because it had been anticipated that ROS generated by mitochondria would be
effectively cleared only by the mitochondrial thioredoxin system, but apparently cytoTxnrd2
and Txnrd1 were also functional.
To investigate whether the different enzyme forms are able to protect Txnrd2−/− cells from
BSO-induced cell death, Txnrd2−/− cells were treated with different BSO concentrations and
cell viability was determined 48 h after treatment. As shown in Figure 28, knock-out cells
stably expressing mitoTxnrd2 were highly resistant to BSO-mediated GSH depletion and
these cells were even slightly more resistant than mock-transfected Txnrd2+/+ cells.
67
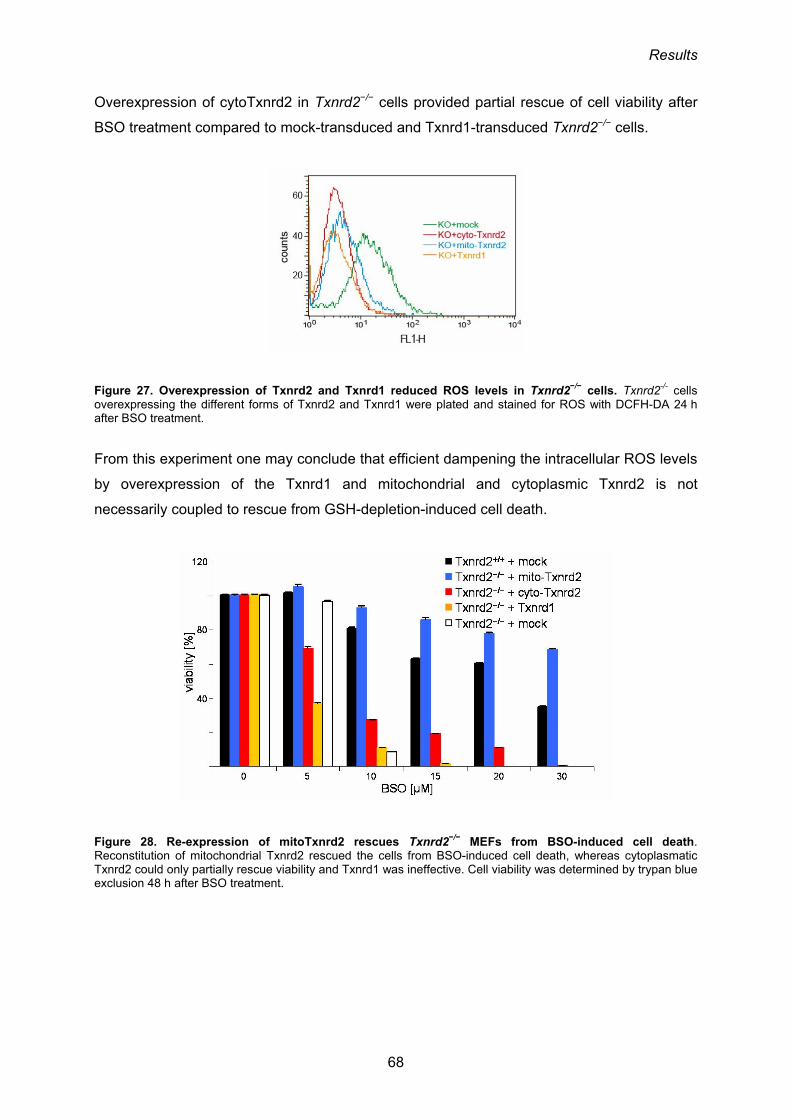
Results
Overexpression of cytoTxnrd2 in Txnrd2−/− cells provided partial rescue of cell viability after
BSO treatment compared to mock-transduced and Txnrd1-transduced Txnrd2−/− cells.
Figure 27. Overexpression of Txnrd2 and Txnrd1 reduced ROS levels in Txnrd2−/− cells. Txnrd2-/- cells overexpressing the different forms of Txnrd2 and Txnrd1 were plated and stained for ROS with DCFH-DA 24 h after BSO treatment.
From this experiment one may conclude that efficient dampening the intracellular ROS levels
by overexpression of the Txnrd1 and mitochondrial and cytoplasmic Txnrd2 is not
necessarily coupled to rescue from GSH-depletion-induced cell death.
Figure 28. Re-expression of mitoTxnrd2 rescues Txnrd2−/− MEFs from BSO-induced cell death. Reconstitution of mitochondrial Txnrd2 rescued the cells from BSO-induced cell death, whereas cytoplasmatic Txnrd2 could only partially rescue viability and Txnrd1 was ineffective. Cell viability was determined by trypan blue exclusion 48 h after BSO treatment.
68
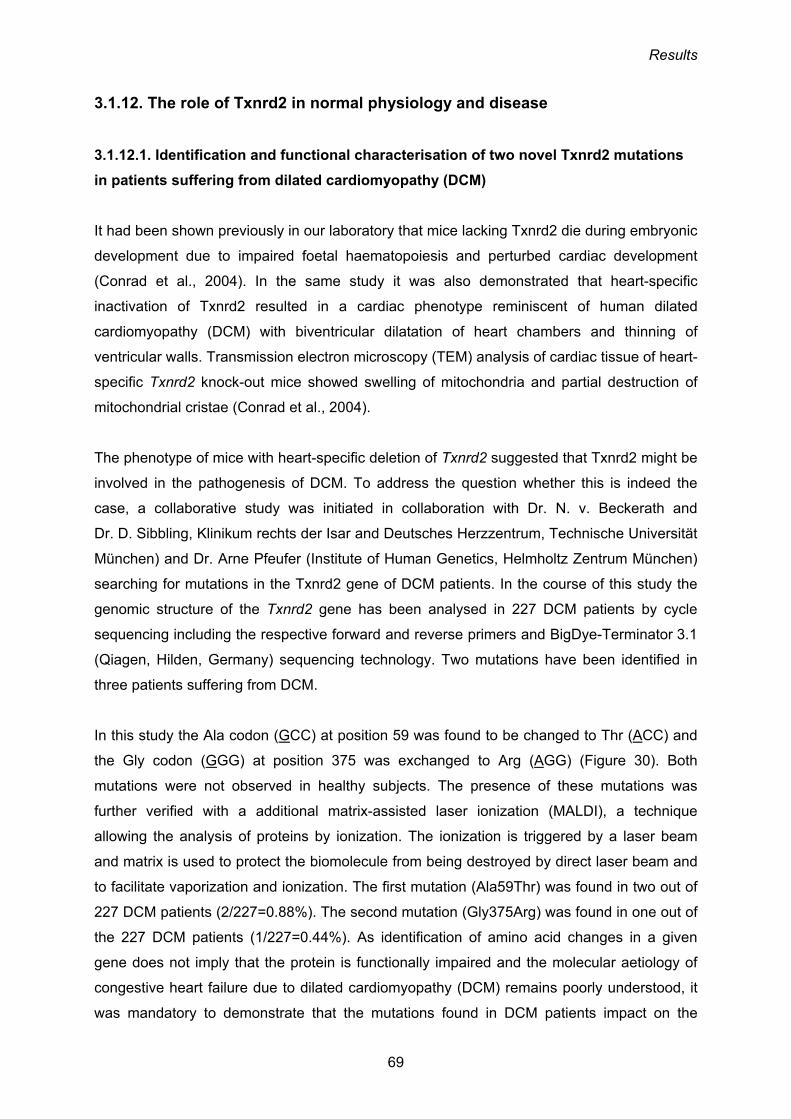
Results
3.1.12. The role of Txnrd2 in normal physiology and disease
3.1.12.1. Identification and functional characterisation of two novel Txnrd2 mutations in patients suffering from dilated cardiomyopathy (DCM)
It had been shown previously in our laboratory that mice lacking Txnrd2 die during embryonic
development due to impaired foetal haematopoiesis and perturbed cardiac development
(Conrad et al., 2004). In the same study it was also demonstrated that heart-specific
inactivation of Txnrd2 resulted in a cardiac phenotype reminiscent of human dilated
cardiomyopathy (DCM) with biventricular dilatation of heart chambers and thinning of
ventricular walls. Transmission electron microscopy (TEM) analysis of cardiac tissue of heart-
specific Txnrd2 knock-out mice showed swelling of mitochondria and partial destruction of
mitochondrial cristae (Conrad et al., 2004).
The phenotype of mice with heart-specific deletion of Txnrd2 suggested that Txnrd2 might be
involved in the pathogenesis of DCM. To address the question whether this is indeed the
case, a collaborative study was initiated in collaboration with Dr. N. v. Beckerath and
Dr. D. Sibbling, Klinikum rechts der Isar and Deutsches Herzzentrum, Technische Universität
München) and Dr. Arne Pfeufer (Institute of Human Genetics, Helmholtz Zentrum München)
searching for mutations in the Txnrd2 gene of DCM patients. In the course of this study the
genomic structure of the Txnrd2 gene has been analysed in 227 DCM patients by cycle
sequencing including the respective forward and reverse primers and BigDye-Terminator 3.1
(Qiagen, Hilden, Germany) sequencing technology. Two mutations have been identified in
three patients suffering from DCM.
In this study the Ala codon (GCC) at position 59 was found to be changed to Thr (ACC) and
the Gly codon (GGG) at position 375 was exchanged to Arg (AGG) (Figure 30). Both
mutations were not observed in healthy subjects. The presence of these mutations was
further verified with a additional matrix-assisted laser ionization (MALDI), a technique
allowing the analysis of proteins by ionization. The ionization is triggered by a laser beam
and matrix is used to protect the biomolecule from being destroyed by direct laser beam and
to facilitate vaporization and ionization. The first mutation (Ala59Thr) was found in two out of
227 DCM patients (2/227=0.88%). The second mutation (Gly375Arg) was found in one out of
the 227 DCM patients (1/227=0.44%). As identification of amino acid changes in a given
gene does not imply that the protein is functionally impaired and the molecular aetiology of
congestive heart failure due to dilated cardiomyopathy (DCM) remains poorly understood, it
was mandatory to demonstrate that the mutations found in DCM patients impact on the
69
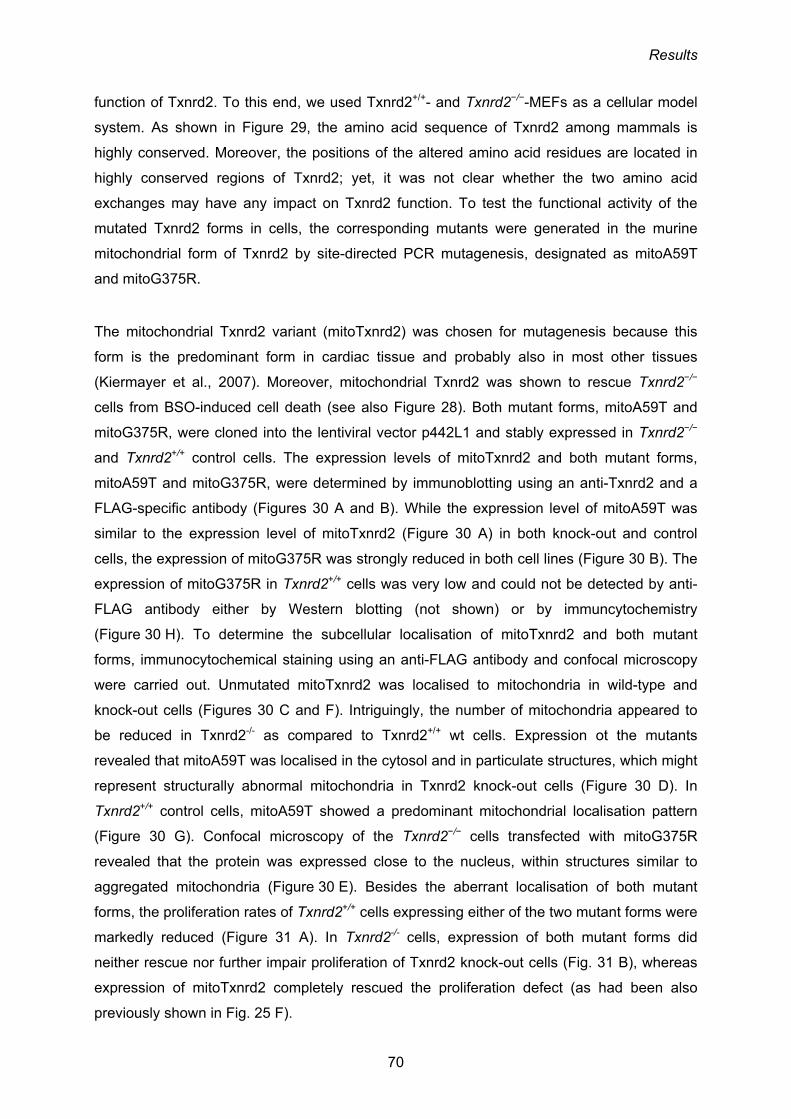
Results
function of Txnrd2. To this end, we used Txnrd2+/+- and Txnrd2−/−-MEFs as a cellular model
system. As shown in Figure 29, the amino acid sequence of Txnrd2 among mammals is
highly conserved. Moreover, the positions of the altered amino acid residues are located in
highly conserved regions of Txnrd2; yet, it was not clear whether the two amino acid
exchanges may have any impact on Txnrd2 function. To test the functional activity of the
mutated Txnrd2 forms in cells, the corresponding mutants were generated in the murine
mitochondrial form of Txnrd2 by site-directed PCR mutagenesis, designated as mitoA59T
and mitoG375R.
The mitochondrial Txnrd2 variant (mitoTxnrd2) was chosen for mutagenesis because this
form is the predominant form in cardiac tissue and probably also in most other tissues
(Kiermayer et al., 2007). Moreover, mitochondrial Txnrd2 was shown to rescue Txnrd2−/−
cells from BSO-induced cell death (see also Figure 28). Both mutant forms, mitoA59T and
mitoG375R, were cloned into the lentiviral vector p442L1 and stably expressed in Txnrd2−/−
and Txnrd2+/+ control cells. The expression levels of mitoTxnrd2 and both mutant forms,
mitoA59T and mitoG375R, were determined by immunoblotting using an anti-Txnrd2 and a
FLAG-specific antibody (Figures 30 A and B). While the expression level of mitoA59T was
similar to the expression level of mitoTxnrd2 (Figure 30 A) in both knock-out and control
cells, the expression of mitoG375R was strongly reduced in both cell lines (Figure 30 B). The
expression of mitoG375R in Txnrd2+/+ cells was very low and could not be detected by anti-
FLAG antibody either by Western blotting (not shown) or by immuncytochemistry
(Figure 30 H). To determine the subcellular localisation of mitoTxnrd2 and both mutant
forms, immunocytochemical staining using an anti-FLAG antibody and confocal microscopy
were carried out. Unmutated mitoTxnrd2 was localised to mitochondria in wild-type and
knock-out cells (Figures 30 C and F). Intriguingly, the number of mitochondria appeared to
be reduced in Txnrd2-/- as compared to Txnrd2+/+ wt cells. Expression ot the mutants
revealed that mitoA59T was localised in the cytosol and in particulate structures, which might
represent structurally abnormal mitochondria in Txnrd2 knock-out cells (Figure 30 D). In
Txnrd2+/+ control cells, mitoA59T showed a predominant mitochondrial localisation pattern
(Figure 30 G). Confocal microscopy of the Txnrd2−/− cells transfected with mitoG375R
revealed that the protein was expressed close to the nucleus, within structures similar to
aggregated mitochondria (Figure 30 E). Besides the aberrant localisation of both mutant
forms, the proliferation rates of Txnrd2+/+ cells expressing either of the two mutant forms were
markedly reduced (Figure 31 A). In Txnrd2-/- cells, expression of both mutant forms did
neither rescue nor further impair proliferation of Txnrd2 knock-out cells (Fig. 31 B), whereas
expression of mitoTxnrd2 completely rescued the proliferation defect (as had been also
previously shown in Fig. 25 F).
70
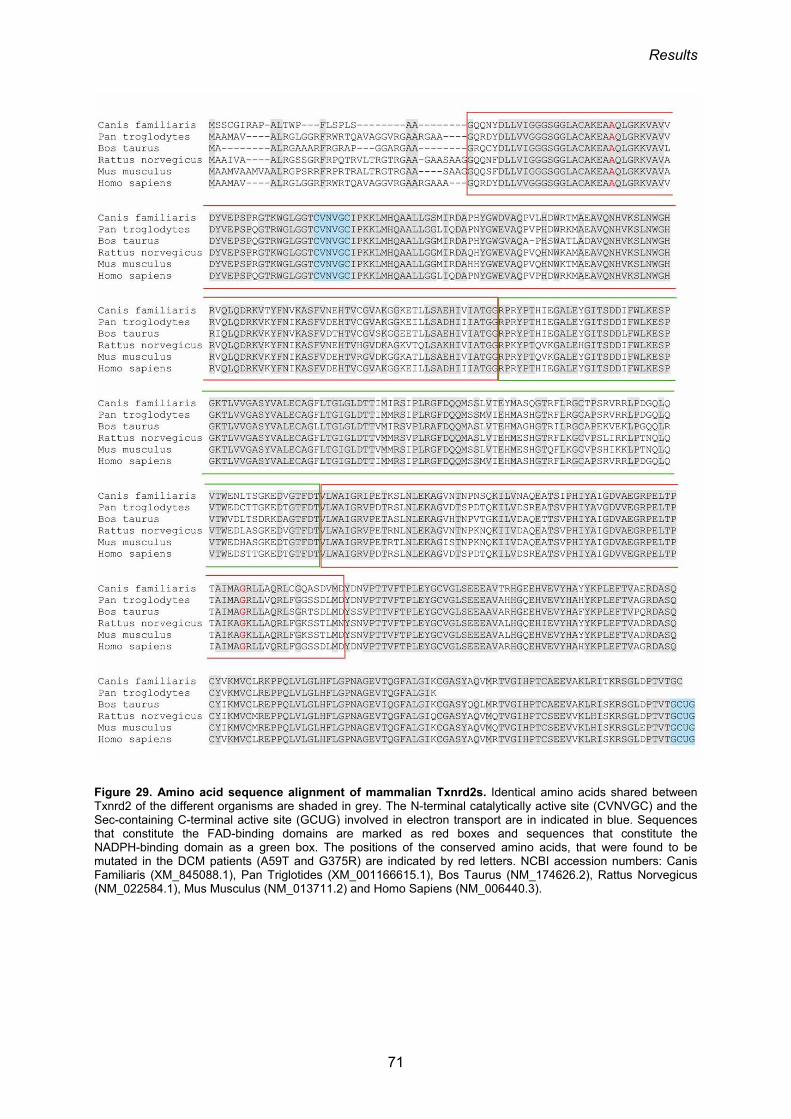
Results
Figure 29. Amino acid sequence alignment of mammalian Txnrd2s. Identical amino acids shared between Txnrd2 of the different organisms are shaded in grey. The N-terminal catalytically active site (CVNVGC) and the Sec-containing C-terminal active site (GCUG) involved in electron transport are in indicated in blue. Sequences that constitute the FAD-binding domains are marked as red boxes and sequences that constitute the NADPH-binding domain as a green box. The positions of the conserved amino acids, that were found to be mutated in the DCM patients (A59T and G375R) are indicated by red letters. NCBI accession numbers: Canis Familiaris (XM_845088.1), Pan Triglotides (XM_001166615.1), Bos Taurus (NM_174626.2), Rattus Norvegicus (NM_022584.1), Mus Musculus (NM_013711.2) and Homo Sapiens (NM_006440.3).
71
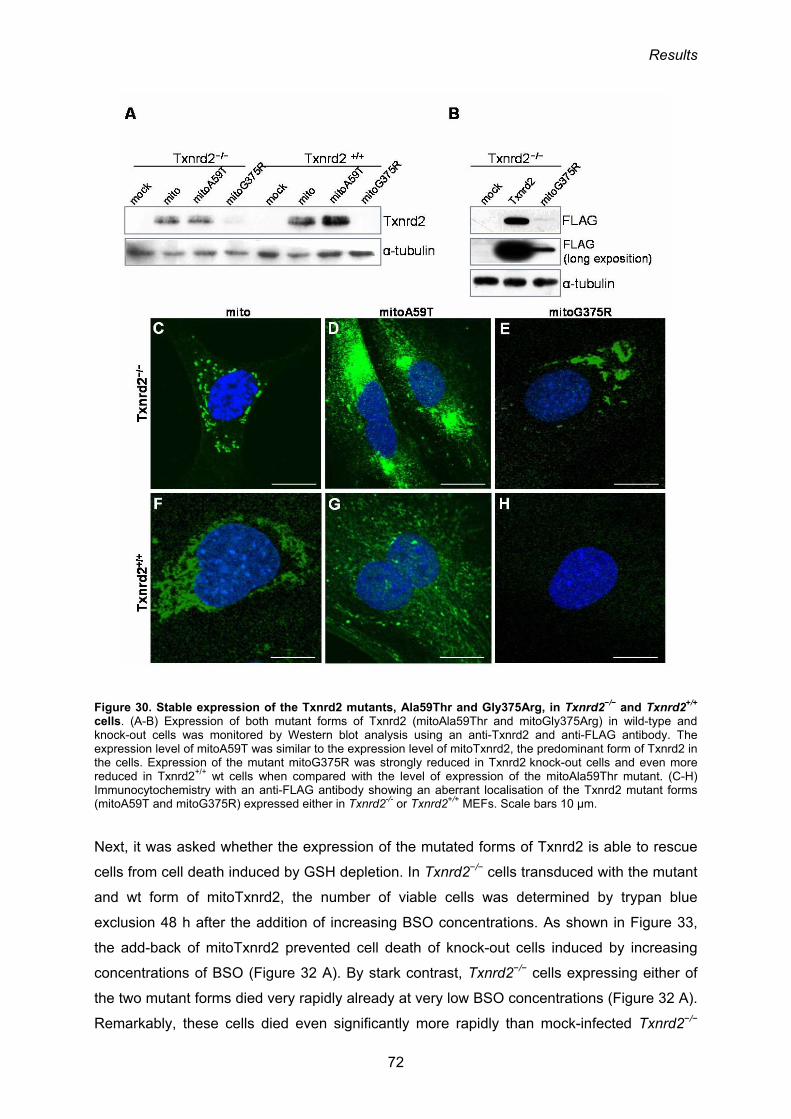
Results
Figure 30. Stable expression of the Txnrd2 mutants, Ala59Thr and Gly375Arg, in Txnrd2−/− and Txnrd2+/+ cells. (A-B) Expression of both mutant forms of Txnrd2 (mitoAla59Thr and mitoGly375Arg) in wild-type and knock-out cells was monitored by Western blot analysis using an anti-Txnrd2 and anti-FLAG antibody. The expression level of mitoA59T was similar to the expression level of mitoTxnrd2, the predominant form of Txnrd2 in the cells. Expression of the mutant mitoG375R was strongly reduced in Txnrd2 knock-out cells and even more reduced in Txnrd2+/+ wt cells when compared with the level of expression of the mitoAla59Thr mutant. (C-H) Immunocytochemistry with an anti-FLAG antibody showing an aberrant localisation of the Txnrd2 mutant forms (mitoA59T and mitoG375R) expressed either in Txnrd2-/- or Txnrd2+/+ MEFs. Scale bars 10 µm. Next, it was asked whether the expression of the mutated forms of Txnrd2 is able to rescue
cells from cell death induced by GSH depletion. In Txnrd2−/− cells transduced with the mutant
and wt form of mitoTxnrd2, the number of viable cells was determined by trypan blue
exclusion 48 h after the addition of increasing BSO concentrations. As shown in Figure 33,
the add-back of mitoTxnrd2 prevented cell death of knock-out cells induced by increasing
concentrations of BSO (Figure 32 A). By stark contrast, Txnrd2−/− cells expressing either of
the two mutant forms died very rapidly already at very low BSO concentrations (Figure 32 A).
Remarkably, these cells died even significantly more rapidly than mock-infected Txnrd2−/−
72
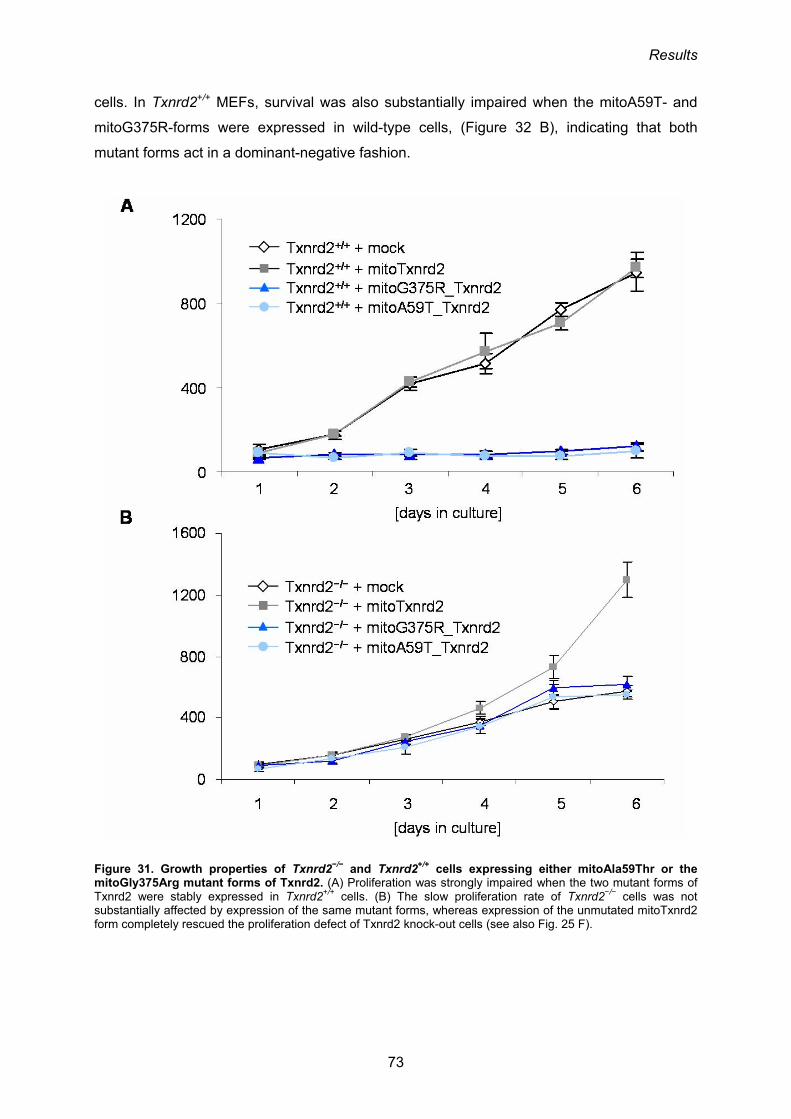
Results
cells. In Txnrd2+/+ MEFs, survival was also substantially impaired when the mitoA59T- and
mitoG375R-forms were expressed in wild-type cells, (Figure 32 B), indicating that both
mutant forms act in a dominant-negative fashion.
Figure 31. Growth properties of Txnrd2−/− and Txnrd2+/+ cells expressing either mitoAla59Thr or the mitoGly375Arg mutant forms of Txnrd2. (A) Proliferation was strongly impaired when the two mutant forms of Txnrd2 were stably expressed in Txnrd2+/+ cells. (B) The slow proliferation rate of Txnrd2−/− cells was not substantially affected by expression of the same mutant forms, whereas expression of the unmutated mitoTxnrd2 form completely rescued the proliferation defect of Txnrd2 knock-out cells (see also Fig. 25 F).
73
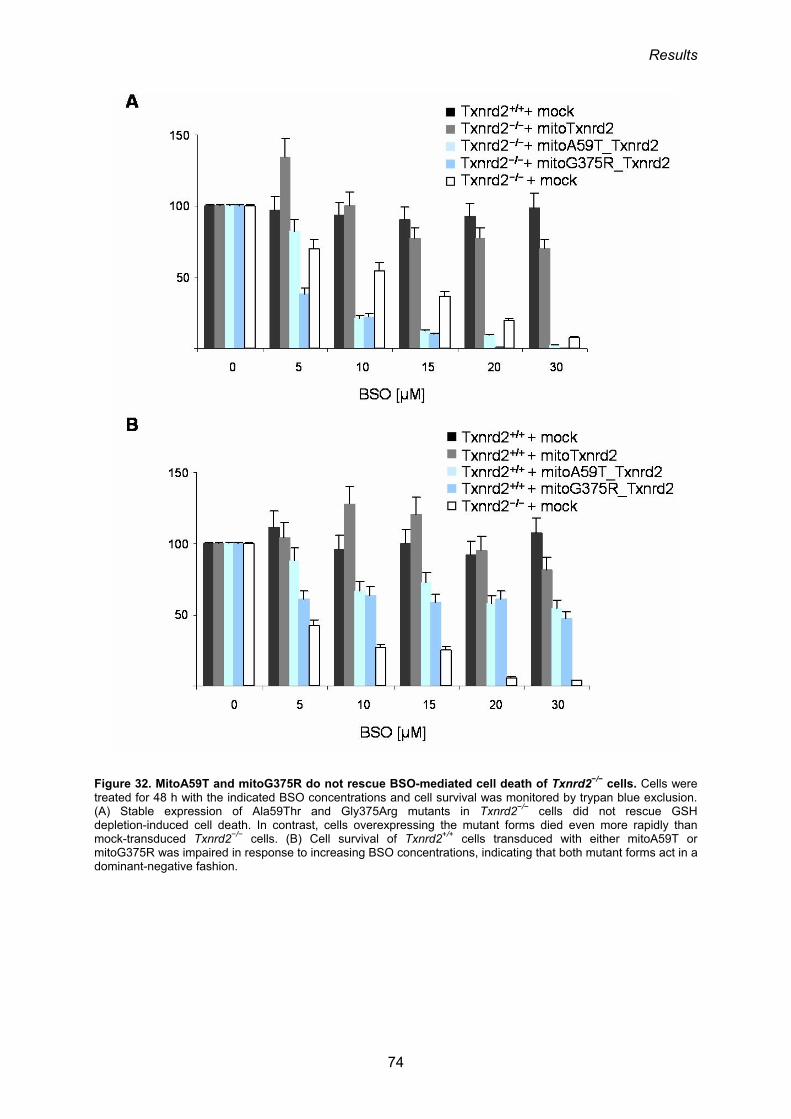
Results
Figure 32. MitoA59T and mitoG375R do not rescue BSO-mediated cell death of Txnrd2−/− cells. Cells were treated for 48 h with the indicated BSO concentrations and cell survival was monitored by trypan blue exclusion. (A) Stable expression of Ala59Thr and Gly375Arg mutants in Txnrd2−/− cells did not rescue GSH depletion-induced cell death. In contrast, cells overexpressing the mutant forms died even more rapidly than mock-transduced Txnrd2−/− cells. (B) Cell survival of Txnrd2+/+ cells transduced with either mitoA59T or mitoG375R was impaired in response to increasing BSO concentrations, indicating that both mutant forms act in a dominant-negative fashion.
74
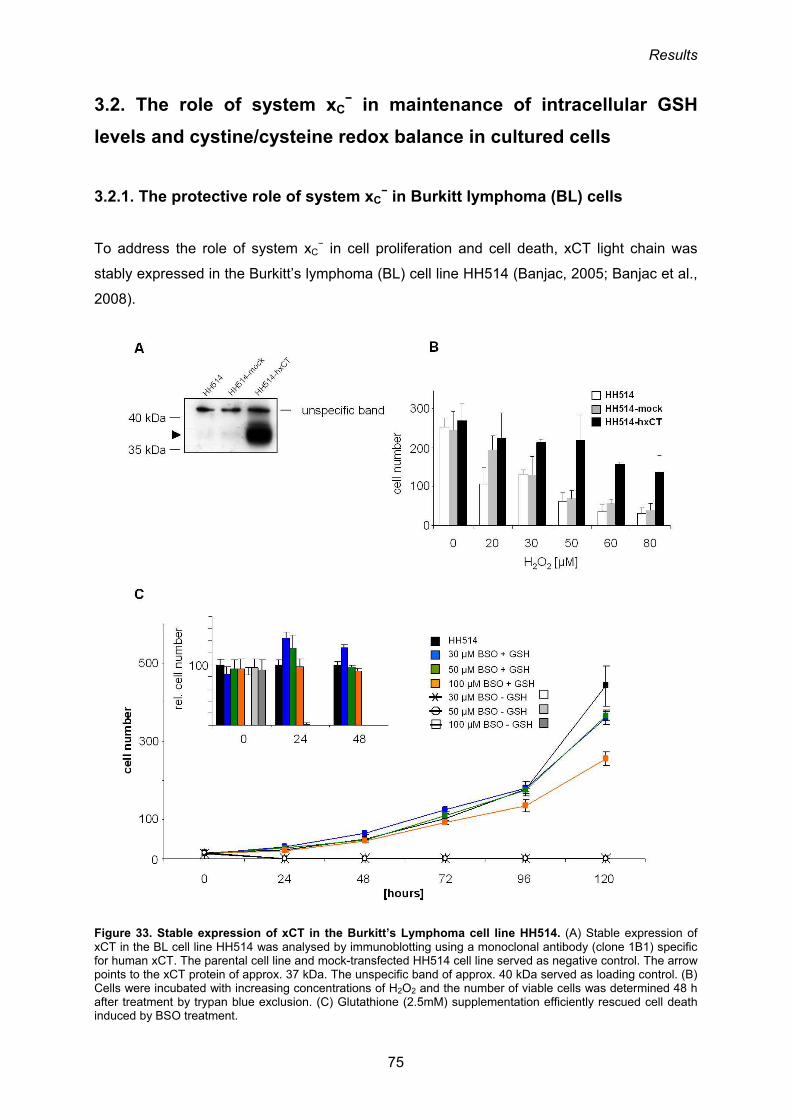
Results
3.2. The role of system xC− in maintenance of intracellular GSH
levels and cystine/cysteine redox balance in cultured cells
3.2.1. The protective role of system xC− in Burkitt lymphoma (BL) cells
To address the role of system xC− in cell proliferation and cell death, xCT light chain was
stably expressed in the Burkitt’s lymphoma (BL) cell line HH514 (Banjac, 2005; Banjac et al.,
2008).
Figure 33. Stable expression of xCT in the Burkitt’s Lymphoma cell line HH514. (A) Stable expression of xCT in the BL cell line HH514 was analysed by immunoblotting using a monoclonal antibody (clone 1B1) specific for human xCT. The parental cell line and mock-transfected HH514 cell line served as negative control. The arrow points to the xCT protein of approx. 37 kDa. The unspecific band of approx. 40 kDa served as loading control. (B) Cells were incubated with increasing concentrations of H2O2 and the number of viable cells was determined 48 h after treatment by trypan blue exclusion. (C) Glutathione (2.5mM) supplementation efficiently rescued cell death induced by BSO treatment.
75
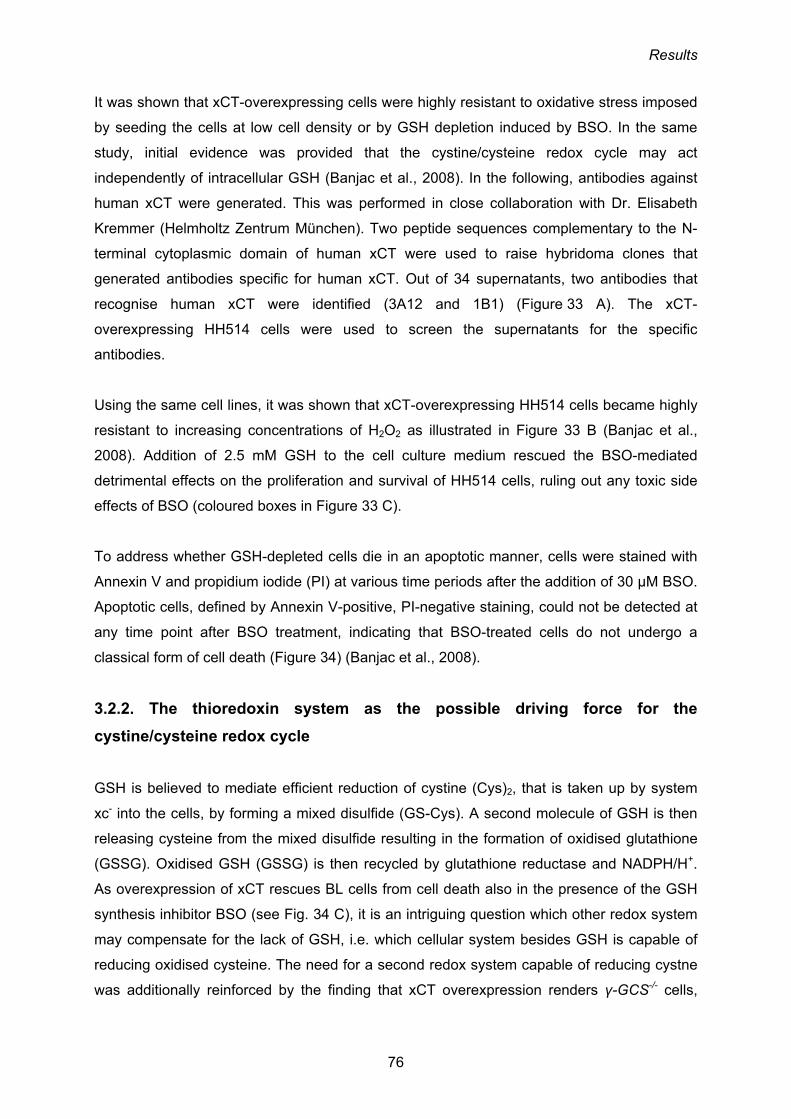
Results
It was shown that xCT-overexpressing cells were highly resistant to oxidative stress imposed
by seeding the cells at low cell density or by GSH depletion induced by BSO. In the same
study, initial evidence was provided that the cystine/cysteine redox cycle may act
independently of intracellular GSH (Banjac et al., 2008). In the following, antibodies against
human xCT were generated. This was performed in close collaboration with Dr. Elisabeth
Kremmer (Helmholtz Zentrum München). Two peptide sequences complementary to the N-
terminal cytoplasmic domain of human xCT were used to raise hybridoma clones that
generated antibodies specific for human xCT. Out of 34 supernatants, two antibodies that
recognise human xCT were identified (3A12 and 1B1) (Figure 33 A). The xCT-
overexpressing HH514 cells were used to screen the supernatants for the specific
antibodies.
Using the same cell lines, it was shown that xCT-overexpressing HH514 cells became highly
resistant to increasing concentrations of H2O2 as illustrated in Figure 33 B (Banjac et al.,
2008). Addition of 2.5 mM GSH to the cell culture medium rescued the BSO-mediated
detrimental effects on the proliferation and survival of HH514 cells, ruling out any toxic side
effects of BSO (coloured boxes in Figure 33 C).
To address whether GSH-depleted cells die in an apoptotic manner, cells were stained with
Annexin V and propidium iodide (PI) at various time periods after the addition of 30 µM BSO.
Apoptotic cells, defined by Annexin V-positive, PI-negative staining, could not be detected at
any time point after BSO treatment, indicating that BSO-treated cells do not undergo a
classical form of cell death (Figure 34) (Banjac et al., 2008).
3.2.2. The thioredoxin system as the possible driving force for the cystine/cysteine redox cycle
GSH is believed to mediate efficient reduction of cystine (Cys)2, that is taken up by system
xc- into the cells, by forming a mixed disulfide (GS-Cys). A second molecule of GSH is then
releasing cysteine from the mixed disulfide resulting in the formation of oxidised glutathione
(GSSG). Oxidised GSH (GSSG) is then recycled by glutathione reductase and NADPH/H+.
As overexpression of xCT rescues BL cells from cell death also in the presence of the GSH
synthesis inhibitor BSO (see Fig. 34 C), it is an intriguing question which other redox system
may compensate for the lack of GSH, i.e. which cellular system besides GSH is capable of
reducing oxidised cysteine. The need for a second redox system capable of reducing cystne
was additionally reinforced by the finding that xCT overexpression renders γ-GCS-/- cells,
76
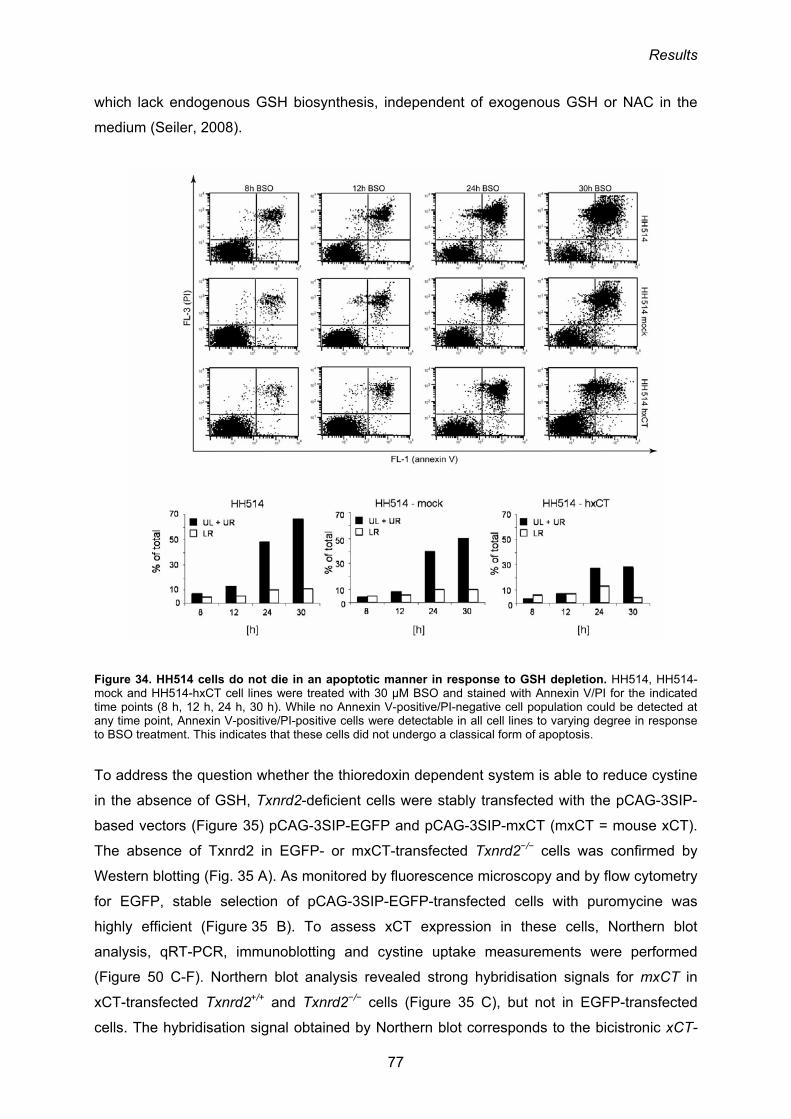
Results
which lack endogenous GSH biosynthesis, independent of exogenous GSH or NAC in the
medium (Seiler, 2008).
Figure 34. HH514 cells do not die in an apoptotic manner in response to GSH depletion. HH514, HH514-mock and HH514-hxCT cell lines were treated with 30 µM BSO and stained with Annexin V/PI for the indicated time points (8 h, 12 h, 24 h, 30 h). While no Annexin V-positive/PI-negative cell population could be detected at any time point, Annexin V-positive/PI-positive cells were detectable in all cell lines to varying degree in response to BSO treatment. This indicates that these cells did not undergo a classical form of apoptosis.
To address the question whether the thioredoxin dependent system is able to reduce cystine
in the absence of GSH, Txnrd2-deficient cells were stably transfected with the pCAG-3SIP-
based vectors (Figure 35) pCAG-3SIP-EGFP and pCAG-3SIP-mxCT (mxCT = mouse xCT).
The absence of Txnrd2 in EGFP- or mxCT-transfected Txnrd2−/− cells was confirmed by
Western blotting (Fig. 35 A). As monitored by fluorescence microscopy and by flow cytometry
for EGFP, stable selection of pCAG-3SIP-EGFP-transfected cells with puromycine was
highly efficient (Figure 35 B). To assess xCT expression in these cells, Northern blot
analysis, qRT-PCR, immunoblotting and cystine uptake measurements were performed
(Figure 50 C-F). Northern blot analysis revealed strong hybridisation signals for mxCT in
xCT-transfected Txnrd2+/+ and Txnrd2−/− cells (Figure 35 C), but not in EGFP-transfected
cells. The hybridisation signal obtained by Northern blot corresponds to the bicistronic xCT-
77
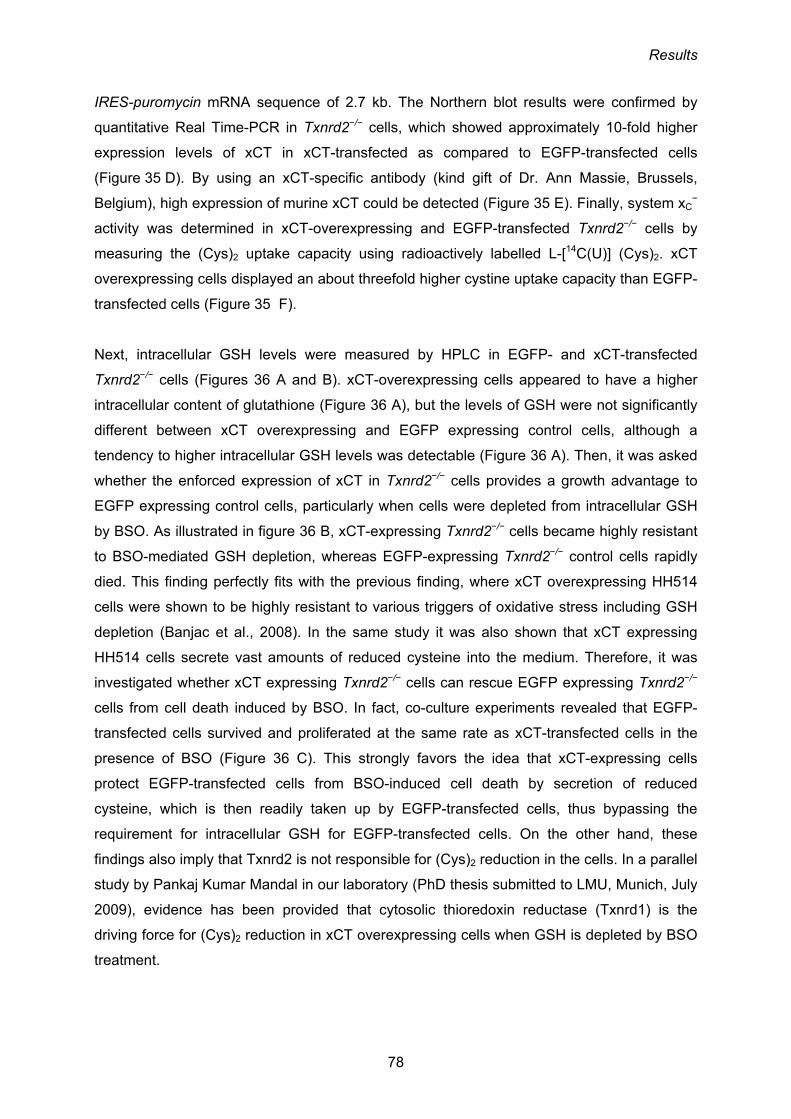
Results
IRES-puromycin mRNA sequence of 2.7 kb. The Northern blot results were confirmed by
quantitative Real Time-PCR in Txnrd2−/− cells, which showed approximately 10-fold higher
expression levels of xCT in xCT-transfected as compared to EGFP-transfected cells
(Figure 35 D). By using an xCT-specific antibody (kind gift of Dr. Ann Massie, Brussels,
Belgium), high expression of murine xCT could be detected (Figure 35 E). Finally, system xC−
activity was determined in xCT-overexpressing and EGFP-transfected Txnrd2−/− cells by
measuring the (Cys)2 uptake capacity using radioactively labelled L-[14C(U)] (Cys)2. xCT
overexpressing cells displayed an about threefold higher cystine uptake capacity than EGFP-
transfected cells (Figure 35 F).
Next, intracellular GSH levels were measured by HPLC in EGFP- and xCT-transfected
Txnrd2−/− cells (Figures 36 A and B). xCT-overexpressing cells appeared to have a higher
intracellular content of glutathione (Figure 36 A), but the levels of GSH were not significantly
different between xCT overexpressing and EGFP expressing control cells, although a
tendency to higher intracellular GSH levels was detectable (Figure 36 A). Then, it was asked
whether the enforced expression of xCT in Txnrd2−/− cells provides a growth advantage to
EGFP expressing control cells, particularly when cells were depleted from intracellular GSH
by BSO. As illustrated in figure 36 B, xCT-expressing Txnrd2−/− cells became highly resistant
to BSO-mediated GSH depletion, whereas EGFP-expressing Txnrd2−/− control cells rapidly
died. This finding perfectly fits with the previous finding, where xCT overexpressing HH514
cells were shown to be highly resistant to various triggers of oxidative stress including GSH
depletion (Banjac et al., 2008). In the same study it was also shown that xCT expressing
HH514 cells secrete vast amounts of reduced cysteine into the medium. Therefore, it was
investigated whether xCT expressing Txnrd2−/− cells can rescue EGFP expressing Txnrd2−/−
cells from cell death induced by BSO. In fact, co-culture experiments revealed that EGFP-
transfected cells survived and proliferated at the same rate as xCT-transfected cells in the
presence of BSO (Figure 36 C). This strongly favors the idea that xCT-expressing cells
protect EGFP-transfected cells from BSO-induced cell death by secretion of reduced
cysteine, which is then readily taken up by EGFP-transfected cells, thus bypassing the
requirement for intracellular GSH for EGFP-transfected cells. On the other hand, these
findings also imply that Txnrd2 is not responsible for (Cys)2 reduction in the cells. In a parallel
study by Pankaj Kumar Mandal in our laboratory (PhD thesis submitted to LMU, Munich, July
2009), evidence has been provided that cytosolic thioredoxin reductase (Txnrd1) is the
driving force for (Cys)2 reduction in xCT overexpressing cells when GSH is depleted by BSO
treatment.
78
Results
Figure 35. Stable expression of xCT in Txnrd2-deficient MEFs. (A) Loss of Txnrd2 in Txnrd2−/− cells stably expressing murine xCT or EGFP was confirmed by Western blotting. (B) Stable transfection of Txnrd2−/− cells with an EGFP expressing plasmid was monitored by fluorescence microscopy and quantified by flow cytometry one week after selection with 2 µg/ml puromycine. (C) Northern blot analysis of xCT expression in Txnrd2+/+ and Txnrd2−/− cells stably transfected with EGFP or xCT. Equal loading of samples was assessed by visualizing 28s and 18s rRNA bands of the corresponding agarose gel. (D) xCT expression in Txnrd2−/− cells was confirmed by qRT-PCR. (E) xCT expression was analysed by immunoblotting of cells expressing mouse xCT in Txnrd2−/− MEFs. HH514 cells overexpressing human xCT served as positive control. Note, murine and human xCT (37 kDa) migrate faster than predicted (55 kDa) in SDS-PAGE, which is line with previous reports . An unspecific band was used as loading control. (F) Cystine uptake measurements showed a 3-fold increased cystine uptake activity of xCT-overexpressing cells as compared to EGFP-transfected cells.
79
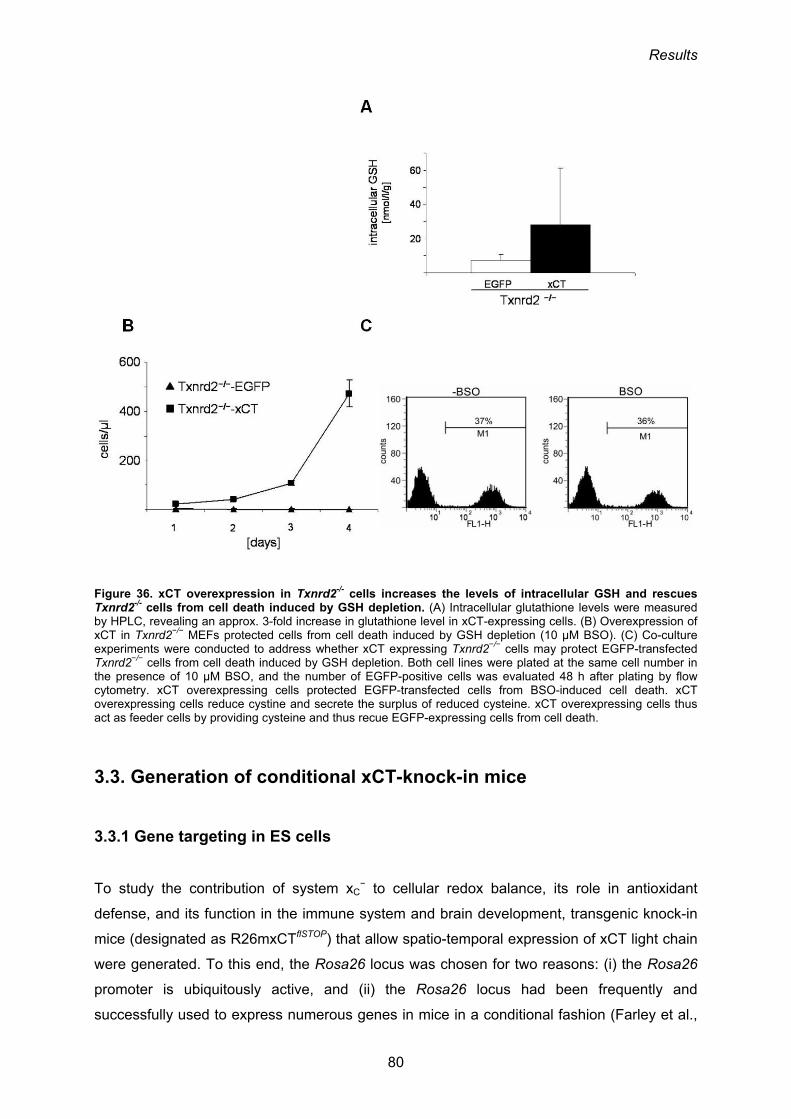
Results
Figure 36. xCT overexpression in Txnrd2-/- cells increases the levels of intracellular GSH and rescues Txnrd2-/- cells from cell death induced by GSH depletion. (A) Intracellular glutathione levels were measured by HPLC, revealing an approx. 3-fold increase in glutathione level in xCT-expressing cells. (B) Overexpression of xCT in Txnrd2−/− MEFs protected cells from cell death induced by GSH depletion (10 µM BSO). (C) Co-culture experiments were conducted to address whether xCT expressing Txnrd2−/− cells may protect EGFP-transfected Txnrd2−/− cells from cell death induced by GSH depletion. Both cell lines were plated at the same cell number in the presence of 10 µM BSO, and the number of EGFP-positive cells was evaluated 48 h after plating by flow cytometry. xCT overexpressing cells protected EGFP-transfected cells from BSO-induced cell death. xCT overexpressing cells reduce cystine and secrete the surplus of reduced cysteine. xCT overexpressing cells thus act as feeder cells by providing cysteine and thus recue EGFP-expressing cells from cell death.
3.3. Generation of conditional xCT-knock-in mice
3.3.1 Gene targeting in ES cells
To study the contribution of system xC− to cellular redox balance, its role in antioxidant
defense, and its function in the immune system and brain development, transgenic knock-in
mice (designated as R26mxCTflSTOP) that allow spatio-temporal expression of xCT light chain
were generated. To this end, the Rosa26 locus was chosen for two reasons: (i) the Rosa26
promoter is ubiquitously active, and (ii) the Rosa26 locus had been frequently and
successfully used to express numerous genes in mice in a conditional fashion (Farley et al.,
80
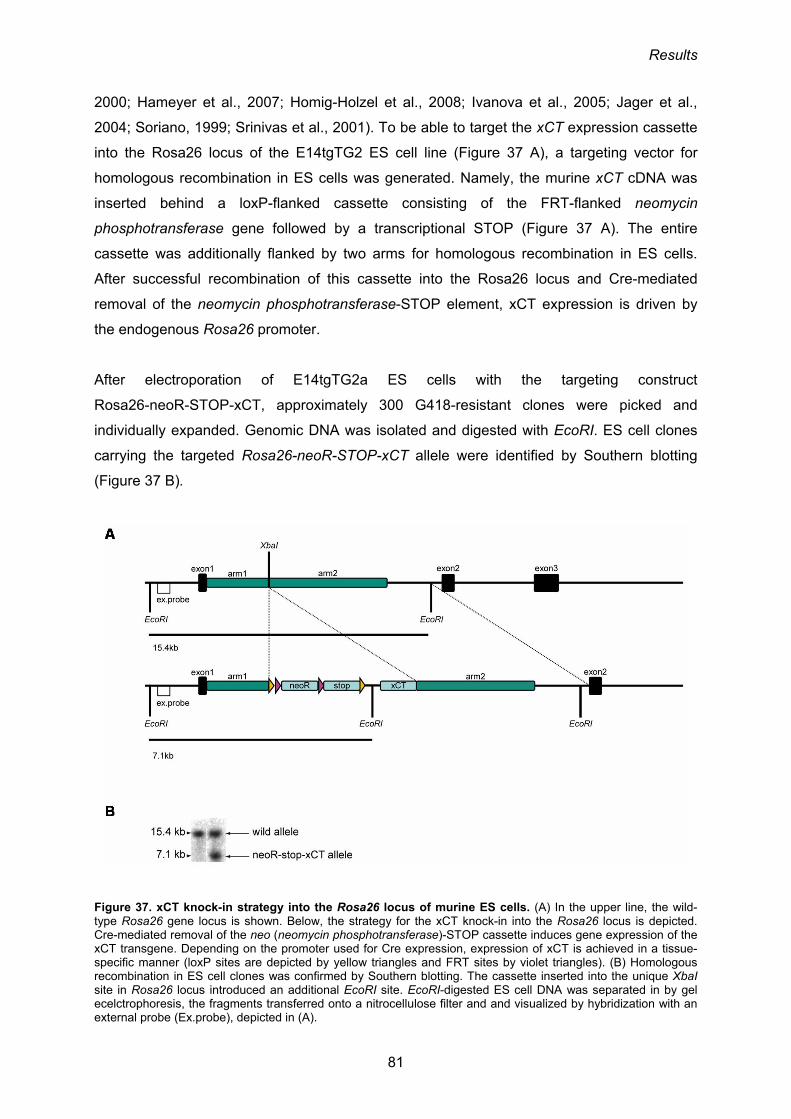
Results
2000; Hameyer et al., 2007; Homig-Holzel et al., 2008; Ivanova et al., 2005; Jager et al.,
2004; Soriano, 1999; Srinivas et al., 2001). To be able to target the xCT expression cassette
into the Rosa26 locus of the E14tgTG2 ES cell line (Figure 37 A), a targeting vector for
homologous recombination in ES cells was generated. Namely, the murine xCT cDNA was
inserted behind a loxP-flanked cassette consisting of the FRT-flanked neomycin
phosphotransferase gene followed by a transcriptional STOP (Figure 37 A). The entire
cassette was additionally flanked by two arms for homologous recombination in ES cells.
After successful recombination of this cassette into the Rosa26 locus and Cre-mediated
removal of the neomycin phosphotransferase-STOP element, xCT expression is driven by
the endogenous Rosa26 promoter.
After electroporation of E14tgTG2a ES cells with the targeting construct
Rosa26-neoR-STOP-xCT, approximately 300 G418-resistant clones were picked and
individually expanded. Genomic DNA was isolated and digested with EcoRI. ES cell clones
carrying the targeted Rosa26-neoR-STOP-xCT allele were identified by Southern blotting
(Figure 37 B).
Figure 37. xCT knock-in strategy into the Rosa26 locus of murine ES cells. (A) In the upper line, the wild-type Rosa26 gene locus is shown. Below, the strategy for the xCT knock-in into the Rosa26 locus is depicted. Cre-mediated removal of the neo (neomycin phosphotransferase)-STOP cassette induces gene expression of the xCT transgene. Depending on the promoter used for Cre expression, expression of xCT is achieved in a tissue-specific manner (loxP sites are depicted by yellow triangles and FRT sites by violet triangles). (B) Homologous recombination in ES cell clones was confirmed by Southern blotting. The cassette inserted into the unique XbaI site in Rosa26 locus introduced an additional EcoRI site. EcoRI-digested ES cell DNA was separated in by gel ecelctrophoresis, the fragments transferred onto a nitrocellulose filter and and visualized by hybridization with an external probe (Ex.probe), depicted in (A).
81
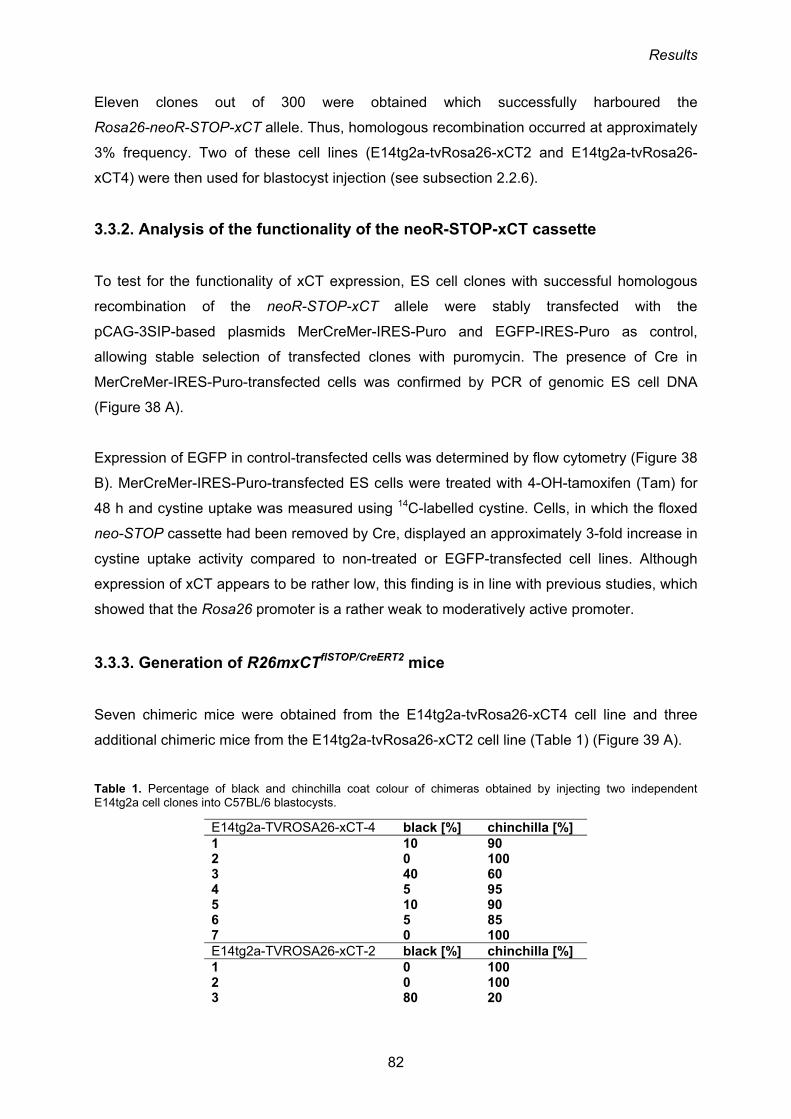
Results
Eleven clones out of 300 were obtained which successfully harboured the
Rosa26-neoR-STOP-xCT allele. Thus, homologous recombination occurred at approximately
3% frequency. Two of these cell lines (E14tg2a-tvRosa26-xCT2 and E14tg2a-tvRosa26-
xCT4) were then used for blastocyst injection (see subsection 2.2.6).
3.3.2. Analysis of the functionality of the neoR-STOP-xCT cassette
To test for the functionality of xCT expression, ES cell clones with successful homologous
recombination of the neoR-STOP-xCT allele were stably transfected with the
pCAG-3SIP-based plasmids MerCreMer-IRES-Puro and EGFP-IRES-Puro as control,
allowing stable selection of transfected clones with puromycin. The presence of Cre in
MerCreMer-IRES-Puro-transfected cells was confirmed by PCR of genomic ES cell DNA
(Figure 38 A).
Expression of EGFP in control-transfected cells was determined by flow cytometry (Figure 38
B). MerCreMer-IRES-Puro-transfected ES cells were treated with 4-OH-tamoxifen (Tam) for
48 h and cystine uptake was measured using 14C-labelled cystine. Cells, in which the floxed
neo-STOP cassette had been removed by Cre, displayed an approximately 3-fold increase in
cystine uptake activity compared to non-treated or EGFP-transfected cell lines. Although
expression of xCT appears to be rather low, this finding is in line with previous studies, which
showed that the Rosa26 promoter is a rather weak to moderatively active promoter.
3.3.3. Generation of R26mxCTflSTOP/CreERT2 mice
Seven chimeric mice were obtained from the E14tg2a-tvRosa26-xCT4 cell line and three
additional chimeric mice from the E14tg2a-tvRosa26-xCT2 cell line (Table 1) (Figure 39 A).
Table 1. Percentage of black and chinchilla coat colour of chimeras obtained by injecting two independent E14tg2a cell clones into C57BL/6 blastocysts.
E14tg2a-TVROSA26-xCT-4 black [%] chinchilla [%] 1 10 90 2 0 100 3 40 60 4 5 95 5 10 90 6 5 85 7 0 100 E14tg2a-TVROSA26-xCT-2 black [%] chinchilla [%] 1 0 100 2 0 100 3 80 20
82
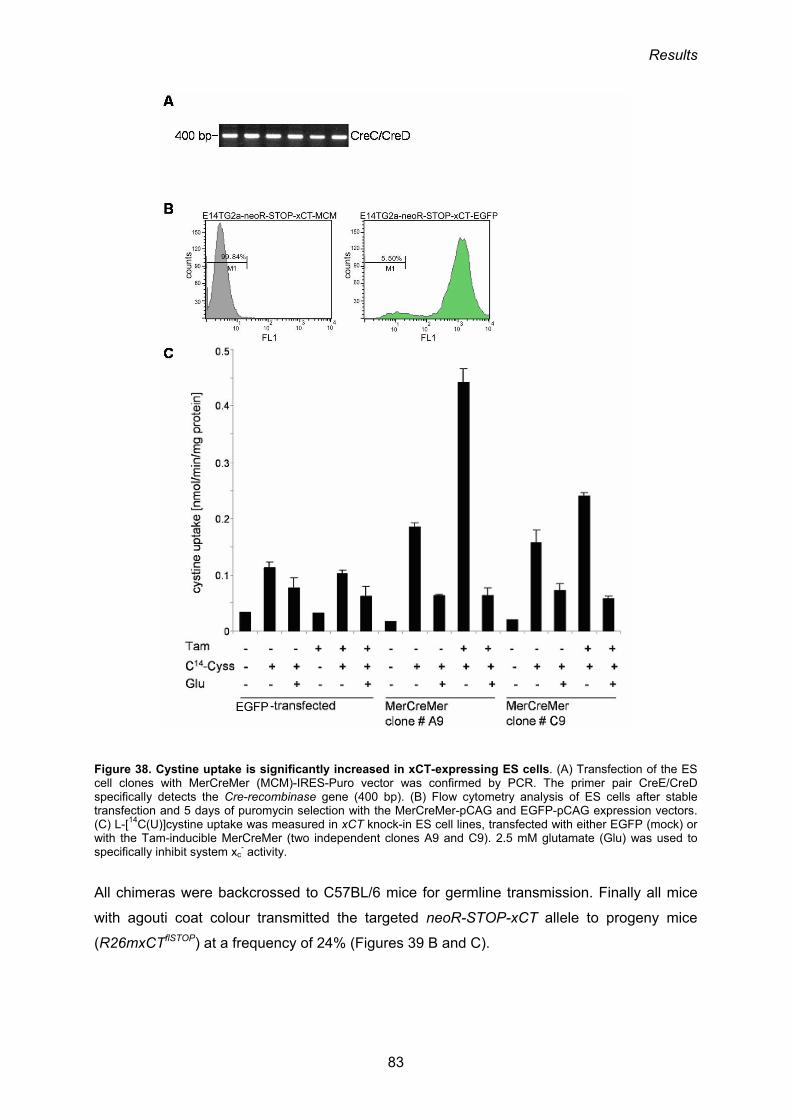
Results
Figure 38. Cystine uptake is significantly increased in xCT-expressing ES cells. (A) Transfection of the ES cell clones with MerCreMer (MCM)-IRES-Puro vector was confirmed by PCR. The primer pair CreE/CreD specifically detects the Cre-recombinase gene (400 bp). (B) Flow cytometry analysis of ES cells after stable transfection and 5 days of puromycin selection with the MerCreMer-pCAG and EGFP-pCAG expression vectors. (C) L-[14C(U)]cystine uptake was measured in xCT knock-in ES cell lines, transfected with either EGFP (mock) or with the Tam-inducible MerCreMer (two independent clones A9 and C9). 2.5 mM glutamate (Glu) was used to specifically inhibit system xc
- activity.
All chimeras were backcrossed to C57BL/6 mice for germline transmission. Finally all mice
with agouti coat colour transmitted the targeted neoR-STOP-xCT allele to progeny mice
(R26mxCTflSTOP) at a frequency of 24% (Figures 39 B and C).
83
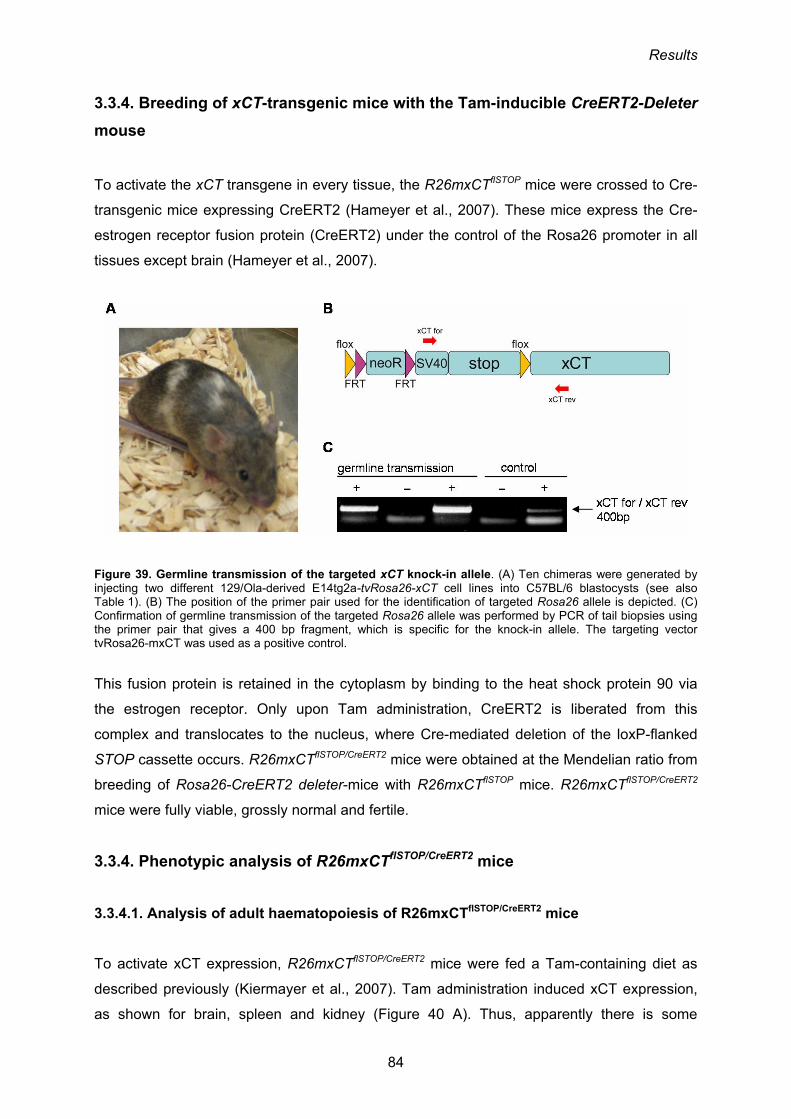
Results
3.3.4. Breeding of xCT-transgenic mice with the Tam-inducible CreERT2-Deleter mouse To activate the xCT transgene in every tissue, the R26mxCTflSTOP mice were crossed to Cre-
transgenic mice expressing CreERT2 (Hameyer et al., 2007). These mice express the Cre-
estrogen receptor fusion protein (CreERT2) under the control of the Rosa26 promoter in all
tissues except brain (Hameyer et al., 2007).
Figure 39. Germline transmission of the targeted xCT knock-in allele. (A) Ten chimeras were generated by injecting two different 129/Ola-derived E14tg2a-tvRosa26-xCT cell lines into C57BL/6 blastocysts (see also Table 1). (B) The position of the primer pair used for the identification of targeted Rosa26 allele is depicted. (C) Confirmation of germline transmission of the targeted Rosa26 allele was performed by PCR of tail biopsies using the primer pair that gives a 400 bp fragment, which is specific for the knock-in allele. The targeting vector tvRosa26-mxCT was used as a positive control.
This fusion protein is retained in the cytoplasm by binding to the heat shock protein 90 via
the estrogen receptor. Only upon Tam administration, CreERT2 is liberated from this
complex and translocates to the nucleus, where Cre-mediated deletion of the loxP-flanked
STOP cassette occurs. R26mxCTflSTOP/CreERT2 mice were obtained at the Mendelian ratio from
breeding of Rosa26-CreERT2 deleter-mice with R26mxCTflSTOP mice. R26mxCTflSTOP/CreERT2
mice were fully viable, grossly normal and fertile.
3.3.4. Phenotypic analysis of R26mxCTflSTOP/CreERT2 mice
3.3.4.1. Analysis of adult haematopoiesis of R26mxCTflSTOP/CreERT2 mice
To activate xCT expression, R26mxCTflSTOP/CreERT2 mice were fed a Tam-containing diet as
described previously (Kiermayer et al., 2007). Tam administration induced xCT expression,
as shown for brain, spleen and kidney (Figure 40 A). Thus, apparently there is some
84
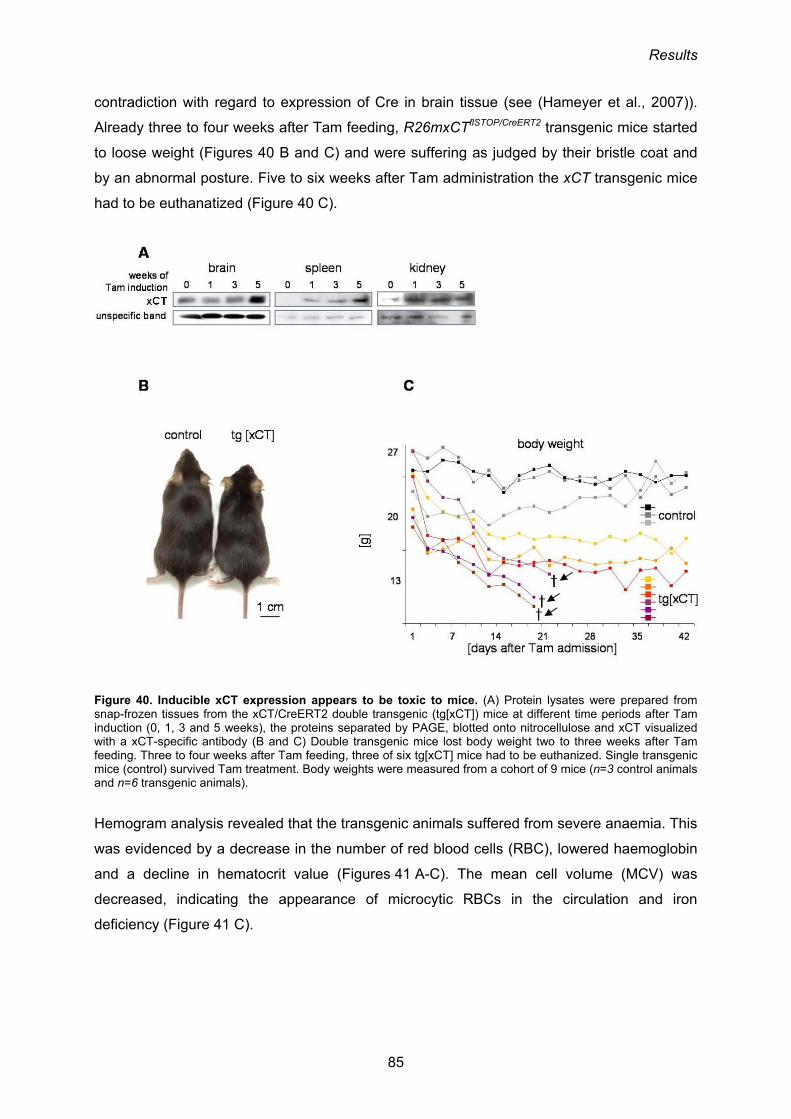
Results
contradiction with regard to expression of Cre in brain tissue (see (Hameyer et al., 2007)).
Already three to four weeks after Tam feeding, R26mxCTflSTOP/CreERT2 transgenic mice started
to loose weight (Figures 40 B and C) and were suffering as judged by their bristle coat and
by an abnormal posture. Five to six weeks after Tam administration the xCT transgenic mice
had to be euthanatized (Figure 40 C).
Figure 40. Inducible xCT expression appears to be toxic to mice. (A) Protein lysates were prepared from snap-frozen tissues from the xCT/CreERT2 double transgenic (tg[xCT]) mice at different time periods after Tam induction (0, 1, 3 and 5 weeks), the proteins separated by PAGE, blotted onto nitrocellulose and xCT visualized with a xCT-specific antibody (B and C) Double transgenic mice lost body weight two to three weeks after Tam feeding. Three to four weeks after Tam feeding, three of six tg[xCT] mice had to be euthanized. Single transgenic mice (control) survived Tam treatment. Body weights were measured from a cohort of 9 mice (n=3 control animals and n=6 transgenic animals).
Hemogram analysis revealed that the transgenic animals suffered from severe anaemia. This
was evidenced by a decrease in the number of red blood cells (RBC), lowered haemoglobin
and a decline in hematocrit value (Figures 41 A-C). The mean cell volume (MCV) was
decreased, indicating the appearance of microcytic RBCs in the circulation and iron
deficiency (Figure 41 C).
85
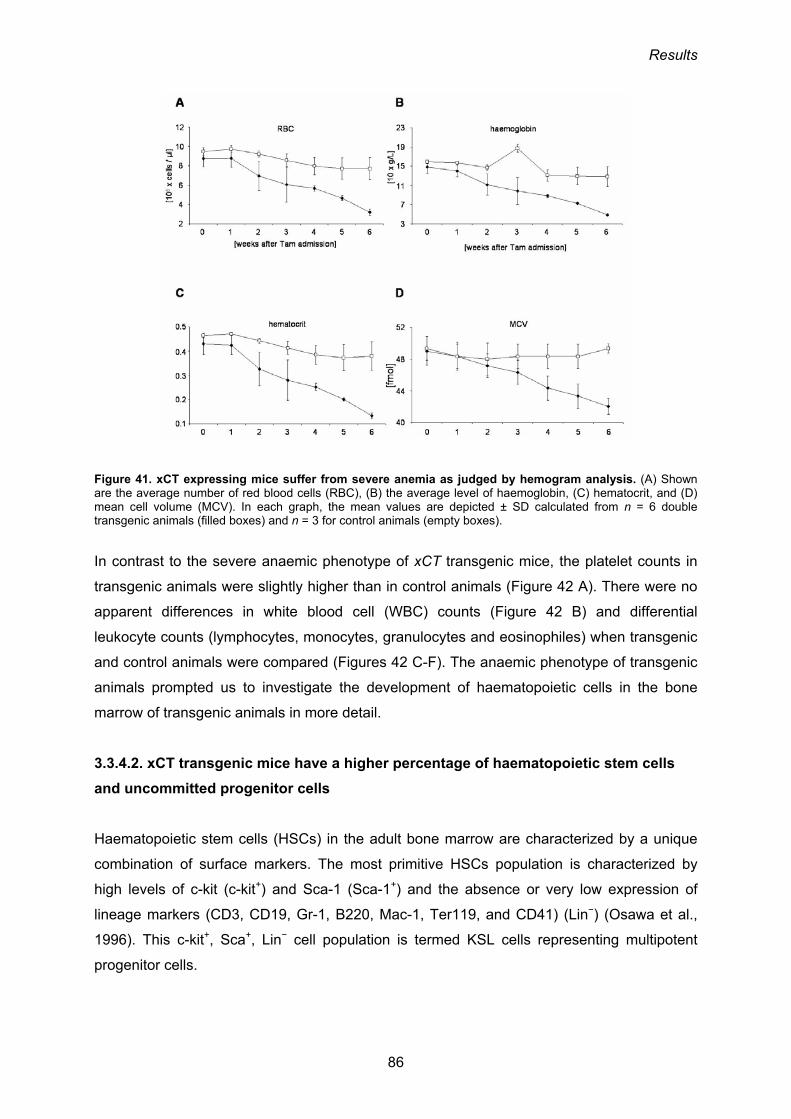
Results
Figure 41. xCT expressing mice suffer from severe anemia as judged by hemogram analysis. (A) Shown are the average number of red blood cells (RBC), (B) the average level of haemoglobin, (C) hematocrit, and (D) mean cell volume (MCV). In each graph, the mean values are depicted ± SD calculated from n = 6 double transgenic animals (filled boxes) and n = 3 for control animals (empty boxes).
In contrast to the severe anaemic phenotype of xCT transgenic mice, the platelet counts in
transgenic animals were slightly higher than in control animals (Figure 42 A). There were no
apparent differences in white blood cell (WBC) counts (Figure 42 B) and differential
leukocyte counts (lymphocytes, monocytes, granulocytes and eosinophiles) when transgenic
and control animals were compared (Figures 42 C-F). The anaemic phenotype of transgenic
animals prompted us to investigate the development of haematopoietic cells in the bone
marrow of transgenic animals in more detail.
3.3.4.2. xCT transgenic mice have a higher percentage of haematopoietic stem cells and uncommitted progenitor cells
Haematopoietic stem cells (HSCs) in the adult bone marrow are characterized by a unique
combination of surface markers. The most primitive HSCs population is characterized by
high levels of c-kit (c-kit+) and Sca-1 (Sca-1+) and the absence or very low expression of
lineage markers (CD3, CD19, Gr-1, B220, Mac-1, Ter119, and CD41) (Lin−) (Osawa et al.,
1996). This c-kit+, Sca+, Lin− cell population is termed KSL cells representing multipotent
progenitor cells.
86
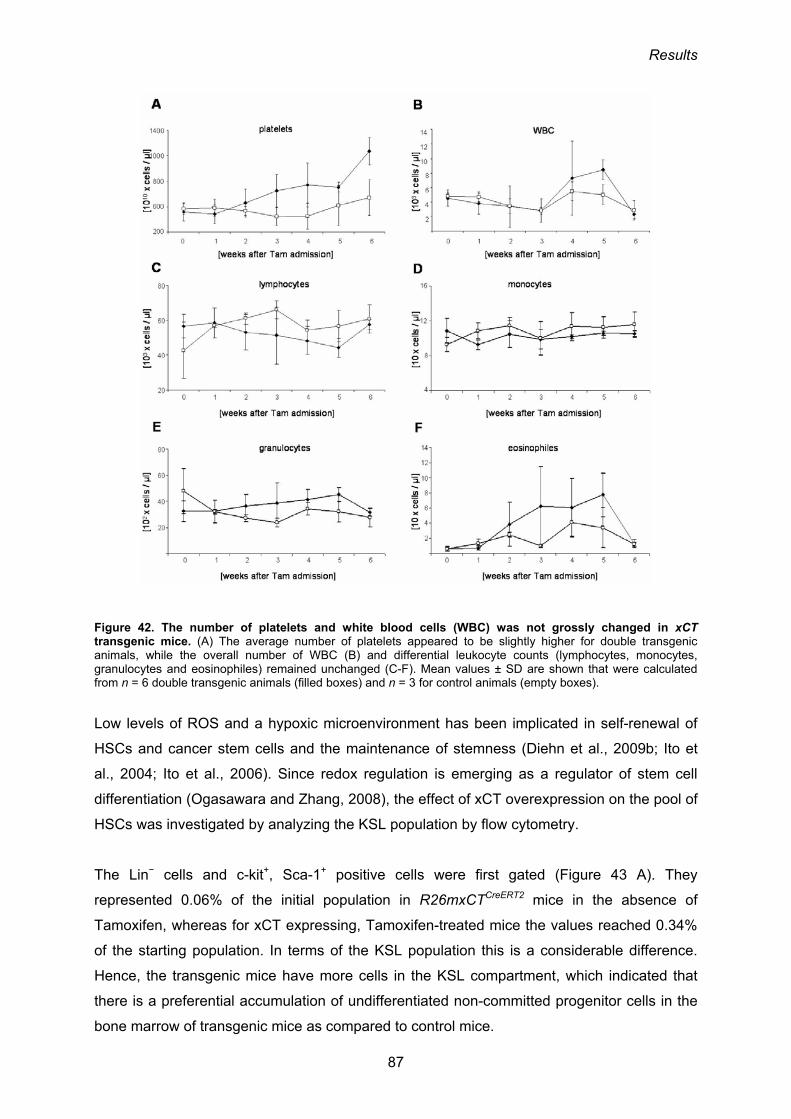
Results
Figure 42. The number of platelets and white blood cells (WBC) was not grossly changed in xCT transgenic mice. (A) The average number of platelets appeared to be slightly higher for double transgenic animals, while the overall number of WBC (B) and differential leukocyte counts (lymphocytes, monocytes, granulocytes and eosinophiles) remained unchanged (C-F). Mean values ± SD are shown that were calculated from n = 6 double transgenic animals (filled boxes) and n = 3 for control animals (empty boxes).
Low levels of ROS and a hypoxic microenvironment has been implicated in self-renewal of
HSCs and cancer stem cells and the maintenance of stemness (Diehn et al., 2009b; Ito et
al., 2004; Ito et al., 2006). Since redox regulation is emerging as a regulator of stem cell
differentiation (Ogasawara and Zhang, 2008), the effect of xCT overexpression on the pool of
HSCs was investigated by analyzing the KSL population by flow cytometry.
The Lin− cells and c-kit+, Sca-1+ positive cells were first gated (Figure 43 A). They
represented 0.06% of the initial population in R26mxCTCreERT2 mice in the absence of
Tamoxifen, whereas for xCT expressing, Tamoxifen-treated mice the values reached 0.34%
of the starting population. In terms of the KSL population this is a considerable difference.
Hence, the transgenic mice have more cells in the KSL compartment, which indicated that
there is a preferential accumulation of undifferentiated non-committed progenitor cells in the
bone marrow of transgenic mice as compared to control mice.
87
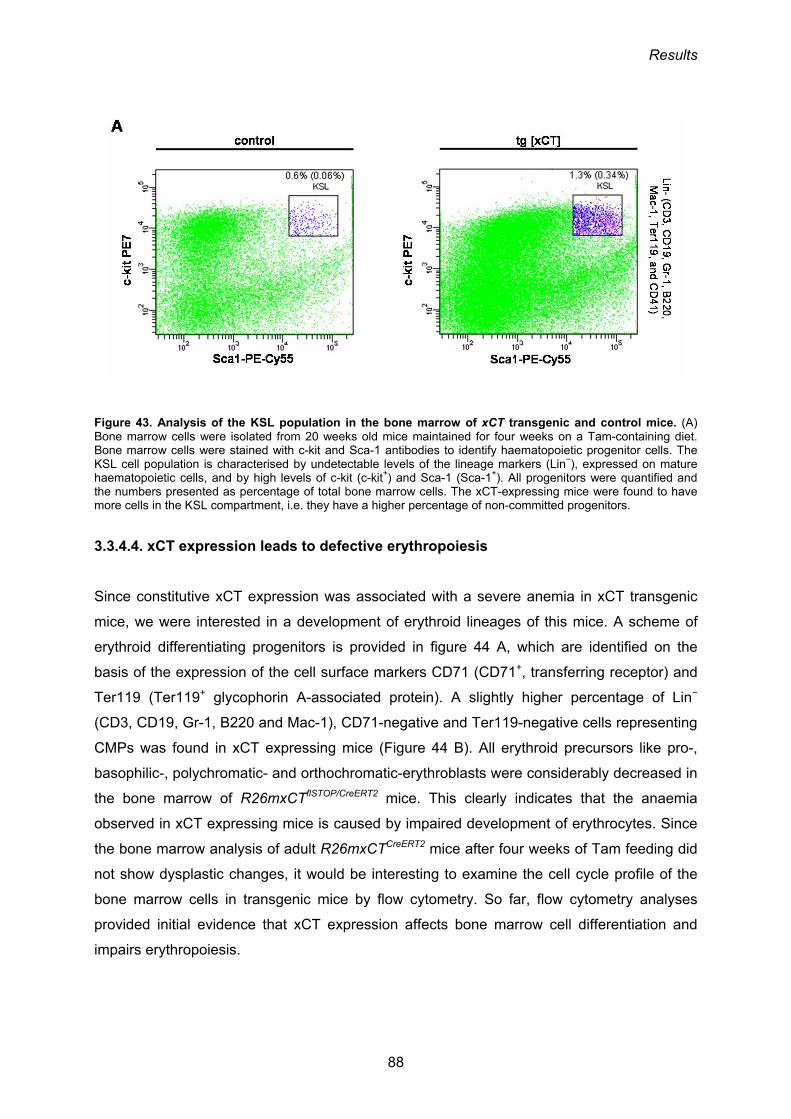
Results
Figure 43. Analysis of the KSL population in the bone marrow of xCT transgenic and control mice. (A) Bone marrow cells were isolated from 20 weeks old mice maintained for four weeks on a Tam-containing diet. Bone marrow cells were stained with c-kit and Sca-1 antibodies to identify haematopoietic progenitor cells. The KSL cell population is characterised by undetectable levels of the lineage markers (Lin−), expressed on mature haematopoietic cells, and by high levels of c-kit (c-kit+) and Sca-1 (Sca-1+). All progenitors were quantified and the numbers presented as percentage of total bone marrow cells. The xCT-expressing mice were found to have more cells in the KSL compartment, i.e. they have a higher percentage of non-committed progenitors.
3.3.4.4. xCT expression leads to defective erythropoiesis
Since constitutive xCT expression was associated with a severe anemia in xCT transgenic
mice, we were interested in a development of erythroid lineages of this mice. A scheme of
erythroid differentiating progenitors is provided in figure 44 A, which are identified on the
basis of the expression of the cell surface markers CD71 (CD71+, transferring receptor) and
Ter119 (Ter119+ glycophorin A-associated protein). A slightly higher percentage of Lin−
(CD3, CD19, Gr-1, B220 and Mac-1), CD71-negative and Ter119-negative cells representing
CMPs was found in xCT expressing mice (Figure 44 B). All erythroid precursors like pro-,
basophilic-, polychromatic- and orthochromatic-erythroblasts were considerably decreased in
the bone marrow of R26mxCTflSTOP/CreERT2 mice. This clearly indicates that the anaemia
observed in xCT expressing mice is caused by impaired development of erythrocytes. Since
the bone marrow analysis of adult R26mxCTCreERT2 mice after four weeks of Tam feeding did
not show dysplastic changes, it would be interesting to examine the cell cycle profile of the
bone marrow cells in transgenic mice by flow cytometry. So far, flow cytometry analyses
provided initial evidence that xCT expression affects bone marrow cell differentiation and
impairs erythropoiesis.
88
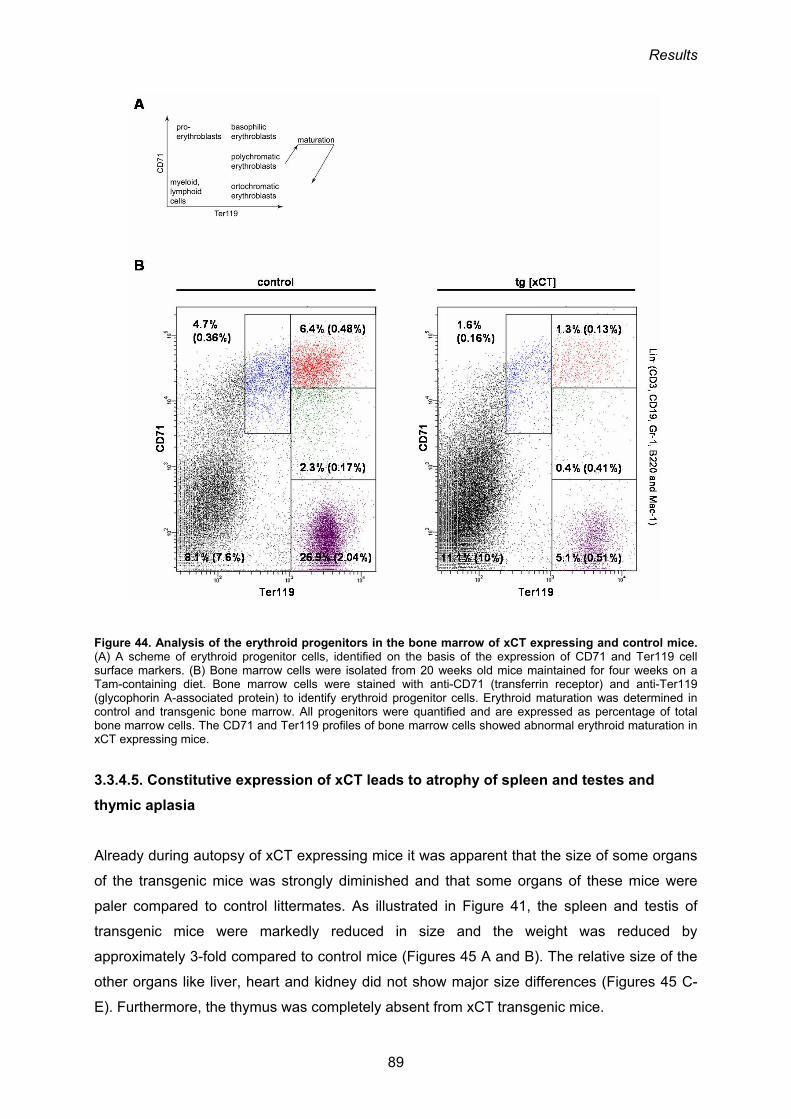
Results
Figure 44. Analysis of the erythroid progenitors in the bone marrow of xCT expressing and control mice. (A) A scheme of erythroid progenitor cells, identified on the basis of the expression of CD71 and Ter119 cell surface markers. (B) Bone marrow cells were isolated from 20 weeks old mice maintained for four weeks on a Tam-containing diet. Bone marrow cells were stained with anti-CD71 (transferrin receptor) and anti-Ter119 (glycophorin A-associated protein) to identify erythroid progenitor cells. Erythroid maturation was determined in control and transgenic bone marrow. All progenitors were quantified and are expressed as percentage of total bone marrow cells. The CD71 and Ter119 profiles of bone marrow cells showed abnormal erythroid maturation in xCT expressing mice.
3.3.4.5. Constitutive expression of xCT leads to atrophy of spleen and testes and thymic aplasia
Already during autopsy of xCT expressing mice it was apparent that the size of some organs
of the transgenic mice was strongly diminished and that some organs of these mice were
paler compared to control littermates. As illustrated in Figure 41, the spleen and testis of
transgenic mice were markedly reduced in size and the weight was reduced by
approximately 3-fold compared to control mice (Figures 45 A and B). The relative size of the
other organs like liver, heart and kidney did not show major size differences (Figures 45 C-
E). Furthermore, the thymus was completely absent from xCT transgenic mice.
89
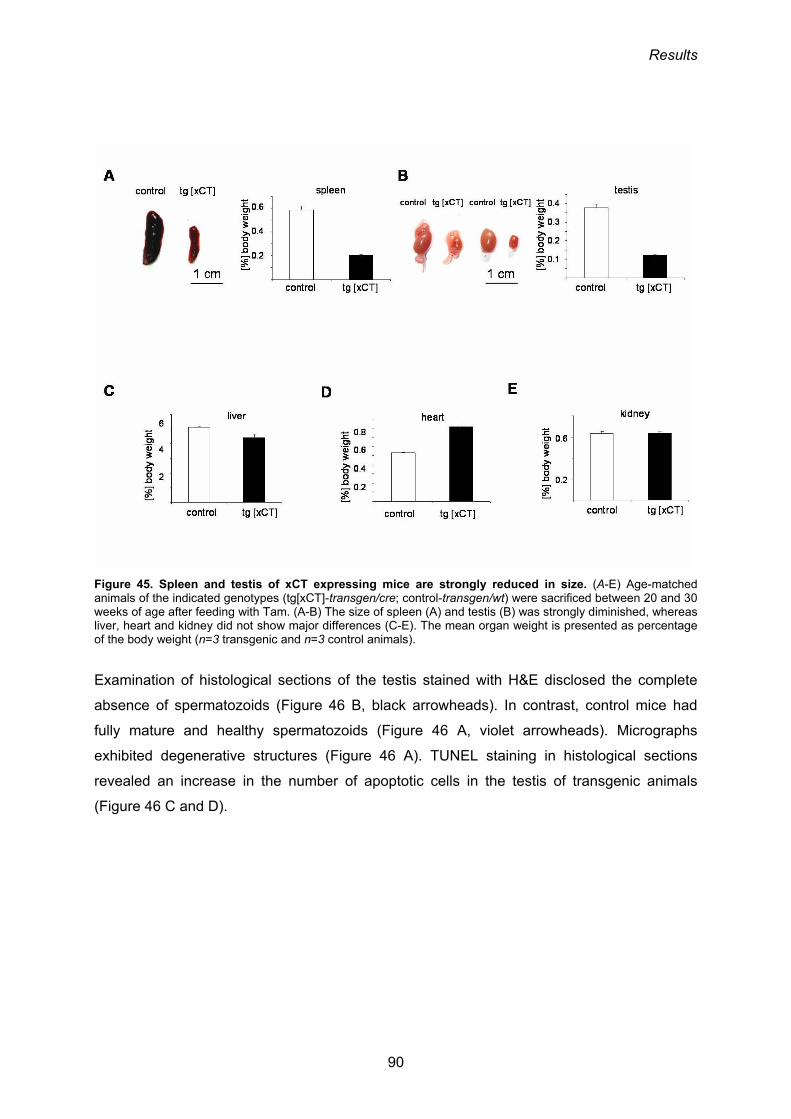
Results
Figure 45. Spleen and testis of xCT expressing mice are strongly reduced in size. (A-E) Age-matched animals of the indicated genotypes (tg[xCT]-transgen/cre; control-transgen/wt) were sacrificed between 20 and 30 weeks of age after feeding with Tam. (A-B) The size of spleen (A) and testis (B) was strongly diminished, whereas liver, heart and kidney did not show major differences (C-E). The mean organ weight is presented as percentage of the body weight (n=3 transgenic and n=3 control animals).
Examination of histological sections of the testis stained with H&E disclosed the complete
absence of spermatozoids (Figure 46 B, black arrowheads). In contrast, control mice had
fully mature and healthy spermatozoids (Figure 46 A, violet arrowheads). Micrographs
exhibited degenerative structures (Figure 46 A). TUNEL staining in histological sections
revealed an increase in the number of apoptotic cells in the testis of transgenic animals
(Figure 46 C and D).
90
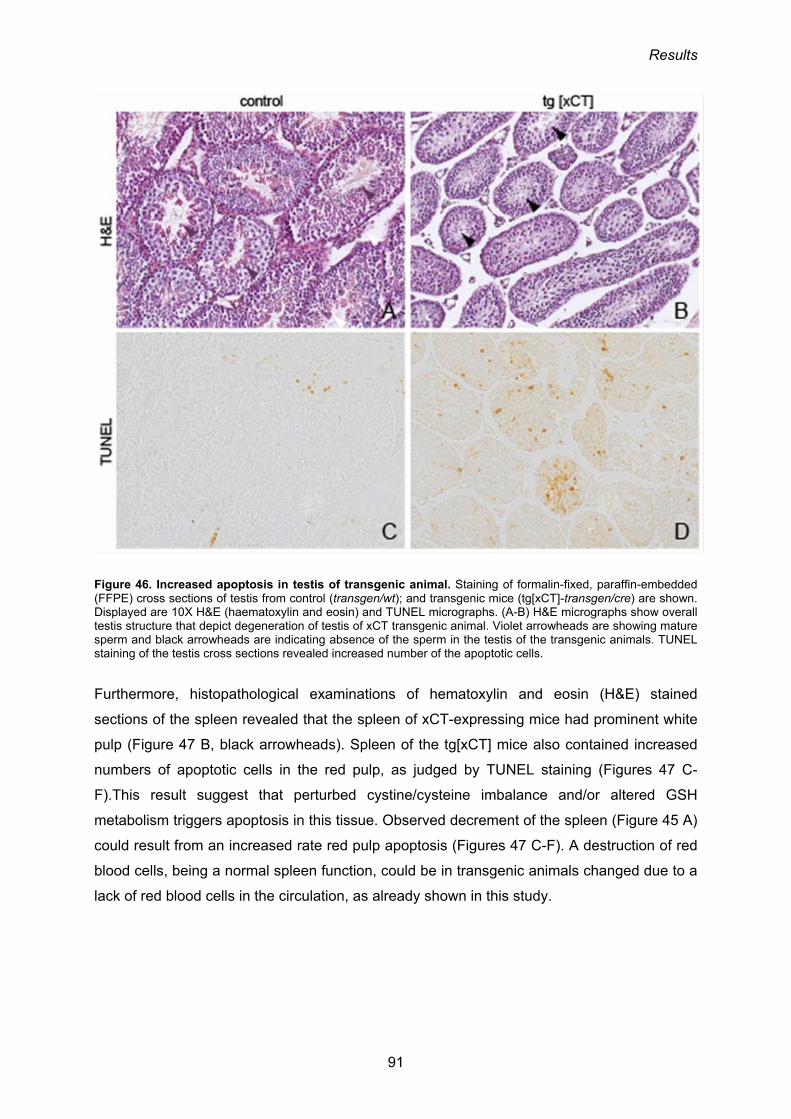
Results
Figure 46. Increased apoptosis in testis of transgenic animal. Staining of formalin-fixed, paraffin-embedded (FFPE) cross sections of testis from control (transgen/wt); and transgenic mice (tg[xCT]-transgen/cre) are shown. Displayed are 10X H&E (haematoxylin and eosin) and TUNEL micrographs. (A-B) H&E micrographs show overall testis structure that depict degeneration of testis of xCT transgenic animal. Violet arrowheads are showing mature sperm and black arrowheads are indicating absence of the sperm in the testis of the transgenic animals. TUNEL staining of the testis cross sections revealed increased number of the apoptotic cells. Furthermore, histopathological examinations of hematoxylin and eosin (H&E) stained
sections of the spleen revealed that the spleen of xCT-expressing mice had prominent white
pulp (Figure 47 B, black arrowheads). Spleen of the tg[xCT] mice also contained increased
numbers of apoptotic cells in the red pulp, as judged by TUNEL staining (Figures 47 C-
F).This result suggest that perturbed cystine/cysteine imbalance and/or altered GSH
metabolism triggers apoptosis in this tissue. Observed decrement of the spleen (Figure 45 A)
could result from an increased rate red pulp apoptosis (Figures 47 C-F). A destruction of red
blood cells, being a normal spleen function, could be in transgenic animals changed due to a
lack of red blood cells in the circulation, as already shown in this study.
91
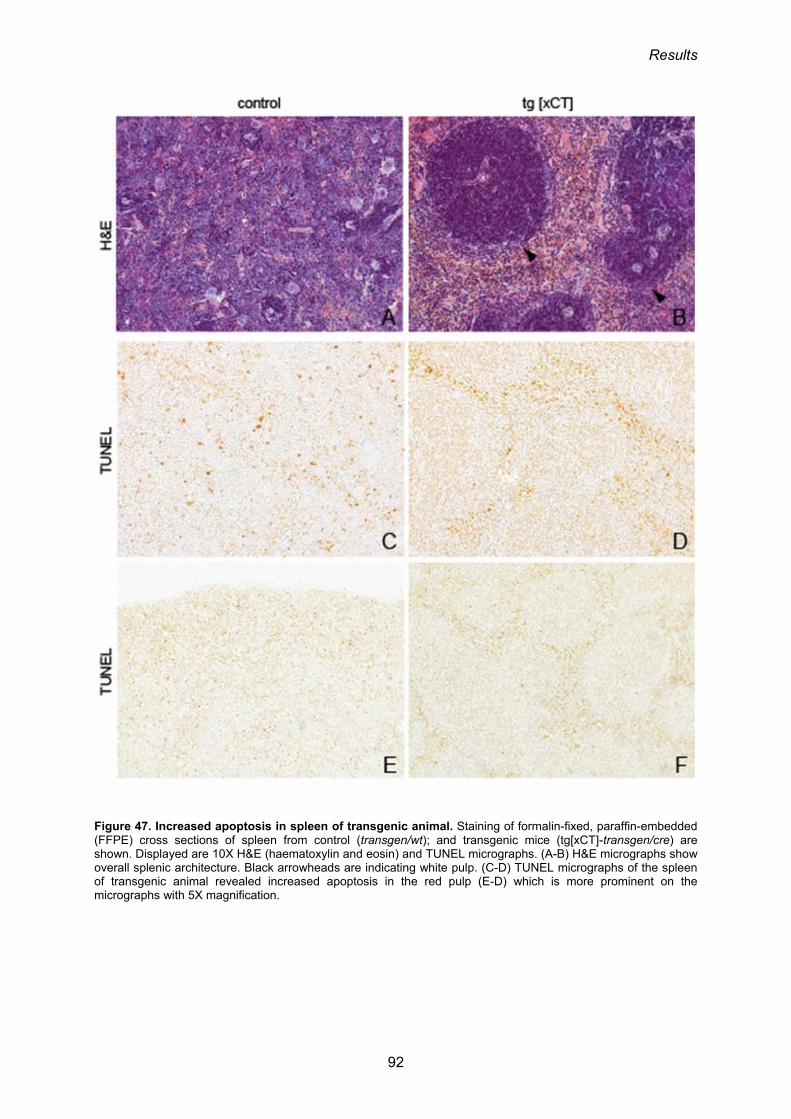
Results
Figure 47. Increased apoptosis in spleen of transgenic animal. Staining of formalin-fixed, paraffin-embedded (FFPE) cross sections of spleen from control (transgen/wt); and transgenic mice (tg[xCT]-transgen/cre) are shown. Displayed are 10X H&E (haematoxylin and eosin) and TUNEL micrographs. (A-B) H&E micrographs show overall splenic architecture. Black arrowheads are indicating white pulp. (C-D) TUNEL micrographs of the spleen of transgenic animal revealed increased apoptosis in the red pulp (E-D) which is more prominent on the micrographs with 5X magnification.
92
Discussion
93
4. Discussion
4.1. Absence of Txnrd2 causes high ROS accumulation, increased sensitivity towards pro-oxidants and impaired cell growth
Impairment or ablation of enzymes, which are critically involved in the control of cellular ROS
concentrations, might cause or aggravate the development of diseases, such as myocardial
infarction, stroke, neurodegeneration and tumor development (Anversa et al., 1998; Crack et
al., 2001; Diehn et al., 2009b; Francis, 2001; Griendling and FitzGerald, 2003a; Griendling
and FitzGerald, 2003b; Ide et al., 2000; Laurent et al., 2005; Lebovitz et al., 1996; Maulik et
al., 1998; Nguyen et al., 2006; Pennington et al., 2007; Seiler et al., 2008; Selenius et al.,
2008; Talbot et al., 2008; Yang et al., 1996; Yoo et al., 2007). While some recent biochemical
and computational studies have revealed the mechanism of Txnrd2 catalysis, understanding
the physiological role of Txnrd2 in cells and tissues is still at its infancy. Txnrd2 is
predominantly localised in mitochondria, which are the cells’ major site of energy production,
but which are also involved in the regulation of key cellular processes, such as cell growth,
and cell death (Cregan et al., 2004; Gustafsson and Gottlieb, 2008; Karunagaran et al.,
2007; Mazumder et al., 2007; Saelens et al., 2004). Although we have provided initial
evidence that Txnrd2 is important for the maintenance of mitochondrial function, presumably
due to scavenging of mitochondrial ROS (Conrad et al., 2004), the underlying cellular and
biochemical mechanisms have only been partially addressed.
Our cellular system with targeted disruption for Txnrd2 is thus a highly suitable tool for the
thorough investigation of Txnrd2-dependent cellular processes. To specifically interfere with
Txnrd2 function, Kim and colleagues established on the other hand a cellular system in
which a dominant-negative form of Txnrd2 (TXNR2DN) is overexpressed in a tetracycline-
regulatable manner (Tet-off-system) (Kim et al., 2003b). The construct was designed such
that it lacks the SECIS element. Thereby the UGA codon is read as a translational stop
codon and thus yields a truncated mutant lacking the two C-terminal residues Sec and Gly.
The dominant negative effect of this mutant was confirmed by measuring decreased Txnrd
activity. Moreover, cells expressing TXNRD2DN were shown to produce more hydrogen
peroxide than non-induced cells when stimulated with EGF (Kim et al., 2003b). In a follow-up
study, Chang et al., 2005 overexpressed an alternative splicing variant of TXNRD2 under
Tet-off control, which had 3 independent point deletions in the coding region and an insertion
of 1228 bp in the 3’-UTR, between the stop codon and the SECIS element (Chang et al.,
Discussion
2005). Again, TXNRD activity in whole cell lysates was decreased which resulted in
alterations of cellular ROS levels and increased apoptosis.
A genetic model is certainly preferable to ablate Txnrd2 function because overexpression of
dominant negative mutants of Txnrd2 may cause side effects as artificial gain of function. For
instance, it has been shown that a C-terminally truncated form of Txnrd1 acquires NADPH
oxidase activity as gain-of function and causes increased oxidative stress and apoptosis
(Anestal et al., 2008). Moreover, it was also shown recently that the N-terminal catalytic site
alone may harbour specific functions independently of the C-terminal catalytic site (Lothrop
et al., 2009). Pharmacological studies that would specifically target Txnrd2 might be
interesting, but certainly hardly feasible, since Txnrd1 and Txnrd2 are highly homologous and
the basic catalytic mechanisms are virtually identical. In general, inhibiting either Txnrd1 or
Txnrd2 specifically will be a major challenge, but certainly worthwhile as Txnrd1 and Txnrd2
are involved in different cellular functions. For instance, overexpression of Txnrd1 (and Txn1)
has been frequently linked to tumor growth, and thus targeting Txnrd1 alone might be an
interesting strategy for cancer treatment (Brigelius-Flohe, 2008; Nguyen et al., 2006;
Pennington et al., 2007; Selenius et al., 2008; Talbot et al., 2008; Yoo et al., 2007).
As described earlier (Conrad et al., 2004), primary Txnrd2−/− MEFs showed reduced
proliferation and/or increased apoptosis compared to wild-type counterparts. Since Txnrd2
has been implicated in the protection of cells from toxic amounts of mitochondrial ROS,
Txnrd2−/− cells were treated with different antioxidants, such as NAC, GSH and α-Toc, to
substantiate this notion: NAC, a frequently used antioxidant providing cells with cysteine for
GSH biosynthesis, is reported to protect cells against various triggers of oxidative stress (van
Zandwijk, 1995); GSH is a cofactor of GSH-dependent enzymes, including GSH
peroxidases; α-Toc disrupts the lipid peroxidation chain by one electron reduction of alkyl
radicals or peroxyl radicals (Ikeda et al., 2003; Seiler et al., 2008; Tagami et al., 1998). By
using these different antioxidants it was possible to complement the lack of Txnrd2: knock-
out cells were thus able to proliferate in a manner similar to Txnrd2 wild-type cells.
Damdimopoulos and colleagues have previously shown that overexpression of human
mitochondrial Trx (Trx2) in HEK-293 cells confers resistance towards etoposide and
increases the mitochondrial membrane potential (Damdimopoulos et al., 2004). Furthermore,
mice specifically lacking Trx2 die during midgestation due to massive apoptosis (Nonn et al.,
2003b). Since under physiological conditions Txnrd2 is the main enzyme for maintaining Trx2
in its reduced state, it was hypothesized that loss of Txnrd2 causes an increase in
intracellular (mitochondrial) ROS. The flow cytometry analyses of Txnrd2−/− MEFs, stained
94
Discussion
with redox-sensitive dyes CM-H2DCF-DA, BODIPY 581/591 C11 and boronate- based
fluorophores (PYAM, PYME and mitoPY) revealed strongly elevated ROS levels, such as
lipid peroxides and H2O2, in mitochondria and in the cytosol of knock-out cells. This rise in
ROS could be even exacerbated when GSH was depleted from the cells. On the contrary,
the amount of total ROS, as monitored by the non-specific ROS sensor CM-H2DCF-DA,
could be dampened by using the antioxidants NAC and α-Toc. Lipid peroxidation, as
determined by BODIPY 581/591 C11, could also be detected in the knock-out cells, which
was insensitive to NAC but sensitive to α-Toc. These results confirmed that NAC has no
scavenging activity towards lipid peroxides, while α-Toc efficiently scavenges lipid peroxides
which might be the initial source of ROS. More specifically boronate-based fluorophores
which are highly specific for H2O2, unmasked higher amounts of H2O2 in the cytoplasm as
well as in mitochondria of Txnrd2−/− cells when compared to wild-type cells. Of course, more
studies are required to answer whether lipid peroxidation is the cause or secondary to the
generation of other oxygen radical species. Nonetheless, the use of the redox-sensitive dyes
corroborates the generation of significant amounts of ROS in cells lacking Txnrd2 which
supports the hypothesis that an increase in ROS is the primary culprit in the impairment of
cellular growth. Since the Txnrd2 knock-out was designed as such that all Txnrd2 isoforms
are simultaneously inactivated, it was an obvious question whether the increase in cellular
ROS can be blunted by overexpression of either mitochondrial or cytoplasmic variants of
Txnrd2. The complex mammalian selenoprotein translational machinery has previously been
considered to be the main hurdle when overexpressing selenoproteins in mammalian cells.
Yet, in this study it was possible to stably express two wild-type and the two mutant forms of
Txnrd2 in Txnrd2 knock-out (and wild-type) cells. To achieve this, a lentiviral system was
used for expression of TAPe-tagged Txnrd2 in MEFs. For the mitochondrial and
cytoplasmatic isoforms, the TAPe-tags were placed after the N-terminal mitochondrial leader
sequence (MLS) or directly at the N-terminus, respectively. Since the C-terminus harbouring
the catalytic site -Gly-Cys-Sec-Gly- is highly flexible and important for thioredoxin reductase
function (Gasdaska et al., 1999b; Gladyshev et al., 1996; Lee et al., 1999; Miranda-Vizuete
et al., 1999; Sandalova et al., 2001; Tamura and Stadtman, 1996; Watabe et al., 1999;
Zhong and Holmgren, 2000), the N-terminus was used for fusion with TAPe-tag. When the
cell lysates of mitoTxnrd2 overexpressing cells were immunoblotted with an anti-Txnrd2
antibody, two bands appeared. This was not the case when the lysates were blotted against
anti-FLAG, suggesting that upon transport into mitochondria the MLS of mitoTxnrd2 was
processed as such that either the MLS alone or the MLS along with the TAPe-tag were
removed (Chang et al., 2005); apparently, both forms were produced at an equal ratio. On
the other hand, for the cytoplasmatic form there was only one single band detectable with
both antibodies, which was equal in size with the larger mitochondrial form due to the tag. To
95
Discussion
further confirm their subcellular localisation, immunocytochemical staining with the anti-FLAG
antibody and confocal microscopy were performed. The mitochondrial form of Txnrd2 was in
fact localised in mitochondria and the cytoplasmatic form was evenly distributed throughout
the cytosol.
It is highly likely that the mitochondrial isoform plays an important role in the scavenging of
mitochondrial ROS generated as a side product of oxidative phosphorylation. On the other
hand, the role of cytoplasmatic form, e.g. in ROS removal, is not known. The add-back of the
cytoplasmatic variant of Txnrd2 was also shown to decrease the level of ROS in Txnrd2
knock-out cells, which was unexpected. However, as the uncharged H2O2 can freely diffuse
across membranes it may be concluded that the major form of ROS released by
mitochondria might be H2O2. Needless to say, many questions regarding the nature and the
spatiotemporal generation of ROS remain to be addressed in the future. Recently, a novel
method was developed that allows to monitor the dynamic changes of redox-based
processes in living cells by using appropriate redox biosensors (Gutscher et al., 2008). This
biosensor is a fusion protein between human glutaredoxin-1 (Grx1) and the sensor protein
roGFP2. Stable expression of the Grx1-roGFP2 fusion protein allows dynamic live imaging of
the cellular redox potential, which is mainly based on the pool of intracellular reduced
glutathione (glutathione is present up to 10 mM in cells). Since the biosensor can be targeted
to different subcellular compartments one may also study the redox potential in the different
compartements. It thus facilitates the real-time determination of redox changes in response
to growth factor stimulation, cell density, mitochondrial depolarization, respiratory burst
activity and immune receptor stimulation. Hence, this technique offers new opportunities to
analyze in more detail the intracellular generation and distribution of ROS in Txnrd2 knock-
out cells.
Reportedly, MEFs overexpressing Txnrd were shown to have slightly retarded growth
(Patenaude et al., 2004; Powis et al., 1997a; Powis et al., 1997b; Spyrou et al., 1997). The
overexpression of Trx2 and Txnrd2 efficiently lowered the level of ROS and consequently
reduced p42/p44 MAPK phosphorylation, which was proposed to be the mechanism that
slows down cell proliferation (Zhou et al., 2008). It thus appears that the redox status in cells
controlled by the thioredoxin/thioredoxin reductase system affects growth and differentiation
and is involved in fine tuning of molecular signalling pathways.
To address whether Txnrd2−/− MEFs are also more sensitive to exogenous stress, cells were
treated with compounds, such as doxorubicin, cisplatin, peroxides, antimycin A and PEITC,
all known to induce the generation of free radicals. It is well established that doxorubicin
96
Discussion
intercalates into DNA, but also induces ROS (Bachur et al., 1977; Gutierrez et al., 1983) by
using electrons from mitochondrial complex I (Davies et al., 1983). Cisplatin, another
anticancer drug, was included in these studies. cis-Diammineplatinum(II) dichloride causes
the formation of cisplatin-platinum complexes in cells, which bind and lead to cross-linking of
DNA, ultimately triggering cell death and the generation of ROS (Martins et al., 2008). Txnrd2
knock-out cells were only moderately more sensitive to the treatment of the anticancer drugs
in terms of cell death; however in the presence of peroxides, antimycin A and PEITC treated
Txnrd2 knock-out cells readily died. Thus, the higher ROS content of Txnrd2 null cells was
apparently exacerbated by these compounds, eventually triggering the rapid onset of cell
death due to the severe impairment of Txnrd2 null cells to cope with the additional ROS.
The initial observation that Txnrd2−/− cells are highly sensitive to GSH depletion induced by
BSO (Conrad et al., 2004), prompted us to study the GSH levels in Txnrd2 knock-out cells.
The determination of GSH levels in the knock-out and control cells showed that wild-type
cells had three times higher GSH levels than Txnrd2−/−. This confirmed that Txnrd2 knock-out
cells apparently compensate for the lack of Txnrd2 by consuming higher levels of GSH thus
leaving the cells highly sensitive towards the GSH-depleting compound BSO. These results
demonstrated that cells lacking only one of the key enzymes of the thioredoxin system, when
devoid of glutathione, the second important intracellular antioxidant system, undergo cell
death due to the additive adverse effects. Thus, the two pathways act in a collaborative
manner to protect cells against oxidative stress. Recently, Lu and colleagues showed that
inhibition of thioredoxin reductase by arsenic trioxide (ATO) in human breast MCF-7 cancer
cells sensitizes them to apoptosis, particularly when used in combination with agents that
reduce the intracellular GSH concentrations, such as BSO (Lu et al., 2007). The authors
discussed several mechanisms, which may lead to this phenotype. The combination of ATO
and BSO may result in the disruption of the electron supply for DNA synthesis and
simultaneously induce augmented oxidative stress which cooperates in the induction of cell
death. These effects are considered to be the reason for H2O2 accumulation in cells upon
ATO treatment (Jing et al., 1999). Trx provide electrons to peroxiredoxins for scavenging
H2O2 and alkyl peroxides (Kang et al., 2004). GSH also participates in removing
hydroperoxides by acting as a cofactor for glutathione peroxidases (Conrad, 2009). Both
thioredoxins and glutaredoxins/GSH provide electrons to ribonucleotide reductase (RNR),
which is essential for DNA synthesis (Holmgren, 1985; Holmgren, 1989; Lammers and
Follmann, 1984; Reichard, 1988; Thelander and Reichard, 1979). Moreover, DNA repair
activity through Ref1, p53, and RNR is also controlled by Trx, and inactivation of the Trx
system presumably impedes DNA repair process (Seemann and Hainaut, 2005; Tanaka et
al., 2000). Trx is also cofactor of methionine sulfoxide reductases, and thus is involved in the
97
Discussion
repair of oxidised proteins (Hoshi and Heinemann, 2001). Yet, the use of ATO does not
discriminate between the two thioredoxin reductases and thus does not allow to specifically
target either mitochondrial or cytoplasmatic thioredoxin reductase. Also bearing in mind the
in vitro observation of Turanov and colleagues (Turanov et al., 2006) that Trx1 can be
equally well reduced by Txnrd2 as Trx2, the role of Txnrd2 on some of the processes that
take place in cytoplasm should not be underestimated, particularly considering the presence
of two Txnrd2 isoforms localised in cytoplasm.
4.2. Compensatory up-regulation of mitochondrial peroxiredoxins III and V in response to Txnrd2 disruption
Mammalian cells express two peroxiredoxins that are mainly localised in mitochondria: Prx III
and Prx V. Prx III is exclusively expressed in mitochondria, Prx V is also localised to
peroxisomes (Seo et al., 2000) and the nucleus (Kinnula et al., 2002). The mitochondrial
thioredoxin system was already shown to provide electrons for peroxiredoxin III in ex vivo
studies. It was shown that SP-22 (= Prx III) along with Trx2, partially purified mitochondrial
thioredoxin reductase from bovine adrenocortical mitochondria, and NADPH had the ability to
protect oxyhemoglobin against ascorbate-induced damage (Watabe et al., 1995; Watabe et
al., 1997; Zhang et al., 2007). Furthermore, NADPH was consumed in equimolar amounts by
Txnrd2, Trx2, and Prx III to reduce hydrogen peroxide and t-butylhydroperoxide (Watabe et
al., 1997). Only the combination of all these factors conferred the hemoglobin-protecting and
peroxide reducing activities. Evidence for these in vitro findings at the cellular level could be
provided by this work. Here, it could be shown that basal Prx III and Prx V protein levels were
increased in Txnrd2−/− cells and that the expression of Prx III and Prx V could be further
stimulated by various triggers of oxidative stress. The analysis of the oxidation state of the
catalytically active site cysteines with an antibody specifically detecting the sulfenic and
sulfinic forms of Prx I and Prx II (Woo et al., 2003a; Woo et al., 2003b) provided initial
insights that the overoxidised forms of Prx I and PrxII/PrxIII were present at higher levels in
knock-out than in wild-type cells in response to increasing H2O2 concentrations. However, it
still remains to be clarified whether this is in fact due to overoxidation or due to augmented
transcription and/or translation of the respective genes and proteins. The rapid H2O2-induced
up-regulation, in particular of Prx III and Prx V, suggests that this is regulated at the
translational and posttranslational rather than at the transcriptional level. It is temptative to
speculate that there are systems in cells which sense and swiftly respond to increasing
concentrations of ROS by enhancing the translation efficiency of antioxidant enzymes
through binding to yet-unrecognized regulatory elements on their mRNAs.
98
Discussion
The fact that the mRNA and protein levels of other Prxs were not changed suggests that the
impairment of Txnrd2 function mainly affects mitochondrial peroxiredoxins. This implies that
Txnrd2, Trx2 and Prx III and Prx V are indeed functionally connected in vivo. Similarly, in
yeast the lack of the Trx enzyme induced increased expression of thioredoxin-dependent
peroxidases, encoded by TSA1 (thiol-specific antioxidant protein encoding the major
cytosolic form 2-Cys Prx), AHP1, YDR453C, YBL064C and YIL010W (Carmel-Harel et al.,
2001). Hence, it seems that the role of the thioredoxin dependent system is phylogenetically
conserved: its proper function is vital for protection from oxidative stress, and also for
ensuring tightly controlled levels of ROS so that H2O2 can be used as signalling molecules
(Veal et al., 2007).
It has been postulated that peroxiredoxins evolved in eukaryotes to remove even low levels
of H2O2 as they have the potential to modulate cell signalling pathways. When H2O2 levels
exceed a certain threshold, peroxiredoxins are oxidized and inactivated (Woo et al., 2003a).
Previously, it was believed that the sulfinic forms of the active site cysteines of
peroxiredoxins are irreversibly oxidised. Toledano’s laboratory then identified a yeast
enzyme, sulfiredoxin (Srx), which in the presence of ATP or GTP is capable to of reducing
the sulfinic form of peroxiredoxins thus preventing them from further and irreversible
oxidation to sulfonic acid (Biteau et al., 2003). Srx was considered to be solely localised in
the cytoplasm, however, recent data revealed that under stress conditions Srx translocates
from the cytosol into mitochondria and regenerates hyperoxidized Prx III (Noh et al., 2009).
Here it could be shown that disruption of Txnrd2 increased Srx transcript levels in Txnrd2−/−
cells, most likely to prevent Prx III and Prx V from overoxidation and inactivation. This cellular
knock-out model could be further used to shed more light on the role of mitochondrial ROS
on the regulation of sulfiredoxin at the transcriptional and translational level as well as of its
subcellular trafficking (Figure 50).
4.3. Txnrd1 and Txnrd2 do not show functional redundancy in vivo
Gene targeting of Txnrd1 and Txnrd2 in mice showed that both enzymes play distinct and
essential roles in embryonic development and organ functions and that they can not
substitute each other (Conrad et al., 2004; Jakupoglu et al., 2005). Txnrd1 knock-out mice
die during early development and knock-out embryos display severe overall developmental
and growth retardation - only the embryonic heart was spared from the Txnrd1 knock-out and
developped normally. The dispensable role for Txnrd1 in cardiac tissue was underlined by
heart-specific disruption of Txnrd1, which did not affect viability of mice or caused any
99
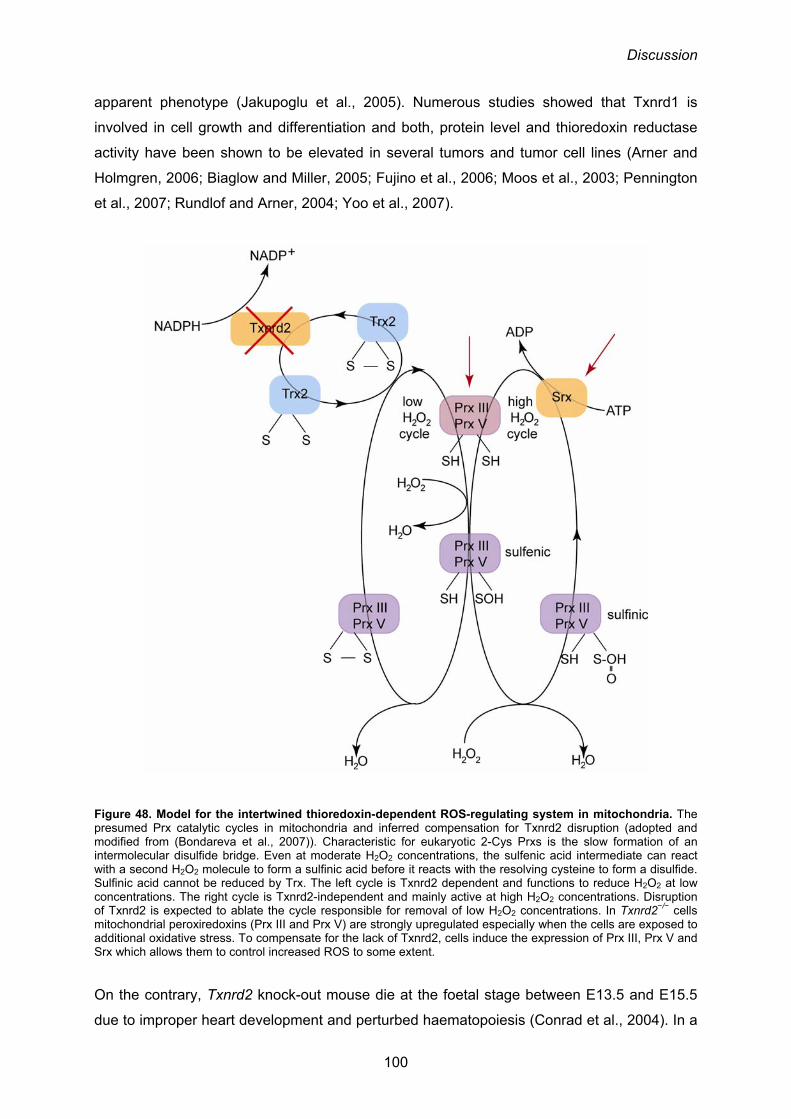
Discussion
apparent phenotype (Jakupoglu et al., 2005). Numerous studies showed that Txnrd1 is
involved in cell growth and differentiation and both, protein level and thioredoxin reductase
activity have been shown to be elevated in several tumors and tumor cell lines (Arner and
Holmgren, 2006; Biaglow and Miller, 2005; Fujino et al., 2006; Moos et al., 2003; Pennington
et al., 2007; Rundlof and Arner, 2004; Yoo et al., 2007).
Figure 48. Model for the intertwined thioredoxin-dependent ROS-regulating system in mitochondria. The presumed Prx catalytic cycles in mitochondria and inferred compensation for Txnrd2 disruption (adopted and modified from (Bondareva et al., 2007)). Characteristic for eukaryotic 2-Cys Prxs is the slow formation of an intermolecular disulfide bridge. Even at moderate H2O2 concentrations, the sulfenic acid intermediate can react with a second H2O2 molecule to form a sulfinic acid before it reacts with the resolving cysteine to form a disulfide. Sulfinic acid cannot be reduced by Trx. The left cycle is Txnrd2 dependent and functions to reduce H2O2 at low concentrations. The right cycle is Txnrd2-independent and mainly active at high H2O2 concentrations. Disruption of Txnrd2 is expected to ablate the cycle responsible for removal of low H2O2 concentrations. In Txnrd2−/− cells mitochondrial peroxiredoxins (Prx III and Prx V) are strongly upregulated especially when the cells are exposed to additional oxidative stress. To compensate for the lack of Txnrd2, cells induce the expression of Prx III, Prx V and Srx which allows them to control increased ROS to some extent. On the contrary, Txnrd2 knock-out mouse die at the foetal stage between E13.5 and E15.5
due to improper heart development and perturbed haematopoiesis (Conrad et al., 2004). In a
100
Discussion
study by Turanov and colleagues (Turanov et al., 2006) a certain overlap between Trx1 and
Trx2 was postulated. By a proteomic approach it was found that Trx1 is the major target of
Txnrd2 in the cytosolic fraction of rat and mouse hepatocytes. Given that Txnrd2 may also
play an important role in the cytoplasma, it was important to study whether Txnrd1 or Txnrd2
specifically targeted to the cytoplasm, is capable to rescue loss of Txnrd2. To this end,
Txnrd1 (a kind gift from, Mandal Kumar Pankaj, PhD thesis 2009) and Txnrd2 lacking a
mitochondrial leader sequence (MLS) were stably expressed in Txnrd2 knock-out cells.
These experiments showed that Txnrd1 overexpression could only partially prevent cell
death of Txnrd2−/− cells treated with increasing BSO concentrations. Partial protection of
Txnrd2−/− cells by Txnrd1 overexpression appeared to be comparable to the effect of
overexpression of cytosolic Txnrd2: only re-expression of Txnrd2 harbouring a MLS fully
rescued the Txnrd2 knock-out cells confirming that the observed phenotypes were solely
caused by Txnrd2 inactivation and were not due to other side effects. This also implies that
subcellular localisation of Txnrd2 is of major importance for proper cell function. To address
the question whether both enzymes harbour distinct and non-redundant functions apart from
the different tissue-specific expression patterns, one should insert mitochondria-targeted
Txnrd1 into the Txnrd2 locus and cytoplasmic Txnrd2 into the Txnrd1 locus in mice and ask
whether the mice are viable and develop normally. The present findings obtained by tissue-
specific disruption of either gene indicated that both enzymes exert non-redundant functions.
Yet, it cannot be excluded that the differences observed are due to the different tissue- and
time-specific expression pattern of Txnrd1 and Txnrd2 (Conrad et al., 2004; Jakupoglu et al.,
2005; Soerensen et al., 2008).
4.4. Txnrd2 is dispensable for maintaining the Cys/(Cys)2 cycle
In normal cell culture conditions, the major part of intracellular Cys derives from the (Cys)2,
the oxidized and predominant form of Cys in the extracellular space. (Cys)2 is transported
into the cells via the cystine/glutamate amino acid antiporter, system xC−, and then reduced
to Cys. Cysteine is used for protein and GSH synthesis, however quite a substantial fraction
may be released back into the medium via neutral amino acid transport systems. Thus,
system xC− is regarded to be the central constituent of the Cys/(Cys)2 cycle, which is
essential for the maintenance of cellular GSH levels (Bannai, 1986) and the sustaining of the
Cys/(Cys)2 redox balance (Bannai et al., 1989). In our laboratory it was shown recently that
enforced expression of xCT, the substrate-specific subunit of system xC−, in Burkitt’s
lymphoma cell drives the Cys/(Cys)2 cycle, characterized by uptake of (Cys)2, intracellular
reduction to Cys, secretion of Cys and re-oxidation to (Cys)2 (Banjac et al., 2008), and
101
Discussion
renders the cells resistant to inhibition of GSH synthesis by BSO. In a subsequent study it
was also shown by our laboratory that genetic GSH-deficiency could be bypassed by stable
expression of xCT in γ-GCS knock-out cells, further corroborating the Cys/(Cys)2 cycle as an
independent redox circuit (Mandal et al., submitted). Anderson et al. showed that HT-29 cells
have the capacity to regulate the extracellular Cys/(Cys)2 redox state by mechanisms that
are independent of cellular GSH (Anderson et al., 2007). Earlier Jones et al. showed that the
steady-state redox potential of the cysteine/cystine couple provides a redox node that is
independent and distinct of the two redox couples, reduced and oxidized thioredoxin at one
hand and reduced and oxidized glutathione at the other hand (Jones et al., 2004).
Therefore, the question arose what is the intracellular driving force behind the Cys/(Cys)2
redox cycle. Under normal conditions, it is conceivable that GSH is the prime candidate. By
forming mixed disulfides with (Cys)2 it first yields Cys and GS-S-Cys, the latter releases Cys
with a second molecule GSH to form GSSG. At the expense of NADPH, GSSG is then
recycled by glutathione reductase to yield 2 molecules of GSH. But what occurs in cells
which lack endogenous GSH biosynthesis like in γ-GCS null cells or cells depleted of GSH
by BSO? In fact, initial in vitro observations by Holmgren implicated bovine thioredoxin
reductase in (Cys)2 reduction in a manner independent of thioredoxin (Holmgren, 1977).
Therefore, xCT was stably expressed in Txnrd2−/− cells. xCT overexpressing cells were
challenged with BSO to address the role of thioredoxin reductases in intracellular (Cys)2
reduction. As shown previously, Txnrd2−/− cells rapidly died in response to GSH depletion,
which could be prevented by NAC (Conrad et al., 2004). Overexpression of xCT in Txnrd2−/−
cells efficiently rescued the cells from BSO-mediated cell death and even prevented cell
death of eGFP-expressing Txnrd2−/− control cells when these were co-cultured with
xCT-overexpressing Txnrd2−/− cells. This finding fits very well with our previous observations
that enforced expression of xCT rescues BL cells from cell death induced by BSO-mediated
GSH depletion (Banjac et al., 2008). The results obtained with Txnrd2−/− and γ-GCS−/− cells
(Pankaj Kumar Mandal, PhD thesis submitted) provided conclusive evidence that the
(Cys)2/Cys redox cycle is functional and intact even in the absence of GSH and/or Txnrd2. In
a parallel study by Pankaj Kumar Mandal strong evidence could be provided that it is Txnrd1
which is the driving force behind the Cys/(Cys)2 redox cycle: xCT-transfected Txnrd1−/− cells
were unable to exploit the beneficial and protective effects of this cycle, but they rapidly died
in response to BSO-mediated GSH depletion (Pankaj Kumar Mandal, PhD thesis submitted).
Thus, by using three genetically defined cellular systems, we could show that Txnrd1 is
essential for the utilization and recycling of small thiol-containing compounds and is the main
driving force for the (Cys)2/Cys redox cycle (Pankaj Kumar Mandal, PhD thesis submitted).
102
Discussion
4.5. Txnrd2 protects myocardial tissue from oxidative damage and is implicated in the pathogenesis of Dilatative Cardiomyopathy
Cardiac tissue has a particularly high demand for energy in form of ATP, which is mainly
produced by oxidative phosphorylation. Hence, cardiomyocytes are packed with mitochon-
dria, and up to 40% of the cellular mass is made up of mitochondria. Reduction of O2 to H2O
is a highly dangerous process as it requires the transfer of four electrons and the
intermediates of the electron transfer reaction are not stable. Single electron reduction of O2
leads to the generation of substantial amounts (up to 4% of total oxygen) of superoxide anion
(O2. -) as a toxic by-product (Forman et al., 1982; Shigenaga et al., 1994). Oxidative stress
has been associated with many cardiovascular diseases, including infarction
(ischemia/reperfusion injury) and heart failure (Francis, 2001; Griendling and FitzGerald,
2003a; Ide et al., 2000). Ischemia causes alterations in cellular defense mechanisms against
oxygen free radicals, mainly a reduction in the activity of SOD and GSH, yielding oxidized
glutathione (GSSG) (Ferrari et al., 2004). Then, the condition is exacerbated following
reperfusion due to increased ROS production, although the molecular mechanisms are still
widely unclear. Myocardial infarction after ischemia/reperfusion is a consequence of
profound cell death (either necrosis or apoptosis), and excessive ROS production has been
considered to be the major trigger of cell death (Anversa et al., 1998; Maulik et al., 1998).
Hence, cardiac tissue needs effective antioxidant and antiapoptotic systems like the
thioredoxin (Trx) and the glutaredoxin (Grx) systems to maintain cellular redox balance. The
mitochondrial thioredoxin system has been shown to be crucial for cardiac tissue
(Bodenstein et al., 1993; Conrad et al., 2004), and in general, its expression pattern and
distribution correlates well with the metabolic activity of the tissue (Spyrou et al., 1997). As
mentioned earlier, mice that ubiquitously lack Txnrd2 die at E13.5, and perturbed heart
development was identified as one of the underlying reasons for embryonic death. This was
further corroborated by heart-specific disruption Txnrd2, which causes post-natal death due
to biventricular dilatation of the heart and mitochondrial aberrations of cardiomyocytes
(Conrad et al., 2004).
Additional suggestive evidence for a possible involvement of Txnrd2 in the pathogenesis of
cardiac disease stems from patients who suffered from Keshan disease, an endemic
cardiomyopathy resulting from severe nutritional deficiency of the trace element selenium
(Xu et al., 1997) in combination with a coxsackie B virus infection (Beck et al., 2003a; Beck
et al., 2003b). In a collaborative study with Dr. N. von Beckerath (Deutsches Herzzentrum
München) and Dr. A. Pfeufer (Institute of Human Genetics, Helmholtz Zentrum München)
sequencing of all TXNRD2 exons of DNA samples from Dilatative Cardiomyopathy (DCM)
103
Discussion
patients (n = 227) along with controls (n = 683) identified two novel mutations in three
heterozygous carriers of 227 patients (3/227=1.3%). Both 175G>A (Ala59Thr) and 1124G>A
(Gly375Arg) were not observed in the general population (Sibbing D, Perisic T 2009, in
preparation). The recently published crystal structure of Txnrd2 (Biterova et al., 2005)
allowed to precisely locate the two identified mutations of Txnrd2, which are positioned in
highly conserved regions within the FAD binding domain of Txnrd2. It is noteworthy, that both
mutations that had been engeneered into the murine Txnrd2 protein, failed to rescue
Txnrd2−/− cells form BSO-mediated cell death when stably expressed in Txnrd2−/− cells.
When expressed in wild-type cells, cell death of these cells was accelerated compared to
mock-transfected cells. Moreover, Txnrd2+/+ cells expressing the mutated forms proliferated
very slowly, unlike Txnrd2−/− fibroblasts transfected with these mutants. In conclusion, these
data strongly suggest that both mutants behave like dominant-negative forms. In this context,
it should be stressed that the patients carrying these mutations were heterozygous. Hence,
Txnrd2+/+ or Txnrd2−/− cells expressing mutated Txnrd2 represent an appropriate model to
describe the in vivo condition found in the DCM patients with mutated Txnrd2. From these
investigations one may conclude that a small percentage of DCM cases might be caused by
these novel Txnrd2 mutations. After the identification of four mutations in the SelN gene that
cause muscle disorders in humans (SEPN1-related myopathy) (Allamand et al., 2006; Maiti
et al., 2009; Moghadaszadeh et al., 2001; Tajsharghi et al., 2005), Txnrd2 is the second
selenoenzyme in which mutations were found that predispose to a distinct human disease.
4.6. Inducible overexpression of xCT in mice is not protective, but causes spleen, thymus and testis atrophy and defective erythropoiesis
A large part of this thesis has been devoted to better understand possible redundancies
between different redox systems, i.e. of the thioredoxin and the glutathione system. It was
shown above that cells deficient for Txnrd2 are more sensitive to agents causing oxidative
stress than wildtype cells and that Txnrd2 knock-out cells are particularly susceptible to
depletion of glutathione by BSO. As uptake of cystine is the limiting step for glutathione
synthesis in many cellular systems, the cystine/glutamate exchange transporter xC−, had
initially been regarded as an important part of the glutathione system. Yet, overexpression
studies of xCT in wildtype cells (Banjac et al., 2008), in γ-GCS-/- cells (Mandal et al.,
submitted) and Txnrd2−/− cells (this thesis) performed in our laboratory had revealed that the
cystine/cysteine cycle driven by system xC−, represents a redox system that can operate also
independently of glutathione in vitro. Hence, system xC−, plays a dual role: it may increase
104
Discussion
the level of glutathione in cells in which GSH synthesis is intact and cystine uptake is limiting,
and alternatively, it may sustain the redox balance on its own when glutathione is depleted
and/or glutathione synthesis is inhibited.
So far, little is known about the biological role of system xC−, in vivo. Previously, Sato and
colleagues showed that loss of function of xCT by targeted disruption of the gene in mice did
not cause any overt phenotype in terms of viability, fertility and gross morphological changes
(Sato et al., 2005). xCT knock-out mice only showed an imbalance in plasma Cys levels.
Oppositely, it was our aim to generate a gain of function system for xCT. Since xCT has
been mainly associated with the protection of cells and tissues from oxidative stress, it was
hypothesized that gain of function of xCT would render transgenic mice more resistant to
oxidative damage. If ageing is indeed associated with increased oxidative stress and tissue
damage, overexpression of xCT might even prolong the life of transgenic mice. This
assumption had been corroborated by the finding of showed that xCT is central for
glutathione metabolism in rat brain and its overexpression is neuroprotective by enhancing
glutathione export from non-neuronal cells (Shih and Murphy, 2001). But also adverse effects
of ectopic xCT expression might have to be envisioned: Massie et al. reported the
involvement of the xCT in aberrant glutamate neurotransmission in the striatum of a rat
Parkinsonian brain (Massie et al., 2008), and Savaskan et al. found that pharmacological
inhibition of xCT or silencing by small interfering RNAs in human malignant brain tumours
inhibited neurodegeneration and alleviated brain edema most likely by decreasing glutamate-
induced excitotoxicity (Savaskan et al., 2008). A transgenic mouse with inducible xCT
expression was thus regarded as a valuable tool to investigate the role of xCT in various
models of neurodegeneration including stroke and Parkinson’s disease.
Beside this, we sought to study the role of ROS, of an hypoxic microenvironment and of the
intracellular redox balance for stem cell maintenance and differentiation (Diehn et al., 2009a;
Diehn et al., 2009b; Ito et al., 2006). Evidence has been accumulated over the last years
showing that stem cell maintenance requires an hypoxic, ROS-free environment, i.e. the
osteoblastic niche, whereas hematopoietic differentiation is associated with leaving the
niche, a normoxic environment and increased ROS levels (Diehn et al., 2009a; Diehn et al.,
2009b; Ito et al., 2006). Moreover, since system xC−, is the major amino acid transporter
induced in response to LPS and cytokine treatment in macrophages (Sato et al., 1991; Sato
et al., 1987; Watanabe and Bannai, 1987), it was hypothesized that xCT transgenic mice
might be more resistant towards bacterial infection and LPS-mediated toxicity, and hence
could serve as a valuable mouse model to study the involvement of ROS in inflammation.
105
Discussion
To express xCT in a spatio-temporal manner, the Rosa26 locus was chosen, as the Rosa26
promoter is ubiquitously active and this locus has been frequently used for ectopic gene
expression in mice (Farley et al., 2000; Hameyer et al., 2007; Homig-Holzel et al., 2008;
Ivanova et al., 2005; Jager et al., 2004; Soriano, 1999; Srinivas et al., 2001). After successful
generation of conditional xCT knock-in mice, these mice were crossed to tamoxifen-inducible
CreERT2-deleter mice. To our surprise, induction of xCT expression upon tamoxifen feeding
resulted in severe symptoms like gradual weight loss, abnormal posture, and suffering of the
mice so that the tamoxifen-feeded transgenic mice eventually had to be euthanized after 5
weeks. Careful examination of these mice revealed that many organs were pale suggestive
of anemia. Moreover, there was an atrophy of spleen and testes and the thymus was
completely lacking. Histological analysis of the spleen revealed a clear reduction in the red
pulp. The decrease in splenic size probably resulted from the increase in the number of
apoptotic cells, the reasons for which are not understood yet. According to the hemogram
analysis xCT transgenic mice were severely anaemic. This phenotype prompted us to further
investigate the haematopoietic system in more detail. Analysis of bone marrow cells by flow
cytometry revealed that transgenic mice expressing xCT had a 6-fold increase in
undifferentiated non-committed progenitor cells (KSL population) in the bone marrow as
identified on the basis of the high expression of c-kit and Sca-1 and the absence of lineage
markers on the cell surface (Lin−) . Unfortunately, the available data did not allow to draw the
conclusion whether there is an absolute increase in the number of KSL cells or a relative
increase that might be caused merely by the decrease of differentiated cells. Further
investigation of erythrocyte differentiation showed that all committed erythrocytic precursors
like pro-erythroblasts, as well as basophilic-, polychromatic- and orthochromatic-
erythroblasts were decreased in transgenic mice, whereas the percentage of megakaryocytic
and erythroblastic precursor cells was relatively increased. The impaired differentiation of
cells of the erythrocytic lineage may explain the anaemic phenotype of the xCT transgenic
animals. Our preliminary investigation thus showed that transgenic animals have
dysfunctional erythropoiesis that possibly resembles a refractory anemia/myelodysplastic
syndrome. Whether increased destruction of mature RBCs in the spleen may also contribute
to the anaemic phenotype, remains open at present. This will be answered by kinetic studies
determining the half life of mature erythrocytes in vivo. But it is noteworthy that the
phenotype is clearly different from a haemolytic anemia that is characterized by increased
spleen weight due to increased degradation of erythrocytes and compensatory
overproduction of red blood cell precursors.
The phenotype described here is compatible with published reports that a low level of ROS
and hypoxic microenvironment promotes self-renewal of HSCs (Diehn et al., 2009a; Diehn et
106
Discussion
al., 2009b; Ito et al., 2004; Osawa et al., 1996). Thus, by promoting the cystine uptake and
boosting the intracellular cysteine level, xCT overexpression may reduce the overall ROS
burden to a minimal level. By generating a highly reducing intracellular environment xCT
overexpression may shift the balance between self renewal and differentiation towards self
renewal and may thus inhibit differentiation of uncommitted progenitors into mature red blood
cells. This may be corroborated experimentally by showing that not only the relative number
but also the absolute number of KSL cells (harbouring the stem cells) has increased in xCT
transgenic mice. To address the question whether the phenotype observed is due to a cell-
autonomous effect of xCT overexpression in hematopoietic cells or due to a cell non-
autonomous action of xCT in stroma cells supporting hematopoiesis, bone marrow cells of
xCT-transgenic mice have to be transplanted into wildtype mice and vice versa, wildtype
bone marrow cells into xCT transgenic mice.
Although the phenotype observed in hematopoietic cells is exciting and promising, a note of
caution is also required regarding the interpretation of data obtained from xCT transgenic
mice. In vivo, xCT overexpression may not only lead to an increase in the intracellular supply
of cysteine (and thus in an increase in reduced intracellular glutathione), it may also lead –
due to the export of glutamate coupled to the import of cystine - to a decrease in the
intracellular glutamate and an increase in the extracellular glutamate concentration both of
which might be harmful to the cell. Thus, intracellular depletion of glutamate may impact on
the physiology of hematopoietic cells or alternatively, xCT overexpression may cause
glutamate-mediated toxicity in a manner similar to that in neurons. Recent studies have
shown that glutamate not only acts as a neurotransmitter, it also has been reported to have
immunomodulatory function. This is supported by the finding that glutamate receptors are
expressed on T-cells and glutamate transporters in antigen presenting cells like dendritic
cells and macrophages (Pacheco et al., 2007). A final caveat is necessary also regarding the
intracellular supply of NADPH. The continuous import of oxidized cystine and export of
reduced cysteine represents a steadily ongoing loss of reducing equivalents. Regardless
whether glutathione or thioredoxin reductase 1 are used for reduction of cystine, the reducing
equilvalents finally stem from the degradation of glucose in the pentose phosphate cycle and
glucose-6-phosphate dehydrogenase (G6PDH) that is generating NADPH as the universal
supplier of electrons for various biosynthetic pathways. Regarding the phenotype of xCT
overexpression in vivo, it may be necessary to show that the supply of NADPH is ensured
also in vivo and that the cells are not exhausted due to the continuous loss of reducing
equivalents. Yet, even though the in vivo phenotype of xCT overexpression is difficult to
interpret for the reasons mentioned above, the importance of xCT expression for culturing
cells in vitro is well established: in vitro, the supply of glutamate is guaranteed by the uptake
107
Discussion
of glutamine from the medium and the intracellular deamination of glutamine to glutamate.
Likewise, the generation of reducing equivalents through glucose and G6PDH is not limiting
in culture conditions in vitro. We are thus left with the curious situation that the relevance of
the phenotype observed by xCT overexpression in vivo has to be verified in vitro culture
systems, in which all confounding parameters may be controlled and the impact of xCT
overexpression on metabolic parameters can be dissected experimentally. It will be
particularly important to study differentiation of hemaptoietic cells in colony assays in
methylcellulose in vitro to which tamoxifen can be added at different time points, by following
the fate of single cells (Eilken et al., 2009; Rieger et al., 2009).
Besides the role of xCT overexpression for renewal and differentiation of hematopoetic cells,
it will be particularly interesting to study the impact of xCT overexpression in the brain. It is
impossible to predict which of two opposing phenotypes may prevail: protection of neuronal
cells from oxidative stress by increasing the intracellular glutathione concentration, or
increased neurotoxicity due to an increase in the extracellular glutamate levels. Hameyer et
al. have reported that the CreERT2 deleter mouse has no detectable CreERT2 activity in the
brain (Hameyer et al., 2007). Yet, our own preliminary data showed increased xCT levels in
whole brain lysates of xCT transgenic mice after 5 weeks of Tamoxifen feeding. To ensure
extensive broad xCT expression in the brain, R26mxCTflSTOP mice will be crossed to Nestin-
Cre mice, which express Cre in neuronal (and also some non-neuronal) cells. These mice
will prove most suitable to dissect putative protective or detrimental effects of increased
cystine uptake: either neuroprotection to due increased GSH synthesis or neurotoxicity due
to increased glutamate levels. Of note, ongoing studies in our laboratory in collaboration with
Dr. H. Beck (LMU München) and Dr. N. Plesnila (RCSI Dublin, Ireland) provided initial
evidence that xCT knock-out mice have reduced infarct size upon transient
ischemia/reperfusion (Beck et al, submitted) due to reduced levels of extracellular glutamate
and hence reduced glutamate-mediated neurotoxicity. In addition to studying the role of xCT
loss of function in xCT knock-out animals, the xCT transgenic mice will provide
complementary data in a xCT gain of function model.
108
Summary
109
5. Summary The thioredoxin system, along with the glutathione (GSH)-dependent system, is critically
involved in the maintenance of the intracellular redox balance. The thioredoxin dependent
system consists of thioredoxin reductases, thioredoxins and thioredoxin-dependent
peroxidases. The mitochondrial thioredoxin reductase (Txnrd2) is an important component of
the mitochondrial antioxidant system. Using Txnrd2 null cells we show that Txnrd2−/− cells
produced more ROS, and were highly susceptible to different prooxiditans and GSH
depletion. Administration of various antioxidants, such as NAC, GSH and α-Toc, reverted the
phenotyp of the Txnrd2−/− cells. The up-regulation of the mitochondrial peroxiredoxins Prx III
and Prx V and sulfiredoxin transcripts in Txnrd2−/− cells could be a compensatory mechanism
for loss of Txnrd2. However, under oxidative stress, Txnrd2−/− cells showed higher amount of
overoxidation of Prx I and PrxII/PrxIII indicating that in absence of Txnrd2 ROS scavenging
efficiency of Trx2-Prx system is greatly compromised.
Oxidative stress has been implicated in cardiovascular diseases, including infarction and
heart failure. Disruption of Txnrd2 leads to perturbed heart development and embryonic
lethality in mice. Heart-specific Txnrd2 disruption causes post-natal death due to biventricular
dilatation of the heart and mitochondrial aberrations of cardiomyocytes. Additional evidence
for a possible involvement of Txnrd2 in the pathogenesis of cardiac diseases came form the
study of the patients suffering from dialated cardiomyopathy (DCM). By DNA sequence
analysis of these samples, we found two novel mutations (Ala59Thr and Gly375Arg) in
TXNRD2. Stable expression of murine Txnrd2 harboring these two mutations in Txnrd2−/−
cells showed a dominant negative effect and were unable to rescue the cells from GSH
depletion. Our data strongly suggest that the mutations found in a small percentage of DCM
cases might be due to loss of Txnrd2 functions.
The cellular redox balance is maintained by thioredoxin- and GSH-dependent system along
with Cys/(Cys)2-cycle which is a distinct redox node of major importance. Previous study in
the lab showed that the essential requirement of GSH can be bypassed by the Cys/(Cys)2-
cycle. To gain further insights into the role of the thioredoxin system being a driving force for
the Cys/(Cys)2-cycle, xCT was overexpressed in Txnrd2−/− fibroblasts. xCT overexpression
rescued the Txnrd2−/− cells form GSH depletion. This suggests that the (Cys)2/Cys redox
cycle is functional and intact even in the absence of GSH and/or mitochondrial thioredoxin
reductase. In a parallel study, we found that cytosolic thioredoxin reductase (Txnrd1) is the
driving force behind the Cys/(Cys)2 redox cycle.

Summary
xCT epression provided growth advantages in culture conditions. In order to recapitulate our
findings in vivo, we generated xCT knock-in mice, in which xCT expression can be induced in
a spatio-temporal manner by tamoxifen. To our great surprise, overexpression of xCT in mice
resulted in adverse effects like atrophy of spleen, thymus and testis, defective erythropoiesis
and ultimately death after 5 weeks of induction. Detailed analysis of the bone marrow
revealed that although there is an increase in the hematopoietic stem cell population, xCT
overexpression leads to impaired erythropoiesis. The observed paradox with xCT
overexpression could be due to glutamate-mediated toxicity or impaired redox balance.
110
References
111
6. References Allamand, V., Richard, P., Lescure, A., Ledeuil, C., Desjardin, D., Petit, N., Gartioux, C.,
Ferreiro, A., Krol, A., Pellegrini, N., et al. (2006). A single homozygous point mutation in a 3'untranslated region motif of selenoprotein N mRNA causes SEPN1-related myopathy. EMBO Rep 7, 450-454.
Anderson, C. L., Iyer, S. S., Ziegler, T. R., and Jones, D. P. (2007). Control of extracellular cysteine/cystine redox state by HT-29 cells is independent of cellular glutathione. Am J Physiol Regul Integr Comp Physiol 293, R1069-1075.
Andersson, M., Holmgren, A., and Spyrou, G. (1996). NK-lysin, a disulfide-containing effector peptide of T-lymphocytes, is reduced and inactivated by human thioredoxin reductase. Implication for a protective mechanism against NK-lysin cytotoxicity. J Biol Chem 271, 10116-10120.
Anestal, K., Prast-Nielsen, S., Cenas, N., and Arner, E. S. (2008). Cell Death by SecTRAPs: Thioredoxin Reductase as a Prooxidant Killer of Cells. PLoS ONE 3, e1846.
Anversa, P., Cheng, W., Liu, Y., Leri, A., Redaelli, G., and Kajstura, J. (1998). Apoptosis and myocardial infarction. Basic Res Cardiol 93 Suppl 3, 8-12.
Araki, M., Nanri, H., Ejima, K., Murasato, Y., Fujiwara, T., Nakashima, Y., and Ikeda, M. (1999). Antioxidant function of the mitochondrial protein SP-22 in the cardiovascular system. J Biol Chem 274, 2271-2278.
Arner, E. S., and Holmgren, A. (2000). Physiological functions of thioredoxin and thioredoxin reductase. Eur J Biochem 267, 6102-6109.
Arner, E. S., and Holmgren, A. (2006). The thioredoxin system in cancer. Semin Cancer Biol 16, 420-426.
Arner, E. S., Nordberg, J., and Holmgren, A. (1996). Efficient reduction of lipoamide and lipoic acid by mammalian thioredoxin reductase. Biochem Biophys Res Commun 225, 268-274.
Atkins, J. F., and Gesteland, R. F. (2000). The twenty-first amino acid. Nature 407, 463, 465.
Bachur, N. R., Gordon, S. L., and Gee, M. V. (1977). Anthracycline antibiotic augmentation of microsomal electron transport and free radical formation. Mol Pharmacol 13, 901-910.
Baker, A., Payne, C. M., Briehl, M. M., and Powis, G. (1997). Thioredoxin, a gene found overexpressed in human cancer, inhibits apoptosis in vitro and in vivo. Cancer Res 57, 5162-5167.
Banjac, A. (2005) Cystine-Import and regulation of apoptosis n B-Lymphocytes. Dissertation, LMU, Munich.
Banjac, A., Perisic, T., Sato, H., Seiler, A., Bannai, S., Weiss, N., Kolle, P., Tschoep, K., Issels, R. D., Daniel, P. T., et al. (2008). The cystine/cysteine cycle: a redox cycle regulating susceptibility versus resistance to cell death. Oncogene 27, 1618-1628.
Banmeyer, I., Marchand, C., Clippe, A., and Knoops, B. (2005). Human mitochondrial peroxiredoxin 5 protects from mitochondrial DNA damages induced by hydrogen peroxide. FEBS Lett 579, 2327-2333.
Bannai, S. (1984). Induction of cystine and glutamate transport activity in human fibroblasts by diethyl maleate and other electrophilic agents. J Biol Chem 259, 2435-2440.
Bannai, S. (1986). Exchange of cystine and glutamate across plasma membrane of human fibroblasts. J Biol Chem 261, 2256-2263.
References
Bannai, S., and Ishii, T. (1982). Transport of cystine and cysteine and cell growth in cultured human diploid fibroblasts: effect of glutamate and homocysteate. J Cell Physiol 112, 265-272.
Bannai, S., and Kasuga, H. (1985). Anti-inflammatory drug inhibition of transport of cystine and glutamate in cultured human fibroblasts. Biochem Pharmacol 34, 1852-1854.
Bannai, S., Sato, H., Ishii, T., and Sugita, Y. (1989). Induction of cystine transport activity in human fibroblasts by oxygen. J Biol Chem 264, 18480-18484.
Bannai, S., Sato, H., Ishii, T., and Taketani, S. (1991). Enhancement of glutathione levels in mouse peritoneal macrophages by sodium arsenite, cadmium chloride and glucose/glucose oxidase. Biochim Biophys Acta 1092, 175-179.
Bauer, H., Massey, V., Arscott, L. D., Schirmer, R. H., Ballou, D. P., and Williams, C. H., Jr. (2003). The mechanism of high Mr thioredoxin reductase from Drosophila melanogaster. J Biol Chem 278, 33020-33028.
Beck, M. A., and Levander, O. A. (1998). Dietary oxidative stress and the potentiation of viral infection. Annu Rev Nutr 18, 93-116.
Beck, M. A., Levander, O. A., and Handy, J. (2003a). Selenium deficiency and viral infection. J Nutr 133, 1463S-1467S.
Beck, M. A., Williams-Toone, D., and Levander, O. A. (2003b). Coxsackievirus B3-resistant mice become susceptible in Se/vitamin E deficiency. Free Radic Biol Med 34, 1263-1270.
Biaglow, J. E., and Miller, R. A. (2005). The thioredoxin reductase/thioredoxin system: novel redox targets for cancer therapy. Cancer Biol Ther 4, 6-13.
Bilski, P., Belanger, A. G., and Chignell, C. F. (2002). Photosensitized oxidation of 2',7'-dichlorofluorescin: singlet oxygen does not contribute to the formation of fluorescent oxidation product 2',7'-dichlorofluorescein. Free Radic Biol Med 33, 938-946.
Birringer, M., Pilawa, S., and Flohe, L. (2002). Trends in selenium biochemistry. Nat Prod Rep 19, 693-718.
Biteau, B., Labarre, J., and Toledano, M. B. (2003). ATP-dependent reduction of cysteine-sulphinic acid by S. cerevisiae sulphiredoxin. Nature 425, 980-984.
Biterova, E. I., Turanov, A. A., Gladyshev, V. N., and Barycki, J. J. (2005). Crystal structures of oxidized and reduced mitochondrial thioredoxin reductase provide molecular details of the reaction mechanism. Proc Natl Acad Sci U S A 102, 15018-15023.
Bjornstedt, M., Hamberg, M., Kumar, S., Xue, J., and Holmgren, A. (1995). Human thioredoxin reductase directly reduces lipid hydroperoxides by NADPH and selenocystine strongly stimulates the reaction via catalytically generated selenols. J Biol Chem 270, 11761-11764.
Bodenstein, N. P., McIntosh, W. A., Vlantis, A. C., and Urquhart, A. C. (1993). Clinical signs of orbital ischemia in rhino-orbitocerebral mucormycosis. Laryngoscope 103, 1357-1361.
Bondareva, A. A., Capecchi, M. R., Iverson, S. V., Li, Y., Lopez, N. I., Lucas, O., Merrill, G. F., Prigge, J. R., Siders, A. M., Wakamiya, M., et al. (2007). Effects of thioredoxin reductase-1 deletion on embryogenesis and transcriptome. Free Radic Biol Med 43, 911-923.
Bosl, M. R., Takaku, K., Oshima, M., Nishimura, S., and Taketo, M. M. (1997). Early embryonic lethality caused by targeted disruption of the mouse selenocysteine tRNA gene (Trsp). Proc Natl Acad Sci U S A 94, 5531-5534.
Boveris, A. (1984). Determination of the production of superoxide radicals and hydrogen peroxide in mitochondria. Methods Enzymol 105, 429-435.
112
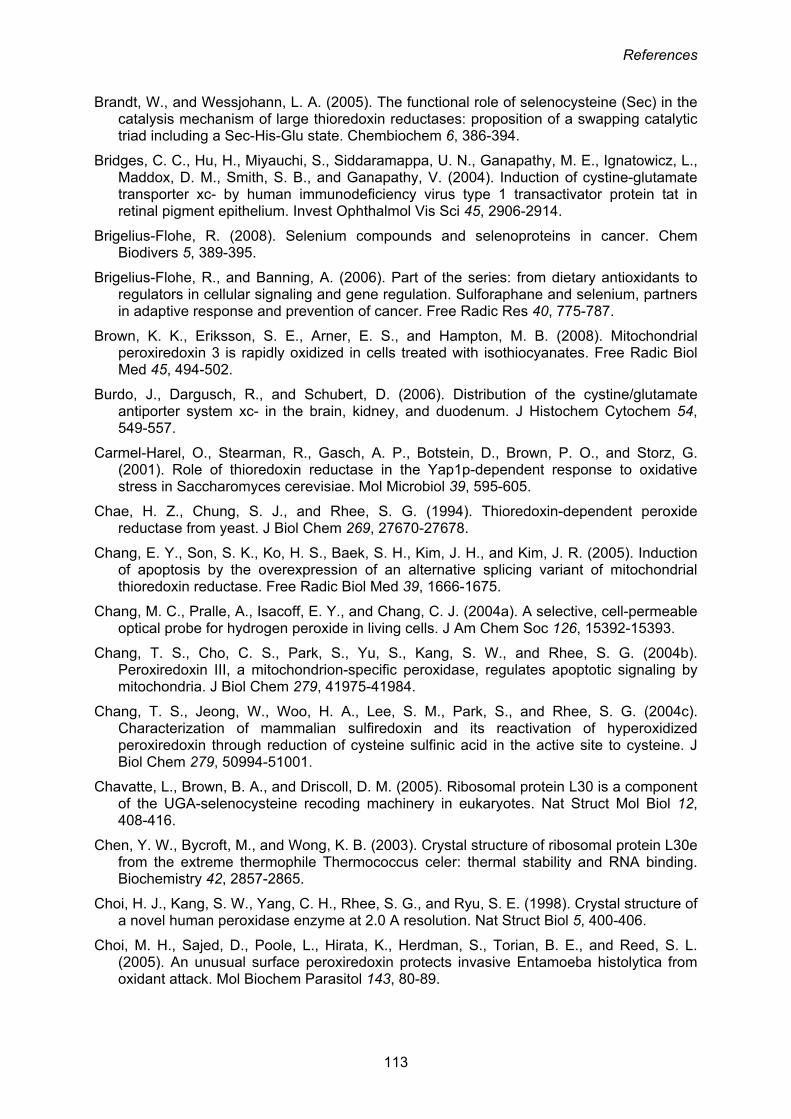
References
Brandt, W., and Wessjohann, L. A. (2005). The functional role of selenocysteine (Sec) in the catalysis mechanism of large thioredoxin reductases: proposition of a swapping catalytic triad including a Sec-His-Glu state. Chembiochem 6, 386-394.
Bridges, C. C., Hu, H., Miyauchi, S., Siddaramappa, U. N., Ganapathy, M. E., Ignatowicz, L., Maddox, D. M., Smith, S. B., and Ganapathy, V. (2004). Induction of cystine-glutamate transporter xc- by human immunodeficiency virus type 1 transactivator protein tat in retinal pigment epithelium. Invest Ophthalmol Vis Sci 45, 2906-2914.
Brigelius-Flohe, R. (2008). Selenium compounds and selenoproteins in cancer. Chem Biodivers 5, 389-395.
Brigelius-Flohe, R., and Banning, A. (2006). Part of the series: from dietary antioxidants to regulators in cellular signaling and gene regulation. Sulforaphane and selenium, partners in adaptive response and prevention of cancer. Free Radic Res 40, 775-787.
Brown, K. K., Eriksson, S. E., Arner, E. S., and Hampton, M. B. (2008). Mitochondrial peroxiredoxin 3 is rapidly oxidized in cells treated with isothiocyanates. Free Radic Biol Med 45, 494-502.
Burdo, J., Dargusch, R., and Schubert, D. (2006). Distribution of the cystine/glutamate antiporter system xc- in the brain, kidney, and duodenum. J Histochem Cytochem 54, 549-557.
Carmel-Harel, O., Stearman, R., Gasch, A. P., Botstein, D., Brown, P. O., and Storz, G. (2001). Role of thioredoxin reductase in the Yap1p-dependent response to oxidative stress in Saccharomyces cerevisiae. Mol Microbiol 39, 595-605.
Chae, H. Z., Chung, S. J., and Rhee, S. G. (1994). Thioredoxin-dependent peroxide reductase from yeast. J Biol Chem 269, 27670-27678.
Chang, E. Y., Son, S. K., Ko, H. S., Baek, S. H., Kim, J. H., and Kim, J. R. (2005). Induction of apoptosis by the overexpression of an alternative splicing variant of mitochondrial thioredoxin reductase. Free Radic Biol Med 39, 1666-1675.
Chang, M. C., Pralle, A., Isacoff, E. Y., and Chang, C. J. (2004a). A selective, cell-permeable optical probe for hydrogen peroxide in living cells. J Am Chem Soc 126, 15392-15393.
Chang, T. S., Cho, C. S., Park, S., Yu, S., Kang, S. W., and Rhee, S. G. (2004b). Peroxiredoxin III, a mitochondrion-specific peroxidase, regulates apoptotic signaling by mitochondria. J Biol Chem 279, 41975-41984.
Chang, T. S., Jeong, W., Woo, H. A., Lee, S. M., Park, S., and Rhee, S. G. (2004c). Characterization of mammalian sulfiredoxin and its reactivation of hyperoxidized peroxiredoxin through reduction of cysteine sulfinic acid in the active site to cysteine. J Biol Chem 279, 50994-51001.
Chavatte, L., Brown, B. A., and Driscoll, D. M. (2005). Ribosomal protein L30 is a component of the UGA-selenocysteine recoding machinery in eukaryotes. Nat Struct Mol Biol 12, 408-416.
Chen, Y. W., Bycroft, M., and Wong, K. B. (2003). Crystal structure of ribosomal protein L30e from the extreme thermophile Thermococcus celer: thermal stability and RNA binding. Biochemistry 42, 2857-2865.
Choi, H. J., Kang, S. W., Yang, C. H., Rhee, S. G., and Ryu, S. E. (1998). Crystal structure of a novel human peroxidase enzyme at 2.0 A resolution. Nat Struct Biol 5, 400-406.
Choi, M. H., Sajed, D., Poole, L., Hirata, K., Herdman, S., Torian, B. E., and Reed, S. L. (2005). An unusual surface peroxiredoxin protects invasive Entamoeba histolytica from oxidant attack. Mol Biochem Parasitol 143, 80-89.
113
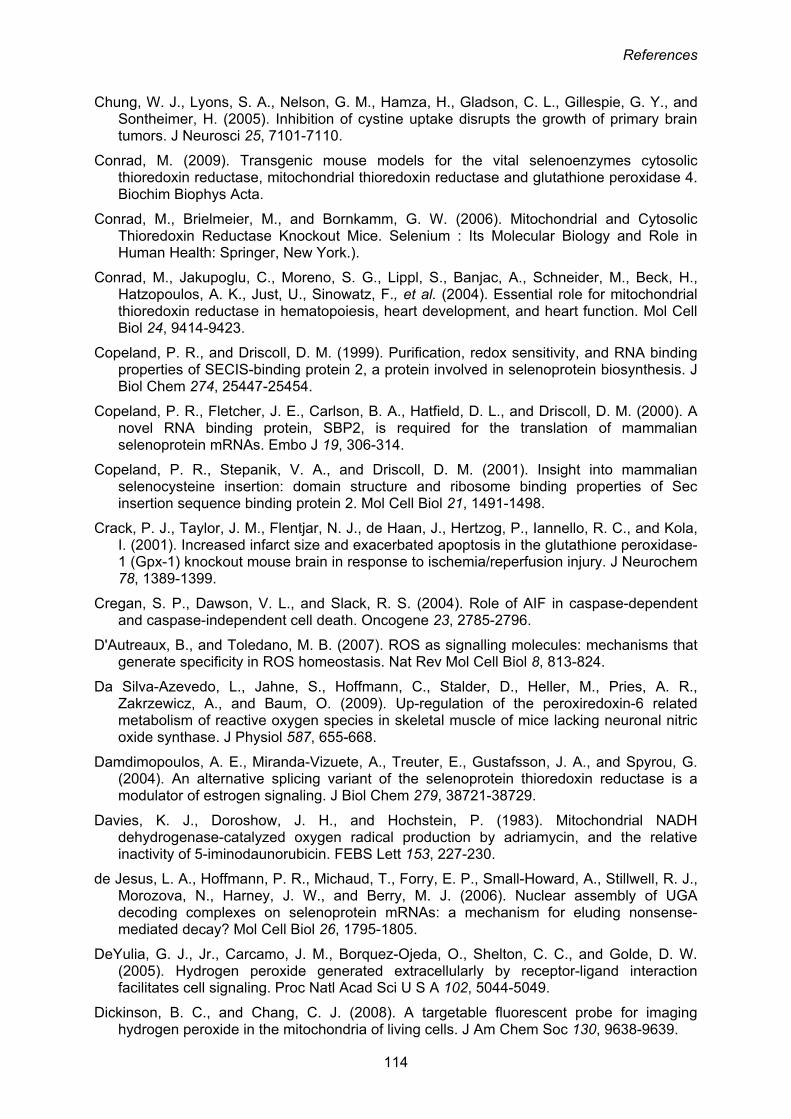
References
Chung, W. J., Lyons, S. A., Nelson, G. M., Hamza, H., Gladson, C. L., Gillespie, G. Y., and Sontheimer, H. (2005). Inhibition of cystine uptake disrupts the growth of primary brain tumors. J Neurosci 25, 7101-7110.
Conrad, M. (2009). Transgenic mouse models for the vital selenoenzymes cytosolic thioredoxin reductase, mitochondrial thioredoxin reductase and glutathione peroxidase 4. Biochim Biophys Acta.
Conrad, M., Brielmeier, M., and Bornkamm, G. W. (2006). Mitochondrial and Cytosolic Thioredoxin Reductase Knockout Mice. Selenium : Its Molecular Biology and Role in Human Health: Springer, New York.).
Conrad, M., Jakupoglu, C., Moreno, S. G., Lippl, S., Banjac, A., Schneider, M., Beck, H., Hatzopoulos, A. K., Just, U., Sinowatz, F., et al. (2004). Essential role for mitochondrial thioredoxin reductase in hematopoiesis, heart development, and heart function. Mol Cell Biol 24, 9414-9423.
Copeland, P. R., and Driscoll, D. M. (1999). Purification, redox sensitivity, and RNA binding properties of SECIS-binding protein 2, a protein involved in selenoprotein biosynthesis. J Biol Chem 274, 25447-25454.
Copeland, P. R., Fletcher, J. E., Carlson, B. A., Hatfield, D. L., and Driscoll, D. M. (2000). A novel RNA binding protein, SBP2, is required for the translation of mammalian selenoprotein mRNAs. Embo J 19, 306-314.
Copeland, P. R., Stepanik, V. A., and Driscoll, D. M. (2001). Insight into mammalian selenocysteine insertion: domain structure and ribosome binding properties of Sec insertion sequence binding protein 2. Mol Cell Biol 21, 1491-1498.
Crack, P. J., Taylor, J. M., Flentjar, N. J., de Haan, J., Hertzog, P., Iannello, R. C., and Kola, I. (2001). Increased infarct size and exacerbated apoptosis in the glutathione peroxidase-1 (Gpx-1) knockout mouse brain in response to ischemia/reperfusion injury. J Neurochem 78, 1389-1399.
Cregan, S. P., Dawson, V. L., and Slack, R. S. (2004). Role of AIF in caspase-dependent and caspase-independent cell death. Oncogene 23, 2785-2796.
D'Autreaux, B., and Toledano, M. B. (2007). ROS as signalling molecules: mechanisms that generate specificity in ROS homeostasis. Nat Rev Mol Cell Biol 8, 813-824.
Da Silva-Azevedo, L., Jahne, S., Hoffmann, C., Stalder, D., Heller, M., Pries, A. R., Zakrzewicz, A., and Baum, O. (2009). Up-regulation of the peroxiredoxin-6 related metabolism of reactive oxygen species in skeletal muscle of mice lacking neuronal nitric oxide synthase. J Physiol 587, 655-668.
Damdimopoulos, A. E., Miranda-Vizuete, A., Treuter, E., Gustafsson, J. A., and Spyrou, G. (2004). An alternative splicing variant of the selenoprotein thioredoxin reductase is a modulator of estrogen signaling. J Biol Chem 279, 38721-38729.
Davies, K. J., Doroshow, J. H., and Hochstein, P. (1983). Mitochondrial NADH dehydrogenase-catalyzed oxygen radical production by adriamycin, and the relative inactivity of 5-iminodaunorubicin. FEBS Lett 153, 227-230.
de Jesus, L. A., Hoffmann, P. R., Michaud, T., Forry, E. P., Small-Howard, A., Stillwell, R. J., Morozova, N., Harney, J. W., and Berry, M. J. (2006). Nuclear assembly of UGA decoding complexes on selenoprotein mRNAs: a mechanism for eluding nonsense-mediated decay? Mol Cell Biol 26, 1795-1805.
DeYulia, G. J., Jr., Carcamo, J. M., Borquez-Ojeda, O., Shelton, C. C., and Golde, D. W. (2005). Hydrogen peroxide generated extracellularly by receptor-ligand interaction facilitates cell signaling. Proc Natl Acad Sci U S A 102, 5044-5049.
Dickinson, B. C., and Chang, C. J. (2008). A targetable fluorescent probe for imaging hydrogen peroxide in the mitochondria of living cells. J Am Chem Soc 130, 9638-9639.
114
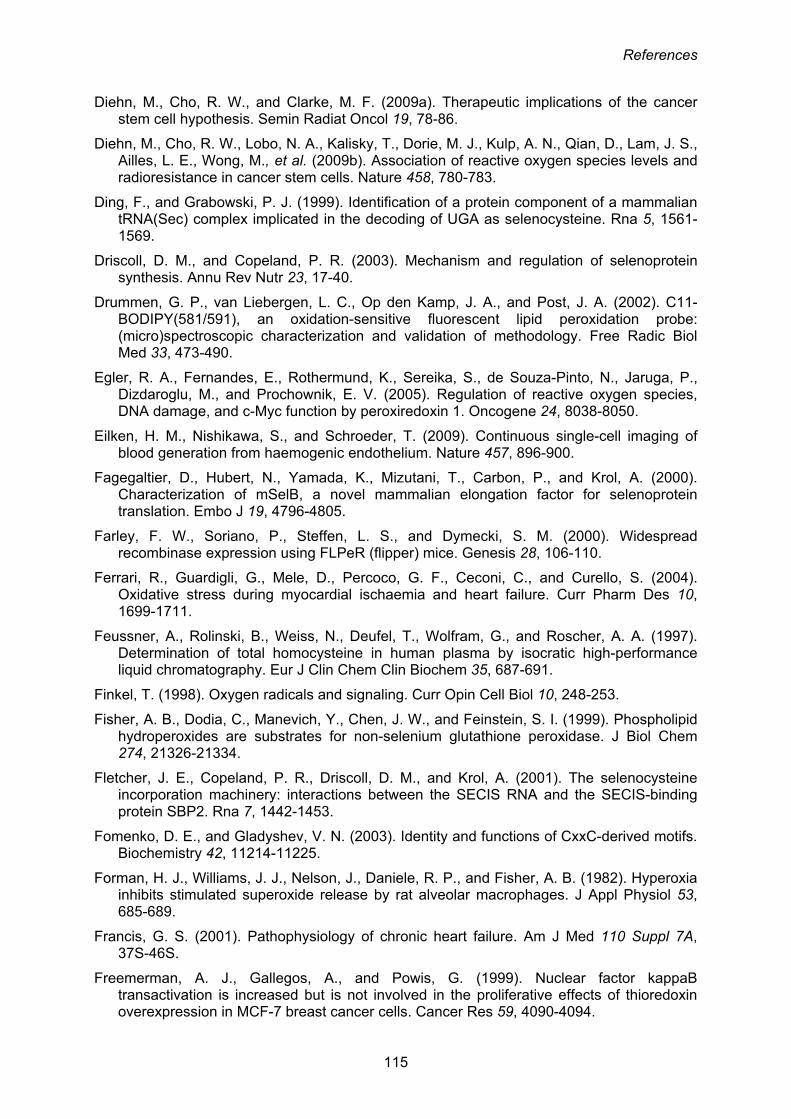
References
Diehn, M., Cho, R. W., and Clarke, M. F. (2009a). Therapeutic implications of the cancer stem cell hypothesis. Semin Radiat Oncol 19, 78-86.
Diehn, M., Cho, R. W., Lobo, N. A., Kalisky, T., Dorie, M. J., Kulp, A. N., Qian, D., Lam, J. S., Ailles, L. E., Wong, M., et al. (2009b). Association of reactive oxygen species levels and radioresistance in cancer stem cells. Nature 458, 780-783.
Ding, F., and Grabowski, P. J. (1999). Identification of a protein component of a mammalian tRNA(Sec) complex implicated in the decoding of UGA as selenocysteine. Rna 5, 1561-1569.
Driscoll, D. M., and Copeland, P. R. (2003). Mechanism and regulation of selenoprotein synthesis. Annu Rev Nutr 23, 17-40.
Drummen, G. P., van Liebergen, L. C., Op den Kamp, J. A., and Post, J. A. (2002). C11-BODIPY(581/591), an oxidation-sensitive fluorescent lipid peroxidation probe: (micro)spectroscopic characterization and validation of methodology. Free Radic Biol Med 33, 473-490.
Egler, R. A., Fernandes, E., Rothermund, K., Sereika, S., de Souza-Pinto, N., Jaruga, P., Dizdaroglu, M., and Prochownik, E. V. (2005). Regulation of reactive oxygen species, DNA damage, and c-Myc function by peroxiredoxin 1. Oncogene 24, 8038-8050.
Eilken, H. M., Nishikawa, S., and Schroeder, T. (2009). Continuous single-cell imaging of blood generation from haemogenic endothelium. Nature 457, 896-900.
Fagegaltier, D., Hubert, N., Yamada, K., Mizutani, T., Carbon, P., and Krol, A. (2000). Characterization of mSelB, a novel mammalian elongation factor for selenoprotein translation. Embo J 19, 4796-4805.
Farley, F. W., Soriano, P., Steffen, L. S., and Dymecki, S. M. (2000). Widespread recombinase expression using FLPeR (flipper) mice. Genesis 28, 106-110.
Ferrari, R., Guardigli, G., Mele, D., Percoco, G. F., Ceconi, C., and Curello, S. (2004). Oxidative stress during myocardial ischaemia and heart failure. Curr Pharm Des 10, 1699-1711.
Feussner, A., Rolinski, B., Weiss, N., Deufel, T., Wolfram, G., and Roscher, A. A. (1997). Determination of total homocysteine in human plasma by isocratic high-performance liquid chromatography. Eur J Clin Chem Clin Biochem 35, 687-691.
Finkel, T. (1998). Oxygen radicals and signaling. Curr Opin Cell Biol 10, 248-253.
Fisher, A. B., Dodia, C., Manevich, Y., Chen, J. W., and Feinstein, S. I. (1999). Phospholipid hydroperoxides are substrates for non-selenium glutathione peroxidase. J Biol Chem 274, 21326-21334.
Fletcher, J. E., Copeland, P. R., Driscoll, D. M., and Krol, A. (2001). The selenocysteine incorporation machinery: interactions between the SECIS RNA and the SECIS-binding protein SBP2. Rna 7, 1442-1453.
Fomenko, D. E., and Gladyshev, V. N. (2003). Identity and functions of CxxC-derived motifs. Biochemistry 42, 11214-11225.
Forman, H. J., Williams, J. J., Nelson, J., Daniele, R. P., and Fisher, A. B. (1982). Hyperoxia inhibits stimulated superoxide release by rat alveolar macrophages. J Appl Physiol 53, 685-689.
Francis, G. S. (2001). Pathophysiology of chronic heart failure. Am J Med 110 Suppl 7A, 37S-46S.
Freemerman, A. J., Gallegos, A., and Powis, G. (1999). Nuclear factor kappaB transactivation is increased but is not involved in the proliferative effects of thioredoxin overexpression in MCF-7 breast cancer cells. Cancer Res 59, 4090-4094.
115
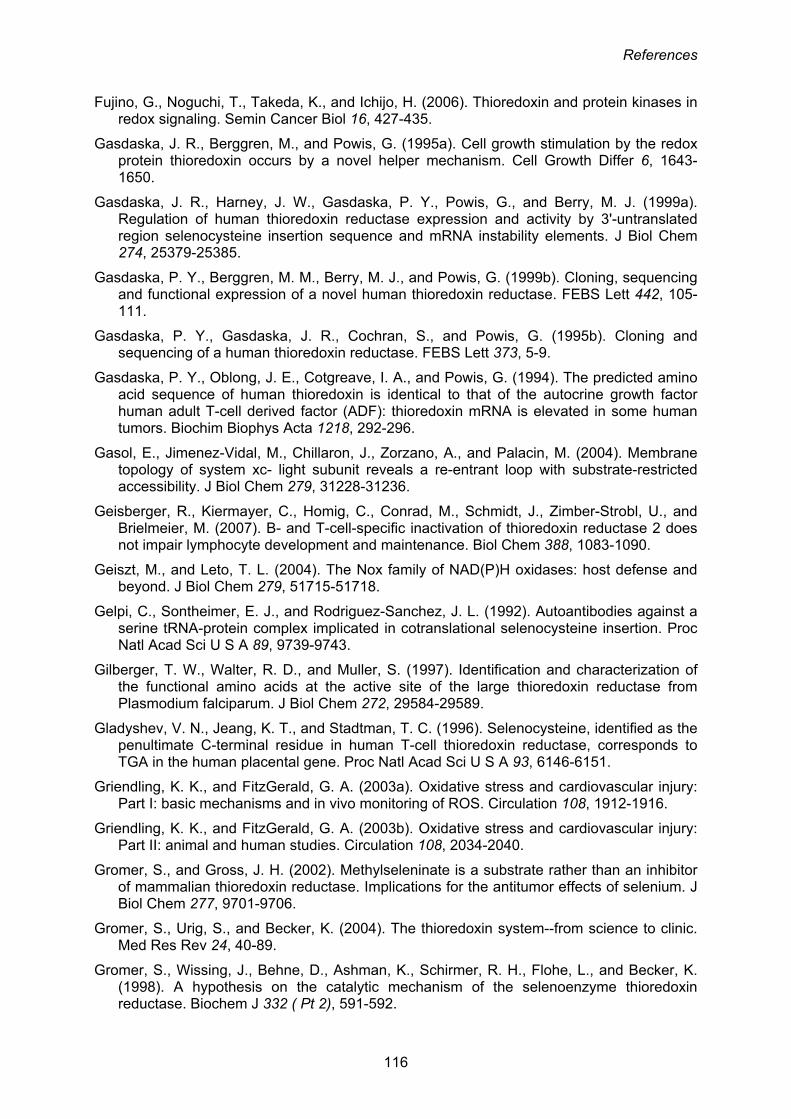
References
Fujino, G., Noguchi, T., Takeda, K., and Ichijo, H. (2006). Thioredoxin and protein kinases in redox signaling. Semin Cancer Biol 16, 427-435.
Gasdaska, J. R., Berggren, M., and Powis, G. (1995a). Cell growth stimulation by the redox protein thioredoxin occurs by a novel helper mechanism. Cell Growth Differ 6, 1643-1650.
Gasdaska, J. R., Harney, J. W., Gasdaska, P. Y., Powis, G., and Berry, M. J. (1999a). Regulation of human thioredoxin reductase expression and activity by 3'-untranslated region selenocysteine insertion sequence and mRNA instability elements. J Biol Chem 274, 25379-25385.
Gasdaska, P. Y., Berggren, M. M., Berry, M. J., and Powis, G. (1999b). Cloning, sequencing and functional expression of a novel human thioredoxin reductase. FEBS Lett 442, 105-111.
Gasdaska, P. Y., Gasdaska, J. R., Cochran, S., and Powis, G. (1995b). Cloning and sequencing of a human thioredoxin reductase. FEBS Lett 373, 5-9.
Gasdaska, P. Y., Oblong, J. E., Cotgreave, I. A., and Powis, G. (1994). The predicted amino acid sequence of human thioredoxin is identical to that of the autocrine growth factor human adult T-cell derived factor (ADF): thioredoxin mRNA is elevated in some human tumors. Biochim Biophys Acta 1218, 292-296.
Gasol, E., Jimenez-Vidal, M., Chillaron, J., Zorzano, A., and Palacin, M. (2004). Membrane topology of system xc- light subunit reveals a re-entrant loop with substrate-restricted accessibility. J Biol Chem 279, 31228-31236.
Geisberger, R., Kiermayer, C., Homig, C., Conrad, M., Schmidt, J., Zimber-Strobl, U., and Brielmeier, M. (2007). B- and T-cell-specific inactivation of thioredoxin reductase 2 does not impair lymphocyte development and maintenance. Biol Chem 388, 1083-1090.
Geiszt, M., and Leto, T. L. (2004). The Nox family of NAD(P)H oxidases: host defense and beyond. J Biol Chem 279, 51715-51718.
Gelpi, C., Sontheimer, E. J., and Rodriguez-Sanchez, J. L. (1992). Autoantibodies against a serine tRNA-protein complex implicated in cotranslational selenocysteine insertion. Proc Natl Acad Sci U S A 89, 9739-9743.
Gilberger, T. W., Walter, R. D., and Muller, S. (1997). Identification and characterization of the functional amino acids at the active site of the large thioredoxin reductase from Plasmodium falciparum. J Biol Chem 272, 29584-29589.
Gladyshev, V. N., Jeang, K. T., and Stadtman, T. C. (1996). Selenocysteine, identified as the penultimate C-terminal residue in human T-cell thioredoxin reductase, corresponds to TGA in the human placental gene. Proc Natl Acad Sci U S A 93, 6146-6151.
Griendling, K. K., and FitzGerald, G. A. (2003a). Oxidative stress and cardiovascular injury: Part I: basic mechanisms and in vivo monitoring of ROS. Circulation 108, 1912-1916.
Griendling, K. K., and FitzGerald, G. A. (2003b). Oxidative stress and cardiovascular injury: Part II: animal and human studies. Circulation 108, 2034-2040.
Gromer, S., and Gross, J. H. (2002). Methylseleninate is a substrate rather than an inhibitor of mammalian thioredoxin reductase. Implications for the antitumor effects of selenium. J Biol Chem 277, 9701-9706.
Gromer, S., Urig, S., and Becker, K. (2004). The thioredoxin system--from science to clinic. Med Res Rev 24, 40-89.
Gromer, S., Wissing, J., Behne, D., Ashman, K., Schirmer, R. H., Flohe, L., and Becker, K. (1998). A hypothesis on the catalytic mechanism of the selenoenzyme thioredoxin reductase. Biochem J 332 ( Pt 2), 591-592.
116
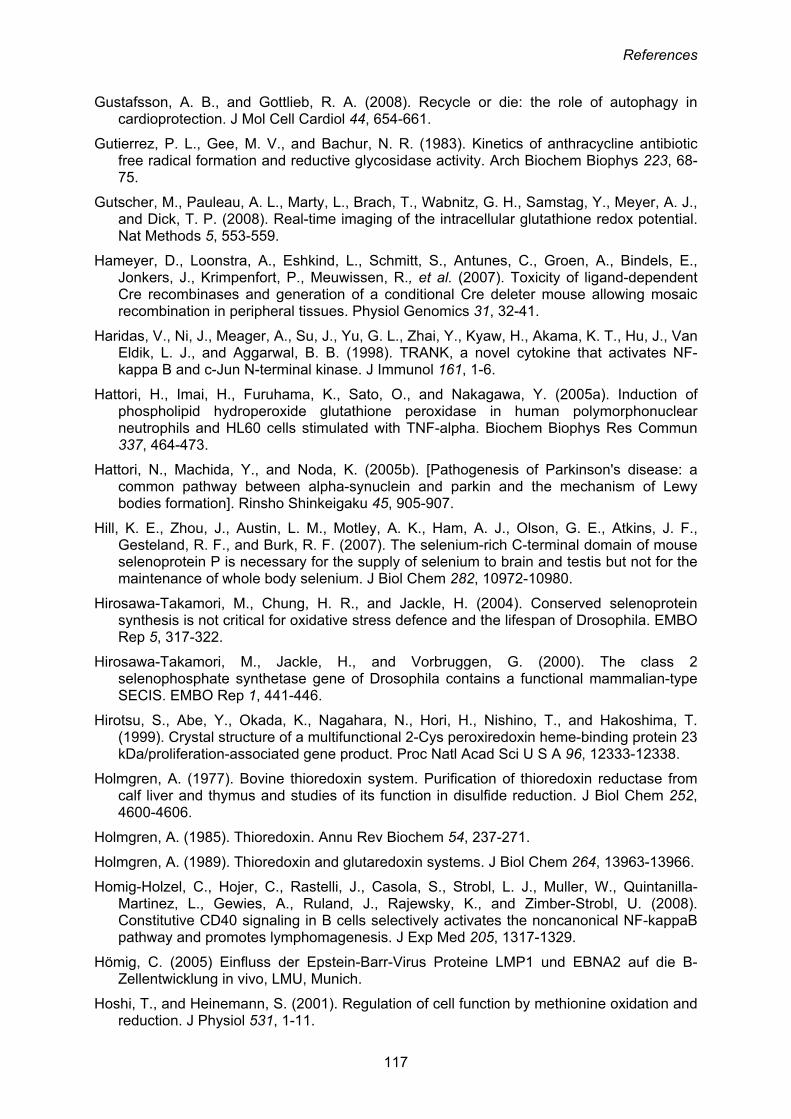
References
Gustafsson, A. B., and Gottlieb, R. A. (2008). Recycle or die: the role of autophagy in cardioprotection. J Mol Cell Cardiol 44, 654-661.
Gutierrez, P. L., Gee, M. V., and Bachur, N. R. (1983). Kinetics of anthracycline antibiotic free radical formation and reductive glycosidase activity. Arch Biochem Biophys 223, 68-75.
Gutscher, M., Pauleau, A. L., Marty, L., Brach, T., Wabnitz, G. H., Samstag, Y., Meyer, A. J., and Dick, T. P. (2008). Real-time imaging of the intracellular glutathione redox potential. Nat Methods 5, 553-559.
Hameyer, D., Loonstra, A., Eshkind, L., Schmitt, S., Antunes, C., Groen, A., Bindels, E., Jonkers, J., Krimpenfort, P., Meuwissen, R., et al. (2007). Toxicity of ligand-dependent Cre recombinases and generation of a conditional Cre deleter mouse allowing mosaic recombination in peripheral tissues. Physiol Genomics 31, 32-41.
Haridas, V., Ni, J., Meager, A., Su, J., Yu, G. L., Zhai, Y., Kyaw, H., Akama, K. T., Hu, J., Van Eldik, L. J., and Aggarwal, B. B. (1998). TRANK, a novel cytokine that activates NF-kappa B and c-Jun N-terminal kinase. J Immunol 161, 1-6.
Hattori, H., Imai, H., Furuhama, K., Sato, O., and Nakagawa, Y. (2005a). Induction of phospholipid hydroperoxide glutathione peroxidase in human polymorphonuclear neutrophils and HL60 cells stimulated with TNF-alpha. Biochem Biophys Res Commun 337, 464-473.
Hattori, N., Machida, Y., and Noda, K. (2005b). [Pathogenesis of Parkinson's disease: a common pathway between alpha-synuclein and parkin and the mechanism of Lewy bodies formation]. Rinsho Shinkeigaku 45, 905-907.
Hill, K. E., Zhou, J., Austin, L. M., Motley, A. K., Ham, A. J., Olson, G. E., Atkins, J. F., Gesteland, R. F., and Burk, R. F. (2007). The selenium-rich C-terminal domain of mouse selenoprotein P is necessary for the supply of selenium to brain and testis but not for the maintenance of whole body selenium. J Biol Chem 282, 10972-10980.
Hirosawa-Takamori, M., Chung, H. R., and Jackle, H. (2004). Conserved selenoprotein synthesis is not critical for oxidative stress defence and the lifespan of Drosophila. EMBO Rep 5, 317-322.
Hirosawa-Takamori, M., Jackle, H., and Vorbruggen, G. (2000). The class 2 selenophosphate synthetase gene of Drosophila contains a functional mammalian-type SECIS. EMBO Rep 1, 441-446.
Hirotsu, S., Abe, Y., Okada, K., Nagahara, N., Hori, H., Nishino, T., and Hakoshima, T. (1999). Crystal structure of a multifunctional 2-Cys peroxiredoxin heme-binding protein 23 kDa/proliferation-associated gene product. Proc Natl Acad Sci U S A 96, 12333-12338.
Holmgren, A. (1977). Bovine thioredoxin system. Purification of thioredoxin reductase from calf liver and thymus and studies of its function in disulfide reduction. J Biol Chem 252, 4600-4606.
Holmgren, A. (1985). Thioredoxin. Annu Rev Biochem 54, 237-271.
Holmgren, A. (1989). Thioredoxin and glutaredoxin systems. J Biol Chem 264, 13963-13966.
Homig-Holzel, C., Hojer, C., Rastelli, J., Casola, S., Strobl, L. J., Muller, W., Quintanilla-Martinez, L., Gewies, A., Ruland, J., Rajewsky, K., and Zimber-Strobl, U. (2008). Constitutive CD40 signaling in B cells selectively activates the noncanonical NF-kappaB pathway and promotes lymphomagenesis. J Exp Med 205, 1317-1329.
Hömig, C. (2005) Einfluss der Epstein-Barr-Virus Proteine LMP1 und EBNA2 auf die B-Zellentwicklung in vivo, LMU, Munich.
Hoshi, T., and Heinemann, S. (2001). Regulation of cell function by methionine oxidation and reduction. J Physiol 531, 1-11.
117

References
Ide, T., Tsutsui, H., Kinugawa, S., Suematsu, N., Hayashidani, S., Ichikawa, K., Utsumi, H., Machida, Y., Egashira, K., and Takeshita, A. (2000). Direct evidence for increased hydroxyl radicals originating from superoxide in the failing myocardium. Circ Res 86, 152-157.
Ikeda, K., Kumagai, Y., Nagano, Y., Matsuzawa, N., and Kojo, S. (2003). Change in the concentration of vitamins C and E in rat tissues by paraquat administration. Biosci Biotechnol Biochem 67, 1130-1131.
Ito, K., Hirao, A., Arai, F., Matsuoka, S., Takubo, K., Hamaguchi, I., Nomiyama, K., Hosokawa, K., Sakurada, K., Nakagata, N., et al. (2004). Regulation of oxidative stress by ATM is required for self-renewal of haematopoietic stem cells. Nature 431, 997-1002.
Ito, K., Hirao, A., Arai, F., Takubo, K., Matsuoka, S., Miyamoto, K., Ohmura, M., Naka, K., Hosokawa, K., Ikeda, Y., and Suda, T. (2006). Reactive oxygen species act through p38 MAPK to limit the lifespan of hematopoietic stem cells. Nat Med 12, 446-451.
Itoh, N., Cao, J., Chen, Z. H., Yoshida, Y., and Niki, E. (2007). Advantages and limitation of BODIPY as a probe for the evaluation of lipid peroxidation and its inhibition by antioxidants in plasma. Bioorg Med Chem Lett 17, 2059-2063.
Ivanova, A., Signore, M., Caro, N., Greene, N. D., Copp, A. J., and Martinez-Barbera, J. P. (2005). In vivo genetic ablation by Cre-mediated expression of diphtheria toxin fragment A. Genesis 43, 129-135.
Jager, R., Maurer, J., Jacob, A., and Schorle, H. (2004). Cell type-specific conditional regulation of the c-myc proto-oncogene by combining Cre/loxP recombination and tamoxifen-mediated activation. Genesis 38, 145-150.
Jakupoglu, C., Przemeck, G. K., Schneider, M., Moreno, S. G., Mayr, N., Hatzopoulos, A. K., de Angelis, M. H., Wurst, W., Bornkamm, G. W., Brielmeier, M., and Conrad, M. (2005). Cytoplasmic thioredoxin reductase is essential for embryogenesis but dispensable for cardiac development. Mol Cell Biol 25, 1980-1988.
Jeong, W., Park, S. J., Chang, T. S., Lee, D. Y., and Rhee, S. G. (2006). Molecular mechanism of the reduction of cysteine sulfinic acid of peroxiredoxin to cysteine by mammalian sulfiredoxin. J Biol Chem 281, 14400-14407.
Jin, D. Y., Chae, H. Z., Rhee, S. G., and Jeang, K. T. (1997). Regulatory role for a novel human thioredoxin peroxidase in NF-kappaB activation. J Biol Chem 272, 30952-30961.
Jing, Y., Dai, J., Chalmers-Redman, R. M., Tatton, W. G., and Waxman, S. (1999). Arsenic trioxide selectively induces acute promyelocytic leukemia cell apoptosis via a hydrogen peroxide-dependent pathway. Blood 94, 2102-2111.
Jones, D. P., Go, Y. M., Anderson, C. L., Ziegler, T. R., Kinkade, J. M., Jr., and Kirlin, W. G. (2004). Cysteine/cystine couple is a newly recognized node in the circuitry for biologic redox signaling and control. Faseb J 18, 1246-1248.
Jonsson, T. J., Tsang, A. W., Lowther, W. T., and Furdui, C. M. (2008). Identification of intact protein thiosulfinate intermediate in the reduction of cysteine sulfinic acid in peroxiredoxin by human sulfiredoxin. J Biol Chem 283, 22890-22894.
Kang, S. W., Baines, I. C., and Rhee, S. G. (1998a). Characterization of a mammalian peroxiredoxin that contains one conserved cysteine. J Biol Chem 273, 6303-6311.
Kang, S. W., Chae, H. Z., Seo, M. S., Kim, K., Baines, I. C., and Rhee, S. G. (1998b). Mammalian peroxiredoxin isoforms can reduce hydrogen peroxide generated in response to growth factors and tumor necrosis factor-alpha. J Biol Chem 273, 6297-6302.
Kang, S. W., Chang, T. S., Lee, T. H., Kim, E. S., Yu, D. Y., and Rhee, S. G. (2004). Cytosolic peroxiredoxin attenuates the activation of Jnk and p38 but potentiates that of Erk in Hela cells stimulated with tumor necrosis factor-alpha. J Biol Chem 279, 2535-2543.
118
References
Karunagaran, D., Joseph, J., and Kumar, T. R. (2007). Cell growth regulation. Adv Exp Med Biol 595, 245-268.
Keightley, J. A., Anitori, R., Burton, M. D., Quan, F., Buist, N. R., and Kennaway, N. G. (2000). Mitochondrial encephalomyopathy and complex III deficiency associated with a stop-codon mutation in the cytochrome b gene. Am J Hum Genet 67, 1400-1410.
Kiermayer, C., Michalke, B., Schmidt, J., and Brielmeier, M. (2007). Effect of selenium on thioredoxin reductase activity in Txnrd1 or Txnrd2 hemizygous mice. Biol Chem 388, 1091-1097.
Kim, H. J., Chae, H. Z., Kim, Y. J., Kim, Y. H., Hwangs, T. S., Park, E. M., and Park, Y. M. (2003a). Preferential elevation of Prx I and Trx expression in lung cancer cells following hypoxia and in human lung cancer tissues. Cell Biol Toxicol 19, 285-298.
Kim, M. R., Chang, H. S., Kim, B. H., Kim, S., Baek, S. H., Kim, J. H., Lee, S. R., and Kim, J. R. (2003b). Involvements of mitochondrial thioredoxin reductase (TrxR2) in cell proliferation. Biochem Biophys Res Commun 304, 119-124.
Kim, S. Y., Kim, T. J., and Lee, K. Y. (2008). A novel function of peroxiredoxin 1 (Prx-1) in apoptosis signal-regulating kinase 1 (ASK1)-mediated signaling pathway. FEBS Lett 582, 1913-1918.
Kinnula, V. L., Lehtonen, S., Kaarteenaho-Wiik, R., Lakari, E., Paakko, P., Kang, S. W., Rhee, S. G., and Soini, Y. (2002). Cell specific expression of peroxiredoxins in human lung and pulmonary sarcoidosis. Thorax 57, 157-164.
Kinzy, S. A., Caban, K., and Copeland, P. R. (2005). Characterization of the SECIS binding protein 2 complex required for the co-translational insertion of selenocysteine in mammals. Nucleic Acids Res 33, 5172-5180.
Krol, A. (2002). Evolutionarily different RNA motifs and RNA-protein complexes to achieve selenoprotein synthesis. Biochimie 84, 765-774.
Kumar, S., Bjornstedt, M., and Holmgren, A. (1992). Selenite is a substrate for calf thymus thioredoxin reductase and thioredoxin and elicits a large non-stoichiometric oxidation of NADPH in the presence of oxygen. Eur J Biochem 207, 435-439.
Kwon, J., Lee, S. R., Yang, K. S., Ahn, Y., Kim, Y. J., Stadtman, E. R., and Rhee, S. G. (2004). Reversible oxidation and inactivation of the tumor suppressor PTEN in cells stimulated with peptide growth factors. Proc Natl Acad Sci U S A 101, 16419-16424.
Lammers, M., and Follmann, H. (1984). Deoxyribonucleotide biosynthesis in yeast (Saccharomyces cerevisiae). A ribonucleotide reductase system of sufficient activity for DNA synthesis. Eur J Biochem 140, 281-287.
Laurent, A., Nicco, C., Chereau, C., Goulvestre, C., Alexandre, J., Alves, A., Levy, E., Goldwasser, F., Panis, Y., Soubrane, O., et al. (2005). Controlling tumor growth by modulating endogenous production of reactive oxygen species. Cancer Res 65, 948-956.
Laurent, T. C., Moore, E. C., and Reichard, P. (1964). Enzymatic Synthesis of Deoxyribonucleotides. Iv. Isolation and Characterization of Thioredoxin, the Hydrogen Donor from Escherichia Coli B. J Biol Chem 239, 3436-3444.
Lebovitz, R. M., Zhang, H., Vogel, H., Cartwright, J., Jr., Dionne, L., Lu, N., Huang, S., and Matzuk, M. M. (1996). Neurodegeneration, myocardial injury, and perinatal death in mitochondrial superoxide dismutase-deficient mice. Proc Natl Acad Sci U S A 93, 9782-9787.
Lee, S. R., Kim, J. R., Kwon, K. S., Yoon, H. W., Levine, R. L., Ginsburg, A., and Rhee, S. G. (1999). Molecular cloning and characterization of a mitochondrial selenocysteine-containing thioredoxin reductase from rat liver. J Biol Chem 274, 4722-4734.
119
References
Lerman-Sagie, T., Rustin, P., Lev, D., Yanoov, M., Leshinsky-Silver, E., Sagie, A., Ben-Gal, T., and Munnich, A. (2001). Dramatic improvement in mitochondrial cardiomyopathy following treatment with idebenone. J Inherit Metab Dis 24, 28-34.
Lescure, A., Gautheret, D., Carbon, P., and Krol, A. (1999). Novel selenoproteins identified in silico and in vivo by using a conserved RNA structural motif. J Biol Chem 274, 38147-38154.
Li, L., Shoji, W., Takano, H., Nishimura, N., Aoki, Y., Takahashi, R., Goto, S., Kaifu, T., Takai, T., and Obinata, M. (2007). Increased susceptibility of MER5 (peroxiredoxin III) knockout mice to LPS-induced oxidative stress. Biochem Biophys Res Commun 355, 715-721.
Lim, J. C., Choi, H. I., Park, Y. S., Nam, H. W., Woo, H. A., Kwon, K. S., Kim, Y. S., Rhee, S. G., Kim, K., and Chae, H. Z. (2008). Irreversible oxidation of the active-site cysteine of peroxiredoxin to cysteine sulfonic acid for enhanced molecular chaperone activity. J Biol Chem 283, 28873-28880.
Lothrop, A. P., Ruggles, E. L., and Hondal, R. J. (2009). No selenium required: reactions catalyzed by mammalian thioredoxin reductase that are independent of a selenocysteine residue. Biochemistry 48, 6213-6223.
Low, S. C., and Berry, M. J. (1996). Knowing when not to stop: selenocysteine incorporation in eukaryotes. Trends Biochem Sci 21, 203-208.
Lu, J., Chew, E. H., and Holmgren, A. (2007). Targeting thioredoxin reductase is a basis for cancer therapy by arsenic trioxide. Proc Natl Acad Sci U S A 104, 12288-12293.
Maiti, B., Arbogast, S., Allamand, V., Moyle, M. W., Anderson, C. B., Richard, P., Guicheney, P., Ferreiro, A., Flanigan, K. M., and Howard, M. T. (2009). A mutation in the SEPN1 selenocysteine redefinition element (SRE) reduces selenocysteine incorporation and leads to SEPN1-related myopathy. Hum Mutat 30, 411-416.
Martins, N. M., Santos, N. A., Curti, C., Bianchi, M. L., and Santos, A. C. (2008). Cisplatin induces mitochondrial oxidative stress with resultant energetic metabolism impairment, membrane rigidification and apoptosis in rat liver. J Appl Toxicol 28, 337-344.
Massie, A., Schallier, A., Mertens, B., Vermoesen, K., Bannai, S., Sato, H., Smolders, I., and Michotte, Y. (2008). Time-dependent changes in striatal xCT protein expression in hemi-Parkinson rats. Neuroreport 19, 1589-1592.
Matsui, M., Oshima, M., Oshima, H., Takaku, K., Maruyama, T., Yodoi, J., and Taketo, M. M. (1996). Early embryonic lethality caused by targeted disruption of the mouse thioredoxin gene. Dev Biol 178, 179-185.
Matsushima, S., Ide, T., Yamato, M., Matsusaka, H., Hattori, F., Ikeuchi, M., Kubota, T., Sunagawa, K., Hasegawa, Y., Kurihara, T., et al. (2006). Overexpression of mitochondrial peroxiredoxin-3 prevents left ventricular remodeling and failure after myocardial infarction in mice. Circulation 113, 1779-1786.
Maulik, N., Yoshida, T., Engelman, R. M., Deaton, D., Flack, J. E., 3rd, Rousou, J. A., and Das, D. K. (1998). Ischemic preconditioning attenuates apoptotic cell death associated with ischemia/reperfusion. Mol Cell Biochem 186, 139-145.
May, J. M., Cobb, C. E., Mendiratta, S., Hill, K. E., and Burk, R. F. (1998). Reduction of the ascorbyl free radical to ascorbate by thioredoxin reductase. J Biol Chem 273, 23039-23045.
Mazumder, S., Plesca, D., and Almasan, A. (2007). A jekyll and hyde role of cyclin E in the genotoxic stress response: switching from cell cycle control to apoptosis regulation. Cell Cycle 6, 1437-1442.
120
References
Miller, E. W., Albers, A. E., Pralle, A., Isacoff, E. Y., and Chang, C. J. (2005). Boronate-based fluorescent probes for imaging cellular hydrogen peroxide. J Am Chem Soc 127, 16652-16659.
Miranda-Vizuete, A., Damdimopoulos, A. E., Pedrajas, J. R., Gustafsson, J. A., and Spyrou, G. (1999). Human mitochondrial thioredoxin reductase cDNA cloning, expression and genomic organization. Eur J Biochem 261, 405-412.
Miranda-Vizuete, A., and Spyrou, G. (2002). Genomic organization and identification of a novel alternative splicing variant of mouse mitochondrial thioredoxin reductase (TrxR2) gene. Mol Cells 13, 488-492.
Mizusawa, H., Ishii, T., and Bannai, S. (2000). Peroxiredoxin I (macrophage 23 kDa stress protein) is highly and widely expressed in the rat nervous system. Neurosci Lett 283, 57-60.
Moghadaszadeh, B., Petit, N., Jaillard, C., Brockington, M., Roy, S. Q., Merlini, L., Romero, N., Estournet, B., Desguerre, I., Chaigne, D., et al. (2001). Mutations in SEPN1 cause congenital muscular dystrophy with spinal rigidity and restrictive respiratory syndrome. Nat Genet 29, 17-18.
Moos, P. J., Edes, K., Cassidy, P., Massuda, E., and Fitzpatrick, F. A. (2003). Electrophilic prostaglandins and lipid aldehydes repress redox-sensitive transcription factors p53 and hypoxia-inducible factor by impairing the selenoprotein thioredoxin reductase. J Biol Chem 278, 745-750.
Nalvarte, I., Damdimopoulos, A. E., Nystom, C., Nordman, T., Miranda-Vizuete, A., Olsson, J. M., Eriksson, L., Bjornstedt, M., Arner, E. S., and Spyrou, G. (2004a). Overexpression of enzymatically active human cytosolic and mitochondrial thioredoxin reductase in HEK-293 cells. Effect on cell growth and differentiation. J Biol Chem 279, 54510-54517.
Nalvarte, I., Damdimopoulos, A. E., and Spyrou, G. (2004b). Human mitochondrial thioredoxin reductase reduces cytochrome c and confers resistance to complex III inhibition. Free Radic Biol Med 36, 1270-1278.
Nguyen, P., Awwad, R. T., Smart, D. D., Spitz, D. R., and Gius, D. (2006). Thioredoxin reductase as a novel molecular target for cancer therapy. Cancer Lett 236, 164-174.
Noh, D. Y., Ahn, S. J., Lee, R. A., Kim, S. W., Park, I. A., and Chae, H. Z. (2001). Overexpression of peroxiredoxin in human breast cancer. Anticancer Res 21, 2085-2090.
Noh, Y. H., Baek, J. Y., Jeong, W., Rhee, S. G., and Chang, T. S. (2009). Sulfiredoxin Translocation into Mitochondria Plays a Crucial Role in Reducing Hyperoxidized Peroxiredoxin III. J Biol Chem 284, 8470-8477.
Nonn, L., Berggren, M., and Powis, G. (2003a). Increased expression of mitochondrial peroxiredoxin-3 (thioredoxin peroxidase-2) protects cancer cells against hypoxia and drug-induced hydrogen peroxide-dependent apoptosis. Mol Cancer Res 1, 682-689.
Nonn, L., Williams, R. R., Erickson, R. P., and Powis, G. (2003b). The absence of mitochondrial thioredoxin 2 causes massive apoptosis, exencephaly, and early embryonic lethality in homozygous mice. Mol Cell Biol 23, 916-922.
Nordberg, J., and Arner, E. S. (2001). Reactive oxygen species, antioxidants, and the mammalian thioredoxin system. Free Radic Biol Med 31, 1287-1312.
Oberley, T. D., Verwiebe, E., Zhong, W., Kang, S. W., and Rhee, S. G. (2001). Localization of the thioredoxin system in normal rat kidney. Free Radic Biol Med 30, 412-424.
Ogasawara, M. A., and Zhang, H. (2008). Redox Regulation and its Emerging Roles in Stem Cells and Stem-Like Cancer Cells. Antioxid Redox Signal.
121
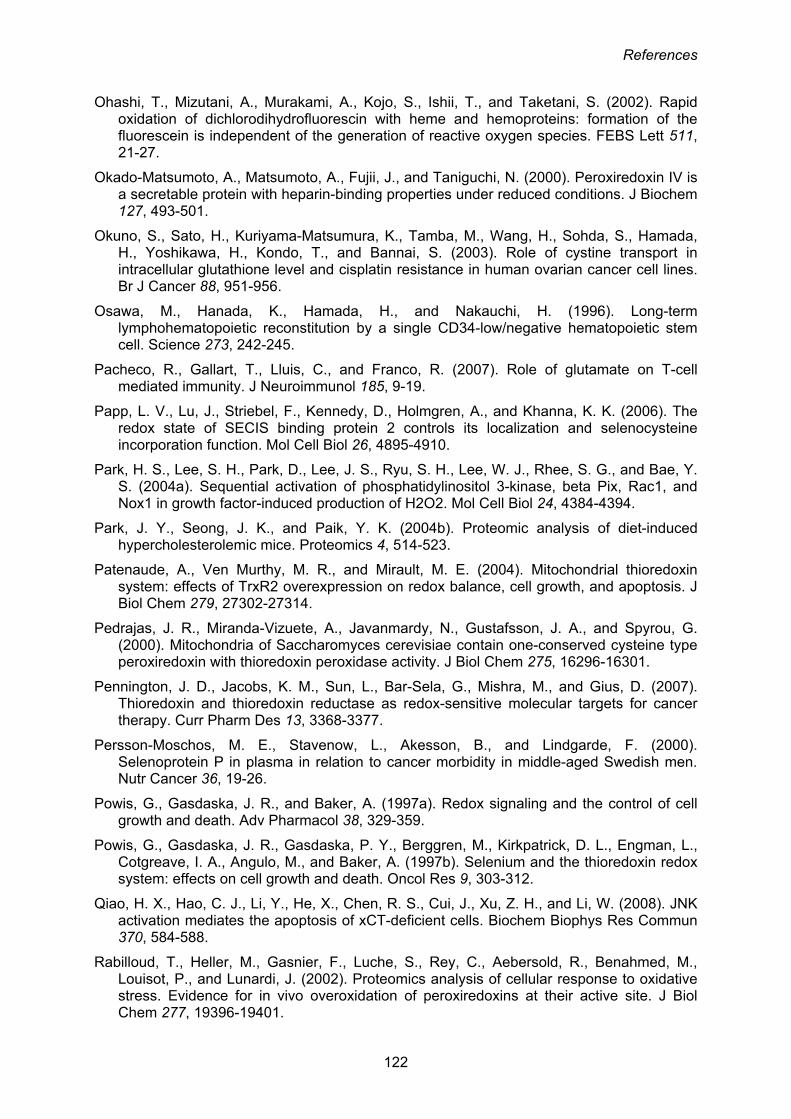
References
Ohashi, T., Mizutani, A., Murakami, A., Kojo, S., Ishii, T., and Taketani, S. (2002). Rapid oxidation of dichlorodihydrofluorescin with heme and hemoproteins: formation of the fluorescein is independent of the generation of reactive oxygen species. FEBS Lett 511, 21-27.
Okado-Matsumoto, A., Matsumoto, A., Fujii, J., and Taniguchi, N. (2000). Peroxiredoxin IV is a secretable protein with heparin-binding properties under reduced conditions. J Biochem 127, 493-501.
Okuno, S., Sato, H., Kuriyama-Matsumura, K., Tamba, M., Wang, H., Sohda, S., Hamada, H., Yoshikawa, H., Kondo, T., and Bannai, S. (2003). Role of cystine transport in intracellular glutathione level and cisplatin resistance in human ovarian cancer cell lines. Br J Cancer 88, 951-956.
Osawa, M., Hanada, K., Hamada, H., and Nakauchi, H. (1996). Long-term lymphohematopoietic reconstitution by a single CD34-low/negative hematopoietic stem cell. Science 273, 242-245.
Pacheco, R., Gallart, T., Lluis, C., and Franco, R. (2007). Role of glutamate on T-cell mediated immunity. J Neuroimmunol 185, 9-19.
Papp, L. V., Lu, J., Striebel, F., Kennedy, D., Holmgren, A., and Khanna, K. K. (2006). The redox state of SECIS binding protein 2 controls its localization and selenocysteine incorporation function. Mol Cell Biol 26, 4895-4910.
Park, H. S., Lee, S. H., Park, D., Lee, J. S., Ryu, S. H., Lee, W. J., Rhee, S. G., and Bae, Y. S. (2004a). Sequential activation of phosphatidylinositol 3-kinase, beta Pix, Rac1, and Nox1 in growth factor-induced production of H2O2. Mol Cell Biol 24, 4384-4394.
Park, J. Y., Seong, J. K., and Paik, Y. K. (2004b). Proteomic analysis of diet-induced hypercholesterolemic mice. Proteomics 4, 514-523.
Patenaude, A., Ven Murthy, M. R., and Mirault, M. E. (2004). Mitochondrial thioredoxin system: effects of TrxR2 overexpression on redox balance, cell growth, and apoptosis. J Biol Chem 279, 27302-27314.
Pedrajas, J. R., Miranda-Vizuete, A., Javanmardy, N., Gustafsson, J. A., and Spyrou, G. (2000). Mitochondria of Saccharomyces cerevisiae contain one-conserved cysteine type peroxiredoxin with thioredoxin peroxidase activity. J Biol Chem 275, 16296-16301.
Pennington, J. D., Jacobs, K. M., Sun, L., Bar-Sela, G., Mishra, M., and Gius, D. (2007). Thioredoxin and thioredoxin reductase as redox-sensitive molecular targets for cancer therapy. Curr Pharm Des 13, 3368-3377.
Persson-Moschos, M. E., Stavenow, L., Akesson, B., and Lindgarde, F. (2000). Selenoprotein P in plasma in relation to cancer morbidity in middle-aged Swedish men. Nutr Cancer 36, 19-26.
Powis, G., Gasdaska, J. R., and Baker, A. (1997a). Redox signaling and the control of cell growth and death. Adv Pharmacol 38, 329-359.
Powis, G., Gasdaska, J. R., Gasdaska, P. Y., Berggren, M., Kirkpatrick, D. L., Engman, L., Cotgreave, I. A., Angulo, M., and Baker, A. (1997b). Selenium and the thioredoxin redox system: effects on cell growth and death. Oncol Res 9, 303-312.
Qiao, H. X., Hao, C. J., Li, Y., He, X., Chen, R. S., Cui, J., Xu, Z. H., and Li, W. (2008). JNK activation mediates the apoptosis of xCT-deficient cells. Biochem Biophys Res Commun 370, 584-588.
Rabilloud, T., Heller, M., Gasnier, F., Luche, S., Rey, C., Aebersold, R., Benahmed, M., Louisot, P., and Lunardi, J. (2002). Proteomics analysis of cellular response to oxidative stress. Evidence for in vivo overoxidation of peroxiredoxins at their active site. J Biol Chem 277, 19396-19401.
122
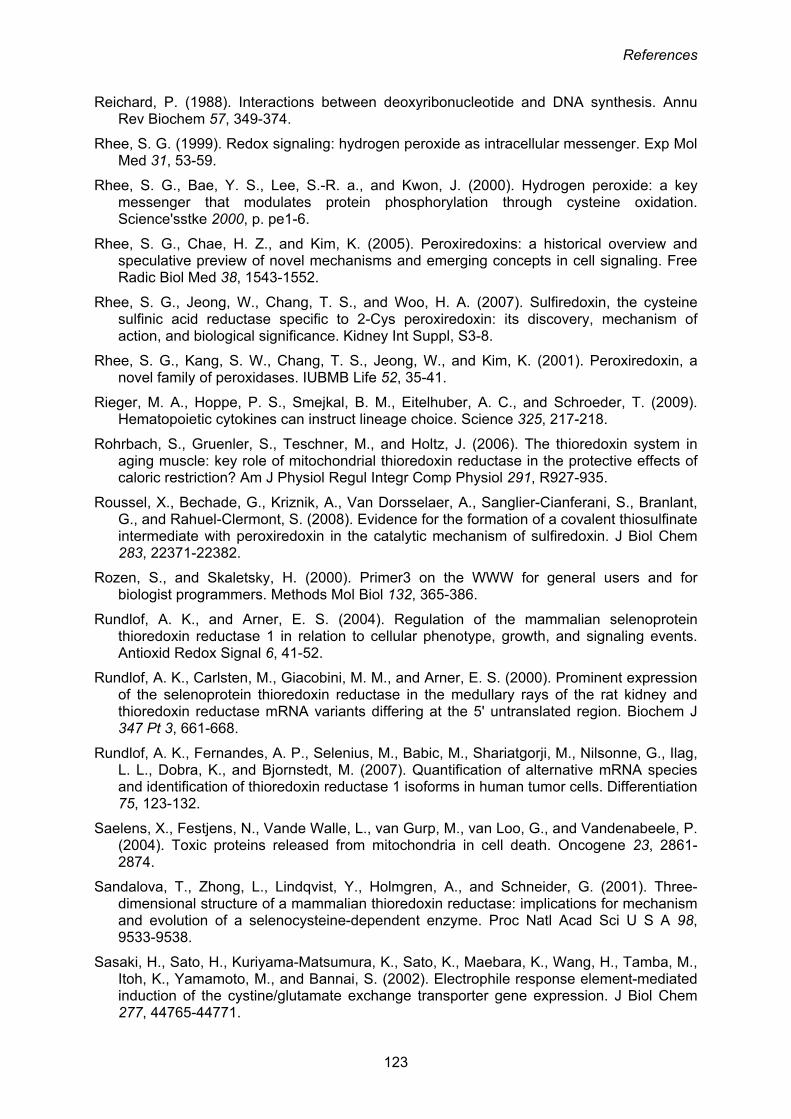
References
Reichard, P. (1988). Interactions between deoxyribonucleotide and DNA synthesis. Annu Rev Biochem 57, 349-374.
Rhee, S. G. (1999). Redox signaling: hydrogen peroxide as intracellular messenger. Exp Mol Med 31, 53-59.
Rhee, S. G., Bae, Y. S., Lee, S.-R. a., and Kwon, J. (2000). Hydrogen peroxide: a key messenger that modulates protein phosphorylation through cysteine oxidation. Science'sstke 2000, p. pe1-6.
Rhee, S. G., Chae, H. Z., and Kim, K. (2005). Peroxiredoxins: a historical overview and speculative preview of novel mechanisms and emerging concepts in cell signaling. Free Radic Biol Med 38, 1543-1552.
Rhee, S. G., Jeong, W., Chang, T. S., and Woo, H. A. (2007). Sulfiredoxin, the cysteine sulfinic acid reductase specific to 2-Cys peroxiredoxin: its discovery, mechanism of action, and biological significance. Kidney Int Suppl, S3-8.
Rhee, S. G., Kang, S. W., Chang, T. S., Jeong, W., and Kim, K. (2001). Peroxiredoxin, a novel family of peroxidases. IUBMB Life 52, 35-41.
Rieger, M. A., Hoppe, P. S., Smejkal, B. M., Eitelhuber, A. C., and Schroeder, T. (2009). Hematopoietic cytokines can instruct lineage choice. Science 325, 217-218.
Rohrbach, S., Gruenler, S., Teschner, M., and Holtz, J. (2006). The thioredoxin system in aging muscle: key role of mitochondrial thioredoxin reductase in the protective effects of caloric restriction? Am J Physiol Regul Integr Comp Physiol 291, R927-935.
Roussel, X., Bechade, G., Kriznik, A., Van Dorsselaer, A., Sanglier-Cianferani, S., Branlant, G., and Rahuel-Clermont, S. (2008). Evidence for the formation of a covalent thiosulfinate intermediate with peroxiredoxin in the catalytic mechanism of sulfiredoxin. J Biol Chem 283, 22371-22382.
Rozen, S., and Skaletsky, H. (2000). Primer3 on the WWW for general users and for biologist programmers. Methods Mol Biol 132, 365-386.
Rundlof, A. K., and Arner, E. S. (2004). Regulation of the mammalian selenoprotein thioredoxin reductase 1 in relation to cellular phenotype, growth, and signaling events. Antioxid Redox Signal 6, 41-52.
Rundlof, A. K., Carlsten, M., Giacobini, M. M., and Arner, E. S. (2000). Prominent expression of the selenoprotein thioredoxin reductase in the medullary rays of the rat kidney and thioredoxin reductase mRNA variants differing at the 5' untranslated region. Biochem J 347 Pt 3, 661-668.
Rundlof, A. K., Fernandes, A. P., Selenius, M., Babic, M., Shariatgorji, M., Nilsonne, G., Ilag, L. L., Dobra, K., and Bjornstedt, M. (2007). Quantification of alternative mRNA species and identification of thioredoxin reductase 1 isoforms in human tumor cells. Differentiation 75, 123-132.
Saelens, X., Festjens, N., Vande Walle, L., van Gurp, M., van Loo, G., and Vandenabeele, P. (2004). Toxic proteins released from mitochondria in cell death. Oncogene 23, 2861-2874.
Sandalova, T., Zhong, L., Lindqvist, Y., Holmgren, A., and Schneider, G. (2001). Three-dimensional structure of a mammalian thioredoxin reductase: implications for mechanism and evolution of a selenocysteine-dependent enzyme. Proc Natl Acad Sci U S A 98, 9533-9538.
Sasaki, H., Sato, H., Kuriyama-Matsumura, K., Sato, K., Maebara, K., Wang, H., Tamba, M., Itoh, K., Yamamoto, M., and Bannai, S. (2002). Electrophile response element-mediated induction of the cystine/glutamate exchange transporter gene expression. J Biol Chem 277, 44765-44771.
123
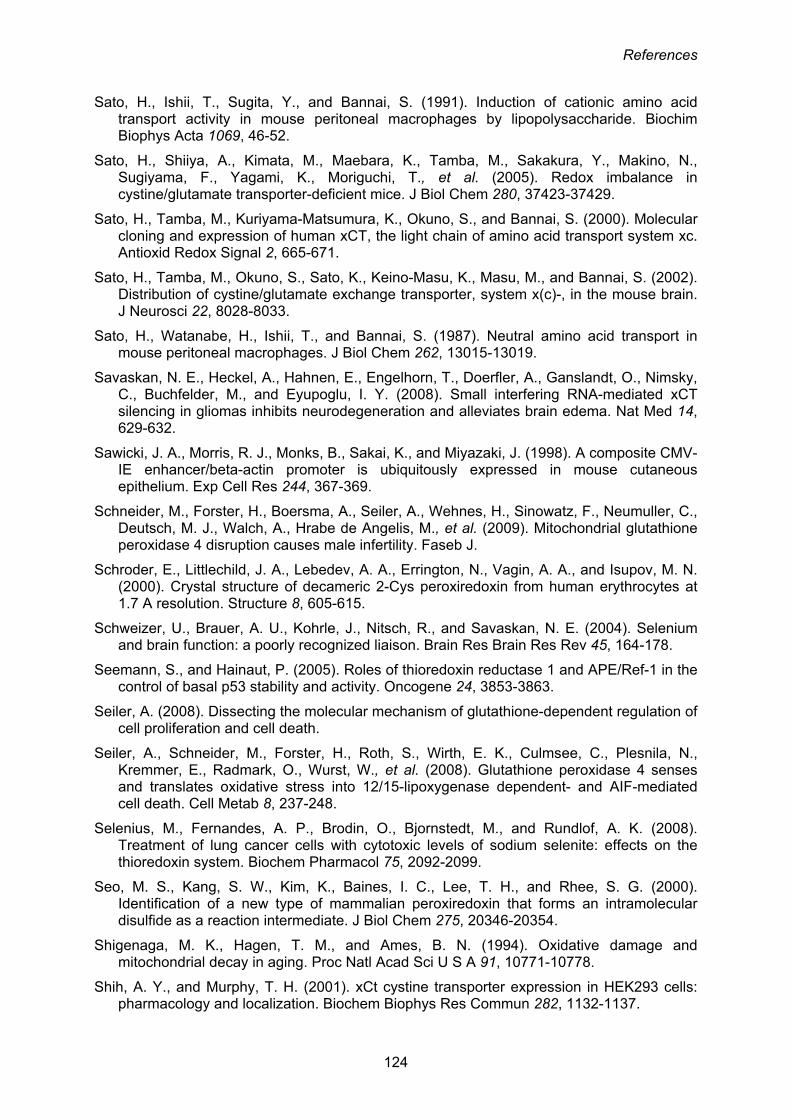
References
Sato, H., Ishii, T., Sugita, Y., and Bannai, S. (1991). Induction of cationic amino acid transport activity in mouse peritoneal macrophages by lipopolysaccharide. Biochim Biophys Acta 1069, 46-52.
Sato, H., Shiiya, A., Kimata, M., Maebara, K., Tamba, M., Sakakura, Y., Makino, N., Sugiyama, F., Yagami, K., Moriguchi, T., et al. (2005). Redox imbalance in cystine/glutamate transporter-deficient mice. J Biol Chem 280, 37423-37429.
Sato, H., Tamba, M., Kuriyama-Matsumura, K., Okuno, S., and Bannai, S. (2000). Molecular cloning and expression of human xCT, the light chain of amino acid transport system xc. Antioxid Redox Signal 2, 665-671.
Sato, H., Tamba, M., Okuno, S., Sato, K., Keino-Masu, K., Masu, M., and Bannai, S. (2002). Distribution of cystine/glutamate exchange transporter, system x(c)-, in the mouse brain. J Neurosci 22, 8028-8033.
Sato, H., Watanabe, H., Ishii, T., and Bannai, S. (1987). Neutral amino acid transport in mouse peritoneal macrophages. J Biol Chem 262, 13015-13019.
Savaskan, N. E., Heckel, A., Hahnen, E., Engelhorn, T., Doerfler, A., Ganslandt, O., Nimsky, C., Buchfelder, M., and Eyupoglu, I. Y. (2008). Small interfering RNA-mediated xCT silencing in gliomas inhibits neurodegeneration and alleviates brain edema. Nat Med 14, 629-632.
Sawicki, J. A., Morris, R. J., Monks, B., Sakai, K., and Miyazaki, J. (1998). A composite CMV-IE enhancer/beta-actin promoter is ubiquitously expressed in mouse cutaneous epithelium. Exp Cell Res 244, 367-369.
Schneider, M., Forster, H., Boersma, A., Seiler, A., Wehnes, H., Sinowatz, F., Neumuller, C., Deutsch, M. J., Walch, A., Hrabe de Angelis, M., et al. (2009). Mitochondrial glutathione peroxidase 4 disruption causes male infertility. Faseb J.
Schroder, E., Littlechild, J. A., Lebedev, A. A., Errington, N., Vagin, A. A., and Isupov, M. N. (2000). Crystal structure of decameric 2-Cys peroxiredoxin from human erythrocytes at 1.7 A resolution. Structure 8, 605-615.
Schweizer, U., Brauer, A. U., Kohrle, J., Nitsch, R., and Savaskan, N. E. (2004). Selenium and brain function: a poorly recognized liaison. Brain Res Brain Res Rev 45, 164-178.
Seemann, S., and Hainaut, P. (2005). Roles of thioredoxin reductase 1 and APE/Ref-1 in the control of basal p53 stability and activity. Oncogene 24, 3853-3863.
Seiler, A. (2008). Dissecting the molecular mechanism of glutathione-dependent regulation of cell proliferation and cell death.
Seiler, A., Schneider, M., Forster, H., Roth, S., Wirth, E. K., Culmsee, C., Plesnila, N., Kremmer, E., Radmark, O., Wurst, W., et al. (2008). Glutathione peroxidase 4 senses and translates oxidative stress into 12/15-lipoxygenase dependent- and AIF-mediated cell death. Cell Metab 8, 237-248.
Selenius, M., Fernandes, A. P., Brodin, O., Bjornstedt, M., and Rundlof, A. K. (2008). Treatment of lung cancer cells with cytotoxic levels of sodium selenite: effects on the thioredoxin system. Biochem Pharmacol 75, 2092-2099.
Seo, M. S., Kang, S. W., Kim, K., Baines, I. C., Lee, T. H., and Rhee, S. G. (2000). Identification of a new type of mammalian peroxiredoxin that forms an intramolecular disulfide as a reaction intermediate. J Biol Chem 275, 20346-20354.
Shigenaga, M. K., Hagen, T. M., and Ames, B. N. (1994). Oxidative damage and mitochondrial decay in aging. Proc Natl Acad Sci U S A 91, 10771-10778.
Shih, A. Y., and Murphy, T. H. (2001). xCt cystine transporter expression in HEK293 cells: pharmacology and localization. Biochem Biophys Res Commun 282, 1132-1137.
124
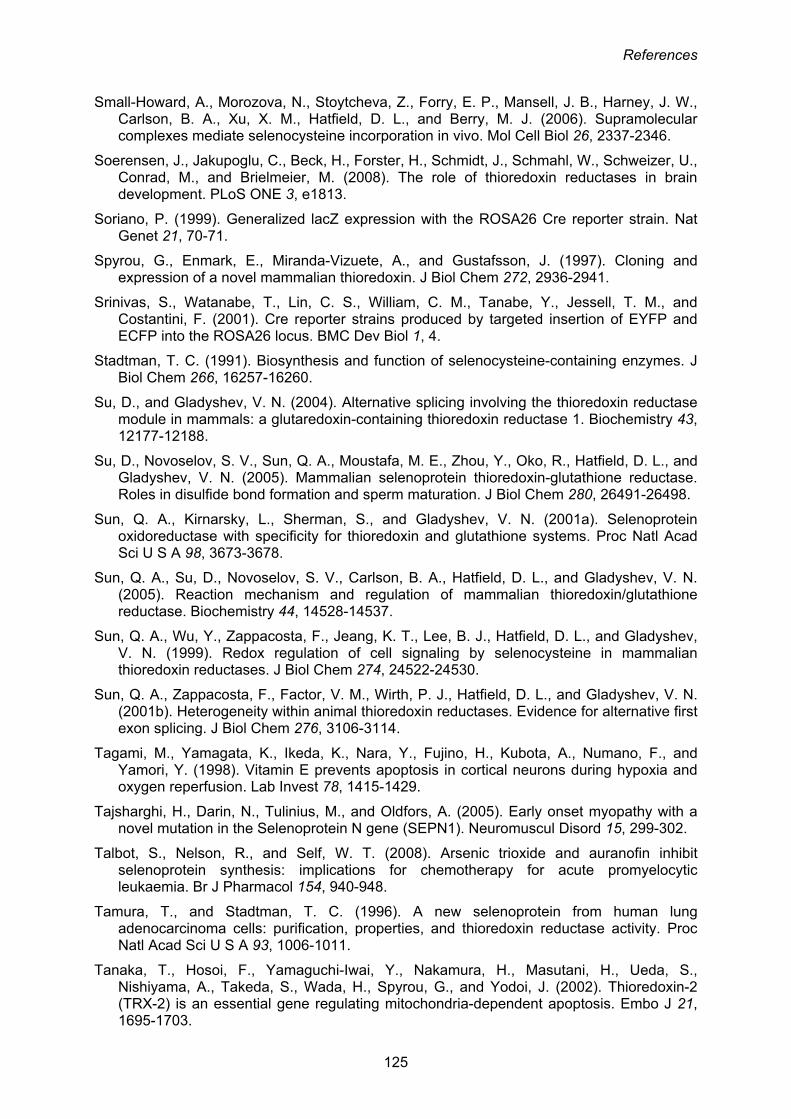
References
Small-Howard, A., Morozova, N., Stoytcheva, Z., Forry, E. P., Mansell, J. B., Harney, J. W., Carlson, B. A., Xu, X. M., Hatfield, D. L., and Berry, M. J. (2006). Supramolecular complexes mediate selenocysteine incorporation in vivo. Mol Cell Biol 26, 2337-2346.
Soerensen, J., Jakupoglu, C., Beck, H., Forster, H., Schmidt, J., Schmahl, W., Schweizer, U., Conrad, M., and Brielmeier, M. (2008). The role of thioredoxin reductases in brain development. PLoS ONE 3, e1813.
Soriano, P. (1999). Generalized lacZ expression with the ROSA26 Cre reporter strain. Nat Genet 21, 70-71.
Spyrou, G., Enmark, E., Miranda-Vizuete, A., and Gustafsson, J. (1997). Cloning and expression of a novel mammalian thioredoxin. J Biol Chem 272, 2936-2941.
Srinivas, S., Watanabe, T., Lin, C. S., William, C. M., Tanabe, Y., Jessell, T. M., and Costantini, F. (2001). Cre reporter strains produced by targeted insertion of EYFP and ECFP into the ROSA26 locus. BMC Dev Biol 1, 4.
Stadtman, T. C. (1991). Biosynthesis and function of selenocysteine-containing enzymes. J Biol Chem 266, 16257-16260.
Su, D., and Gladyshev, V. N. (2004). Alternative splicing involving the thioredoxin reductase module in mammals: a glutaredoxin-containing thioredoxin reductase 1. Biochemistry 43, 12177-12188.
Su, D., Novoselov, S. V., Sun, Q. A., Moustafa, M. E., Zhou, Y., Oko, R., Hatfield, D. L., and Gladyshev, V. N. (2005). Mammalian selenoprotein thioredoxin-glutathione reductase. Roles in disulfide bond formation and sperm maturation. J Biol Chem 280, 26491-26498.
Sun, Q. A., Kirnarsky, L., Sherman, S., and Gladyshev, V. N. (2001a). Selenoprotein oxidoreductase with specificity for thioredoxin and glutathione systems. Proc Natl Acad Sci U S A 98, 3673-3678.
Sun, Q. A., Su, D., Novoselov, S. V., Carlson, B. A., Hatfield, D. L., and Gladyshev, V. N. (2005). Reaction mechanism and regulation of mammalian thioredoxin/glutathione reductase. Biochemistry 44, 14528-14537.
Sun, Q. A., Wu, Y., Zappacosta, F., Jeang, K. T., Lee, B. J., Hatfield, D. L., and Gladyshev, V. N. (1999). Redox regulation of cell signaling by selenocysteine in mammalian thioredoxin reductases. J Biol Chem 274, 24522-24530.
Sun, Q. A., Zappacosta, F., Factor, V. M., Wirth, P. J., Hatfield, D. L., and Gladyshev, V. N. (2001b). Heterogeneity within animal thioredoxin reductases. Evidence for alternative first exon splicing. J Biol Chem 276, 3106-3114.
Tagami, M., Yamagata, K., Ikeda, K., Nara, Y., Fujino, H., Kubota, A., Numano, F., and Yamori, Y. (1998). Vitamin E prevents apoptosis in cortical neurons during hypoxia and oxygen reperfusion. Lab Invest 78, 1415-1429.
Tajsharghi, H., Darin, N., Tulinius, M., and Oldfors, A. (2005). Early onset myopathy with a novel mutation in the Selenoprotein N gene (SEPN1). Neuromuscul Disord 15, 299-302.
Talbot, S., Nelson, R., and Self, W. T. (2008). Arsenic trioxide and auranofin inhibit selenoprotein synthesis: implications for chemotherapy for acute promyelocytic leukaemia. Br J Pharmacol 154, 940-948.
Tamura, T., and Stadtman, T. C. (1996). A new selenoprotein from human lung adenocarcinoma cells: purification, properties, and thioredoxin reductase activity. Proc Natl Acad Sci U S A 93, 1006-1011.
Tanaka, T., Hosoi, F., Yamaguchi-Iwai, Y., Nakamura, H., Masutani, H., Ueda, S., Nishiyama, A., Takeda, S., Wada, H., Spyrou, G., and Yodoi, J. (2002). Thioredoxin-2 (TRX-2) is an essential gene regulating mitochondria-dependent apoptosis. Embo J 21, 1695-1703.
125
References
Tanaka, T., Nakamura, H., Nishiyama, A., Hosoi, F., Masutani, H., Wada, H., and Yodoi, J. (2000). Redox regulation by thioredoxin superfamily; protection against oxidative stress and aging. Free Radical Research 33, 851-855.
Thelander, L., and Reichard, P. (1979). Reduction of ribonucleotides. Annu Rev Biochem 48, 133-158.
Toohey, J. I. (1975). Sulfhydryl dependence in primary explant hematopoietic cells. Inhibition of growth in vitro with vitamin B12 compounds. Proc Natl Acad Sci U S A 72, 73-77.
Trachootham, D., Zhou, Y., Zhang, H., Demizu, Y., Chen, Z., Pelicano, H., Chiao, P. J., Achanta, G., Arlinghaus, R. B., Liu, J., and Huang, P. (2006). Selective killing of oncogenically transformed cells through a ROS-mediated mechanism by beta-phenylethyl isothiocyanate. Cancer Cell 10, 241-252.
Tsutsui, H., Kinugawa, S., and Matsushima, S. (2009). Mitochondrial oxidative stress and dysfunction in myocardial remodelling. Cardiovasc Res 81, 449-456.
Tujebajeva, R. M., Copeland, P. R., Xu, X. M., Carlson, B. A., Harney, J. W., Driscoll, D. M., Hatfield, D. L., and Berry, M. J. (2000). Decoding apparatus for eukaryotic selenocysteine insertion. EMBO Rep 1, 158-163.
Turanov, A. A., Su, D., and Gladyshev, V. N. (2006). Characterization of alternative cytosolic forms and cellular targets of mouse mitochondrial thioredoxin reductase. J Biol Chem 281, 22953-22963.
van Zandwijk, N. (1995). N-acetylcysteine for lung cancer prevention. Chest 107, 1437-1441.
Veal, E. A., Day, A. M., and Morgan, B. A. (2007). Hydrogen peroxide sensing and signaling. Mol Cell 26, 1-14.
Veal, E. A., Findlay, V. J., Day, A. M., Bozonet, S. M., Evans, J. M., Quinn, J., and Morgan, B. A. (2004). A 2-Cys peroxiredoxin regulates peroxide-induced oxidation and activation of a stress-activated MAP kinase. Mol Cell 15, 129-139.
Walczak, R., Carbon, P., and Krol, A. (1998). An essential non-Watson-Crick base pair motif in 3'UTR to mediate selenoprotein translation. Rna 4, 74-84.
Watabe, S., Hasegawa, H., Takimoto, K., Yamamoto, Y., and Takahashi, S. Y. (1995). Possible function of SP-22, a substrate of mitochondrial ATP-dependent protease, as a radical scavenger. Biochem Biophys Res Commun 213, 1010-1016.
Watabe, S., Hiroi, T., Yamamoto, Y., Fujioka, Y., Hasegawa, H., Yago, N., and Takahashi, S. Y. (1997). SP-22 is a thioredoxin-dependent peroxide reductase in mitochondria. Eur J Biochem 249, 52-60.
Watabe, S., Makino, Y., Ogawa, K., Hiroi, T., Yamamoto, Y., and Takahashi, S. Y. (1999). Mitochondrial thioredoxin reductase in bovine adrenal cortex its purification, properties, nucleotide/amino acid sequences, and identification of selenocysteine. Eur J Biochem 264, 74-84.
Watanabe, H., and Bannai, S. (1987). Induction of cystine transport activity in mouse peritoneal macrophages. J Exp Med 165, 628-640.
Williams, C. H., Arscott, L. D., Muller, S., Lennon, B. W., Ludwig, M. L., Wang, P. F., Veine, D. M., Becker, K., and Schirmer, R. H. (2000). Thioredoxin reductase two modes of catalysis have evolved. Eur J Biochem 267, 6110-6117.
Woo, H. A., Chae, H. Z., Hwang, S. C., Yang, K. S., Kang, S. W., Kim, K., and Rhee, S. G. (2003a). Reversing the inactivation of peroxiredoxins caused by cysteine sulfinic acid formation. Science 300, 653-656.
Woo, H. A., Jeong, W., Chang, T. S., Park, K. J., Park, S. J., Yang, J. S., and Rhee, S. G. (2005). Reduction of cysteine sulfinic acid by sulfiredoxin is specific to 2-cys peroxiredoxins. J Biol Chem 280, 3125-3128.
126
References
Woo, H. A., Kang, S. W., Kim, H. K., Yang, K. S., Chae, H. Z., and Rhee, S. G. (2003b). Reversible oxidation of the active site cysteine of peroxiredoxins to cysteine sulfinic acid. Immunoblot detection with antibodies specific for the hyperoxidized cysteine-containing sequence. J Biol Chem 278, 47361-47364.
Wood, Z. A., Schroder, E., Robin Harris, J., and Poole, L. B. (2003). Structure, mechanism and regulation of peroxiredoxins. Trends Biochem Sci 28, 32-40.
Wu, S. J., Ng, L. T., and Lin, C. C. (2005). Effects of antioxidants and caspase-3 inhibitor on the phenylethyl isothiocyanate-induced apoptotic signaling pathways in human PLC/PRF/5 cells. Eur J Pharmacol 518, 96-106.
Xu, G. L., Wang, S. C., Gu, B. Q., Yang, Y. X., Song, H. B., Xue, W. L., Liang, W. S., and Zhang, P. Y. (1997). Further investigation on the role of selenium deficiency in the aetiology and pathogenesis of Keshan disease. Biomed Environ Sci 10, 316-326.
Xu, X. M., Carlson, B. A., Mix, H., Zhang, Y., Saira, K., Glass, R. S., Berry, M. J., Gladyshev, V. N., and Hatfield, D. L. (2007). Biosynthesis of selenocysteine on its tRNA in eukaryotes. PLoS Biol 5, e4.
Xu, X. M., Mix, H., Carlson, B. A., Grabowski, P. J., Gladyshev, V. N., Berry, M. J., and Hatfield, D. L. (2005). Evidence for direct roles of two additional factors, SECp43 and soluble liver antigen, in the selenoprotein synthesis machinery. J Biol Chem 280, 41568-41575.
Yamamoto, Y., Nagata, Y., Niki, E., Watanabe, K., and Yoshimura, S. (1993). Plasma glutathione peroxidase reduces phosphatidylcholine hydroperoxide. Biochem Biophys Res Commun 193, 133-138.
Yanagawa, T., Iwasa, S., Ishii, T., Tabuchi, K., Yusa, H., Onizawa, K., Omura, K., Harada, H., Suzuki, H., and Yoshida, H. (2000). Peroxiredoxin I expression in oral cancer: a potential new tumor marker. Cancer Lett 156, 27-35.
Yang, K. S., Kang, S. W., Woo, H. A., Hwang, S. C., Chae, H. Z., Kim, K., and Rhee, S. G. (2002). Inactivation of human peroxiredoxin I during catalysis as the result of the oxidation of the catalytic site cysteine to cysteine-sulfinic acid. J Biol Chem 277, 38029-38036.
Yang, M., Nazhat, N. B., Jiang, X., Kelsey, S. M., Blake, D. R., Newland, A. C., and Morris, C. J. (1996). Adriamycin stimulates proliferation of human lymphoblastic leukaemic cells via a mechanism of hydrogen peroxide (H2O2) production. Br J Haematol 95, 339-344.
Yoo, M. H., Xu, X. M., Carlson, B. A., Patterson, A. D., Gladyshev, V. N., and Hatfield, D. L. (2007). Targeting thioredoxin reductase 1 reduction in cancer cells inhibits self-sufficient growth and DNA replication. PLoS ONE 2, e1112.
Yoshida, T., Maulik, N., Engelman, R. M., Ho, Y. S., Magnenat, J. L., Rousou, J. A., Flack, J. E., 3rd, Deaton, D., and Das, D. K. (1997). Glutathione peroxidase knockout mice are susceptible to myocardial ischemia reperfusion injury. Circulation 96, II-216-220.
Yu, R., Mandlekar, S., Harvey, K. J., Ucker, D. S., and Kong, A. N. (1998). Chemopreventive isothiocyanates induce apoptosis and caspase-3-like protease activity. Cancer Res 58, 402-408.
Zavacki, A. M., Mansell, J. B., Chung, M., Klimovitsky, B., Harney, J. W., and Berry, M. J. (2003). Coupled tRNA(Sec)-dependent assembly of the selenocysteine decoding apparatus. Mol Cell 11, 773-781.
Zhang, H., Go, Y. M., and Jones, D. P. (2007). Mitochondrial thioredoxin-2/peroxiredoxin-3 system functions in parallel with mitochondrial GSH system in protection against oxidative stress. Arch Biochem Biophys 465, 119-126.
127
References
Zhang, P., Liu, B., Kang, S. W., Seo, M. S., Rhee, S. G., and Obeid, L. M. (1997). Thioredoxin peroxidase is a novel inhibitor of apoptosis with a mechanism distinct from that of Bcl-2. J Biol Chem 272, 30615-30618.
Zhang, Y., Tang, L., and Gonzalez, V. (2003). Selected isothiocyanates rapidly induce growth inhibition of cancer cells. Mol Cancer Ther 2, 1045-1052.
Zhao, W., Fan, G. C., Zhang, Z. G., Bandyopadhyay, A., Zhou, X., and Kranias, E. G. (2009). Protection of peroxiredoxin II on oxidative stress-induced cardiomyocyte death and apoptosis. Basic Res Cardiol 104, 377-389.
Zhong, L., Arner, E. S., and Holmgren, A. (2000). Structure and mechanism of mammalian thioredoxin reductase: the active site is a redox-active selenolthiol/selenenylsulfide formed from the conserved cysteine-selenocysteine sequence. Proc Natl Acad Sci U S A 97, 5854-5859.
Zhong, L., Arner, E. S., Ljung, J., Aslund, F., and Holmgren, A. (1998). Rat and calf thioredoxin reductase are homologous to glutathione reductase with a carboxyl-terminal elongation containing a conserved catalytically active penultimate selenocysteine residue. J Biol Chem 273, 8581-8591.
Zhong, L., and Holmgren, A. (2000). Essential role of selenium in the catalytic activities of mammalian thioredoxin reductase revealed by characterization of recombinant enzymes with selenocysteine mutations. J Biol Chem 275, 18121-18128.
Zhou, J., Eleni, C., Spyrou, G., and Brune, B. (2008). The mitochondrial thioredoxin system regulates nitric oxide-induced HIF-1alpha protein. Free Radic Biol Med 44, 91-98.
Zhou, Y., Kok, K. H., Chun, A. C., Wong, C. M., Wu, H. W., Lin, M. C., Fung, P. C., Kung, H., and Jin, D. Y. (2000). Mouse peroxiredoxin V is a thioredoxin peroxidase that inhibits p53-induced apoptosis. Biochem Biophys Res Commun 268, 921-927.
128
Appendix
129
7. Appendix
7.1. Acknowledgements
Standing at a crucial juncture of my academic journey and before I step across the finish line, its time to take a pause and to express my gratitude in retrospect to all those people who supported me throughout this learning process.
I would start and would like to thank to my supervisor Dr. Marcus Conrad for his support and guidance. I appreciate the freedom given to me while doing my PhD thesis. He was always accommodative to the suggestions or criticisms, which stimulated the independent thinking.
I am indebted to Prof. Georg W. Bornkamm for giving me the opportunity to do my PhD in Germany. It was a great experience working under him. His ideas and suggestions were very valuable which finally concluded in the form of the present manuscript.
I express my best regards to my Dr. father Prof. Dr. Dirk Eick, for his supportive attitude towards me. Without his help it would have not been possible to submit the thesis in such a smooth manner.
I thank my present and former lab members Ana Banjac, Madhu Sukumar, Pankaj Kumar Mandal, Alexander Seiler, Heidi Förster, Alexander Mannes and Katja Möllmann for supporting me during day-to-day work, sharing their valuable experiences and making the stay in the lab memorable. I wish all of them a great success in life.
I would like to put emphasis on the help and support provided by Dr. Heike Beck, and of course, the members of her group: Juliane Hrdina, Matthias Semisch and Markus Worthmann. The unselfish help provided by Manuela Schneider at the bigining of my days in Munich deserve a special note of appreciation. They were the integral part of numerous sessions of discussion on ongoing projects.
Also I would like to thank Pirkko Kölle from Medizinische Poliklinik Innenstadt des Klinikum der LMU for doing HPLC measurements which added substantial information to the thesis.
I want to thank Dr. Elisabeth Kremmer for raising monoclonal antibody against mouse thioredoxin reductase 2 and human xCT for us.
I express my sincere thank to the people of Prof. Dr. Dick Eicks lab, specially Thomas Harasim, Martin Heidemann, Anastassia Malamoussi, Anita Gruber-Eber for sparing reagents and providing support at the hour of need.
I am very obliged to Dr. Ralf Kühn for coming up with the precise solution at the needed moment; without his help some of the data included would have never seen the light of the day.
I am expressing my thankfulness to Dr. Josef Mautner, whom I tried to awoid at the end of my thesis. Time and time again I have tried to sneak through the 1st floor where he was working. Every time when being caught, I was compelled by unpleasant question: Why I am still working and not writing my thesis?

Appendix
I would like to thank people of KMOLB for help and encouragement.
The effort done by people in the animal facility is really appreciated and I thank all of them.
Additionally, I would like to thank my friend Adriana Gil-Monux, for her support and sharing nice time in Munich.
At last I want to dedicate this paragraph to acknowledge my family. Mom and Dad, thank you for all your mental support which was giving me great strength. And I would highlight the help provided by my sister, for always beliving in me, standing behind me, and having the time and patience when nobody would. I would like to thank Dominik Flüge, for being the flambeau in moments when I was stuck in dark labirinth.
Tamara Perisic
130
Appendix
131
7.2. Curriculum vitae Name: Tamara PERISIC
Date and place of Birth: 29th May 1978, Travnik, Bosnia and Herzegovina
Nationality: Montenegrinian
Permanent address: Lofererstr 17, 81671 München, Germany
E-Mail: [email protected]
Educational profile PhD student at the Institute Of Clinical Molecular Biology And Tumor Genetics, Helmholtz Zentrum München (Feb 2005 – May 2009) University education in molecular biology and physiology, Faculty of biology, Belgrade University, Belgrade, Serbia (Oct 1997- July 2004) List of Publications Mitochondrial Thioredoxin reductase but not cytosolic Thioredoxin reductase protects against myocardial ischemia-reperfusion injury: role of intrinsic apoptosis induction. Perisic T*, Horstkotte J*, Schneider M, Lange P, Schroeder M, Hinkel R, Foerster H, Neumüller C, Sinowatz F,
Molkenti JD, Boekstegers P, Brielmeier M, Conrad M, Kupatt C (In preparation).
* These author contributed equally to the manuscript
Mutations in the Gene encoding mitochondrial thioredoxin reductase are associated with dilated cardiomyopathy. Perisic T*, Sibbing D*, Pfeufer A*, Akyol M, Unwin S, Sinner MF, Jalilzadeh S, Conrad M, Bornkamm GW,
Gieger C, Glöckner J, Wichmann HE, Hinterseer M, Näbauer M, MD, Kääb S, Meitinger T, Schömig A, Kastrati A,
von Beckerath N. (submitted)
* These author contributed equally to the manuscript
System xC- and Thioredoxin Reductase 1 Cooperatively Rescue Glutathione Deficiency
Perisic T*, Mandal P K* Seiler A*, Banjac-Canak A, Förster H, Kölle P, Weiss N, Lieberman M, Bannai S, Sato H,
Kuhlencordt P, Bornkamm G.W, and Conrad M (submitted)
* These author contributed equally to the manuscript The cystine/cysteine cycle: a redox cycle regulating susceptibility versus resistance to cell death. Banjac A, Perisic T, Sato H, Seiler A, Bannai S, Weiss N, Kölle P, Tschoep K, Issels RD, Daniel PT, Conrad M,
Bornkamm GW. (2007). Oncogene 27: 1618-1628