adeno-associatedvirus2asa …etheses.bham.ac.uk/3664/1/oneill12phd.pdf · adeno-associatedvirus2asa...
TRANSCRIPT
ADENO-ASSOCIATED VIRUS 2 AS AVECTOR FOR DELIVERING CNTF ANDSHRHOA TO THE VISUAL SYSTEM
by
JENNA TERI O'NEILL
A thesis submi ed to the University of Birmingham for the
degree of DOCTOR OF PHILOSOPHY
School of Clinical and Experimental MedicineCollege of Medical and Dental SciencesIns tute of Biomedical Research (West)University of BirminghamSeptember 2011
University of Birmingham Research Archive
e-theses repository This unpublished thesis/dissertation is copyright of the author and/or third parties. The intellectual property rights of the author or third parties in respect of this work are as defined by The Copyright Designs and Patents Act 1988 or as modified by any successor legislation. Any use made of information contained in this thesis/dissertation must be in accordance with that legislation and must be properly acknowledged. Further distribution or reproduction in any format is prohibited without the permission of the copyright holder.
Abstract
Aims:
To fully characterise the RGC-5 cell line and determine whether it would be a suitablesubs tute for primary RGC cell culture. To op mise a CNTF Nogo-P4 inhibitory assay andestablish whether (a) CNTF alone is capable of s mula ng RGC neurite outgrowth andsurvival, or (b) an increase in intracellular cAMP is required for CNTF to be effec ve. Todetermine whether recombinant AAV2 viral constructs were capable of producing de-tectable levels of CNTF in HEK-293 transfected condi oned media. To op mise AAV2-eGFP delivery and establish whether AAV2-CNTF-hrGFP and AAV2-CNTF-shRhoA-hrGFPcould promote RGC survival and regenera on a er op c nerve crush surgery.
Methods:
The RGC-5 cell line was characterised using semi-quan ta ve PCR, sequencing and im-munocytochemistry. RGC-5 cells were screened for a selec on of neuronal, glial, progen-itor, oligodendroglial lineages and cone photoreceptor cell markers to iden fy the cellsorigin. Re nal cultures were treated with recombinant CNTF and/or Forskolin to pro-mote RGC neurite outgrowth and survival - this was quan fied a er 3 d. Re nal whole-mounts were prepared to assess GFP transduc on and survival a er intravitreal deliveryof AAV2-eGFP. Axonal regenera on and RGC survival were assessed through histologicalexamina on of op c nerves and re nal sec ons.
Results:
The RGC-5 cell line predominantly expressed oligodendroglial lineage markers and onlyweakly expressed ßIII-Tubulin mRNA. RGC-5 cells did not express mRNA for many of thephenotypic markers of RGC. CNTF was effec ve at s mula ng RGC neurite outgrowthwithout the need for cAMP eleva on - furthermore recombinant CNTF could disinhibitNogo-P4 treated RGC in vitro. GFP transduc on was low when injected alone, however,when administered with Pronase-E there was a significant increase in GFP expression.AAV2-CNTF-hrGFP and AAV2-CNTF-shRhoA-hrGFP did not promote RGC survival or re-genera on 23 d post op c nerve crush.
Conclusions:
RGC-5 cells are not an appropriate subs tute for primary re nal cell culture in vitro asthey express many of the samemarkers as oligodendrocyte progenitors. CNTF is capableof s mula ng RGC neurite outgrowth without an addi onal eleva on of cAMP. AAV2-mediated GFP expression could be enhanced through the par al diges on of the innerlimi ngmembrane - this seems to be themajor obstacle in achieving op mal AAV2 trans-duc on.

Acknowledgements
First and foremost I would like to thankmy husband, Ben O'Neill, for his love and supportthroughout my PhD and write up — not to men on preparing copius amounts of tea.
I would also like to send a big thank you to all members of the Molecular NeuroscienceGroup (past and present) who have been there to discuss and troubleshoot with. Manythanks to Ann Logan, Mar n Berry, Zubair Ahmed and Michael Douglas for their supportand guidance throughout my PhD.
To Ruth Seabright and Barbara Lorber, you took the me to show me a variety of tech-niques and are some of the best scien sts I've ever worked with. You were always happyto help and for that I am eternally grateful.
I'd like to offer my condolences thanks to Kevin Morrison, Steven Jacques and SamanthaPrince for being extremely funny and great friends throughout my PhD. I will never forgetsome of our a ernoon debates while wai ng for experiments to run. I'd also like to thankAndy Thewles for introducing a whole new level of sarcasm to day to day life.
Finally, I'd like to thank Daljeet Bansal, Lisa Hill and everyone else from the MolecularNeuroscience Group for the support you've offered me over the past few years.
Eggs.

Dedica on
In loving memory of Doris and Jack Carr

CONTENTS
List of Figures ix
List of Tables xii
List of Abbrevia ons xiii
1 General Introduc on 1
1.1 Anatomy of the visual system . . . . . . . . . . . . . . . . . . . . . . . . 2
1.1.1 Organisa on of the re na . . . . . . . . . . . . . . . . . . . . . 2
1.2 RGC structure func on and development . . . . . . . . . . . . . . . . . 4
1.2.1 RGC cell fate . . . . . . . . . . . . . . . . . . . . . . . . . . . . 5
1.2.2 RGC morphology and classifica on . . . . . . . . . . . . . . . . . 6
1.2.3 RGC recep ve fields . . . . . . . . . . . . . . . . . . . . . . . . 7
1.2.4 Colour opponent RGC . . . . . . . . . . . . . . . . . . . . . . . 8
1.3 Histology of the op c nerve . . . . . . . . . . . . . . . . . . . . . . . . . 8
1.3.1 Anatomical differences between humans and rats . . . . . . . . . 9
1.4 The ON as a model system to study CNS injury responses . . . . . . . . . 10
1.4.1 The CNS injury response . . . . . . . . . . . . . . . . . . . . . . 12
1.5 Glia . . . . . . . . . . . . . . . . . . . . . . . . . . . . . . . . . . . . . 14
1.5.1 Astrocytes . . . . . . . . . . . . . . . . . . . . . . . . . . . . . . 14
1.5.2 NG2 glia . . . . . . . . . . . . . . . . . . . . . . . . . . . . . . . 14
Page | i
1.5.3 Microglia . . . . . . . . . . . . . . . . . . . . . . . . . . . . . . 15
1.6 Why doesn't the mammalian CNS regenerate? . . . . . . . . . . . . . . . 16
1.6.0.1 Myelin inhibitory ligands . . . . . . . . . . . . . . . . 16
1.6.0.2 Myelin inhibitory ligand receptors . . . . . . . . . . . . 21
1.6.1 The growth cone . . . . . . . . . . . . . . . . . . . . . . . . . . 23
1.6.2 Myelin inhibitory signalling cascade . . . . . . . . . . . . . . . . 25
1.6.3 Targe ng the inhibitory signalling cascade . . . . . . . . . . . . . 26
1.6.4 Chondroi n sulphate proteoglycans and the glial scar . . . . . . . 29
1.7 Cell death . . . . . . . . . . . . . . . . . . . . . . . . . . . . . . . . . . 30
1.7.1 The extrinsic pathway . . . . . . . . . . . . . . . . . . . . . . . 31
1.7.2 The intrinsic pathway . . . . . . . . . . . . . . . . . . . . . . . . 31
1.7.3 Regulators of apoptosis . . . . . . . . . . . . . . . . . . . . . . . 33
1.8 Neurotrophins . . . . . . . . . . . . . . . . . . . . . . . . . . . . . . . . 33
1.8.1 Neurotrophin receptors . . . . . . . . . . . . . . . . . . . . . . 34
1.8.2 p75NTF and apoptosis . . . . . . . . . . . . . . . . . . . . . . . . 35
1.8.3 Neurotrophin signalling pathways . . . . . . . . . . . . . . . . . 37
1.8.3.1 Ras/MAPK signalling . . . . . . . . . . . . . . . . . . . 37
1.8.3.2 Phospholipase C . . . . . . . . . . . . . . . . . . . . . 38
1.8.3.3 PI3K/Akt signalling . . . . . . . . . . . . . . . . . . . . 38
1.9 Cilliary neurotrophic factor . . . . . . . . . . . . . . . . . . . . . . . . . 39
1.9.1 CNTF Receptor Complex . . . . . . . . . . . . . . . . . . . . . . 42
1.9.2 The JAK-STAT signalling pathway . . . . . . . . . . . . . . . . . . 42
1.10 Non-viral mediated gene transfer . . . . . . . . . . . . . . . . . . . . . . 43
1.10.1 Naked DNA . . . . . . . . . . . . . . . . . . . . . . . . . . . . . 43
1.10.2 Electropora on and shotgun gene delivery . . . . . . . . . . . . 43
Page | ii
1.10.3 Ca onic polymers . . . . . . . . . . . . . . . . . . . . . . . . . . 45
1.11 Viral mediated gene transfer . . . . . . . . . . . . . . . . . . . . . . . . 45
1.11.1 Adenoviruses . . . . . . . . . . . . . . . . . . . . . . . . . . . . 46
1.11.2 Len viruses . . . . . . . . . . . . . . . . . . . . . . . . . . . . . 47
1.12 Structure of wild type adeno-associated virus . . . . . . . . . . . . . . . 48
1.13 The ly c pathway . . . . . . . . . . . . . . . . . . . . . . . . . . . . . . 48
1.14 The lysogenic pathway . . . . . . . . . . . . . . . . . . . . . . . . . . . 49
1.15 Recombinant AAV virus as a gene delivery vector . . . . . . . . . . . . . 51
1.15.1 Advantages and disadvantages of using AAV as a viral vector . . . 53
1.16 RNA interference . . . . . . . . . . . . . . . . . . . . . . . . . . . . . . 53
1.16.1 Mechanisms of RNA interference . . . . . . . . . . . . . . . . . 55
2 Materials and Methods 56
2.1 In vitro Techniques . . . . . . . . . . . . . . . . . . . . . . . . . . . . . 57
2.1.1 Re nal culture . . . . . . . . . . . . . . . . . . . . . . . . . . . 57
2.1.1.1 Re nal culture quan fica on . . . . . . . . . . . . . . 58
2.1.2 RGC-5 cell culture . . . . . . . . . . . . . . . . . . . . . . . . . . 59
2.1.2.1 Morphological analysis of RGC-5 cells . . . . . . . . . . 59
2.1.3 Immunocytochemistry and Immunohistochemistry . . . . . . . . 60
2.1.3.1 Immunocytochemistry . . . . . . . . . . . . . . . . . . 60
2.1.3.2 Immunohistochemistry . . . . . . . . . . . . . . . . . 61
2.1.3.3 An bodies . . . . . . . . . . . . . . . . . . . . . . . . 62
2.1.4 Haematoxylin and Eosin staining of frozen re nal sec ons . . . . 63
2.1.5 AAV2 constructs . . . . . . . . . . . . . . . . . . . . . . . . . . 64
2.1.6 Lipofectamine 2000 Transfec on . . . . . . . . . . . . . . . . . . 65
2.1.7 Enzyme linked immunosorbent assay . . . . . . . . . . . . . . . 66
Page | iii
2.1.8 Cell viability assay . . . . . . . . . . . . . . . . . . . . . . . . . . 68
2.1.9 RNA extrac on . . . . . . . . . . . . . . . . . . . . . . . . . . . 70
2.1.9.1 RGC-5 cell RNA extrac on . . . . . . . . . . . . . . . . 70
2.1.9.2 Mouse brain RNA extrac on . . . . . . . . . . . . . . . 71
2.1.9.3 Mouse eye RNA extrac on . . . . . . . . . . . . . . . 71
2.1.10 RNA quan fica on . . . . . . . . . . . . . . . . . . . . . . . . . 71
2.1.11 cDNA Libraries . . . . . . . . . . . . . . . . . . . . . . . . . . . 72
2.1.12 Primer Design . . . . . . . . . . . . . . . . . . . . . . . . . . . . 73
2.1.13 Semi-quan ta ve PCR and densitometry . . . . . . . . . . . . . 76
2.1.13.1 Densitometry . . . . . . . . . . . . . . . . . . . . . . 77
2.1.14 Sample prepara on for sequencing . . . . . . . . . . . . . . . . 79
2.1.14.1 Gel extrac on . . . . . . . . . . . . . . . . . . . . . . 79
2.1.14.2 DNA quan fica on . . . . . . . . . . . . . . . . . . . . 80
2.1.14.3 Sample prepara on . . . . . . . . . . . . . . . . . . . 80
2.1.14.4 Sequencing . . . . . . . . . . . . . . . . . . . . . . . . 81
2.2 In vivo techniques . . . . . . . . . . . . . . . . . . . . . . . . . . . . . . 82
2.2.1 Animal surgery . . . . . . . . . . . . . . . . . . . . . . . . . . . 82
2.2.1.1 Op c nerve crush . . . . . . . . . . . . . . . . . . . . 82
2.2.2 Intravitreal injec ons . . . . . . . . . . . . . . . . . . . . . . . . 83
2.2.3 AAV2-CNTF-hrGFP,AAV2-eGFP andAAV2-CNTF-shRhoA-hrGFPde-livery and RGC survival counts . . . . . . . . . . . . . . . . . . . 83
2.2.4 Tissue Prepara on for Histology . . . . . . . . . . . . . . . . . . 84
2.2.5 Re nal wholemount counts . . . . . . . . . . . . . . . . . . . . 85
2.2.6 Re nal ganglion cell transduc on . . . . . . . . . . . . . . . . . 85
2.2.7 Quan fica on of RGC axon regenera on in vivo . . . . . . . . . . 87
2.2.8 Sta s cal Analysis . . . . . . . . . . . . . . . . . . . . . . . . . 90
Page | iv
3 Characterisa on of the RGC-5 Cell Line 91
3.1 The use of cell lines in biological research . . . . . . . . . . . . . . . . . 92
3.2 RGC-5 cell line . . . . . . . . . . . . . . . . . . . . . . . . . . . . . . . . 92
3.3 Aims . . . . . . . . . . . . . . . . . . . . . . . . . . . . . . . . . . . . . 94
3.4 Results . . . . . . . . . . . . . . . . . . . . . . . . . . . . . . . . . . . . 94
3.4.1 Staurosporine treatment induces process extension . . . . . . . 95
3.4.2 The impact of Staurosporine treatment on process number . . . 99
3.4.3 Process branching is dose dependent . . . . . . . . . . . . . . . 100
3.4.4 RGC-5 cell viability assay a er Staurosporine treatment . . . . . . 102
3.4.5 Representa ve images of the Staurosporine dose response ex-periment . . . . . . . . . . . . . . . . . . . . . . . . . . . . . . 104
3.5 The RGC-5 cell line is derived fromMusmusculus and not Ra us norvegicus107
3.5.1 New aims . . . . . . . . . . . . . . . . . . . . . . . . . . . . . . 107
3.5.2 Primer Op misa on . . . . . . . . . . . . . . . . . . . . . . . . 112
3.5.3 Determining the exponen al phase of the PCR reac on . . . . . . 114
3.5.3.1 Neuronal marker expression . . . . . . . . . . . . . . . 114
3.5.3.2 Expression of glial markers . . . . . . . . . . . . . . . 114
3.5.3.3 Developmental Marker Expression . . . . . . . . . . . 115
3.5.4 RGC-5 cells are derived from the oligodendroglial lineage . . . . . 117
3.5.5 RGC-5 cells are not derived from cone photoreceptors . . . . . . 120
3.5.6 Densitometry . . . . . . . . . . . . . . . . . . . . . . . . . . . . 121
3.6 Discussion . . . . . . . . . . . . . . . . . . . . . . . . . . . . . . . . . . 123
3.6.1 Morphological analysis of Staurosporine treated RGC-5 cells . . . 123
3.6.2 RGC-5 sequencing . . . . . . . . . . . . . . . . . . . . . . . . . 127
3.6.3 RGC-5 expression profile . . . . . . . . . . . . . . . . . . . . . . 127
3.7 Conclusions . . . . . . . . . . . . . . . . . . . . . . . . . . . . . . . . . 130
Page | v
4 In vitro Effects of CNTF in Primary Re nal Culture 131
4.1 Tes ng the effec veness of CNTF in primary re nal culture . . . . . . . . 132
4.2 Aims . . . . . . . . . . . . . . . . . . . . . . . . . . . . . . . . . . . . . 133
4.3 Results . . . . . . . . . . . . . . . . . . . . . . . . . . . . . . . . . . . . 134
4.3.1 Primary re nal cultures . . . . . . . . . . . . . . . . . . . . . . . 134
4.3.2 Forskolin and recombinant CNTF promotes re nal ganglion cellneurite outgrowth in vitro . . . . . . . . . . . . . . . . . . . . . 136
4.3.3 CNTF and Forskolin treatment has a minimal affect on neuritenumber . . . . . . . . . . . . . . . . . . . . . . . . . . . . . . . 139
4.3.4 10 ngml−1 and 50 ngml−1 CNTF caused minor toxicity . . . . . . 141
4.3.5 100 ngml−1 CNTF increases neurite number and abolishes theNogo-P4 induced inhibitory effect . . . . . . . . . . . . . . . . . 144
4.3.6 100 ngml−1 CNTF disinhibits Nogo-P4 treated re nal ganglion cells146
4.3.7 Nogo-P4 treatment had no effect on RGC survival . . . . . . . . . 149
4.3.8 Summary of results . . . . . . . . . . . . . . . . . . . . . . . . . 151
4.4 Discussion . . . . . . . . . . . . . . . . . . . . . . . . . . . . . . . . . . 152
4.4.1 Forskolinwas effec ve at s mula ngRGCneurite outgrowthwhenadministered alone or in combina on with a low dose of CNTF . . 152
4.4.2 100 ngml−1 CNTF significantly increased mean neurite length . . 154
4.4.3 Treatment with Forskolin led a to a small reduc on in RGC number156
4.4.4 CNTF and Forskolin had a minimal effect on mean neurite number 156
4.4.5 25 µ Nogo-P4 pep de significantly inhibited RGC neurite out-growth . . . . . . . . . . . . . . . . . . . . . . . . . . . . . . . 157
4.4.6 Treatment with 25 µ Nogo-P4 pep de had no impact on RGCsurvival . . . . . . . . . . . . . . . . . . . . . . . . . . . . . . . 158
4.4.7 Treatment with 100 ngml−1 CNTF disinhibited Nogo-P4 pep detreated RGC . . . . . . . . . . . . . . . . . . . . . . . . . . . . . 158
4.5 Conclusions . . . . . . . . . . . . . . . . . . . . . . . . . . . . . . . . . 158
Page | vi
5 AAV2 as a Vector for Delivering CNTF to the Visual System 160
5.1 Introduc on . . . . . . . . . . . . . . . . . . . . . . . . . . . . . . . . . 161
5.1.1 Barriers to AAV2 transduc on . . . . . . . . . . . . . . . . . . . 162
5.2 Hypothesis . . . . . . . . . . . . . . . . . . . . . . . . . . . . . . . . . 166
5.3 Aims . . . . . . . . . . . . . . . . . . . . . . . . . . . . . . . . . . . . . 166
5.4 Results . . . . . . . . . . . . . . . . . . . . . . . . . . . . . . . . . . . . 166
5.4.1 Design and valida on of shRhoA containing constructs . . . . . . 166
5.4.2 HEK-293 cells transfectedwithAAV2-CNTF-hrGFP,AAV2-CNTF-shRhoA-hrGFP and AAV2-CNTF-FLAG produced detectable levels of CNTF . 167
5.4.3 Co-injec onwith 0.0002%Pronase-E significantly enhancedAAV2-eGFP transduc on, but caused some cell death . . . . . . . . . . 169
5.4.4 RGC survival was not enhanced byAAV2-CNTF-hrGFP + Pronase-Eor AAV2-CNTF-shRhoA-hrGFP + Pronase-E treatment . . . . . . . 172
5.4.5 AAV2-CNTF-hrGFP and CNTF-shRhoA did not promote extensiveRGC axonal regenera on . . . . . . . . . . . . . . . . . . . . . . 175
5.5 Discussion . . . . . . . . . . . . . . . . . . . . . . . . . . . . . . . . . . 181
5.5.1 Condi onedmedia collected fromAAV2-CNTF-hrGFP,AAV2-CNTF-shRhoA-hrGFP andAAV2-CNTF-FLAG transfectedHEK-293 cells con-tained detectable levels of CNTF . . . . . . . . . . . . . . . . . . 181
5.5.2 AAV2-eGFP + Pronase-E significantly enhanced AAV2-eGFP trans-duc on . . . . . . . . . . . . . . . . . . . . . . . . . . . . . . . 181
5.5.3 AAV2-eGFP + Pronase-E significantly reduced RGC number in re -nal wholemount prepara ons . . . . . . . . . . . . . . . . . . . 182
5.5.4 AAV2-CNTF-hrGFP andAAV2-CNTF-shRhoA-hrGFPdid not promoteextensive axonal regenera on . . . . . . . . . . . . . . . . . . . 184
5.5.5 AAV2-CNTF-hrGFP andAAV2-CNTF-shRhoA-hrGFP did not protectRGC from cell death . . . . . . . . . . . . . . . . . . . . . . . . 185
5.6 Conclusions . . . . . . . . . . . . . . . . . . . . . . . . . . . . . . . . . 185
6 General Discussion 186
6.1 Main Findings and Future Work . . . . . . . . . . . . . . . . . . . . . . . 187
Page | vii
6.1.1 Viral Delivery . . . . . . . . . . . . . . . . . . . . . . . . . . . . 188
6.2 Conclusions . . . . . . . . . . . . . . . . . . . . . . . . . . . . . . . . . 190
References 191
Appendices 205
A Characterisa on of the RGC-5 Cell Line 205
Page | viii
LIST OF FIGURES
1.1 Organisa on of the re na . . . . . . . . . . . . . . . . . . . . . . . . . . 3
1.2 Diagramma c representa on of the op c nerve . . . . . . . . . . . . . . 9
1.3 Diagramma c representa on of the ON crush model . . . . . . . . . . . 11
1.4 Diagrama c representa on of MAG structure . . . . . . . . . . . . . . . 17
1.5 Structure of OMgp . . . . . . . . . . . . . . . . . . . . . . . . . . . . . 19
1.6 Structural arrangement of Nogo-A, Nogo-B and Nogo-C . . . . . . . . . . 20
1.7 Growth cone structure . . . . . . . . . . . . . . . . . . . . . . . . . . . 24
1.8 Inhibitory signalling diagram . . . . . . . . . . . . . . . . . . . . . . . . 27
1.9 Diagramma c representa on of the intrinsic and extrinsic apopto c sig-nalling pathways . . . . . . . . . . . . . . . . . . . . . . . . . . . . . . 32
1.10 Neurotrophic factor signalling through Trk receptors . . . . . . . . . . . 36
1.11 Structure of wild type AAV . . . . . . . . . . . . . . . . . . . . . . . . . 50
1.12 Recombinant AAV virus . . . . . . . . . . . . . . . . . . . . . . . . . . . 52
2.1 Diagramma c representa on of sampling technique . . . . . . . . . . . 59
2.2 pAAV-IRES-hrGFP expression plasmid supplied in the AAVHelper Free Sys-tem . . . . . . . . . . . . . . . . . . . . . . . . . . . . . . . . . . . . . 65
2.3 Example of how the exponen al phase of the PCR reac on was determined 78
2.4 Image illustra ng the sampling technique used to calculate RGC survivaland GFP transduc on efficiency . . . . . . . . . . . . . . . . . . . . . . 86
2.5 Quan fica on of RGC axon regenera on . . . . . . . . . . . . . . . . . . 89
Page | ix
3.1 Staurosporine treatment induces process extension . . . . . . . . . . . . 97
3.2 Process number a er Staurosporine dose response . . . . . . . . . . . . 99
3.3 Process branching is dose dependent . . . . . . . . . . . . . . . . . . . 101
3.4 RGC-5 cell viability assay . . . . . . . . . . . . . . . . . . . . . . . . . . 103
3.5 Representa ve images of Staurosporine dose response experiment . . . 105
3.6 Rat CNTF primers do not anneal to RGC-5 cDNA . . . . . . . . . . . . . . 110
3.7 NG2 and CD44 PCR products and sequence alignments . . . . . . . . . . 111
3.8 Op misa on of annealing temperature . . . . . . . . . . . . . . . . . . 113
3.9 Semi-quan ta ve PCR analysis of selected neuronal, glial and progenitorcell mRNA markers in RGC-5 cells . . . . . . . . . . . . . . . . . . . . . . 116
3.10 Semi-quan ta ve PCR shows that RGC-5 cells expressmarkers of the oligo-dendroglial lineage . . . . . . . . . . . . . . . . . . . . . . . . . . . . . 118
3.11 Immunocytochenistry shows that RGC-5 cells expressmarkers of the oligo-dendroglial lineage . . . . . . . . . . . . . . . . . . . . . . . . . . . . . 119
3.12 RGC-5 cells are not derived from cone photoreceptor cells . . . . . . . . 120
3.13 Densitometric analysis of PCR products . . . . . . . . . . . . . . . . . . 122
4.1 Representa ve bright field images of control primary re nal cultures . . . 135
4.2 CNTF and Forskolin promotes neurite outgrowth in vitro . . . . . . . . . 138
4.3 CNTF and Forskolin had a minimal affect on neurite number . . . . . . . 140
4.4 Minor cytotoxicity was seen a er treatment with 15 µ Forskolin com-pared to untreated controls . . . . . . . . . . . . . . . . . . . . . . . . . 142
4.5 CNTF dose response experiment . . . . . . . . . . . . . . . . . . . . . . 143
4.6 100 ng CNTF increased neurite number and abolished the Nogo-P4 in-duced inhibitory effect . . . . . . . . . . . . . . . . . . . . . . . . . . . 145
4.7 Effect of CNTF on Nogo-P4 treated primary re nal culture. . . . . . . . . 147
4.8 Nogo-P4 treatment had no effect on RGC survival . . . . . . . . . . . . . 149
4.9 Nogo-P4 inhibitory assay . . . . . . . . . . . . . . . . . . . . . . . . . . 150
Page | x
5.1 Localisa on of Cy3-labelled AAV2 par cles at the ILM of the re na . . . . 163
5.2 Pronase-E punches holes in the ILM of the re na . . . . . . . . . . . . . 164
5.3 Design and valida on of shRhoA containing constructs . . . . . . . . . . 167
5.4 CNTF ELISA on HEK-293 Condi oned Media . . . . . . . . . . . . . . . . 168
5.5 AAV2-eGFP transduc on . . . . . . . . . . . . . . . . . . . . . . . . . . 170
5.6 AAV2-eGFP transduc on representa ve wholemount images . . . . . . . 171
5.7 RGC survivalwas not enhancedbyAAV2-CNTF-hrGFPorAAV2-CNTF-sRhoAtreatment . . . . . . . . . . . . . . . . . . . . . . . . . . . . . . . . . . 173
5.8 Representa ve images of H&E stained re nal sec ons . . . . . . . . . . 174
5.9 Quan fica on of RGC axon regenera on . . . . . . . . . . . . . . . . . . 177
5.10 Intravitreal injec on of AAV2-eGFP + 0.0002% Pronase-E did not promoteRGC axon regenera on 23 d post-ONC . . . . . . . . . . . . . . . . . . . 178
5.11 Intravitreal injec on ofAAV2-CNTF + 0.0002% Pronase-E did not promoteRGC axon regenera on 23 d post-ONC . . . . . . . . . . . . . . . . . . . 179
5.12 Intravitreal injec on of AAV2-CNTF-shRhoA + 0.0002% Pronase-E did notpromote RGC axon regenera on 23 d post-ONC . . . . . . . . . . . . . . 180
A.1 RGC-5 neuronal marker expression . . . . . . . . . . . . . . . . . . . . . 206
A.2 RGC-5 glial marker expression . . . . . . . . . . . . . . . . . . . . . . . 207
A.3 RGC-5 developmental marker expression . . . . . . . . . . . . . . . . . . 208
A.4 RGC-5 oligodendroglial lineage marker expression . . . . . . . . . . . . . 209
A.5 Blue-sensi ve opsin expression . . . . . . . . . . . . . . . . . . . . . . . 210
Page | xi
LIST OF TABLES
2.1 Immunocytochemistry / immunohistochemistry reagents. . . . . . . . . 62
2.2 An body details for immunocytochemistry and immunohistochemsitry. . 62
2.3 Reagents for CNTF ELISA. . . . . . . . . . . . . . . . . . . . . . . . . . . 68
2.4 2 x RT master mix (100 µl reac on volume). . . . . . . . . . . . . . . . . 72
2.5 Thermal cycler se ngs used for reverse transcrip on. . . . . . . . . . . . 73
2.6 RGC-5 primer list. . . . . . . . . . . . . . . . . . . . . . . . . . . . . . . 74
2.7 PCR reac on volumes. . . . . . . . . . . . . . . . . . . . . . . . . . . . 76
2.8 PCR thermal cycler se ngs. . . . . . . . . . . . . . . . . . . . . . . . . . 76
2.9 PCR reac on volumes used to prepare samples for sequencing. . . . . . . 79
2.10 Sample prepara on. . . . . . . . . . . . . . . . . . . . . . . . . . . . . . 81
Page | xii
LIST OF ABBREVIATIONS
AAV Adeno-associated virus
Ad Adenoviruses
AIF Apoptosis inducing factor
ANOVA Analysis of variance
AP-1 Ac vator protein-1
ATCC American Type Culture Collec on
BDNF Brain derived neurotrophic factor
Brn-3 Brain-3
C-domain Central domain
C.elegans Caenorhabdi s elegans
CaMK Calmodulin-dependent protein kinases
cAMP Cyclic adenosine monophosphate
cDNA Complementary DNA
ChaT Choline acetyltransferase
CLC Cardiotrophin like cytokine
CNS Central nervous system
CNTF Cilliary neurotrophic factor
CNTFRɑ CNTFɑ receptor
CR3 Complement type 3 receptor
CREB cAMP responsive binding element binding protein
CSPG Chondroi n sulphate proteoglycan
Page | xiii
CSPGs Chondroi n sulphate proteoglycans
CT-1 Cardiotrophin-1
DAG Diaglycerol
DAPI 4ʹ,6-diamidino-2-phenylindole
DIABLO Direct inhibitor of apoptosis binding protein with low PI
DMEM Dulbecco's Modified Eagle Medium
DMSO Dimethyl Sulfoxide
DNA Deoxyribonucleic acid
DNase I deoxyribonuclease I
dpi Days post-injury
DREZ Dorsal root entry zone
dsRNA double-stranded RNA
EBSS Earle's Balanced Salt Solu on
ELAV Equine infec ous anaemia virus
ELISA Enzyme-linked immunosorbent assay
EtBr Ethidium bromide
F-ac n Filamentous-ac n
FBS Foetal bovine serum
FG Flourogold
FG+ Flourogold posi ve
FGF2 Fibroblast growth factor 2
FIV Feline immunodeficiency virus
GAG Glycosaminoglycan chain
GAP GTPase-ac va ng protein
GAP-43 Growth-associated protein-43
GAPDH Glyceraldehyde 3-phosphate dehydrogenase
GCL Ganglion cell layer
GDI GDP dissocia on inhibitors
Page | xiv
GDP Guanosine diphosphate
GEF Guanine nucleo de-exchange factor
GFAP Glial fibrillary acidic protein
GFP Green fluorescent protein
GPCR G protein coupled receptors
GPI Glycosyl phospha dylinositol
Grb2 Growth factor receptor binding protein 2
H&E Haematoxylin and eosin
HEK-293 Human embryonic kidney 293 cells
HIV Human immunodeficiency virus
HSPG Heparin sulphate proteoglycan
HSV Herpes simplex virus
HtrA2 High-temperature requirement protein A2
IAP Inhibitor of apoptosis
Ig Immunoglobulin
IHC Immunohistochemistry
IL-11 Interleukin-11
IL-6 Interleukin-6
INL Inner nuclear layer
IP3 Inosital-trisphosphate
IPL Inner plexiform layer
IRES Internal ribosome entry site
ITR Inverted terminal repeats
JAK Janus-kinase
JAK-2 Janus-kinase 2
K252a 9,12-epoxy-1H-diindolo[1,2,3-fg:3ʹ,2ʹ,1ʹ-kl]pyrrolo[3,4-i][1,6]benzodiazocine-10-carboxylic acid, 2,3,9,10,11,12-hexahydro-10-hydroxy-9-methyl-1-oxo-, methyl ester, (9S,10R,12R)-
Page | xv
K252b (5R,6S,8S)-6-hydroxy-5-methyl-13-oxo-6,7,8,13,14,15-hexahydro-5H-16-oxa-4b,8a,14-triaza-5,8-methanodibenzo[b,h]cycloocta[jkl]cyclopenta[e]-as-indacene-6-carboxylic acid
K252c Staurosporine aglycone
L-MAG Large MAG
LCA Leukocyte common an gen
LGN Lateral geniculate nucleus
LIF Leukemia inhibitory factor
LIFRβ Leukemia inhibitory factor receptor β
Lingo-1 Leucine rich repeat and Ig domain containing 1
LRR Leucine rich repeat
LV Len virus
MAG Myelin associated glycoprotein
MAP2 Microtubule-associated protein 2
MAPK Mitogen-ac vated protein kinase
MEK Map kinase kinase
MHC I Major histocompa bilty complex I
MHC II Major histocompa bilty complex II
MIL Myelin inhibitory ligand
MMPs Matrix metalloproteases
mRNA Messenger RNA
NDPase Nucleoside diphosphatase
NFL Nerve fibre layer
NG2 Neuron-glial an gen 2
NGF Nerve growth factor
NgR Nogo receptor
NMDA-R1 N-Methyl-D-aspar c acid
Nogo Neurite outgrowth inhibitor
NP Neuropoie n
Page | xvi
NT3 Neurotrophin 3
NT4 Neurotrophin 4
NT5 Neurotrophin 5
Olig-1 Oligodendrocyte transcrip on factor-1
Olig-2 Oligodendrocyte transcrip on factor-2
OMgp Oligodendrocyte myelin glycoprotein
ON Op c nerve
ONC Op c nerve crush
ONL Outer nuclear layer
OPL Outer plexiform layer
OSM Oncosta n M
P-domain Peripheral domain
P/S Penicillin/streptomycin
p75NTR Low-affinity p75 neurotrophin receptor
PAX-6 Paired box gene-6
PBS Phosphate buffered saline
PFA Paraformaldehyde
PI3K Phosphoinosi de 3-kinases
PIP2 Phospha dylinositol-4,5-bisphosphate
PKA Protein kinase A
PKC Protein kinase C
PKC-412 4ʹ-N-benzoylstaurosporine
PKG Protein kinase G
PLC Phospholipase C
PN Peripheral nerve
ppNGF prepro-Nerve growth factor
RGC Re nal ganglion cells
RISC RNA-induced silencing complex
Page | xvii
RNAi RNA interference
ROCK Rho-associated kinase
RPF-1 POU-domain factor-1
RT Room temperature
S-MAG Small MAG
SC Superior colliculus
SEM Standard error of the mean
SHC SH2 containing protein
Shh Sonic hedgehog
siRNA Short-interfering RNA
SIV Simian immunodeficiency virus
Smac Second mitochondria-derived ac vator of caspase
SOS Son of sevenless
SOX-1 Sex determining region Y box-1
STAT Signal-transducer and ac vator of transcrip on
STAT1 Signal transducers and ac vators of transcrip on 1
STAT3 Signal transducers and ac vators of transcrip on 3
T-domain Transi on domain
TGFβ Transforming growth factor beta
Thy-1 Thymocyte differen a on an gen 1
TIMP Tissue inhibitors of MMP
TNF Tumour necrosis factor
Trk Tropomyosin receptor kinase
TrkA Tropomyosin receptor kinase A
TrkB Tropomyosin receptor kinase B
TrkC Tropomyosin receptor kinase C
Troy Tumour necrosis factor receptor 19
UCN-01 7-hydroxystaurosporine
Page | xviii

CHAPTER 1
GENERAL INTRODUCTION
Page | 1
1.1 Anatomy of the visual system
The visual system has a single popula on of neurons within the re na (Re nal ganglion
cells) that extend their axons to form the op c nerves. The op c nerve (ON) decussates
at the op c chiasm to form the op c tracts which synapses at the lateral geniculate nu-
cleus (LGN) and superior colliculus (SC) (Berry, et al. 2008). Visual informa on is directed
from these structures to the visual neocortex for processesing, the motor nuclei in the
brain stem and cord for visually guided movement and the accessory oculomotor nu-
cleus for accommoda on reflexes (Berry et al. 2008). Interes ngly, not all axons in the
ON originate from re nal ganglion cells (RGC). A small subpopula on of re nopetal axons
originate from pep dernergic neurons in the hypothalamus (and other limbic structures)
and terminate in the re na (Vereczki, et al. 2006).
1.1.1 Organisa on of the re na
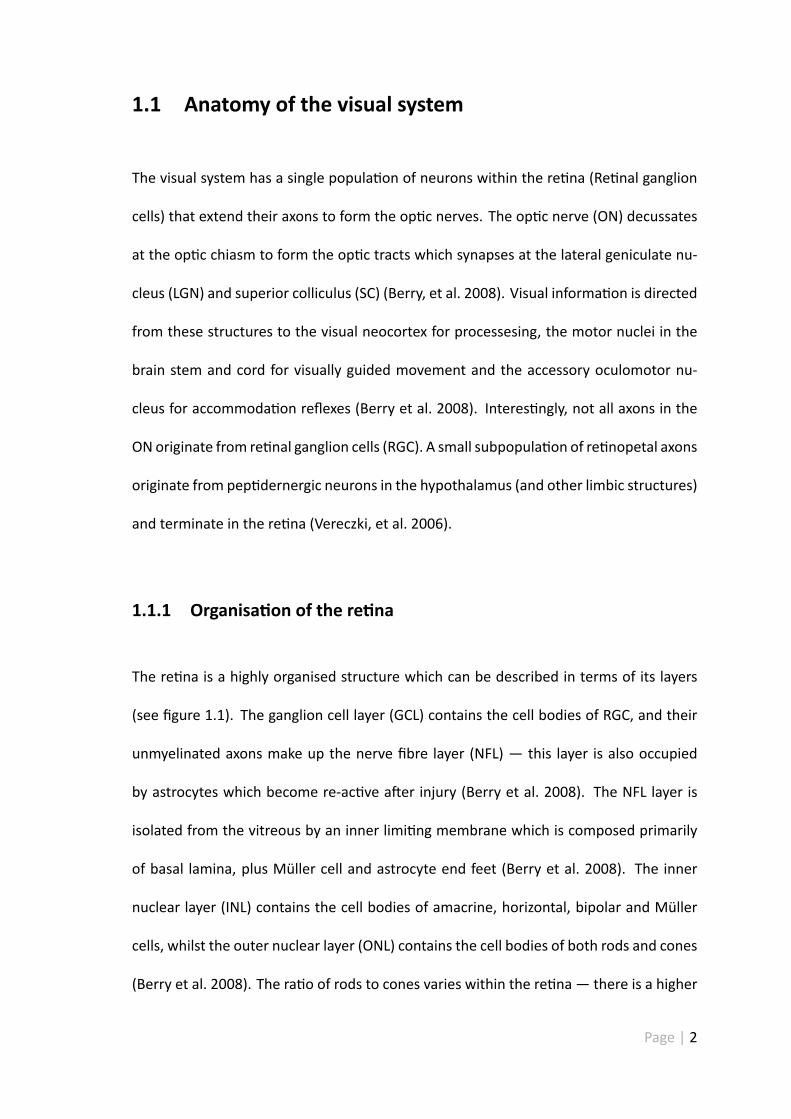
The re na is a highly organised structure which can be described in terms of its layers
(see figure 1.1). The ganglion cell layer (GCL) contains the cell bodies of RGC, and their
unmyelinated axons make up the nerve fibre layer (NFL) — this layer is also occupied
by astrocytes which become re-ac ve a er injury (Berry et al. 2008). The NFL layer is
isolated from the vitreous by an inner limi ng membrane which is composed primarily
of basal lamina, plus Müller cell and astrocyte end feet (Berry et al. 2008). The inner
nuclear layer (INL) contains the cell bodies of amacrine, horizontal, bipolar and Müller
cells, whilst the outer nuclear layer (ONL) contains the cell bodies of both rods and cones
(Berry et al. 2008). The ra o of rods to cones varies within the re na — there is a higher
Page | 2
ra o of rods to cones in the periphery as well as a higher propor on of photoreceptors to
ganglion cells. At the back of the re na there is a layer of re nal pigmented epithelium
which acts as a protec ve barrier and prevents the reflec on of light striking the back of
the re na tomaintain image integrity. Synap c connec ons between interneurons occur
in the inner plexiform and outer plexiform layers (Berry et al. 2008).
Figure 1.1: Organisa on of the re na. The re na is a highly organised structure which can bedescribed in terms of its layers. RGC lie within the GCL and their unmyelinated axons lie within theNFL. This layer also contains astrocytes which become reac ve a er injury. The NFL is separatedfrom the vitreous by the inner limi ng membrane. Bipolar, amacrine and horizontal cells residewithin the INL. Rod and cone photoreceptors occupy the ONL. Synap c connec ons betweeninterneurons occur in the inner plexiform layer (IPL) and outer plexiform layer (OPL). (Reproducedwith permission from Prof. Ann Logan) (Berry et al. 2008).
Page | 3
1.2 RGC structure func on and development
The ON and eye are highly specialised central nervous system (CNS) structures which
are formed from the neural tube. Eye development in vertebrates is characterised by
bilateral evagina on of the diencephalon (op c vesicle). The op c vesicle then makes
contact with the surface ectoderm and folds back on its self to form the op c cup. The
thin outer region of the op c cup forms the re nal pigmented epitheliumwhilst the inner
region forms the re na (Chow & Lang 2001).
In the re na, cell differen a on from re nal precursors occurs in the inner layer of the
op c cup and gradually expands out towards the peripheral edge of the re na. Cell dif-
feren a on from re nal precursors tends to occur in a very specific order. In the rat
genera on of all the major cell types commences between Embryonic day 14 and 20
(E14-E20) (Reese & Colello 1992).
RGC differen a on commences at around E14, these cells then migrate towards the in-
ner limi ng membrane (ILM) of the re na to form the GCL (Werner & Chalupa 2004).
Amacrine cells emerge shortly a erwards, although this process overlaps considerably
with RGC neurogenesis and does not occur sequen ally (Reese & Colello 1992). At this
point, synap c connec ons are established between the RGC and amacrine cells to form
the IPL of the re na (Werner & Chalupa 2004). Cone photoreceptors migrate at this
point, but do not differen ate un l much later (Werner & Chalupa 2004). This is im-
mediately followed by the genera on and differen a on of bipolar cells and Müller glia
(Werner & Chalupa 2004). At this stage, cone and rod photoreceptors of the ONLmature
Page | 4
and form synap c connec ons with bipolar and horizontal cells in the OPL (Werner &
Chalupa 2004).
1.2.1 RGC cell fate
For the most part, the way in which cell fate is determined remains unclear — however,
there are some studies which have provided insight. Progenitor cells which are des ned
to become RGC express transcrip on factors such as brain-3 (Brn-3) and re na derived
POU-domain factor-1 (RPF-1) (Wang & Kim 2001). Sonic hedgehog (Shh) also appears
to be an important determinant of RGC cell fate – as its expression leads to the gener-
a on and differen a on of new RGC (Isenmann & Kretz 2003). Furthermore, Shh has
been shown to regulate paired box gene-6 (PAX-6) (a gene which plays a pivotal role in
eye development) gene expression, for example, downregula on of PAX-6 directs re -
nal progenitors towards an amacrine cell fate whilst overexpression of PAX-6 increases
the rate of RGC differen a on and decreases photoreceptor cell number (Isenmann &
Kretz 2003).
Like many other neuronal popula ons, once differen ated, RGC loose the property of
self renewal and can't be replaced a er death. Newly established RGC extend their axons
through the ON, decussate at the op c chiasm and con nues on through the op c tracts
to make contact with their midbrain targets (e.g. LGN and SC) (Berry et al. 2008).
Page | 5
1.2.2 RGC morphology and classifica on
RGC can be sorted into subcategories based on their dendri c morphology, dendri c
field, cell size and loca on of dendri c arborisa on. In 1974 Boyco and Wassle pro-
posed a classifica on system for the cat. RGC of the cat were subdivided into alpha, beta,
gamma and delta types based on their size andmorphology (Boyco &Wassle 1974). Al-
pha cells have large cell bodies and wide dendri c fields, making up approximately 3% of
cat RGC (Kolb 1981). In the centre of the re na the density of alpha cell bodies is high
and the dendri c field is small, whilst in the periphery the reverse is true (Wassle 2004).
Alpha cells are not confined to the re na of cats, they can also be found in a variety of
mammals (rats, ferrets, guinea pigs, mice and ox) cited in (Wassle 2004). Beta cells have
small dendri c fields making up approximately 50% of cat RGC (Kolb 1981).
Another commonly used classifica on system for the cat was based on their physiologi-
cal responses to visual s muli (Y, X and W types). Since then it's been found that there
was a correla on between alpha, beta, gamma and delta morphologies with Y, X and W
type physiological responses (Bear, et al. 2001). There are two addi onal classifica ons
which should also be men oned, namely M-type (or Midget RGC) and P-type ganglion
cells (or Parasol RGC). These ganglion cell subtypes have been iden fied in the monkey
and human re na (Bear et al. 2001). M-type RGC are thought to be the human equiva-
lent of cat alpha cells and P-type RGC are thought to be the human equivalent of cat beta
cells(Wassle 2004). M-type RGC are typically larger and account for approximately 5% of
the total ganglion cell popula on, whilst P-type RGC are significantly smaller making up
the majority (≈90%), of the total cell popula on (Bear et al. 2001). The remaining 5% of
Page | 6
ganglion cells are made up of a completely different class of ganglion cells (non-M and
non-P subtypes) (Bear et al. 2001).
The func onal proper es of each of these subtypes differs considerably, for example,
M-type RGC have larger recep ve fields, propagate ac on poten als more rapidly and
are sensi ve to low contrast s muli (Bear et al. 2001). Furthermore, s mula on of their
recep vefields induces a transient burst of ac onpoten als (Bear et al. 2001). In contrast
s mula on of P-type RGC leads to the sustained firing of ac on poten als – in fact this
period of sustained ac vity con nues un l the s mulus has ceased (Bear et al. 2001). As
a result, M-type RGC are thought to be important in terms of detec on of movement,
whilst P-type RGC are more important in terms of visual acuity (Bear et al. 2001).
1.2.3 RGC recep ve fields
RGC can be further categorised based on their branching loca on, for example RGCs
which branch at different depths of the sublamina. The sublamina of the re na can be
divided into (A) RGCwith ON recep ve fields and (B) RGCwith OFF centre recep ve fields
(Nelson & Famiglie 1978). A recep ve field is an area of re na that can be s mulated to
fire ac on poten als (through changes in RGC membrane poten al) in response to light
(Bear et al. 2001). ON-centre RGC fire ac on poten als when light strikes the centre of
their recep ve fields, whereas OFF-centre RGC are ac vated when a shadow falls on the
centre of its recep ve field (Bear et al. 2001). The majority of RGC in the re na display
this property and have either ON or OFF centre recep ve fields. The way in which this
characteris c distribu on is established is believed to occur through cell death. Axons
Page | 7
compete for a limited number of trophic factors at their designated post-synap c targets
– those which receive more trophic support typically survive and those that are outcom-
peted die through apopto c mechanisms (Sernagor & Eglen 2001). The overall purpose
of this type of configura on is so that RGC can respond to changes in light intensity.
1.2.4 Colour opponent RGC
A small popula on of RGC are also sensi ve to specific wavelengths of light, namely
colour opponent RGC. This means that the response to one wavelength (e.g. red), strik-
ing the centre of the recep ve field can be cancelled out by the response of another (e.g.
green), striking the perimeter of the recep ve field (Bear et al. 2001). The central re-
gion of RGC recep ve field receives inputs from mainly red cones, whilst the periphery
receives inputs from green cones – therefore the response to red wavelengths can only
be cancelled out by the response of green wavelengths (Bear et al. 2001). This type of
configura on is typically seen in P-type RGC, whereas blue/yellow colour opponency is
o en found in non-M non-P type RGC (which works the same way). M-type RGC do not
exhibit this property, since the centre and periphery of the recep ve field are fed into by
mul ple types of cones (Bear et al. 2001).
1.3 Histology of the op c nerve
The ON is occupied by four types of glia, namely: oligodendrocytes, astrocytes, microglia
and neuron-glial an gen 2 (NG2) glia. Within the re na RGC axons are unmyelinated,
Page | 8
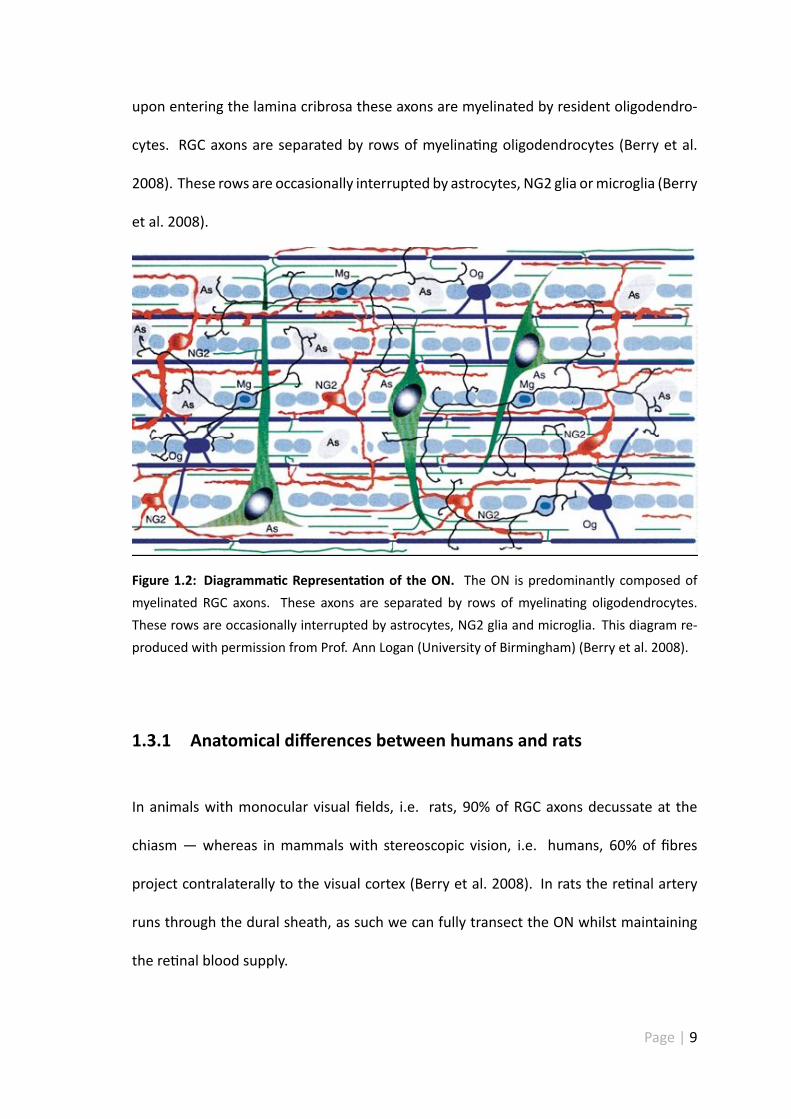
upon entering the lamina cribrosa these axons are myelinated by resident oligodendro-
cytes. RGC axons are separated by rows of myelina ng oligodendrocytes (Berry et al.
2008). These rows are occasionally interrupted by astrocytes, NG2 glia ormicroglia (Berry
et al. 2008).
Figure 1.2: Diagramma c Representa on of the ON. The ON is predominantly composed ofmyelinated RGC axons. These axons are separated by rows of myelina ng oligodendrocytes.These rows are occasionally interrupted by astrocytes, NG2 glia and microglia. This diagram re-produced with permission from Prof. Ann Logan (University of Birmingham) (Berry et al. 2008).
1.3.1 Anatomical differences between humans and rats
In animals with monocular visual fields, i.e. rats, 90% of RGC axons decussate at the
chiasm — whereas in mammals with stereoscopic vision, i.e. humans, 60% of fibres
project contralaterally to the visual cortex (Berry et al. 2008). In rats the re nal artery
runs through the dural sheath, as such we can fully transect the ON whilst maintaining
the re nal blood supply.
Page | 9
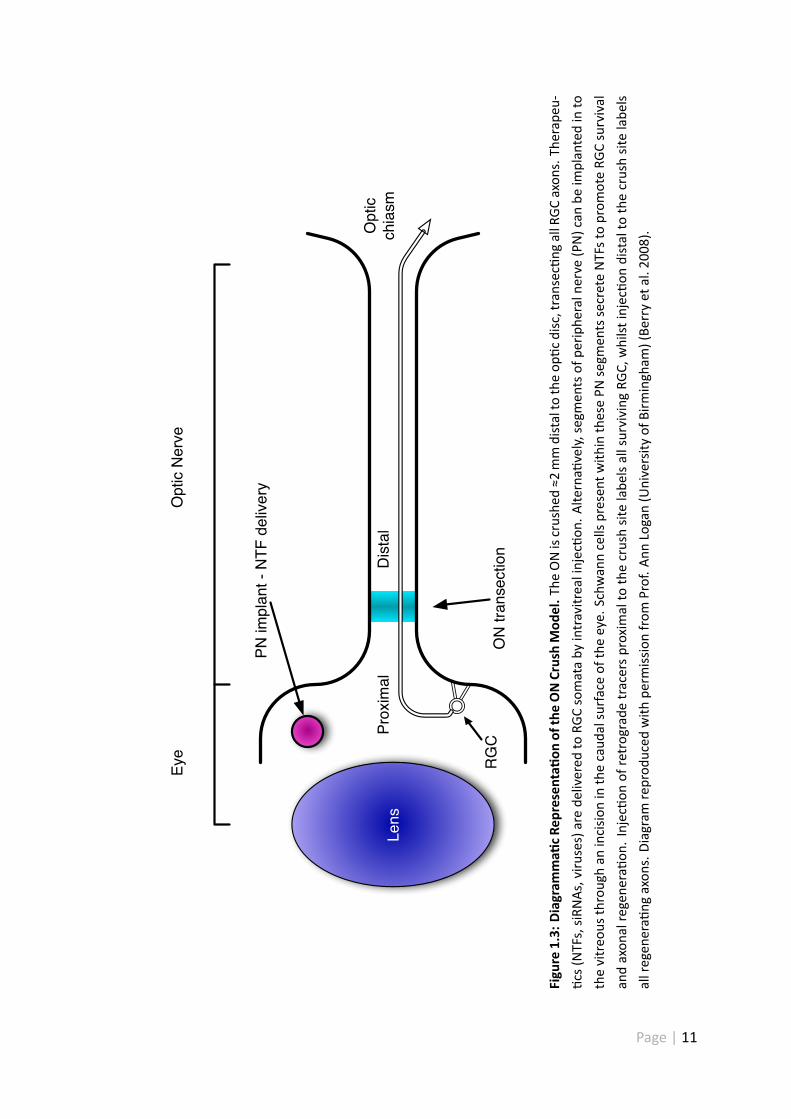
1.4 TheONas amodel system to studyCNS injury responses
The ON can be used as a model to study the cellular and molecular mechanisms under-
lying neuro-regenera ve failure. The anatomical simplicity and accessibility of the ON
allows us to dissect out basic mechanisms which inhibit or promote axon growth within
the CNS as a whole. With this model it is possible to completely transect RGC axonal pro-
jec ons from their target cells. As the eye is a rela vely enclosed system, specific cells
can be targeted and drug dose can be regulated more effec vely. Axon regenera on can
be assessed by intravitreal injec on of anterograde tracers e.g. cholera toxin or through
growth-associated protein-43 (GAP-43) immunohistochemistry (IHC) (Berry et al. 2008).
Retrograde tracers e.g. Fluorogold, can be injected proximal to the crush to assess RGC
survival through the use of re nal wholemount prepara ons. Furthermore, func onal
recovery can be assessed through the measurement of visually evoked poten als, pupil-
lary reflexes and visually guided behaviour (Berry et al. 2008).
Page | 10
Lens
Eye
Opt
ic N
erve
RG
CO
N tr
anse
ctio
n
Dis
tal
Prox
imal
PN im
plan
t - N
TF d
eliv
ery
Opt
icch
iasm
Figur e
1.3:
Diagramma
cRep
resenta
onof
theONCrushMod
el.T
heONiscrushe
d≈2
mmdistalto
theop
cdisc
,transec
ngallRGC
axon
s.Th
erap
eu-
cs(NTFs,siR
NAs,viru
ses)arede
livered
toRG
Csomataby
intravitrealinjec
on.A
lterna
vely,
segm
entsof
perip
heralnerve
(PN)can
beim
plantedinto
thevitreo
usthroughan
incisio
ninthecaud
alsurfaceof
theeye.
Schw
anncells
presen
twith
inthesePN
segm
entssecreteNTFstoprom
oteRG
Csurvival
andaxon
alregene
raon
.Injec
onof
retrograde
tracersproxim
alto
thecrushsitelabe
lsallsurviving
RGC,
whilst
injecon
distalto
thecrushsitelabe
lsallregen
era
ngaxon
s.Diagram
reprod
uced
with
perm
issionfrom
Prof.A
nnLogan(University
ofBirm
ingham
)(Be
rryet
al.200
8).
Page | 11
1.4.1 The CNS injury response
The extent of CNS damage can vary depending on the type of injury, the spread of damage
and the extent of secondary reac ons. CNS injuries typically sever axons, damagemyelin
sheaths and blood vessels and can cause catastrophic damage to the CNS through both
primary and secondary reac ons. It is also important to note that cellular responses can
vary depending on damage loca on and developmental age.
The primary responses to CNS injuries are typically ini ated by mechanical damage and
lead to apoptosis and necrosis of cells in the immediate vicinity, for example, mem-
branes and myelin sheaths may be injured leading to the release of myelin inhibitory
ligands (see sec on 1.6.0.1) and other extracellular matrix molecules (see sec on 1.6.4).
In addi on to this, the vasculature is commonly disrupted leading to infiltra on of a vari-
ety of haematogenous cells (macrophages, monocytes, neutrophils, platelets and serum)
(Berry 1998).
A er the ini al insult a whole host of secondary reac ons occur. Platelets commence a
clo ng reac on to stem the haemorrhage from severed blood vessels and monocytes
differen ate into macrophages to phagocytose necro c debris and blood clots (Berry
1998). Infiltra ng neutrophils, monocytes and lymphocytes s mulate the release of a
whole host of chemokines which poten ates the inflammatory response (Berry 1998)
andmacrophages sequester erythrocytes from the haemorrhagic core, reducing its over-
all volume (Berry 1998). The macrophages, monocytes and neutrophils secrete a whole
host of trophic cytokines (tumour necrosis factors, interleukins, TGFβ's, fibroblast growth
factors and insulin-like growth factors) and s mulate the release of a variety of endoge-
Page | 12
nous trophic factors from both neurons and glia (Berry 1998). Resident microglia also
play an important role in debris clearance by accumula ng around the injury site and
phagocytosing any cellular debris (Berry 1998). This is also accompanied by a change in
morphology and upregula on of major histocompa bilty complex an gens (MHC I and
II), leukocyte common an gen (LCA), nucleoside diphosphatase (NDPase) and comple-
ment type 3 receptor (CR3) (Berry 1998).
Reac ve astrocytes proliferate around the injury site and release axon growth inhibitory
molecules (CSPG, kera n sulphate proteoglycan and tenascin) which contribute towards
regenera ve failure (see sec on 1.6.4). This gliosis is typically iden fied by a change
in cell morphology and upregula on of glial fibrillary acidic protein (GFAP) (Berry et al.
2008).
The numbers of haematogenous cells are reduced 3 to 8 days post-injury (dpi) as endoge-
nous gliosis is amplified. Wound margins are established and a basal lamina is formed at
the astrocyte end feet boundary (Berry 1998). This structure comprises the glia limitans
and forms a con nuous barrier against the infiltra on of unwanted cells and molecules
(Berry 1998). The lesion core con nues to shrink between 8 dpi to 20 dpi— this structural
change is accompanied by compac on of astrocy c processes and GFAP down regula on
(Berry 1998).
Page | 13
1.5 Glia
Glial cells make up approximately 90% of cells present within the CNS - although glial cells
were originally thought to purely have a structural role (Weigert 1895), it has become
increasingly clear that glial cells have a variety of different func ons, and are essen al
for normal CNS func on and development. Four popula ons of glia exist in the CNS,
namely, astrocytes, microglia and NG2 glia and oligodendrocytes.
1.5.1 Astrocytes
Astrocytes have a stellate morphology consis ng of mul ple processes which interact
with numerous neurons to provide stability and support. Astrocytes have a number of
different func ons in health and disease. Neuronal damage and changes in the extra-
celluar environment triggers the upregula on of GFAP (Berry 1998). Astrocytes are a
major source of matrix and adhesion molecules e.g. laminin, fibronec n, cytotac n-J1.
Astrocytes also secrete pro-survival factors such as nerve growth factor (NGF), cilliary
neurotrophic factor (CNTF) and S100-protein which have been shown to promote neu-
rite outgrowth (Berry 1998).
1.5.2 NG2 glia
NG2 glia or `synantocytes' are highly abundant in the CNS and are distributed evenly
throughout grey and white ma er, making up approximately 8-9% of all white ma er
cells and 2-3% of grey ma er cells (Dawson & Polito 2003). NG2 glia has a stellate mor-
Page | 14
phology and can be iden fied by their expression of platelet derived growth factor re-
ceptor alpha (PDGFRα), A2B5 and NG2 (Verkhratsky & Bu 2007). During development
NG2 glia generate myelina ng oligodendrocytes (Rivers, et al. 2008). NG2 glia persist in
adulthood and retain some stem cell characteris cs (Verkhratsky & Bu 2007).
1.5.3 Microglia
Microglial cells cons tute the resident phagocy c cells of the CNS, making up approxi-
mately 10% of the total glial popula on (Hanisch & Ke erman 2007, Barres 2008). Mi-
croglia are derived from blood borne monocytes and mesenchymal progenitor cells, to a
lesser extent (Guillemin & Brew 2003).
Under normal condi onsmicroglia are thought to act as environmental sensorswhich are
able to rapidly respond to extracellular cues (microbes, serum, intracellular components,
protein aggregates) induced by trauma or infec on (Hanisch & Ke erman 2007). To fulfil
this role they con nuously rebuild their processes to allow them to efficiently monitor
the CNS environment (Hanisch & Ke erman 2007).
A er injurymicroglial cells assume a `reac ve' profile and temporarily cease their surveil-
lance ac vity. This change in reac ve state can be iden fied morphologically (processes
become shorter and thicker) and histologically (through the up regula on of phagocy c
makers such as CD68 and CD11b)(Ransohoff & Perry 2009).
Page | 15
1.6 Why doesn't the mammalian CNS regenerate?
Injury to the mammalian CNS has catastrophic func onal consequences, o en resul ng
in paralysis, loss of sensa on, chronic pain and loss of bladder control (Donovan 2007).
For many years the mammalian CNS was deemed to be incapable of regenera on. As a
result, research in this area was impeded for almost a century (Cajal 1928). This assump-
on was first challenged by a series of early experiments which demonstrated that some
injured axons were capable of regenera ng long distances in the permissive environment
of a PN gra (David & Aguayo 1981). Unfortunately regenera on was short lived, with
axons being unable to re-enter the CNS environment. This phenomenon has also been
documented in the re na, where axons were unable to enter the ON head (McConnell
& Berry 1982) unless a PN implant was present (Cotman 1985, Berry, et al. 1986). Re-
genera on was halted when axons encountered CNS myelin. CNS myelin is formed by
oligodendrocytes and its primary purpose is to increase the speed at which ac on poten-
als are propagated along myelinated fibres by saltatory conduc on – it is essen al for
normal CNS func on (Zalc & Colman 2000). These observa ons led researchers to inves-
gate the environmental factors which play an important role in regenera ve failure.
1.6.0.1 Myelin inhibitory ligands
CNS myelin was first implicated as a poten al inhibitor of neurite outgrowth a er a se-
ries of experiments showed that dissociated neurons could invade and extend neurites
along scia c nerve explants, but not ON explants (Schwab & Thoenen 1985). Further
evidence came from experiments performed by Huang et al which showed that mice im-
Page | 16
munised with central myelin extract 3 weeks before spinal cord injury showed significant
axonal regenera on across the lesion site (Huang, et al. 1999). Success was a ributed
to the produc on of polyclonal an bodies which specifically blocked myelin associated
inhibitors and prevented growth cone collapse.
Myelin associated glycoprotein
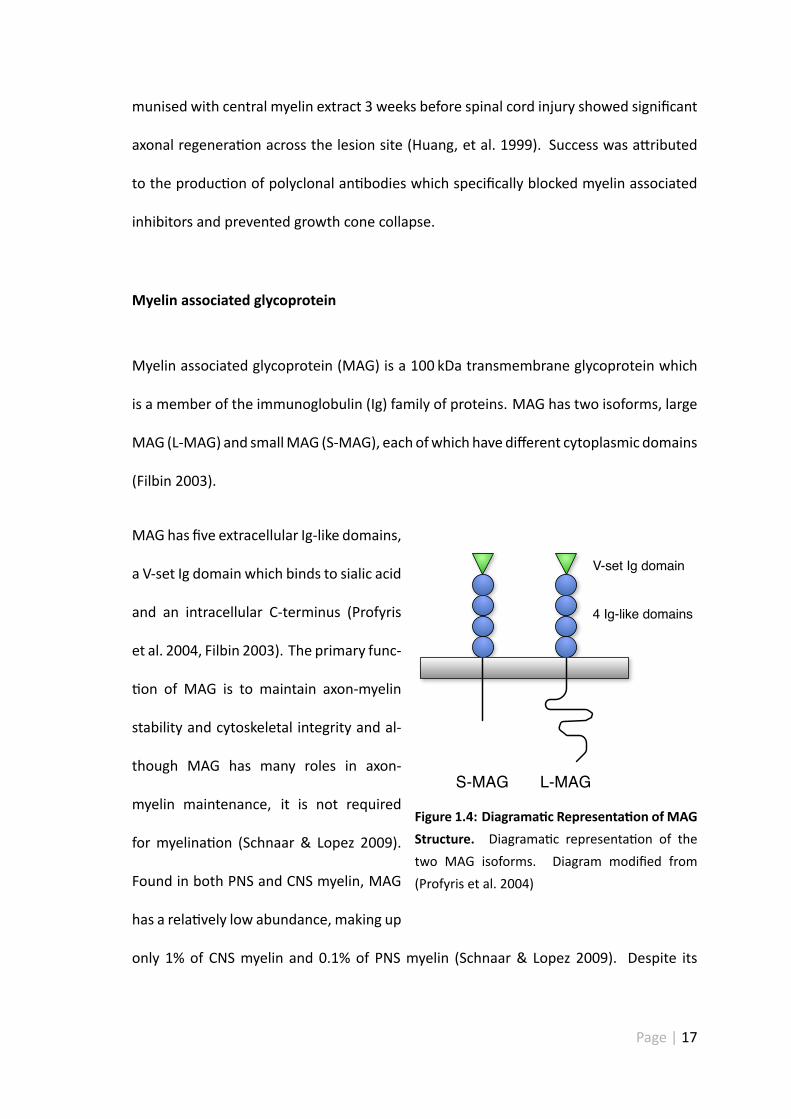
Myelin associated glycoprotein (MAG) is a 100 kDa transmembrane glycoprotein which
is a member of the immunoglobulin (Ig) family of proteins. MAG has two isoforms, large
MAG (L-MAG) and smallMAG (S-MAG), each ofwhich have different cytoplasmic domains
(Filbin 2003).
S-MAG L-MAG
V-set Ig domain
4 Ig-like domains
Figure 1.4: Diagrama c Representa on of MAGStructure. Diagrama c representa on of thetwo MAG isoforms. Diagram modified from(Profyris et al. 2004)
MAGhas five extracellular Ig-like domains,
a V-set Ig domain which binds to sialic acid
and an intracellular C-terminus (Profyris
et al. 2004, Filbin 2003). The primary func-
on of MAG is to maintain axon-myelin
stability and cytoskeletal integrity and al-
though MAG has many roles in axon-
myelin maintenance, it is not required
for myelina on (Schnaar & Lopez 2009).
Found in both PNS and CNS myelin, MAG
has a rela vely low abundance, making up
only 1% of CNS myelin and 0.1% of PNS myelin (Schnaar & Lopez 2009). Despite its
Page | 17
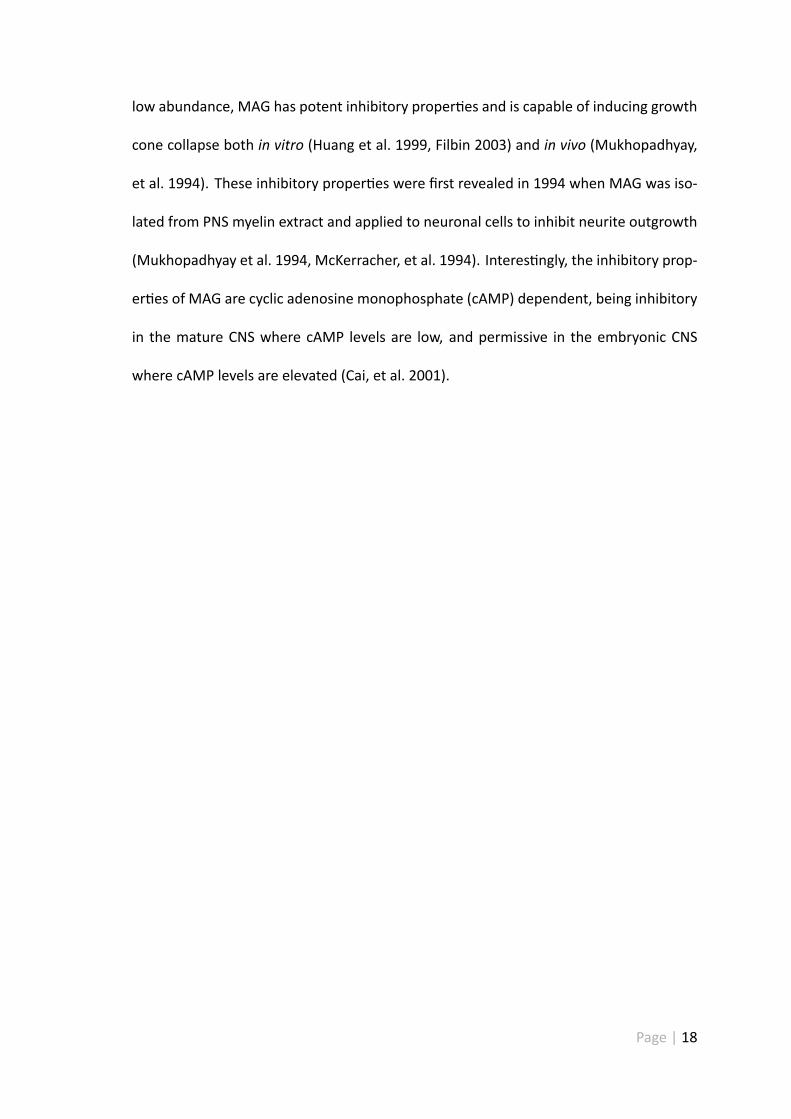
low abundance, MAG has potent inhibitory proper es and is capable of inducing growth
cone collapse both in vitro (Huang et al. 1999, Filbin 2003) and in vivo (Mukhopadhyay,
et al. 1994). These inhibitory proper es were first revealed in 1994 when MAG was iso-
lated from PNS myelin extract and applied to neuronal cells to inhibit neurite outgrowth
(Mukhopadhyay et al. 1994, McKerracher, et al. 1994). Interes ngly, the inhibitory prop-
er es of MAG are cyclic adenosine monophosphate (cAMP) dependent, being inhibitory
in the mature CNS where cAMP levels are low, and permissive in the embryonic CNS
where cAMP levels are elevated (Cai, et al. 2001).
Page | 18
Oligodendrocyte myelin glycoprotein
LRR
Ser/Thr richdomain
GPI anchor
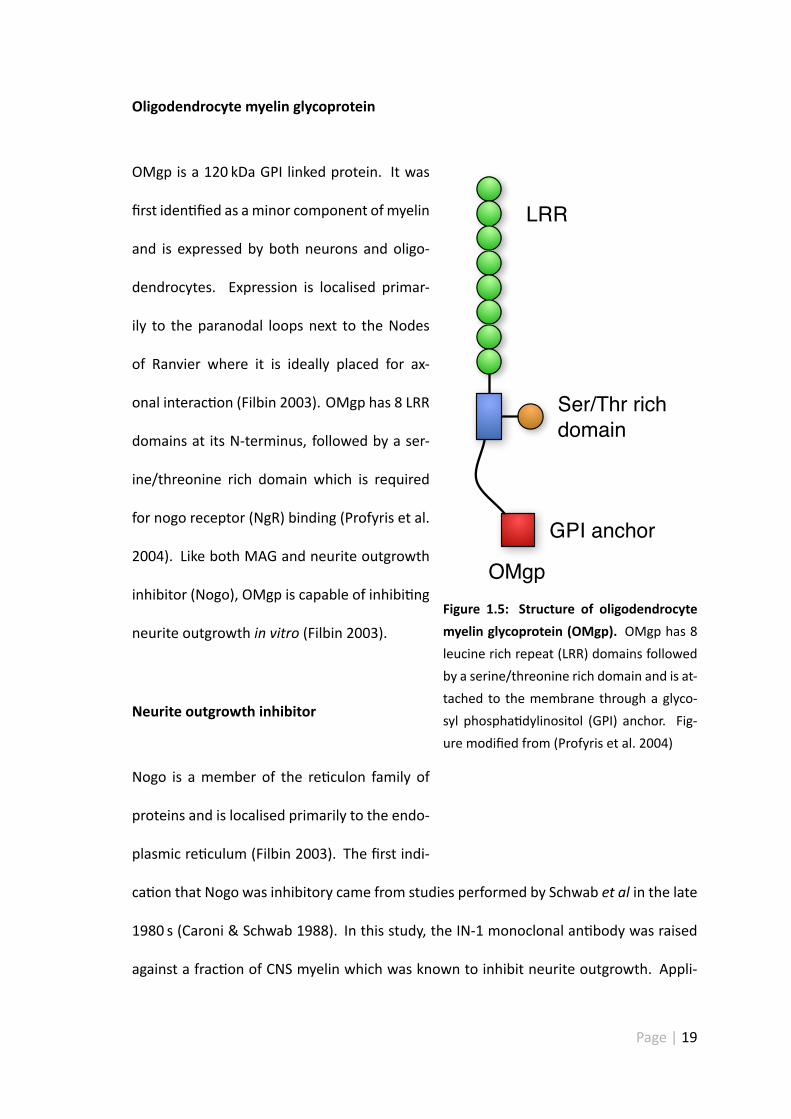
OMgpFigure 1.5: Structure of oligodendrocytemyelin glycoprotein (OMgp). OMgp has 8leucine rich repeat (LRR) domains followedby a serine/threonine rich domain and is at-tached to the membrane through a glyco-syl phospha dylinositol (GPI) anchor. Fig-ure modified from (Profyris et al. 2004)
OMgp is a 120 kDa GPI linked protein. It was
first iden fied as aminor component of myelin
and is expressed by both neurons and oligo-
dendrocytes. Expression is localised primar-
ily to the paranodal loops next to the Nodes
of Ranvier where it is ideally placed for ax-
onal interac on (Filbin 2003). OMgp has 8 LRR
domains at its N-terminus, followed by a ser-
ine/threonine rich domain which is required
for nogo receptor (NgR) binding (Profyris et al.
2004). Like both MAG and neurite outgrowth
inhibitor (Nogo), OMgp is capable of inhibi ng
neurite outgrowth in vitro (Filbin 2003).
Neurite outgrowth inhibitor
Nogo is a member of the re culon family of
proteins and is localised primarily to the endo-
plasmic re culum (Filbin 2003). The first indi-
ca on that Nogo was inhibitory came from studies performed by Schwab et al in the late
1980 s (Caroni & Schwab 1988). In this study, the IN-1 monoclonal an body was raised
against a frac on of CNS myelin which was known to inhibit neurite outgrowth. Appli-
Page | 19
ca on of this an body resulted in disinhibited neuronal growth both in vitro (Caroni &
Schwab 1988) and in vivo (Schnell & Schwab 1990). Despite this breakthrough, it was
not un l the year 2000 that the an gen for this an body was cloned and iden fied
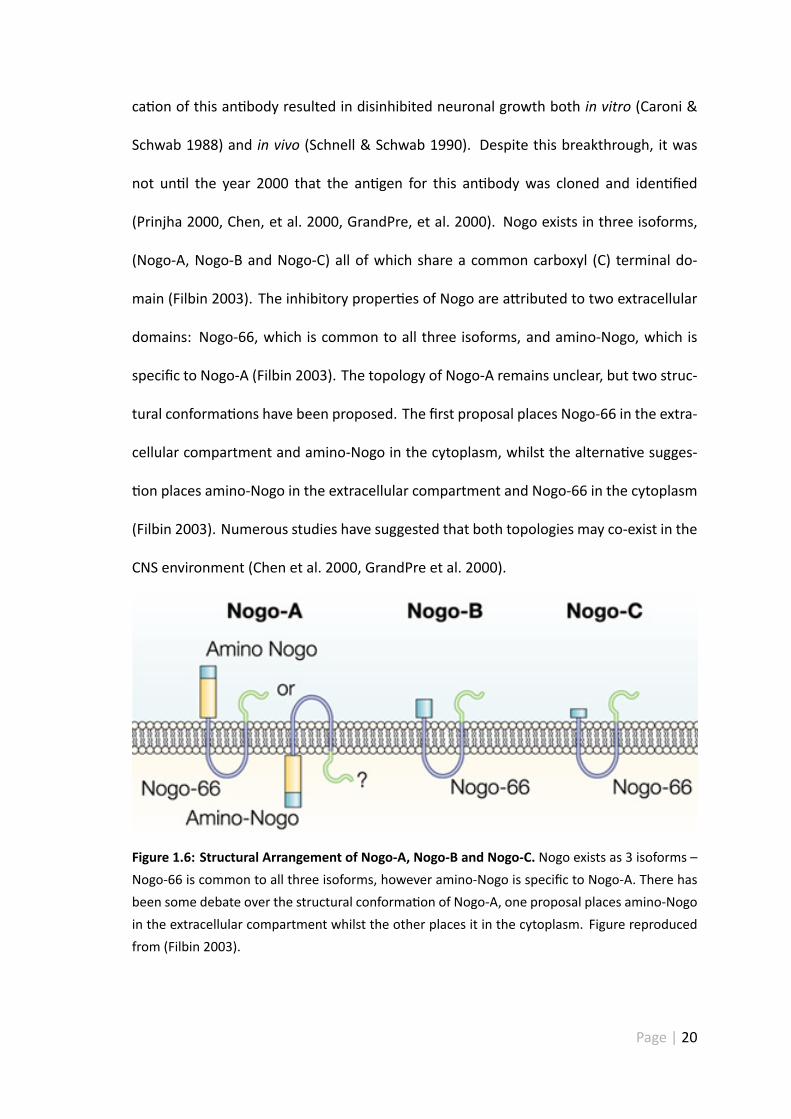
(Prinjha 2000, Chen, et al. 2000, GrandPre, et al. 2000). Nogo exists in three isoforms,
(Nogo-A, Nogo-B and Nogo-C) all of which share a common carboxyl (C) terminal do-
main (Filbin 2003). The inhibitory proper es of Nogo are a ributed to two extracellular
domains: Nogo-66, which is common to all three isoforms, and amino-Nogo, which is
specific to Nogo-A (Filbin 2003). The topology of Nogo-A remains unclear, but two struc-
tural conforma ons have been proposed. The first proposal places Nogo-66 in the extra-
cellular compartment and amino-Nogo in the cytoplasm, whilst the alterna ve sugges-
on places amino-Nogo in the extracellular compartment and Nogo-66 in the cytoplasm
(Filbin 2003). Numerous studies have suggested that both topologies may co-exist in the
CNS environment (Chen et al. 2000, GrandPre et al. 2000).
Figure 1.6: Structural Arrangement of Nogo-A, Nogo-B and Nogo-C. Nogo exists as 3 isoforms –Nogo-66 is common to all three isoforms, however amino-Nogo is specific to Nogo-A. There hasbeen some debate over the structural conforma on of Nogo-A, one proposal places amino-Nogoin the extracellular compartment whilst the other places it in the cytoplasm. Figure reproducedfrom (Filbin 2003).
Page | 20
1.6.0.2 Myelin inhibitory ligand receptors
Nogo-66 Receptors
MAG, Nogo and OMgp all bind to the Nogo-66 receptor (NgR1+2) to elicit their Rho me-
diated biological effects. A member of the LRR superfamily (Fournier, et al. 2001), NgR1
is a glycosyl phospha dylinositol-linked membrane protein which is expressed primar-
ily by neurons of the CNS (Fournier et al. 2001). As this receptor is GPI-linked it does
not possess an intracellular signalling domain and requires a co-receptor to transduce
inhibitory signals. This prompted researchers to iden fy NgR and several co-receptors,
namely: low-affinity p75 neurotrophin receptor (p75NTR), tumour necrosis factor (TNF)
receptor 19 , and LRR and Ig domain containing 1.
p75NTR, Tumour necrosis factor receptor 19 (Troy) and Lingo-1
p75NTR is a glycosylated membrane protein and a member of the TNF receptor super-
family. In addi on to its role as a low affinity neurotrophin receptor, numerous lines of
study have iden fied p75NTR as a co-receptor for NgR1 (Yamashita, et al. 2002, Wong,
et al. 2002). p75NTR was first implicated as an interac ng partner of NgR1 a er neurons
isolated from p75NTR knockout mice only exhibited a limited response to MAG, Nogo and
OMgp treatment (Yamashita et al. 2002, Wang, et al. 2002). This was followed by co-
immunoprecipita on studieswhich revealed that p75NTR formed a receptor complexwith
NgR1 (Wong et al. 2002, Wang et al. 2002). Interes ngly p75NTR is not expressed univer-
sally, being present in only a small subpopula on of neurons (Park, et al. 2005). It may be
Page | 21
that p75NTR has amore prominent role in the developing CNS, as messenger RNA (mRNA)
expression rapidly declines with maturity (Shao, et al. 2005).
In contrast, Troy mRNA is broadly expressed in the mature CNS and may act as the pre-
dominant co-receptor postnatally (Shao et al. 2005). Its func on as an NgR1 co-receptor
was confirmed a er a series of binding and co-immunoprecipita on assays (Shao et al.
2005). COS-7 cells were treated with OMgp, MAG and Nogo a er transfec on with var-
ious combina ons of Troy, NgR1 and leucine rich repeat and Ig domain containing 1
(Lingo-1). Rho ac va on was used as a func onal readout of receptor ac va on (Shao
et al. 2005). They found that only the combina on of Troy, NgR1 and Lingo-1 ac vated
Rho, and concluded that Troy could be used as a subs tute for p75NTR (Shao et al. 2005).
As Troy alone was incapable of transducing the inhibitory signalling, the requirement for
an NgR1 receptor complex was also confirmed (Shao et al. 2005). Neurons isolated from
Troy knockoutmice only exhibited a limited response toMAG, OMgp andNogo, andwere
able to extendneurites overmyelin inhibitory ligand (MIL) coated slides (Shao et al. 2005).
Higher concentra ons were able to inhibit neurite outgrowth, but this was a ributed to
the presence of p75NTR (Shao et al. 2005).
To form a func onal receptor complex with NgR, Lingo-1 is also required. Lingo-1 belongs
to the TNF receptor superfamily and is expressed exclusively by neuronal ssue (Mi, et al.
2004). Lingo-1 has a 12 leucine-rich repeat domain which commences at the N terminus.
This is followed by an Ig and transmembrane domain, as well as a short cytoplasmic tail
(Mi et al. 2004). COS-7 cells transfectedwith NgR1 are able to directly interact with Lingo-
1 fusion proteins (Mi et al. 2004). However, cells transfected with NgR1 and p75NTR were
Page | 22
insensi ve to OMgp treatment. Only cells triple transfectedwith NgR1, p75NTR and Lingo-
1 were capable of ac va ng Rho and transducing the inhibitory signal (Mi et al. 2004).
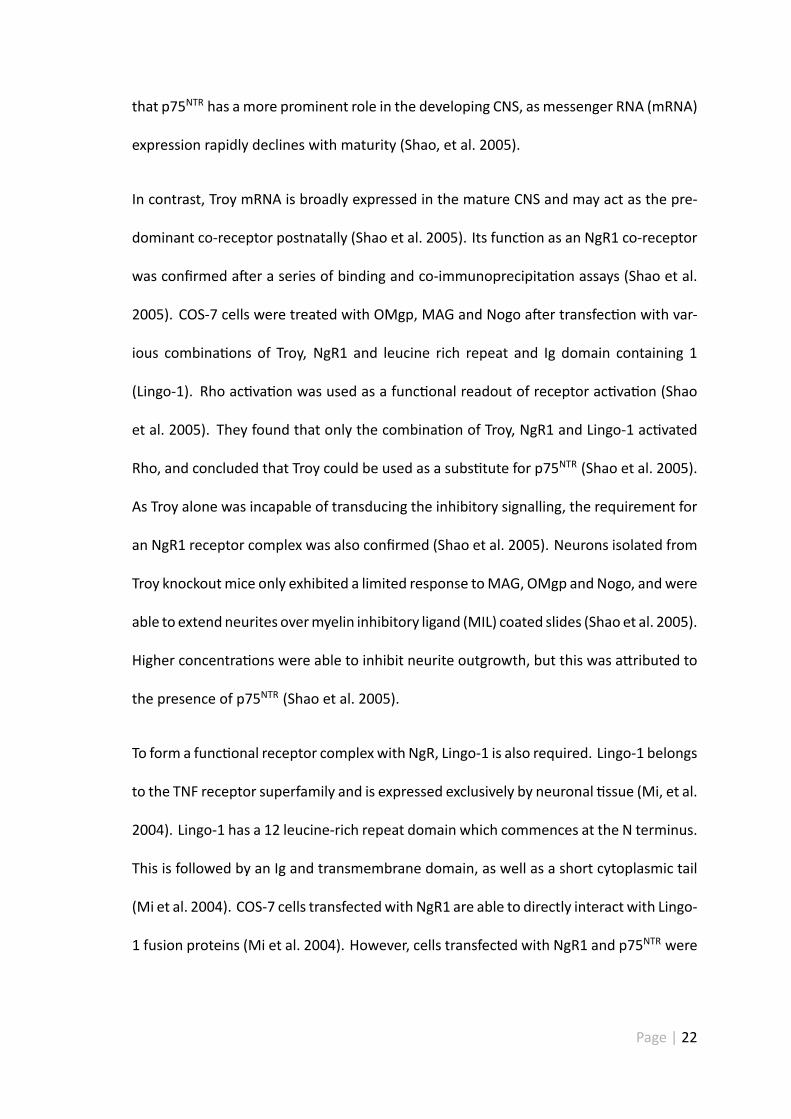
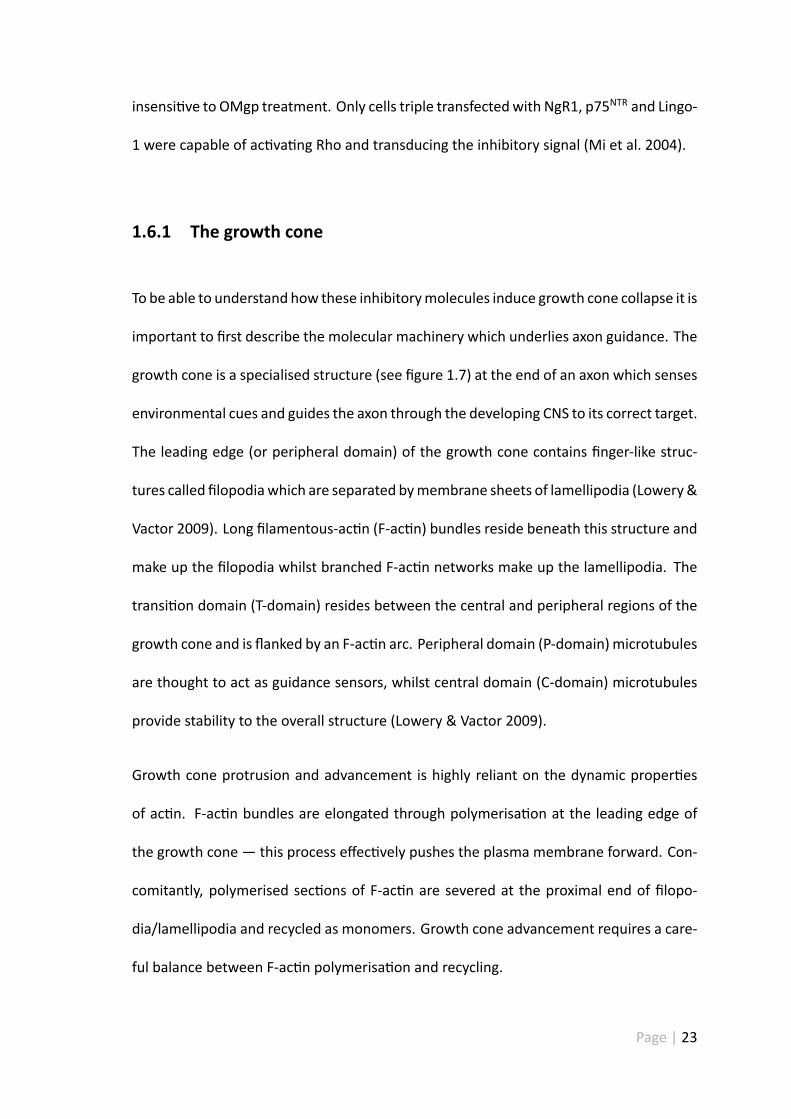
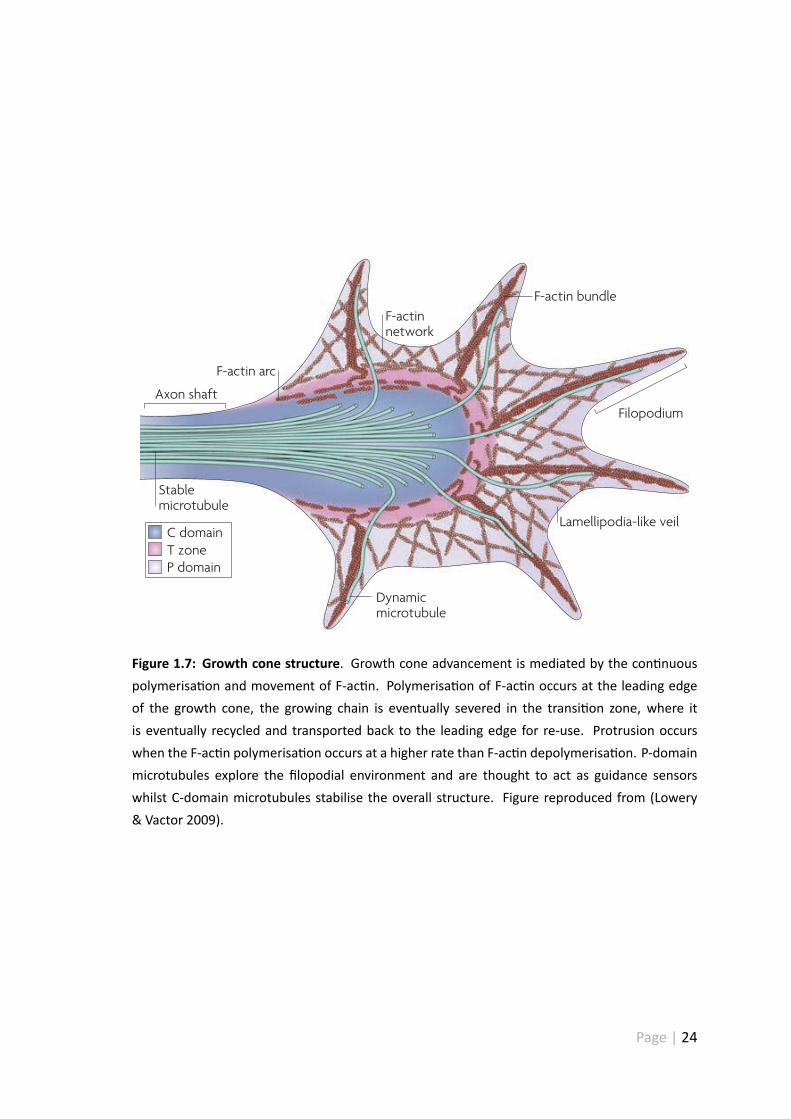
1.6.1 The growth cone
To be able to understand how these inhibitorymolecules induce growth cone collapse it is
important to first describe the molecular machinery which underlies axon guidance. The
growth cone is a specialised structure (see figure 1.7) at the end of an axon which senses
environmental cues and guides the axon through the developing CNS to its correct target.
The leading edge (or peripheral domain) of the growth cone contains finger-like struc-
tures called filopodiawhich are separated bymembrane sheets of lamellipodia (Lowery&
Vactor 2009). Long filamentous-ac n (F-ac n) bundles reside beneath this structure and
make up the filopodia whilst branched F-ac n networks make up the lamellipodia. The
transi on domain (T-domain) resides between the central and peripheral regions of the
growth cone and is flanked by an F-ac n arc. Peripheral domain (P-domain) microtubules
are thought to act as guidance sensors, whilst central domain (C-domain) microtubules
provide stability to the overall structure (Lowery & Vactor 2009).
Growth cone protrusion and advancement is highly reliant on the dynamic proper es
of ac n. F-ac n bundles are elongated through polymerisa on at the leading edge of
the growth cone — this process effec vely pushes the plasma membrane forward. Con-
comitantly, polymerised sec ons of F-ac n are severed at the proximal end of filopo-
dia/lamellipodia and recycled as monomers. Growth cone advancement requires a care-
ful balance between F-ac n polymerisa on and recycling.
Page | 23
F-actin arc
F-actin bundleF-actinnetwork
Lamellipodia-like veil
Filopodium
Dynamicmicrotubule
Stablemicrotubule
Axon shaft
T zoneP domain
C domain
Nature Reviews | Molecular Cell Biology
Actin treadmillingThe process by which the continual addition of actin subunits at the barbed end of an actin polymer and disassembly of the polymer at the pointed end ensures that the polymer stays of constant length, but individual subunits move along.
FilopodiumA thin, transient actin protrusion that extends from the cell surface and is formed by the elongation of bundled actin filaments in its core.
Lamellipodia-like veilA thin, sheet-like extension of cytoplasm between filopodia that is formed by branched actin networks.
F-actin bundleLong actin filaments that are crosslinked together in parallel, forming the core of filopodia.
spatially and to achieve accurate steering. In fact, the steering and drivetrain are intimately connected at a physical level. Therefore, if we are to fully grasp how guidance occurs, it is essential to understand the underlying cytoskeletal mechanisms that propel the vehicle forward and have the potential to be affected asymmetrically.
Turning on the engine: F-actin retrograde flow. Growth cone motility and protrusion of the leading edge mem-brane depend on the dynamic properties of actin (BOX 3). Although actin might not be the only engine that powers axon elongation per se (axons that lack actin poly mer-ization can still move forward, albeit with abnormal growth cone morphology and substratum selectivity)15, actin is a central part of the mechanism that controls growth cone exploration. A combination of filamen-tous (F)-actin treadmilling and F-actin retrograde flow (the continuous movement of F-actin from the leading edge towards the centre of the growth cone) provide the ‘motor’ that keeps the growth cone engine idling (FIG. 2a) and available to drive movement in response to directional cues16. Following increased technological advances in live cell imaging, the past few years have
seen substantial improvements in our molecular under-standing of F-actin retrograde flow and how it relates to growth cone motility and protrusion.
It has been convincingly demonstrated that F-actin ret-rograde flow is driven both by contractility of the motor protein myosin II, which seems to be tethered through protein–protein interactions in the transition (T) zone (the region between the peripheral (P) and central (C) domains of the growth cone), and the ‘push’ from F-actin polymerization in the P domain (the region of the growth cone that includes filopodia and lamellipodia-like veils)17. Myosin II-driven compression across the T zone cir-cumference causes buckling of the F-actin bundles (FIG. 2a), which might be enhanced by pushing from leading edge actin polymerization17. This leads to bundle severing near the proximal ends17 and probably involves actin filament-severing proteins of the actin-depolymerizing factor (ADF)/cofilin family18. A recent paper suggests that myosin II might also actively depolymerize actin fila-ments19. After severing, the actin fragments are recycled into individual actin subunits and are available for trans-port to the periphery for further actin polymerization at the leading edge20 (FIG. 2a).
Engaging the clutch and forming traction to push ahead. How does the growth cone use the actin engine to move forward? Mitchison and Kirschner first proposed the ‘clutch’ hypothesis21, also called the substrate–cytoskeletal coupling model22, which links growth cone protru-sion to actin dynamics16,23. They suggested that growth cone receptor binding to an adhesive substrate leads to the formation of a complex that acts like a mole-cular clutch, mechanically coupling the receptors and F-actin flow, thus anchoring F-actin to prevent retro-grade flow and driving actin-based forward protrusion of the growth cone on the adhesive substrate (FIG. 2a). Indeed, growth cone–substrate adhesions have long been shown to be important for growth cone migra-tion24 and, in fact, the generation of traction also requires myosin II25.
Filopodia, in particular, are considered to be guid-ance sensors at the front line of the growth cone and might have a major role in establishing growth cone–substrate adhesive contacts during environmental explo-ration26. Studies show that filopodia function as points of attachment to the substrate and produce tension that is used for growth cone progression27,28. Whereas earlier studies that blocked filopodia formation using general F-actin inhibitors showed abnormal growth cone steer-ing29,30, a recent study that specifically targeted filopodial F-actin suggests that filopodia are dispensible for accu-rate growth cone guidance but are indeed required for normal growth cone motility31, supporting their role in forming adhesive contacts.
Accumulating evidence in recent years supports the clutch model, in particular in vitro live growth cone imaging experiments that use APCAM, a neural CAM (NCAM) orthologue in Aplysia californica32, a model system with large growth cones that allow the high resolution imaging of their cytoskeletal dynamics33. Following APCAM-mediated growth cone–substrate
Box 1 | The structure of the growth cone
The structure of the growth cone is fundamental to its function. The leading edge consists of dynamic, finger-like filopodia that explore the road ahead, separated by sheets of membrane between the filopodia called lamellipodia-like veils (see the figure). The cytoskeletal elements in the growth cone underlie its shape, and the growth cone can be separated into three domains based on cytoskeletal distribution14. The peripheral (P) domain contains long, bundled actin filaments (F-actin bundles), which form the filopodia, as well as mesh-like branched F-actin networks, which give structure to lamellipodia-like veils. Additionally, individual dynamic ‘pioneer’ microtubules (MTs) explore this region, usually along F-actin bundles. The central (C) domain encloses stable, bundled MTs that enter the growth cone from the axon shaft, in addition to numerous organelles, vesicles and central actin bundles. Finally, the transition (T) zone sits at the interface between the P and C domains, where actomyosin contractile structures (termed actin arcs) lie perpendicular to F-actin bundles and form a hemicircumferential ring33. The dynamics of these cytoskeletal components determine growth cone shape and movement on its journey during development.
REVIEWS
NATURE REVIEWS | MOLECULAR CELL BIOLOGY VOLUME 10 | MAY 2009 | 333
Figure 1.7: Growth cone structure. Growth cone advancement is mediated by the con nuouspolymerisa on and movement of F-ac n. Polymerisa on of F-ac n occurs at the leading edgeof the growth cone, the growing chain is eventually severed in the transi on zone, where itis eventually recycled and transported back to the leading edge for re-use. Protrusion occurswhen the F-ac n polymerisa on occurs at a higher rate than F-ac n depolymerisa on. P-domainmicrotubules explore the filopodial environment and are thought to act as guidance sensorswhilst C-domain microtubules stabilise the overall structure. Figure reproduced from (Lowery& Vactor 2009).
Page | 24
When the rate of F-ac n polymerisa on is higher than that of F-ac n recycling, the lead-
ing edge of the growth cone advances. On the other hand, if the rate of ac n depoly-
merisa on is higher than that of ac n polymerisa on, the leading edge of the growth
cone retracts. However, when F-ac n monomers are polymerised and recycled at the
same rate, protrusion at the leading edge does not occur and the growth cone is said to
be arrested (Lowery & Vactor 2009).
When F-ac n polymerisa on occurs predominantly at the front of the growth cone, the
axon advances in a rela vely straight line. However, if F-ac n depolymerisa on occurs
locally at one side of the growth cone, the axon turns in the opposite direc on.
The last process that will be discussed is growth cone collapse. Importantly, growth cone
retrac on and growth cone collapse are two en rely separate en es. Whilst growth
cone retrac on is characterised by F-ac n depolymerisa on and lamellipodia shortening,
growth cone collapse occurs as a result of lamellipodial disassembly (Gallo & Letourneau
2004). Growth cone collapse o en occurs a er CNS injury, where it encounters a variety
of inhibitory ligands and is mediated by a number of different receptors and signalling
molecules — which is discussed in sec on 1.6.2.
1.6.2 Myelin inhibitory signalling cascade
Rho GTPases are small (≈21 kDa) G proteins which regulate a whole host of cellular pro-
cesses (gene transcrip on, vesicle trafficking, cell morphology and ac n polymerisa on)
(Ellenbroek & Collard 2007). RhoA belongs to this family of proteins and is a key medi-
ator of myelin based inhibi on and growth cone collapse (Yamashita et al. 2002). RhoA
Page | 25
ac vity is regulated by guanine nucleo de exchange factors, GTPase ac va ng proteins
and guanosine diphosphate (GDP) dissocia on inhibitors (GDI). GDP-bound (inac ve) Rho
is sequestered in the cytoplasm by GDI and prevented from interac ng with guanine
nucleo de-exchange factor (GEF) (Ellenbroek& Collard 2007). Upon phosporyla on, Rho
is released from GDI induced inhibi on and allowed to translocate to the plasma mem-
brane where it can interact with GEF (Ellenbroek & Collard 2007). Upon interac on with
GEF, Rho is able to exchange GDP (inac ve) for GTP (ac ve) and interact with a variety
of downstream effectors. GEF induced signalling is terminated by GTPase-ac va ng pro-
tein (GAP) which renders Rho inac ve once more through GTP hydrolysis (Ellenbroek &
Collard 2007). Rho-associated kinase (ROCK), a serine threonine kinase, is a major down-
stream effector of GTP-bound Rho. Ac va on of ROCK and LIM kinase-1 leads to F-ac n
disassembly, inhibi on of lamellipodea extension and growth cone collapse (see figure
1.8 for an overview of inhibitory signalling) (Yang, et al. 1998).
1.6.3 Targe ng the inhibitory signalling cascade
Over the years various strategies have been used to overcome myelin induced growth
cone collapse. The inhibitory signalling cascade can be targeted at mul ple levels and
since all myelin derived ligands signal through a common receptor complex, this is an
obvious place to start. The NgR receptor complex can be targeted through the admin-
istra on of an bodies or pep des to prevent ligand binding and/or receptor interac-
on (Chaudhry & Filbin 2006). However, targe ng the inhibitory signalling pathway at
this level is problema c since there is a degree of func onal redundancy in the system
Page | 26
MAG Nogo OMgp CSPG
NgR Lingo-1
p75 NTFRhoGDI
Rho A
GDP
LIM Kinase
Rho A
GTP
ROCK
GEF
GAP
P
cofilin cofilin
P
Slingshot Phosphatase
Δ Actin dynamicsInhibits lamellipodia
extension
Growth cone Arrest
Δ Actin dynamicsLamellipodia extension
Growth cone Mobility
or Troy
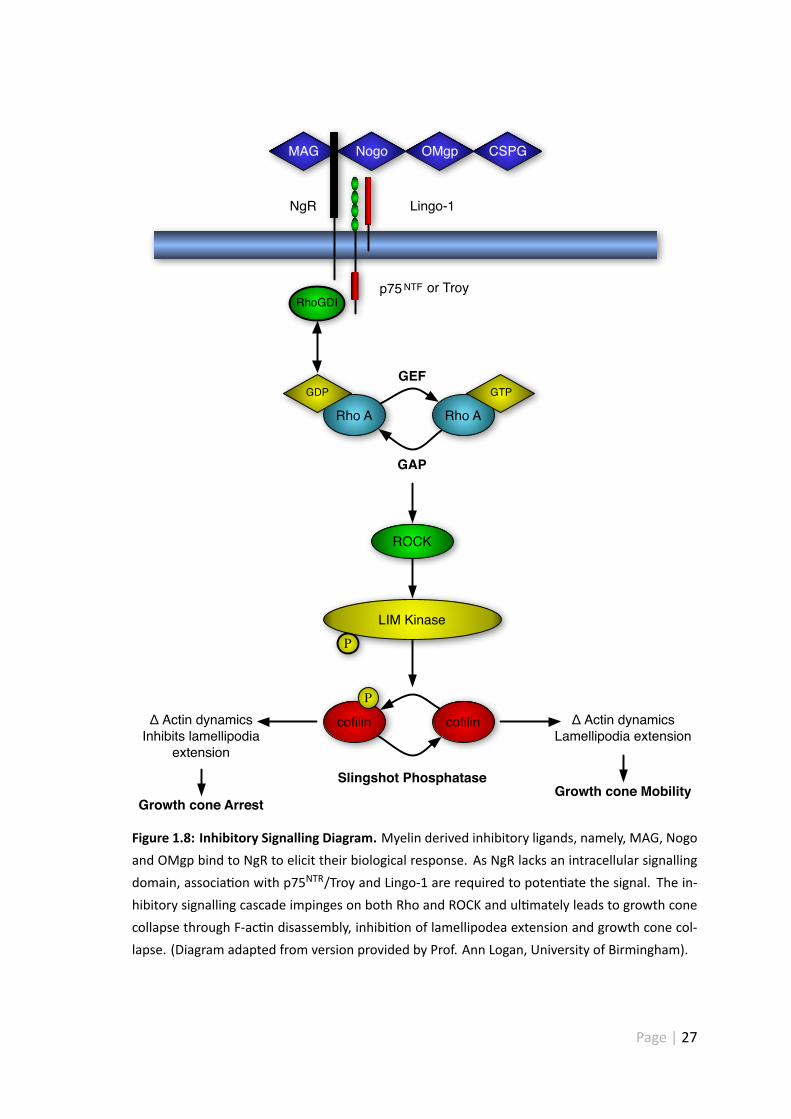
Figure 1.8: Inhibitory Signalling Diagram. Myelin derived inhibitory ligands, namely, MAG, Nogoand OMgp bind to NgR to elicit their biological response. As NgR lacks an intracellular signallingdomain, associa on with p75NTR/Troy and Lingo-1 are required to poten ate the signal. The in-hibitory signalling cascade impinges on both Rho and ROCK and ul mately leads to growth conecollapse through F-ac n disassembly, inhibi on of lamellipodea extension and growth cone col-lapse. (Diagram adapted from version provided by Prof. Ann Logan, University of Birmingham).
Page | 27
(Filbin 2003), meaning targe ngmyelin inhibitory ligands is inefficient; as youwould need
to target mul ple myelin derived elements (Filbin 2003). Furthermore knockdown of any
one of these components may lead to a compensatory increase in protein expression –
this is certainly true in the case of Nogo (Simonen, et al. 2003).
Nogo knockout experiments revealed that when Nogo-A was knocked down there was a
compensatory increase in Nogo-B expression (Simonen et al. 2003). Furthermore the in-
jured CNS environment is also li ered with other inhibitory molecules (e.g. Chondroi n
sulphate proteoglycans (CSPGs), semaphorins) which could induce growth cone collapse
(Berry et al. 2008). Targe ng the NgR receptor complex is also problema c since it as-
sociates with mul ple proteins (Lingo-1, p75NTR/Troy), as a result, it is possible that any
inhibi on (or knockdown) of Troy may result in a compensatory upregula on in p75NTR
(Mandemakers & Barres 2005). It is also possible that NgR has some, as of yet, uniden -
fied interac ng partner which could also transduce the inhibitory signal (Mandemakers
& Barres 2005).
An alterna ve would be to target signalling molecules which lie downstream of the NgR
receptor complex. Since both Rho and ROCK are integral to the inhibitory signalling
pathway their poten al as a therapeu c target has received much a en on (Dergham,
et al. 2002, Lehmann, et al. 1999). For example C3-transferase (a bacterial enzyme de-
rived from Clostridium Botulinum) can be used to specifically inhibit Rho ac vity and
promote significant RGC neurite outgrowth in the presence ofMIL (Lehmann et al. 1999).
It has been shown that C3-transferase suppresses Rho ac vity through ADP-ribosyla on
(the addi on of ADP-ribosemoie es to a protein) of asparagine-41 (Paterson, et al. 1990).
Moreover, treatmentwith the ROCK inhibitor Y-27632 enabled cor cal neurons to extend
Page | 28
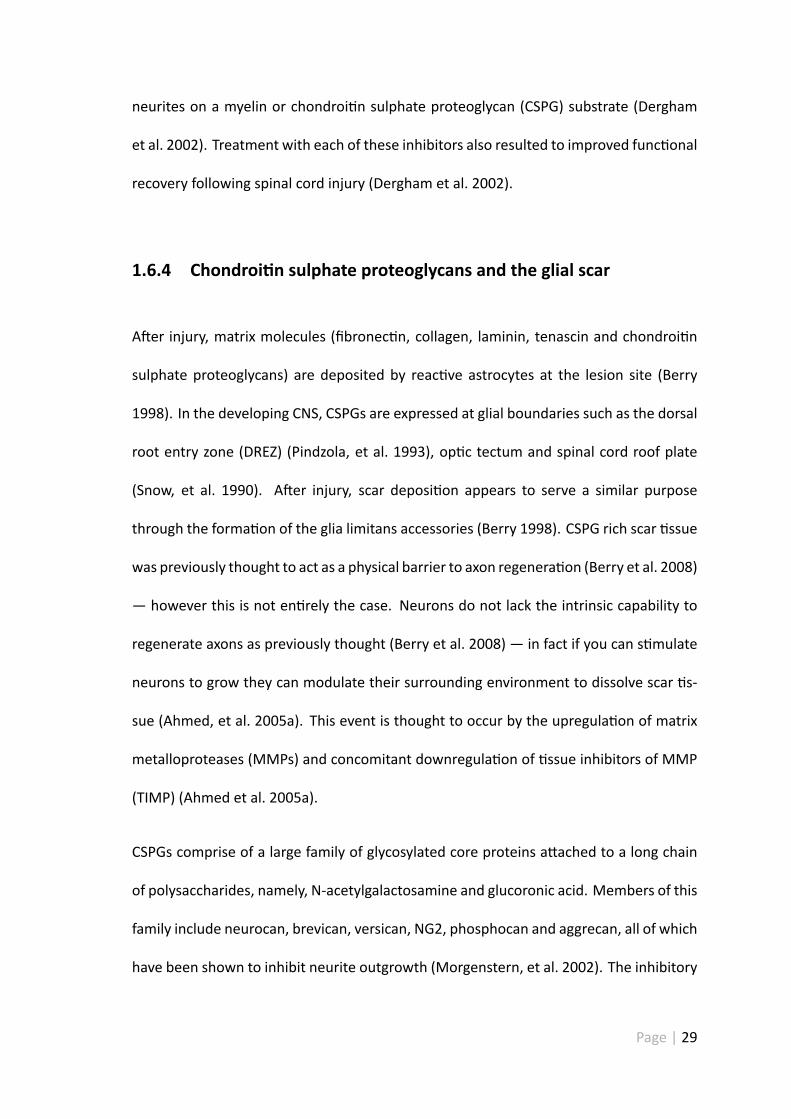
neurites on a myelin or chondroi n sulphate proteoglycan (CSPG) substrate (Dergham
et al. 2002). Treatment with each of these inhibitors also resulted to improved func onal
recovery following spinal cord injury (Dergham et al. 2002).
1.6.4 Chondroi n sulphate proteoglycans and the glial scar
A er injury, matrix molecules (fibronec n, collagen, laminin, tenascin and chondroi n
sulphate proteoglycans) are deposited by reac ve astrocytes at the lesion site (Berry
1998). In the developing CNS, CSPGs are expressed at glial boundaries such as the dorsal
root entry zone (DREZ) (Pindzola, et al. 1993), op c tectum and spinal cord roof plate
(Snow, et al. 1990). A er injury, scar deposi on appears to serve a similar purpose
through the forma on of the glia limitans accessories (Berry 1998). CSPG rich scar ssue
was previously thought to act as a physical barrier to axon regenera on (Berry et al. 2008)
— however this is not en rely the case. Neurons do not lack the intrinsic capability to
regenerate axons as previously thought (Berry et al. 2008) — in fact if you can s mulate
neurons to grow they can modulate their surrounding environment to dissolve scar s-
sue (Ahmed, et al. 2005a). This event is thought to occur by the upregula on of matrix
metalloproteases (MMPs) and concomitant downregula on of ssue inhibitors of MMP
(TIMP) (Ahmed et al. 2005a).
CSPGs comprise of a large family of glycosylated core proteins a ached to a long chain
of polysaccharides, namely, N-acetylgalactosamine and glucoronic acid. Members of this
family include neurocan, brevican, versican, NG2, phosphocan and aggrecan, all of which
have been shown to inhibit neurite outgrowth (Morgenstern, et al. 2002). The inhibitory
Page | 29
proper es of CSPGs are mediated primarily by glycosaminoglycan chain (GAG) chains
and in some instances by their core proteins (e.g. NG2) (Ughrin, et al. 2003). This in-
hibi on can be par ally reversed, and neurite outgrowth promoted in vitro and in vivo
by Chondroi nase ABC treatment (an enzyme which cleaves sugar chains) (Bradbury,
et al. 2002, Houle, et al. 2006). Although the CSPG receptor has recently been iden fied
as PTPσ (a heparin sulphate proteoglycan (HSPG) receptor) (Shen, et al. 2009), its precise
signalling mechanism remains unclear. However, there is some evidence to suggest that
CSPG signalling may exert its ac ons through the Rho inhibitory pathway (see figure 1.8)
(Monnier, et al. 2003). In this study they found that treatment with C3 transferase or
Y-27632 disinhibited RGC neurite outgrowth (Monnier et al. 2003).
1.7 Cell death
A er ON injury, axotomized RGC ini ates a transitory sprou ng reac on, however this
growth ul mately fails (Cajal 1928), leading to RGC death through both apopto c and
necro c mechanisms. During necrosis cells swell and burst, releasing their cellular con-
tents into the surrounding environment – this can lead to a poten ally damaging inflam-
matory responses (Alberts 2002). In contrast, cells undergoing apoptosis die in a regu-
lated way – cells shrink and condense, the cytoskeleton collapses and the nuclear enve-
lope loses structural integrity (Alberts 2002). As a result of this, nuclear deoxyribonucleic
acid (DNA) is exposed to endogenous DNases and RNases and DNA fragmenta on occurs
(Alberts 2002). The apoptosome is then phagocytosed by surrounding cells before any of
the cellular contents can be released into the surrounding environment (Alberts 2002).
Page | 30
This process is regulated by a highly conserved family of proteases known as Caspases
(Cysteine-dependent Aspartate-directed protease). Caspases are ini ally manufactured
as inac ve precursors (pro-caspases) which require cleavage by other caspases to be-
come ac ve (Alberts 2002). Once ac vated these caspases interact with adaptor proteins
to bring about ac va on of ini ator pro-caspases (Alberts 2002).The apopto c signalling
pathways are typically ac vated through either an intrinsic or extrinsic mechanism (see
figure 1.9).
1.7.1 The extrinsic pathway
The extrinsic signalling pathway is typically ac vated by a receptor mediated process.
Upon ligand binding (Fas) death receptors of the of the TNF receptor superfamily aggre-
gate and recruit intracellular adaptor proteins (FADD, NRAGE) (Fulda & Deba n 2006).
These adaptor proteins bind and aggregate pro-caspase 8 molecules, which cleave and
ac vate one another (Alberts 2002). Once ac vated these molecules ini ate apoptosis
through the direct cleavage of downstream effector caspases, such as Caspase-3 (Alberts
2002).
1.7.2 The intrinsic pathway
When a cell is damaged or stressed the intrinsic signalling pathway is ac vated. Stress
signals induce the release of pro-apopto c factors (cytochrome c, apoptosis inducing fac-
tor (AIF) (apoptosis inducing factor), second mitochondria-derived ac vator of caspase
Page | 31
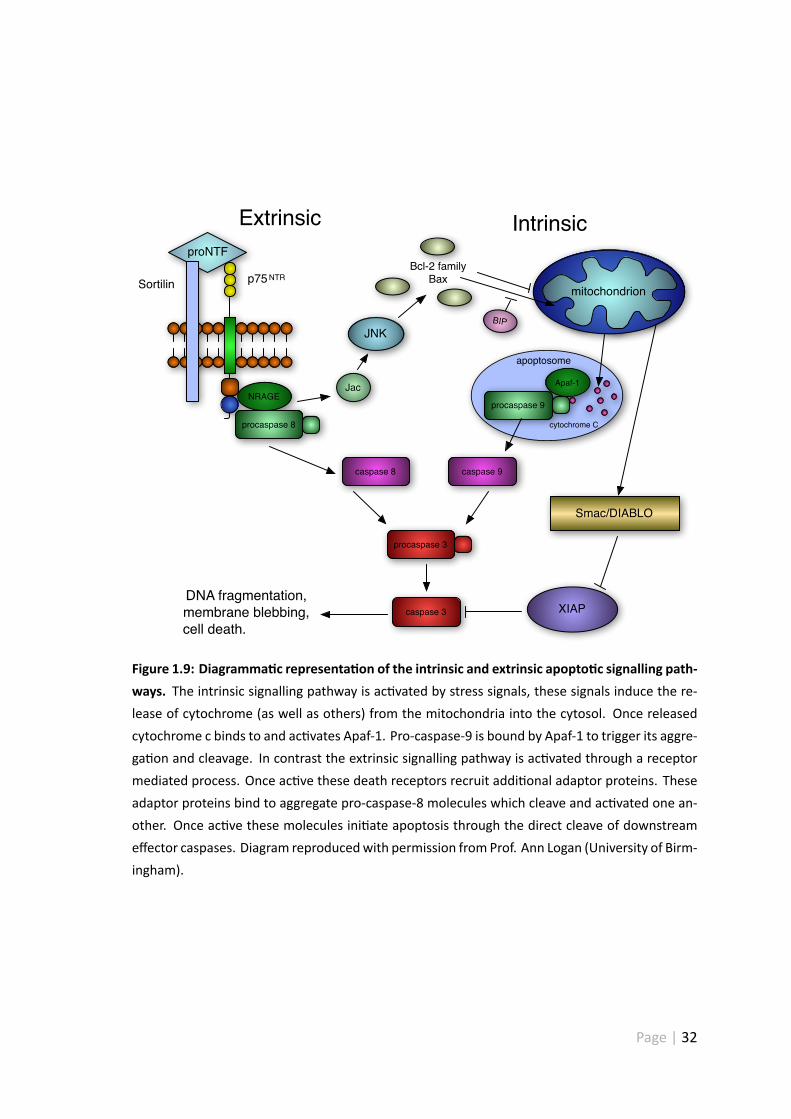
proNTF
NRAGE
procaspase 8
Jac
JNKBIP
Apaf-1
procaspase 9
caspase 8 caspase 9
procaspase 3
caspase 3
Smac/DIABLO
XIAP
apoptosome
cytochrome C
Bcl-2 familyBaxp75 NTRSortilin
Extrinsic Intrinsic
DNA fragmentation,membrane blebbing,cell death.
mitochondrion
Figure 1.9: Diagramma c representa on of the intrinsic and extrinsic apopto c signalling path-ways. The intrinsic signalling pathway is ac vated by stress signals, these signals induce the re-lease of cytochrome (as well as others) from the mitochondria into the cytosol. Once releasedcytochrome c binds to and ac vates Apaf-1. Pro-caspase-9 is bound by Apaf-1 to trigger its aggre-ga on and cleavage. In contrast the extrinsic signalling pathway is ac vated through a receptormediated process. Once ac ve these death receptors recruit addi onal adaptor proteins. Theseadaptor proteins bind to aggregate pro-caspase-8 molecules which cleave and ac vated one an-other. Once ac ve these molecules ini ate apoptosis through the direct cleave of downstreameffector caspases. Diagram reproducedwith permission from Prof. Ann Logan (University of Birm-ingham).
Page | 32
(Smac) (second mitochondria-derived ac vator of caspase)/DIABLO (direct inhibitor of
apoptosis (IAP) binding protein with low PI) or Omi/HtrA2 (high-temperature require-
ment protein A2)) from the mitochondria into the cytosol (Alberts 2002). Once released
cytochrome c binds to and ac vates an adaptor protein called Apaf-1 (Alberts 2002). Pro-
caspase-9 is then bound by Apaf-1, to trigger its aggrega on and cleavage. Smac/DIABLO
and Omi/HtrA2 regulates caspase ac vity through an alterna ve mechanism. Upon mi-
tochondrial release Smac/DIABLO binds to and counteracts the inhibitory effects of IAPs
(Alberts 2002).
1.7.3 Regulators of apoptosis
Apoptosis is regulated, in part, by the Bcl-2 family of proteins (Alberts 2002). This family
contains pro- (e.g. Bax, Bak) and an -apopto c members (e.g. Bcl-2, Bcl-XL), each of
which controls mitochondrial protein release by altering the permeability of the outer
mitochondrial membrane (Alberts 2002). Another level of regula on is performed by
inhibitors of apoptosis, these proteins bind to pro-caspases to prevent their ac va on,
or interact directly with caspases to inhibit their ac vity (Alberts 2002).
1.8 Neurotrophins
Neurotrophins have numerous func ons, both in the developing and mature CNS. They
have roles in cell survival, synaptogenesis, growth cone guidance, synap c plas city, neu-
rotransmi er turnover and differen a on (Tuszynski 2007). Members of this family in-
Page | 33
clude brain derived neurotrophic factor (BDNF) NGF, neurotrophin 3 (NT3), and Neu-
rotrophin 4/5(NT4/NT5) (Tuszynski 2007). Neurotrophins are ini ally synthesized as pro-
proteins (30-35kDa), which are proteoly cally cleaved by convertases (convertase 1 and
2) to produce mature proteins (12-13kDa)which exist as non-covalently bound homod-
imers (Tuszynski 2007).
1.8.1 Neurotrophin receptors
tropomyosin receptor kinase (Trk) receptors are type I transmembrane proteinswhich are
members of the receptor tyrosine kinase superfamily. Each neurotrophin binds with high
affinity to their respec ve tropomyosin-related kinase receptor – NGF to tropomyosin re-
ceptor kinase A (TrkA), BDNF and NT4/NT5 to tropomyosin receptor kinase B (TrkB), and
NT3 to tropomyosin receptor kinase C (TrkC) (Tuszynski 2007). Binding of neurotrophins
to their corresponding Trk receptors causes receptor dimerisa on and autophosphory-
la on of tyrosine residues within the ac va on loop, which leads to the phosphoryla-
on of seven addi onal tyrosine residues (Roux & Barker 2002). These phosphotyrosine
residues act as docking sites for SH2 containing secondarymessengerswhich regulate cell
growth and survival through Ras/MAPK, phospholipase C (PLC) and phospha dylinositol
3-kinase / Akt signalling pathways.
As previously discussed in sec on 1.6.0.2, p75NTF is not solely a co-receptor for NgR1 and
also plays an important role in neurotrophin signalling. In fact all neurotrophins (NGF,
BDNF, and NT4/NT5) bind to p75NTF with almost equal affinity. Although p75NTF has
been shown to bind to all neurotrophins with low affinity, its' exact func on has been
Page | 34
the subject of much debate. There is substan al evidence to suggest that p75NTF en-
hances the responsiveness of Trk receptors to their corresponding ligands (Hantzopoulos
& Suri 1994). For example Yancopoulus et al found that a truncated form of p75NTF sig-
nificantly enhanced the ability of each of the Trks to respond to their cognate receptors
(Hantzopoulos & Suri 1994). p75NTF may play a role in neuronal apoptosis, since neu-
rotrophin pro-proteins are not have been found to bind to p75NTF with high affinity to
ini ate apoptosis (Volosin, et al. 2008).
1.8.2 p75NTF and apoptosis
The first indica on that p75NTF had a role in inducing apoptosis came from the work of
Rabizadeh et al. A selec on of neuronal cell lines (CSM 14.1 and R2) were transfected
with p75NTF and cultured in serum free or serum supplemented media. Cells which were
cultured in serum free media had an increased rate of apopto c cell death, however
when these cells were cultured in serum supplementedmedia there was no effect on cell
death. WhenNGFwas added to the serumdeprived cells the nega ve effect of the p75NTF
transfected cells was abolished (Rabizadeh, et al. 1993). A similar effect was achieved by
trea ng these cells with amonoclonal an body targeted against p75NTF. Since neither the
R2 nor CSM 14.1 cell lines endogenously expressed detectable levels of TrkA or p75NTF,
the apopto c effect was thought to be mediated by the p75NTF receptor (Rabizadeh et al.
1993).
Page | 35
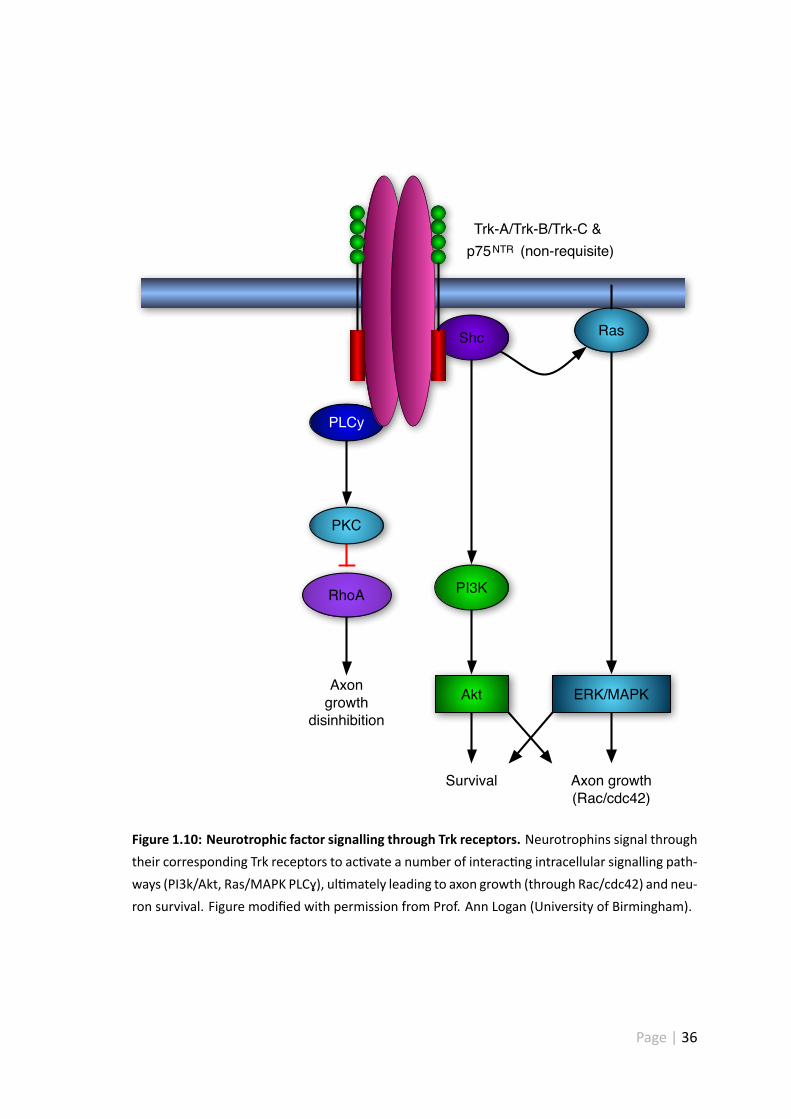
PLCy
Shc
PI3K
Ras
ERK/MAPKAkt
RhoA
Trk-A/Trk-B/Trk-C &p75NTR (non-requisite)
PKC
Axongrowth
disinhibition
Survival Axon growth(Rac/cdc42)
Figure 1.10: Neurotrophic factor signalling through Trk receptors. Neurotrophins signal throughtheir corresponding Trk receptors to ac vate a number of interac ng intracellular signalling path-ways (PI3k/Akt, Ras/MAPK PLCɣ), ul mately leading to axon growth (through Rac/cdc42) and neu-ron survival. Figure modified with permission from Prof. Ann Logan (University of Birmingham).
Page | 36
1.8.3 Neurotrophin signalling pathways
1.8.3.1 Ras/MAPK signalling
Ras is a 21 kDa small GTPase which essen ally acts as a molecular switch for a whole host
of cellular processes (e.g. cell growth, differen a on, cytoskeletal organisa on, mem-
brane trafficking and apoptosis) (Huang & Reichardt 2003). Its role as a mediator of neu-
rotrophin signalling was ini ally iden fied in 1986 (Huang & Reichardt 2003). An bodies
raised against Ras were micro-injected into PC12 cells, this resulted in neurite inhibi on
and par al reversal of neurite outgrowth following NGF treatment (Hagag, et al. 1986).
Ras signalling is typically ini ated through the ac va on of cell surface receptor tyrosine
kinases (e.g. Trk receptors) (Ray 2009). Ligand binding induces receptor dimeriza on
and autophosphoryla on of three sites in the intracellular domain. SH2 containing pro-
tein (SHC) is phosphorylated at one of these sites, crea ng a binding site for growth fac-
tor receptor binding protein 2 (Grb2) (Huang & Reichardt 2003). This in turn interacts
with son of sevenless (SOS) to ac vate Ras through the exchange of GDP for GTP (Huang
& Reichardt 2003). Ras ac va on s mulates transloca on of Raf (a 68 kDa to 72 kDa
cytosolic protein) to the cell membrane where it can ac vate map kinase kinase (MEK)
(Huang & Reichardt 2003). MEK then phosphorylates mitogen-ac vated protein kinase
(MAPK) (ERK1 and ERK2) which translocates to the nucleus to ac vate a variety of tran-
scrip on factors (e.g. c-Fos, Jun, ac vator protein-1 (AP-1), cAMP responsive binding ele-
ment binding protein (CREB), c-myc, and signal transducers and ac vators of transcrip on
1 (STAT1) / 3 (STAT1/STAT3) which modulate gene expression (Huang & Reichardt 2003).
Page | 37
1.8.3.2 Phospholipase C
PLC is recruited to an alterna ve site of the intracellular domain a er TrK receptor phos-
phoryla on (Huang&Reichardt 2003). PLC catalyzes the forma onof inositol-trisphosphate
anddiaglycerol (DAG) through the cleavageof phospha dylinositol-4,5-bisphosphate (PIP2)
(Huang&Reichardt 2003). DAGac vates protein kinase C (PKC)whilst inosital-trisphosphate
(IP3) induces the release of calcium from intracellular stores (Huang & Reichardt 2003).
Cytosolic calcium can then go on to s mulate a variety of downstream enzymes (e.g ac-
va on of calmodulin-dependent protein kinases), whilst PKC can ac vate the Erk-1 sig-
nalling pathway (Huang & Reichardt 2003).
1.8.3.3 PI3K/Akt signalling
Phosphoinosi de 3-kinases (PI3K) are a family of highly conserved lipid kinases that phos-
phorylate the 3’hydroxyl (3’-OH) group of phospha dylinosi des. Class 1 PI3Ks are het-
erodimeric molecules which contain a regulatory (p85) and a cataly c (p110) subunit
(Vanhaesebroeck & Guillermet-Guibert 2010).
This class of PI3Ks can be further subdivided into class 1A and class 1B. Class 1A PI3Ks
are typically ac vated by growth factors and their associated receptors (e.g. Trk recep-
tors) whilst class IB PI3Ks are usually ac vated by G protein coupled receptors (GPCR)
(Vanhaesebroeck & Guillermet-Guibert 2010).
Page | 38
PI3K/Akt signalling pathway
Trk receptor ac va on leads to receptor autophosphoryla on of tyrosine residues and
subsequent recruitment of PI3K to the plasmamembrane. The regulatory subunit of PI3K
interacts with the receptor through its SH2 containing domains leading to subsequent
ac va on of its cataly c subunit (Vanhaesebroeck & Guillermet-Guibert 2010). This ul -
mately leads to the genera on of phosphoinositol-3, 4, 5-triphosphate (PtdIns(3,4,5)P3)
and PtdIns-3,4-bisphosphate (PtdIns-(3,4)P2) at the inner side of the cell membrane. Akt
is then recruited to the cell membrane where it is phosphorylated by PDK1 and PDk2
(Vanhaesebroeck & Guillermet-Guibert 2010). Akt then translocates to the cell nucleus
where it can interact with a variety of transcrip on factors to bring about changes in gene
expression to influence a whole host of cellular processes (e.g. cell prolifera on, growth
and survival).
1.9 Cilliary neurotrophic factor
CNTF is a 22 kDa cytosolic protein which belongs to the interleukin-6 family of cytokines.
This family consists of interleukin-6 (IL-6) together with leukemia inhibitory factor (LIF),
interleukin-11 (IL-11), oncosta nM (OSM) and cardiotrophin-1 (CT-1) (Du a, et al. 2007).
Some more recent members include cardiotrophin like cytokine (CLC) and neuropoie n
(NP) (Rousseau, et al. 2008).
CNTF has a ter ary structure which is similar to that of other cytokines and consists of a
four alpha helix bundle (Inoue, et al. 1996). CNTF does not possess a classical secretory
Page | 39
signal sequence and it's unclear how the protein is released from cells. One poten al ex-
plana on is that it is released from cells (e.g. astrocytes) through an induced mechanism
(Sleeman, et al. 2000).
CNTFwas first described as a proteinwhich could enhance chick cilliary ganglionic neuron
survival in vitro (Adler, et al. 1979). Further research has revealed that CNTF has a much
broader effect and is capable of promo ng sensory, motor, cerebral and hippocampal
neuron survival (cited in (Sleeman et al. 2000)).
In the re na, CNTF is endogenously expressed by astrocytes and Müller glia while it's
corresponding receptor, CNTFRα, can be found on RGC, horizontal cells and a subpopu-
la on of amacrine cells (Adel, et al. 2005). It is generally believed that CNTF is an injury
inducible factor which is released by glia, in response to trauma or cellular stress, to pro-
tect neurons from cell death (Adler 1993). Several lines of evidence indicate that this
is the case. A er injury, endogenous levels of CNTF, CNTFR α and leukemia inhibitory
factor receptor β (LIFRβ) are substan ally elevated (Adel et al. 2005). This compensatory
up regula on of CNTF, CNTFR α and LIFRβ may be in place to enhance neuronal survival
through JAK-STAT signalling and/or other neuroprotec ve signalling pathways e.g. MAPK
and PI3K . Exogenous applica on of CNTF at this point may further enhance RGC survival,
since more receptors are available for protein binding and propaga on of the extracellu-
lar signal (Adel et al. 2005).
CNTF mediated ac va on of these pathways may also protect RGC from glutamate in-
duced excitotoxic damage through modifica on and/or downregula on of glutamate re-
ceptors (Petersén & Brundin 1999). This is important since excitotoxic damage has been
Page | 40
shown to be a major contributor of RGC cell death a er axotomy (cited in (Adel et al.
2005)).
Alterna vely, CNTF may protect neurons from injury through an indirect mechanism, for
example, CNTF release from glia can be s mulated through the applica on of exoge-
nous protein (Adel et al. 2005). Several studies shown that exogenous CNTF can directly
ac vate glia (Müller glia, astrocytes) to bring about changes in gene expression via the
Ras-MAPK and JAK-STAT signalling pathways (Adel et al. 2005).
Intravitreal injec on of CNTF has a neuroprotec ve effect a er ON transec on and —
a er mul ple injec ons — promotes RGC axon regenera on through both the ON and a
PN gra (Cui & Harvey 2000, Cui, et al. 2003). Long term CNTF gene expression has also
been demonstrated using Adenoviral vectors. In 2000, Weise et al found that intravitreal
injec on of Ad-CNTF rescued approximately 31% of RGC from cell death 14 d a er op c
nerve crush (ONC) injury (Weise, et al. 2000). Interes ngly, Ad-CNTF was more effec ve
at rescuing RGC from cell death when Ad-CNTF was applied to the severed end of the
transected ON – this resulted in a 41% increase in RGC survival. Although Ad-CNTF pro-
moted significant RGC survival, axon regenera on was not evident(Weise et al. 2000).
Len viral and AAV2 vectors have also been used to deliver CNTF to the visual system –
this ul mately resulted in RGC survival and axonal regenera on (Leaver, et al. 2006b, van
Adel, et al. 2003, Leaver, et al. 2006a).
Page | 41
1.9.1 CNTF Receptor Complex
CNTF binds to a tripar te receptor complex to elicit its biological effects. Ini ally it binds
to the GPI-linked CNTFɑ receptor (CNTFRɑ), which in turn associates with gp130 and LIF
receptor β to form a tripar te receptor complex (Tuszynski 2007). Ligand binding ul -
mately leads to ac va on of the JAK-STAT, PI3-Akt and Ras-MAPK signalling pathways
(see figure 1.10).
1.9.2 The JAK-STAT signalling pathway
The JAK-STAT signalling pathway can be ac vated by a variety of cytokines (IL-6, IL-11,
CNTF) and growth factors. Cytokines such as CNTF, IL-6, IL-11, bind to their respec ve
receptors (CNTFRɑ, IL-6Rɑ, IL-11Rɑ) which s mulates associa on with co-receptors such
as gp130 and LIF to form a tripar te receptor complex (Tuszynski 2007). Receptor ac va-
on leads to tyrosine phosphoryla on of Janus kinase – the ac vated receptor complex
provides docking sites for SH2 containing signalling molecules such as signal-transducer
and ac vator of transcrip on (STAT) (Signal Transducer and Ac vator of Transcrip on)
and Grb2 (Tuszynski 2007) (to ac vate the JAK-STAT and Ras/MAPK signalling pathways
respec vely). Once docked STAT proteins are phosphorylated by JAKS and undergo a
process of homo- or heterodimerisa on (Aaronson & Horvath 2002). At which point
STAT dimers translocate to the nucleus and interact with specific DNA sequences to bring
about changes in gene expression (Tuszynski 2007, Aaronson & Horvath 2002). CNTF
signalling through this receptor complex has also been shown to ac vate the PI3k/AKt,
Ras/MAPKand PLCɣ signalling pathways (Boulton, et al. 1994). The JAK-STAT signalling
Page | 42
pathway can interact with a variety of different signalling pathways. Cross-talk between
these signalling pathways is complex and can occur at mul ple points throughout the
JAK-STAT signalling cascade.
1.10 Non-viral mediated gene transfer
1.10.1 Naked DNA
Delivering naked, unpackaged plasmid DNA to the visual system is extremely inefficient.
The ability to transfect mammalian cells using naked, unpackaged plasmid DNA is ex-
tremely limited. Naked DNA is unable to cross biological membranes (e.g. plasma, en-
dothelium and nuclear membranes) -this is thought to be a result of the repulsive forces
generated between the nega vely charged cell surface and the naked DNA (Niidome &
Huang 2002). Another contribu ng factor to their poor efficacy is that endonucleases
present within the extracellular space can rapidly degrade naked, unpackaged DNA ren-
dering them ineffec ve (Niidome & Huang 2002). Several techniques have been devel-
oped to tackle the problem of poor DNA uptake.
1.10.2 Electropora on and shotgun gene delivery
Electropora on is a techniquewhich is commonly used in vitro to facilitate DNA uptake—
it has also been used in vivo with varying degrees of success. An electric pulse is applied
Page | 43
to temporarily permeabilise the cell membrane and overcome the repulsive forces by
driving the nega vely charged DNA into the cell (Vry, et al. 2010).
In vivo delivery is achievedwhen the electric field is applied directly a er a bolus injec on
of DNA. The effec veness of this techniquewas first demonstrated in vivo by Titomirov et
al. In this study electropora on was successfully used to deliver plasmid DNA (containing
a neomycin resistant casse e) into the skin of newborn mice (Titomirov, et al. 1991).
Since then electropora on has been extensively used as a method of gene transfer. Its
usefulness has also been demonstrated in the eye to transduce RGC (Mo & Yokoyama
2002), pigmented epithelial cells (RPE cells) and the cornea (Mo& Yokoyama 2002). Re -
nal transduc on was achieved by placing a hemisphere cathode on the cornea and a
hemisphere anode around the ON. This technique was used to successfully transduce
RGC with a plasmid encoding BDNF a er an intravitreal injec on, and rescued ≈38.7% of
RGC from cell death 6 weeks a er ON transec on. Despite this promising outcome, this
technique has a number of limita ons (Mo & Yokoyama 2002).
One of the limita ons of electropora on is that the electric pulse needs to be carefully
calibrated to ensure that the pulse is strong enough to temporarily permeabilise the cell
membrane, but not so strong that it causes irreversible cell damage (Niidome & Huang
2002). It is also very difficult to target specific cell types since electropora on increases
the permeabilisa on of all cell membranes. As a result, electropora on doesn't seem to
be a very translatable technique in terms of delivery therapeu cs to pa ents.
Gene gun can be used as an alterna ve to electropora on. Gold par cles are coated
with DNA and shot into the ssue or cell of interest. As a result DNA penetrates the
Page | 44
cell membrane and is transported directly into the cell cytoplasm or nucleus (Niidome
& Huang 2002). One of the limi ng factors of this technique is that the level of ssue
penetra on is o en poor (Niidome & Huang 2002).
1.10.3 Ca onic polymers
Ca onic polymers are o en used to increase the transduc on efficiency of non-viral me-
diated gene transfer. Some ca onic polymers (e.g. poly-L-lysine) form linear chains,
whilst others have a highly branched structure (e.g. poly (ethyleneimine), fractured den-
drimers) (Smedt & Demeester 2000). Ca onic polymers are able to accommodate larger
genes (Smedt & Demeester 2000). In the presence of ca onic polymers and mul valent
ca ons, plasmid DNA condenses to occupy a much smaller space (Smedt & Demeester
2000). This process is thought to protects DNA from degrada on by extracellular nucle-
ases and prolongs their half-life (Bielinska & Kukowska-Latallo 1997).
1.11 Viral mediated gene transfer
A variety of viral vectors have been tested for their ability to transfect RGC of the visual
system. To be an effec ve therapeu c, the viral vector needs to be able to transduce
postmito c cells without elici ng a harmful immune response. This can be accomplished
directly through the transduc on of RGC or indirectly through the transduc on of other
re nal cell types. One of the main advantages of using a viral mediated gene transfer
Page | 45
strategy is that long term transgene expression can be achieved from a single injec on of
virus.
1.11.1 Adenoviruses
Adenoviruses (Ad) are polyhedral, non-enveloped viruseswhich contain a double-stranded
DNA genome (Harvey, et al. 2006). Although Ad infec on has been linked to a number
of human diseases (Chanock 1974), Adenoviral vectors have become a popular choice
for delivering therapeu c genes to the visual system. Ad exhibit a high degree of cellular
tropism, in fact over 50 types of Ad has been iden fied in recent years.
One of the advantages of using Ad as a viral vector is that it is able to transduce both
dividing and non-dividing cells – as a result both neuronal and glial cell popula ons can
be targeted using this kind of viral vector (Harvey et al. 2006). Moreover infec on can
be achieved without incorpora on of viral DNA into the host cells genome reducing the
likelihood of causing random oncogenic events. Ads can also accommodate much larger
inserts (≈8 kb), making it possible to deliver a wider range of therapeu c transgenes
(Harvey et al. 2006).
Another important factor to consider when developing therapeu c gene vectors is the
ease of produc on and purifica on. In the case of Ad this does not appear to be a prob-
lem, as high viral tres can be achieved through well established manufacturing tech-
niques (Harvey et al. 2006).
Page | 46
Although the onset of gene expression is rapid, transgene expression is o en short-lived
and is rapidly cleared by the immune system (Isenmann, et al. 2001). As a result, ade-
noviral vectors are not typically suitable for long term therapeu c regimes and may be
more suitable for short term use. Another important factor to consider is the impact of
using such an immunogenic viral vector, as this may cause harmful adverse effects. To
overcome this problem, several groups have developed ways to evade the immune re-
sponse e.g. by encapsula ng viral par cles in polymers (Fasbender & Zabner 1997) or
gold par cles (Sims, et al. 2009).
1.11.2 Len viruses
Like other retroviruses, len virus (LV) has an RNA genome that is surrounded by core
proteins and a lipid envelope (Verma & Weitzman 2005). Once the vector is taken up
by the cell the RNA strand is reverse transcribed and incorporated randomly into the
host genome (Verma & Weitzman 2005). As a result the transgene can be inherited
by the cells progeny allowing long term gene expression to occur in dividing cells (e.g.
glia) without the need for repeat administra on (Davidson & Breakefield 2003). In ad-
di on to this, Len viral vectors can transduce non-dividing cells making it possible to
also transduce neuronal cell popula ons. Although random integra on is advantageous
in some respects (see above) it can also increase the likelihood of gene inac va on or
oncogene ac va on. LV has similar packaging capabili es to that of Ad and can accom-
modate an insert of approximately 8 kb (Davidson & Breakefield 2003). Furthermore LV
does not typically induce a significant immune response (Davidson & Breakefield 2003).
Page | 47
A number of len viral variants are currently available for use as therapeu c vectors in-
cluding the human immunodeficiency virus (HIV), equine infec ous anaemia virus (ELAV),
simian immunodeficiency virus (SIV) and feline immunodeficiency virus (FIV) (Verma &
Weitzman 2005).
1.12 Structure of wild type adeno-associated virus
Wild type adeno-associated virus (AAV)was ini ally iden fied as a contaminant of adeno-
virus prepara ons (Atchison, et al. 1965). Wild type AAV has a single stranded DNA
genome consis ng of ≈4700 bases which is flanked by iden cal 145base inverted ter-
minal repeats (ITR) (Vasileva & Jessberger 2005). Wild type AAV contains REP and CAP
genes which are responsible for replica ng and packaging viral DNA and producing the
capsid proteins needed for successful infec on (Vasileva & Jessberger 2005). The virus
can enter either a ly c (see sec on 1.13) or lysogenic (see sec on 1.14) pathway a er
host cell infec on.
1.13 The ly c pathway
The ly c pathway occurs when the virus infects a cell in the presence of a helper virus
such as Ad or herpes simplex virus (HSV). The virus enters the cell via a receptor medi-
ated process (e.g. HSPG or laminin receptor), replicates and packages its viral genome
Page | 48
(Vasileva & Jessberger 2005). The host cell then undergoes helper virus induced cell lysis
followed by the release of infec ve virion par cles (Vasileva & Jessberger 2005).
1.14 The lysogenic pathway
The virus enters the lysogenic pathway when the virus infects the cell in the absence
of a helper virus. If this occurs gene expression is repressed and the AAV integrates its
genome into the host cell at chromosome 19 (Vasileva & Jessberger 2005). The viral DNA
remains there latently un l a helper virus comes along. If a latently infected cell is then
infected with a helper virus, viral gene expression is ac vated, viral DNA is excised from
the chromosome and the cell enters the ly c pathway (Vasileva & Jessberger 2005) (see
sec on 1.13).
Page | 49
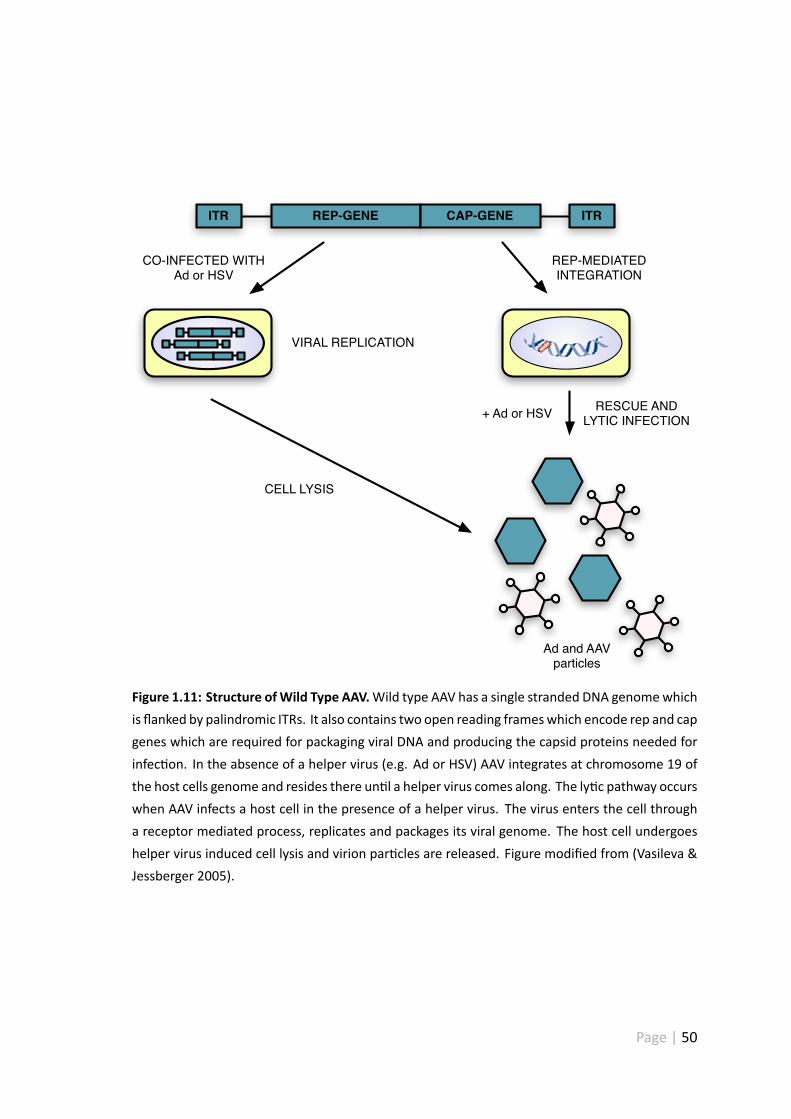
ITR REP-GENE CAP-GENE ITR
CO-INFECTED WITHAd or HSV
VIRAL REPLICATION
CELL LYSIS
Ad and AAVparticles
+ Ad or HSV RESCUE ANDLYTIC INFECTION
REP-MEDIATEDINTEGRATION
Figure 1.11: Structure ofWild Type AAV.Wild type AAV has a single stranded DNA genomewhichis flanked by palindromic ITRs. It also contains two open reading frameswhich encode rep and capgenes which are required for packaging viral DNA and producing the capsid proteins needed forinfec on. In the absence of a helper virus (e.g. Ad or HSV) AAV integrates at chromosome 19 ofthe host cells genome and resides there un l a helper virus comes along. The ly c pathway occurswhen AAV infects a host cell in the presence of a helper virus. The virus enters the cell througha receptor mediated process, replicates and packages its viral genome. The host cell undergoeshelper virus induced cell lysis and virion par cles are released. Figure modified from (Vasileva &Jessberger 2005).
Page | 50
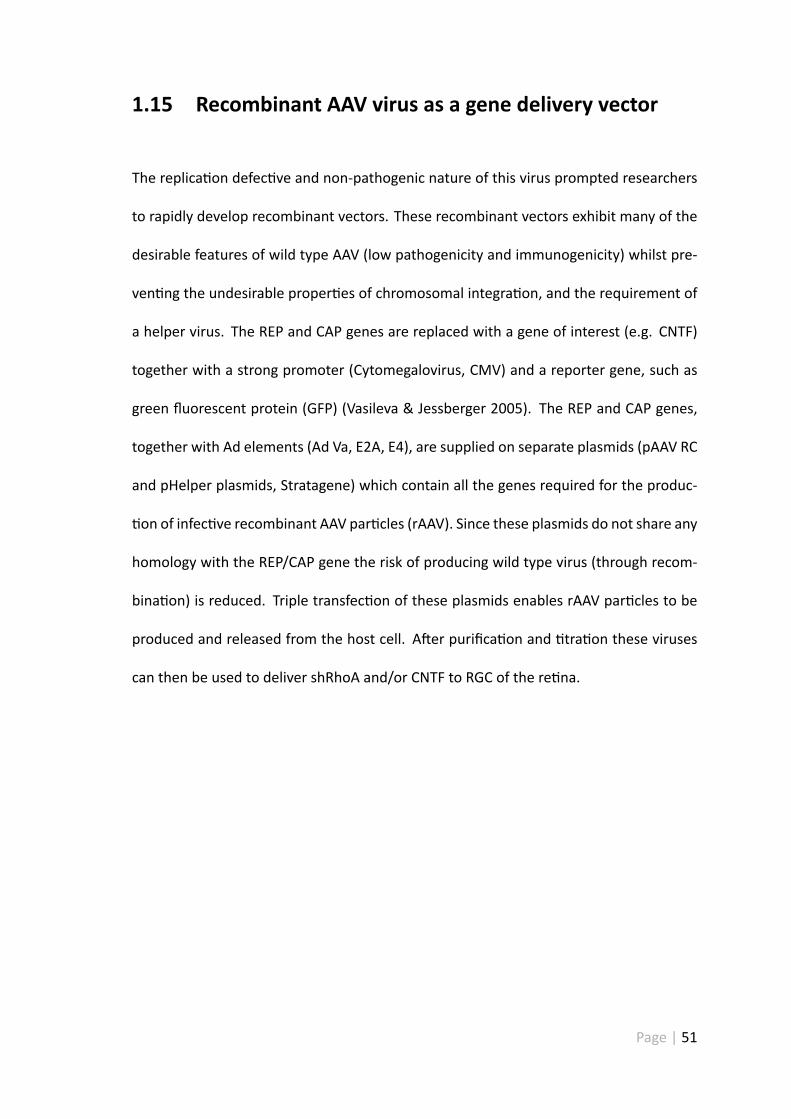
1.15 Recombinant AAV virus as a gene delivery vector
The replica on defec ve and non-pathogenic nature of this virus prompted researchers
to rapidly develop recombinant vectors. These recombinant vectors exhibit many of the
desirable features of wild type AAV (low pathogenicity and immunogenicity) whilst pre-
ven ng the undesirable proper es of chromosomal integra on, and the requirement of
a helper virus. The REP and CAP genes are replaced with a gene of interest (e.g. CNTF)
together with a strong promoter (Cytomegalovirus, CMV) and a reporter gene, such as
green fluorescent protein (GFP) (Vasileva & Jessberger 2005). The REP and CAP genes,
together with Ad elements (Ad Va, E2A, E4), are supplied on separate plasmids (pAAV RC
and pHelper plasmids, Stratagene) which contain all the genes required for the produc-
on of infec ve recombinant AAV par cles (rAAV). Since these plasmids do not share any
homology with the REP/CAP gene the risk of producing wild type virus (through recom-
bina on) is reduced. Triple transfec on of these plasmids enables rAAV par cles to be
produced and released from the host cell. A er purifica on and tra on these viruses
can then be used to deliver shRhoA and/or CNTF to RGC of the re na.
Page | 51
Co-infection withE2A, E4 and VA RNA genes (pHelper plasmid)E1 gene (host cells)REP/CAP genes (pAAVRC)
VECTOR PRODUCTIONCELL LYSIS
ITR CMV Promoter CNTF hrGFP ITR
ITR U6 Promoter shRhoA CMV Promoter CNTF hrGFP ITR
TRANSDUCTION
rAAV particles
Figure 1.12: Recombinant AAV Virus. The REP and CAP genes of wild type AAV are replacedwith a gene of interest (e.g. CNTF). This insert contains a strong promoter (CMV) to drive geneexpression and a reporter gene which allows the visualisa on of AAV2 transfected cells. Like thewild type virus, the transgene insert is flanked by ITR to allow viral replica on to occur. Figuremodified from (Vasileva & Jessberger 2005).
Page | 52
1.15.1 Advantages and disadvantages of using AAV as a viral vector
AAV viruses are ideal for re nal gene transfer since they are able to transduce both di-
viding and non-dividing cells. Furthermore they exert low pathogenicity and immuno-
genicity, in fact approximately 80% of the human popula on test seroposi ve for AAV2
without any overt pathology (Goncalves 2005). Moreover, rAAV vectors are par cularly
effec ve at promo ng long term gene expression in the eye (Dudus, et al. 1999), making
the requirement for repe ve protein injec ons redundant. One of the major limi ng
factors of using rAAV2 as a gene delivery vector is the transduc on process. First AAV2
needs to be able to enter the cell of interest through a receptormediated process (Surace
& Auricchio 2008), this is problema c when virus is administered through an intravitreal
injec on and is discussed in sec on 5.1.1. Once internalised the AAV virus needs to be
trafficked to the nucleus where it can ini ate second strand DNA synthesis and express
the desired transgene (Surace & Auricchio 2008). All of these processes are very me
consuming; in the case of AAV2 it can take up to 30 d for transgene expression to be seen
a er delivery (Surace & Auricchio 2008, Zincarelli, et al. 2008). Furthermore AAV has a
limited packaging capacity and is only able to accommodate a ≈4.7 kb insert (Surace &
Auricchio 2008) — however this is sufficient to house our gene of interest.
1.16 RNA interference
RNA interference (RNAi) is a highly conserved mechanism that co-ordinates the degra-
da on of double-stranded RNA (dsRNA) molecules (Davidson & McCray 2011). This nat-
Page | 53
urally occurring defencemechanismhas been observed in a number of organisms, includ-
ing single cell fungi (Cogoni, et al. 1996), plants (Bernstein, et al. 2001), frogs (Oelgeschlager,
et al. 2000) and insects (Kennerdell & Carthew 1998). The process of RNAi was ini ally
observed in transgenic plants (Bernstein et al. 2001). Transgenes coding for chalcone
synthase were introduced into pertunia plants to enhance petal pigmenta on (Bernstein
et al. 2001); in spite of this they found that many of the plants had white or variegated
petals — this outcome was indica ve of gene silencing (Bernstein et al. 2001). Subse-
quent work on caenorhabdi s elegans (C.elegans) (Fire, et al. 1998) revealed that the
presence of double stranded RNA was a prerequisite for RNAi. They found that injec on
of single stranded sense or an sense RNAs led to moderate mRNA suppression, whilst
introduc on of dsRNA resulted in significant mRNA knockdown (Fire et al. 1998). Inter-
es ngly, many of the phenotypic changes associated with mRNA knockdown were dis-
played by injected adults, and inherited by their respec ve progeny (Fire et al. 1998).
This was the first indica on that RNAi could be used to cause heritable changes. This
phenomenon was later recognised in a variety of mammalian cell lines (Human embry-
onic kidney-293, HeLa, COS-7 and NIH/3T3) (Elbashir, et al. 2001). They found that trans-
fec on of dsRNA caused significant mRNA knockdown without producing an interferon
response. The outcome of this study brought with it the realisa on that short-interfering
RNA (siRNA) technology could be used to produce ``gene-specific'' therapeu cs (Elbashir
et al. 2001).
The mechanis c ac on of RNAi has recently been demonstrated in humans (during a
phase I clinical trial) (Davis, et al. 2010). siRNA was administered systemically, using a
nanopar cle delivery system, to treat pa ents with solid tumours. Analysis of pa ent
Page | 54
biopsies revealed a dose dependent accumula on of nanopar cles, together with mRNA
cleavage and protein suppression (Davis et al. 2010).
1.16.1 Mechanisms of RNA interference
RNAi can be triggered by the presence of exogenous dsRNA (e.g. derived from viruses
or transposable elements) and leads to the Dicer dependent genera on of small (20 to
24 nucleo de pairs) siRNAs (Davidson & McCray 2011). Alterna vely siRNAs can arise
from endogenous loci that contain direct or indirect ITR (Davidson &McCray 2011). Tran-
scripts arising from these loci form short hairpin loops which are cleaved by Dicer to pro-
duce siRNAs (Davidson &McCray 2011). The resultant siRNA duplex consists of two RNA
strands, each of which has a 5ʹ phosphate group and a 3ʹ hydroxyl group (Davidson &
McCray 2011). These strands are paired together to produce a 2 nucleo de overhang at
each end (Davidson & McCray 2011). Once synthesized, one strand of the siRNA duplex
(the guide strand) binds to the endonuclease Argonaut (AGO) and is incorporated into
the RNA-induced silencing complex (RISC), whilst the other strand (the passenger) is dis-
carded (Davidson & McCray 2011). The guide strand directs the RISC complex to a com-
plementary region ofmRNA. Gene silencing is achieved through the subsequent cleavage
of the targeted mRNA, ul mately leading to mRNA degrada on and transla onal arrest
(Davidson & McCray 2011).
Page | 55
CHAPTER 2
MATERIALS AND METHODS
Page | 56
2.1 In vitro Techniques
Unless otherwise stated reagents were obtained from Sigma-Aldrich (Poole, UK).
2.1.1 Re nal culture
Adult Sprague-Dawley rats (150 g to 250 g) were killed by cervical disloca on, the eyes
were removed and placed on ice in sterile phosphate buffered saline (PBS) (Gibco, Pais-
ley, UK). Re nae were dissected from each eye and dissociated using a papain dissocia-
on kit (Worthington Biochemicals, New Jersey, USA). The papain solu on was prepared
by adding 5ml of earle's Balanced Salt Solu on (EBSS) with bicarbonate and phenol red
together with 20Uml−1 papain and 100Uml−1 deoxyribonuclease I (DNase I). Re nae
were placed in this solu on and incubated at 37 ◦C in a humidified atmosphere contain-
ing 5% CO2 for 90min. During this me, ovomucoid inhibitor was recons tuted in 32ml
EBSS to give a final concentra on of 10mgml−1 ovomucoid inhibitor and 10mgml−1 al-
bumin. A er 90min, any remaining ssue fragments were broken up by tritura ng with
a 5ml pipe e, the solu on was then centrifuged at 300 x g for 5min at room temper-
ature (RT). The supernatant was discarded and the remaining pellet was resuspended
in a solu on containing 1.35ml EBSS, 150 µl recons tuted albumin ovomucoid inhibitor
and 125 µl DNase. The cell suspension was then layered on top of a discon nuous den-
sity gradient (containing 2.5ml of albumin ovomucoid inhibitor) to separate intact re nal
cells from cell membrane components. The cell suspension was then passed through this
gradient by centrifuga on (70 x g for 6min). The supernatant (containing cell membrane
components) was discarded and the remaining cell pellet (containing re nal cells) was
Page | 57
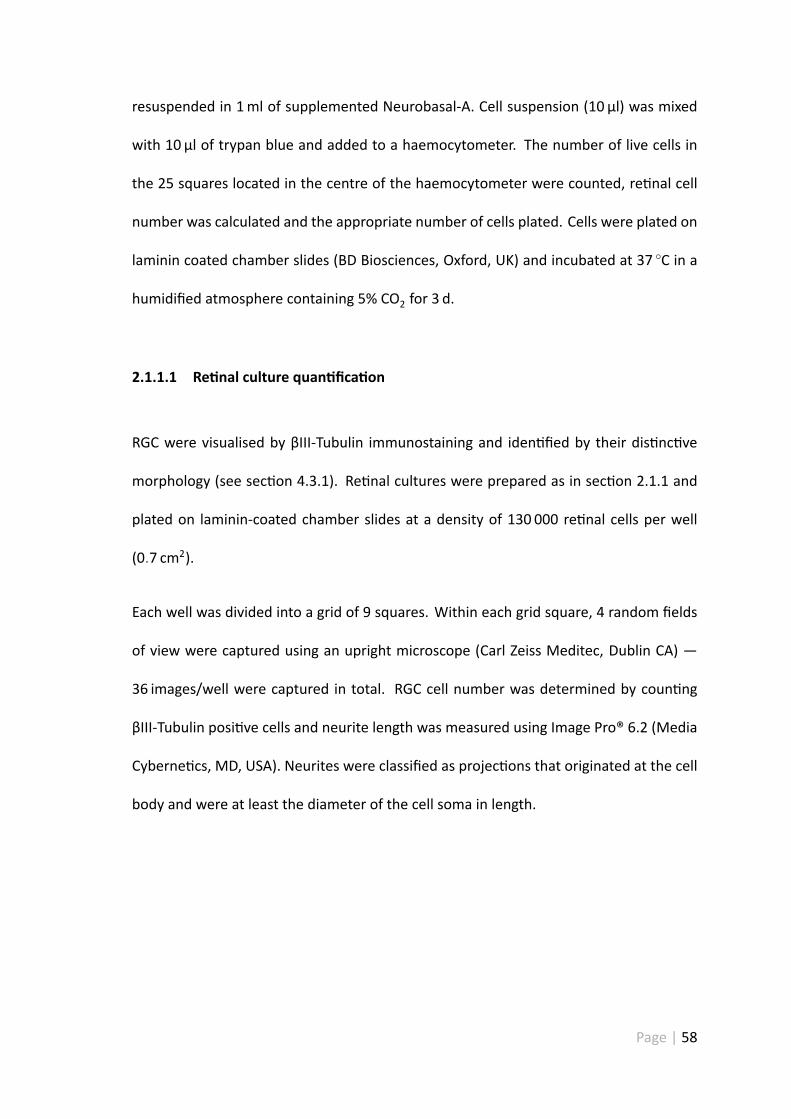
resuspended in 1ml of supplemented Neurobasal-A. Cell suspension (10 µl) was mixed
with 10 µl of trypan blue and added to a haemocytometer. The number of live cells in
the 25 squares located in the centre of the haemocytometer were counted, re nal cell
number was calculated and the appropriate number of cells plated. Cells were plated on
laminin coated chamber slides (BD Biosciences, Oxford, UK) and incubated at 37 ◦C in a
humidified atmosphere containing 5% CO2 for 3 d.
2.1.1.1 Re nal culture quan fica on
RGC were visualised by βIII-Tubulin immunostaining and iden fied by their dis nc ve
morphology (see sec on 4.3.1). Re nal cultures were prepared as in sec on 2.1.1 and
plated on laminin-coated chamber slides at a density of 130 000 re nal cells per well
(0.7 cm2).
Each well was divided into a grid of 9 squares. Within each grid square, 4 random fields
of view were captured using an upright microscope (Carl Zeiss Meditec, Dublin CA) —
36 images/well were captured in total. RGC cell number was determined by coun ng
βIII-Tubulin posi ve cells and neurite length was measured using Image Pro® 6.2 (Media
Cyberne cs, MD, USA). Neurites were classified as projec ons that originated at the cell
body and were at least the diameter of the cell soma in length.
Page | 58
2 31
5 64
8 97
Well
Figure 2.1: Diagramma c representa on of sampling technique. Each well was divided intoa grid of 9 squares. 4 random fields of view were captured within each grid square. Diagramreproduced from (Morrison 2011).
2.1.2 RGC-5 cell culture
RGC-5 cells were kindly provided by Dr. Neeraj Agarwal (Department of Pathology and
Anatomy, The University of north Texas Health Science Centre, Fort Worth, Texas, USA).
RGC-5 cells were grown in dulbecco's Modified Eagle Medium (DMEM) supplemented
with 100Uml−1 penicillin/streptomycin (P/S) and10%heat-inac vated foetal bovine serum
(FBS). RGC-5 cells were incubated at 37 ◦C in a humidified environment containing 5%CO2
and were passaged at a ra o of 1:20. The RGC-5 cells were grown in T175 flasks during
general cell maintenance.
2.1.2.1 Morphological analysis of RGC-5 cells
RGC-5 cells were treated with Staurosporine using concentra ons ranging from 0 n to
3.16 µ for 24 h to induce differen a on. The extent of process outgrowth, expression
and branching were assessed a er 24 h exposure to the reagent. The extent of process
Page | 59
expression and branching per cell were expressed as mean ± standard error of the mean
(SEM) from 60 cells. The length of each process was measured from soma to end using
Image Pro® 6.2 (Media Cyberne cs, MD, USA). Mean process length and longest process
per cell were expressed as ± SEM from 60 cells. For the purpose of quan fica on a pro-
cess was defined as any cellular projec on longer than the diameter of one cell soma.
2.1.3 Immunocytochemistry and Immunohistochemistry
IHC and immunocytochemistry are techniques which can be used to visualise par cular
an gens on ssues/cells of interest. This is accomplished by the applica on of a primary
an body targeted against a specific an gen, followed by addi on of a secondary an body
conjugated to a fluorescent label — this allows visualisa on when examined microscop-
ically. The loca on of fluorescent label gives an indica on as to the cellular loca on of
the an body-an gen interac ons.
2.1.3.1 Immunocytochemistry
Cells were fixed with 4% formaldehyde (TAAB Laboratories, Berkshire, UK) in PBS (Oxoid,
Ltd, Basingstoke, UK) at RT for 10min. The formaldehyde solu on was then removed
with a pasteur pipe e and the wells were washed three mes with rinsing buffer. Block-
ing buffer was then added to each of the wells to eliminate non-specific binding. Primary
an body (200 µl) was then added to each of the wells and incubated at RT for 1 h. Pri-
mary an bodies were then removed by inver ng chamber slides onto paper towels and
the wells were washed three mes with rinsing buffer. Secondary an bodies (200 µl)
Page | 60
were added to each of the wells and incubated for 1 h at RT in a dark environment to pre-
vent bleaching. Secondary an bodies were removed by inver ng chamber slides onto
paper towels and each of the wells were washed three mes in rinsing buffer. When
the last wash was removed, the well dividers were removed from the chamber slides
and coverslips were mounted using vectashield withʹ,6-diamidino-2-phenylindole (DAPI)
(Vector Labs, Peterborough, UK). The slideswere then viewedwith an uprightmicroscope
(Carl Zeiss Meditec, Dublin, CA) and images were captured using the Axiovision so ware
(Axiovision; Carl Zeiss Meditec).
2.1.3.2 Immunohistochemistry
ON and eye sec ons were removed from the freezer, thawed for 30min and washed in
rinsing buffer (3 x 5min). Excess rinsing buffer was aspirated and a hydrophobic pen
was used to draw around each sec on. Blocking solu on (100 µl) was then applied to
each of the sec ons and slides were subsequently placed in a humidified chamber at RT
for 1 h. A er this, blocking buffer was removed and 100 µl of primary an body was ap-
plied to each sec on and incubated in a humidified chamber for 1 h at RT. Slides were
then washed in rinsing buffer (3 x 5min) before applying the appropriate secondary an-
body. Sec ons were then incubated in a humidified chamber at RT for 1 h in the dark
to prevent bleaching of fluorescence. Sec ons were washed in rinsing buffer (3 x 5min)
and coverslips mounted using vectashield with DAPI (vector labs, Peterborough, UK). The
slides were then viewed with an upright microscope (Carl Zeiss Meditec, Dublin CA) and
images were captured using the Axiovision so ware (Axiovision; Carl Zeiss Meditec).
Page | 61
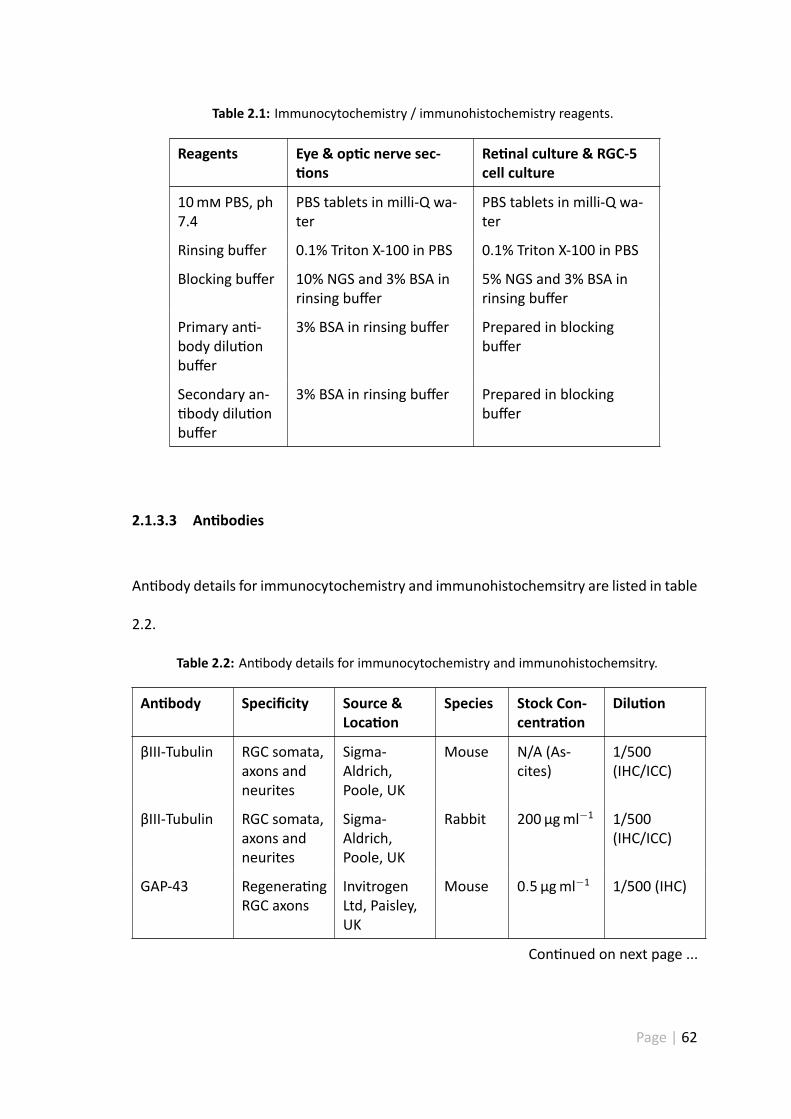
Table 2.1: Immunocytochemistry / immunohistochemistry reagents.
Reagents Eye & op c nerve sec-ons
Re nal culture & RGC-5cell culture
10m PBS, ph7.4
PBS tablets in milli-Q wa-ter
PBS tablets in milli-Q wa-ter
Rinsing buffer 0.1% Triton X-100 in PBS 0.1% Triton X-100 in PBS
Blocking buffer 10% NGS and 3% BSA inrinsing buffer
5% NGS and 3% BSA inrinsing buffer
Primary an -body dilu onbuffer
3% BSA in rinsing buffer Prepared in blockingbuffer
Secondary an-body dilu on
buffer
3% BSA in rinsing buffer Prepared in blockingbuffer
2.1.3.3 An bodies
An body details for immunocytochemistry and immunohistochemsitry are listed in table
2.2.
Table 2.2: An body details for immunocytochemistry and immunohistochemsitry.
An body Specificity Source &Loca on
Species Stock Con-centra on
Dilu on
βIII-Tubulin RGC somata,axons andneurites
Sigma-Aldrich,Poole, UK
Mouse N/A (As-cites)
1/500(IHC/ICC)
βIII-Tubulin RGC somata,axons andneurites
Sigma-Aldrich,Poole, UK
Rabbit 200 µgml−1 1/500(IHC/ICC)
GAP-43 Regenera ngRGC axons
InvitrogenLtd, Paisley,UK
Mouse 0.5 µgml−1 1/500 (IHC)
Con nued on next page ...
Page | 62
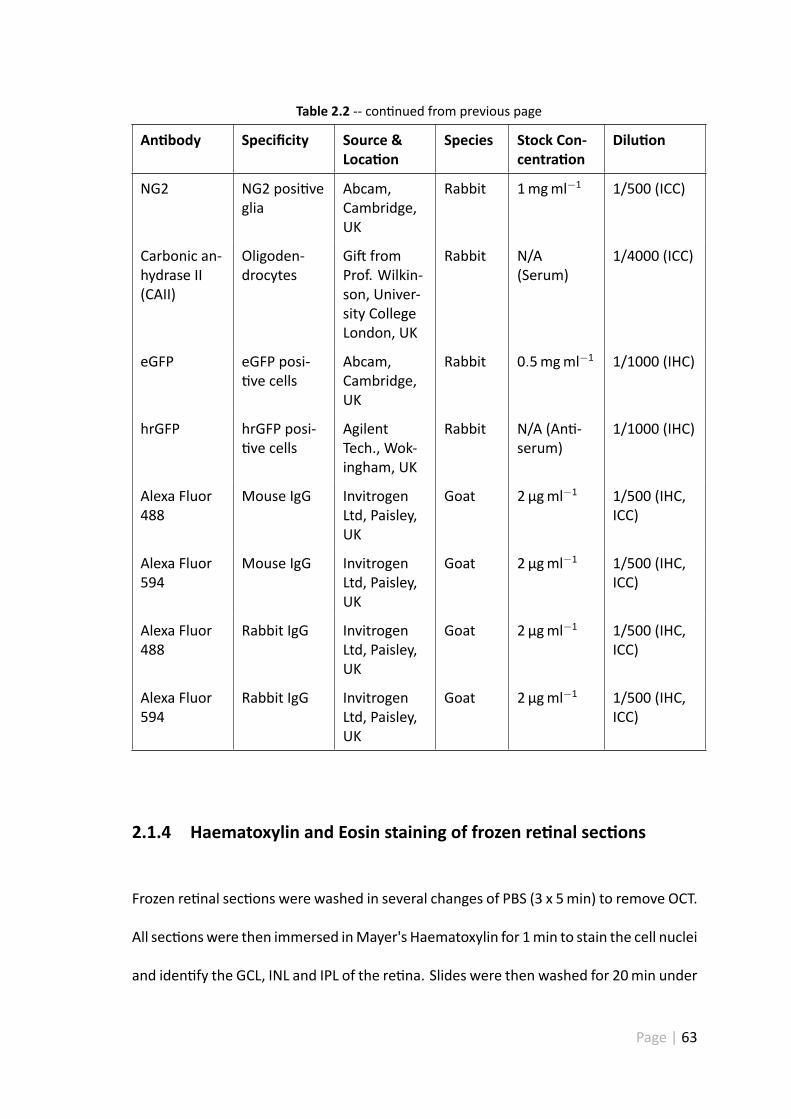
Table 2.2 -- con nued from previous page
An body Specificity Source &Loca on
Species Stock Con-centra on
Dilu on
NG2 NG2 posi veglia
Abcam,Cambridge,UK
Rabbit 1mgml−1 1/500 (ICC)
Carbonic an-hydrase II(CAII)
Oligoden-drocytes
Gi fromProf. Wilkin-son, Univer-sity CollegeLondon, UK
Rabbit N/A(Serum)
1/4000 (ICC)
eGFP eGFP posi-ve cells
Abcam,Cambridge,UK
Rabbit 0.5mgml−1 1/1000 (IHC)
hrGFP hrGFP posi-ve cells
AgilentTech., Wok-ingham, UK
Rabbit N/A (An -serum)
1/1000 (IHC)
Alexa Fluor488
Mouse IgG InvitrogenLtd, Paisley,UK
Goat 2 µgml−1 1/500 (IHC,ICC)
Alexa Fluor594
Mouse IgG InvitrogenLtd, Paisley,UK
Goat 2 µgml−1 1/500 (IHC,ICC)
Alexa Fluor488
Rabbit IgG InvitrogenLtd, Paisley,UK
Goat 2 µgml−1 1/500 (IHC,ICC)
Alexa Fluor594
Rabbit IgG InvitrogenLtd, Paisley,UK
Goat 2 µgml−1 1/500 (IHC,ICC)
2.1.4 Haematoxylin and Eosin staining of frozen re nal sec ons
Frozen re nal sec ons were washed in several changes of PBS (3 x 5min) to remove OCT.
All sec onswere then immersed inMayer's Haematoxylin for 1min to stain the cell nuclei
and iden fy the GCL, INL and IPL of the re na. Slides were then washed for 20min under
Page | 63
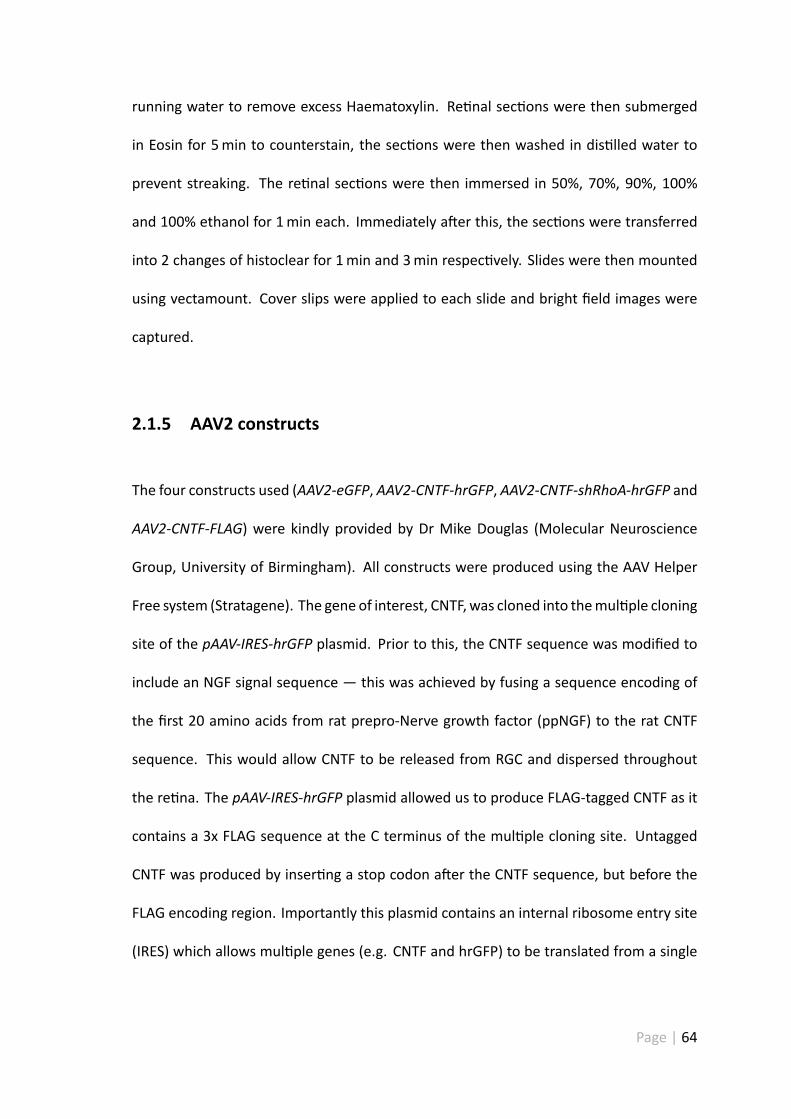
running water to remove excess Haematoxylin. Re nal sec ons were then submerged
in Eosin for 5min to counterstain, the sec ons were then washed in dis lled water to
prevent streaking. The re nal sec ons were then immersed in 50%, 70%, 90%, 100%
and 100% ethanol for 1min each. Immediately a er this, the sec ons were transferred
into 2 changes of histoclear for 1min and 3min respec vely. Slides were then mounted
using vectamount. Cover slips were applied to each slide and bright field images were
captured.
2.1.5 AAV2 constructs
The four constructs used (AAV2-eGFP, AAV2-CNTF-hrGFP, AAV2-CNTF-shRhoA-hrGFP and
AAV2-CNTF-FLAG) were kindly provided by Dr Mike Douglas (Molecular Neuroscience
Group, University of Birmingham). All constructs were produced using the AAV Helper
Free system (Stratagene). The gene of interest, CNTF,was cloned into themul ple cloning
site of the pAAV-IRES-hrGFP plasmid. Prior to this, the CNTF sequence was modified to
include an NGF signal sequence — this was achieved by fusing a sequence encoding of
the first 20 amino acids from rat prepro-Nerve growth factor (ppNGF) to the rat CNTF
sequence. This would allow CNTF to be released from RGC and dispersed throughout
the re na. The pAAV-IRES-hrGFP plasmid allowed us to produce FLAG-tagged CNTF as it
contains a 3x FLAG sequence at the C terminus of the mul ple cloning site. Untagged
CNTF was produced by inser ng a stop codon a er the CNTF sequence, but before the
FLAG encoding region. Importantly this plasmid contains an internal ribosome entry site
(IRES) which allows mul ple genes (e.g. CNTF and hrGFP) to be translated from a single
Page | 64
plasmid. IRES sequences allow transla on ini a on to occur in the middle of an mRNA
sequence by a cap-independent mechanism. As a result Ribosomes bind to the AUG
start codon without scanning the 5ʹ non-translated region of the transcript (Mizuguchi,
et al. 2000). AAV2 viruses were manufactured, concentrated and tred by Gene Vector
Core (University of Iowa). For a more complete explana on of this process (see sec on
1.15).
14 AAV Helper-Free System
pAAV-IRES-hrGFP Vector
*Non-unique sites used to release the expression cassette for subcloning fragments from pCMV-MCS
Feature Nucleotide Position
left AAV-2 inverted terminal repeat (ITR) 1–141
CMV promoter 150–812
E-globin intron 820–1312
multiple cloning site 1392–1420
3× FLAG tag 1421–1492
internal ribosome entry site (IRES) 1528–2114
hrGFP ORF 2112–2828
human growth hormone (hGH) polyA signal 2886–3364
right AAV-2 inverted terminal repeat (ITR) 3404–3544
f1 origin of ss-DNA replication 3636–3942
ampicillin resistance (bla) ORF 4461–5318
pUC origin of replication 5469–6136
Not I cleavage sites for subcloning from pCMV-MCS 143, 3397 (additional site at 1373)
FIGURE 2 The pAAV-IRES-hrGFP cloning vector
Not I*
Not I*
L-ITR
P CMV
beta-globin intron
MCS3x FLAG
IRES
hrGFP
hGH pA
R-ITR
ampicillin
f1 ori
pUC ori
pAAV-IRES-hrGFP6.1 kb
pAAV-IRES-hrGFP Multiple Cloning Site Region (sequence shown 1392–1432)
GG ATC CGA ATT CGC ATG CGT CGA CTC GAG GAC TAC AAG GAT
Sal I
BamH I EcoR I Hinc IIAcc I
Xho Istart of FLAG tag
Figure 2.2: pAAV-IRES-hrGFP expression plasmid supplied in the AAV Helper Free System.Reproduced from http://www.chem.agilent.com/Library/usermanuals/Public/240071.pdf
2.1.6 Lipofectamine 2000 Transfec on
Human embryonic kidney 293 cells (HEK-293) were plated in DMEM media at a density
of 500 000 cells well−1 in a 6-well plate (Nunc, Loughborough, UK) to ensure that the
Page | 65
cells were 90-95% confluent at the me of transfec on. The following day, transfec on
samples and reagents were prepared in separate tubes. In one tube, plasmid DNA was
diluted in Op -MEM media (2mlwell−1) to give a DNA concentra on of 4 µgwell−1. In
the second tube, 10 µl of Lipofectamine 2000 (Invitrogen, Ltd, Paisley, UK) was diluted
in Op -MEM media (Invitrogen, Ltd, Paisley, UK) (2mlwell−1) — both solu ons were in-
cubated at RT for 5min. To form complexes, diluted plasmid DNA was combined with
the diluted Lipofectamine solu on, mixed gently and incubated at RT for 20min. A er
this, 2ml of complexes were added to each well and mixed gently. Cells were then incu-
bated at 37 ◦C in a humidified atmosphere containing 5% CO2 for 5 h, at which point the
media was changed with DMEM (+ 100Uml−1 P/S + 10% FBS). Treatment groups com-
prised of AAV2-hrGFP, AAV2-CNTF-hrGFP, AAV2-CNTF-FLAG, AAV2-CNTF-shRhoA-hrGFP,
untreated control and Lipofectamine 2000 only. Condi oned media was collected 5 d
a er transfec on.
2.1.7 Enzyme linked immunosorbent assay
A sandwich enzyme-linked immunosorbent assay (ELISA) was used to measure CNTF lev-
els in HEK-293 condi oned media. The CNTF ELISA (R&D Systems) was performed in ac-
cordance with manufacturer's instruc ons and all reagents were supplied with the kit. A
sterile 96-well plate (Nunc, Loughborough, UK) was coated with capture an body, sealed
with parafilm and incubated at RT overnight for 17 h. Following an body removal, each
well was rinsed three mes with wash buffer (≈400 µl well−1). A er each wash step the
buffer was removed by inver ng the plate and blo ng with clean paper towels.
Page | 66
To block, reagent diluent (300 µl) was added to each well and incubated at RT for 1 h. Af-
ter repea ng the aspira on wash step, CNTF standards and samples were prepared and
added to each well (100 µl). The ini al CNTF standard was diluted with reagent diluent
to give a final concentra on of 2000 pgml−1. A series of 1:2 dilu ons (i.e. 1000 pgml−1,
500 pgml−1, 250 pgml−1 etc) was then performed so that a standard curve could be con-
structed (each sample was ini ally diluted 1:5 to ensure that the concentra onwould fall
within the standard curve). A series of 1:2 dilu ons were then performed for each sam-
ple, as with the CNTF standard.
The plate was then coveredwith an adhesive strip and incubated at RT for 2 h on a shaker.
A er another round of washing, detec on an body (100 µl) was added to each of the
wells. The plate was then covered with a new adhesive strip and incubated at RT for a
further 2 h. Another aspira on wash step was performed and then a working solu on
of streptavidin-HRP was prepared and added to each well. The plate was incubated at
RT for 20min and covered with foil to avoid being placed in direct light – this was then
followed by another aspira on wash step.
Substrate solu on (100 µl) was added to each well and incubated at RT for 20min. Stop
solu on (50 µl) was then applied to each well and mixed gently on a shaker. The op cal
density was measured using a microplate reader set to 450 nm (Victor3, Perkin Elmer).
A standard curve of absorbance vs CNTF concentra on was then plo ed using Microso
Excel. This curve was then used to determine the rela ve concentra on of CNTF present
within each sample.
Page | 67
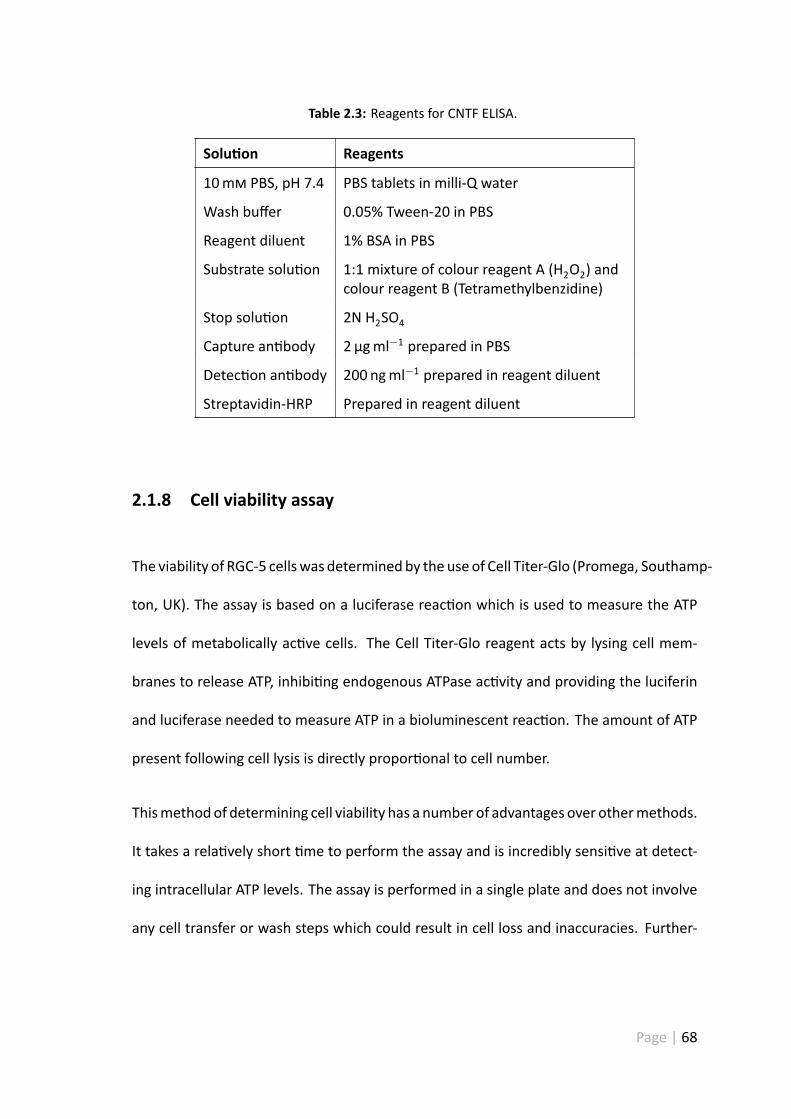
Table 2.3: Reagents for CNTF ELISA.
Solu on Reagents
10m PBS, pH 7.4 PBS tablets in milli-Q water
Wash buffer 0.05% Tween-20 in PBS
Reagent diluent 1% BSA in PBS
Substrate solu on 1:1 mixture of colour reagent A (H2O2) andcolour reagent B (Tetramethylbenzidine)
Stop solu on 2N H2SO4
Capture an body 2 µgml−1 prepared in PBS
Detec on an body 200 ngml−1 prepared in reagent diluent
Streptavidin-HRP Prepared in reagent diluent
2.1.8 Cell viability assay
The viability of RGC-5 cellswas determinedby theuse of Cell Titer-Glo (Promega, Southamp-
ton, UK). The assay is based on a luciferase reac on which is used to measure the ATP
levels of metabolically ac ve cells. The Cell Titer-Glo reagent acts by lysing cell mem-
branes to release ATP, inhibi ng endogenous ATPase ac vity and providing the luciferin
and luciferase needed to measure ATP in a bioluminescent reac on. The amount of ATP
present following cell lysis is directly propor onal to cell number.
Thismethodof determining cell viability has a number of advantages over othermethods.
It takes a rela vely short me to perform the assay and is incredibly sensi ve at detect-
ing intracellular ATP levels. The assay is performed in a single plate and does not involve
any cell transfer or wash steps which could result in cell loss and inaccuracies. Further-
Page | 68
more, this assay gives reproducible bioluminescent readouts resul ng in low standard
devia on/error values.
One of the limita ons of using this method is that it requires cells lysis to isolate and
measure cellular ATP content. As a result, conclusions can only be drawn from whole
popula ons of cells rather than from individual cells. Another poten al limita on of hav-
ing a cell lysis step is that it prevents further analysis from being carried out on the same
popula on of cells (e.g.immunocytochemistry, PCR e.t.c.). This method relies on mea-
suring the metabolic ac vity of cells (through ATP content) to determine cell viability. As
a result this assay is poten ally suscep ble to addi onal factors which may rapidly in-
fluence ATP cell content (e.g. oxygen availability). Consequently, analysis is limited to
gross changes in ATP content and does not allow for the analysis of contribu ng factors.
It is also important that the right equipment is used to carry out these assays: Biolumi-
nescent reac ons require the use of a specialised microplates (opaque sides with a clear
flat bo om) to prevent luminescent interference between wells. It's also essen al that
phenol red is not present within the media as it can reduce the luminescent signal.
RGC-5 cellswere plated in a 96-wellwhite opaqueplate at a seeding density of 2500 cells well−1
in 180 µl of medium containing 10% FBS for 2 h at 37 ◦C in a humidified environment con-
taining 5% CO2. The CellTiter-Glo luminescent substrate was recons tuted with CellTiter-
Glo buffer and equilibrated to RT. Cells were le at RT for 30min before 100 µl of lumines-
cent substrate was added. To ensure efficient cell lysis the plate was placed on a shaker
for 5min at RT and then le to stabilise for 10min. The luminescencewas thenmeasured
using a 96-well plate reader (Victor3, Perkin Elmer, MA, USA).
Page | 69
2.1.9 RNA extrac on
RNA was extracted using the RNeasy mini kit (Qiagen) according to manufacturer's pro-
tocols.
2.1.9.1 RGC-5 cell RNA extrac on
DMEM was removed from ssue culture flasks and cells were washed twice with sterile
PBS. Trypsin (Gibco) in PBS (0.25%)was then added to detach cells from the flask—media
(DMEM + 10% FBS + 1% P/S) was then added to inac vate the trypsin. The cell suspen-
sion was then transferred into a 50ml Falcon tube and centrifuged at 300 x g for 5min.
The supernatant was carefully aspirated leaving the remaining cell pellet. The pellet was
then re-suspended in denaturing buffer RLT (containing guanidine-thiocyanate) and ho-
mogenized using a rotor stator homogenizor. One volume of 70% ethanol was added to
the homogenate to facilitate membrane binding. The solu on was then transferred to a
spin column and centrifuged at 8000 x g for 15 s, the flow through was collected in the
tube supplied and discarded. Buffer RW1 (700 µl) was added to the spin column and cen-
trifuged at 8000 x g for 15 s to wash the membrane. The membrane was then washed
a further two mes with buffer RPE (discarding the flow through each me) to remove
contaminants. RNA was then eluted from the column in 50 µl of RNase free water. A
Nanodrop was then used to measure RNA concentra on.
Page | 70
2.1.9.2 Mouse brain RNA extrac on
Mouse brain was dissected out and snap frozen in liquid nitrogen, ≈30mg of brain s-
sue was disrupted in 600 µl buffer RLT using a rotor stator homogeniser (IKA ® T10 basic
Ultra-Turrax) for 20 s to 40 s. The homogenate was centrifuged at full speed for 3min
and the supernatant was carefully removed using a pipe e. The supernatant was then
transferred into a clean eppendorf tube and one volume of 70% ethanol was added to
aid membrane binding. The solu on was then transferred to a spin column and cen-
trifuged at 8000 x g for 15 s, the flow through was collected in the tube supplied and
discarded. Buffer RW1 (700 µl) was added to the spin column and centrifuged at 8000 x
g for 15 s to wash the membrane. The membrane was then washed a further two mes
with buffer RPE (discarding the flow through each me) to remove contaminants. RNA
was then eluted from the column in 50 µl of RNase free water. A Nanodrop was then
used to measure RNA concentra on.
2.1.9.3 Mouse eye RNA extrac on
RNA was extracted from 2 mouse eyes using the RNeasy mini kit as previously described
(see sec on 2.1.9.2).
2.1.10 RNA quan fica on
RNA concentra ons were determined by loading 2 µl of RNA solu on into a Nanodrop
spectrophotometer (ND-1000; Wilmington, DE, USA) and measuring the absorbance of
Page | 71
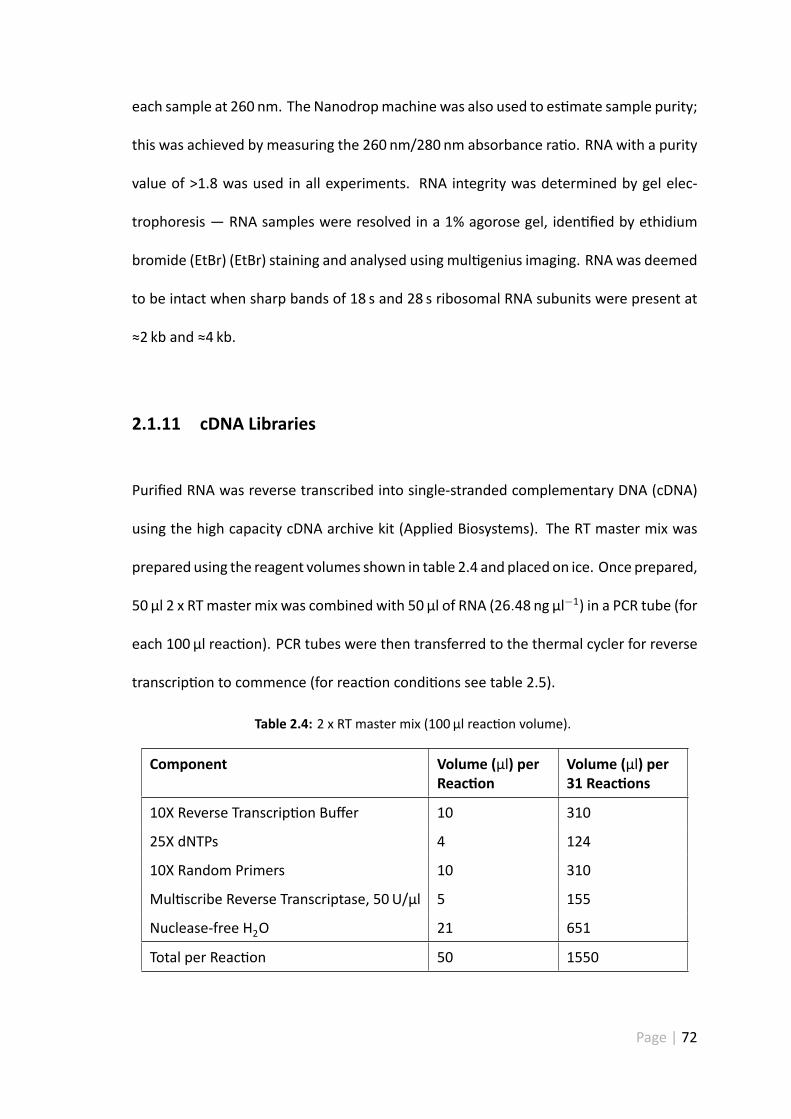
each sample at 260 nm. The Nanodropmachine was also used to es mate sample purity;
this was achieved by measuring the 260 nm/280 nm absorbance ra o. RNA with a purity
value of >1.8 was used in all experiments. RNA integrity was determined by gel elec-
trophoresis — RNA samples were resolved in a 1% agorose gel, iden fied by ethidium
bromide (EtBr) (EtBr) staining and analysed using mul genius imaging. RNA was deemed
to be intact when sharp bands of 18 s and 28 s ribosomal RNA subunits were present at
≈2 kb and ≈4 kb.
2.1.11 cDNA Libraries
Purified RNA was reverse transcribed into single-stranded complementary DNA (cDNA)
using the high capacity cDNA archive kit (Applied Biosystems). The RT master mix was
prepared using the reagent volumes shown in table 2.4 and placed on ice. Once prepared,
50 µl 2 x RTmaster mix was combined with 50 µl of RNA (26.48 ng µl−1) in a PCR tube (for
each 100 µl reac on). PCR tubes were then transferred to the thermal cycler for reverse
transcrip on to commence (for reac on condi ons see table 2.5).
Table 2.4: 2 x RT master mix (100 µl reac on volume).
Component Volume (µl) perReac on
Volume (µl) per31 Reac ons
10X Reverse Transcrip on Buffer 10 310
25X dNTPs 4 124
10X Random Primers 10 310
Mul scribe Reverse Transcriptase, 50U/µl 5 155
Nuclease-free H2O 21 651
Total per Reac on 50 1550
Page | 72
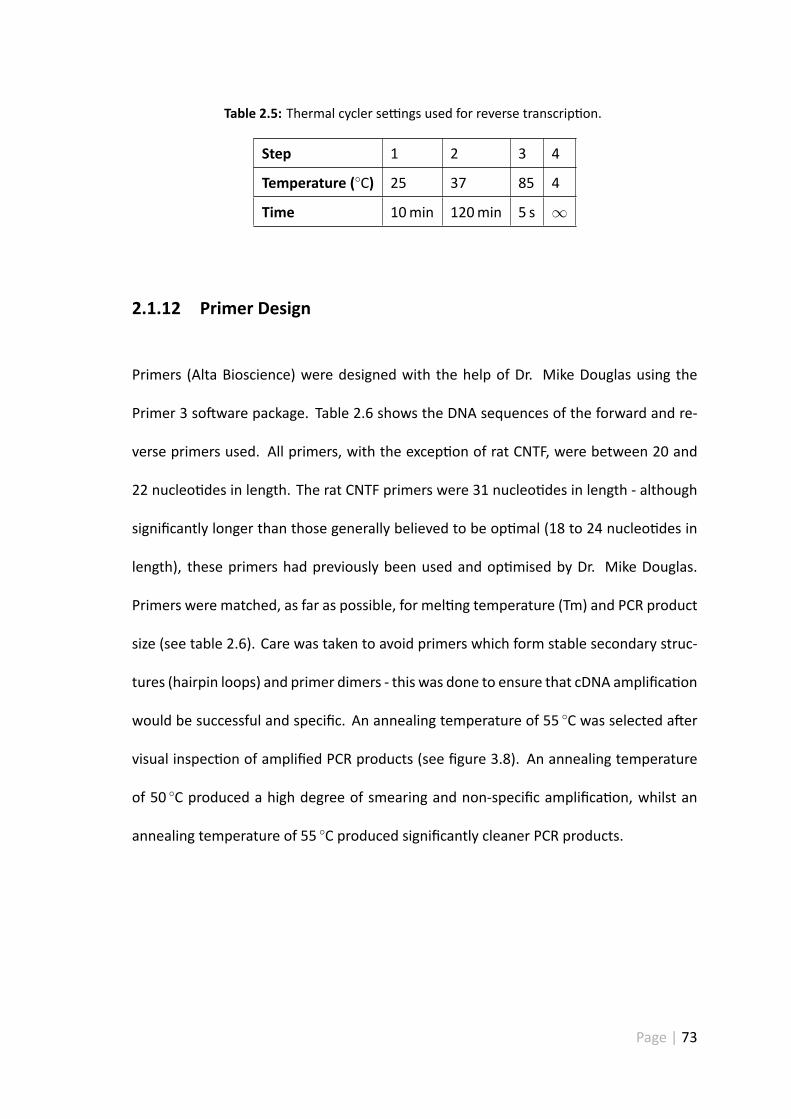
Table 2.5: Thermal cycler se ngs used for reverse transcrip on.
Step 1 2 3 4
Temperature (◦C) 25 37 85 4
Time 10min 120min 5 s ∞
2.1.12 Primer Design
Primers (Alta Bioscience) were designed with the help of Dr. Mike Douglas using the
Primer 3 so ware package. Table 2.6 shows the DNA sequences of the forward and re-
verse primers used. All primers, with the excep on of rat CNTF, were between 20 and
22 nucleo des in length. The rat CNTF primers were 31 nucleo des in length - although
significantly longer than those generally believed to be op mal (18 to 24 nucleo des in
length), these primers had previously been used and op mised by Dr. Mike Douglas.
Primers were matched, as far as possible, for mel ng temperature (Tm) and PCR product
size (see table 2.6). Care was taken to avoid primers which form stable secondary struc-
tures (hairpin loops) and primer dimers - this was done to ensure that cDNA amplifica on
would be successful and specific. An annealing temperature of 55 ◦C was selected a er
visual inspec on of amplified PCR products (see figure 3.8). An annealing temperature
of 50 ◦C produced a high degree of smearing and non-specific amplifica on, whilst an
annealing temperature of 55 ◦C produced significantly cleaner PCR products.
Page | 73
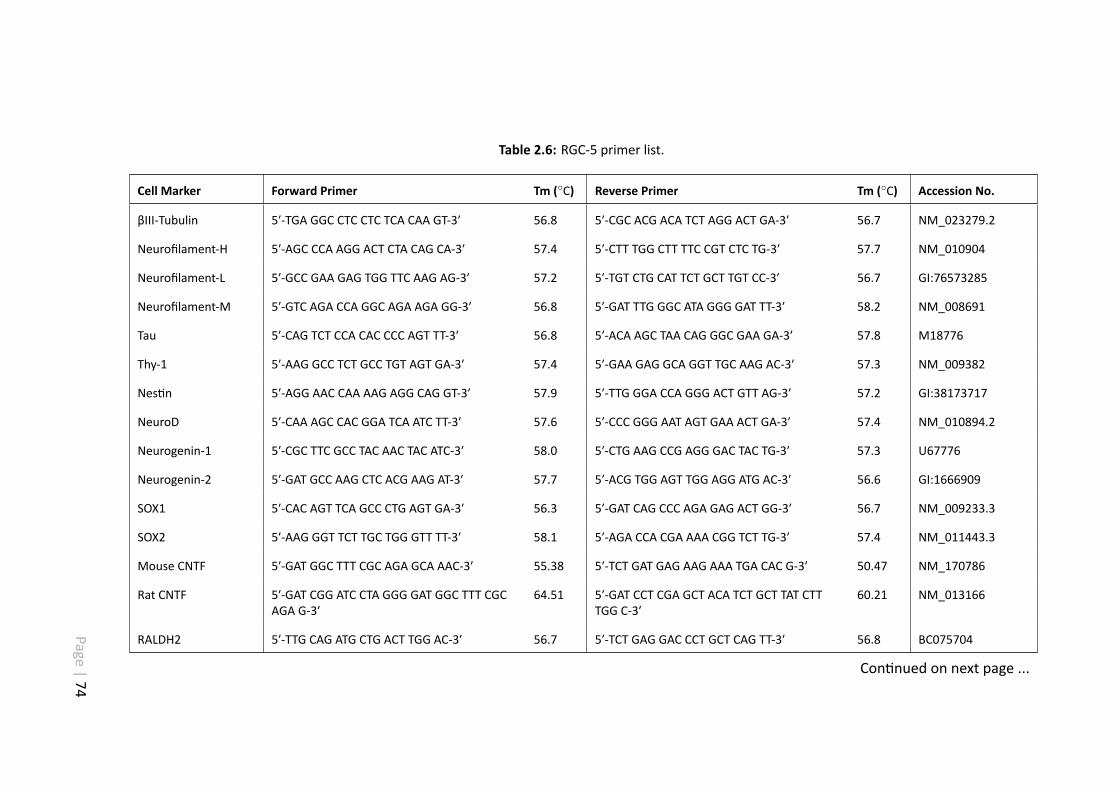
Table 2.6: RGC-5 primer list.
Cell Marker Forward Primer Tm (◦C) Reverse Primer Tm (◦C) Accession No.
βIII-Tubulin 5ʹ-TGA GGC CTC CTC TCA CAA GT-3ʹ 56.8 5ʹ-CGC ACG ACA TCT AGG ACT GA-3ʹ 56.7 NM_023279.2
Neurofilament-H 5ʹ-AGC CCA AGG ACT CTA CAG CA-3ʹ 57.4 5ʹ-CTT TGG CTT TTC CGT CTC TG-3ʹ 57.7 NM_010904
Neurofilament-L 5ʹ-GCC GAA GAG TGG TTC AAG AG-3ʹ 57.2 5ʹ-TGT CTG CAT TCT GCT TGT CC-3ʹ 56.7 GI:76573285
Neurofilament-M 5ʹ-GTC AGA CCA GGC AGA AGA GG-3ʹ 56.8 5ʹ-GAT TTG GGC ATA GGG GAT TT-3ʹ 58.2 NM_008691
Tau 5ʹ-CAG TCT CCA CAC CCC AGT TT-3ʹ 56.8 5ʹ-ACA AGC TAA CAG GGC GAA GA-3ʹ 57.8 M18776
Thy-1 5ʹ-AAG GCC TCT GCC TGT AGT GA-3ʹ 57.4 5ʹ-GAA GAG GCA GGT TGC AAG AC-3ʹ 57.3 NM_009382
Nes n 5ʹ-AGG AAC CAA AAG AGG CAG GT-3ʹ 57.9 5ʹ-TTG GGA CCA GGG ACT GTT AG-3ʹ 57.2 GI:38173717
NeuroD 5ʹ-CAA AGC CAC GGA TCA ATC TT-3ʹ 57.6 5ʹ-CCC GGG AAT AGT GAA ACT GA-3ʹ 57.4 NM_010894.2
Neurogenin-1 5ʹ-CGC TTC GCC TAC AAC TAC ATC-3ʹ 58.0 5ʹ-CTG AAG CCG AGG GAC TAC TG-3ʹ 57.3 U67776
Neurogenin-2 5ʹ-GAT GCC AAG CTC ACG AAG AT-3ʹ 57.7 5ʹ-ACG TGG AGT TGG AGG ATG AC-3ʹ 56.6 GI:1666909
SOX1 5ʹ-CAC AGT TCA GCC CTG AGT GA-3ʹ 56.3 5ʹ-GAT CAG CCC AGA GAG ACT GG-3ʹ 56.7 NM_009233.3
SOX2 5ʹ-AAG GGT TCT TGC TGG GTT TT-3ʹ 58.1 5ʹ-AGA CCA CGA AAA CGG TCT TG-3ʹ 57.4 NM_011443.3
Mouse CNTF 5ʹ-GAT GGC TTT CGC AGA GCA AAC-3ʹ 55.38 5ʹ-TCT GAT GAG AAG AAA TGA CAC G-3ʹ 50.47 NM_170786
Rat CNTF 5ʹ-GAT CGG ATC CTA GGG GAT GGC TTT CGCAGA G-3ʹ
64.51 5ʹ-GAT CCT CGA GCT ACA TCT GCT TAT CTTTGG C-3ʹ
60.21 NM_013166
RALDH2 5ʹ-TTG CAG ATG CTG ACT TGG AC-3ʹ 56.7 5ʹ-TCT GAG GAC CCT GCT CAG TT-3ʹ 56.8 BC075704
Con nued on next page ...
Page|74
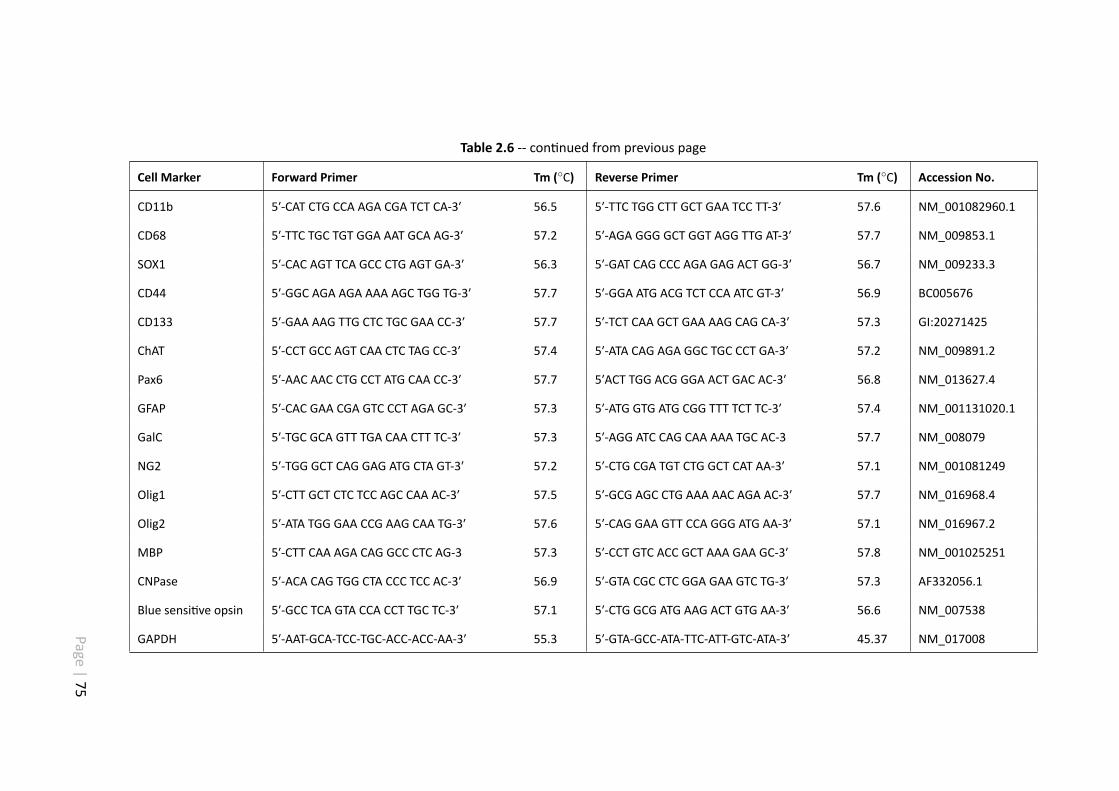
Table 2.6 -- con nued from previous page
Cell Marker Forward Primer Tm (◦C) Reverse Primer Tm (◦C) Accession No.
CD11b 5ʹ-CAT CTG CCA AGA CGA TCT CA-3ʹ 56.5 5ʹ-TTC TGG CTT GCT GAA TCC TT-3ʹ 57.6 NM_001082960.1
CD68 5ʹ-TTC TGC TGT GGA AAT GCA AG-3ʹ 57.2 5ʹ-AGA GGG GCT GGT AGG TTG AT-3ʹ 57.7 NM_009853.1
SOX1 5ʹ-CAC AGT TCA GCC CTG AGT GA-3ʹ 56.3 5ʹ-GAT CAG CCC AGA GAG ACT GG-3ʹ 56.7 NM_009233.3
CD44 5ʹ-GGC AGA AGA AAA AGC TGG TG-3ʹ 57.7 5ʹ-GGA ATG ACG TCT CCA ATC GT-3ʹ 56.9 BC005676
CD133 5ʹ-GAA AAG TTG CTC TGC GAA CC-3ʹ 57.7 5ʹ-TCT CAA GCT GAA AAG CAG CA-3ʹ 57.3 GI:20271425
ChAT 5ʹ-CCT GCC AGT CAA CTC TAG CC-3ʹ 57.4 5ʹ-ATA CAG AGA GGC TGC CCT GA-3ʹ 57.2 NM_009891.2
Pax6 5ʹ-AAC AAC CTG CCT ATG CAA CC-3ʹ 57.7 5ʹACT TGG ACG GGA ACT GAC AC-3ʹ 56.8 NM_013627.4
GFAP 5ʹ-CAC GAA CGA GTC CCT AGA GC-3ʹ 57.3 5ʹ-ATG GTG ATG CGG TTT TCT TC-3ʹ 57.4 NM_001131020.1
GalC 5ʹ-TGC GCA GTT TGA CAA CTT TC-3ʹ 57.3 5ʹ-AGG ATC CAG CAA AAA TGC AC-3 57.7 NM_008079
NG2 5ʹ-TGG GCT CAG GAG ATG CTA GT-3ʹ 57.2 5ʹ-CTG CGA TGT CTG GCT CAT AA-3ʹ 57.1 NM_001081249
Olig1 5ʹ-CTT GCT CTC TCC AGC CAA AC-3ʹ 57.5 5ʹ-GCG AGC CTG AAA AAC AGA AC-3ʹ 57.7 NM_016968.4
Olig2 5ʹ-ATA TGG GAA CCG AAG CAA TG-3ʹ 57.6 5ʹ-CAG GAA GTT CCA GGG ATG AA-3ʹ 57.1 NM_016967.2
MBP 5ʹ-CTT CAA AGA CAG GCC CTC AG-3 57.3 5ʹ-CCT GTC ACC GCT AAA GAA GC-3ʹ 57.8 NM_001025251
CNPase 5ʹ-ACA CAG TGG CTA CCC TCC AC-3ʹ 56.9 5ʹ-GTA CGC CTC GGA GAA GTC TG-3ʹ 57.3 AF332056.1
Blue sensi ve opsin 5ʹ-GCC TCA GTA CCA CCT TGC TC-3ʹ 57.1 5ʹ-CTG GCG ATG AAG ACT GTG AA-3ʹ 56.6 NM_007538
GAPDH 5ʹ-AAT-GCA-TCC-TGC-ACC-ACC-AA-3ʹ 55.3 5ʹ-GTA-GCC-ATA-TTC-ATT-GTC-ATA-3ʹ 45.37 NM_017008Page|75
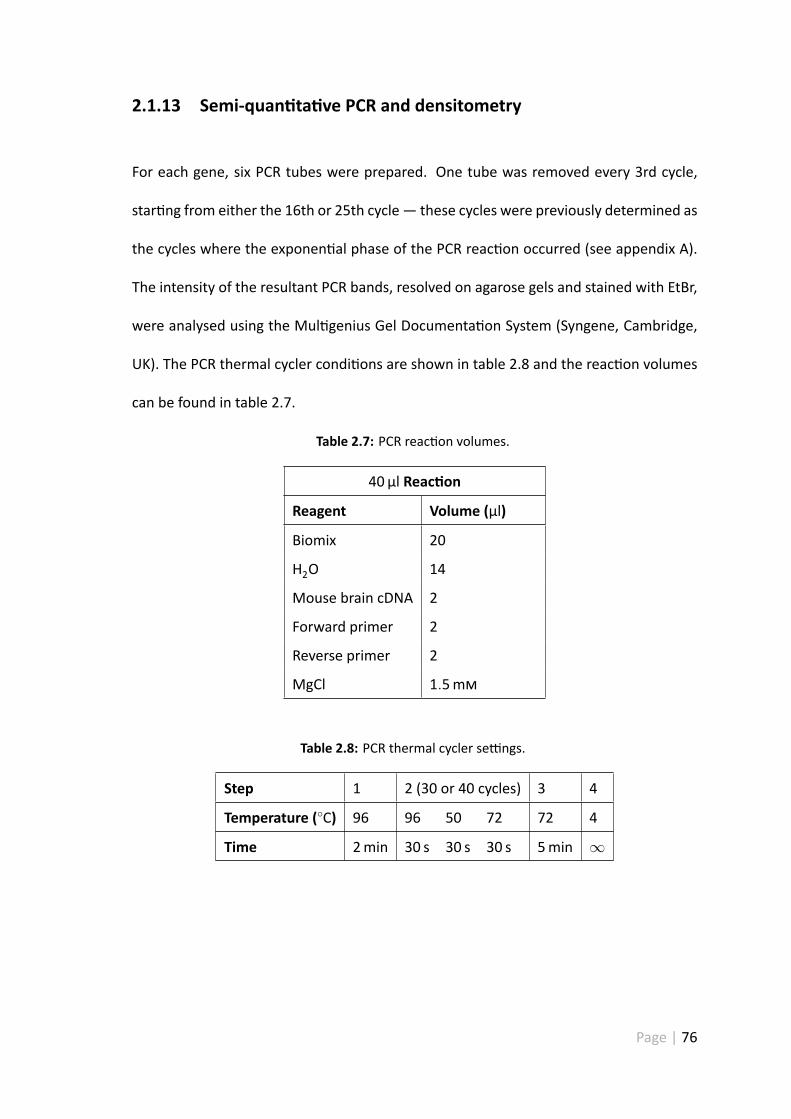
2.1.13 Semi-quan ta ve PCR and densitometry
For each gene, six PCR tubes were prepared. One tube was removed every 3rd cycle,
star ng from either the 16th or 25th cycle— these cycles were previously determined as
the cycles where the exponen al phase of the PCR reac on occurred (see appendix A).
The intensity of the resultant PCR bands, resolved on agarose gels and stained with EtBr,
were analysed using the Mul genius Gel Documenta on System (Syngene, Cambridge,
UK). The PCR thermal cycler condi ons are shown in table 2.8 and the reac on volumes
can be found in table 2.7.
Table 2.7: PCR reac on volumes.
40 µl Reac on
Reagent Volume (µl)
Biomix 20
H2O 14
Mouse brain cDNA 2
Forward primer 2
Reverse primer 2
MgCl 1.5m
Table 2.8: PCR thermal cycler se ngs.
Step 1 2 (30 or 40 cycles) 3 4
Temperature (◦C) 96 96 50 72 72 4
Time 2min 30 s 30 s 30 s 5min ∞
Page | 76
2.1.13.1 Densitometry
EtBr stained DNA bands from all genes that tested posi ve in the RGC-5 groupwere quan-
fied by densitometry using the Phore x 1D So ware (Nonlinear Dynamics, Newcastle-
upon-Tyne, UK) and normalised to the density of a glyceraldehyde 3-phosphate dehy-
drogenase (GAPDH) loading control. Unless otherwise stated, each experiment was per-
formed on 3 independent occasions. Densitometry valueswere averaged for each primer
and cycle number. The exponen al phase of each PCR reac on was determined by plot-
ng the densitometry readings on a line chart (see figure 2.3). This enabled me to es-
tablish which cycles fell within the exponen al phase of the PCR reac on. A cycle was
chosen where both PCR products fell within the exponen al phase of the reac on (e.g.
cycle 25 for mouse brain GalC and RGC-5 GalC), an example of this is shown below. Mean
densitometry values at the selected cycle number were normalised by dividing the tar-
get gene (e.g. GalC) densitometry value by the GAPDH (internal control) densitometry
value. The rela ve signal intensi es could then be compared and plo ed on a bar chart
(see figure 2.3).
Page | 77
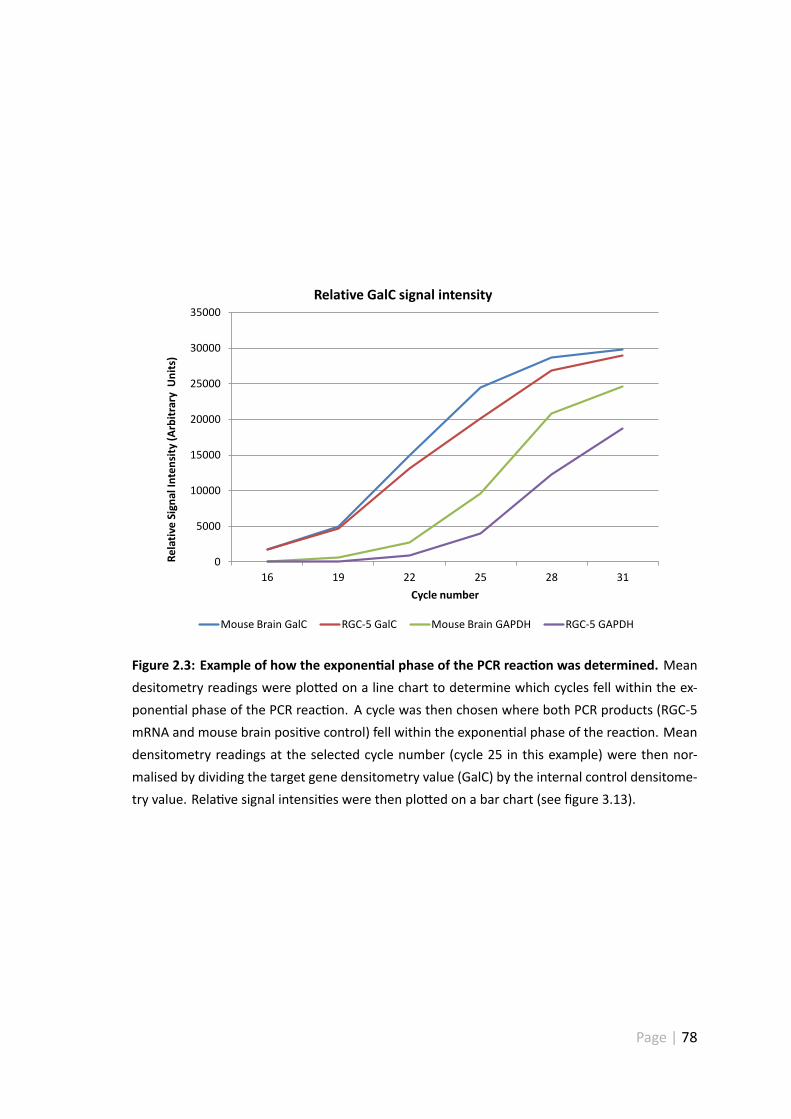
0
5000
10000
15000
20000
25000
30000
35000
16 19 22 25 28 31
Re
lati
ve
Sig
na
l In
ten
sity
(A
rbit
rary
U
nit
s)
Cycle number
Relative GalC signal intensity
Mouse Brain GalC RGC-5 GalC Mouse Brain GAPDH RGC-5 GAPDH
Figure 2.3: Example of how the exponen al phase of the PCR reac on was determined. Meandesitometry readings were plo ed on a line chart to determine which cycles fell within the ex-ponen al phase of the PCR reac on. A cycle was then chosen where both PCR products (RGC-5mRNA and mouse brain posi ve control) fell within the exponen al phase of the reac on. Meandensitometry readings at the selected cycle number (cycle 25 in this example) were then nor-malised by dividing the target gene densitometry value (GalC) by the internal control densitome-try value. Rela ve signal intensi es were then plo ed on a bar chart (see figure 3.13).
Page | 78
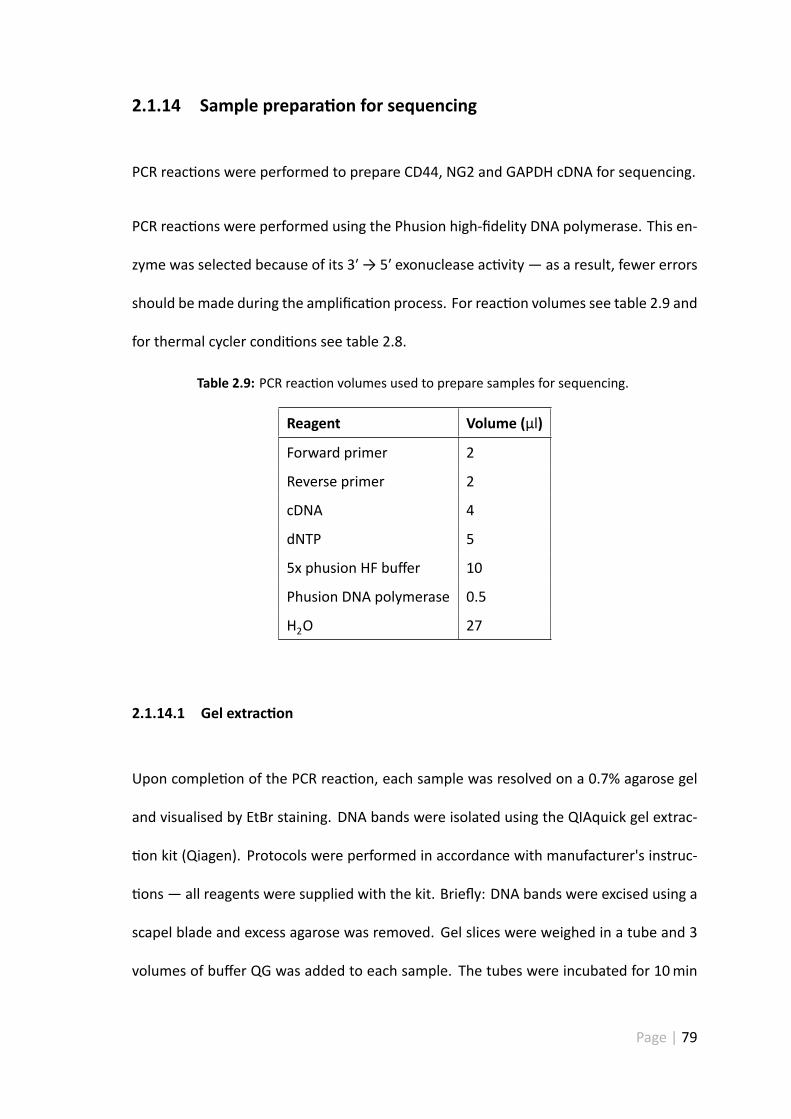
2.1.14 Sample prepara on for sequencing
PCR reac ons were performed to prepare CD44, NG2 and GAPDH cDNA for sequencing.
PCR reac ons were performed using the Phusion high-fidelity DNA polymerase. This en-
zyme was selected because of its 3ʹ → 5ʹ exonuclease ac vity — as a result, fewer errors
should bemade during the amplifica on process. For reac on volumes see table 2.9 and
for thermal cycler condi ons see table 2.8.
Table 2.9: PCR reac on volumes used to prepare samples for sequencing.
Reagent Volume (µl)
Forward primer 2
Reverse primer 2
cDNA 4
dNTP 5
5x phusion HF buffer 10
Phusion DNA polymerase 0.5
H2O 27
2.1.14.1 Gel extrac on
Upon comple on of the PCR reac on, each sample was resolved on a 0.7% agarose gel
and visualised by EtBr staining. DNA bands were isolated using the QIAquick gel extrac-
on kit (Qiagen). Protocols were performed in accordance with manufacturer's instruc-
ons — all reagents were supplied with the kit. Briefly: DNA bands were excised using a
scapel blade and excess agarose was removed. Gel slices were weighed in a tube and 3
volumes of buffer QG was added to each sample. The tubes were incubated for 10min
Page | 79
at 50 ◦C to dissolve the gel samples and 1 volume of isopropanol was added to each tube
and mixed. Samples were then transferred into a QIAquick spin (with accompanying col-
lec on tube) and centrifuged for 1min. The flow through was discarded and the spin
column was placed back within the same collec on tube. 500 µl of buffer QG was then
added to the spin column and centrifuged for 1min to remove all trace of agarose. Buffer
PE (750 µl) was then added to the column and allowed to stand for 5min, the columnwas
then washed by centrifuga on for 1min. The flow through was discarded and the col-
umn was spun for an addi onal 1min. The spin column was then placed within a new
collec on tube and the DNA was eluted by adding 50 µl of buffer EB and centrifuging for
1min at maximum speed.
2.1.14.2 DNA quan fica on
DNAconcentra onsweredeterminedby loading 2 µl of DNA into aNanodrop spectropho-
tometer (ND-1000; Wilmington, DE, USA) and measuring the absorbance of each sample
at 260 nm. The Nanodrop machine was also used to es mate sample purity — this was
achieved by measuring the 260 nm/280 nm absorbance ra o. DNA with a purity value of
<1.8 was used in all experiments.
2.1.14.3 Sample prepara on
Two samples of each of the PCR products were made up with 50 ng of DNA (volume re-
quired to give 50 ngwas calculatedwith the concentra onmeasured using the Nanodrop
machine). For each of the PCR product sample pairs, 1 µl of forward primer (10 pmol) was
Page | 80
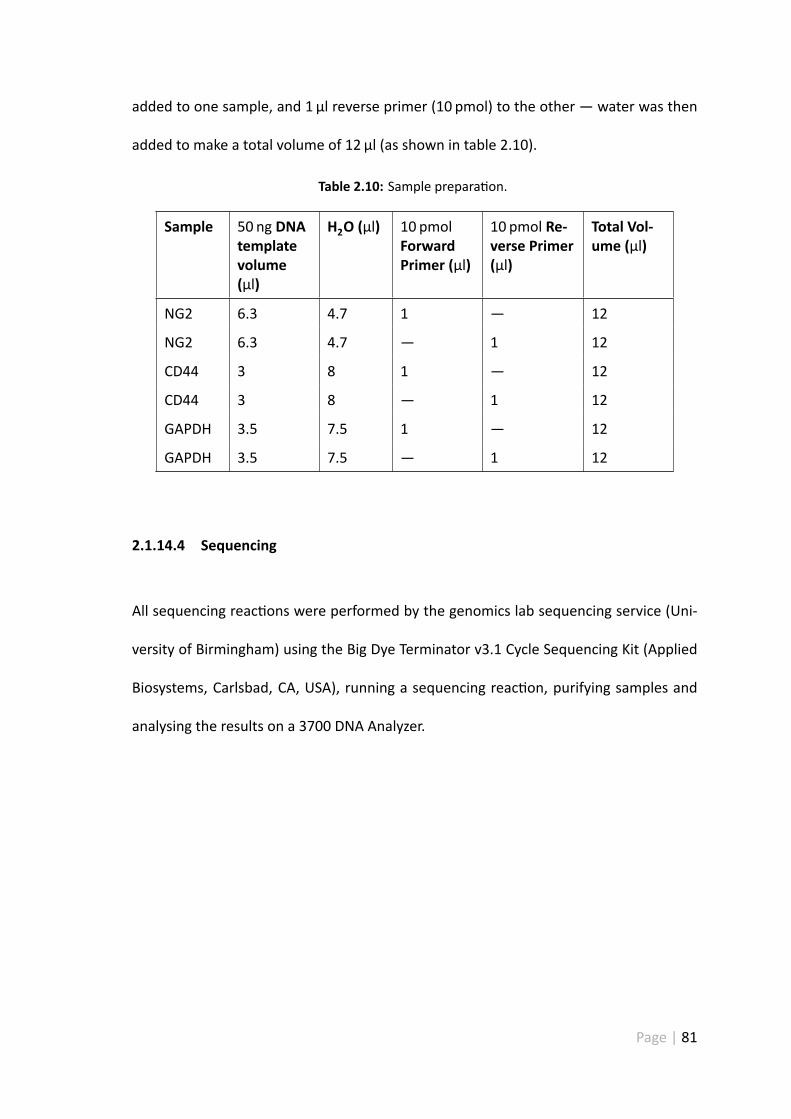
added to one sample, and 1 µl reverse primer (10 pmol) to the other — water was then
added to make a total volume of 12 µl (as shown in table 2.10).
Table 2.10: Sample prepara on.
Sample 50 ng DNAtemplatevolume(µl)
H2O (µl) 10 pmolForwardPrimer (µl)
10 pmol Re-verse Primer(µl)
Total Vol-ume (µl)
NG2 6.3 4.7 1 — 12
NG2 6.3 4.7 — 1 12
CD44 3 8 1 — 12
CD44 3 8 — 1 12
GAPDH 3.5 7.5 1 — 12
GAPDH 3.5 7.5 — 1 12
2.1.14.4 Sequencing
All sequencing reac ons were performed by the genomics lab sequencing service (Uni-
versity of Birmingham) using the Big Dye Terminator v3.1 Cycle Sequencing Kit (Applied
Biosystems, Carlsbad, CA, USA), running a sequencing reac on, purifying samples and
analysing the results on a 3700 DNA Analyzer.
Page | 81
2.2 In vivo techniques
2.2.1 Animal surgery
Adult male Sprague Dawley rats (150 g to 250 g) were used for AAV2 experiments to as-
sess transfec on rates, RGC survival and axon regenera on. All procedures were per-
formed in accordance with the regula ons of the UK Animals (Scien fic Procedures) Act
1986 under a Home Office Licence. Surgeries were performed by Professor Mar n Berry
— anaesthesia and analgesia were administered by myself.
Inhala on anaesthesia was induced with an ini al dose of 4% isoflurane (Abbo Labo-
ratories Ltd, Kent, UK) and maintained at 3% during surgery. Animals received a sub-
cutaneous injec on of the analgesic Buprenorphine (Na onal Ve nary Supplies, Stoke-
on-Trent, UK) at the start of the procedure at a dose of 0.03mg kg−1. An ocular lubricant
(Lacri-Lube, AlleganHighWycombe, UK)was also applied to prevent corneal dehydra on.
2.2.1.1 Op c nerve crush
A midline cutaneous incision was made to access the ON intraorbitally, the skin was re-
flected over the upper lid to expose the orbital margin and the superficial fascia was
removed. A ver cal incision was made through the temporalis fascia and temporalis
muscle and extended rostrally over the orbital margin without damaging the supraor-
bital vessels. The supraorbital neurovascular bundle was clamped using forceps and the
Harderian gland exposed by making an incision in the orbital fascia between the clamp
Page | 82
sites. The gland was reflected rostrally to expose the superior and lateral rectus mus-
cles. Retractors were placed between the superior rectus and ON as well as between
the lateral rectus muscle and ON to allow easy access. The ON was exposed by excising
the retractor bulbi muscle, dural sheath, and arachnoid. Care was taken not to sever the
central re nal artery which runs through the dural sheath medially. The ON was crushed
2mm from the laminal cribrosa using blunt forceps to transect all axonswhilst leaving the
sheath intact. The retractor bulbi, rectus muscles and Harderian gland were reposi oned
around the nerve and the skin margins sutured.
2.2.2 Intravitreal injec ons
A glass micropipe e was loaded with a 10 µl volume of test reagent and inserted into
the vitreous body via the sclera immediately posterior to the ora serrata. The pipe e
was posi oned so that the p was inserted between the lens and the re na. The mi-
cropipe e was connected to a syringe before slowly injec ng the appropriate solu on
into the vitreous. The pipe e was then withdrawn slowly to prevent reflux — care was
taken throughout the procedure not to damage the lens.
2.2.3 AAV2-CNTF-hrGFP,AAV2-eGFP andAAV2-CNTF-shRhoA-hrGFP de-
livery and RGC survival counts
Rats received an intravitreal injec on of 1× 10¹¹ vg/10µlAAV2-CNTF-hrGFP,AAV2-CNTF-
shRhoA-hrGFP or AAV2-eGFP in combina on with 0.0002% Pronase-E 30 d prior to ONC
Page | 83
(see sec on 2.2.1.1). Eyes were prepared for histological examina on as in sec on 2.2.4.
To determine whether intravitreal injec on of AAV2-CNTF-hrGFP or AAV2-CNTF-shRhoA-
hrGFP could protect RGC from cell death, 10 re nal sec ons were randomly selected
for histological examina on. Re nal sec ons were stained with haematoxylin and eosin
(H&E) and images were captured using an upright microscope (Carl Zeiss Meditec, Dublin
CA). The number of RGC occupying a 550 µm × 500 µm field of view was counted and
compared against an uninjured control. n = 3 for each treatment group (30 sec ons in
total for each treatment group).
2.2.4 Tissue Prepara on for Histology
Animals were killed by rising concentra ons of CO2 and the ssue fixed by perfusion with
4% paraformaldehyde (PFA) (TAAB Laboratories, Berkshire, UK). Eyes and op c nerves
were removed and post fixed in PFA for 2 h at 4 ◦C. Tissue was then washed in PBS for
10min and then passed sequen ally through sucrose gradients (overnight at 4 ◦C in 10%,
20% and 30% sucrose in PBS) to cryoprotect. Eyes and ON were then blo ed with filter
paper (to remove excess PBS), embedded in OCT Embedding Medium (R.A. Lamb Labo-
ratory), frozen rapidly on dry ice and stored at−80 ◦C. Eye and ON cryosec ons (15 µm)
were cut on a cryostat (Bright Instrument Company, Hun ngdon, UK) and mounted on
either Superfrost Plus or Extra Adhesive slides microscope slides.
Page | 84
2.2.5 Re nal wholemount counts
To assess survival, RGC were retrogradely labelled with a 4% solu on of flourogold (FG)
(FG, hydroxys lbamidine, Cambridge Bioscience, Cambridge, UK). The ON was accessed
intraorbitally and a 2 µl volume of tracer was injected into the ON proximal to the crush
site 48 h prior to ssue harves ng. A er the eyes had been harvested, the re na was ex-
posed by carefully removing the cornea, iris diaphragm, lens and a ached vitreous. The
remaining eye cup was then submerged in 4% PFA for 2 h to post fix the ssue. The re na
was then removed from the eye cup, cut into 4 quadrants and fla ened out onto a slide
using dry paintbrushes. Coverslips were mounted with Vectamount (without DAPI) to
preserve immunoflourescence. Wholemounted re nae were viewed with an Axioplan-2
fluorescent microscope (Carl Zeiss Meditec, Dublin CA) and images were captured using
Axiovision so ware (Axiovision; Carl Zeiss Meditec). The radial centre was determined
for each quadrant and 4 images were captured along this axis. FG-posi ve RGC were
counted and averaged per wholemount. Results were expressed as the mean number of
RGC/mm2 ± SEM of 3 re nae for each treatment group. For a diagramma c representa-
on of this sampling technique see figure 2.4.
2.2.6 Re nal ganglion cell transduc on
To determine whether the addi on of Pronase-E could increase AAV2 transduc on effi-
ciency, animals received a 10 µl intravitreal injec on of AAV-GFP (1× 10¹¹ vg/10µl) with
and without 0.0002% Pronase-E (see sec on 2.2.2). A er the eyes had been harvested
the re na was exposed by carefully removing the cornea, iris diaphragm, lens and at-
Page | 85
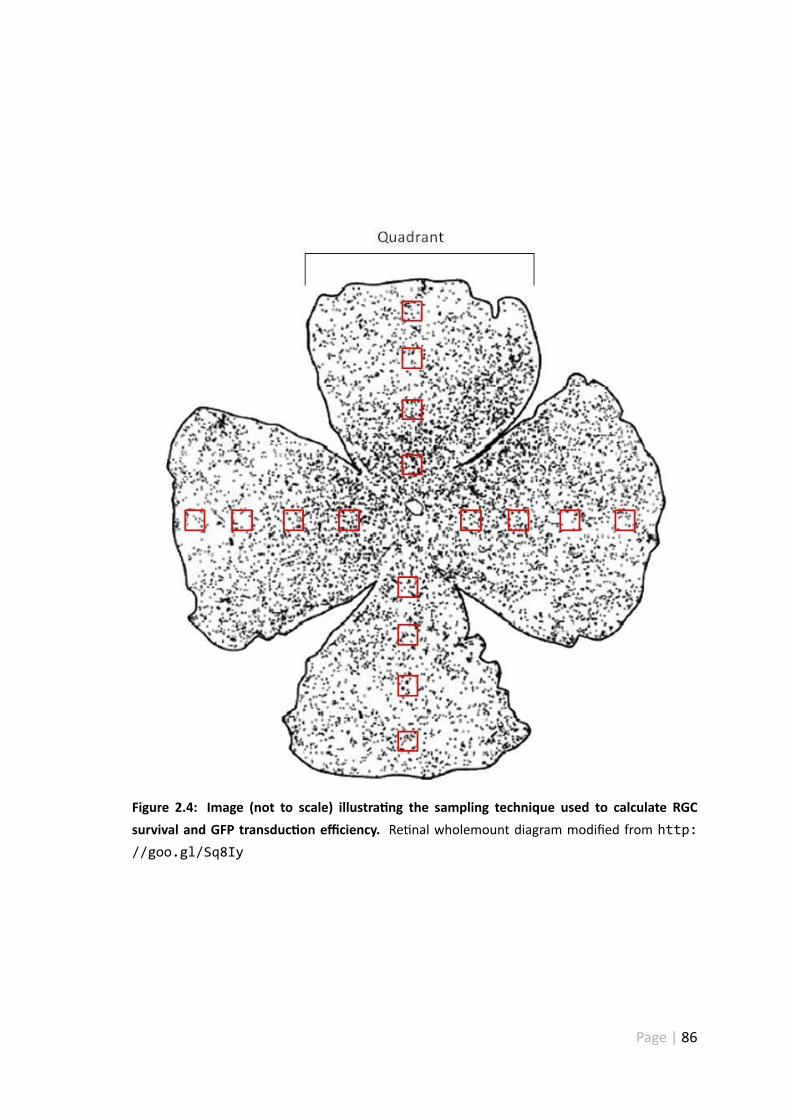
Figure 2.4: Image (not to scale) illustra ng the sampling technique used to calculate RGCsurvival and GFP transduc on efficiency. Re nal wholemount diagram modified from http://goo.gl/Sq8Iy
Page | 86
tached vitreous. The remaining eye cup was then submerged in 4% PFA for 2 h to post
fix the ssue. The re na was then removed from the eye cup, cut into 4 quadrants and
fla ened out onto a slide using dry paintbrushes. Coverslips were mounted with Vecta-
mount (without DAPI) to preserve immunoflourescence. Wholemounted re nae were
viewed with an Axioplan-2 fluorescent microscope (Carl Zeiss Meditec, Dublin CA) and
images were captured using Axiovision so ware (Axiovision; Carl Zeiss Meditec). The
radial centre was determined for each quadrant and 4 images were captured along this
axis. GFP posi ve RGC were counted and averaged per wholemount. Results were ex-
pressed as the mean number of RGC/mm2 ± SEM of 3 re nae for each treatment group.
For diagramma c representa on of this sampling technique see figure 2.4.
2.2.7 Quan fica on of RGC axon regenera on in vivo
Quan fica on of RGC axon regenera on was based upon a method described by others
(Leon, et al. 2000, Lorber, et al. 2005). The number of GAP-43 posi ve axons extending
100 µm, 200 µm, 400 µm, 800 µm and 1200 µm from the lesion core was counted. The
cross sec onal width of the ON was measured at the point at which the counts were
taken. This was used to calculate the number of axons/mm width. Unless otherwise
stated, this value was averaged over 3 sec ons.∑
ad (the total number of axons extend-
ing distance d in an ON with radius r) was calculated and results were expressed as the
mean from 3 op c nerves per treatment group ± SEM.
Page | 87
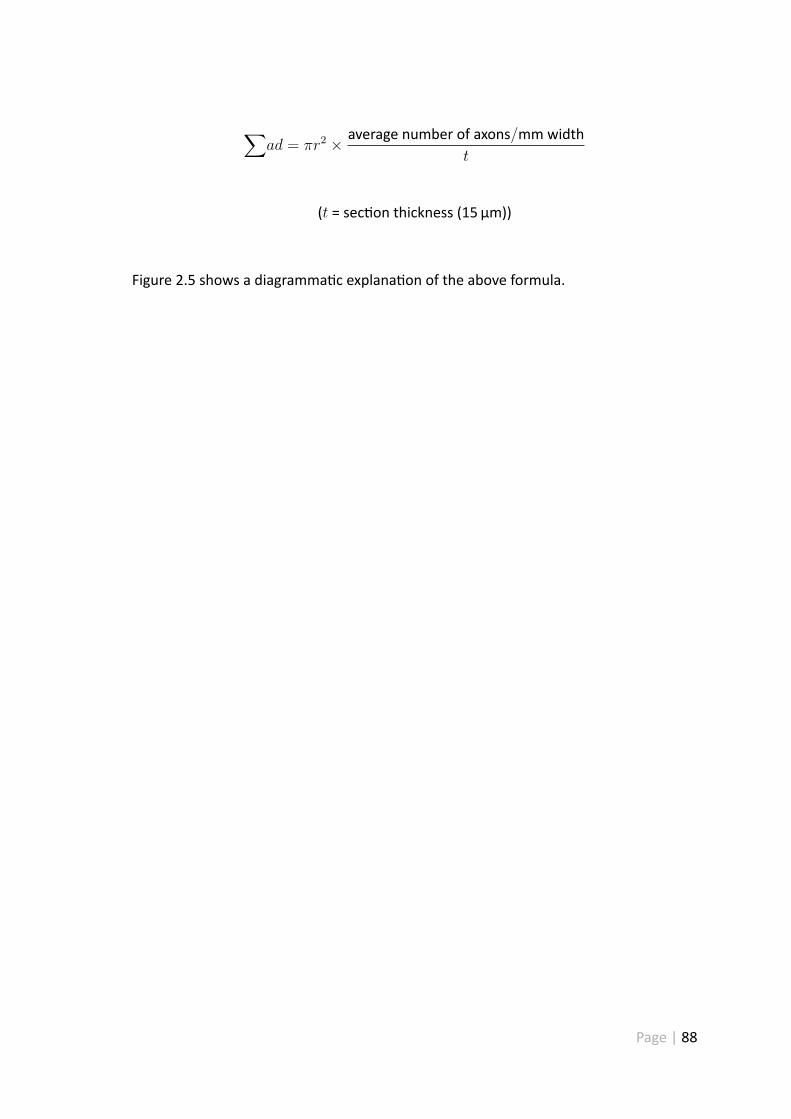
∑ad = πr2 × average number of axons/mmwidth
t
(t = sec on thickness (15 µm))
Figure 2.5 shows a diagramma c explana on of the above formula.
Page | 88
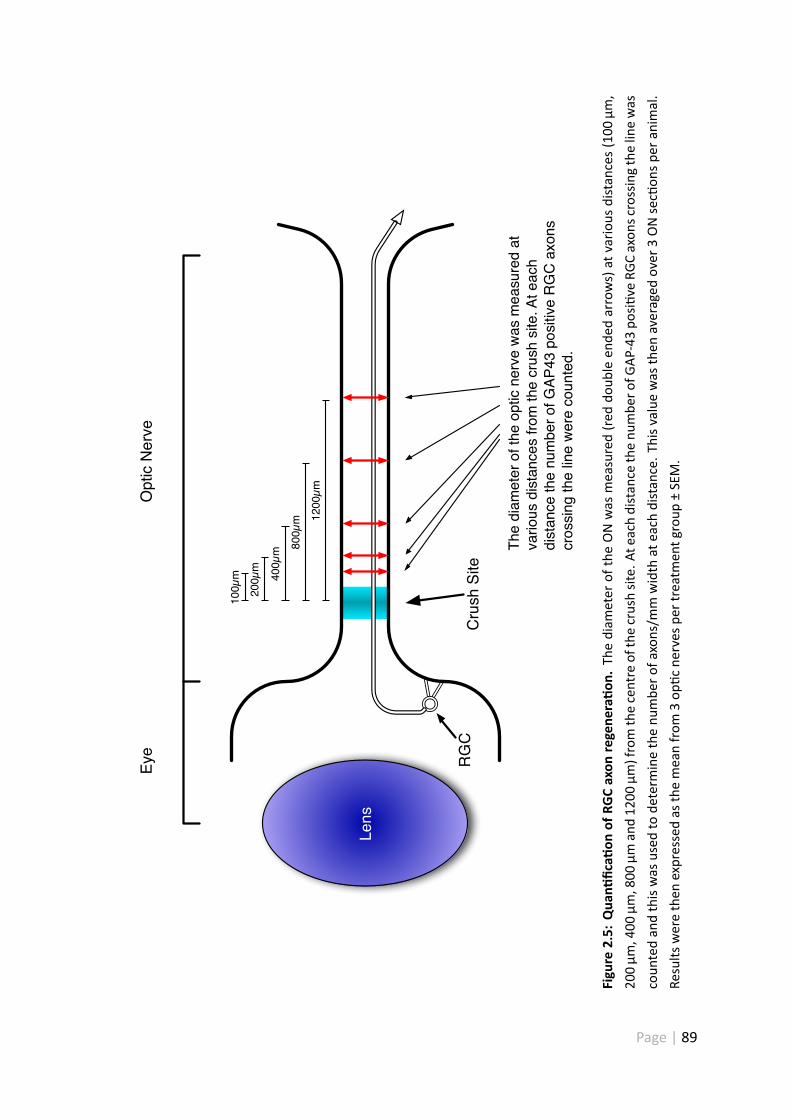
Lens
Eye
Opt
ic N
erve
RG
CC
rush
Site
The
diam
eter
of t
he o
ptic
ner
ve w
as m
easu
red
at
vario
us d
ista
nces
from
the
crus
h si
te. A
t eac
h di
stan
ce th
e nu
mbe
r of G
AP43
pos
itive
RG
C a
xons
cr
ossi
ng th
e lin
e w
ere
coun
ted.
100µ
m 400µ
m
200µ
m
800µ
m 1200
µm
Figure
2.5:
Qua
nfica
onof
RGCaxon
regene
raon
.Th
ediam
eter
oftheONwas
measured(red
doub
leen
dedarrows)at
vario
usdistan
ces(100
µm,
200µm
,400
µm,800
µman
d12
00µm
)fromthecentre
ofthecrushsite.
Ateach
distan
cethenu
mbe
rofG
AP-43po
sive
RGCaxon
scrossingthelinewas
coun
tedan
dthiswas
used
tode
term
inethenu
mbe
rofa
xons/m
mwidth
ateach
distan
ce.T
hisv
alue
was
then
averaged
over
3ONsecon
sper
anim
al.
Results
werethen
expressedas
themeanfrom
3op
cne
rves
pertreatmen
tgroup
±SEM.
Page | 89
2.2.8 Sta s cal Analysis
All sta s cal analysis was performed using the SPSS (IBM) so ware package. Sta s cal
analysis was performed to ascertainwhether differences seen between treatment groups
were real, due experimental error or random chance. An independent t-test was used to
compare data from 2 experimental treatment groups. A one-way analysis of variance
(ANOVA) in combina on with the Gains Howell post-hoc test was used to compare data
from mul ple treatment groups. This test was performed to determine if the mean of 2
or more treatment groups was significantly different from that of the untreated controls.
Parametric tests were chosen based on the assump on that the data followed a normal
distribu on. Data was considered to be sta s cally significant if the probability (p) was
less than the specified significance levels (where *p ≥ 0.05, **p ≥ 0.05, ***p ≥ 0.001).
Page | 90
CHAPTER 3
CHARACTERISATION OF THE RGC-5 CELL
LINE
Page | 91
3.1 The use of cell lines in biological research
Cell lines have many advantages over primary cell cultures. Cell lines tend to represent
a homogeneous popula on of cells — giving them the advantage of genera ng more
reproducible results. As cell lines aremito cally ac ve they are rela vely easy tomaintain
and can be passaged for a long, or indefinite, amount of me. This provides us with the
means to produce and harvest high yields of cells. The use of cell lines can also limit
the cost of using animals as a source of material which in turns minimises the variability
inherent in using such animals.
Cell lines also have some disadvantages — they need to be fully characterised before
they can be used as a subs tute for primary cells. This involves determining whether the
cells express the same transcrip on factors, signallingmolecules, receptors, neurotrophic
factors and proteins present in the primary cells. A further disadvantage is that with
increasing me and passage number, cell lines may incur morphological changes as well
as changes in gene expression.
3.2 RGC-5 cell line
The use of in vitro assays is an important tool for elucida ng the mechanisms involved in
regenera ve failure. Primary re nal cultures are commonly used to achieve this, however
RGC are notoriously difficult to purify making it difficult to dis nguish between neuronal
and glial based ac ons. The use of an RGC cell line would eliminate this complica on and
facilitate the analysis of neuronal specific responses.
Page | 92
The RGC-5 cell line was first introduced in 2001 as an immortalised cell line generated
by isola ng RGC from postnatal day 1 Sprague Dawley rats and transforming them us-
ing ψ2EIA virus (R.R.Krishnamoorthy, et al. 2000). The cell line was deemed to be of
re nal ganglion cell origin based upon it tes ng posi ve for a number of markers associ-
ated with RGC e.g. Thymocyte differen a on an gen 1 (Thy-1), Brn-3C, Neuri n, NMDA
receptor, GABA-B receptor, synaptophysin, neurotrophic factors and their respec ve re-
ceptors (R.R.Krishnamoorthy et al. 2000). They were not found to express GFAP which is
a marker of astrocytes (R.R.Krishnamoorthy et al. 2000).
Since their introduc on, more than 100 research reports have used RGC-5 cells as a
subs tute for primary RGC. Many of these reports use RGC-5 cells to model apopto c
events induced by hypoxia (Li, et al. 2011, Sato, et al. 2010), serum depriva on (Charles,
et al. 2005), oxida ve stress (Jung, et al. 2010, Koriyama, et al. 2009), glutamate excito-
toxicity (Harper, et al. 2009, Bergen, et al. 2009, Tchedre & Yorio 2008) and hydrosta c
pressure (Agar, et al. 2006). Other publica ons have used RGC-5 cells to inves gate dif-
feren a on (R.R.Krishnamoorthy et al. 2000, Tchedre & Yorio 2008, Frasse o, et al. 2006,
Lieven, et al. 2007, Schwechter, et al. 2007), calcium signalling (Tchedre& Yorio 2008, Luo,
et al. 2005) and neuroprotec on (Koriyama et al. 2009, Harper et al. 2009, Tchedre &
Yorio 2008).
The purpose of this study was to characterise the RGC-5 cell line to determine whether
it would be a suitable subs tute for primary re nal cultures.
Page | 93
3.3 Aims
1. Characterise the RGC-5 cell line.
2. Establish whether the RGC-5 cell line can be used as a subs tute for primary RGC.
3. Determine whether Staurosporine could be used to differen ate the RGC-5 cell
line.
4. Look at the morphological dynamics of Staurosporine mediated RGC-5 differen a-
on.
3.4 Results
The use of cells lines in biological research can be a very useful tool for inves ga ng the
molecularmechanismswhich underlie CNS injury. However, comparisonsmade between
mito c cell lines (e.g. the RGC-5 cell line) and post-mito c neuronal cell popula ons (e.g.
primary RGC) are o en problema c, since they o en don’t have the same characteris cs
as primary neurones.
As a result it would be useful to find a means of differen a ng the RGC-5 cell line so that
more accurate comparisons can be made between these two cell popula ons. In recent
years, several differen a ng agents have been tested on the RGC-5 cell line. One such
reagent is Staurosporine, a broad spectrum kinase inhibitor which is reported to cause
cell cycle arrest, somal rounding and process extension (Frasse o et al. 2006). In addi on
to this, Staurosporine treated RGC-5 cells are believed to take on a more neuronal phe-
Page | 94
notype as evidenced by an increased expression of neuronal markers and establishment
of outward rec fying channels (Frasse o et al. 2006).
To achieve this, a Staurosporine dose response experiment was performed and RGC-
5 morphological measurements were taken (see sec on 2.1.2.1). The purpose of this
was to find out which concentra on was op mal in terms of process extension, process
length (figures 3.1a and 3.1b), process number (figure 3.2), process branching (figure 3.3)
and toxicity (figure 3.4). The evalua on of toxicity was par cularly important since Stau-
rosporine is commonly used to ini ate apoptosis at high doses (Manns, et al. 2011).
3.4.1 Staurosporine treatment induces process extension
Approximately 5000 RGC-5 cells per well were plated and given 2 h to adhere. Once the
2 h had passed the reagents were added and le for a further 24 h to induce differen a-
on, finally the cells were fixed and analysed.
For the purpose of quan fica on a process was defined as any cellular projec on greater
than one soma in length. The length of each cellular projec on was measured using
Image Pro® and expressed for each treatment group as ± SEM from 60 cells.
Results demonstrate that increasing the concentra on of Staurosporine led to increases
in the length of the longest process (and processes length/cell), with a concentra on
of Staurosporine between 100 n and 1.78 µ favouring op mum process outgrowth.
There was a sta s cal significance between Staurosporine treatment groups and con-
trols, ***p ≤ 0.001. Dimethyl Sulfoxide (DMSO) treatment did not induce process out-
Page | 95
growth and there was no sta s cal significance between DMSO treatment groups and
control.
Page | 96
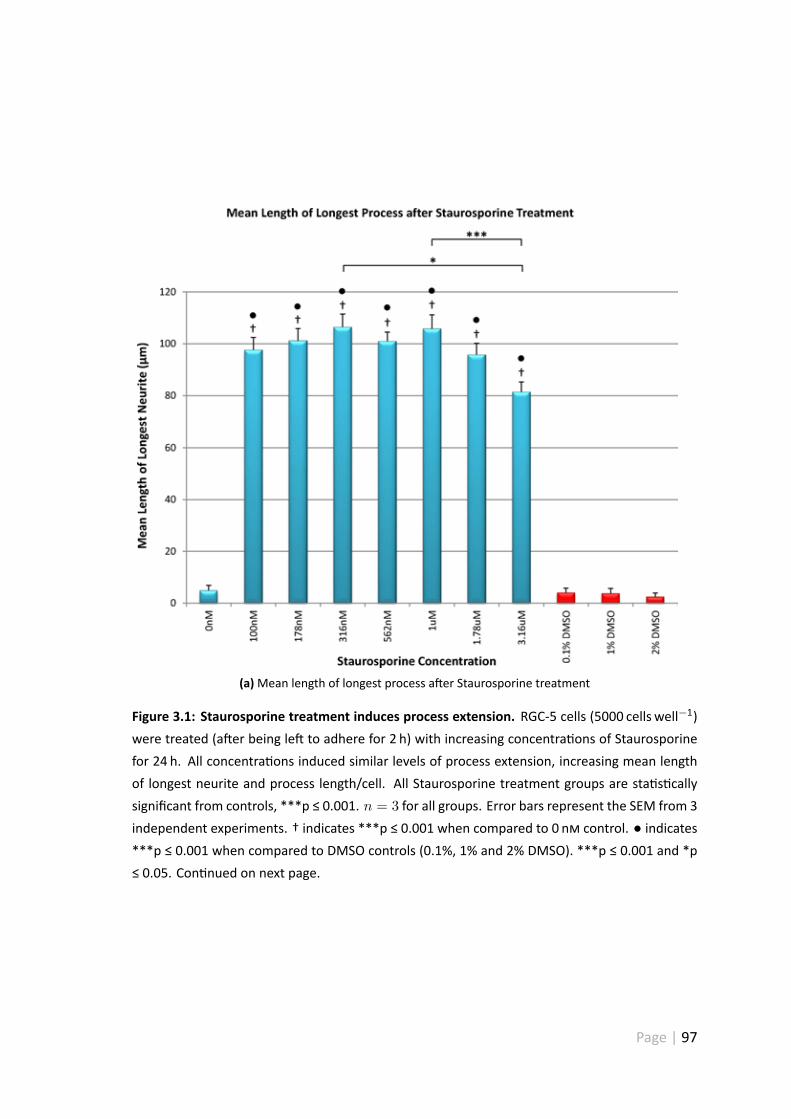
(a)Mean length of longest process a er Staurosporine treatment
Figure 3.1: Staurosporine treatment induces process extension. RGC-5 cells (5000 cells well−1)were treated (a er being le to adhere for 2 h) with increasing concentra ons of Staurosporinefor 24 h. All concentra ons induced similar levels of process extension, increasing mean lengthof longest neurite and process length/cell. All Staurosporine treatment groups are sta s callysignificant from controls, ***p ≤ 0.001. n = 3 for all groups. Error bars represent the SEM from 3independent experiments. † indicates ***p ≤ 0.001 when compared to 0 n control. ● indicates***p ≤ 0.001 when compared to DMSO controls (0.1%, 1% and 2% DMSO). ***p ≤ 0.001 and *p≤ 0.05. Con nued on next page.
Page | 97
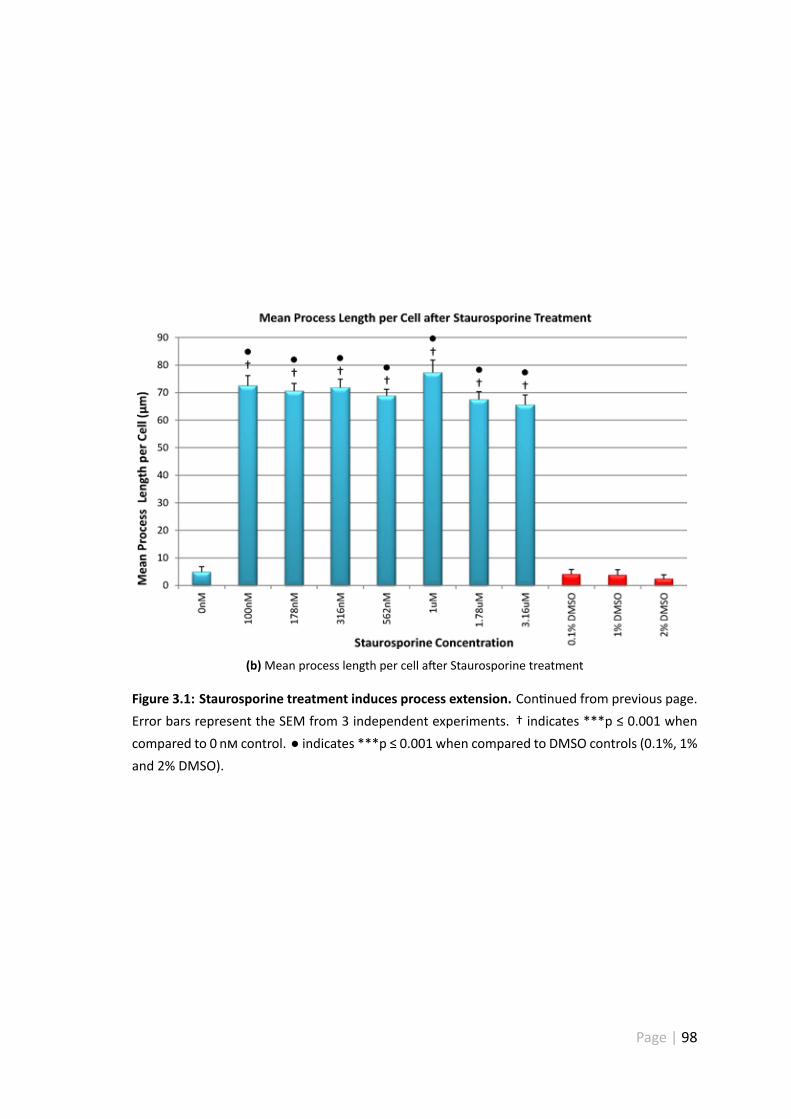
(b)Mean process length per cell a er Staurosporine treatment
Figure 3.1: Staurosporine treatment induces process extension. Con nued from previous page.Error bars represent the SEM from 3 independent experiments. † indicates ***p ≤ 0.001 whencompared to 0 n control. ● indicates ***p ≤ 0.001 when compared to DMSO controls (0.1%, 1%and 2% DMSO).
Page | 98
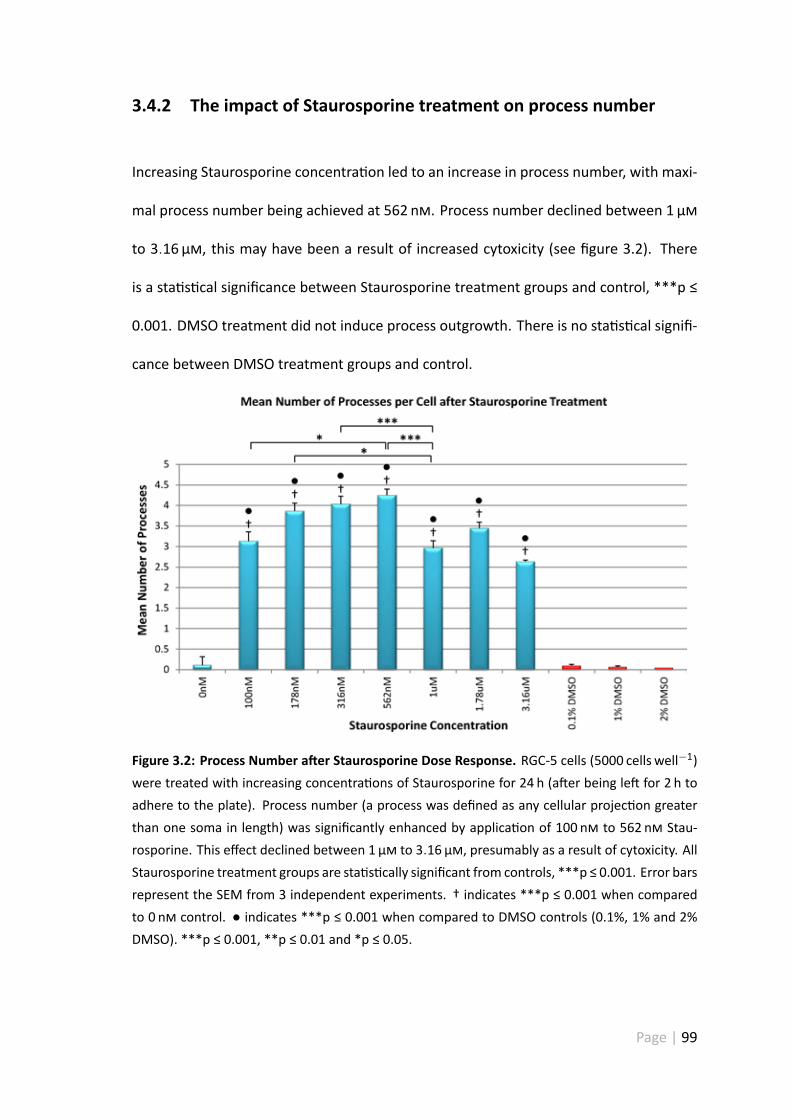
3.4.2 The impact of Staurosporine treatment on process number
Increasing Staurosporine concentra on led to an increase in process number, with maxi-
mal process number being achieved at 562 n . Process number declined between 1 µ
to 3.16 µ , this may have been a result of increased cytoxicity (see figure 3.2). There
is a sta s cal significance between Staurosporine treatment groups and control, ***p ≤
0.001. DMSO treatment did not induce process outgrowth. There is no sta s cal signifi-
cance between DMSO treatment groups and control.
Figure 3.2: Process Number a er Staurosporine Dose Response. RGC-5 cells (5000 cells well−1)were treated with increasing concentra ons of Staurosporine for 24 h (a er being le for 2 h toadhere to the plate). Process number (a process was defined as any cellular projec on greaterthan one soma in length) was significantly enhanced by applica on of 100 n to 562 n Stau-rosporine. This effect declined between 1 µ to 3.16 µ , presumably as a result of cytoxicity. AllStaurosporine treatment groups are sta s cally significant from controls, ***p ≤ 0.001. Error barsrepresent the SEM from 3 independent experiments. † indicates ***p ≤ 0.001 when comparedto 0 n control. ● indicates ***p ≤ 0.001 when compared to DMSO controls (0.1%, 1% and 2%DMSO). ***p ≤ 0.001, **p ≤ 0.01 and *p ≤ 0.05.
Page | 99
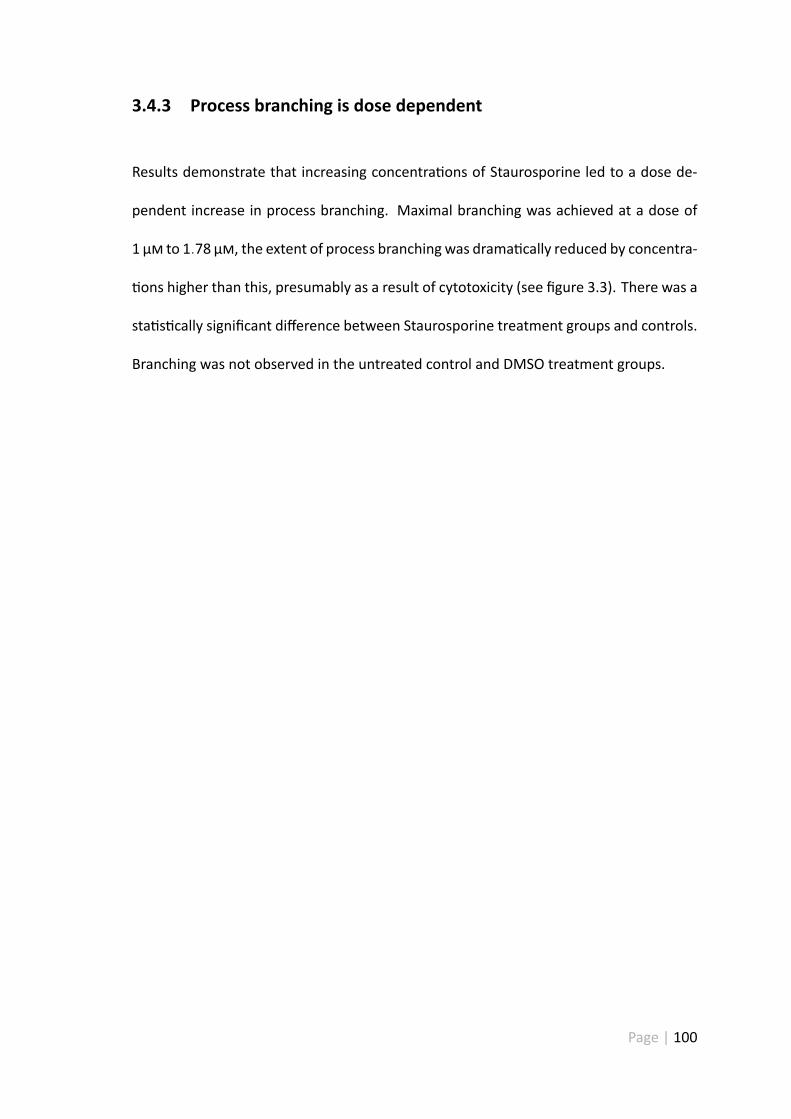
3.4.3 Process branching is dose dependent
Results demonstrate that increasing concentra ons of Staurosporine led to a dose de-
pendent increase in process branching. Maximal branching was achieved at a dose of
1 µ to 1.78 µ , the extent of process branching was drama cally reduced by concentra-
ons higher than this, presumably as a result of cytotoxicity (see figure 3.3). There was a
sta s cally significant difference between Staurosporine treatment groups and controls.
Branching was not observed in the untreated control and DMSO treatment groups.
Page | 100
Figure 3.3: Process Branching is Dose Dependent. RGC-5 cells (5000 cells well−1) were exposedto increasing concentra ons of Staurosporine for 24 h (a er being le for 2 h to adhere to theplate). The extent of process branching was posi vely correlated with Staurosporine concentra-on. Process branching (where a process was defined as any cellular projec on longer than one
soma) dras cally declines a er exposure to 3.16 µ . Branching is absent from the untreated con-trol and DMSO groups. All Staurosporine treatment groups are sta s cally significant from con-trols. Error bars represent the SEM from 3 independent experiments. † indicates ***p ≤ 0.001when compared to 0 n control. ● indicates ***p ≤ 0.001 when compared to DMSO controls(0.1%, 1% and 2% DMSO). ‼ indicates ***p ≤ 0.001 when compared to 100 n Staurosporinetreatment group. ***p ≤ 0.001, **p ≤ 0.01 and *p ≤ 0.05.
Page | 101
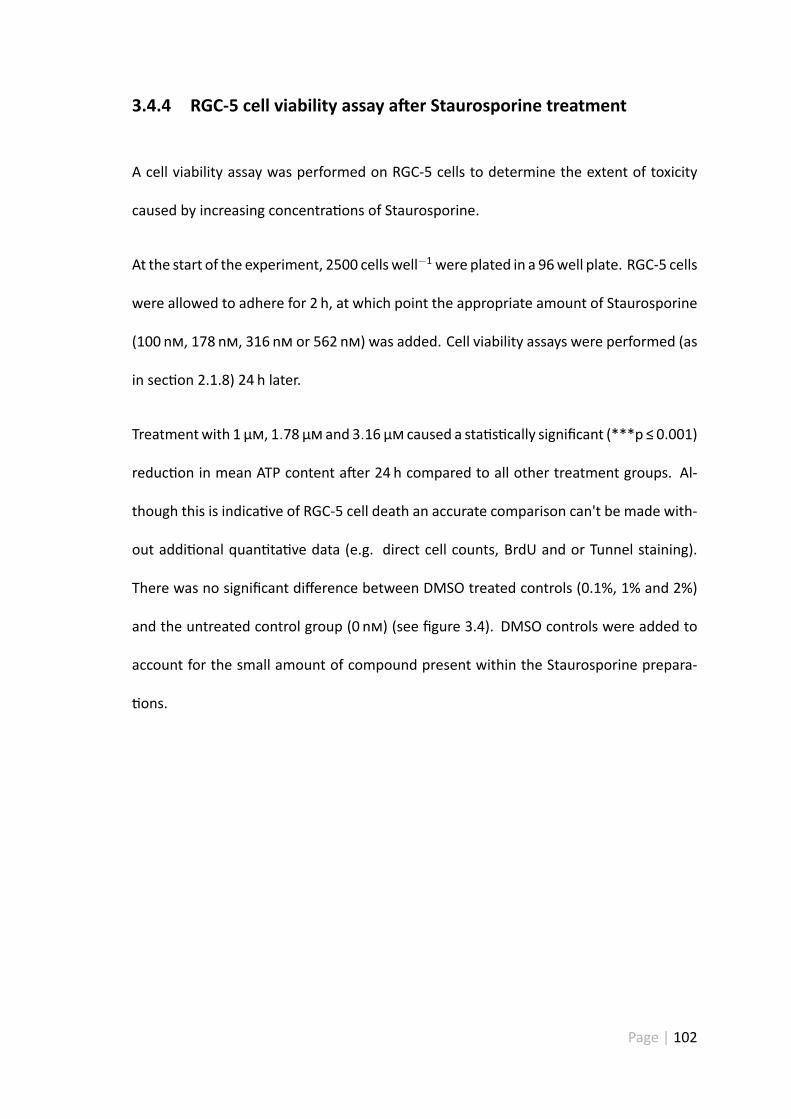
3.4.4 RGC-5 cell viability assay a er Staurosporine treatment
A cell viability assay was performed on RGC-5 cells to determine the extent of toxicity
caused by increasing concentra ons of Staurosporine.
At the start of the experiment, 2500 cells well−1were plated in a 96well plate. RGC-5 cells
were allowed to adhere for 2 h, at which point the appropriate amount of Staurosporine
(100 n , 178 n , 316 n or 562 n ) was added. Cell viability assays were performed (as
in sec on 2.1.8) 24 h later.
Treatmentwith 1 µ , 1.78 µ and 3.16 µ caused a sta s cally significant (***p ≤ 0.001)
reduc on in mean ATP content a er 24 h compared to all other treatment groups. Al-
though this is indica ve of RGC-5 cell death an accurate comparison can't be made with-
out addi onal quan ta ve data (e.g. direct cell counts, BrdU and or Tunnel staining).
There was no significant difference between DMSO treated controls (0.1%, 1% and 2%)
and the untreated control group (0 n ) (see figure 3.4). DMSO controls were added to
account for the small amount of compound present within the Staurosporine prepara-
ons.
Page | 102
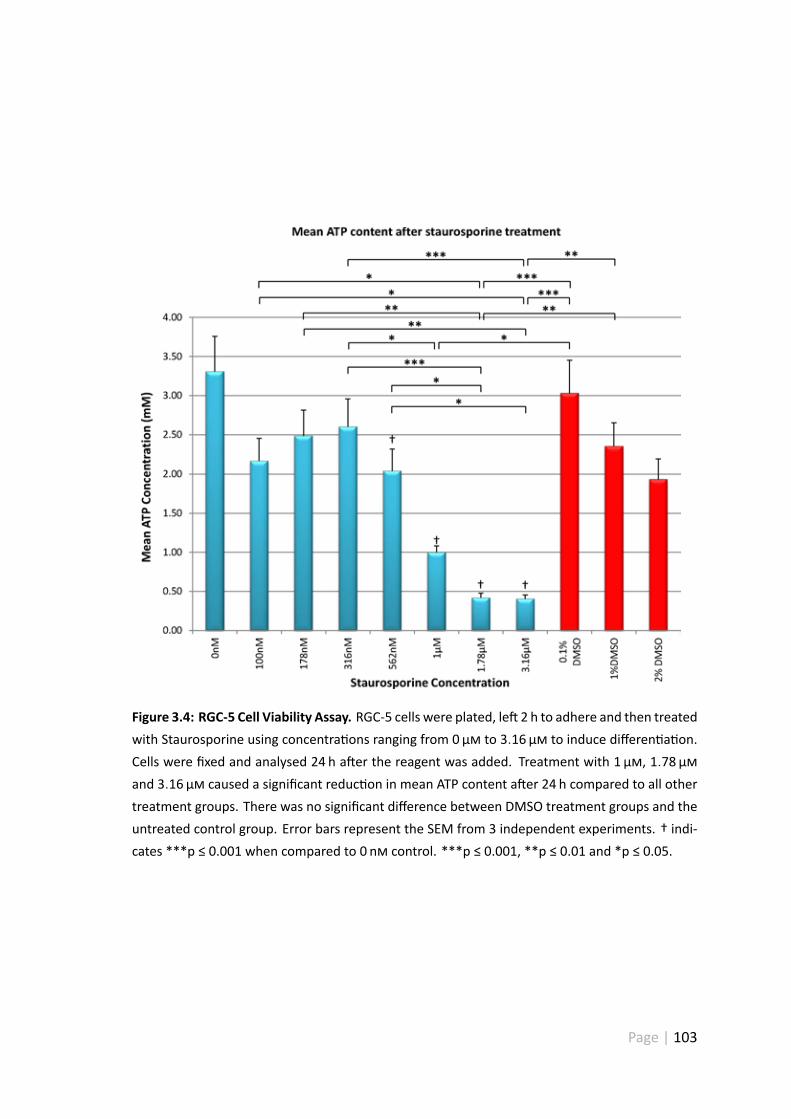
Figure 3.4: RGC-5 Cell Viability Assay. RGC-5 cells were plated, le 2 h to adhere and then treatedwith Staurosporine using concentra ons ranging from 0µ to 3.16 µ to induce differen a on.Cells were fixed and analysed 24 h a er the reagent was added. Treatment with 1 µ , 1.78 µand 3.16 µ caused a significant reduc on in mean ATP content a er 24 h compared to all othertreatment groups. There was no significant difference between DMSO treatment groups and theuntreated control group. Error bars represent the SEM from 3 independent experiments. † indi-cates ***p ≤ 0.001 when compared to 0 n control. ***p ≤ 0.001, **p ≤ 0.01 and *p ≤ 0.05.
Page | 103
3.4.5 Representa ve images of the Staurosporine dose response ex-
periment
RGC-5 cells were plated (5000 cells well−1) onto chamber slides (BD Biosciences, Oxford,
UK) and allowed to adhere for 2 h. The cells were then treated with increasing concen-
tra ons (0 n , 100 n , 178 n , 562 n , 1 µ , 1.78 µ , 3.16 µ ) of Staurosporine to de-
termine an op mal dose for differen a on. A er 24 h the cells were fixed and visualised
by βIII-Tubulin immunostaining (shown in figure 3.5 as green). Somal rounding and pro-
cess extension was evident in all Staurosporine treatment (see figure 3.5B-H and figures
3.2, 3.3, 3.4 for quan fica on) groups a er 24 h. In contrast, fewer processes (examples
highlighted with a red arrow in figure 3.5) were present in all control groups (figure 3.5A,
3.5I-K) and the cell soma of these cells (examples highlighted with a white arrow in figure
3.5) were markedly fla er – DMSO was included as a control to account for the small
amount of compound present within the Staurosporine solu on. Increasing concentra-
ons of Staurosporine led to a dose dependent increase in process branching (see figure
3.5A-H and figure 3.3, where a process was defined as any cellular projec on which was
longer than one cell soma. Fewer cells were present at higher Staurosporine concentra-
ons - this was likely a result of toxicity. As expected no background staining was evident
in the no primary control group (see figure 3.5L).
Page | 104
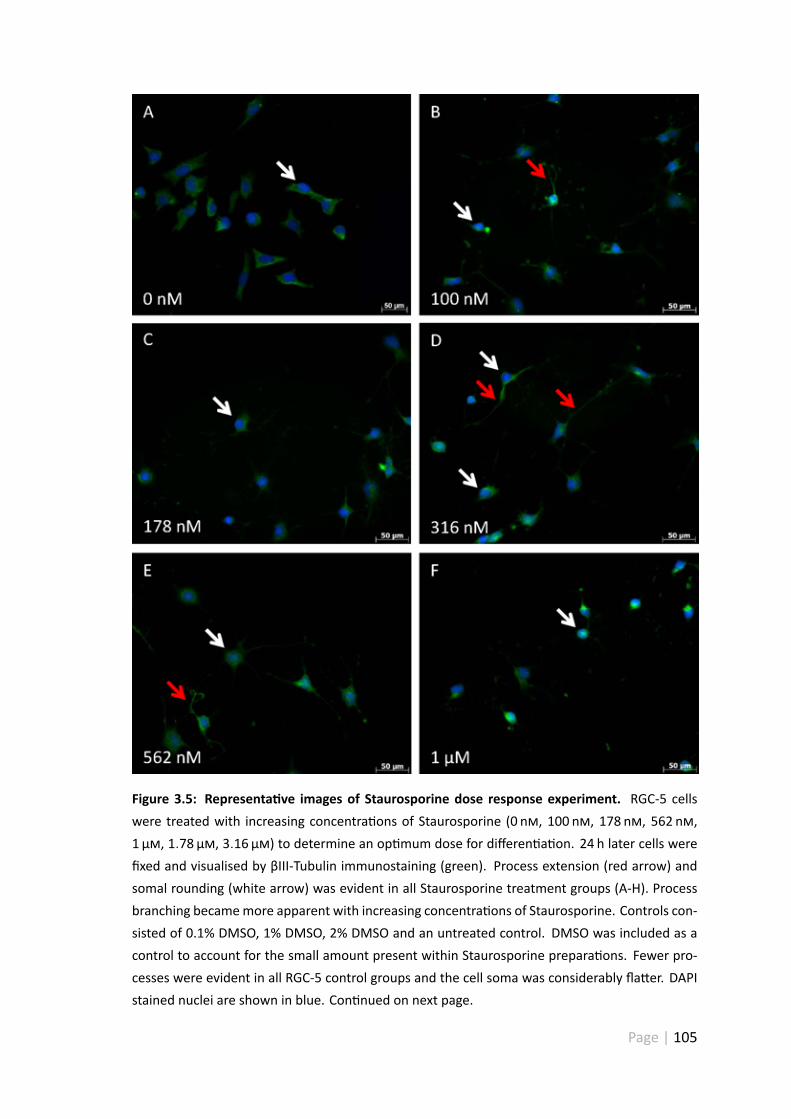
Figure 3.5: Representa ve images of Staurosporine dose response experiment. RGC-5 cellswere treated with increasing concentra ons of Staurosporine (0 n , 100 n , 178 n , 562 n ,1 µ , 1.78 µ , 3.16 µ ) to determine an op mum dose for differen a on. 24 h later cells werefixed and visualised by βIII-Tubulin immunostaining (green). Process extension (red arrow) andsomal rounding (white arrow) was evident in all Staurosporine treatment groups (A-H). Processbranching becamemore apparent with increasing concentra ons of Staurosporine. Controls con-sisted of 0.1% DMSO, 1% DMSO, 2% DMSO and an untreated control. DMSO was included as acontrol to account for the small amount present within Staurosporine prepara ons. Fewer pro-cesses were evident in all RGC-5 control groups and the cell soma was considerably fla er. DAPIstained nuclei are shown in blue. Con nued on next page.
Page | 105
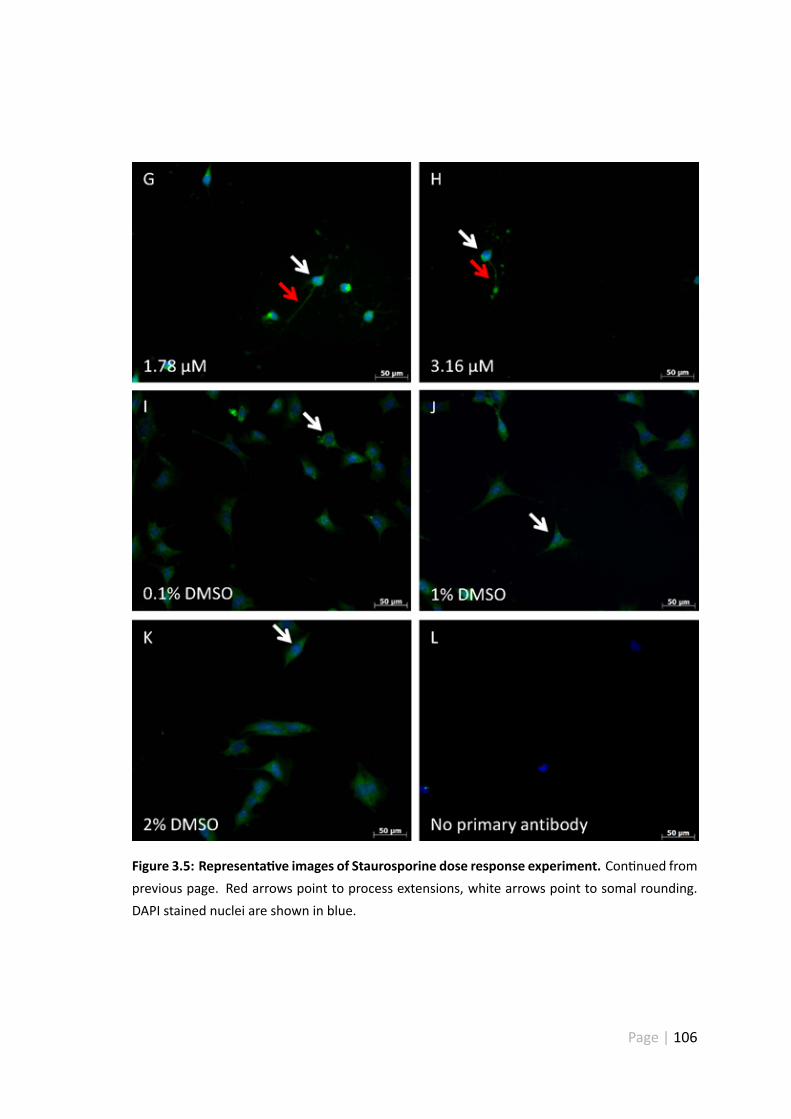
Figure 3.5: Representa ve images of Staurosporine dose response experiment. Con nued fromprevious page. Red arrows point to process extensions, white arrows point to somal rounding.DAPI stained nuclei are shown in blue.
Page | 106
3.5 The RGC-5 cell line is derived from Mus musculus and
not Ra us norvegicus
The primary aim of this chapter was to characterise the RGC-5 cell line and to determine
whether the cells would be a suitable subs tute for primary RGC.
In 2009 several batches of RGC-5 cellswere found to bederived fromMusmusculus rather
than Ra us norvegicus (Bergen et al. 2009). Although all RGC-5 cells used in the studies
listed in sec on 3.2 were derived from a common source, held by the Agarwal laboratory
(R.R.Krishnamoorthy et al. 2000, Agarwal, et al. 2007), their originwas challengedwhen it
was found that a number of batches were not derived from rats and were phenotypically
unlike RGC (Bergen et al. 2009). Furthermore, a study re-characterised the RGC-5 cell line
as a deriva ve of a mouse cone photoreceptor lineage (Wood, et al. 2010).
In light of this, all experiments from this point onwards were performed in the knowledge
that this batch of cells may not be of rat origin as originally thought. As a result a new set
of aims were planned:
3.5.1 New aims
1. Design and op mise primers for PCR and sequencing reac ons.
2. Determine whether the RGC-5 cell line is derived from Ra us norvegicus or Mus
musculus.
Page | 107
3. Establish whether the RGC-5 cell line expresses neuronal, glial or developmental
cell markers.
Sequencing was performed to determine whether the RGC-5 cell line was derived from
Mus musculus or Ra us norvegicus. PCR was performed on RGC-5 and rat brain cDNA
using primers specific for rat CNTF. PCR products were run on a 0.7% agarose gel and
visualised using EtBr staining. No band was present in the RGC-5 sample, whilst a band
of the expected size (≈550 bp) was present within the control lane (see figure 3.6).
The primers were then re-designed to target the mouse CNTF sequence and included
a GAPDH control for both rat brain and RGC-5 cDNA samples. The PCR reac on was
repeated a second me, on this occasion no bands were present in the CNTF groups,
but GAPDH posi ve bands (≈473 bp) were present in the control group (see figure 3.6).
As the purpose of this exercise was not specifically to sequence CNTF, but to ascertain
whether the RGC-5 cells were of mouse origin I decided to go ahead and sequence the
GAPDH posi ve samples. Subsequent sequence alignments (see figure 3.6) confirmed
that the RGC-5 cDNA was of mouse (Mus musculus) not rat (Ra us norvegicus) origin.
Sequence alignment revealed that the GAPDH mouse homologue shared 97% iden ty
with the RGC-5 sequence whilst the rat homologue shared 96% iden ty.
To confirm that RGC-5 cells were of mouse origin, a region of the NG2 and CD44 genes
were selected for sequencing (see figure 3.7). Sequences were aligned using ClustalX and
compared against published sequences for both NG2 (Ra us norvegicus:
NM_001170558.1; Mus musculus: Mm: NM_001081249.1) and CD44 (Ra us norvegi-
cus: M61875.1; Mus musculus: NM_009851.2). Sequence alignments revealed that the
Page | 108
NG2 mouse homologue was 99% iden cal to the RGC-5 sequence, whereas the rat ho-
mologue was only 87% iden cal. The CD44 sequence alignment revealed that the RGC-
5 sequence was 100% iden cal to Mus musculus and shared 93% iden ty with Ra us
norvegicus (see figure 3.7). All sequence alignments confirm that the RGC-5 cells in our
possession are derived from mouse (Mus musculus) and not rat (Ra us norvegicus).
PCR and sequencing experiments were not performed on differen ated RGC-5 cells be-
cause this had already been inves gated by Wood et al in 2010 (Wood et al. 2010). A full
comparison between their results and mine is discussed in sec on 3.6.3.
Page | 109
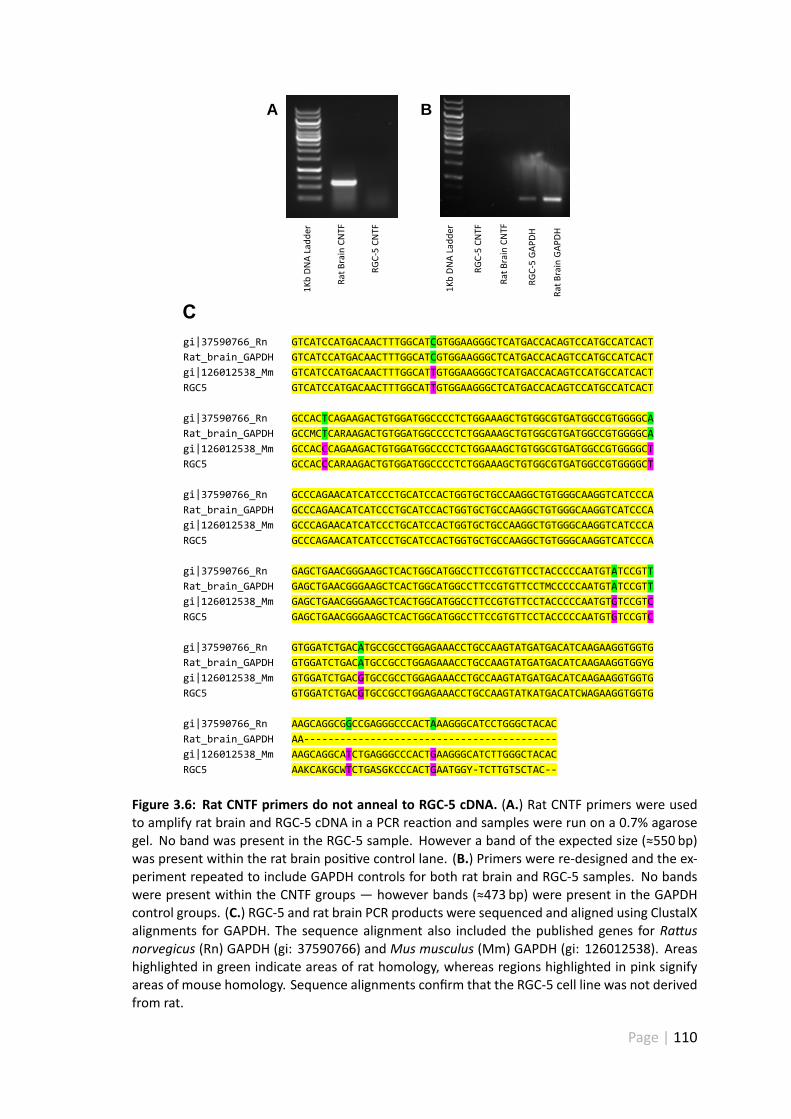
1K
b D
NA
La
dd
er
Ra
t B
ra
in C
NT
F
RG
C-5
CN
TF
1K
b D
NA
La
dd
er
Ra
t B
ra
in G
AP
DH
RG
C-5
GA
PD
H
RG
C-5
CN
TF
Ra
t B
ra
in C
NT
F
A B
gi|37590766_Rn GTCATCCATGACAACTTTGGCATCGTGGAAGGGCTCATGACCACAGTCCATGCCATCACT
Rat_brain_GAPDH GTCATCCATGACAACTTTGGCATCGTGGAAGGGCTCATGACCACAGTCCATGCCATCACT
gi|126012538_Mm GTCATCCATGACAACTTTGGCATTGTGGAAGGGCTCATGACCACAGTCCATGCCATCACT
RGC5 GTCATCCATGACAACTTTGGCATTGTGGAAGGGCTCATGACCACAGTCCATGCCATCACT
gi|37590766_Rn GCCACTCAGAAGACTGTGGATGGCCCCTCTGGAAAGCTGTGGCGTGATGGCCGTGGGGCA
Rat_brain_GAPDH GCCMCTCARAAGACTGTGGATGGCCCCTCTGGAAAGCTGTGGCGTGATGGCCGTGGGGCA
gi|126012538_Mm GCCACCCAGAAGACTGTGGATGGCCCCTCTGGAAAGCTGTGGCGTGATGGCCGTGGGGCT
RGC5 GCCACCCARAAGACTGTGGATGGCCCCTCTGGAAAGCTGTGGCGTGATGGCCGTGGGGCT
gi|37590766_Rn GCCCAGAACATCATCCCTGCATCCACTGGTGCTGCCAAGGCTGTGGGCAAGGTCATCCCA
Rat_brain_GAPDH GCCCAGAACATCATCCCTGCATCCACTGGTGCTGCCAAGGCTGTGGGCAAGGTCATCCCA
gi|126012538_Mm GCCCAGAACATCATCCCTGCATCCACTGGTGCTGCCAAGGCTGTGGGCAAGGTCATCCCA
RGC5 GCCCAGAACATCATCCCTGCATCCACTGGTGCTGCCAAGGCTGTGGGCAAGGTCATCCCA
gi|37590766_Rn GAGCTGAACGGGAAGCTCACTGGCATGGCCTTCCGTGTTCCTACCCCCAATGTATCCGTT
Rat_brain_GAPDH GAGCTGAACGGGAAGCTCACTGGCATGGCCTTCCGTGTTCCTMCCCCCAATGTATCCGTT
gi|126012538_Mm GAGCTGAACGGGAAGCTCACTGGCATGGCCTTCCGTGTTCCTACCCCCAATGTGTCCGTC
RGC5 GAGCTGAACGGGAAGCTCACTGGCATGGCCTTCCGTGTTCCTACCCCCAATGTGTCCGTC
gi|37590766_Rn GTGGATCTGACATGCCGCCTGGAGAAACCTGCCAAGTATGATGACATCAAGAAGGTGGTG
Rat_brain_GAPDH GTGGATCTGACATGCCGCCTGGAGAAACCTGCCAAGTATGATGACATCAAGAAGGTGGYG
gi|126012538_Mm GTGGATCTGACGTGCCGCCTGGAGAAACCTGCCAAGTATGATGACATCAAGAAGGTGGTG
RGC5 GTGGATCTGACGTGCCGCCTGGAGAAACCTGCCAAGTATKATGACATCWAGAAGGTGGTG
gi|37590766_Rn AAGCAGGCGGCCGAGGGCCCACTAAAGGGCATCCTGGGCTACAC
Rat_brain_GAPDH AA------------------------------------------
gi|126012538_Mm AAGCAGGCATCTGAGGGCCCACTGAAGGGCATCTTGGGCTACAC
RGC5 AAKCAKGCWTCTGASGKCCCACTGAATGGY-TCTTGTSCTAC--
C
Figure 3.6: Rat CNTF primers do not anneal to RGC-5 cDNA. (A.) Rat CNTF primers were usedto amplify rat brain and RGC-5 cDNA in a PCR reac on and samples were run on a 0.7% agarosegel. No band was present in the RGC-5 sample. However a band of the expected size (≈550 bp)was present within the rat brain posi ve control lane. (B.) Primers were re-designed and the ex-periment repeated to include GAPDH controls for both rat brain and RGC-5 samples. No bandswere present within the CNTF groups — however bands (≈473 bp) were present in the GAPDHcontrol groups. (C.) RGC-5 and rat brain PCR products were sequenced and aligned using ClustalXalignments for GAPDH. The sequence alignment also included the published genes for Ra usnorvegicus (Rn) GAPDH (gi: 37590766) and Mus musculus (Mm) GAPDH (gi: 126012538). Areashighlighted in green indicate areas of rat homology, whereas regions highlighted in pink signifyareas of mouse homology. Sequence alignments confirm that the RGC-5 cell line was not derivedfrom rat.
Page | 110
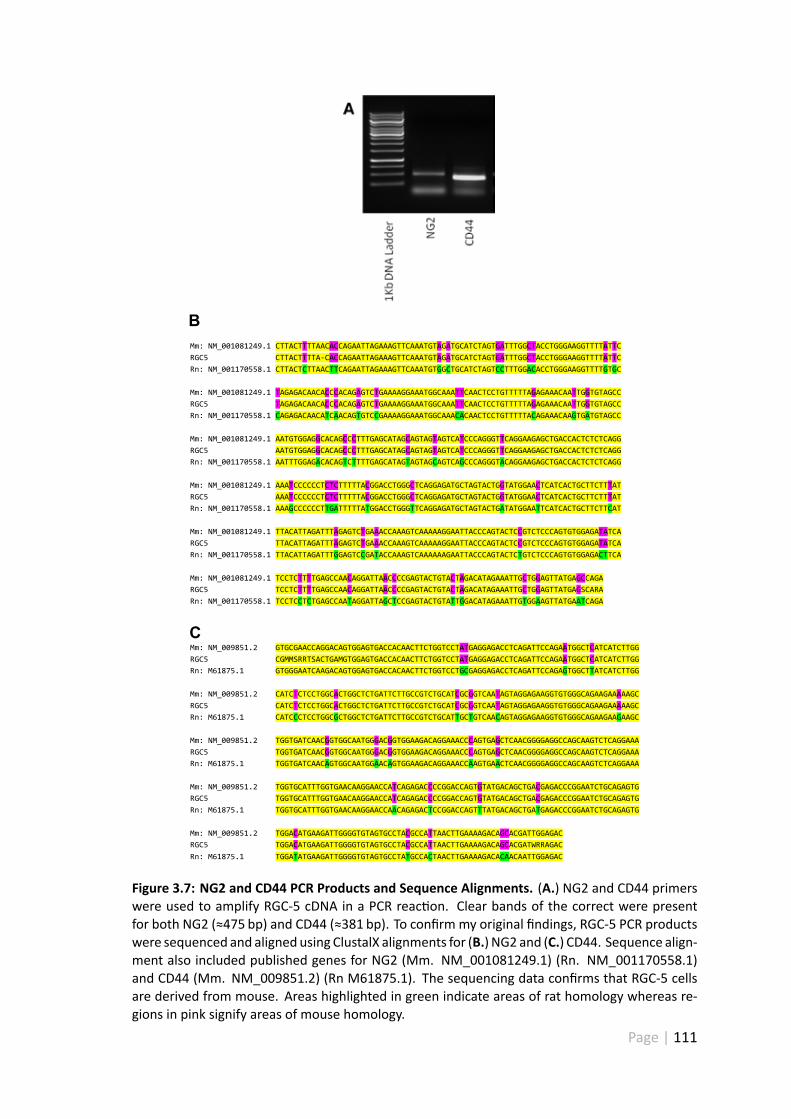
Mm: NM_001081249.1 CTTACTTTTAACACCAGAATTAGAAAGTTCAAATGTAGATGCATCTAGTGATTTGGCTACCTGGGAAGGTTTTATTC RGC5 CTTACTTTTA-CACCAGAATTAGAAAGTTCAAATGTAGATGCATCTAGTGATTTGGCTACCTGGGAAGGTTTTATTC Rn: NM_001170558.1 CTTACTCTTAACTTCAGAATTAGAAAGTTCAAATGTGGCTGCATCTAGTCCTTTGGACACCTGGGAAGGTTTTGTGC Mm: NM_001081249.1 TAGAGACAACACCCACAGAGTCTGAAAAGGAAATGGCAAATTCAACTCCTGTTTTTAGAGAAACAATTGGTGTAGCC RGC5 TAGAGACAACACCCACAGAGTCTGAAAAGGAAATGGCAAATTCAACTCCTGTTTTTAGAGAAACAATTGGTGTAGCC Rn: NM_001170558.1 CAGAGACAACATCAACAGTGTCCGAAAAGGAAATGGCAAACACAACTCCTGTTTTTACAGAAACAAGTGATGTAGCC Mm: NM_001081249.1 AATGTGGAGGCACAGCCCTTTGAGCATAGCAGTAGTAGTCATCCCAGGGTTCAGGAAGAGCTGACCACTCTCTCAGG RGC5 AATGTGGAGGCACAGCCCTTTGAGCATAGCAGTAGTAGTCATCCCAGGGTTCAGGAAGAGCTGACCACTCTCTCAGG Rn: NM_001170558.1 AATTTGGAGACACAGTCTTTTGAGCATAGTAGTAGCAGTCAGCCCAGGGTACAGGAAGAGCTGACCACTCTCTCAGG Mm: NM_001081249.1 AAATCCCCCCTCTCTTTTTACGGACCTGGGCTCAGGAGATGCTAGTACTGGTATGGAACTCATCACTGCTTCTTTAT RGC5 AAATCCCCCCTCTCTTTTTACGGACCTGGGCTCAGGAGATGCTAGTACTGGTATGGAACTCATCACTGCTTCTTTAT Rn: NM_001170558.1 AAAGCCCCCCTTGATTTTTATGGACCTGGGTTCAGGAGATGCTAGTACTGATATGGAATTCATCACTGCTTCTTCAT Mm: NM_001081249.1 TTACATTAGATTTAGAGTCTGAAACCAAAGTCAAAAAGGAATTACCCAGTACTCCGTCTCCCAGTGTGGAGATATCA RGC5 TTACATTAGATTTAGAGTCTGAAACCAAAGTCAAAAAGGAATTACCCAGTACTCCGTCTCCCAGTGTGGAGATATCA Rn: NM_001170558.1 TTACATTAGATTTGGAGTCCGATACCAAAGTCAAAAAAGAATTACCCAGTACTCTGTCTCCCAGTGTGGAGACTTCA Mm: NM_001081249.1 TCCTCTTTTGAGCCAACAGGATTAACCCCGAGTACTGTACTAGACATAGAAATTGCTGGAGTTATGAGCCAGA RGC5 TCCTCTTTTGAGCCAACAGGATTAACCCCGAGTACTGTACTAGACATAGAAATTGCTGGAGTTATGAGSCARA Rn: NM_001170558.1 TCCTCCTCTGAGCCAATAGGATTAGCTCCGAGTACTGTATTGGACATAGAAATTGTGGAAGTTATGAATCAGA
Mm: NM_009851.2 GTGCGAACCAGGACAGTGGAGTGACCACAACTTCTGGTCCTATGAGGAGACCTCAGATTCCAGAATGGCTCATCATCTTGG RGC5 CGMMSRRTSACTGAMGTGGAGTGACCACAACTTCTGGTCCTATGAGGAGACCTCAGATTCCAGAATGGCTCATCATCTTGG Rn: M61875.1 GTGGGAATCAAGACAGTGGAGTGACCACAACTTCTGGTCCTGCGAGGAGACCTCAGATTCCAGAGTGGCTTATCATCTTGG Mm: NM_009851.2 CATCTCTCCTGGCACTGGCTCTGATTCTTGCCGTCTGCATCGCGGTCAATAGTAGGAGAAGGTGTGGGCAGAAGAAAAAGC RGC5 CATCTCTCCTGGCACTGGCTCTGATTCTTGCCGTCTGCATCGCGGTCAATAGTAGGAGAAGGTGTGGGCAGAAGAAAAAGC Rn: M61875.1 CATCCCTCCTGGCGCTGGCTCTGATTCTTGCCGTCTGCATTGCTGTCAACAGTAGGAGAAGGTGTGGGCAGAAGAAGAAGC Mm: NM_009851.2 TGGTGATCAACGGTGGCAATGGGACGGTGGAAGACAGGAAACCCAGTGAGCTCAACGGGGAGGCCAGCAAGTCTCAGGAAA RGC5 TGGTGATCAACGGTGGCAATGGGACGGTGGAAGACAGGAAACCCAGTGAGCTCAACGGGGAGGCCAGCAAGTCTCAGGAAA Rn: M61875.1 TGGTGATCAACAGTGGCAATGGAACAGTGGAAGACAGGAAACCAAGTGAACTCAACGGGGAGGCCAGCAAGTCTCAGGAAA Mm: NM_009851.2 TGGTGCATTTGGTGAACAAGGAACCATCAGAGACCCCGGACCAGTGTATGACAGCTGACGAGACCCGGAATCTGCAGAGTG RGC5 TGGTGCATTTGGTGAACAAGGAACCATCAGAGACCCCGGACCAGTGTATGACAGCTGACGAGACCCGGAATCTGCAGAGTG Rn: M61875.1 TGGTGCATTTGGTGAACAAGGAACCAACAGAGACTCCGGACCAGTTTATGACAGCTGATGAGACCCGGAATCTGCAGAGTG Mm: NM_009851.2 TGGACATGAAGATTGGGGTGTAGTGCCTACGCCATTAACTTGAAAAGACAGCACGATTGGAGAC RGC5 TGGACATGAAGATTGGGGTGTAGTGCCTACGCCATTAACTTGAAAAGACAGCACGATWRRAGAC Rn: M61875.1 TGGATATGAAGATTGGGGTGTAGTGCCTATGCCACTAACTTGAAAAGACACAACAATTGGAGAC
B
C
Figure 3.7: NG2 and CD44 PCR Products and Sequence Alignments. (A.) NG2 and CD44 primerswere used to amplify RGC-5 cDNA in a PCR reac on. Clear bands of the correct were presentfor both NG2 (≈475 bp) and CD44 (≈381 bp). To confirmmy original findings, RGC-5 PCR productswere sequenced and aligned using ClustalX alignments for (B.) NG2 and (C.) CD44. Sequence align-ment also included published genes for NG2 (Mm. NM_001081249.1) (Rn. NM_001170558.1)and CD44 (Mm. NM_009851.2) (Rn M61875.1). The sequencing data confirms that RGC-5 cellsare derived from mouse. Areas highlighted in green indicate areas of rat homology whereas re-gions in pink signify areas of mouse homology.
Page | 111
3.5.2 Primer Op misa on
To determine primer specificity and op mum annealing temperature a series of PCR re-
ac ons were performed. The amplified products were separated on a 1% agarose gel and
visualised by EtBr staining. A series of primers were designed to characterise the RGC-5
cell line and determine its origin. An annealing temperature of 50 ◦C produced a high
degree of smearing and non-specific amplifica on. As a result, an annealing tempera-
ture of 55 ◦C was selected for all future experiments. Primers which were unsuccessful
at amplifying the desired products were re-designed for use in future experiments.
Page | 112
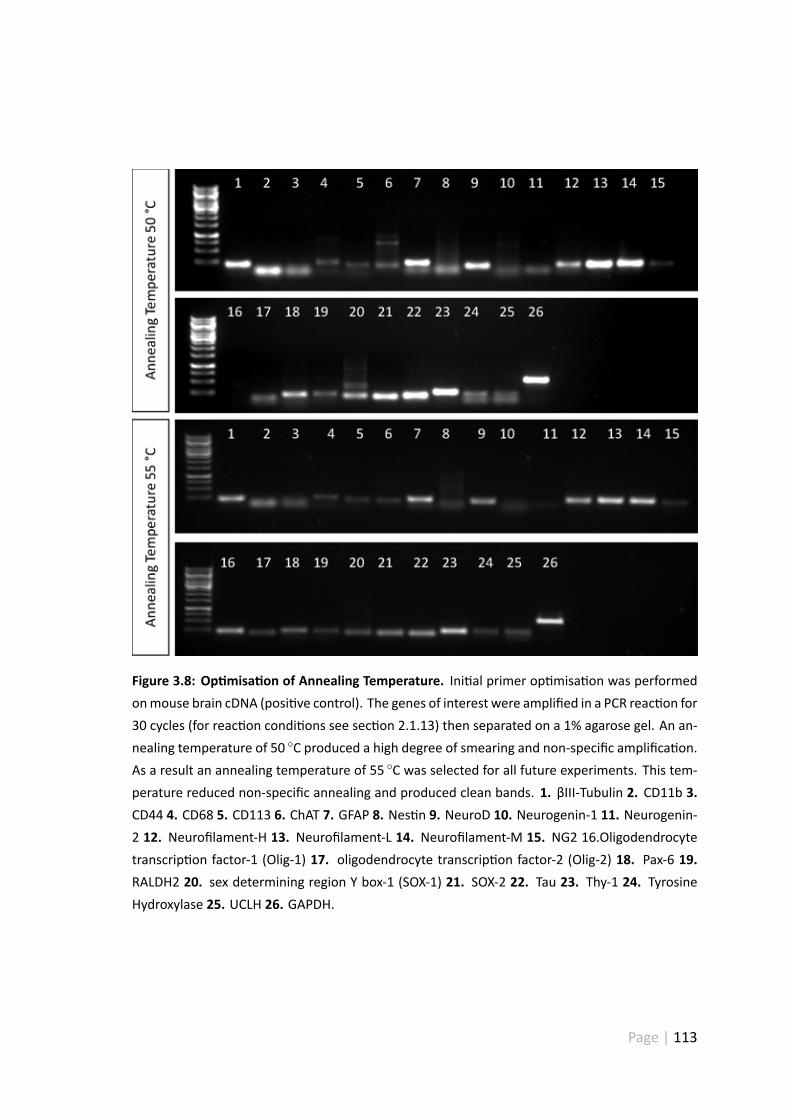
Figure 3.8: Op misa on of Annealing Temperature. Ini al primer op misa on was performedonmouse brain cDNA (posi ve control). The genes of interest were amplified in a PCR reac on for30 cycles (for reac on condi ons see sec on 2.1.13) then separated on a 1% agarose gel. An an-nealing temperature of 50 ◦C produced a high degree of smearing and non-specific amplifica on.As a result an annealing temperature of 55 ◦C was selected for all future experiments. This tem-perature reduced non-specific annealing and produced clean bands. 1. βIII-Tubulin 2. CD11b 3.CD44 4. CD68 5. CD113 6. ChAT 7. GFAP 8. Nes n 9. NeuroD 10. Neurogenin-1 11. Neurogenin-2 12. Neurofilament-H 13. Neurofilament-L 14. Neurofilament-M 15. NG2 16.Oligodendrocytetranscrip on factor-1 (Olig-1) 17. oligodendrocyte transcrip on factor-2 (Olig-2) 18. Pax-6 19.RALDH2 20. sex determining region Y box-1 (SOX-1) 21. SOX-2 22. Tau 23. Thy-1 24. TyrosineHydroxylase 25. UCLH 26. GAPDH.
Page | 113
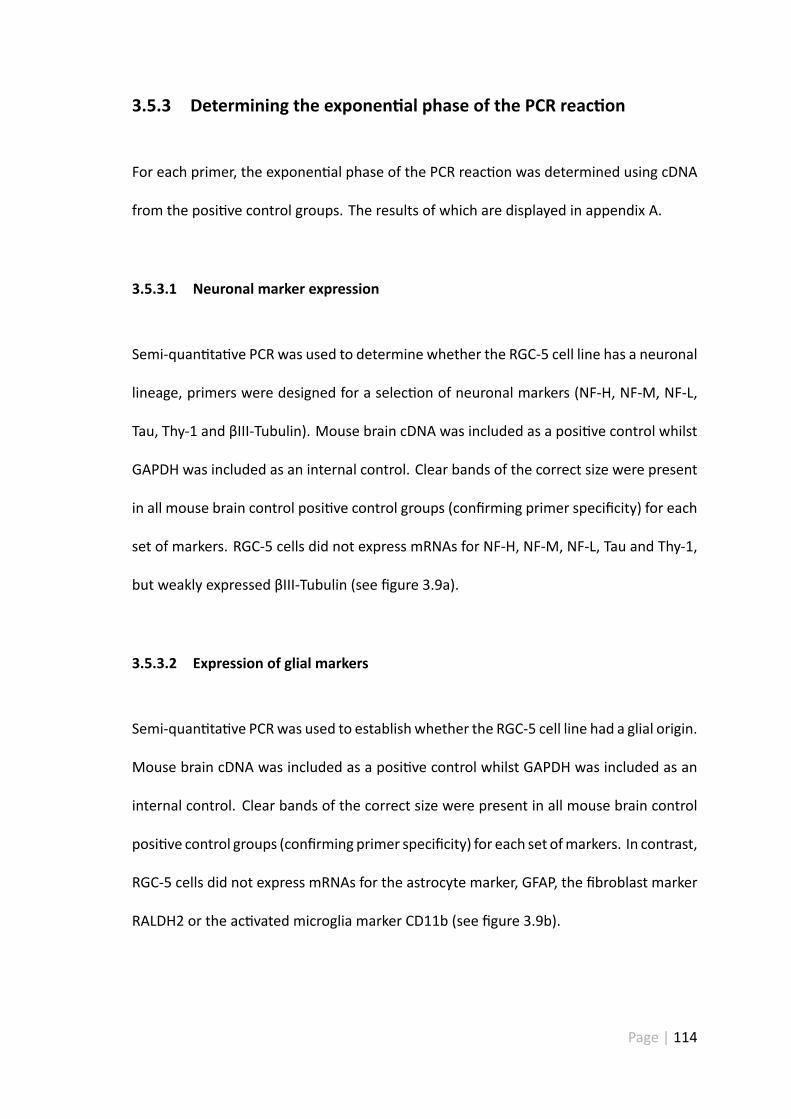
3.5.3 Determining the exponen al phase of the PCR reac on
For each primer, the exponen al phase of the PCR reac on was determined using cDNA
from the posi ve control groups. The results of which are displayed in appendix A.
3.5.3.1 Neuronal marker expression
Semi-quan ta ve PCR was used to determine whether the RGC-5 cell line has a neuronal
lineage, primers were designed for a selec on of neuronal markers (NF-H, NF-M, NF-L,
Tau, Thy-1 and βIII-Tubulin). Mouse brain cDNA was included as a posi ve control whilst
GAPDH was included as an internal control. Clear bands of the correct size were present
in all mouse brain control posi ve control groups (confirming primer specificity) for each
set of markers. RGC-5 cells did not express mRNAs for NF-H, NF-M, NF-L, Tau and Thy-1,
but weakly expressed βIII-Tubulin (see figure 3.9a).
3.5.3.2 Expression of glial markers
Semi-quan ta ve PCRwas used to establish whether the RGC-5 cell line had a glial origin.
Mouse brain cDNA was included as a posi ve control whilst GAPDH was included as an
internal control. Clear bands of the correct size were present in all mouse brain control
posi ve control groups (confirming primer specificity) for each set ofmarkers. In contrast,
RGC-5 cells did not express mRNAs for the astrocyte marker, GFAP, the fibroblast marker
RALDH2 or the ac vated microglia marker CD11b (see figure 3.9b).
Page | 114
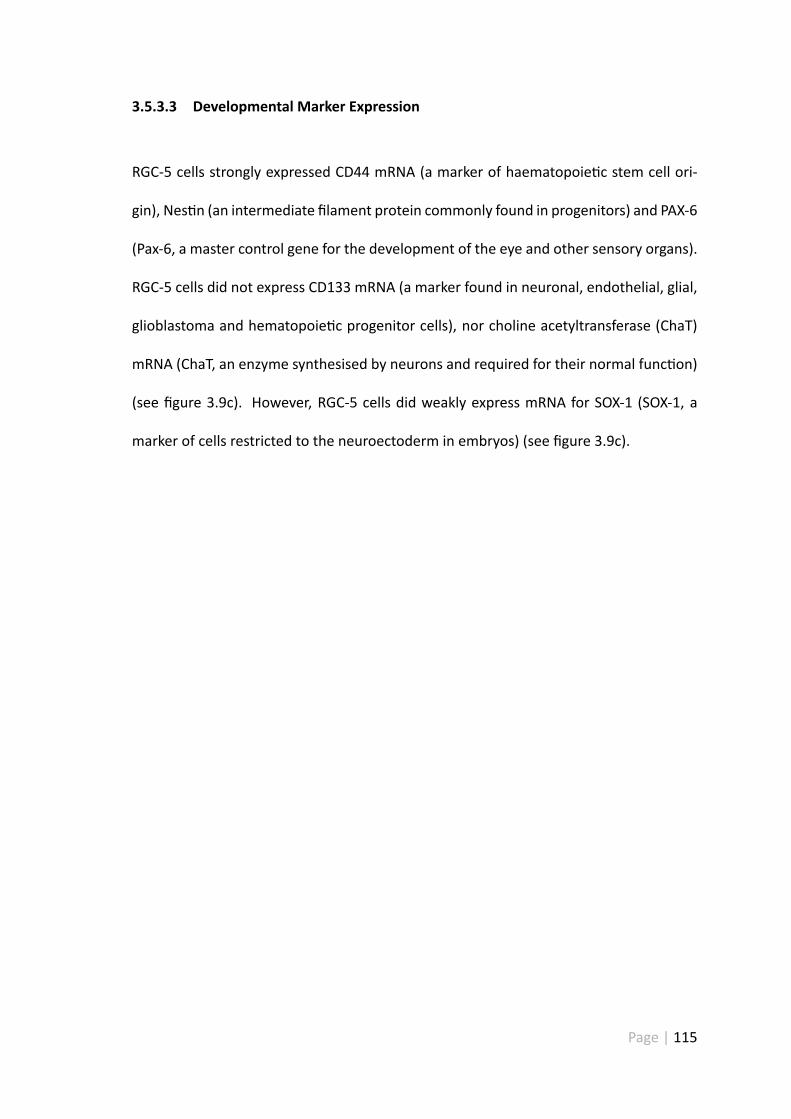
3.5.3.3 Developmental Marker Expression
RGC-5 cells strongly expressed CD44 mRNA (a marker of haematopoie c stem cell ori-
gin), Nes n (an intermediate filament protein commonly found in progenitors) and PAX-6
(Pax-6, a master control gene for the development of the eye and other sensory organs).
RGC-5 cells did not express CD133 mRNA (a marker found in neuronal, endothelial, glial,
glioblastoma and hematopoie c progenitor cells), nor choline acetyltransferase (ChaT)
mRNA (ChaT, an enzyme synthesised by neurons and required for their normal func on)
(see figure 3.9c). However, RGC-5 cells did weakly express mRNA for SOX-1 (SOX-1, a
marker of cells restricted to the neuroectoderm in embryos) (see figure 3.9c).
Page | 115
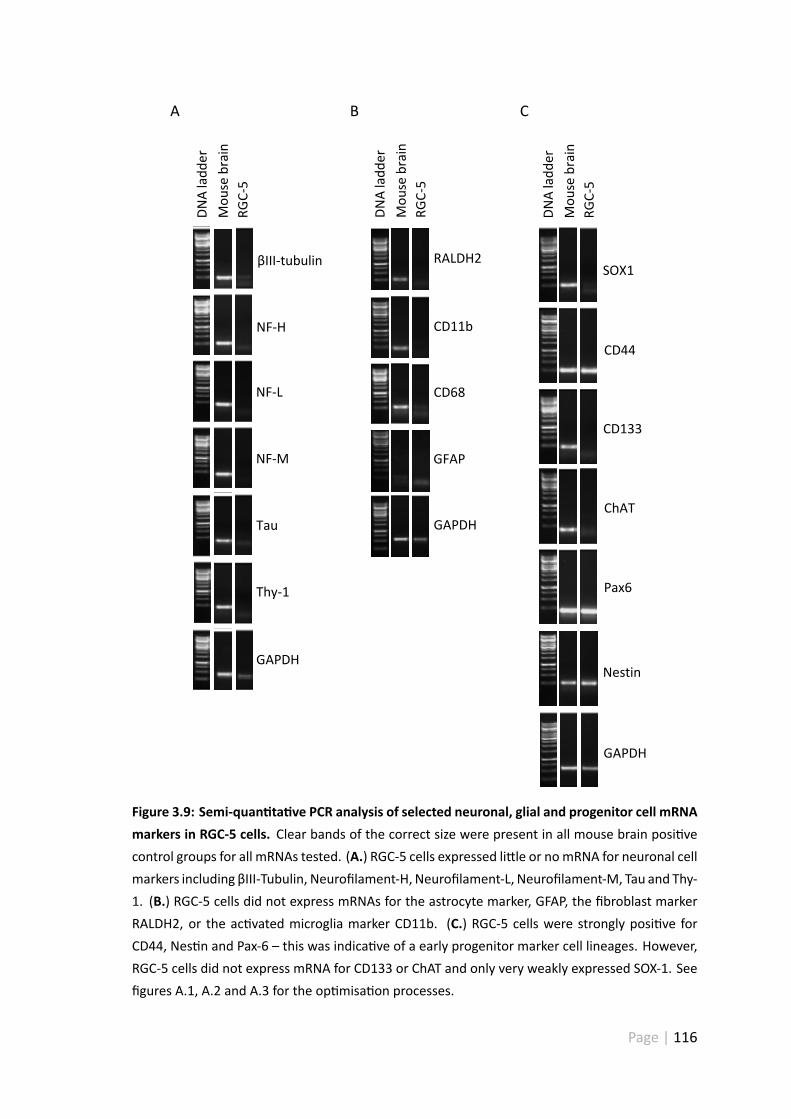
éIII-tubulin
Mo
use
bra
in
RG
C-5
DN
A la
dd
er
NF-H
NF-L
NF-M
Tau
Thy-1
GAPDH
RALDH2
CD11b
CD68
GAPDH
SOX1
CD44
CD133
ChAT
Pax6
GAPDH
A B C
Nestin
Mo
use
bra
in
RG
C-5
DN
A la
dd
er
Mo
use
bra
in
RG
C-5
DN
A la
dd
er
GFAP
Figure 3.9: Semi-quan ta ve PCR analysis of selected neuronal, glial and progenitor cell mRNAmarkers in RGC-5 cells. Clear bands of the correct size were present in all mouse brain posi vecontrol groups for all mRNAs tested. (A.) RGC-5 cells expressed li le or nomRNA for neuronal cellmarkers including βIII-Tubulin, Neurofilament-H, Neurofilament-L, Neurofilament-M, Tau and Thy-1. (B.) RGC-5 cells did not express mRNAs for the astrocyte marker, GFAP, the fibroblast markerRALDH2, or the ac vated microglia marker CD11b. (C.) RGC-5 cells were strongly posi ve forCD44, Nes n and Pax-6 – this was indica ve of a early progenitor marker cell lineages. However,RGC-5 cells did not express mRNA for CD133 or ChAT and only very weakly expressed SOX-1. Seefigures A.1, A.2 and A.3 for the op misa on processes.
Page | 116
3.5.4 RGC-5 cells are derived from the oligodendroglial lineage
RGC-5 cells expressedmRNAmarkers consistent with those found in the oligodendroglial
lineage. Clear bands of the correct size were present in all mouse brain posi ve control
groups. Interes ngly, RGC-5 cells co-expressed mRNA for markers of mature and imma-
ture oligodendrocytes (see figure 3.10). For example, RGC-5 cells expressed mRNAs for
NG2, CNPase and GalC, but tested nega ve for MBP (a marker of mature myelina ng
oligodendrocytes). NG2 and CAII expression, was confirmed by immunocytochemistry
(see figure 3.11) and sequencing (see figure 3.7b). Since strong immunoreac vivity was
seen in all cells (not just a subpopula on) it is unlikely that this cons tutes a mixed popu-
la on of cells. RGC-5 cells also displayed strong homogeneous immunoreac vity for CAII
(carbonic anhydrase II, typically expressed at all stages of oligodendrocyte development
(Baumann & Pham-Dinh 2001)). RGC-5 cells did not express mRNA for Olig-1 or -2.
Page | 117
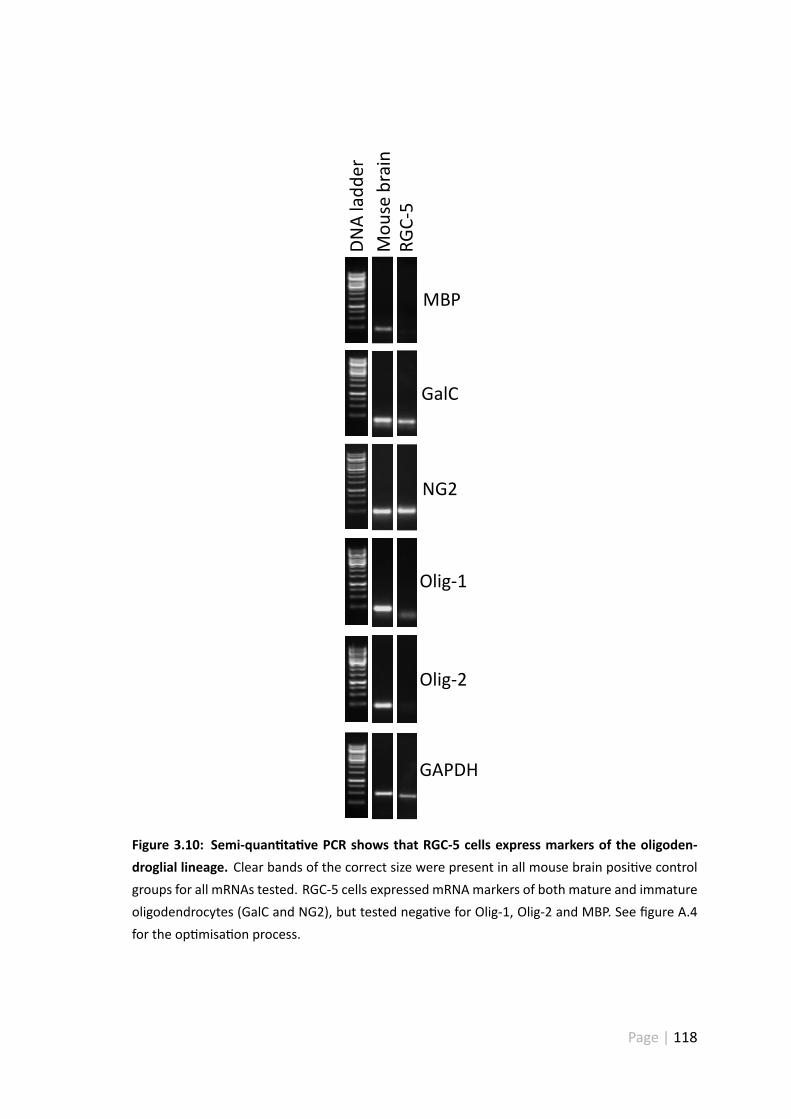
MBP
GalC
Olig-1
NG2
Olig-2
GAPDH
Mo
use
bra
in
RG
C-5
DN
A la
dd
er
Figure 3.10: Semi-quan ta ve PCR shows that RGC-5 cells express markers of the oligoden-droglial lineage. Clear bands of the correct size were present in all mouse brain posi ve controlgroups for all mRNAs tested. RGC-5 cells expressed mRNAmarkers of both mature and immatureoligodendrocytes (GalC and NG2), but tested nega ve for Olig-1, Olig-2 and MBP. See figure A.4for the op misa on process.
Page | 118
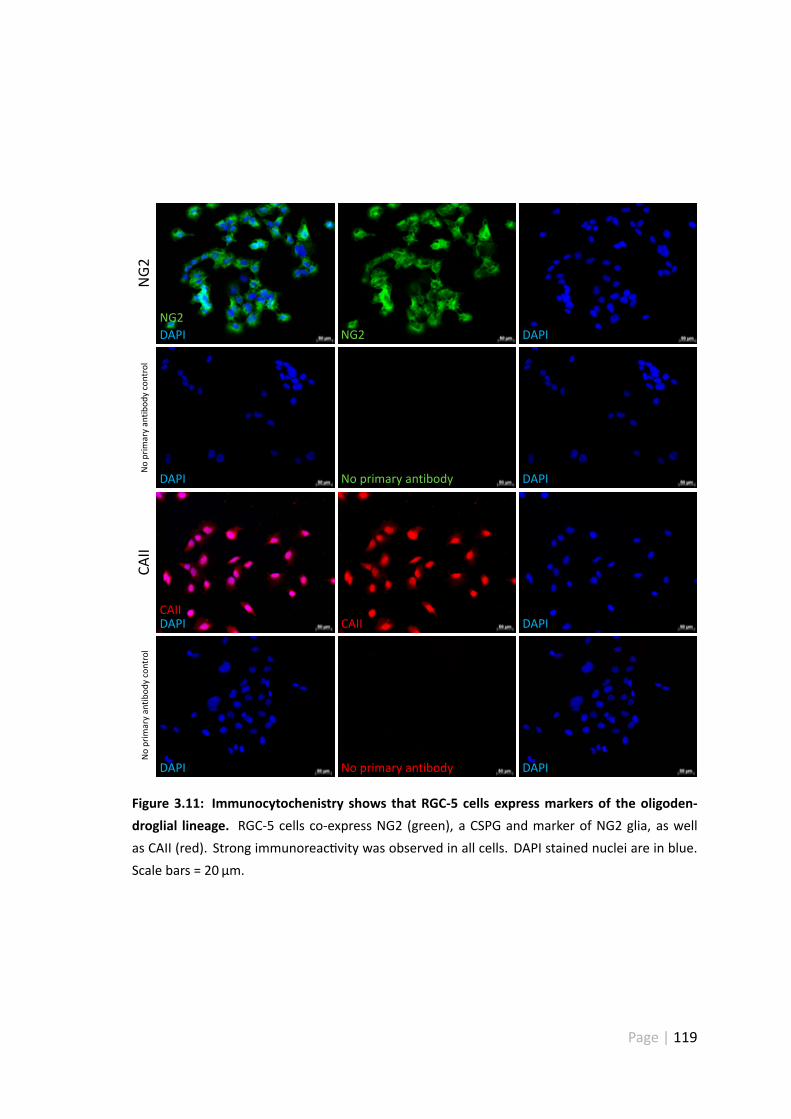
DAPI DAPI No primary antibody
No
pri
ma
ry a
nti
bo
dy
co
ntr
ol
DAPI DAPI
NG2
NG2
NG
2
DAPI DAPI CAII
CAII
CA
II
DAPI DAPI
No
pri
ma
ry a
nti
bo
dy
co
ntr
ol
No primary antibody
Figure 3.11: Immunocytochenistry shows that RGC-5 cells express markers of the oligoden-droglial lineage. RGC-5 cells co-express NG2 (green), a CSPG and marker of NG2 glia, as wellas CAII (red). Strong immunoreac vity was observed in all cells. DAPI stained nuclei are in blue.Scale bars = 20 µm.
Page | 119
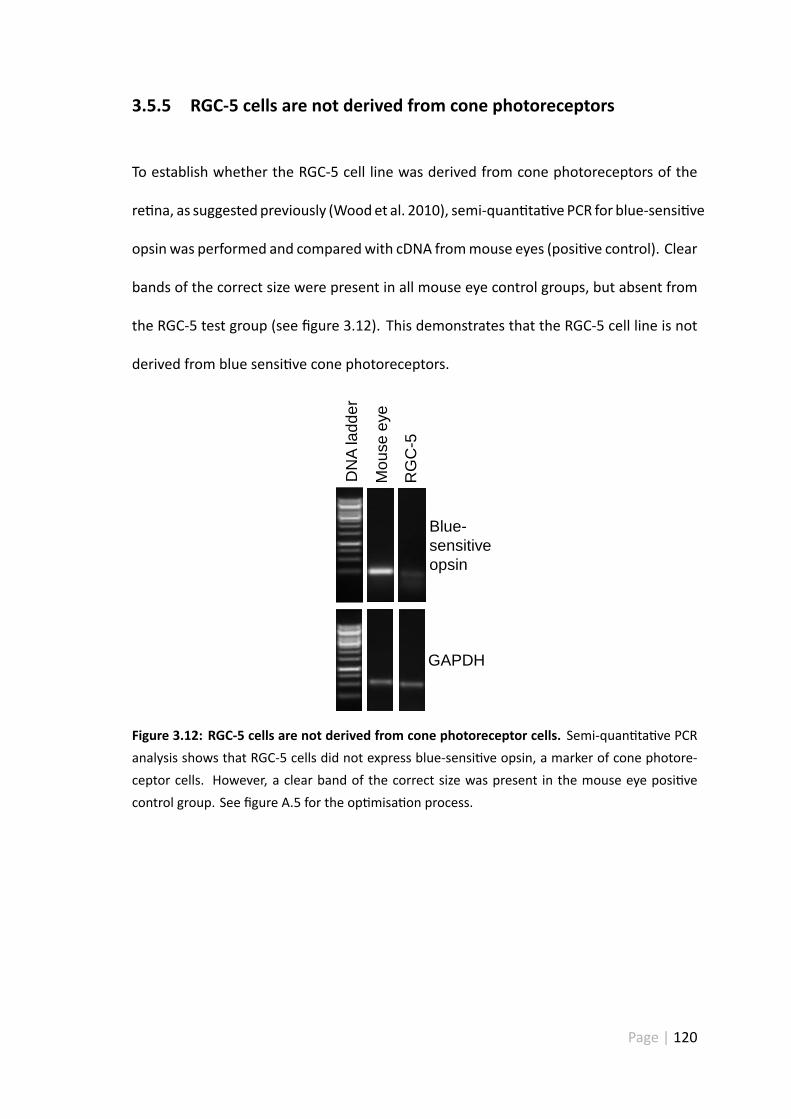
3.5.5 RGC-5 cells are not derived from cone photoreceptors
To establish whether the RGC-5 cell line was derived from cone photoreceptors of the
re na, as suggestedpreviously (Woodet al. 2010), semi-quan ta ve PCR for blue-sensi ve
opsin was performed and comparedwith cDNA frommouse eyes (posi ve control). Clear
bands of the correct size were present in all mouse eye control groups, but absent from
the RGC-5 test group (see figure 3.12). This demonstrates that the RGC-5 cell line is not
derived from blue sensi ve cone photoreceptors.M
ouse
eye
RG
C-5
DN
A la
dder
GAPDH
Blue- sensitive opsin
Figure 3.12: RGC-5 cells are not derived from cone photoreceptor cells. Semi-quan ta ve PCRanalysis shows that RGC-5 cells did not express blue-sensi ve opsin, a marker of cone photore-ceptor cells. However, a clear band of the correct size was present in the mouse eye posi vecontrol group. See figure A.5 for the op misa on process.
Page | 120
3.5.6 Densitometry
Densitometric quan fica on was performed on all of the posi ve lineage markers ex-
pressed in RGC-5 cells and compared to that of the mouse brain posi ve controls. Apart
from βIII-Tubulin, all mRNA markers were expressed in greater abundance than mouse
brain posi ve controls (see figure 3.13). All the mRNAmarkers were expressed in greater
abundance in RGC-5 cells than in the mouse brain posi ve controls (see figure 3.13).
Moreover, RGC-5 cells expressed significantly more CD44, CNPase and Nes nmRNA than
in the mouse brain posi ve controls. The only excep on to this was βIII-Tubulin, which
was weakly expressed in the RGC-5 cell line.
Page | 121
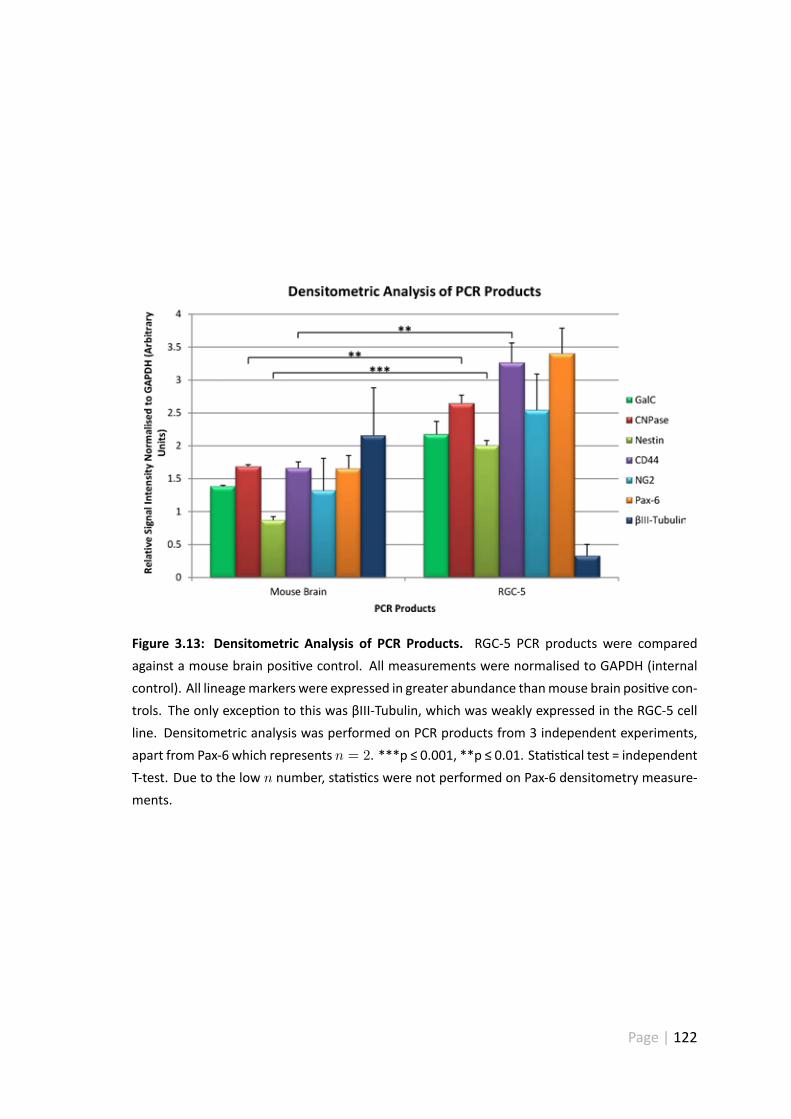
Figure 3.13: Densitometric Analysis of PCR Products. RGC-5 PCR products were comparedagainst a mouse brain posi ve control. All measurements were normalised to GAPDH (internalcontrol). All lineagemarkers were expressed in greater abundance thanmouse brain posi ve con-trols. The only excep on to this was βIII-Tubulin, which was weakly expressed in the RGC-5 cellline. Densitometric analysis was performed on PCR products from 3 independent experiments,apart from Pax-6 which represents n = 2. ***p ≤ 0.001, **p ≤ 0.01. Sta s cal test = independentT-test. Due to the low n number, sta s cs were not performed on Pax-6 densitometry measure-ments.
Page | 122
3.6 Discussion
3.6.1 Morphological analysis of Staurosporine treated RGC-5 cells
Previous studies (Frasse o et al. 2006) have suggested that Staurosporine, a broad spec-
trum protein kinase inhibitor, is capable of differen a ng the RGC-5 cell line. Accord-
ing to the literature (Frasse o et al. 2006), Staurosporine treatment induces cell cycle
arrest, morphological changes, upregula on of neuronal markers (Thymocyte differen -
a on an gen 1, microtubule-associated protein 2 (MAP2) and N-Methyl-D-aspar c acid
(NMDA-R1) and establishment of outward rec fying channels.
Unfortunately the mechanism by which Staurosporine induces differen a on is not yet
fully understood. Its mechanism of ac on is presumably related to kinase inhibi on how-
ever, it's unclear as to which kinases are directly responsible. In 2006 Frasse o et al
tested a variety of different kinase inhibitors to determine which were involved in the
RGC-5 differen a on process (Frasse o et al. 2006). Although treatment with H-1152
(a Rho kinase inhibitor) and H-89 (a non-specific protein kinase-A inhibitor) resulted in
some process forma on, however the morphological changes induced were dissimilar
from Staurosporine treated RGC-5 cells (Frasse o et al. 2006). Although each kinase in-
hibitor induced RGC-5 process forma on, somal roundingwas not evident, irrespec ve of
whether the kinase inhibitors were added alone or in combina on (Frasse o et al. 2006).
Page | 123
In 2009 Thompson et al took a different approach, by comparing Staurosporine against
other structurally related molecules (K252a1, K252b2, K252c3, UCN-014 and PKC-4125)
(Thompson & Levin 2010). RGC-5 cells were treated with each of these compounds and
morphological measurements (somal rounding, process forma on, number of processes
etc.) were taken. They found that only Staurosporine and-hydroxystaurosporine (UCN-
01) (the most structurally similar) induced differen a on of the RGC-5 cell line – both of
which induced somal rounding and process extension. Since Staurosporine and UCN-01
were the only compounds that contained an accessible methoxy group at the 3ʹ carbon
and a neighbouring amine group, they concluded that these structural groups were re-
sponsible for causing RGC-5 differen a on.
One of the limita ons of using Staurosporine as a differen a ng agent is that very li le
is known about its mechanism of ac on. As Staurosporine is a broad spectrum kinase
inhibitor it has mul ple targets, many of which have not yet been iden fied. As a result,
Staurosporine should be used with care as it may be difficult to make direct comparisons
between Staurosporine treated cell lines and primary cell cultures.
Although many targets have not yet been iden fied many have, and these include: PKC
(see sec on 1.8.3.2), protein kinase A (PKA) and protein kinase G (PKG) (Tamaoki, et al.
1986). In addi on to this Staurosporine also inhibits a variety of cell cycle regulators
19,12-epoxy-1H-diindolo[1,2,3-fg:3ʹ,2ʹ,1ʹ-kl]pyrrolo[3,4-i][1,6]benzodiazocine-10-carboxylic acid,2,3,9,10,11,12-hexahydro-10-hydroxy-9-methyl-1-oxo-, methyl ester, (9S,10R,12R)-
2(5R,6S,8S)-6-hydroxy-5-methyl-13-oxo-6,7,8,13,14,15-hexahydro-5H-16-oxa-4b,8a,14-triaza-5,8-methanodibenzo[b,h]cycloocta[jkl]cyclopenta[e]-as-indacene-6-carboxylic acid
3Staurosporine aglycone47-hydroxystaurosporine54ʹ-N-benzoylstaurosporine
Page | 124
including cyclin dependent kinase 1 (regulates M phase), cyclin dependent kinase 2 (reg-
ulates G1/S phase) and cyclin dependent kinase 5 (regulates Transcrip on). Addi onal
targets include: janus-kinase 2 (JAK-2) (see sec on 1.9.2), epidermal growth factor recep-
tor kinase, platelet derived growth factor receptor, myosin-light chain kinase (regulates
cellular morphology), ROCK (see sec on 1.6.2), MAP/ERK kinase (see sec on 1.8.3.1) and
Akt (see sec on 1.8.3.3) (Bain, et al. 2003). Using this differen a on agent may present
a number of problems when inves ga ng growth and/or inhibitory signalling pathways,
since staurosporine inhibits key mediators of many of these pathways.
To determine whether Staurosporine did indeed induce morphological changes consis-
tent with that of an RGC phenotype, it was decided to perform a Staurosporine dose
response experiment. In agreement with other published works (Wood et al. 2010, Fras-
se o et al. 2006), RGC-5 cells do exhibit dis nc ve morphological changes a er Stau-
rosporine treatment (see figures 3.1, 3.2 and 3.3). Staurosporine treatment led to in-
creases in the length of the longest process, and processes length/cell, with a concentra-
on of Staurosporine between 0.1 µ to 1.78 µ favouring op mumprocess outgrowth.
In addi on to this, Staurosporine treatment significantly enhanced process number (com-
pared to controls), with maximal process number being achieved at 562 n . Process
number declined between 1 µ to 3.16 µ , this may have been a result of increased cy-
toxicity (see figure 3.4). Moreover, Staurosporine treatment led to a dose dependent
increase in process branching. Maximal branching was achieved at a dose of 1 µ to
1.78 µ , the extent of process branching was drama cally reduced by concentra ons
higher than this, presumably as a result of cytotoxicity (see figure 3.4).
Page | 125
In order to establish a suitable concentra on to induce differen a on whilst keeping tox-
icity to aminimum, a cell viability assay was performed. In retrospect this wasn’t the best
approach to take since comparisons can’t be easily made between loss of viability and re-
duced cell number due to cell cycle arrest. Ideally I should have combined this approach
with direct cell counts and BrdU or Tunnel immuno-labelling, as this would have allowed
me to dis nguish between mito c and post-mito c cells. This would have allowed me to
more accurately dis nguish between toxicity and cell cycle arrest.
The results show that there was a significant reduc on in mean ATP content a er treat-
ment with high doses of Staurosporine (1 µ , 1.78 µ or 3.16 µ ) compared to all other
treatment groups (see figure 3.4). Although this indicates that Staurosporine could have
caused some toxicity, addi onal experiments would need to be performed to confirm
this (see previous). Interes ngly, a number of other studies (Thompson & Levin 2010)
(Frasse o et al. 2006) have shown that Staurosporine does indeed cause toxicity at doses
higher than 316 n , a er direct cell coun ng. This suggests that the reduc on of ATP
seen in figure was likely a result of toxicity.
Treatment with 0.1%, 1% and 2% DMSO did not cause significant toxicity compared to
the untreated control. I am fairly confident that this was the case, since all of the cells
present within these groups were s ll ac vely dividing, however this would s ll need to
be confirmed by addi onal experiments.
Page | 126
3.6.2 RGC-5 sequencing
Sequencing analysis of GAPDH (see figure 3.6), CD44 and NG2 (see figure 3.7) has re-
vealed that the cells in my possession are derived from mice (Mus musculus) not rats
(Ra us norvegicus). The distribu on of this misiden fied and/or cross-contaminated
cell does not appear to be an isolated occurrence — two other laboratories have cor-
roborated these findings (Bergen et al. 2009). However this in itself does not exclude
the use of the RGC-5 cell line as an appropriate alterna ve for primary re nal culture. To
assess this, it was necessary to look at the expression profile of the RGC-5 cell line.
3.6.3 RGC-5 expression profile
Semi-quan ta ve PCR analysis has revealed that the RGC-5 cell line does not express
mRNA for markers of mature RGC, (Thy1, NF-M, NF-L, NF-H and Tau) and only weakly
expressed the neuronal marker βIII-Tubulin (see figure 3.9a). As a result the RGC-5 cell
line is unlikely to be derived from mature RGC. Furthermore, RGC-5 cells did not express
markers of fibroblasts (RALDH2), ac vatedmicroglia (CD11b) ormacrophages (CD68) (see
figure 3.9b).
Since the original report of the genera on of the RGC-5 cell line (R.R.Krishnamoorthy
et al. 2000), many discrepancies with primary RGC have been iden fied. For example,
there has been marked decrease in glutamate sensi vity sugges ng that the RGC-5 cells
were pharmacologically less ganglion-cell like (Bergen et al. 2009, Fan, et al. 2005, Maher
& Hanneken 2005).
Page | 127
Contrary to previously published works (Wood et al. 2010), the RGC-5 cell line does not
express mRNA for blue-sensi ve Opsin, a marker of cone photoreceptors. In this study
(Wood et al. 2010), Opsin expression was determined through the use of western blot-
ng and immunostaining. This discrepancy may have been due to a problem with an -
body specificity. It is possible that the an body exhibited cross-reac vity with an an gen
present on the RGC-5 cell line.
However, in agreement with this study (Wood et al. 2010), RGC-5 cells expressed βIII-
Tubulin but did not express Thy-1, NF-H, NF-M or NF-L – even a er treatment with any
of the known RGC-5 differen a ng agents (Staurosporine, Succinyl-concanavalin A and
Trichosta n).
RGC-5 cells expressed mRNAs for NG2, CNPase and GalC (oligodendroglial lineage mark-
ers) but tested nega ve forMBP (amarker ofmaturemyelina ng oligodendrocytes). NG2
expression (a marker of oligodendrocyte progenitors / NG2 glia) was further confirmed
by immunocytochemistry and sequencing analysis (see figure 3.7). In light of this infor-
ma on, it seems unlikely that these cells were even derived from the eye, since oligo-
dendrocyte progenitors are typically absent from the re na.
Interes ngly, RGC-5 cells did not express oligodendrocyte transcrip on factor 1 and 2
(Olig- 1, Olig-2) (see figure 3.10). These genes encode basic helix-loop helix transcrip on
factors and are expressed exclusively by oligodendrocytes and NG2 glia/oligodendrocyte
progenitors. Furthermore, RGC-5 cells strongly express the neural stem cell marker Pax-6
(see figure 3.9c). This was surprising since RGC-5 cells express many markers consistent
with an oligodendroglial lineage. This may in some way explain the absence of Olig-2
Page | 128
expression since It has been well documented that (Agarwal et al. 2007) there is an in-
verse correla on between Olig-2 and Pax-6 expression — over expression of Pax-6 gen-
erally leads to down regula on of Olig-2 and progression towards a neuronal fate (Jang &
Goldman 2011). It is also possible that these cells may be derived from a subpopula on
of NG2 glia which expresses Pax-6, or that these cells have not yet commi ed themselves
to a par cular cell fate.
Interes ngly, RGC-5 cells highly expressed mRNA for both CD44 and Nes n (see figure
3.9c)— thiswas not surprising since both aremarkers ofmul lineage progenitors (Wiese,
et al. 2004). Nes n is highly upregulated in prolifera ng oligodendrocyte progenitors
(Gallo & Armstrong 1995). Moreover, Nes n and CD44 are upregulated in response to
injury, so it is also possible that thismay have been a consequence of the isola on process
(Frisen, et al. 1995, Moon, et al. 2004).
The wide range of dispari es in RGC-5 cell phenotypes, which encompass the original
characteris cs given by Agarwal and colleagues (R.R.Krishnamoorthy et al. 2000, Agar-
wal et al. 2007) and more recent re-evalua ons (Bergen et al. 2009, Wood et al. 2010),
are probably explained by inadequate isola on during passage (American Type Culture
Collec on Standards Development Organiza onWorkgroup ASN-0002 2010), differen al
methods of screening and misiden fica on (MacLeod, et al. 1999, Masters, et al. 2001,
Thompson, et al. 2004) throughmislabelling (American Type Culture Collec on Standards
Development Organiza on Workgroup ASN-0002 2010) and cross-contamina on with
other cell lines. For example, phenotypic screening may yield divergent results when
using specific an body marker techniques compared to DNA amplifica on, restric on
digest and sequencing analyses. Once contaminated, invading cells can swi ly over-ride
Page | 129
and eventually replace the resident cell line (Nims, et al. 1998). For example, a study con-
ducted by the american Type Culture Collec on (ATCC) found that 27 out of 56 cell lines
were contaminated by the HeLa cell line (Lavappa, et al. 1976), while another found that
ECV304 (Dirks, et al. 1999), a normal human endothelial cell line, had become contam-
inated by the bladder cancer derived T24 cell line, and two human prostate cancer cell
lines, TSU-Pr1 and JCA-1 (van Bokhoven, et al. 2001). Despite the applica on of genotyp-
ing, karyotyping and cell marker iden fica on, the use ofmisiden fied and contaminated
cell lines con nues to invalidate results, waste me and resources, andmake comparison
between published works impossible.
3.7 Conclusions
The overall aim of this study was to establish whether the RGC-5 cell line could be used
as a subs tute for primary RGC. From the current data it is evident that the RGC-5 cell
line is not what it was originally reported to be. The RGC-5 cells in our laboratory were
derived from a mouse oligodendroglial lineage and were not ganglion or cone photore-
ceptor cells.
Page | 130
CHAPTER 4
IN VITRO EFFECTS OF CNTF IN PRIMARY
RETINAL CULTURE
Page | 131
4.1 Tes ng the effec veness of CNTF in primary re nal culture
Before a long term in vivo delivery strategy was undertaken, it was decided to look at
the effec veness of CNTF treatment on primary re nal cultures. It was also necessary
to confirm that CNTF could disinhibit RGC neurite outgrowth whilst in an inhibitory en-
vironment. To this end, a dose response experiment was performed to determine the
op mum CNTF concentra on for RGC.
Having determined the op mum CNTF concentra on, it was necessary to test this dose
in the presence of a growth inhibitory ligand. To achieve this, the recombinant Nogo-P4
pep de was chosen to crudely mimic the inhibitory CNS environment a er injury. Nogo-
P4 was selected in preference to central myelin extract for a number of reasons. Firstly,
the recombinant protein is soluble, allowing the dose to be easily modified if op misa-
on was required. In contrast, central myelin extract is lipid rich and contains an array of
inhibitory ligands, therefore it would be necessary to fully characterise and trate each
batch of central myelin extract before use. This is a me consuming and expensive pro-
cess which is further impeded by the presence of contamina ng growth factors, such as
fibroblast growth factor 2 (FGF2). Secondly, Nogo has a well defined signalling profile
which has been extensively characterised — this would make it easier to monitor CNTF
and/or Nogo dependent signalling mechanisms. Once op mised, this neurite growth
inhibitory assay could be used to reproducibly inhibit RGC neurite outgrowth. Further-
more, this assay could be used to test a variety of neuritogenic and/or neuroprotec ve
therapeu cs in vitro.
Page | 132
Several studies suggest that CNTF is ineffec ve at directly s mula ng RGC axon growth
(Cui, et al. 2008), whilst others suggest that cAMP eleva on is required for CNTF to be
effec ve (Müller, et al. 2009). Furthermore, it was recently proposed that CNTF exerts
its effects indirectly through the ac va on of macrophages/microglia (Cen, et al. 2007).
As there has been some controversy regarding the effec veness of CNTF in vitro (Müller
et al. 2009) and in vivo (Müller et al. 2009). It was also necessary to establish whether an
addi onal eleva on in cAMP was required to s mulate neurite outgrowth. To establish
this it was decided to test each CNTF dose in the presence of a cAMP elevator, namely
Forskolin (an ac vator of adenylate cyclase).
As already discussed, cAMP is important both developmentally and a er injury. cAMP
levels not only modulate neuronal responsiveness to myelin inhibitory ligands, but can
also influence their capacity for regrowth (Cai et al. 2001, Cai, et al. 1999). cAMP ac vates
PKA to exert many of its biological effects and acts independently to that of the JAK/STAT,
MAPK/ERK and PI3-K/Akt signalling pathways (Li, et al. 2000).
4.2 Aims
1. Develop an assay for assessing whether recombinant CNTF can disinhibit RGC neu-
rite outgrowth in vitro in the presence of a growth inhibitory ligand.
2. Determine whether an eleva on in cAMP is required for CNTF to effec vely s mu-
late RGC neurite outgrowth.
Page | 133
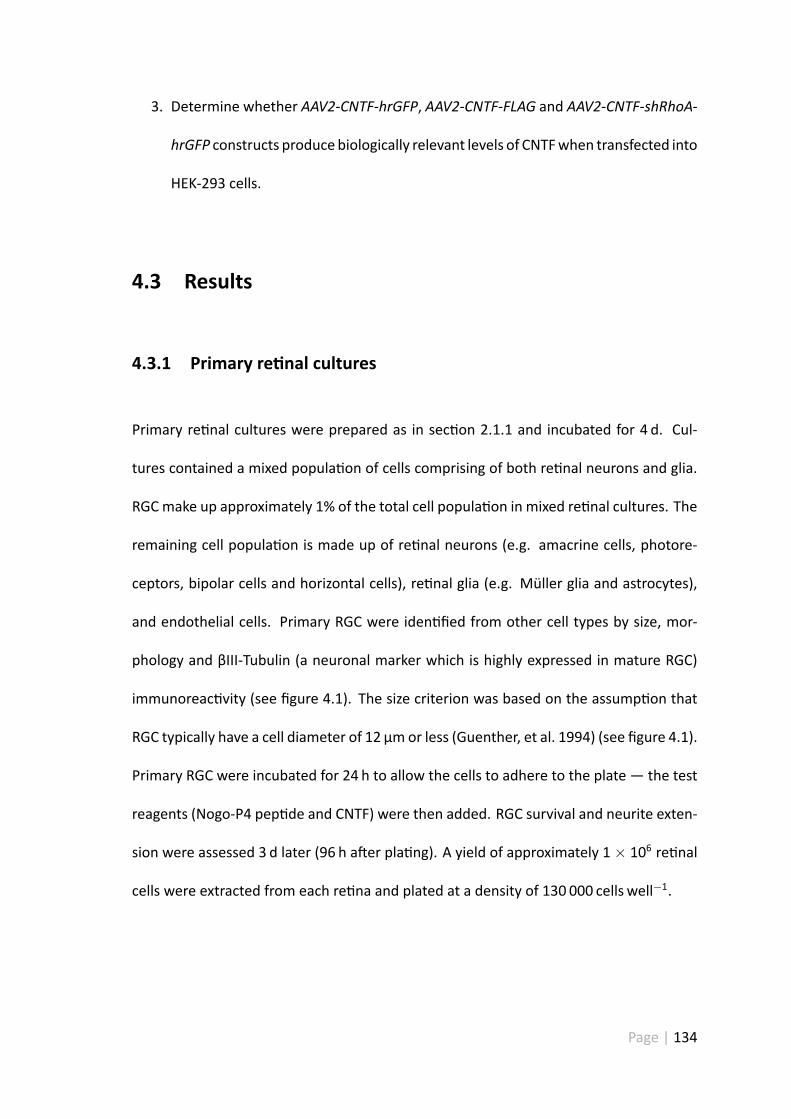
3. Determine whether AAV2-CNTF-hrGFP, AAV2-CNTF-FLAG and AAV2-CNTF-shRhoA-
hrGFP constructs produce biologically relevant levels of CNTFwhen transfected into
HEK-293 cells.
4.3 Results
4.3.1 Primary re nal cultures
Primary re nal cultures were prepared as in sec on 2.1.1 and incubated for 4 d. Cul-
tures contained a mixed popula on of cells comprising of both re nal neurons and glia.
RGCmake up approximately 1% of the total cell popula on in mixed re nal cultures. The
remaining cell popula on is made up of re nal neurons (e.g. amacrine cells, photore-
ceptors, bipolar cells and horizontal cells), re nal glia (e.g. Müller glia and astrocytes),
and endothelial cells. Primary RGC were iden fied from other cell types by size, mor-
phology and βIII-Tubulin (a neuronal marker which is highly expressed in mature RGC)
immunoreac vity (see figure 4.1). The size criterion was based on the assump on that
RGC typically have a cell diameter of 12 µm or less (Guenther, et al. 1994) (see figure 4.1).
Primary RGC were incubated for 24 h to allow the cells to adhere to the plate — the test
reagents (Nogo-P4 pep de and CNTF) were then added. RGC survival and neurite exten-
sion were assessed 3 d later (96 h a er pla ng). A yield of approximately 1× 10⁶ re nal
cells were extracted from each re na and plated at a density of 130 000 cells well−1.
Page | 134
A B
C D
Figure 4.1: Representa ve bright field images of control primary re nal cultures. Primary RGCwere iden fied in culture by their dis nc ve morphology and size. Re nal cells were incubatedfor 24 h to allow the cells to adhere to the plate, all test reagents were added at this me point.Primary RGC typically have a cell diameter of 12 µm or less (Guenther et al. 1994) and tend toextend neurites within 96 h of pla ng. Figture shows control re nal cultures (A.) 24h (B.) 48h (C.)72h (D.) 96h a er pla ng. Black arrows point to the soma of primary RGC, whilst red arrows pointto the neurites.
Page | 135
4.3.2 Forskolin and recombinant CNTF promotes re nal ganglion cell
neurite outgrowth in vitro
A range of CNTF concentra ons was applied to adult rat primary re nal cultures to de-
termine whether recombinant CNTF was capable of promo ng RGC neurite outgrowth
(see figure 4.2) and survival (see figure 4.4) in vitro.
Approximately 130 000 cells well−1were plated and given 24 h to adhere to the plate a er
which treatment was applied. A er a further 72 h the cells were fixed and analysed for
mean length of longest neurite (figure 4.2a) and mean neurite length (figure 4.2b).
Results indicate that CNTF is capable of promo ng neurite outgrowth in culture (see fig-
ure 4.2a) and that this effect can be augmented with increasing concentra ons of pro-
tein. The op mal dosewas deemed to be 100 ngml−1 as applica on of this concentra on
elicited the greatest effect in terms of mean neurite length and mean length of longest
neurite. Treatment with 100 ngml−1 CNTF significantly increased the mean length of
longest neurite from 18.83 µm± 1.67 (untreated control) to 33.89 µm± 2.41 (100 ngml−1
CNTF) and mean neurite length from 17.3 µm ± 0.07 (untreated control) to 29.97 µm ±
0.07 (100 ngml−1 CNTF). See figure 4.5 for representa ve images of this experiment.
Maximal RGCneurite outgrowthwas achievedwhen Forskolinwas added alone (Forskolin
control). Treatmentwith 15 µ Forskolin significantly increased themean length of longest
neurite from 18.82 ± 1.67 (untreated control) to 33.66 ± 2.97 (15 µ Forskolin) andmean
neurite length from 17.36 ± 1.43 (untreated control) to 28.21 ± 2.22 (15 µ Forskolin).
Similar neurite outgrowthmeasurements (meanneurite length andmean length of longest
Page | 136
neurite) were obtained when CNTF (10 ngml−1, 50 ngml−1 and 100 ngml−1) was added
in combina on with 15 µ Forskolin. However, there was no sta s cally significant dif-
ference in neurite length irrespec ve of whether Forskolin was added alone (Forskolin
control) or in combina on with CNTF (10 ngml−1, 50 ngml−1 or 100 ngml−1, see figure
4.2b).
Page | 137
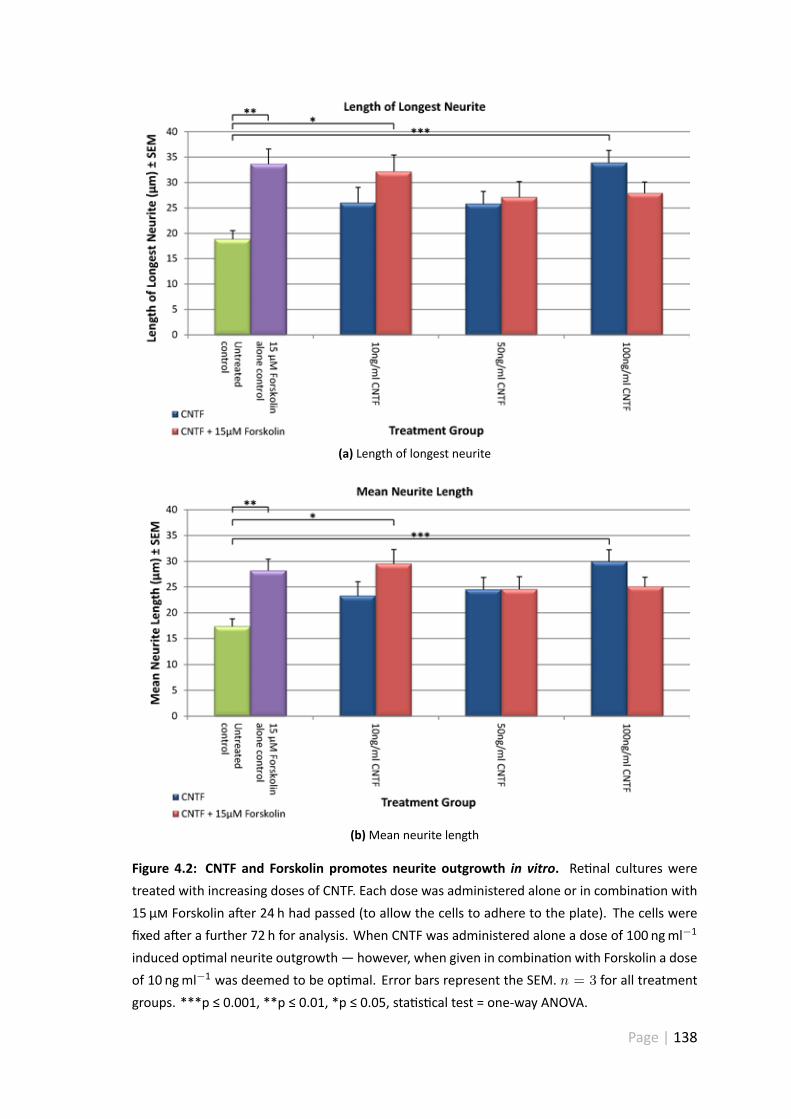
(a) Length of longest neurite
(b)Mean neurite length
Figure 4.2: CNTF and Forskolin promotes neurite outgrowth in vitro. Re nal cultures weretreated with increasing doses of CNTF. Each dose was administered alone or in combina on with15 µ Forskolin a er 24 h had passed (to allow the cells to adhere to the plate). The cells werefixed a er a further 72 h for analysis. When CNTF was administered alone a dose of 100 ngml−1
induced op mal neurite outgrowth— however, when given in combina on with Forskolin a doseof 10 ngml−1 was deemed to be op mal. Error bars represent the SEM. n = 3 for all treatmentgroups. ***p ≤ 0.001, **p ≤ 0.01, *p ≤ 0.05, sta s cal test = one-way ANOVA.
Page | 138
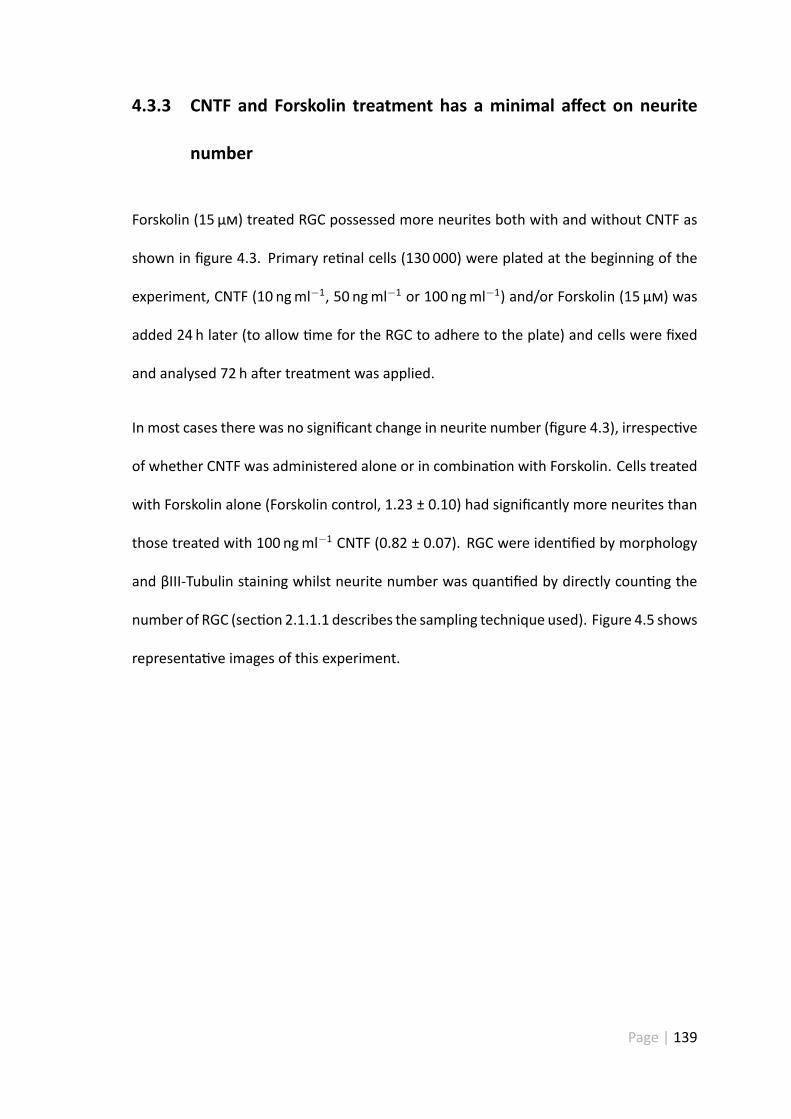
4.3.3 CNTF and Forskolin treatment has a minimal affect on neurite
number
Forskolin (15 µ ) treated RGC possessed more neurites both with and without CNTF as
shown in figure 4.3. Primary re nal cells (130 000) were plated at the beginning of the
experiment, CNTF (10 ngml−1, 50 ngml−1 or 100 ngml−1) and/or Forskolin (15 µ ) was
added 24 h later (to allow me for the RGC to adhere to the plate) and cells were fixed
and analysed 72 h a er treatment was applied.
In most cases there was no significant change in neurite number (figure 4.3), irrespec ve
of whether CNTF was administered alone or in combina on with Forskolin. Cells treated
with Forskolin alone (Forskolin control, 1.23 ± 0.10) had significantly more neurites than
those treated with 100 ngml−1 CNTF (0.82 ± 0.07). RGC were iden fied by morphology
and βIII-Tubulin staining whilst neurite number was quan fied by directly coun ng the
number of RGC (sec on 2.1.1.1 describes the sampling technique used). Figure 4.5 shows
representa ve images of this experiment.
Page | 139
Figure 4.3: CNTF and Forskolin had a minimal affect on neurite number. In most cases, therewas no significant change in neurite number. RGC within the 15 µ Forskolin treatment group(Forskolin control) had significantly more neurites than those in the 100 ngml−1 CNTF treatmentgroup. All Forskolin treatment groups possessed more neurites than their CNTF-treated counter-parts. The control groups consist of an untreated (nega ve) control and a 15 µ Forskolin control.Error bars represent the SEM. n = 3 for all treatment groups. *p ≤ 0.05, sta s cal test = one-wayANOVA.
Page | 140
4.3.4 10 ngml−1 and 50 ngml−1 CNTF caused minor toxicity
Toxicity was seen 72 h a er treatment with 15 µ Forskolin alone (Forskolin control)
compared to the untreated (nega ve) control (RGC number was reduced by 23.96%).
Similar levels of toxicity were observed when Forskolin was administered together with
10 ngml−1 CNTF or 50 ngml−1 CNTF — each of which had a 22.23% reduc on in RGC
cell number compared to untreated controls. There was no significant change in RGC
cell number between 100 ngml−1 CNTF treated and untreated controls. Primary re nal
cultures were fixed and analysed 96 h a er pla ng (72 hour a er CNTF and/or Forskolin
addi on). RGCwere visualised by βIII-Tubulin immunostaining and iden fied by their dis-
nc ve morphology (see sec on 4.3.1). Cell survival was assessed by directly coun ng
the βIII-Tubulin posi ve (red) RGC (see sec on 2.1.1.1 for details of the sampling tech-
nique). As 100 ngml−1 has been shown to be an op mal dose for RGC neurite outgrowth,
survival and toxicity, I decided to use this dose for all future experiments. See figure 4.5
for representa ve images of this experiment.
Page | 141
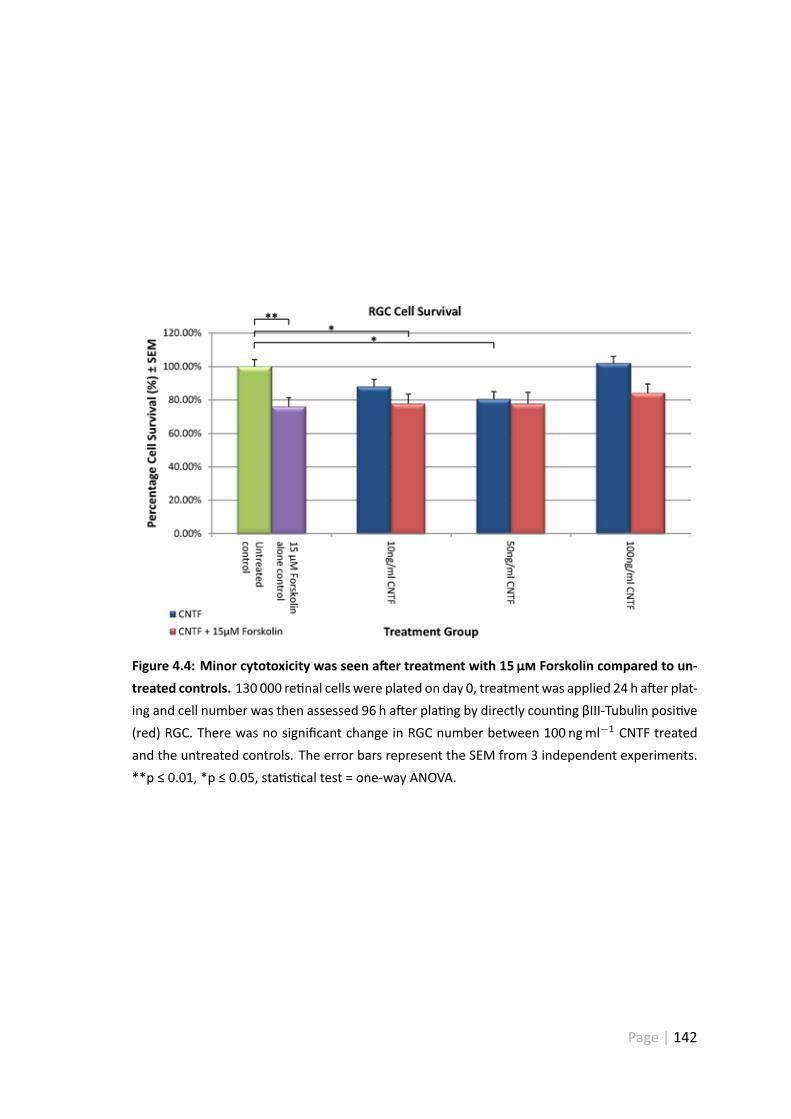
Figure 4.4: Minor cytotoxicity was seen a er treatment with 15 µ Forskolin compared to un-treated controls. 130 000 re nal cells were plated on day 0, treatmentwas applied 24 h a er plat-ing and cell number was then assessed 96 h a er pla ng by directly coun ng βIII-Tubulin posi ve(red) RGC. There was no significant change in RGC number between 100 ngml−1 CNTF treatedand the untreated controls. The error bars represent the SEM from 3 independent experiments.**p ≤ 0.01, *p ≤ 0.05, sta s cal test = one-way ANOVA.
Page | 142
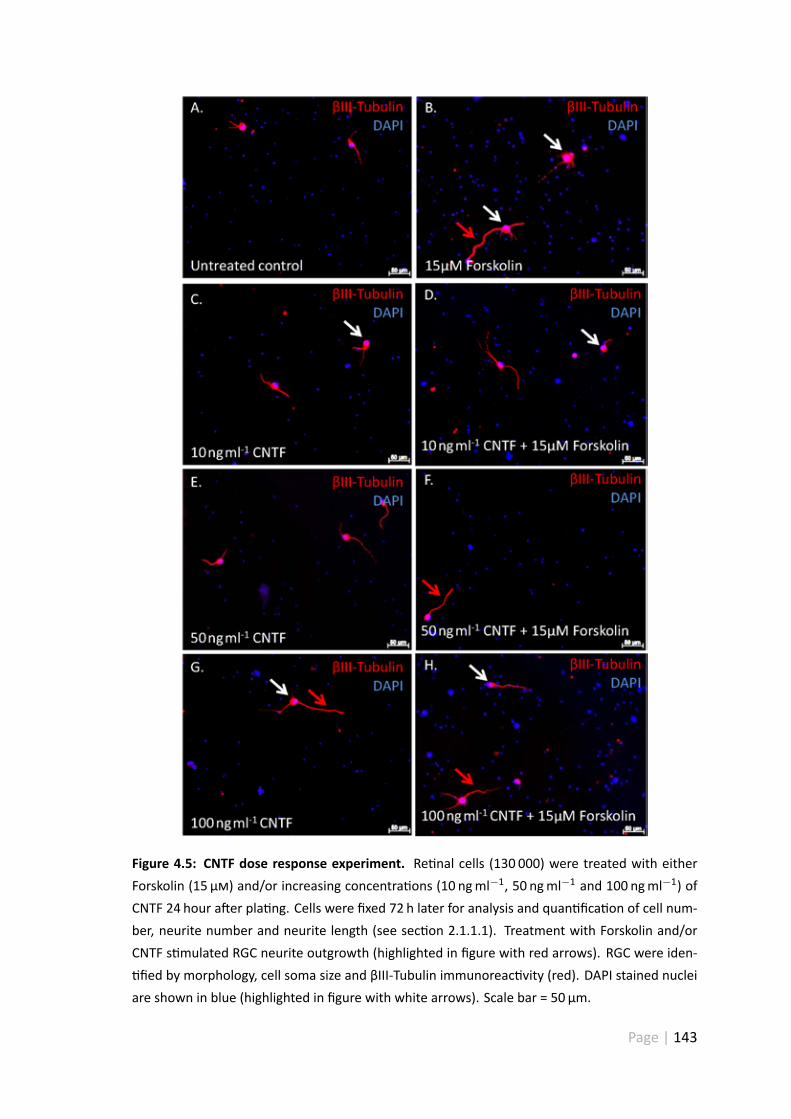
Figure 4.5: CNTF dose response experiment. Re nal cells (130 000) were treated with eitherForskolin (15 µ ) and/or increasing concentra ons (10 ngml−1, 50 ngml−1 and 100 ngml−1) ofCNTF 24 hour a er pla ng. Cells were fixed 72 h later for analysis and quan fica on of cell num-ber, neurite number and neurite length (see sec on 2.1.1.1). Treatment with Forskolin and/orCNTF s mulated RGC neurite outgrowth (highlighted in figure with red arrows). RGC were iden-fied by morphology, cell soma size and βIII-Tubulin immunoreac vity (red). DAPI stained nuclei
are shown in blue (highlighted in figure with white arrows). Scale bar = 50 µm.
Page | 143
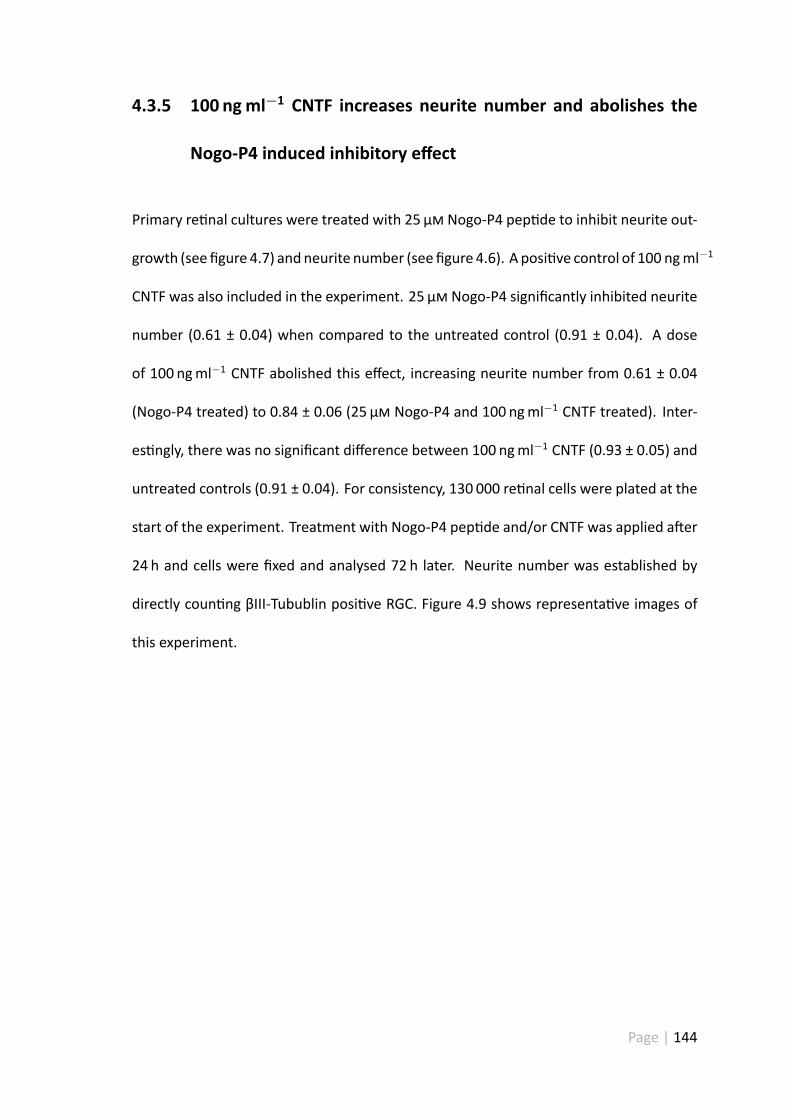
4.3.5 100 ngml−1 CNTF increases neurite number and abolishes the
Nogo-P4 induced inhibitory effect
Primary re nal cultures were treated with 25 µ Nogo-P4 pep de to inhibit neurite out-
growth (see figure 4.7) andneurite number (see figure 4.6). A posi ve control of 100 ngml−1
CNTF was also included in the experiment. 25 µ Nogo-P4 significantly inhibited neurite
number (0.61 ± 0.04) when compared to the untreated control (0.91 ± 0.04). A dose
of 100 ngml−1 CNTF abolished this effect, increasing neurite number from 0.61 ± 0.04
(Nogo-P4 treated) to 0.84 ± 0.06 (25 µ Nogo-P4 and 100 ngml−1 CNTF treated). Inter-
es ngly, there was no significant difference between 100 ngml−1 CNTF (0.93 ± 0.05) and
untreated controls (0.91 ± 0.04). For consistency, 130 000 re nal cells were plated at the
start of the experiment. Treatment with Nogo-P4 pep de and/or CNTF was applied a er
24 h and cells were fixed and analysed 72 h later. Neurite number was established by
directly coun ng βIII-Tubublin posi ve RGC. Figure 4.9 shows representa ve images of
this experiment.
Page | 144
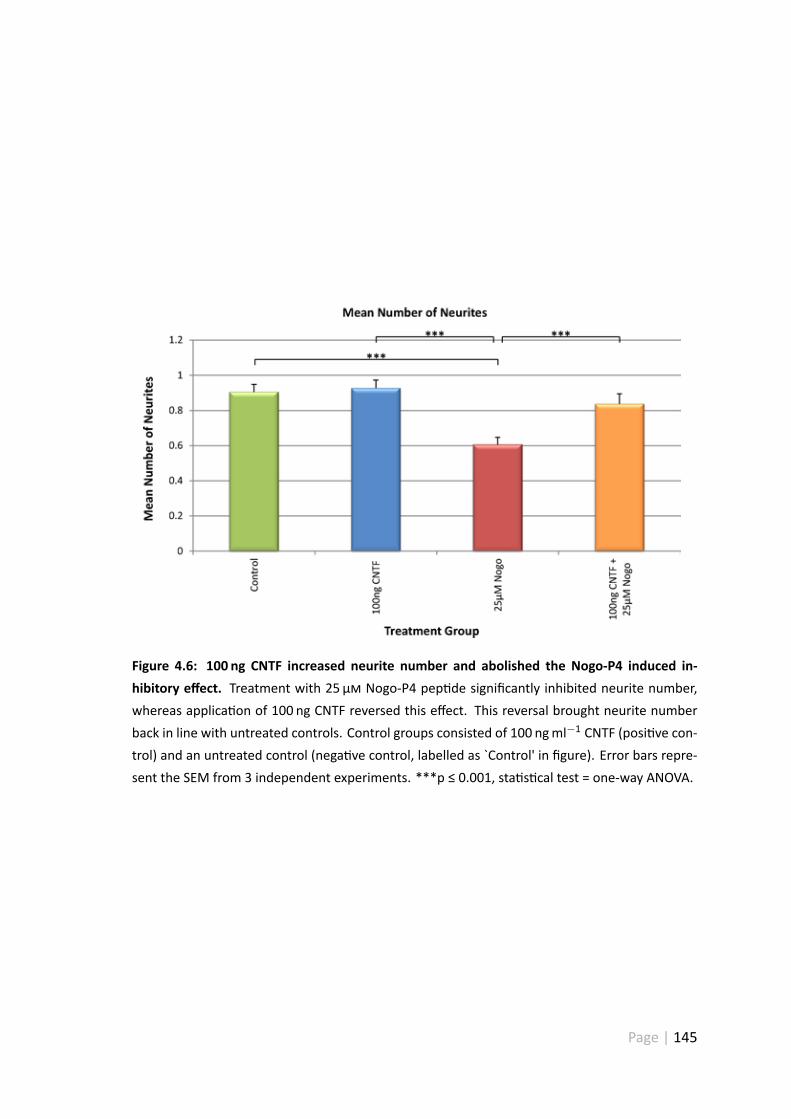
Figure 4.6: 100 ng CNTF increased neurite number and abolished the Nogo-P4 induced in-hibitory effect. Treatment with 25 µ Nogo-P4 pep de significantly inhibited neurite number,whereas applica on of 100 ng CNTF reversed this effect. This reversal brought neurite numberback in line with untreated controls. Control groups consisted of 100 ngml−1 CNTF (posi ve con-trol) and an untreated control (nega ve control, labelled as `Control' in figure). Error bars repre-sent the SEM from 3 independent experiments. ***p ≤ 0.001, sta s cal test = one-way ANOVA.
Page | 145
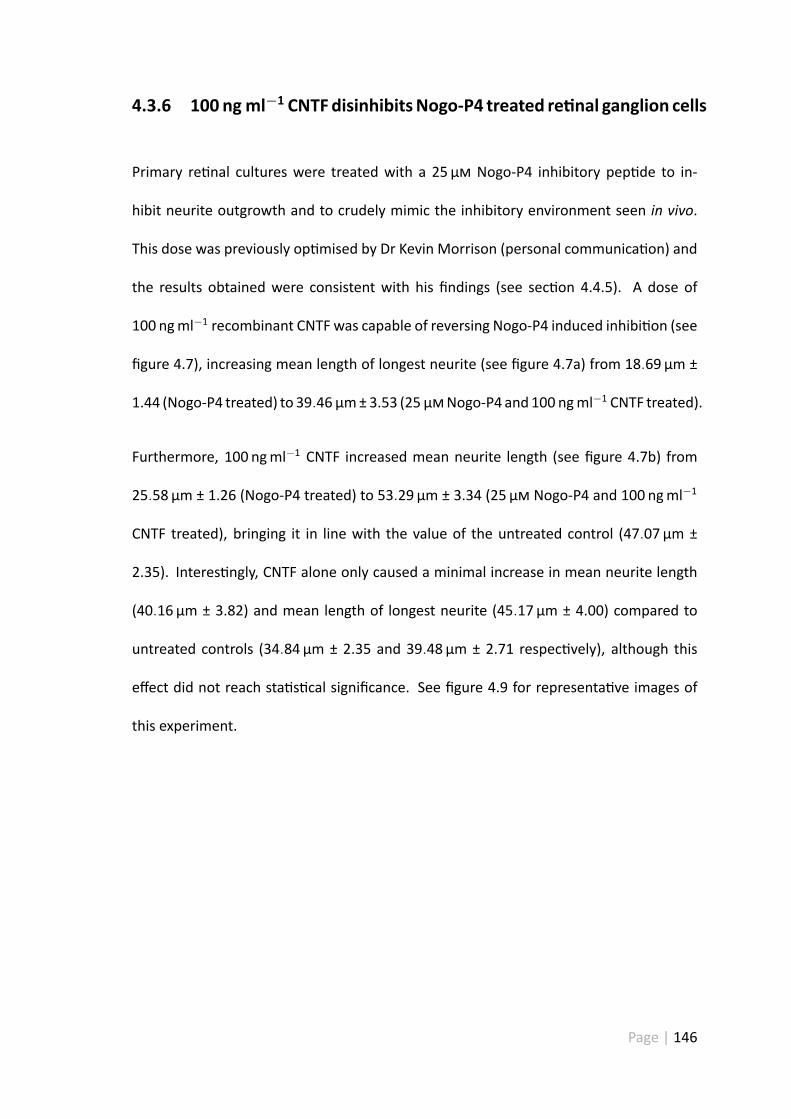
4.3.6 100 ngml−1 CNTFdisinhibitsNogo-P4 treated re nal ganglion cells
Primary re nal cultures were treated with a 25 µ Nogo-P4 inhibitory pep de to in-
hibit neurite outgrowth and to crudely mimic the inhibitory environment seen in vivo.
This dose was previously op mised by Dr Kevin Morrison (personal communica on) and
the results obtained were consistent with his findings (see sec on 4.4.5). A dose of
100 ngml−1 recombinant CNTF was capable of reversing Nogo-P4 induced inhibi on (see
figure 4.7), increasing mean length of longest neurite (see figure 4.7a) from 18.69 µm ±
1.44 (Nogo-P4 treated) to 39.46 µm±3.53 (25 µ Nogo-P4 and100 ngml−1 CNTF treated).
Furthermore, 100 ngml−1 CNTF increased mean neurite length (see figure 4.7b) from
25.58 µm ± 1.26 (Nogo-P4 treated) to 53.29 µm ± 3.34 (25 µ Nogo-P4 and 100 ngml−1
CNTF treated), bringing it in line with the value of the untreated control (47.07 µm ±
2.35). Interes ngly, CNTF alone only caused a minimal increase in mean neurite length
(40.16 µm ± 3.82) and mean length of longest neurite (45.17 µm ± 4.00) compared to
untreated controls (34.84 µm ± 2.35 and 39.48 µm ± 2.71 respec vely), although this
effect did not reach sta s cal significance. See figure 4.9 for representa ve images of
this experiment.
Page | 146
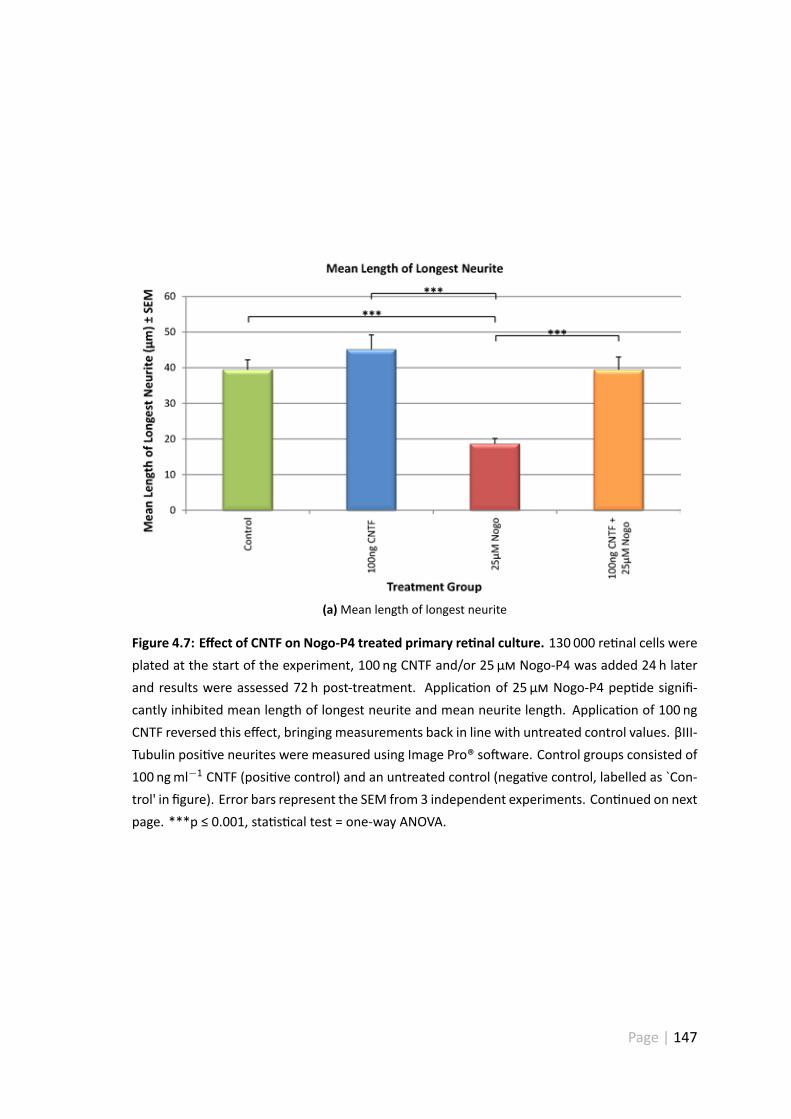
(a)Mean length of longest neurite
Figure 4.7: Effect of CNTF on Nogo-P4 treated primary re nal culture. 130 000 re nal cells wereplated at the start of the experiment, 100 ng CNTF and/or 25 µ Nogo-P4 was added 24 h laterand results were assessed 72 h post-treatment. Applica on of 25 µ Nogo-P4 pep de signifi-cantly inhibited mean length of longest neurite and mean neurite length. Applica on of 100 ngCNTF reversed this effect, bringing measurements back in line with untreated control values. βIII-Tubulin posi ve neurites were measured using Image Pro® so ware. Control groups consisted of100 ngml−1 CNTF (posi ve control) and an untreated control (nega ve control, labelled as `Con-trol' in figure). Error bars represent the SEM from 3 independent experiments. Con nued on nextpage. ***p ≤ 0.001, sta s cal test = one-way ANOVA.
Page | 147
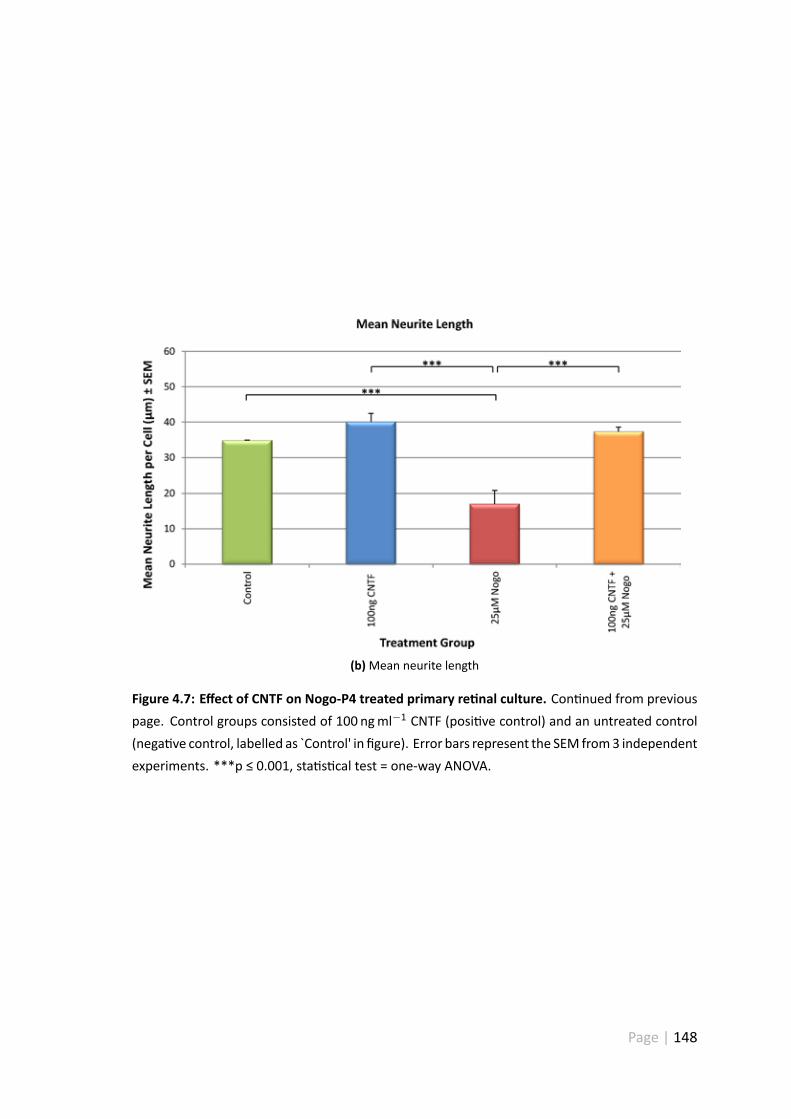
(b)Mean neurite length
Figure 4.7: Effect of CNTF on Nogo-P4 treated primary re nal culture. Con nued from previouspage. Control groups consisted of 100 ngml−1 CNTF (posi ve control) and an untreated control(nega ve control, labelled as `Control' in figure). Error bars represent the SEM from3 independentexperiments. ***p ≤ 0.001, sta s cal test = one-way ANOVA.
Page | 148
4.3.7 Nogo-P4 treatment had no effect on RGC survival
Results show that there was no significant difference in RGC survival between the un-
treated control (nega ve control) and each of the treatment groups a er 72 h, see figure
4.8. RGC were visualised by βIII-Tubulin immunostaining and iden fied by their dis nc-
ve morphology (see sec on 4.3.1). Cell survival was assessed by directly coun ng βIII-
Tubulin posi ve (red) RGC (see sec on 2.1.1.1 for details of the sampling technique). See
figure 4.9 for representa ve images of this experiment.
Figure 4.8: Nogo-P4 treatment had no effect on RGC survival. RGC were plated (at a densityof 130 000 cells well−1) and incubated for 24 h, treatment was then applied. A er a further 72 h(96 h a er pla ng) the cells were fixed and analysed. RGC survival was not affected by any ofthe treatment groups. No significant difference was observed in RGC number between treatmentgroups and the untreated control (nega ve control). Control groups consisted of 100 ngml−1
CNTF (posi ve control, labelled as `Control' in figure) and untreated cells served as a nega vecontrol. Error bars represent the SEM from 3 independent experiments. Sta s cal test = one-way ANOVA.
Page | 149
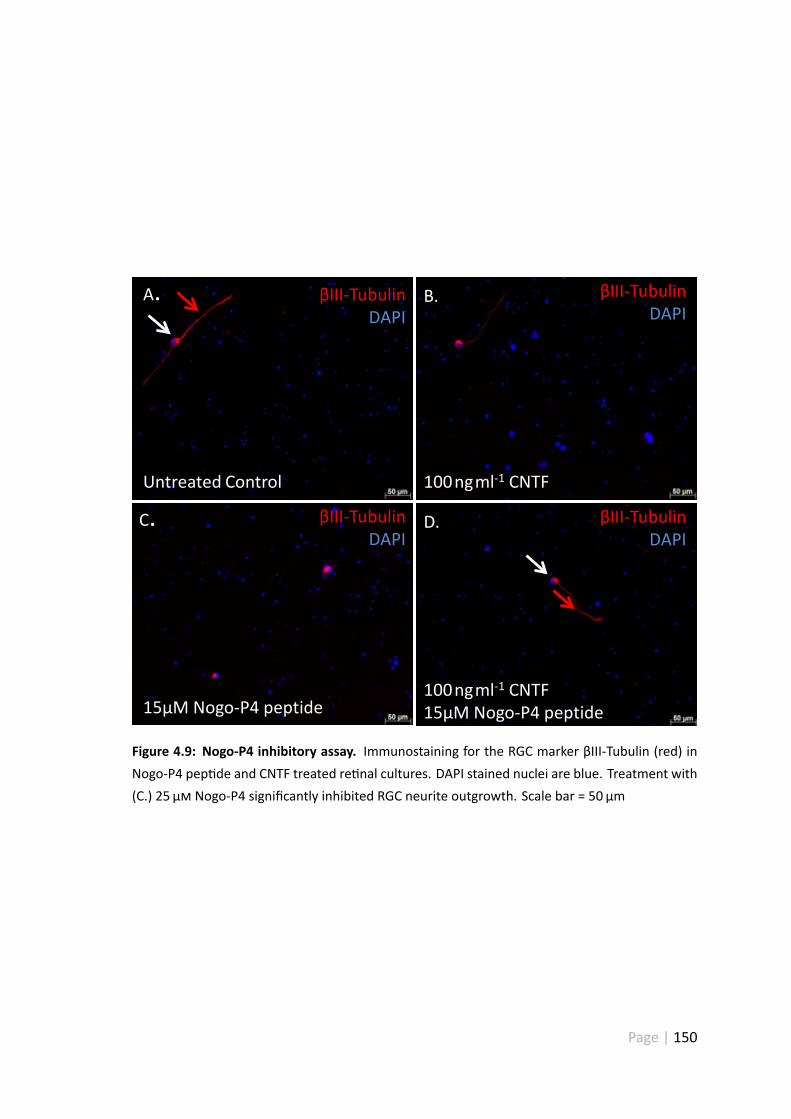
B.
100 ng ml-1 CNTF
ɴIII-Tubulin
DAPI
C.
15µM Nogo-P4 peptide
ɴIII-Tubulin
DAPI
A. ɴIII-Tubulin
DAPI
Untreated Control
D.
100 ng ml-1 CNTF
15µM Nogo-P4 peptide
ɴIII-Tubulin
DAPI
Figure 4.9: Nogo-P4 inhibitory assay. Immunostaining for the RGC marker βIII-Tubulin (red) inNogo-P4 pep de and CNTF treated re nal cultures. DAPI stained nuclei are blue. Treatment with(C.) 25 µ Nogo-P4 significantly inhibited RGC neurite outgrowth. Scale bar = 50 µm
Page | 150
4.3.8 Summary of results
A range of CNTF concentra ons (10 ngml−1, 50 ngml−1 and 100 ngml−1) were applied to
adult primary re nal cultures to determine whether recombinant CNTF could promote
RGC neurite outgrowth and survival in vitro. A dose of 100 ngml−1 CNTF was found to be
op mum since this concentra on induced maximal neurite outgrowth and survival.
In addi on to this, each concentra on of CNTF was tested in the presence of Forskolin
(15 µ ) – this was done to find out whether cAMP eleva onwas required to enhance the
neuritogenic effects of CNTF. Interes ngly, the addi on of CNTF (10 ngml−1, 50 ngml−1
or 100 ngml−1) did not significantly augment neurite outgrowth measurements com-
pared to treatment with Forskolin alone (this is discussed in sec on 4.4.1). In most cases
there was no significant change in neurite number, irrespec ve of whether Forskolin
(15 µ ) was administered alone or in combina on with CNTF. Minor toxicity was induced
by 15 µ Forskolin when given in combina on with 10 ngml−1 and 50 ngml−1 CNTF.
The op mised dose of 100 ngml−1 CNTFwas then tested in a Nogo-P4 neurite outgrowth
inhibitory assay. Nogo-P4 was added to primary re nal cultures to inhibit RGC neurite
outgrowth. Results show that CNTF (100 ngml−1) was capable of disinhibi ng RGC neu-
rite outgrowth when given in combina on with Nogo-P4 (25 µ ). In this experiment,
treatment with 100 ngml−1 CNTF alone did not significantly enhance RGC neurite out-
growth compared to the untreated control.
Page | 151
4.4 Discussion
4.4.1 Forskolinwas effec ve at s mula ngRGCneurite outgrowthwhen
administered alone or in combina on with a low dose of CNTF
Treatment with Forskolin (a cAMP elevator) alone significantly enhanced mean RGC neu-
rite length and mean length of longest neurite compared to untreated controls. This was
hardly surprising since cAMP eleva on can s mulate RGC neurite outgrowth in vitro (Cai
et al. 1999) and can promote RGC axon regenera on in vivo (Monsul, et al. 2004). A
similar effect was observed when Forskolin was applied in combina on with 10 ngml−1
CNTF.
Interes ngly, when 10 ngml−1 CNTF was added alone the neuritogenic effects were at-
tenuated. This phenomenon is consistent with previous studies that suggest treatment
with low doses of CNTF (e.g. 10 ngml−1) is insufficient to promote significant RGC neurite
outgrowth (Jo, et al. 1999).
Maximal effects in terms of mean neurite length and mean length of longest neurite
were achieved using Forskolin alone or 100 ngml−1 CNTF alone. Supplementa on with
Forskolin caused a modest increase in RGC mean neurite length and mean length of
longest neurite — however, this effect decreased with higher concentra ons of CNTF
(50 ngml−1, 100 ngml−1).
This result may have been a consequence of CNTF receptor satura on and/or CNTF re-
ceptor down-regula on/desensi sa on. It is well documented that prolonged exposure
Page | 152
to agonists can lead to receptor down-regula on. This is certainly true in the case of
BDNF, where it has been demonstrated that con nuous s mula on with recombinant
protein leads to a reduc on in TrkB protein and mRNA levels in rat hippocampal neurons
(Frank, et al. 1996).
Furthermore, a er ON injury RGC begin to lose their ability to respond to NTFs, pre-
sumably through the loss of their respec ve receptors and/or perturba on of protein
trafficking. Like BDNF, a similar decline in responsiveness has been seen a er CNTF ad-
ministra on and this decline has been associated with a reduc on in CNTFRɑ expression
(Miotke, et al. 2007). This is important since CNTFRɑ is a major component of the CNTF
tripar te receptor complex. Likewise, it is possible that CNTFRɑ expression may be af-
fected by re nal dissocia on, since this process effec vely disconnects RGC from their
respec ve targets. However this seems unlikely since all RGCs were isolated using the
same process, and were responsive to CNTF treatment when given at the correct dose
(100 ngml−1 CNTF).
Alterna vely, a lower concentra on of Forskolin may be required to op mally s mulate
neurite outgrowthwhen high concentra ons of CNTF are present. Whilst 15 µ Forskolin
may be adequate to s mulate significant neurite outgrowth when supplied alone, it may
be too highwhen given in combina onwith 50 ngml−1 or 100 ngml−1 CNTF. It is also pos-
sible that this dose of Forskolin (15 µ ) saturated the system, preven ng further neurite
outgrowth from being achieved. Ideally I should have performed a Forskolin dose re-
sponse experiment to determine whether this was case, and to find out whether 15 µ
Forskolin was indeed the op mum concentra on.
Page | 153
Since re nal cultures contain a variety of different cell types one must also consider the
resident glial popula on. CNTF and/or Forskolin treatment may, to a greater or lesser ex-
tent, have an effect on this popula on. This effect maymanifest itself through changes in
metabolism, energy consump on, neurotrophic factor produc on or neurotrophic factor
release (Park, et al. 2004). Any of which may directly or indirectly have an effect on RGC
neurite outgrowth.
4.4.2 100 ngml−1 CNTF significantly increased mean neurite length
Op mal neurite outgrowth was achieved when 100 ngml−1 CNTF was added alone. This
suggests that CNTF treatment is capable of s mula ng neurite outgrowth without the
need for exogenous cAMP eleva on, a finding consistent with that of Müller et al (Müller
et al. 2009). Treatment with 100 ngml−1 CNTF was deemed to be op mal in terms of
mean neurite length and mean length of longest neurite.
Interes ngly Müller et al tested much higher doses of recombinant CNTF compared to
those tested in chapter 4 (10 ngml−1, 50 ngml−1 and 100 ngml−1). Müller et al found
that a concentra on of 10 ngml−1 CNTF was sufficient to promote significant RGC neu-
rite outgrowth (Müller et al. 2009). In contrast, no significant increase in RGC neurite
outgrowth was documented at this concentra on in figure 4.2. This outcome could have
been due to differences in re nal cell prepara on or pla ng density. The enhanced neu-
ritogenic effects, seen at 10 ngml−1 CNTF, could be explained by differences in glial num-
ber and/or contact dependent neurotrophic support.
Page | 154
Müller et al found op mum RGC neurite outgrowth was achieved at much higher con-
centra ons of CNTF (200 ngml−1 CNTF) (Müller et al. 2009) — this was exactly double
the concentra on of my op mum (100 ngml−1). It is possible that recombinant CNTF is
much more effec ve at s mula ng RGC neurite outgrowth at higher concentra on (e.g.
at 200 ngml−1 CNTF). However, higher doses (e.g. concentra ons >100 ngml−1) of CNTF
would need to be tested to determine whether this was the case. Unfortunately direct
comparisons in RGC neurite outgrowth could not bemade at 100 ngml−1 CNTF, since this
concentra on was not tested in the publica on.
Interes ngly, Müller et al used the same concentra on of Forskolin (15 µ ) to deter-
mine whether a rise in cAMP was required for CNTF to be effec ve at s mula ng RGC
neurite outgrowth (Müller et al. 2009). In agreement with my results, Forskolin (15 µ )
was capable of s mula ng significant RGC neurite outgrowth, when administered alone.
However, it was not required for CNTF to promote significant neurite outgrowth in vitro.
In terms of RGC survival Forskolin groups could not be compared since survival data was
not shown in this study (for these groups) and as a result it’s impossible to tell whether
the same levels of RGC toxicity were observed. The CNTF-alone groups can be compared
and agree with my data (see figure 4.4), there was no significant change in RGC number
a er treatment with increasing doses of CNTF (without Forskolin) (Müller et al. 2009).
Page | 155
4.4.3 Treatment with Forskolin led a to a small reduc on in RGC num-
ber
Cytotoxicity was seen a er treatment with 15 µ Forskolin, compared to untreated con-
trols. Similar levels of toxicity were observed when Forskolin was administered together
with 10 ngml−1 or 50 ngml−1 CNTF. Since cell counts were not performed for other re -
nal cell popula ons, it is unclear as towhether Forskolin caused the death of any other cell
types. As a result, it is difficult to establish whether RGC cell death was induced directly
through exposure to Forskolin or indirectly — through the loss of glial cells (and contact
dependent neurotrophic support). It is possible that Forskolin had an adverse effect on
glial cell func on and that this may have contributed to the cytotoxicity seen. There was
no significant change in RGC cell number between the 100 ngml−1 CNTF treatment group
and untreated controls. 100 ngml−1 CNTF was deemed to be op mal in terms of RGC
neurite outgrowth and survival. As a result this dose was used in all future experiments.
4.4.4 CNTF and Forskolin had aminimal effect onmeanneurite number
Treatment with CNTF and/or Forskolin had no significant effect on RGC neurite number
compared to untreated controls. The CNTF plus Forskolin treated groups tended to have
more neurites than their CNTF alone treated counterparts, although this did not reach
sta s cal significance. It is important to note that this experiment had a rela vely low n
number (n = 3) and it is possible that this trendmay have reached sta s cal significance
with further repe on. In the visual systemRGC typically possess a single long axonwhich
Page | 156
degenerates a er ONC. Consequently neurite length and RGC number were considered
to be a more important measure of axogenic and/or survival response.
4.4.5 25 µ Nogo-P4 pep de significantly inhibited RGC neurite out-
growth
Treatment of RGC with 25 µ recombinant Nogo-P4 pep de significantly inhibited neu-
rite outgrowth whilst causing minimal toxicity. This factor was important as we needed
to be able to differen ate between cells lacking neurites as a consequence of apop-
tosis/necrosis and those lacking neurites as a result of Nogo-P4 induced inhibi on. A
dose of 25 µ Nogo-P4 was selected based upon previous work from our laboratory
(Morrison 2011). In his 2010 study, Dr Kevin Morrison found that doses higher than
25 µ caused similar levels of RGC neurite inhibi on, but induced significant cell death
(Morrison 2011). In a similar study (Wang & Zhu 2008), Wang et al used Nogo-P4 to in-
hibit neuronal stem cell differen a on. They found that a dose of 4 µ Nogo-P4 was suf-
ficient to significantly inhibit neurite outgrowth, however, it is important to note that the
cells under inves ga onwere neural stem cells that may bemore suscep ble to Nogo-P4
treatment than mature RGC.
Page | 157
4.4.6 Treatment with 25 µ Nogo-P4 pep de had no impact on RGC
survival
Therewas no sta s cally significant difference in RGCnumber a er treatmentwith 25 µ
Nogo-P4, a finding that is consistentwith previouswork (Morrison 2011). As this dose did
not cause significant cell death it was concluded that the growth inhibi on observed was
due to growth cone collapse and not a consequence of RGC necrosis and/or apoptosis.
4.4.7 Treatment with 100 ngml−1 CNTF disinhibited Nogo-P4 pep de
treated RGC
Treatment with 100 ngml−1 recombinant CNTF abolished the inhibitory effects of Nogo-
P4 pep de and brought neurite measurements back in line with untreated controls. In-
teres ngly 100 ngml−1 CNTF did not significantly s mulate neurite outgrowth above that
of untreated controls. It is possible that significance may be achieved with further repe-
on since this experiment has a rela vely low n number (n = 3).
4.5 Conclusions
The purpose of this chapter was to inves gate the neuritogenic and/or neuroprotec ve
effects of CNTF in vitro. To this end, a dose response experiment was performed to deter-
mine the op mum CNTF dose. A concentra on of 100 ngml−1 CNTF was deemed to be
op mal since it significantly enhanced neurite outgrowth compared to other CNTF con-
Page | 158
centra ons tested. Upon finding an appropriate concentra on, the disinhibitory proper-
es of CNTF could then be inves gated. To accomplish this, Nogo-P4 pep de was used
to inhibit RGC neurite outgrowth. Results show that Nogo-P4 pep de reproducibly inhib-
ited RGC neurite outgrowth, this result was consistent with previous findings fromour lab
(Morrison 2011). The use of such an inhibitory assay has many applica ons and could be
used to test a host of poten al therapeu cs in vitro. CNTF (100 ngml−1) was capable
of enhancing RGC neurite outgrowth when administered alone (in some circumstances),
but had a disinhibitory effect when given in combina onwith Nogo-P4 pep de. Forskolin
significantly enhanced RGC neurite outgrowth when given alone or in combina on with
a low dose of CNTF, however it was not required to poten ate the neuritogenic effects
of CNTF.
Page | 159
CHAPTER 5
AAV2 AS A VECTOR FOR DELIVERING
CNTF TO THE VISUAL SYSTEM
Page | 160
5.1 Introduc on
In the previous chapter it was established that recombinant CNTF could be used to disin-
hibit neurite outgrowth inNogo-P4 treatedprimary RGC. Itwas also shown that 100 ngml−1
CNTF could significantly enhance RGC neurite outgrowth in a dose response experiment.
Having established the effec veness of recombinant CNTF in vitro, the next step would
be to develop and test a viral vector CNTF gene delivery system. To accomplish this AAV2-
CNTF-hrGFP constructs were provided by Dr. Michael Douglas (Molecular Neuroscience
Group, University of Birmingham) to be used in a series of transfec on experiments. As
CNTF does not have a classical secretory sequence the CNTF transgene was modified
to include the first 20 amino acids of the rat ppNGF. This region of the NGF gene con-
tains a classical secre on sequence, allowing CNTF to be released from HEK-293 cells
a er transfec on. CNTF ELISAs could then be performed on HEK-293 condi oned media
to determine whether the constructs produce CNTF. It was decided to include a FLAG-
tagged construct as it would allow discrimina on between CNTF transgene products and
endogenous CNTF levels in vivo (since the transgene was designed using a rat CNTF se-
quence). Secondly, the presence of a FLAG-tag would facilitate any purifica on a empts.
The final CNTF construct included an shRNA to knockdown RhoA and silence the growth
inhibitory signalling cascade (for details on RNAi see sec on 1.16). The aim of this was
to launch a two pronged a ack on RGC axons — driving growth through the secre on of
CNTF whilst preven ng growth cone collapse through the knockdown of RhoA.
Page | 161
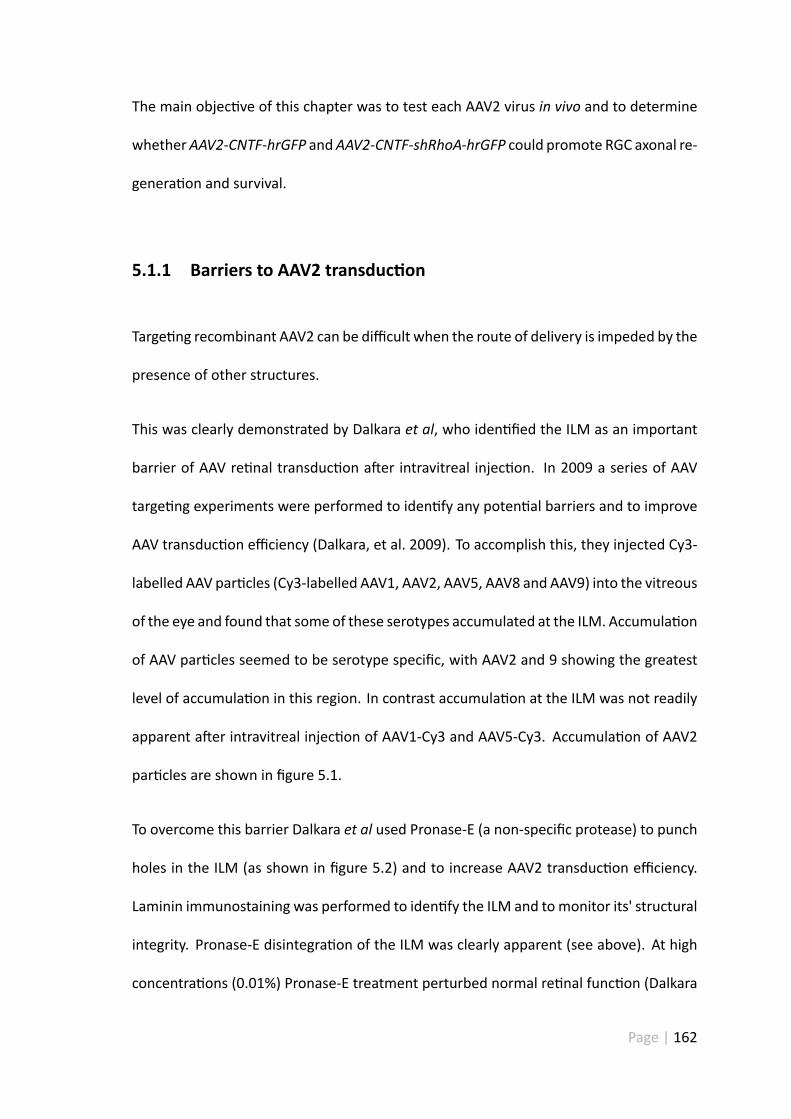
The main objec ve of this chapter was to test each AAV2 virus in vivo and to determine
whetherAAV2-CNTF-hrGFP andAAV2-CNTF-shRhoA-hrGFP could promote RGC axonal re-
genera on and survival.
5.1.1 Barriers to AAV2 transduc on
Targe ng recombinant AAV2 can be difficult when the route of delivery is impeded by the
presence of other structures.
This was clearly demonstrated by Dalkara et al, who iden fied the ILM as an important
barrier of AAV re nal transduc on a er intravitreal injec on. In 2009 a series of AAV
targe ng experiments were performed to iden fy any poten al barriers and to improve
AAV transduc on efficiency (Dalkara, et al. 2009). To accomplish this, they injected Cy3-
labelled AAV par cles (Cy3-labelled AAV1, AAV2, AAV5, AAV8 and AAV9) into the vitreous
of the eye and found that some of these serotypes accumulated at the ILM. Accumula on
of AAV par cles seemed to be serotype specific, with AAV2 and 9 showing the greatest
level of accumula on in this region. In contrast accumula on at the ILM was not readily
apparent a er intravitreal injec on of AAV1-Cy3 and AAV5-Cy3. Accumula on of AAV2
par cles are shown in figure 5.1.
To overcome this barrier Dalkara et al used Pronase-E (a non-specific protease) to punch
holes in the ILM (as shown in figure 5.2) and to increase AAV2 transduc on efficiency.
Laminin immunostaining was performed to iden fy the ILM and tomonitor its' structural
integrity. Pronase-E disintegra on of the ILM was clearly apparent (see above). At high
concentra ons (0.01%) Pronase-E treatment perturbed normal re nal func on (Dalkara
Page | 162
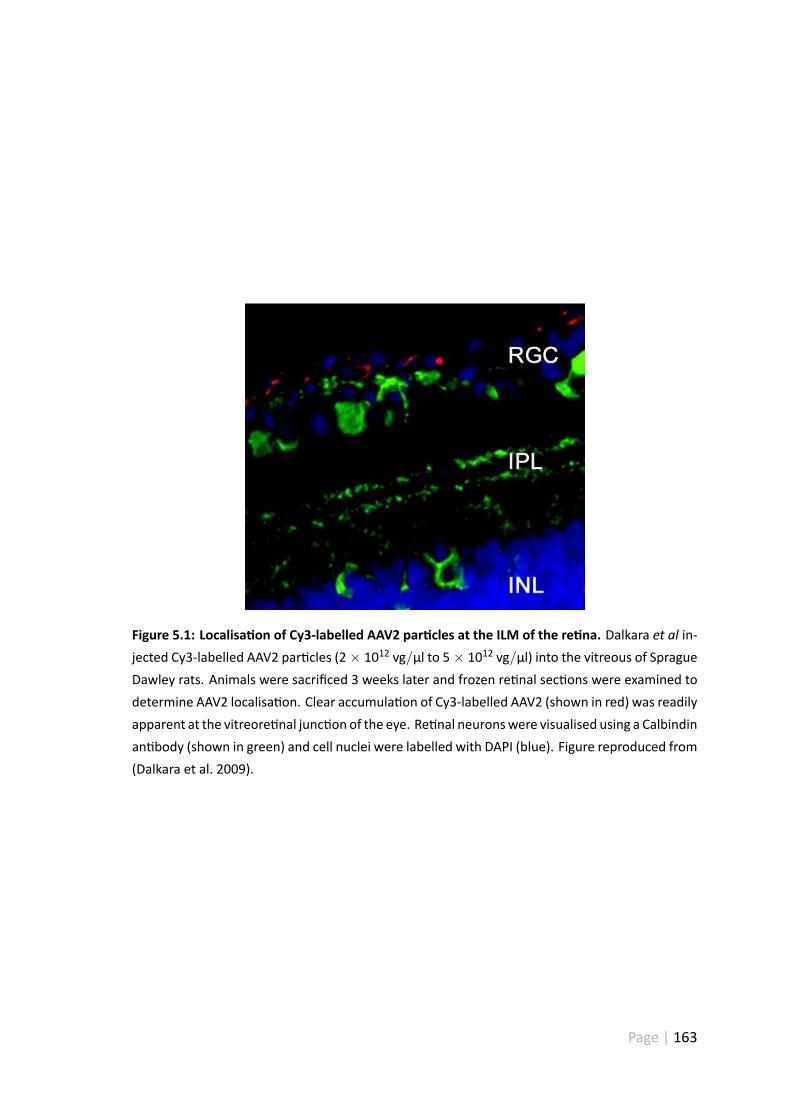
Figure 5.1: Localisa on of Cy3-labelled AAV2 par cles at the ILM of the re na. Dalkara et al in-jected Cy3-labelled AAV2 par cles (2× 10¹² vg/µl to 5× 10¹² vg/µl) into the vitreous of SpragueDawley rats. Animals were sacrificed 3 weeks later and frozen re nal sec ons were examined todetermine AAV2 localisa on. Clear accumula on of Cy3-labelled AAV2 (shown in red) was readilyapparent at the vitreore nal junc on of the eye. Re nal neuronswere visualised using a Calbindinan body (shown in green) and cell nuclei were labelled with DAPI (blue). Figure reproduced from(Dalkara et al. 2009).
Page | 163
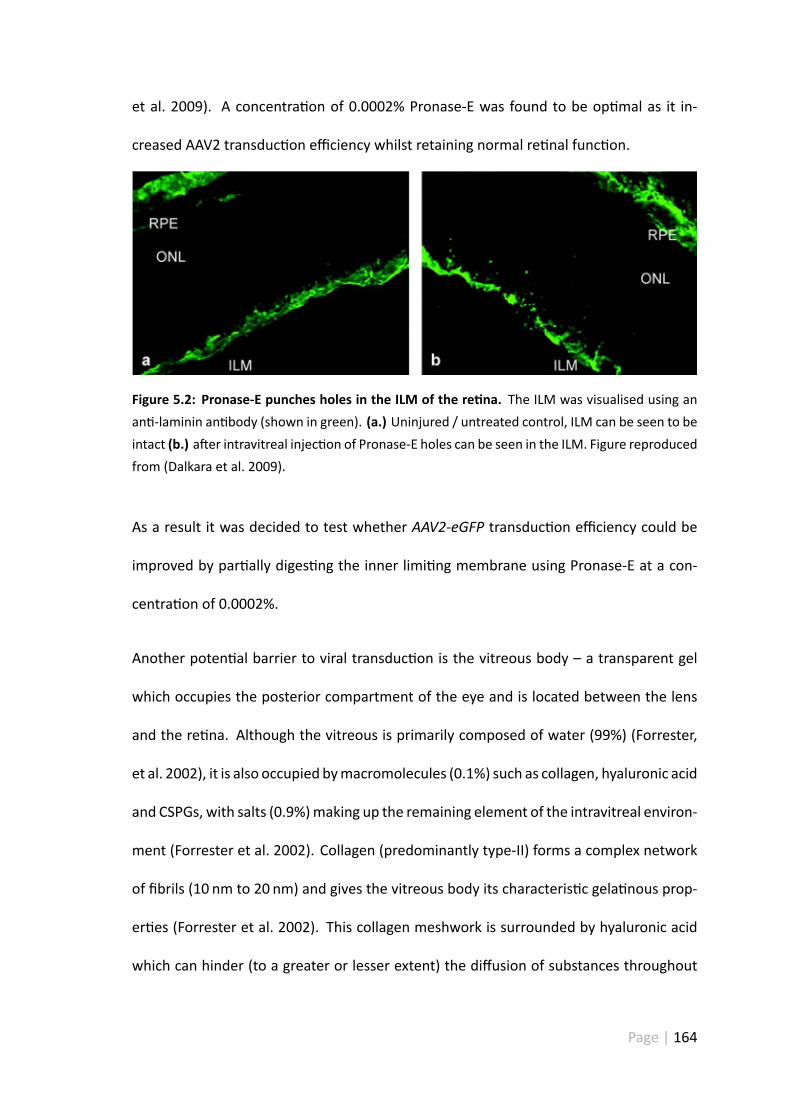
et al. 2009). A concentra on of 0.0002% Pronase-E was found to be op mal as it in-
creased AAV2 transduc on efficiency whilst retaining normal re nal func on.
Figure 5.2: Pronase-E punches holes in the ILM of the re na. The ILM was visualised using anan -laminin an body (shown in green). (a.) Uninjured / untreated control, ILM can be seen to beintact (b.) a er intravitreal injec on of Pronase-E holes can be seen in the ILM. Figure reproducedfrom (Dalkara et al. 2009).
As a result it was decided to test whether AAV2-eGFP transduc on efficiency could be
improved by par ally diges ng the inner limi ng membrane using Pronase-E at a con-
centra on of 0.0002%.
Another poten al barrier to viral transduc on is the vitreous body – a transparent gel
which occupies the posterior compartment of the eye and is located between the lens
and the re na. Although the vitreous is primarily composed of water (99%) (Forrester,
et al. 2002), it is also occupied bymacromolecules (0.1%) such as collagen, hyaluronic acid
and CSPGs, with salts (0.9%)making up the remaining element of the intravitreal environ-
ment (Forrester et al. 2002). Collagen (predominantly type-II) forms a complex network
of fibrils (10 nm to 20 nm) and gives the vitreous body its characteris c gela nous prop-
er es (Forrester et al. 2002). This collagen meshwork is surrounded by hyaluronic acid
which can hinder (to a greater or lesser extent) the diffusion of substances throughout
Page | 164
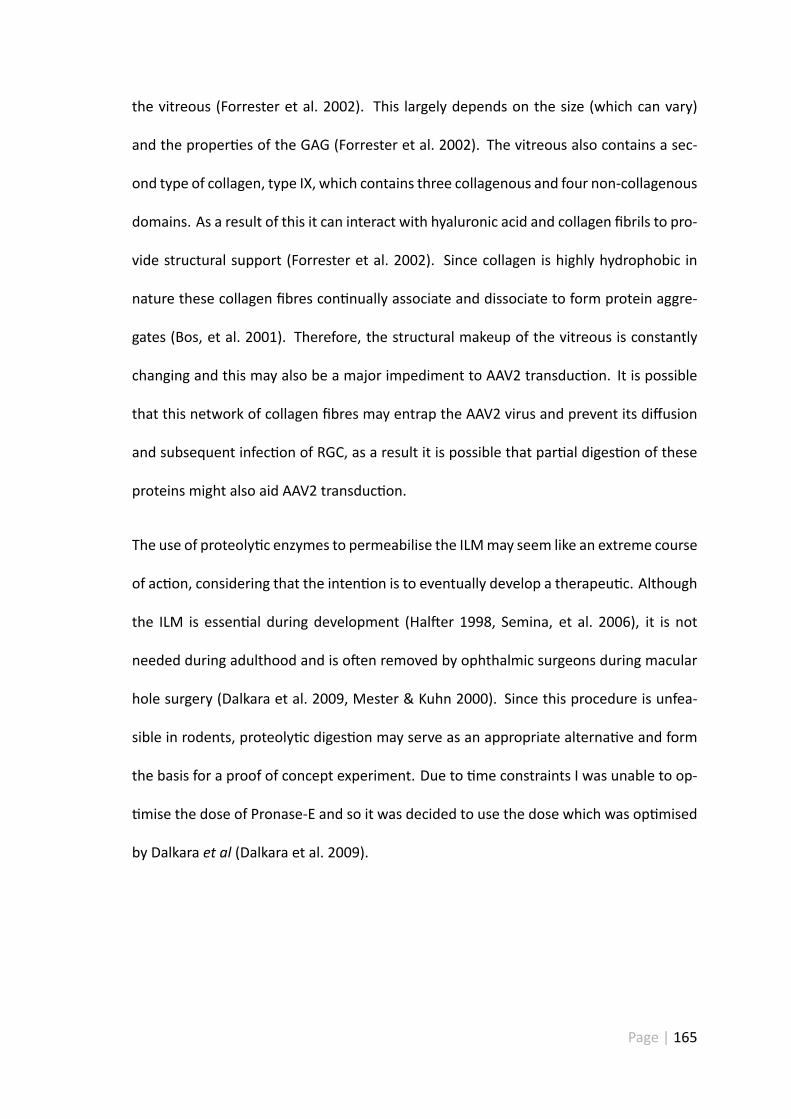
the vitreous (Forrester et al. 2002). This largely depends on the size (which can vary)
and the proper es of the GAG (Forrester et al. 2002). The vitreous also contains a sec-
ond type of collagen, type IX, which contains three collagenous and four non-collagenous
domains. As a result of this it can interact with hyaluronic acid and collagen fibrils to pro-
vide structural support (Forrester et al. 2002). Since collagen is highly hydrophobic in
nature these collagen fibres con nually associate and dissociate to form protein aggre-
gates (Bos, et al. 2001). Therefore, the structural makeup of the vitreous is constantly
changing and this may also be a major impediment to AAV2 transduc on. It is possible
that this network of collagen fibres may entrap the AAV2 virus and prevent its diffusion
and subsequent infec on of RGC, as a result it is possible that par al diges on of these
proteins might also aid AAV2 transduc on.
The use of proteoly c enzymes to permeabilise the ILMmay seem like an extreme course
of ac on, considering that the inten on is to eventually develop a therapeu c. Although
the ILM is essen al during development (Hal er 1998, Semina, et al. 2006), it is not
needed during adulthood and is o en removed by ophthalmic surgeons during macular
hole surgery (Dalkara et al. 2009, Mester & Kuhn 2000). Since this procedure is unfea-
sible in rodents, proteoly c diges on may serve as an appropriate alterna ve and form
the basis for a proof of concept experiment. Due to me constraints I was unable to op-
mise the dose of Pronase-E and so it was decided to use the dose which was op mised
by Dalkara et al (Dalkara et al. 2009).
Page | 165
5.2 Hypothesis
1. Intravitreal delivery of AAV2-CNTF-hrGFP and AAV2-CNTF-shRhoA-hrGFP will pro-
mote increased RGC survival and axonal regenera on a er ONC.
2. Co-administra on with Pronase-E will enhance AAV2 transduc on efficiency.
5.3 Aims
1. To promote RGC axonal regenera on and survival through the delivery of AAV2-
CNTF-hrGFP and AAV2-CNTF-shRhoA-hrGFP
2. Determine whether co-injec on with 0.0002% Pronase-E can increase AAV2-eGFP
transfec on efficiency.
5.4 Results
5.4.1 Design and valida on of shRhoA containing constructs
The biological ac vi es of shRNA containing constructs were designed and validated by
Dr. Mike Douglas. As well as providing the shRhoA sequence present within the AAV2-
CNTF-shRhoA-hrGFP plasmid, Dr. Douglas also designed the primers required to deter-
mine the orienta on of the shRhoA insert. To establish biological ac vity, Dr. Douglas
performed a series of COS-1 cell transfec on experiments. Plasmids containing shRhoA
Page | 166
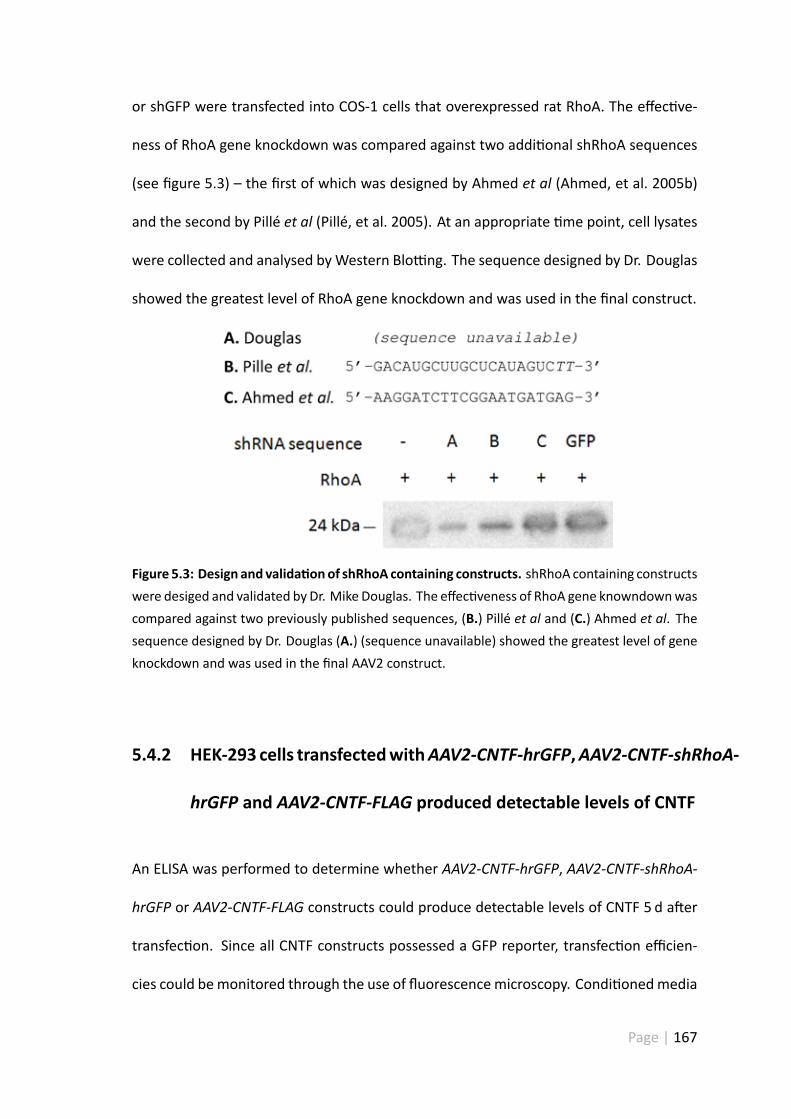
or shGFP were transfected into COS-1 cells that overexpressed rat RhoA. The effec ve-
ness of RhoA gene knockdown was compared against two addi onal shRhoA sequences
(see figure 5.3) – the first of which was designed by Ahmed et al (Ahmed, et al. 2005b)
and the second by Pillé et al (Pillé, et al. 2005). At an appropriate me point, cell lysates
were collected and analysed byWestern Blo ng. The sequence designed by Dr. Douglas
showed the greatest level of RhoA gene knockdown and was used in the final construct.
Figure 5.3: Design and valida onof shRhoA containing constructs. shRhoA containing constructswere desiged and validated by Dr. Mike Douglas. The effec veness of RhoA gene knowndownwascompared against two previously published sequences, (B.) Pillé et al and (C.) Ahmed et al. Thesequence designed by Dr. Douglas (A.) (sequence unavailable) showed the greatest level of geneknockdown and was used in the final AAV2 construct.
5.4.2 HEK-293 cells transfectedwithAAV2-CNTF-hrGFP,AAV2-CNTF-shRhoA-
hrGFP and AAV2-CNTF-FLAG produced detectable levels of CNTF
An ELISA was performed to determine whether AAV2-CNTF-hrGFP, AAV2-CNTF-shRhoA-
hrGFP or AAV2-CNTF-FLAG constructs could produce detectable levels of CNTF 5 d a er
transfec on. Since all CNTF constructs possessed a GFP reporter, transfec on efficien-
cies could bemonitored through the use of fluorescencemicroscopy. Condi onedmedia
Page | 167
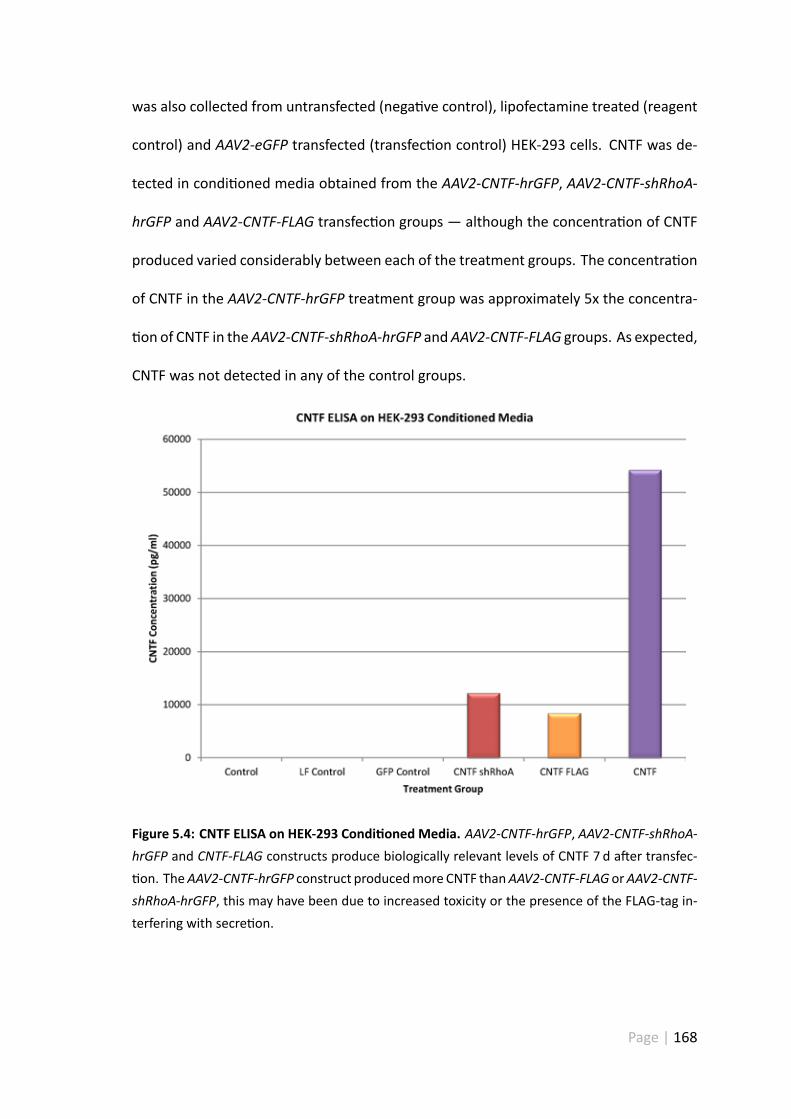
was also collected from untransfected (nega ve control), lipofectamine treated (reagent
control) and AAV2-eGFP transfected (transfec on control) HEK-293 cells. CNTF was de-
tected in condi oned media obtained from the AAV2-CNTF-hrGFP, AAV2-CNTF-shRhoA-
hrGFP and AAV2-CNTF-FLAG transfec on groups — although the concentra on of CNTF
produced varied considerably between each of the treatment groups. The concentra on
of CNTF in the AAV2-CNTF-hrGFP treatment group was approximately 5x the concentra-
on of CNTF in theAAV2-CNTF-shRhoA-hrGFP andAAV2-CNTF-FLAG groups. As expected,
CNTF was not detected in any of the control groups.
Figure 5.4: CNTF ELISA on HEK-293 Condi oned Media. AAV2-CNTF-hrGFP, AAV2-CNTF-shRhoA-hrGFP and CNTF-FLAG constructs produce biologically relevant levels of CNTF 7 d a er transfec-on. TheAAV2-CNTF-hrGFP construct producedmore CNTF thanAAV2-CNTF-FLAGorAAV2-CNTF-
shRhoA-hrGFP, this may have been due to increased toxicity or the presence of the FLAG-tag in-terfering with secre on.
Page | 168
5.4.3 Co-injec onwith 0.0002%Pronase-E significantly enhancedAAV2-
eGFP transduc on, but caused some cell death
Co-administra on with 0.0002% Pronase-E significantly enhanced RGC GFP transduc on
compared to AAV2-eGFP (1× 10¹¹ vg/10µl) alone in re nal wholemount prepara ons
30 d a er intravitreal injec on (as in sec on 2.2.6, see figure 5.5). When AAV2-eGFPwas
administered alone 17% of the RGC popula on was GFP posi ve, however when deliv-
ered in combina on with 0.0002% Pronase-E, 52% of the surviving RGC popula on was
GFP posi ve. Treatment with 0.0002% Pronase-E caused a significant reduc on (18%,
192.3 RGC/mm2 ± 26 RGC/mm2) in total RGC number. Furthermore GFP expression was
significantly weaker in the AAV2-eGFP alone treatment group compared to the AAV2-
eGFP + Pronase-E treatment group (see figure 5.5).
Page | 169
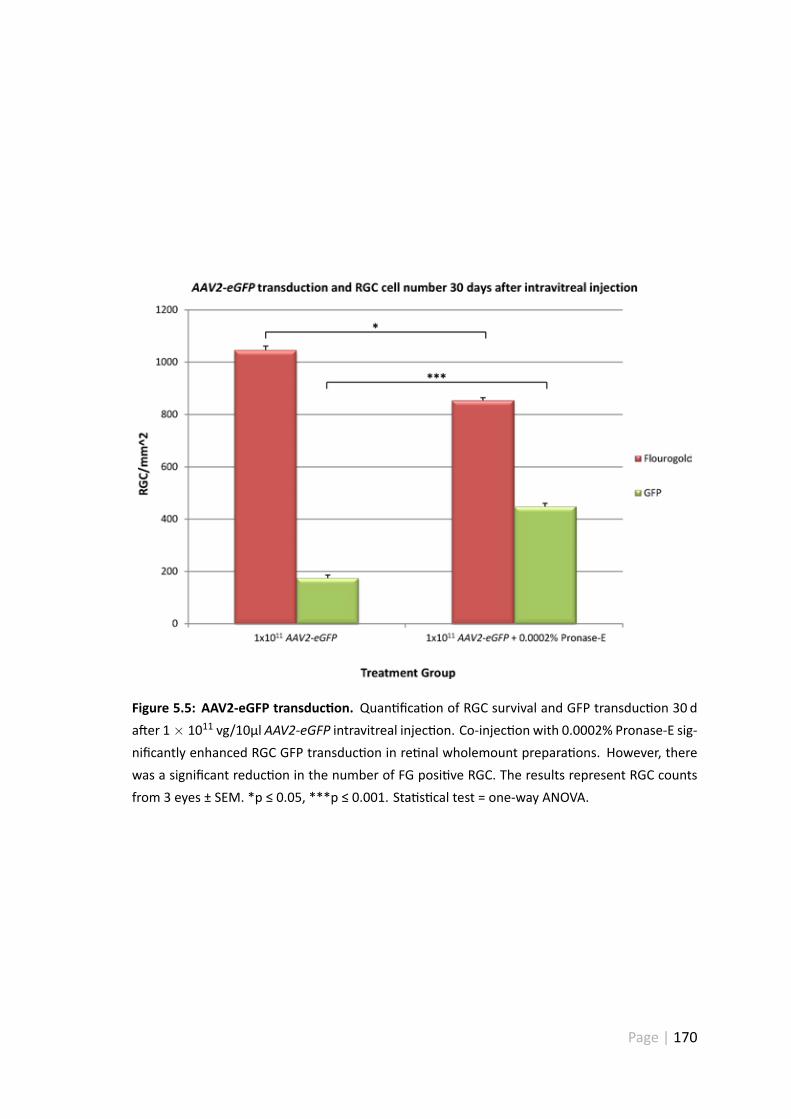
Figure 5.5: AAV2-eGFP transduc on. Quan fica on of RGC survival and GFP transduc on 30 da er 1× 10¹¹ vg/10µl AAV2-eGFP intravitreal injec on. Co-injec on with 0.0002% Pronase-E sig-nificantly enhanced RGC GFP transduc on in re nal wholemount prepara ons. However, therewas a significant reduc on in the number of FG posi ve RGC. The results represent RGC countsfrom 3 eyes ± SEM. *p ≤ 0.05, ***p ≤ 0.001. Sta s cal test = one-way ANOVA.
Page | 170
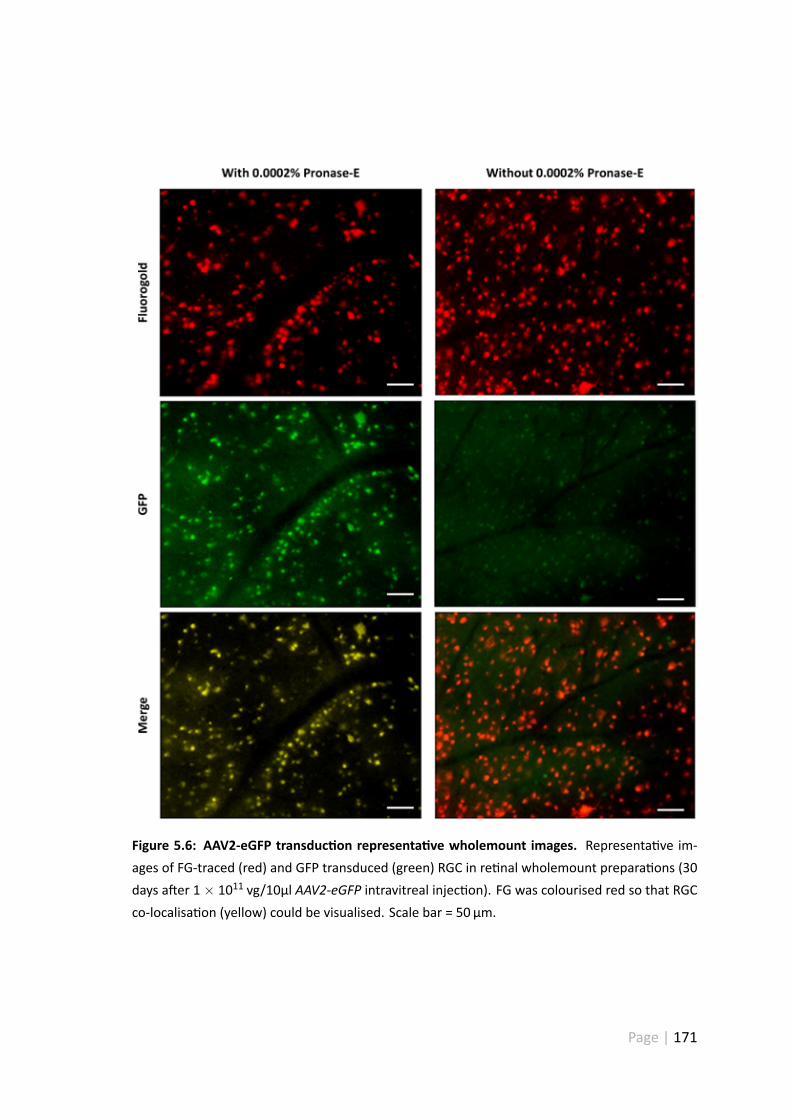
Figure 5.6: AAV2-eGFP transduc on representa ve wholemount images. Representa ve im-ages of FG-traced (red) and GFP transduced (green) RGC in re nal wholemount prepara ons (30days a er 1× 10¹¹ vg/10µl AAV2-eGFP intravitreal injec on). FG was colourised red so that RGCco-localisa on (yellow) could be visualised. Scale bar = 50 µm.
Page | 171
5.4.4 RGC survival was not enhanced byAAV2-CNTF-hrGFP + Pronase-E
or AAV2-CNTF-shRhoA-hrGFP + Pronase-E treatment
Sprague Dawley rats received an intravitreal injec on of AAV2 virus 30 d prior to receiv-
ing an ONC injury. RGC counts obtained from H&E stained frozen re nal sec ons 23 d
post ONC (see sec on 2.1.4 for details) demonstrates that all AAV2 treatment groups
(1× 10¹¹ vg/10µl (AAV2-eGFP + Pronase-E, AAV2-CNTF-hrGFP + Pronase-E and AAV2-
CNTF-shRhoA-hrGFP + Pronase-E) induced significant (***p ≤ 0.001) RGC cell death, caus-
ing ≈40% reduc on in RGC cell number compared to the uninjured/uninjected control
group (see figure 5.7). RGC cell loss was accompanied by thinning of the IPL and OPL, this
was par cularly evident in AAV2-eGFP injected animals (see figure 5.8). There was no sig-
nificant change in mean RGC number between all AAV2 treatment groups. As expected
uninjured control re nal sec ons retained a normal morphological appearance.
Page | 172
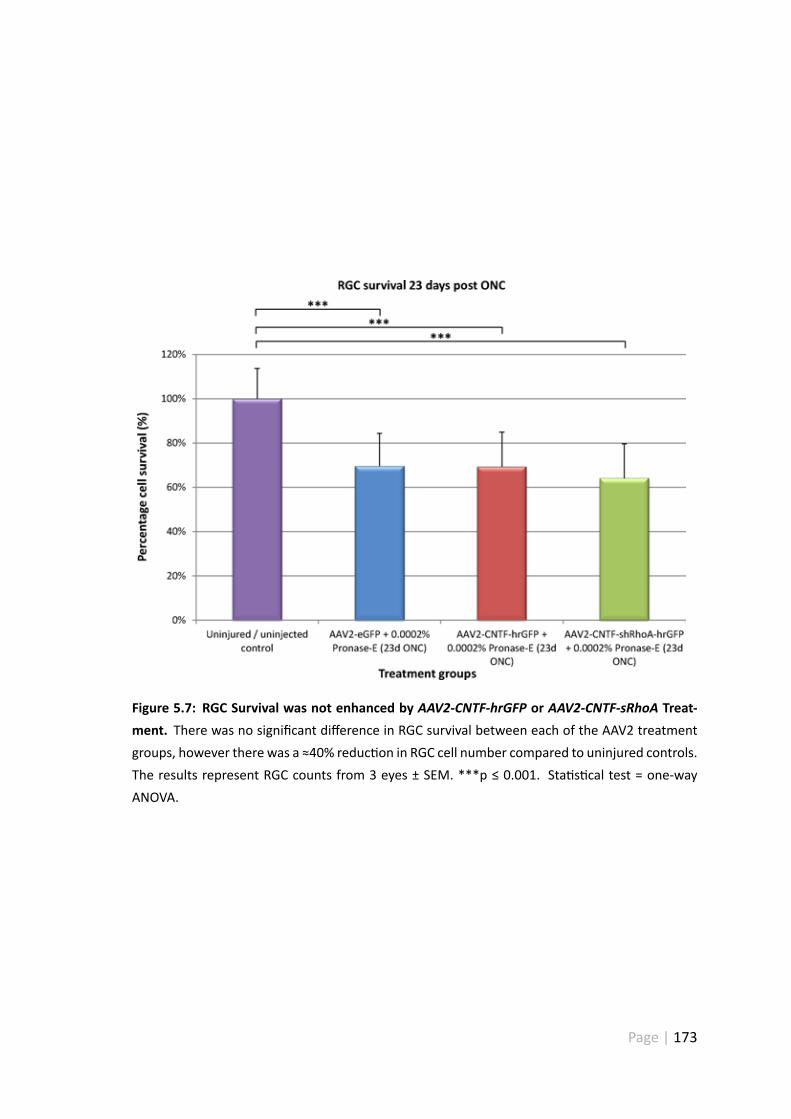
Figure 5.7: RGC Survival was not enhanced by AAV2-CNTF-hrGFP or AAV2-CNTF-sRhoA Treat-ment. There was no significant difference in RGC survival between each of the AAV2 treatmentgroups, however there was a ≈40% reduc on in RGC cell number compared to uninjured controls.The results represent RGC counts from 3 eyes ± SEM. ***p ≤ 0.001. Sta s cal test = one-wayANOVA.
Page | 173
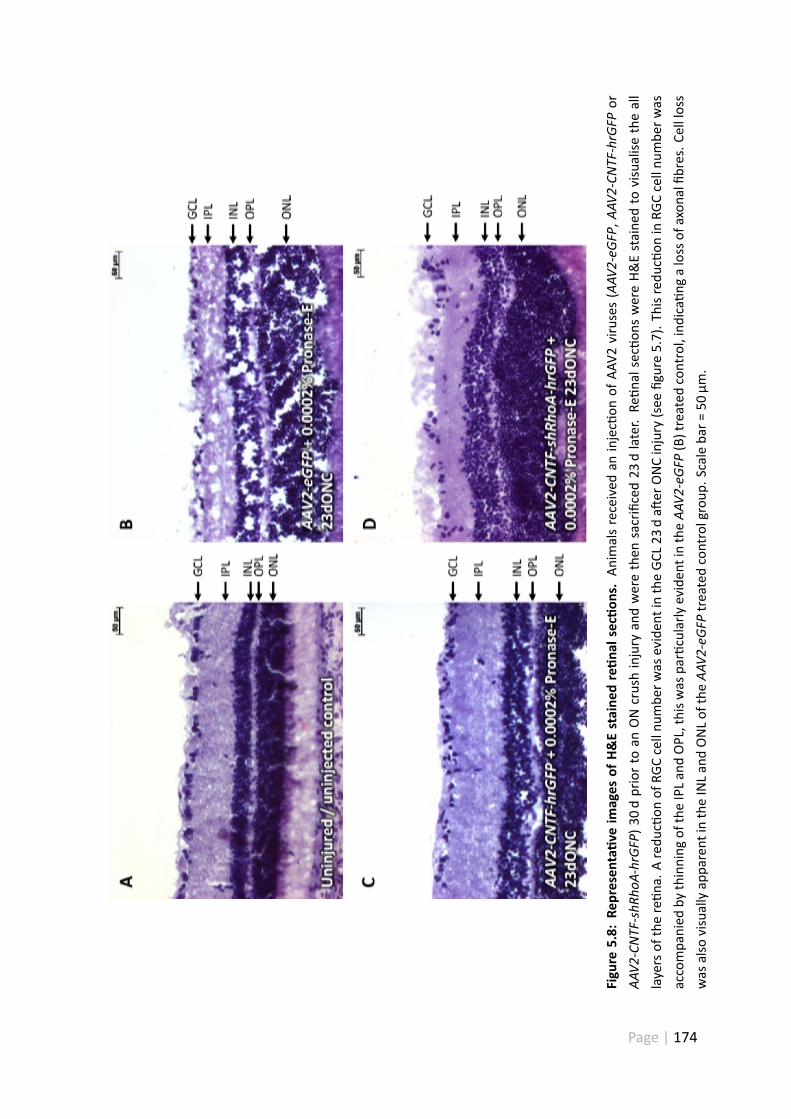
Figure
5.8:
Represen
tave
images
ofH&
Estaine
dre
nalsec
ons.
Anim
alsreceived
aninjecon
ofAA
V2viruses(AAV
2-eG
FP,A
AV2-CN
TF-hrG
FPor
AAV2
-CNT
F-shRh
oA-hrG
FP)3
0dpriorto
anONcrushinjury
andwerethen
sacrificed23
dlater.
Rena
lsec
onswereH&
Estaine
dto
visualise
theall
layersof
there
na.A
redu
con
ofRG
Ccellnu
mbe
rwas
eviden
tintheGC
L23
da
erONCinjury
(see
figure5.7).T
hisred
ucon
inRG
Ccellnu
mbe
rwas
accompa
nied
bythinning
oftheIPLa
ndOPL,thisw
aspa
rcularly
eviden
tintheAA
V2-eGF
P(B)treated
control,indica
ngalossof
axon
alfib
res.Ce
llloss
was
also
visuallyap
parent
intheINLan
dONLof
theAA
V2-eGF
Ptreatedcontrolgroup
.Scaleba
r=50
µm.
Page | 174
5.4.5 AAV2-CNTF-hrGFP and CNTF-shRhoA did not promote extensive
RGC axonal regenera on
Intravitreal injec onofAAV2-CNTF-hrGFP (1× 10¹¹ vg/10µl) + 0.0002%Pronase-E orAAV2-
CNTF-shRhoA-hrGFP (1× 10¹¹ vg/10µl) + 0.0002% Pronase-E 30 d before ONC failed to
promote significant axon regenera on (animals were sacrificed 23 d a er ONC injury)
when compared to the control (AAV2-eGFP + 0.0002% Pronase-E).
Although GAP-43 posi ve axons (shown in figure 5.11B and 5.12B) entered the crush site
(*) in both cases, very few entered the distal stump (D) of the ON (see figures 5.9, 5.11
and 5.12). RGC axons were found, for both treatment groups, to not regenerate beyond
1200 µm (hence why quan fica on stops at 1200 µm).
A significant difference in the mean number of RGC axons was found at 400 µm for an-
imals treated with AAV2-CNTF-hrGFP + 0.0002% Pronase-E when compared to the con-
trol (AAV2-eGFP + 0.0002% Pronase-E). The mean number of RGC axons was found to
be significantly fewer, see figure 5.9 for quan fica on. There was no significant differ-
ence in mean number of RGC axons at all other distances (100 µm, 200 µm, 800 µm and
1200 µm).
WhenAAV2-CNTF-shRhoA + 0.0002%Pronase-Ewas compared to the control significantly
fewer RGC axons (mean of directly counted RGC axons across 3 sec ons per ON and 3 ON
per treatment group) were found at 200 µm from the crush site. There was no significant
difference in mean number of RGC axons at all other distances (100 µm, 400 µm, 800 µm
and 1200 µm).
Page | 175
Interes ngly no GFP was seen in any of the sec ons (despite the use of polyclonal an -
bodies to amplify the signal), as a result the lack of regenera on (see figures 5.9, 5.10,
5.11 and 5.12) or survival (see figures 5.7 and 5.8) may have been a consequence of in-
effec ve viral transduc on.
AAV2-CNTF-hrGFP + Pronase-E and AAV2-CNTF-shRhoA-hrGFP + Pronase-E did not pro-
mote extensive RGC axonal regenera on 23 d a er ONC (see figure 5.12). Although GAP-
43 posi ve axons entered the crush site (*), very few entered the distal stump (D). From
the examples in figure 5.11, it appears that there are more GAP-43 posi ve axons in the
proximal stump compared to the nega ve control (AAV2-eGFP + Pronase-E), sugges ng
that AAV2-CNTF-hrGFP + Pronase-E and AAV2-CNTF-shRhoA-hrGFP + Pronase-E could be
neuroprotec ve. This is clearly not the case, since there was no significant difference be-
tween RGC number in H&E stained re nal sec ons (see sec on 5.4.4). Interes ngly no
GFP was seen in any of the sec ons, as a result the lack of regenera on (see figures 5.10,
5.11 and 5.12) or survival (see figure 5.7) may have been a consequence of ineffec ve
viral transduc on.
Page | 176
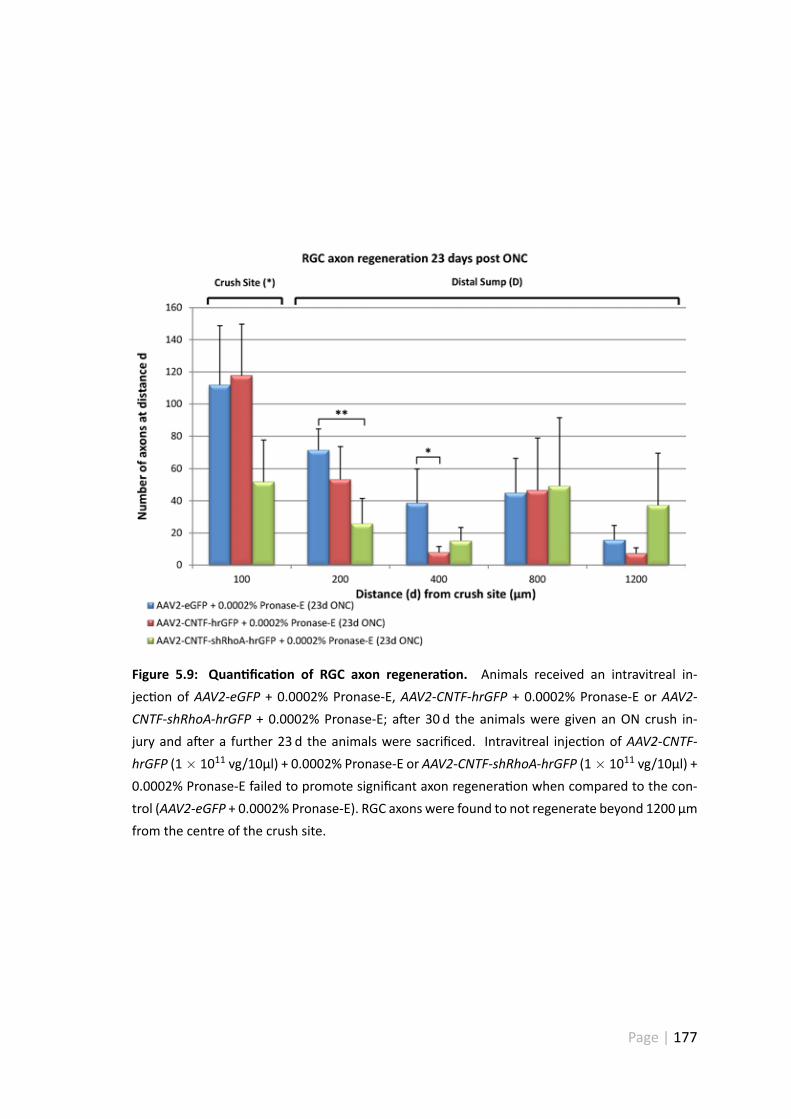
Figure 5.9: Quan fica on of RGC axon regenera on. Animals received an intravitreal in-jec on of AAV2-eGFP + 0.0002% Pronase-E, AAV2-CNTF-hrGFP + 0.0002% Pronase-E or AAV2-CNTF-shRhoA-hrGFP + 0.0002% Pronase-E; a er 30 d the animals were given an ON crush in-jury and a er a further 23 d the animals were sacrificed. Intravitreal injec on of AAV2-CNTF-hrGFP (1× 10¹¹ vg/10µl) + 0.0002% Pronase-E or AAV2-CNTF-shRhoA-hrGFP (1× 10¹¹ vg/10µl) +0.0002% Pronase-E failed to promote significant axon regenera on when compared to the con-trol (AAV2-eGFP + 0.0002% Pronase-E). RGC axons were found to not regenerate beyond 1200 µmfrom the centre of the crush site.
Page | 177
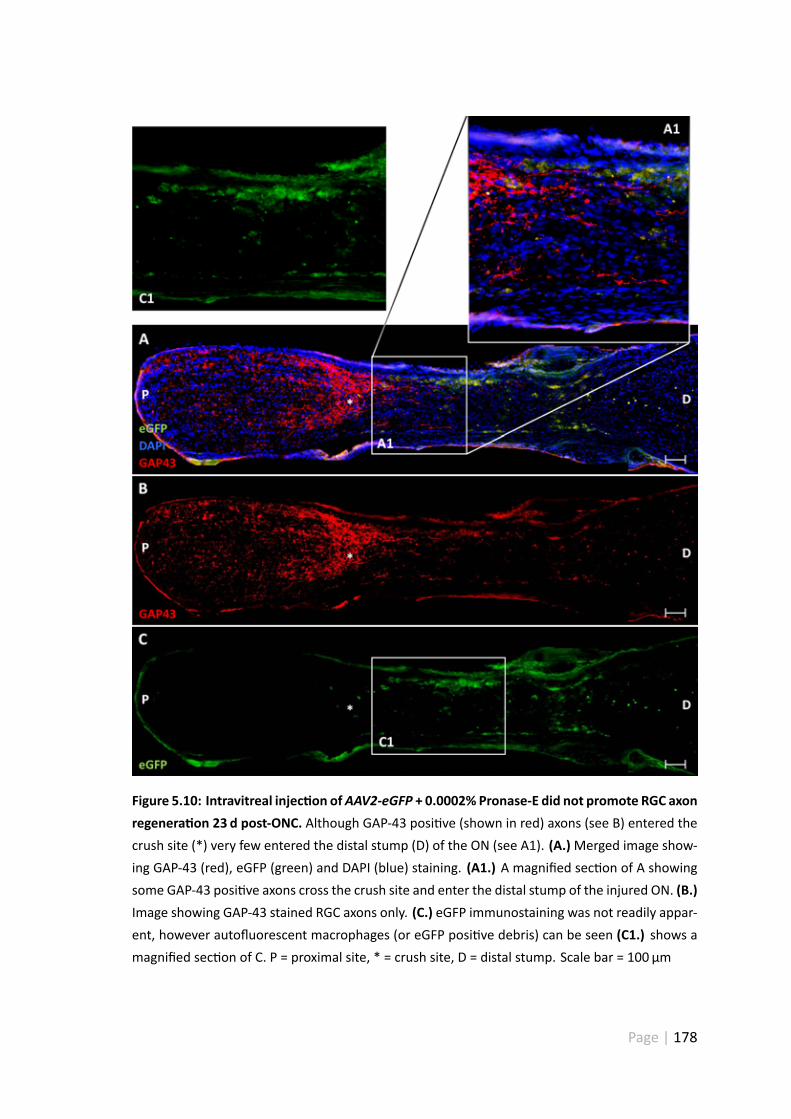
Figure 5.10: Intravitreal injec on ofAAV2-eGFP + 0.0002% Pronase-E did not promote RGC axonregenera on 23 d post-ONC. Although GAP-43 posi ve (shown in red) axons (see B) entered thecrush site (*) very few entered the distal stump (D) of the ON (see A1). (A.)Merged image show-ing GAP-43 (red), eGFP (green) and DAPI (blue) staining. (A1.) A magnified sec on of A showingsome GAP-43 posi ve axons cross the crush site and enter the distal stump of the injured ON. (B.)Image showing GAP-43 stained RGC axons only. (C.) eGFP immunostaining was not readily appar-ent, however autofluorescent macrophages (or eGFP posi ve debris) can be seen (C1.) shows amagnified sec on of C. P = proximal site, * = crush site, D = distal stump. Scale bar = 100 µm
Page | 178
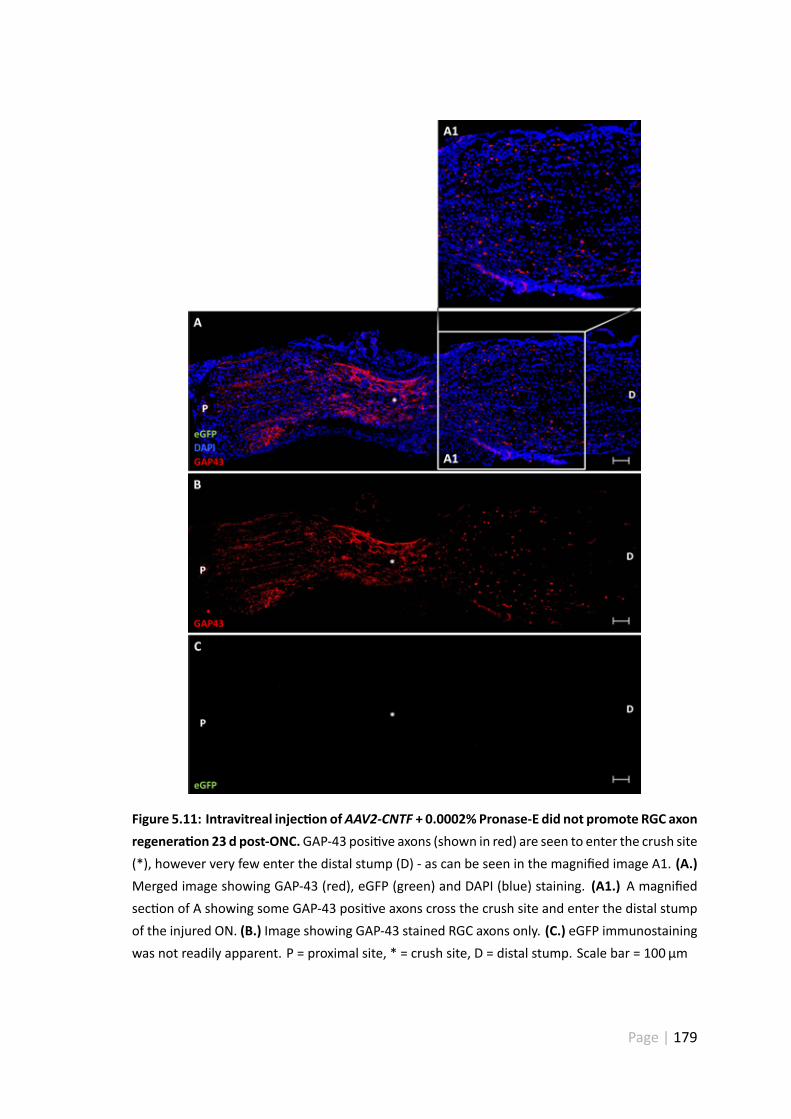
Figure 5.11: Intravitreal injec on ofAAV2-CNTF + 0.0002%Pronase-E did not promote RGC axonregenera on 23 d post-ONC.GAP-43 posi ve axons (shown in red) are seen to enter the crush site(*), however very few enter the distal stump (D) - as can be seen in the magnified image A1. (A.)Merged image showing GAP-43 (red), eGFP (green) and DAPI (blue) staining. (A1.) A magnifiedsec on of A showing some GAP-43 posi ve axons cross the crush site and enter the distal stumpof the injured ON. (B.) Image showing GAP-43 stained RGC axons only. (C.) eGFP immunostainingwas not readily apparent. P = proximal site, * = crush site, D = distal stump. Scale bar = 100 µm
Page | 179
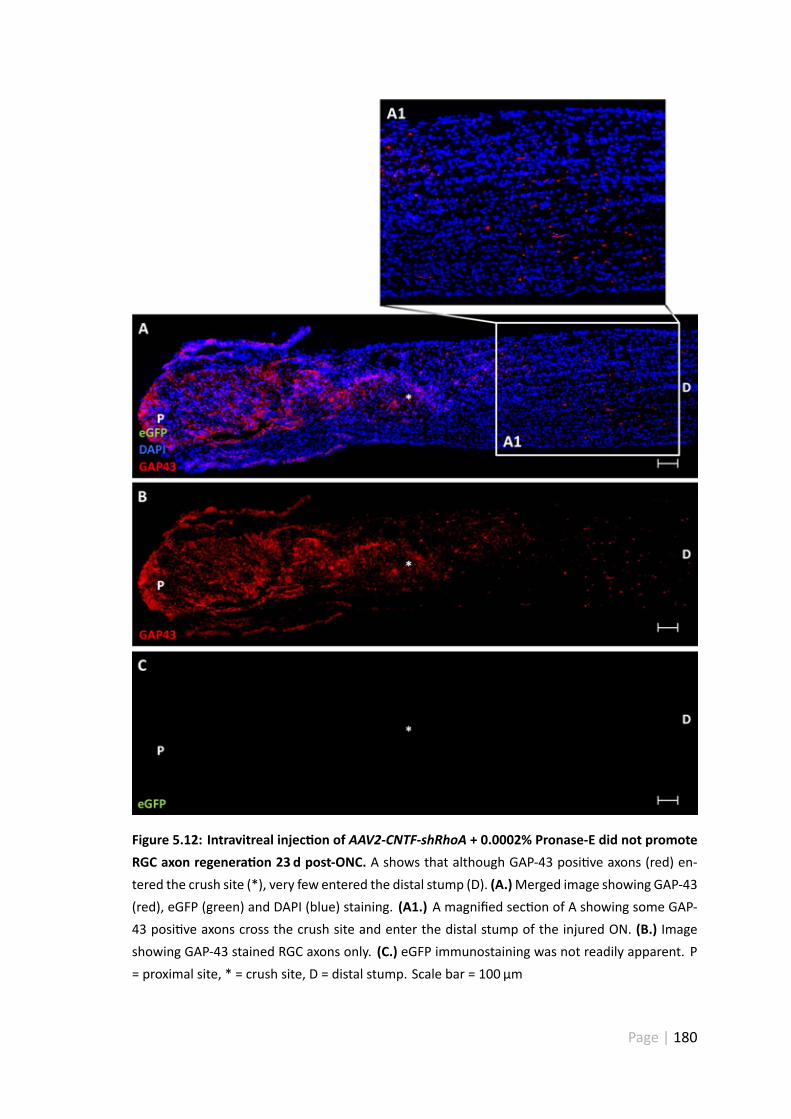
Figure 5.12: Intravitreal injec on of AAV2-CNTF-shRhoA + 0.0002% Pronase-E did not promoteRGC axon regenera on 23 d post-ONC. A shows that although GAP-43 posi ve axons (red) en-tered the crush site (*), very few entered the distal stump (D). (A.)Merged image showing GAP-43(red), eGFP (green) and DAPI (blue) staining. (A1.) A magnified sec on of A showing some GAP-43 posi ve axons cross the crush site and enter the distal stump of the injured ON. (B.) Imageshowing GAP-43 stained RGC axons only. (C.) eGFP immunostaining was not readily apparent. P= proximal site, * = crush site, D = distal stump. Scale bar = 100 µm
Page | 180
5.5 Discussion
5.5.1 Condi onedmedia collected fromAAV2-CNTF-hrGFP,AAV2-CNTF-
shRhoA-hrGFP andAAV2-CNTF-FLAG transfectedHEK-293 cells con-
tained detectable levels of CNTF
Condi onedmediawas collected fromAAV2-CNTF-hrGFP,AAV2-CNTF-shRhoA-hrGFP and
AAV2-CNTF-FLAG transfected HEK-293 cells. CNTF ELISAs were performed to determine
whether each of the CNTF constructs produced detectable levels of CNTF. Interes ngly
CNTF levels in the AAV2-CNTF-shRhoA-hrGFP and AAV2-CNTF-FLAG groups were lower
than that ofAAV2-CNTF-hrGFP alone. Cytotoxicitywas apparent in theAAV2-CNTF-shRhoA-
hrGFP transfected cells, this may have also led to a decrease in CNTF secre on.
5.5.2 AAV2-eGFP + Pronase-E significantly enhanced AAV2-eGFP trans-
duc on
Co-administra on with 0.0002% Pronase-E significantly enhanced RGC GFP transduc on
compared toAAV2-eGFP alone in re nalwholemount prepara ons (see figure 5.5). When
AAV2-eGFP was administered alone 17% of the RGC popula on was GFP posi ve, how-
ever, when delivered in combina on with 0.0002% Pronase-E 52% of the surviving RGC
popula on was GFP posi ve. This was probably a direct consequence of diges on of the
inner-limi ng membrane as in (Dalkara et al. 2009) or due to the degrada on or dam-
age of AAV2 receptors laminin or HSPG receptors. It is also possible that the presence
Page | 181
of Pronase-E made the vitreous more permissible, as previously discussed (see sec on
5.1.1).
5.5.3 AAV2-eGFP + Pronase-E significantly reduced RGC number in re -
nal wholemount prepara ons
Treatment with 0.0002% Pronase-E caused a significant reduc on (18%, 192.3 RGC/mm2
±26 RGC/mm2) in total RGCnumber. FurthermoreGFPexpressionwas significantlyweaker
in the AAV2-eGFP alone treatment group compared to the AAV2-eGFP + Pronase-E treat-
ment group (see figure 5.6). It is possible that the toxicity observed in figure 5.5 was a
direct consequence of GFP expression. Several studies (Klein, et al. 2006) have shown
a posi ve correla on between GFP expression and cell death. For example, Klein et al
has demonstrated that neuronal death in the substan a nigra a er AAV8 injec on was
a direct consequence of GFP expression (Klein et al. 2006). Cell death was a ributed to
GFP expression, since injec on of the AAV8 vector alone (absent the GFP reporter) did
not induce cell death (Klein et al. 2006). Moreover, toxicity was ameliorated by a reduc-
on in viral tre, presumably as a consequence of reduced infec vity (Klein et al. 2006).
Furthermore, GFP toxicity has also been reported in primary neuronal cultures (Detrait,
et al. 2002, Krestel, et al. 2004) and a variety of cell lines (Liu, et al. 1999). Although
the mechanism through which GFP causes cell death remains unclear, several proposals
have been made: It is possible that GFP affects normal cell func oning through the per-
turba on of polyubiqui na on (Baens, et al. 2006). This post-transla onal modifica on
is par cularly important in modula ng p53 tumour suppressor ac vity as well as other
Page | 182
important signalling events (e.g. NF-κB and JNK signalling) (Baens et al. 2006). Another
possibility is that GFP accumulates and prevents retrograde and anterograde transport
of essen al proteins and nutrients. Furthermore it has been documented that con nual
s mula on of eGFP can cause cell death through the produc on of free radicals (cited in
(Liu et al. 1999)).
Another poten al explana on is that the high viral tre of theAAV2-eGFP virus (1× 10¹¹ vg/10µl)
induced RGC cell death. To establish this it would be necessary to perform a dose re-
sponse experiment. Furthermore it would also be necessary to test different doses of
virus using AAV2 vector alone (absent GFP transgene)— thiswould allowme to differen -
ate between toxicity induced by viral dose and toxicity induced by eGFP expression. Since
an untreated control group wasn't present in the re nal wholemount survival counts I
was unable to ascertain whether a dose of 1× 10¹¹ AAV2-eGFP virus caused toxicity.
Perhaps one of themore obvious explana ons is that Pronase-E directly caused the death
of re nal RGC throughprotein degrada on. Todeterminewhether thiswas case, a Pronase-
E dose response experiment could be performed. Although Dalkara et al (Dalkara et al.
2009) reported that 0.0002% Pronase-E did not cause RGC cell death, independent con-
firma on of this would need to be performed.
Due to me constraints the AAV2-eGFP transduc on experiments and ON crush exper-
iments were run in parallel. As a result, it was decided to co-inject 0.0002% Pronase-E
with each of the AAV2 treatment groups (i.e. AAV2-eGFP, AAV2-CNTF-hrGFP and AAV2-
CNTF-shRhoA-hrGFP).
Page | 183
5.5.4 AAV2-CNTF-hrGFP andAAV2-CNTF-shRhoA-hrGFP didnot promote
extensive axonal regenera on
AAV2-CNTF-hrGFP and AAV2-CNTF-shRhoA-hrGFP did not promote extensive axonal re-
genera on 23 d post ONC (see figures 5.11 and 5.12). Although quite a few GAP-43 pos-
i ve axons (red) were present in the proximal stump (of AAV2-CNTF-hrGFP and AAV2-
CNTF-shRhoA-hrGFP injected animals, see figures 5.11 and 5.12), very few axons tra-
versed the crush site and entered the distal stump. Due to the low n number (n = 1)
RGC axonal regenera on was not quan fied.
Interes ngly no GFP was seen in any of the ON sec ons, this may have been due to a
number of reasons. It is possible that AAV2 had difficulty reaching the target cell de-
spite co-administra on with Pronase-E. Histological examina on of the ILM would indi-
cate whether this was the case. Alterna vely GFP expression may have been too weak to
detect visually, to determine whether this was the case IHC could be performed using an
an body targeted against GFP. This is a possibility since the hrGFP transgene is translated
from the IRES – a process which is less efficient and can result in weaker reporter gene
expression.
Another possibility is that any virally transduced cells were killed off as a result of vi-
ral tre or GFP toxicity (as previously discussed in sec on 5.5.3). Furthermore, since
0.0002% Pronase-E is toxic to RGC, the presence of this enzyme may have also been a
factor, making fewer RGC available for virally mediated transduc on.
Page | 184
5.5.5 AAV2-CNTF-hrGFP andAAV2-CNTF-shRhoA-hrGFP did not protect
RGC from cell death
Re nal counts (from H&E stained re nal sec ons) demonstrate that there was no signifi-
cant difference in RGC number between each of the AAV2-treatment groups (AAV2-eGFP
+ Pronase-E, AAV2-CNTF-hrGFP + Pronase-E and AAV2-CNTF-shRhoA-hrGFP + Pronase-
E) 23 d post ONC – however significant RGC cell death was exhibited compared to un-
treated/uninjured controls, with a ≈40% reduc on in RGC cell survival. Once more this
may have been a consequence of ineffec ve viral delivery (as previously discussed in
sec on 5.1.1) or the presence of toxic substances (Pronase-E, see figure 5.7). Since GFP
expression was not seen in any of the re nal sec ons examined, the likelihood of GFP
mediated toxicity was reduced.
5.6 Conclusions
The ILM appears to be a major barrier to AAV2-mediated gene transduc on via intrav-
itreal injec on. Although co-administra on with Pronase-E could significantly facilitate
this process, it also led RGC cell death. Unfortunately I am unable to make any solid con-
clusions as to the effec veness of long term CNTF delivery (and/or RhoA knockdown)
since the AAV2 delivery technique clearly requires further op misa on.
Page | 185

CHAPTER 6
GENERAL DISCUSSION
Page | 186
6.1 Main Findings and Future Work
The main objec ve of this inves ga on was to determine whether CNTF could promote
RGC axonal regenera on and survival a er ON transec on. In order to determine these
effects in vitro, it was necessary to develop an assay by which neuronal and glial effects
could be monitored independently. As described previously (see sec on 1.1) the re na
contains a variety of different cell types. Each of these cell popula ons can contribute
towards any therapeu c outcome through the release of NTF or inhibitory molecules.
Thismakes it difficult to dissect out neuronal and/or glia specificmechanisms. In an effort
to try and differen ate between these mechanisms, it was decided to characterise an
RGC-5 cell line. This was done primarily to determine whether the RGC-5 cell line could
be used as a subs tute for primary re nal culture. This would be a par cularly effec ve
tool at monitoring the neuronal effects of CNTF since some groups have hypothesized
that CNTF acts indirectly through the ac va on of macrophages (Cen et al. 2007) and/or
astrocytes (Müller et al. 2009).
Unfortunately the RGC-5 cell line was not what it was originally reported to be, and is
likely derived from a mouse oligodendrocyte progenitor lineage (see chapter 3). As a re-
sult of this, it was decided to test our therapeu c agent of interest (e.g. recombinant
CNTF) in primary re nal cultures (see chapter 4). Although this assay did not allow for
dis nc on between neuronal and glial specific responses, it allowed me to evaluate the
overall func onal outcome of CNTF treatment. During the course of this inves ga on it
was established that a dose of 100 ngml−1 CNTF was op mum in terms of RGC neurite
outgrowth and survival, and that this dose was capable of disinhibi ng RGC neurite out-
Page | 187
growth. Moreover, Forskolin significantly enhanced RGC neurite outgrowth when given
alone (or in combina onwith a low dose of CNTF), but was not required to poten ate the
neuritogenic effects of CNTF. To be able to dis nguish between neuronal and glial specific
responses it would be advantageous to be able to assess the effec veness of recombinant
CNTF on a rela vely pure popula on of RGC — to accomplish this, an immunopanning
technique could be used to isolate primary RGC.
6.1.1 Viral Delivery
In agreement with Dalkara et al (Dalkara et al. 2009), the ILM was confirmed to be a
major barrier to AAV2 mediated gene transduc on when administered intravitreally. To
address this problem, a series of in vivo experiments could be performed to op mise viral
transgene delivery. This would involve performing an AAV2 dose response experiment to
find an op mal viral concentra on. To be an effec ve therapeu c vector, this dose would
need to be capable of reproducibly and efficiently transducing RGC without causing any
adverse effects (e.g. RGC toxicity). To determine this, each dose would need to be tested
in the presence and absence of a GFP reporter, so that the cause (e.g. viral tre, GFP ex-
pression) of any toxicity could be easily assessed. A Pronase-E dose response experiment
could also be performed to determine whether 0.0002% Pronase-E was the cause of RGC
cell death in chapter 5. To establish this histological examina on of the ILM would also
be advantageous so that the extent of degrada on could be assessed. Although the ILM
seems to be a significant structural barrier to AAV2 mediated gene transduc on, other
poten al barriers do exist and it is possible that Pronase-E has affects other than to the
Page | 188
ILM. For example Pronase-E may degrade proteins of the vitreous making the environ-
ment more permissible to viral entry.
Since only a single injec on of virus was administered to Sprague Dawley rats the effect
of mul ple injec ons could also be inves gated. Furthermore, the use of slow release
devices could be inves gated as an alterna ve to virally mediated gene transfer.
The use of such a device has several advantages:
1. It would eliminate the need of using a virus at all.
2. Therapeu c interven on would be instantaneous (i.e. not necessary to wait up to
30 d for sufficient transgene expression).
3. The implant could be removed if required.
Intravitreal injec on of AAV2-CNTF-hrGFP + 0.0002% Pronase-E or AAV2-CNTF-shRhoA-
hrGFP + 0.0002% Pronase-E did not rescue RGC from cell death 23d post ONC. As dis-
cussed previously, this was probably a result of defec ve viral delivery. AAV2-CNTF-hrGFP
and AAV2-CNTF-shRhoA-hrGFP failed to promote significant RGC axon regenera on 23 d
a er ONC. Furthermore, no GFP was detected in the sec ons despite the use of an bod-
ies to enhance any signal present. A future experiment would be to replace the AAV2-
eGFP virus (control) with one containing hrGFP, since hrGFP was used in AAV2-CNTF-
hrGFP and AAV2-CNTF-shRhoA-hrGFP viral vectors.
Furthermore it would be necessary to establish whether the shRNA present in the AAV2-
CNTF-shRhoA-hrGFP virus was effec ve at knocking down RhoA expression in primary
Page | 189
RGC. To accomplish this, re nas could be harvested from intravitreally injected animals,
and RhoA expression assessed through real me PCR and/or western blot analysis. Fur-
thermore, CNTF over expression could be confirmed using similar techniques.
6.2 Conclusions
The findings of this thesis provide extensive evidence that the RGC-5 cell line was not
what it was originally reported to be (R.R.Krishnamoorthy et al. 2000, Agarwal et al. 2007)
– and is in fact derived from mouse oligodendrocyte progenitor cells. It was found that
recombinant CNTF could promote RGC neurite outgrowth in vitro, and could disinhibit
Nogo-P4 treated RGC. Although RGC axonal regenera on and survival were not promoted
in vivo (due to inefficient viral delivery) CNTF and/or shRhoA s ll has the poten al to be
an effec ve therapeu c in vivo.
Page | 190
REFERENCES
D. S. Aaronson&C.M.Horvath (2002). `A RoadMap for ThoseWhoDon't Know JAK-STAT'.Science 296(5573):1653--1655.
B. A. Adel, et al. (2005). `Ciliary neurotrophic factor protects re nal ganglion cells fromaxotomy-induced apoptosis via modula on of re nal glia in vivo'. Journal of Neurobi-ology 63(3).
R. Adler (1993). `Ciliary neurotrophic factor as an injury factor'. Current Opinion in Neu-robiology 3(5):785--789.
R. Adler, et al. (1979). `Cholinergic neuronotrophic factors: intraocular distribu on oftrophic ac vity for ciliary neurons'. Science 204(4400):1434--6.
A. Agar, et al. (2006). `Re nal ganglion cell line apoptosis inducedbyhydrosta c pressure'.Brain Research 1086(1):191--200.
R. A. N. Agarwal, et al. (2007). `Comparison of expression profile of neurotrophins andtheir receptors in primary and transformed rat re nal ganglion cells'. Molecular Visionpp. 1311--1318.
A. J. Aguayo (1985). Axon regenera on from injured neurons in the adult mammaliancentral nervous system, pp. 457--84. Guildford Press.
Z. Ahmed, et al. (2005a). `Matrix metalloproteases: degrada on of the inhibitory envi-ronment of the transected op c nerve and the scar by regenera ng axons'. Mol CellNeurosci 28(1):64--78.
Z. Ahmed, et al. (2005b). `Disinhibi on of neurotrophin-induced dorsal root ganglion cellneurite outgrowth on CNSmyelin by siRNA-mediated knockdown of NgR, p75NTR andRho-A'. Molecular and Cellular Neuroscience 28(3):509 -- 523.
B. Alberts (2002). Molecular Biology of the Cell. Garland Science, 4th edn.
Page | 191
American Type Culture Collec on Standards Development Organiza onWorkgroup ASN-0002 (2010). `Cell line misiden fica on: the beginning of the end'. Nat Rev Cancer10(6).
R. W. Atchison, et al. (1965). `Adenovius-Associated Defec ve Virus Par cles'. Science149:754--6.
M. Baens, et al. (2006). `The Dark Side of EGFP: Defec ve Polyubiqui na on'. PLoS One1(1):e54.
J. Bain, et al. (2003). `The specifici es of protein kinase inhibitors: an update'. BiochemJ 371(Pt 1):199--204.
B. A. Barres (2008). `The Mystery and Magic of Glia: A Perspec ve on Their Roles inHealth and Disease'. Nat Neurosci 60(3):430--440.
N. Baumann&D. Pham-Dinh (2001). `Biology of oligodendrocyte andmyelin in themam-malian central nervous system'. Physiol Rev 81(2):871--927.
M. F. Bear, et al. (2001). Neuroscience exploring the brain. Lippinco Williams andWilkins, 2nd edn.
N. J. V. Bergen, et al. (2009). `Re-characterisa on of the RGC-5 re nal ganglion cell line'.Inves ga ve Opthalmology & Visual Science pp. 1--26.
E. Bernstein, et al. (2001). `The rest is silence'. RNA 7(11):1509--21.
A. L. M. Berry (ed.) (1998). CNS Injuries: Cellular Responses and Pharmacological Strate-gies. Informa Healthcare, 1st edn.
M. Berry, et al. (2008). `Regenera on of axons in the visual system'. Restor Neurol Neu-rosci 26(2--3):147--74.
M. R. Berry, et al. (1986). `Regenera on of axons in the mammalian visual system'. Ex-perimental Brain Research Supplement 13:18--33.
A. U. Bielinska & J. F. Kukowska-Latallo (1997). `The interac on of plasmid DNA withpolyamidoamine dendrimers: mechanism of complex forma on and analysis of al-tera ons induced in nuclease sensi vity and transcrip onal ac vity of the complexedDNA'. Biochim Biophys Acta 1353(2):180--190.
K. J. Bos, et al. (2001). `Collagen fibril organisa on in mammalian vitreous by freezeetch/rotary shadowing electron microscopy'. Micron 32(3):301--6.
Page | 192
T. G. Boulton, et al. (1994). `Ciliary neurotrophic factor/leukemia inhibitory fac-tor/interleukin 6/oncosta n M family of cytokines induces tyrosine phosphoryla onof a common set of proteins overlapping those induced by other cytokines and growthfactors'. J Biol Chem 269(15):11648--55.
B. B. Boyco & H. Wassle (1974). `The morphological types of ganglion cells of the do-mes c cat's re na'. J Physiol 240(2):397--419.
E. J. Bradbury, et al. (2002). `Chondroi nase ABC promotes func onal recovery a erspinal cord injury'. Nature 416(6881):636--640.
D. Cai, et al. (2001). `Neuronal cyclic AMP controls the developmental loss in ability ofaxons to regenerate'. J Neurosci 21(13):4731--9.
D. Cai, et al. (1999). `Prior Exposure toNeurotrophins Blocks Inhibi on of Axonal Regener-a on by MAG and Myelin via a cAMP-Dependent Mechanism'. Neuron 22(1):89--101.
S. R. Y. Cajal (1928). `Degenera on and Regenera on of the Nervous System'. London.Oxford University Press .
P. Caroni &M. E. Schwab (1988). `An body against myelin-associated inhibitor of neuritegrowth neutralizes nonpermissive substrate proper es of CNS white ma er'. Neuron1(1):85--96.
L. P. Cen, et al. (2007). `Chemotac c effect of ciliary neurotrophic factor on macrophagesin re nal ganglion cell survival and axonal regenera on'. Invest Ophthalmol Vis Sci48(9):4257--66.
R. M. Chanock (1974). `Impact of adenoviruses in human disease'. Preven ve Medicine3(4):466 -- 472.
I. Charles, et al. (2005). `Serum depriva on induces apopto c cell death of transformedrat re nal ganglion cells via mitochondrial signaling pathways'. Invest Ophthalmol VisSci 46(4):1330--8.
N. Chaudhry & M. T. Filbin (2006). `Myelin-associated inhibitory signaling and strategiesto overcome inhibi on'. J Cereb Blood Flow Metab 27(6):1096--1107.
M. S. Chen, et al. (2000). `Nogo-A is a myelin-associated neurite outgrowth inhibitor andan an gen for monoclonal an body IN-1'. Nature 403(6768):434--9.
R. L. Chow & R. A. Lang (2001). `Early eye development in vertebrates'. Annu Rev CellDev Biol 17:255--296.
Page | 193
C. Cogoni, et al. (1996). `Transgene silencing of the al-1 gene in vegeta ve cells of Neu-rospora is mediated by a cytoplasmic effector and does not depend on DNA-DNA in-terac ons or DNA methyla on'. EMBO J 15(12):3153--63.
Q. Cui, et al. (2008). `Does CNTF mediate the effect of intraocular inflamma on on op cnerve regenera on?'. Brain 131(Pt 6):e96; author reply e97.
Q. Cui & A. R. Harvey (2000). `CNTF promotes the regrowth of re nal ganglion cell axonsinto murine peripheral nerve gra s'. Neuroreport 11(18):3999--4002.
Q. Cui, et al. (2003). `Intraocular eleva on of cyclic AMP poten ates ciliary neurotrophicfactor-induced regenera on of adult rat re nal ganglion cell axons'. Mol Cell Neurosci22(1):49--61.
D. Dalkara, et al. (2009). `Inner Limi ng Membrane Barriers to AAV-mediated Re nalTransduc on From the Vitreous'. Mol Ther 17(12):2096--2102.
S. David & A. J. Aguayo (1981). `Axonal elonga on into peripheral nervous system'bridges' a er central nervous system injury in adult rats'. Science 214(4523):931--3.
B. L. Davidson & X. O. Breakefield (2003). `Viral vectors for gene delivery to the nervoussystem'. Nat Rev Neurosci 4(5):353--364.
B. L. Davidson & P. B. McCray (2011). `Current prospects for RNA interference-basedtherapies'. Nat Rev Genet 12(5):329--340.
M. E. Davis, et al. (2010). `Evidence of RNAi in humans from systemically administeredsiRNA via targeted nanopar cles'. Nature 464(7291):1067--1070.
M. R. Dawson & A. Polito (2003). `NG2-expressing glial progenitor cells: an abundantand widespread popula on of cycling cells in the adult rat CNS'. Mol Cell Neurosci24(2):476--488.
P. Dergham, et al. (2002). `Rho signaling pathway targeted to promote spinal cord repair'.J Neurosci 22(15):6570--7.
E. R. Detrait, et al. (2002). `Reporter gene transfer induces apoptosis in primary cor calneurons'. Mol Ther 5(6):723--30.
W. G. Dirks, et al. (1999). `ECV304 (endothelial) is really T24 (bladder carcinoma): cellline cross- contamina on at source'. In Vitro Cell Dev Biol Anim 35(10):558--9.
W. H. Donovan (2007). `Donald Munro Lecture. Spinal cord injury--past, present, andfuture'. J Spinal Cord Med 30(2):85--100.
Page | 194
L. Dudus, et al. (1999). `Persistent transgene product in re na, op c nerve and brain a erintraocular injec on of rAAV'. Vision Research 39(15):2545--2553.
R. Du a, et al. (2007). `Ac va on of the ciliary neurotrophic factor (CNTF) signallingpathway in cor cal neurons of mul ple sclerosis pa ents'. Brain 130(10):2566--2576.
S. M. Elbashir, et al. (2001). `Duplexes of 21-nucleo de RNAs mediate RNA interferencein cultured mammalian cells'. Nature 411(6836):494--498.
S. Ellenbroek & J. Collard (2007). `Rho GTPases: func ons and associa on with cancer'.Clinical and Experimental Metastasis 24(8):657--672.
W. Fan, et al. (2005). `Re nal ganglion cell death and neuroprotec on: Involvement ofthe CaMKIIalpha gene'. Brain Res Mol Brain Res 139(2):306--16.
A. Fasbender & J. Zabner (1997). `Complexes of adenovirus with polyca onic polymersand ca onic lipids increase the efficiency of gene transfer in vitro and in vivo'. J BiolChem 272(10):6479--6489.
M. T. Filbin (2003). `Myelin-associated inhibitors of axonal regenera on in the adultmammalian CNS'. Nat Rev Neurosci 4(9):703--713.
A. Fire, et al. (1998). `Potent and specific gene c interference by double-stranded RNAin Caenorhabdi s elegans'. Nature 391(6669):806--811.
J. V. Forrester, et al. (2002). The Eye: Basic Sciences in Prac ce. Elsevier, 2nd edn.
A. E. Fournier, et al. (2001). `Iden fica on of a receptor media ng Nogo-66 inhibi on ofaxonal regenera on'. Nature 409(6818):341--346.
L. Frank, et al. (1996). `BDNF down-regulates neurotrophin responsiveness, TrkB proteinand TrkB mRNA levels in cultured rat hippocampal neurons'. Eur J Neurosci 8(6):1220--30.
L. J. Frasse o, et al. (2006). `Kinase-dependent differen a on of a re nal ganglion cellprecursor'. Invest Ophthalmol Vis Sci 47(1):427--38.
J. Frisen, et al. (1995). `Rapid, widespread, and longlas ng induc on of nes n contributesto the genera on of glial scar ssue a er CNS injury'. J Cell Biol 131(2):453--64.
S. Fulda & K. M. Deba n (2006). `Extrinsic versus intrinsic apoptosis pathways in an -cancer chemotherapy'. Oncogene 25(34):4798--4811.
G. Gallo&P. C. Letourneau (2004). `Regula onof growth cone ac n filaments by guidancecues'. Journal of Neurobiology 58(1):92--102.
Page | 195
V. Gallo & R. C. Armstrong (1995). `Developmental and growth factor-induced regula onof nes n in oligodendrocyte lineage cells'. J Neurosci 15(1 Pt 1):394--406.
M. A. Goncalves (2005). `Adeno-associated virus: fromdefec ve virus to effec ve vector'.Virol J 2:43.
T. GrandPre, et al. (2000). `Iden fica on of the Nogo inhibitor of axon regenera on as are culon protein'. Nature 403:439--444.
E. Guenther, et al. (1994). `In vitro iden fica on of re nal ganglion cells in culturewithoutthe need of dye labeling'. J Neurosci Methods 51(2):177--181.
G. J. Guillemin & B. J. Brew (2003). `Microglia, macrophages, perivascular macrophages,and pericytes: a review of func on and iden fica on'. J Leukoc Biol 75(3):388--397.
N. Hagag, et al. (1986). `Inhibi on of growth factor-induced differen a on of PC12 cellsby microinjec on of an body to ras p21'. Nature 319(6055):680--682.
W. Hal er (1998). `Disrup on of the re nal basal lamina during early embryonic devel-opment leads to a retrac on of vitreal end feet, an increased number of ganglion cells,and aberrant axonal outgrowth'. J Comp Neurol 397(1):89--104.
U. K. Hanisch & H. Ke erman (2007). `Microglia: ac ve sensor and versa le effector cellsin the normal and pathologic brain'. Nat Neurosci 10(11):1387--1394.
P. A. Hantzopoulos & C. Suri (1994). `The low affinity NGF receptor, p75, can collaboratewith each of the Trks to poten ate func onal responses to the neurotrophins'. Neuron13(1):187--201.
M. M. Harper, et al. (2009). `Brain-derived neurotrophic factor released from en-gineered mesenchymal stem cells a enuates glutamate- and hydrogen peroxide-mediated death of staurosporine-differen ated RGC-5 cells'. Experimental Eye Re-search 89(4):538--548.
A. R. Harvey, et al. (2006). `Gene therapy and transplanta on in CNS repair: The visualsystem'. Progress in Re nal and Eye Research 25(5):449 -- 489.
J. D. Houle, et al. (2006). `Combining an autologous peripheral nervous system 'bridge'and matrix modifica on by chondroi nase allows robust, func onal regenera on be-yond a hemisec on lesion of the adult rat spinal cord'. J Neurosci 26(28):7405--15.
D. W. Huang, et al. (1999). `A therapeu c vaccine approach to s mulate axon regenera-on in the adult mammalian spinal cord'. Neuron 24:639--647.
Page | 196
E. J. Huang & L. F. Reichardt (2003). `Trk receptors: Roles in neuronal signal transduc on'.Annual Review of Biochemistry 72:609--642.
M. Inoue, et al. (1996). `Ac va ng mechanism of CNTF and related cytokines'. MolNeurobiol 12(3):195--209.
S. Isenmann, et al. (2001). `Intravitreal adenoviral gene transfer evokes an immune re-sponse in the re na that is directed against the heterologous lacZ transgene productbut does not limit transgene expression'. Brain Research 892(2):229 -- 240.
S. Isenmann & A. Kretz (2003). `Molecular determinants of re nal ganglion cell develop-ment, survival, and regenera on'. Prog Re n Eye Res 22(4):483--543.
E. S. Jang & J. E. Goldman (2011). `Pax6 expression is sufficient to induce a neurogenicfate in glial progenitors of the neonatal subventricular zone'. PLoS One 6(6):e20894.
S. A. Jo, et al. (1999). `Ciliary neurotrophic factor is an axogenesis factor for re nal gan-glion cells'. Neuroscience 89(2):579--91.
S. H. Jung, et al. (2010). `Isoquercitrin is the most effec ve an oxidant in the plant Thujaorientalis and able to counteract oxida ve-induced damage to a transformed cell line(RGC-5 cells)'. Neurochemistry Interna onal 57(7):713--721.
J. R. Kennerdell & R. W. Carthew (1998). `Use of dsRNA-mediated gene c interference todemonstrate that frizzled and frizzled 2 act in the wingless pathway'. Cell 95(7):1017--26.
R. L. Klein, et al. (2006). `Efficient Neuronal Gene Transfer with AAV8 Leads to NeurotoxicLevels of Tau or Green Fluorescent Proteins'. Mol Ther 13(3):517--527.
R. N. Kolb, H. (1981). `Amacrine cells, bipolar cells and ganglion cells of the cat re na: aGolgi study' 21(7):1081--1114.
Y. Koriyama, et al. (2009). `Neuroprotec ve effects of 5-S-GAD against oxida ve stress-induced apoptosis in RGC-5 cells'. Brain Research 1296:187--195.
H. E. Krestel, et al. (2004). `Neuronal co-expression of EGFP and beta-galactosidase inmice causes neuropathology and premature death'. Neurobiol Dis 17(2):310--8.
K. S. Lavappa, et al. (1976). `Examina on of ATCC stocks for HeLa marker chromosomesin human cell lines'. Nature 259(5540):211--3.
S. G. Leaver, et al. (2006a). `Coopera ve effects of bcl-2 and AAV-mediated expressionof CNTF on re nal ganglion cell survival and axonal regenera on in adult transgenicmice'. European Journal of Neuroscience 24(12):3323--3332.
Page | 197
S. G. Leaver, et al. (2006b). `AAV-mediated expression of CNTF promotes long-term sur-vival and regenera on of adult rat re nal ganglion cells'. Gene Ther 13(18):1328--1341.
M. Lehmann, et al. (1999). `Inac va on of Rho signaling pathway promotes CNS axonregenera on'. J Neurosci 19(17):7537--47.
S. Leon, et al. (2000). `Lens injury s mulates axon regenera on in the mature rat op cnerve'. J Neurosci 20(12):4615--26.
J. Li, et al. (2011). `Hypoxia induces beta-amyloid in associa on with death of RGC-5 cellsin culture'. Biochemical and Biophysical Research Communica ons 410(1):40--44.
M. Li, et al. (2000). `Cyclic AMP promotes neuronal survival by phosphoryla on of glyco-gen synthase kinase 3beta'. Mol Cell Biol 20(24):9356--63.
C. J. Lieven, et al. (2007). `Induc on of axon and dendrite forma on during early RGC-5cell differen a on'. Experimental Eye Research 85(5):678--683.
H. S. Liu, et al. (1999). `Is green fluorescent protein toxic to the living cells?'. BiochemBiophys Res Commun 260(3):712--7.
B. Lorber, et al. (2005). `Lens injury s mulates adult mouse re nal ganglion cell axonregenera on via both macrophage- and lens-derived factors'. European Journal ofNeuroscience 21(7):2029--2034.
L. A. Lowery & D. V. Vactor (2009). `The trip of the p: understanding the growth conemachinery'. Nat Rev Mol Cell Biol 10(5):332--343.
W. Luo, et al. (2005). `Two types of protease-ac vated receptors (PAR-1 and PAR-2) me-diate calcium signaling in rat re nal ganglion cells RGC-5'. Brain Research 1047(2):159--167.
R. A. MacLeod, et al. (1999). `Widespread intraspecies cross-contamina on of humantumor cell lines arising at source'. Int J Cancer 83(4):555--63.
P. Maher & A. Hanneken (2005). `The molecular basis of oxida ve stress-induced celldeath in an immortalized re nal ganglion cell line'. InvestOphthalmol Vis Sci 46(2):749--57.
W. J. Mandemakers & B. A. Barres (2005). `Axon Regenera on: It's Ge ng Crowded atthe Gates of TROY'. Current Biology 15(8):302--305.
J. Manns, et al. (2011). `Triggering of a novel intrinsic apoptosis pathway by the kinaseinhibitor staurosporine: ac va on of caspase-9 in the absence of Apaf-1'. The FASEBJournal .
Page | 198
J. R. Masters, et al. (2001). `Short tandem repeat profiling provides an interna onal ref-erence standard for human cell lines'. Proc Natl Acad Sci U S A 98(14):8012--7.
P. McConnell & M. Berry (1982). `Regenera on of ganglion cell axons in the adult mousere na'. Brain Res 241(2):362--5.
L. McKerracher, et al. (1994). `Iden fica on of myelin-associated glycoprotein as a majormyelin-derived inhibitor of neurite growth'. Neuron 13(4):805--11.
V. Mester & F. Kuhn (2000). `Internal limi ng membrane removal in the management offull-thickness macular holes'. Am J Ophthalmol 129(6):769--77.
S. Mi, et al. (2004). `LINGO-1 is a component of the Nogo-66 receptor/p75 signalingcomplex'. Nat Neurosci 7(3):221--228.
J. A. Miotke, et al. (2007). `Immunohistochemical localiza on of CNTFRalpha in adultmouse re na and op c nerve following intraorbital nerve crush: evidence for the ax-onal loss of a trophic factor receptor a er injury'. J Comp Neurol 500(2):384--400.
H. Mizuguchi, et al. (2000). `IRES-Dependent Second Gene Expression Is SignificantlyLower Than Cap-Dependent First Gene Expression in a Bicistronic Vector'. MolecularTherapy 1:376--382.
A.Müller, et al. (2009). `Exogenous CNTF s mulates axon regenera on of re nal ganglioncells par ally via endogenous CNTF'. Molecular and Cellular Neuroscience 41(2):233--246.
X. Mo & A. Yokoyama (2002). `Rescue of axotomized re nal ganglion cells by BDNF geneelectropora on in adult rats'. Invest Ophthalmol Vis Sci 43(7):2401--2405.
P. P. Monnier, et al. (2003). `The Rho/ROCK pathway mediates neurite growth-inhibitoryac vity associated with the chondroi n sulfate proteoglycans of the CNS glial scar'.Molecular and Cellular Neuroscience 22(3):319--330.
N. T. Monsul, et al. (2004). `Intraocular injec on of dibutyryl cyclic AMP promotes axonregenera on in rat op c nerve'. Exp Neurol 186(2):124--33.
C. Moon, et al. (2004). `Upregula on of CD44 expression in the spinal cords of rats withclip compression injury'. Neuroscience Le ers 367(1):133--136.
D. A. Morgenstern, et al. (2002). `Chondroi n sulphate proteoglycans in the CNS injuryresponse'. Prog Brain Res 137:313--32.
K. C. Morrison (2011). Is the Epidermal Growth Factor Receptor involved in visual systemregenera ve failure? Ph.D. thesis, University of Birmingham.
Page | 199
G. Mukhopadhyay, et al. (1994). `A novel role for myelin-associated glycoprotein as aninhibitor of axonal regenera on'. Neuron 13(3):757--67.
R. Nelson & E. V. Famiglie (1978). `Intracellular staining reveals different levels of strat-ifica on for on- and off-center ganglion cells in cat re na'. J Neurophysiol 41(2):472--483.
T. Niidome & L. Huang (2002). `Gene Therapy Progress and Prospects: Nonviral vectors'.Gene Therapy 9(24):1647--1652.
R. W. Nims, et al. (1998). `Sensi vity of isoenzyme analysis for the detec on of inter-species cell line cross-contamina on'. In Vitro Cell Dev Biol Anim 34(1):35--9.
M. Oelgeschlager, et al. (2000). `The evolu onarily conserved BMP-binding proteinTwisted gastrula on promotes BMP signalling'. Nature 405(6788):757--763.
J. B. Park, et al. (2005). `A TNF Receptor Family Member, TROY, Is a Coreceptor with NogoReceptor in Media ng the Inhibitory Ac vity of Myelin Inhibitors'. Neuron 45(3):345--351.
K. Park, et al. (2004). `Cellular mechanisms associated with spontaneous and ciliary neu-rotrophic factor-cAMP-induced survival and axonal regenera on of adult re nal gan-glion cells'. J Neurosci 24(48):10806--15.
H. F. Paterson, et al. (1990). `Microinjec on of recombinant p21rho induces rapid changesin cell morphology'. Cell Biol 111(3):1001--1007.
. Petersén & P. Brundin (1999). `Effects of Ciliary Neurotrophic Factor on Excitotoxic-ity and Calcium-Ionophore A23187-Induced Cell Death in Cultured Embryonic StriatalNeurons'. Experimental Neurology 160(2):402--412.
J. Y. Pillé, et al. (2005). `An -RhoA and an -RhoC siRNAs inhibit the prolifera on and in-vasiveness ofMDA-MB-231 breast cancer cells in vitro and in vivo'. Mol Ther 11(2):267-- 274.
R. R. Pindzola, et al. (1993). `Puta ve inhibitory extracellular matrix molecules at thedorsal root entry zone of the spinal cord during development and a er root and scia cnerve lesions'. Dev Biol 156(1):34--48.
R. Prinjha (2000). `Inhibitor of neurite outgrowth in humans'. Nature 403:383--384.
C. Profyris, et al. (2004). `Degenera ve and regenera ve mechanisms governing spinalcord injury'. Neurobiology of Disease 15(3):415--436.
Page | 200
S. Rabizadeh, et al. (1993). `Induc on of apoptosis by the low-affinity NGF receptor'.Science 261(5119):345--348.
R. M. Ransohoff & H. Perry (2009). `Microglial physiology: Unique s muli, specialisedresponses'. Annual Reviews 27:119--145.
S. K. Ray (ed.) (2009). Glioblastoma: Molecular Mechanisms of Pathogenesis and CurrentTherapeu c Stratagies. Springer.
B. Reese & R. J. Colello (1992). `Neurogenesis in the re nal ganglion cell layer of the rat'.Neuroscience 46(2):419--428.
L. E. Rivers, et al. (2008). `PDGFRA/NG2 glia generate myelina ng oligodendrocytes andpiriform projec on neurons in adult mice'. Nat Neurosci 11(12):1392--1401.
F. Rousseau, et al. (2008). `Ciliary neurotrophic factor, cardiotrophin-like cytokine, andneuropoie n share a conserved binding site on the ciliary neurotrophic factor receptoralpha chain'. J Biol Chem 283(44):30341--50.
P. P. Roux & P. A. Barker (2002). `Neurotrophin signaling through the p75 neurotrophinreceptor'. Progress in Neurobiology 67(3):203 -- 233.
P. A. R.R.Krishnamoorthy, et al. (2000). `Characterisa on of a transformed rat re nalganglion cell line.'. Molecular Brain Research 86:1--12.
T. Sato, et al. (2010). `Effect of hypoxia on suscep bility of RGC-5 cells to nitric oxide'.Invest Ophthalmol Vis Sci 51(5):2575--86.
R. L. Schnaar & P. H. Lopez (2009). `Myelin-associated glycoprotein and its axonal recep-tors'. J Neurosci Res 87(15):3267--76.
L. Schnell & M. E. Schwab (1990). `Axonal regenera on in the rat spinal cord producedby an an body against myelin-associated neurite growth inhibitors'. Nature 343:269--272.
M. E. Schwab & H. Thoenen (1985). `Dissociated neurons regenerate into scia c butnot op c nerve explants in culture irrespec ve of neurotrophic factors'. J Neurosci5(9):2415--23.
B. R. Schwechter, et al. (2007). `Histone deacetylase inhibi on-mediated differen a onof RGC-5 cells and interac on with survival'. Invest Ophthalmol Vis Sci 48(6):2845--57.
E. V. Semina, et al. (2006). `Muta ons in laminin alpha 1 result in complex, lens-independent ocular phenotypes in zebrafish'. Dev Biol 299(1):63--77.
Page | 201
E. Sernagor & S. J. Eglen (2001). `Development of Re nal Ganglion Cell Structure andFunc on'. Progress in Re nal and Eye Research 20(2):139--174.
Z. Shao, et al. (2005). `TAJ/TROY, an orphan TNF receptor family member, binds Nogo-66receptor 1 and regulates axonal regenera on'. Neuron 45(3):353--9.
Y. Shen, et al. (2009). `PTPσ Is a Receptor for Chondroi n Sulfate Proteoglycan, an In-hibitor of Neural Regenera on'. Science 326(5952):592--596.
M. Simonen, et al. (2003). `Systemic dele on of the myelin-associated outgrowth in-hibitor Nogo-A improves regenera ve and plas c responses a er spinal cord injury'.Neuron 38(2):201--11.
K. Sims, et al. (2009). `In vitro evalua on of a ‘stealth’ adenoviral vector for targeted genedelivery to adult mammalian neurones'. The Journal of GeneMedicine 11(4):335--344.
M. W. Sleeman, et al. (2000). `The ciliary neurotrophic factor and its receptor,CNTFR[alpha]'. Pharmaceu ca Acta Helve ae 74(2--3):265--272.
S. J. D. Smedt & J. Demeester (2000). `Ca onic polymer based gene delivery systems'.Pharm Res 17(2):113--126.
D.M. Snow, et al. (1990). `Molecular and cellular characteriza on of the glial roof plate ofthe spinal cord and op c tectum: a possible role for a proteoglycan in the developmentof an axon barrier'. Dev Biol 138(2):359--76.
E. M. Surace & A. Auricchio (2008). `Versa lity of AAV vectors for re nal gene transfer'.Vision Research 48(3):353--359.
T. Tamaoki, et al. (1986). `Staurosporine, a potent inhibitor of phospho-lipid/Ca++dependent protein kinase'. Biochem Biophys Res Commun 135(2):397--402.
K. T. Tchedre & T. Yorio (2008). `sigma-1 receptors protect RGC-5 cells from apoptosis byregula ng intracellular calcium, Bax levels, and caspase-3 ac va on'. Invest Ophthal-mol Vis Sci 49(6):2577--88.
A. F. Thompson & L. A. Levin (2010). `Neuronal differen a on by analogs of stau-rosporine'. Neurochemistry Interna onal 56(4):554--560.
E. W. Thompson, et al. (2004). `LCC15-MB cells are MDA-MB-435: a review of misiden -fied breast and prostate cell lines'. Clin Exp Metastasis 21(6):535--41.
A. V. Titomirov, et al. (1991). `In vivo electropora on and stable transforma on of skincells of newborn mice by plasmid DNA'. Biochimica et Biophysica Acta (BBA) - GeneStructure and Expression 1088(1):131 -- 134.
Page | 202
J. K. M. Tuszynski (ed.) (2007). CNS Regenera on: Basic Science and Clinical Advances.Academic Press, 2nd edn.
Y. M. Ughrin, et al. (2003). `Mul ple regions of the NG2 proteoglycan inhibit neuritegrowth and induce growth cone collapse'. J Neurosci 23(1):175--86.
B. A. van Adel, et al. (2003). `Delivery of ciliary neurotrophic factor via len viral-mediatedtransfer protects axotomized re nal ganglion cells for an extended period of me'.Hum Gene Ther 14(2):103--15.
A. van Bokhoven, et al. (2001). `TSU-Pr1 and JCA-1 cells are deriva ves of T24 bladdercarcinoma cells and are not of prosta c origin'. Cancer Res 61(17):6340--4.
B. Vanhaesebroeck & J. Guillermet-Guibert (2010). `The emerging mechanisms ofisoform-specific PI3K signalling'. Nat Rev Mol Cell Biol 11(5):329--341.
A. Vasileva & R. Jessberger (2005). `Precise hit: adeno-associated virus in gene targe ng'.Nat Rev Micro 3(11):837--847.
V. Vereczki, et al. (2006). `Distribu on of hypothalamic, hippocampal and other lim-bic pep dergic neuronal cell bodies giving rise to re nopetal fibers: anterograde andretrograde tracing and neuropep de immunohistochemical studies'. Neuroscience140(3):1089--100.
A. Verkhratsky & A. Bu (2007). Glial Neurobiology. John Wiley and Sons.
I. M. Verma & M. D. Weitzman (2005). `Gene therapy: twenty-first century medicine'.Annu Rev Biochem 74:711--738.
M. Volosin, et al. (2008). `Induc on of proneurotrophins and ac va on of p75NTR-mediated apoptosis via neurotrophin receptor-interac ng factor in hippocampal neu-rons a er seizures'. J Neurosci 28(39):9870--9.
J. D. Vry, et al. (2010). `In vivo electropora on of the central nervous system: A non-viralapproach for targeted gene delivery'. Progress in Neurobiology 92(3):227 -- 244.
F. Wang & Y. Zhu (2008). `The interac on of Nogo-66 receptor with Nogo-p4 inhibits theneuronal differen a on of neural stem cells'. Neuroscience 151(1):74--81.
K. C. Wang, et al. (2002). `p75 interacts with Nogo receptor as a co-receptor for Nogo,MAG, and OMgp'. Nature 420:74--78.
S. W. Wang & B. S. Kim (2001). `Requirement for math5 in the development of re nalganglion cells'. Genes Dev 15(1):24--29.
Page | 203
H. Wassle (2004). `Parallel processing in the mammalian re na'. Nat Rev Neurosci5(10):747--757.
C. Weigert (1895). `Beiträge zur Kenntnis der normalen menschlichen'. Frankfurt aumMaim, Weisbrod, Moritz Diesterweg .
J. Weise, et al. (2000). `Adenovirus-Mediated Expression of Ciliary Neurotrophic Factor(CNTF) Rescues Axotomized Rat Re nal Ganglion Cells But Does Not Support AxonalRegenera on in Vivo'. Neurobiology of Disease 7(3):212--223.
J. S. Werner & L. M. Chalupa (2004). The visual neurosciences, vol. 1. MIT Press.
C. Wiese, et al. (2004). `Nes n expression--a property of mul -lineage progenitor cells?'.Cell Mol Life Sci 61(19--20):2510--22.
S. T. Wong, et al. (2002). `A p75(NTR) and Nogo receptor complex mediates repulsivesignaling by myelin-associated glycoprotein'. Nat Neurosci 5(12):1302--8.
J. P.Wood, et al. (2010). `A comparison of differen a on protocols for RGC-5 cells'. InvestOphthalmol Vis Sci 51(7):3774--83.
T. Yamashita, et al. (2002). `The p75 receptor transduces the signal from myelin-associated glycoprotein to Rho'. J Cell Biol 157(4):565--70.
N. Yang, et al. (1998). `Cofilin phosphoryla on by LIM-kinase 1 and its role in Rac-mediated ac n reorganiza on'. Nature 393(6687):809--12.
B. Zalc & D. R. Colman (2000). `Origins of vertebrate success'. Science 288(5464):271--2.
C. Zincarelli, et al. (2008). `Analysis of AAV Serotypes 1-9 Mediated Gene Expression andTropism in Mice A er Systemic Injec on'. Mol Ther 16(6):1073--1080.
Page | 204
APPENDIX A
CHARACTERISATION OF THE RGC-5 CELL
LINE
This appendix contains addi onal figures from the characterisa on of the RGC-5 cell line
chapter (chapter 3).
Page | 205
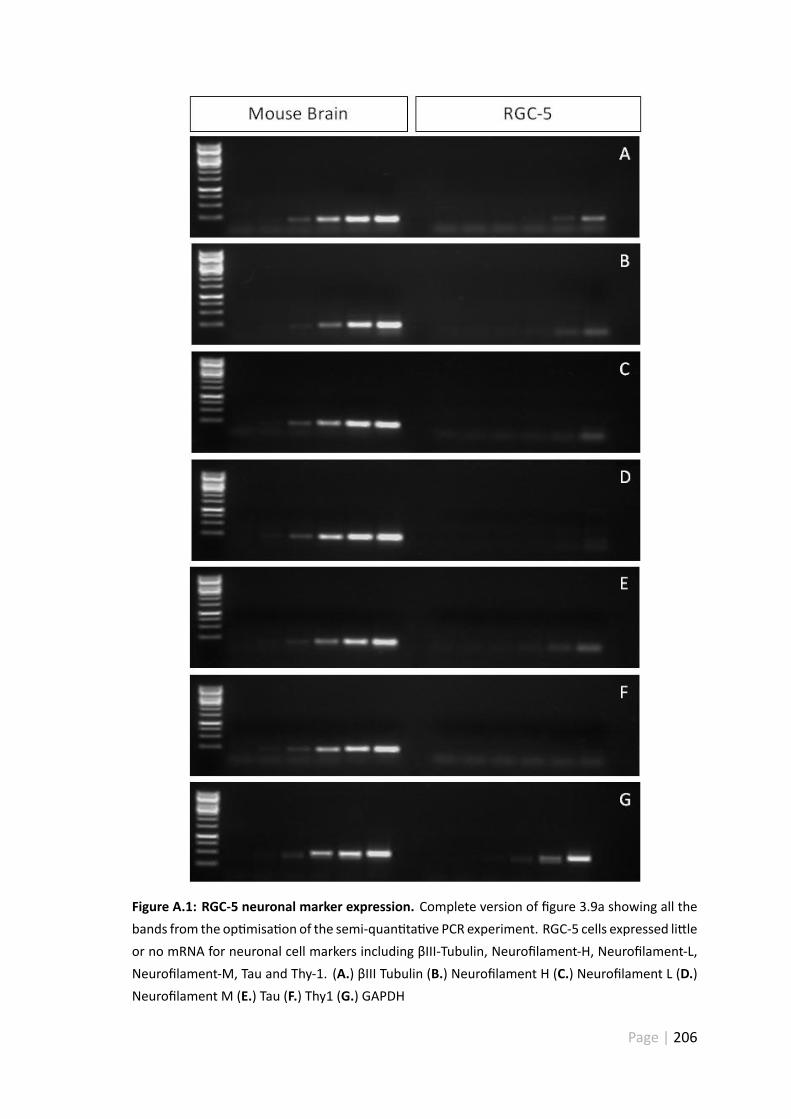
Figure A.1: RGC-5 neuronal marker expression. Complete version of figure 3.9a showing all thebands from the op misa on of the semi-quan ta ve PCR experiment. RGC-5 cells expressed li leor no mRNA for neuronal cell markers including βIII-Tubulin, Neurofilament-H, Neurofilament-L,Neurofilament-M, Tau and Thy-1. (A.) βIII Tubulin (B.) Neurofilament H (C.) Neurofilament L (D.)Neurofilament M (E.) Tau (F.) Thy1 (G.) GAPDH
Page | 206
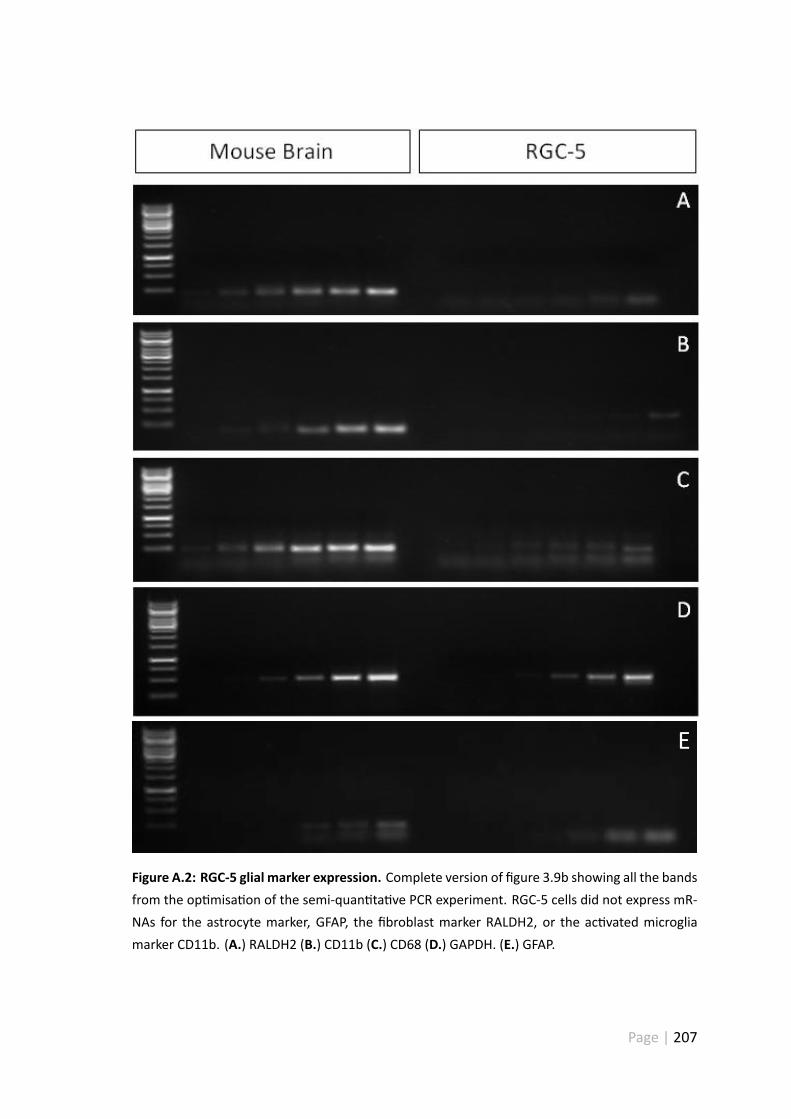
E
Figure A.2: RGC-5 glial marker expression. Complete version of figure 3.9b showing all the bandsfrom the op misa on of the semi-quan ta ve PCR experiment. RGC-5 cells did not express mR-NAs for the astrocyte marker, GFAP, the fibroblast marker RALDH2, or the ac vated microgliamarker CD11b. (A.) RALDH2 (B.) CD11b (C.) CD68 (D.) GAPDH. (E.) GFAP.
Page | 207
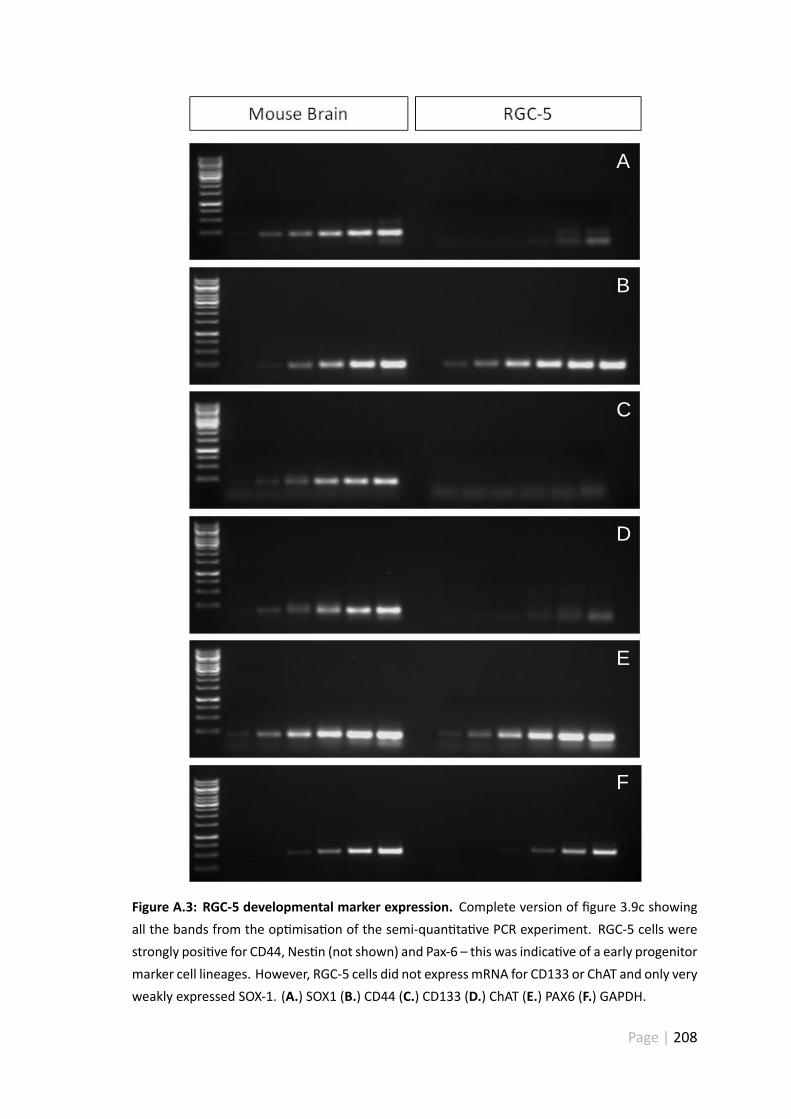
A
B
C
D
E
F
Figure A.3: RGC-5 developmental marker expression. Complete version of figure 3.9c showingall the bands from the op misa on of the semi-quan ta ve PCR experiment. RGC-5 cells werestrongly posi ve for CD44, Nes n (not shown) and Pax-6 – this was indica ve of a early progenitormarker cell lineages. However, RGC-5 cells did not expressmRNA for CD133 or ChAT and only veryweakly expressed SOX-1. (A.) SOX1 (B.) CD44 (C.) CD133 (D.) ChAT (E.) PAX6 (F.) GAPDH.
Page | 208
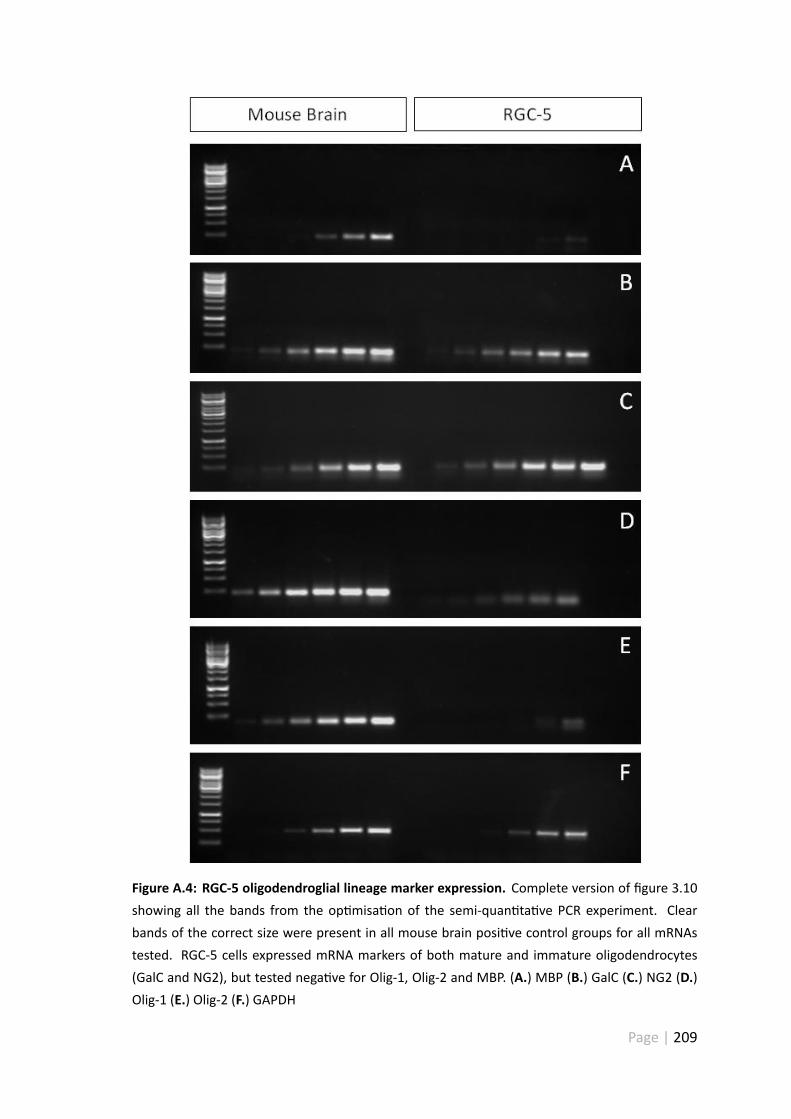
Figure A.4: RGC-5 oligodendroglial lineage marker expression. Complete version of figure 3.10showing all the bands from the op misa on of the semi-quan ta ve PCR experiment. Clearbands of the correct size were present in all mouse brain posi ve control groups for all mRNAstested. RGC-5 cells expressed mRNA markers of both mature and immature oligodendrocytes(GalC and NG2), but tested nega ve for Olig-1, Olig-2 and MBP. (A.) MBP (B.) GalC (C.) NG2 (D.)Olig-1 (E.) Olig-2 (F.) GAPDH
Page | 209
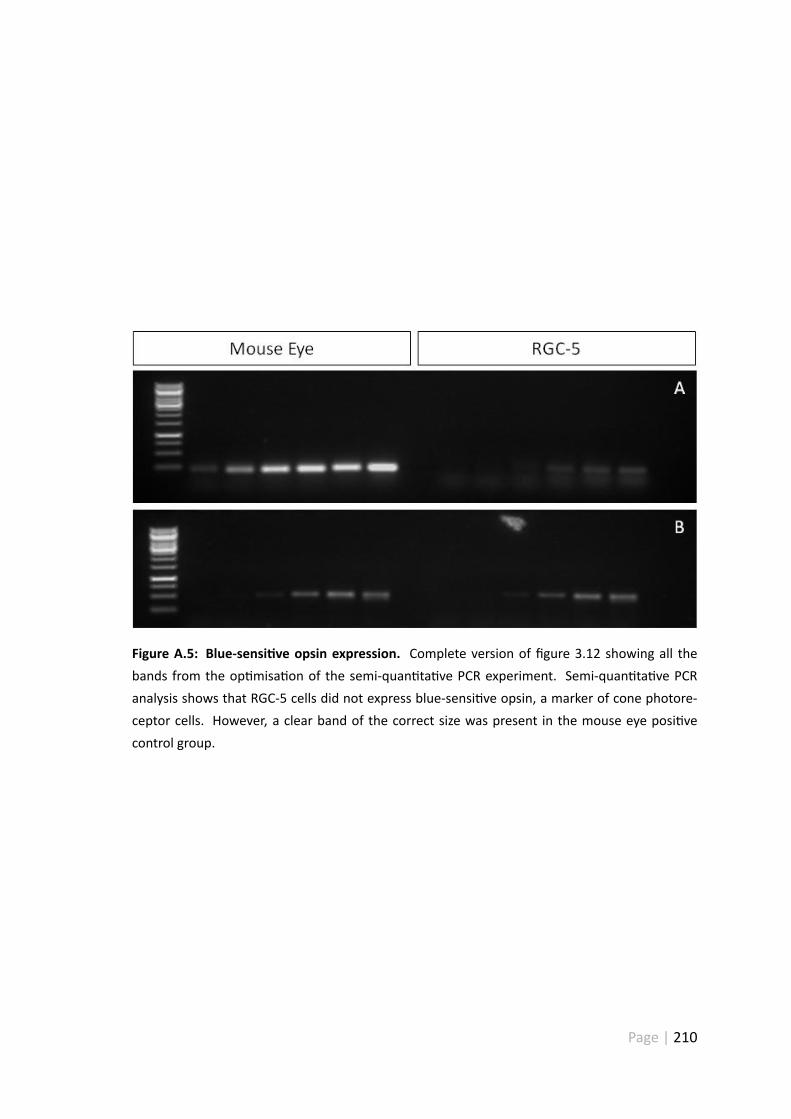
Figure A.5: Blue-sensi ve opsin expression. Complete version of figure 3.12 showing all thebands from the op misa on of the semi-quan ta ve PCR experiment. Semi-quan ta ve PCRanalysis shows that RGC-5 cells did not express blue-sensi ve opsin, a marker of cone photore-ceptor cells. However, a clear band of the correct size was present in the mouse eye posi vecontrol group.
Page | 210