admin is trac ion de la capacidad
TRANSCRIPT

7/31/2019 Admin is Trac Ion de La Capacidad
http://slidepdf.com/reader/full/admin-is-trac-ion-de-la-capacidad 1/26
1
©The McGraw -Hill Com panies, Inc., 2004
Strategic Capacity Planning
7/31/2019 Admin is Trac Ion de La Capacidad
http://slidepdf.com/reader/full/admin-is-trac-ion-de-la-capacidad 2/26
2
©The McGraw -Hill Com panies, Inc., 2004
• Strategic Capacity Planning Defined
• Capacity Utilization & Best Operating
Level
• Economies & Diseconomies of Scale
• The Experience Curve• Capacity Focus, Flexibility & Planning
• Determining Capacity Requirements• Decision Trees
• Capacity Utilization & Service Quality
OBJECTIVES
7/31/2019 Admin is Trac Ion de La Capacidad
http://slidepdf.com/reader/full/admin-is-trac-ion-de-la-capacidad 3/26
3
©The McGraw -Hill Com panies, Inc., 2004
Strategic Capacity Planning Defined
• Capacity can be defined as the ability tohold, receive, store, or accommodate
• Strategic capacity planning is anapproach for determining the overall
capacity level of capital intensiveresources, including facilities, equipment,and overall labor force size

7/31/2019 Admin is Trac Ion de La Capacidad
http://slidepdf.com/reader/full/admin-is-trac-ion-de-la-capacidad 4/26
4
©The McGraw -Hill Com panies, Inc., 2004
Capacity Utilization
• Where• Capacity used
– rate of output actually achieved
• Best operating level
– capacity for which the process was designed
leveloperatingBest
usedCapacityratenutilizatioCapacity =
7/31/2019 Admin is Trac Ion de La Capacidad
http://slidepdf.com/reader/full/admin-is-trac-ion-de-la-capacidad 5/26
5
©The McGraw -Hill Com panies, Inc., 2004
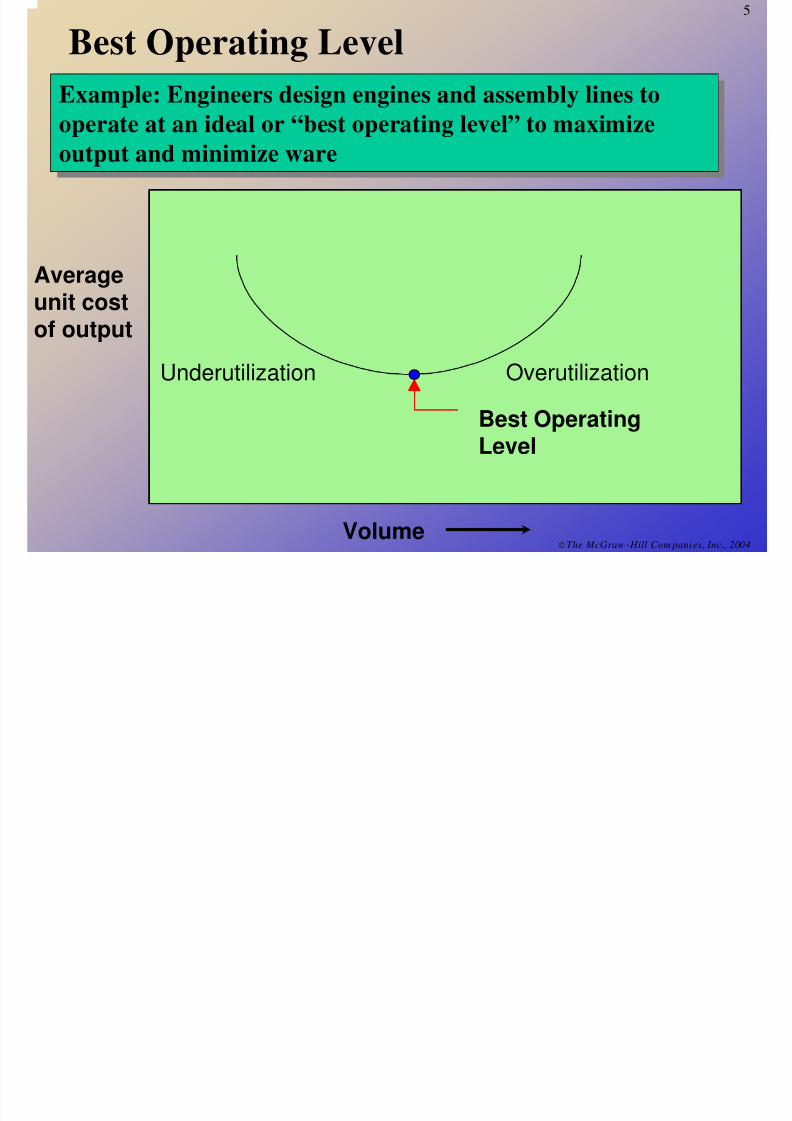
Best Operating Level
Example: Engineers design engines and assembly lines tooperate at an ideal or “best operating level” to maximize
output and minimize ware
Example: Engineers design engines and assembly lines tooperate at an ideal or “best operating level” to maximize
output and minimize ware
Underutilization
Best OperatingLevel
Averageunit costof output
Volume
Overutilization
6
7/31/2019 Admin is Trac Ion de La Capacidad
http://slidepdf.com/reader/full/admin-is-trac-ion-de-la-capacidad 6/26
6
©The McGraw -Hill Com panies, Inc., 2004
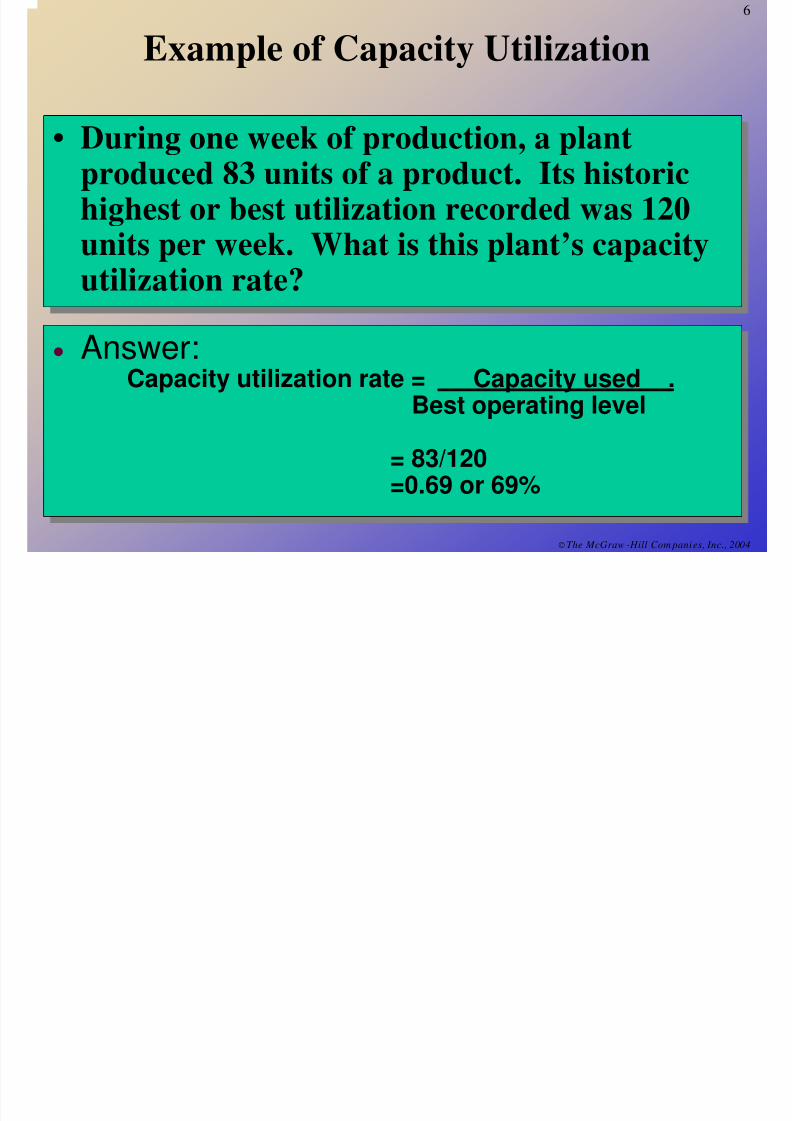
Example of Capacity Utilization
• During one week of production, a plant
produced 83 units of a product. Its historichighest or best utilization recorded was 120units per week. What is this plant’s capacity
utilization rate?
• During one week of production, a plantproduced 83 units of a product. Its historichighest or best utilization recorded was 120units per week. What is this plant’s capacity
utilization rate?
• Answer:
Capacity utilization rate = Capacity used .Best operating level
= 83/120
=0.69 or 69%
• Answer:
Capacity utilization rate = Capacity used .Best operating level
= 83/120
=0.69 or 69%
7
7/31/2019 Admin is Trac Ion de La Capacidad
http://slidepdf.com/reader/full/admin-is-trac-ion-de-la-capacidad 7/26
7
©The McGraw -Hill Com panies, Inc., 2004
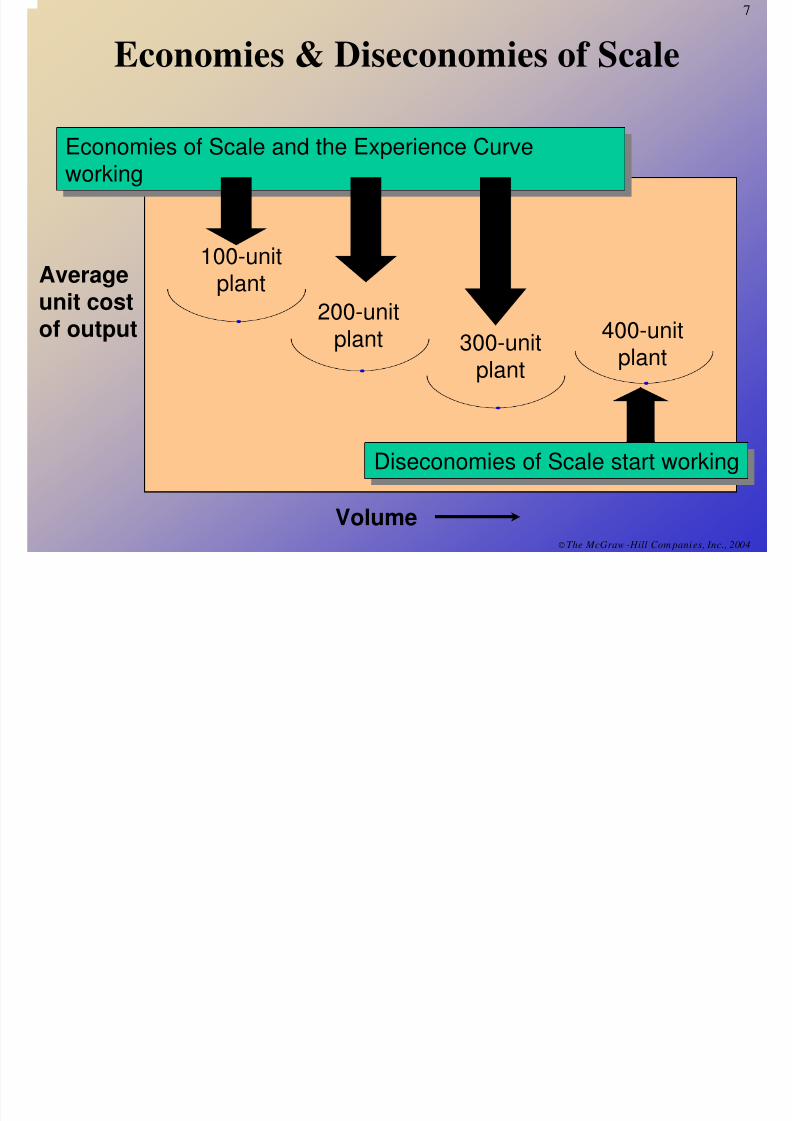
Economies & Diseconomies of Scale
100-unit
plant 200-unitplant 300-unit
plant
400-unitplant
Volume
Averageunit costof output
Economies of Scale and the Experience Curveworking
Economies of Scale and the Experience Curveworking
Diseconomies of Scale start workingDiseconomies of Scale start working
8
7/31/2019 Admin is Trac Ion de La Capacidad
http://slidepdf.com/reader/full/admin-is-trac-ion-de-la-capacidad 8/26
8
©The McGraw -Hill Com panies, Inc., 2004
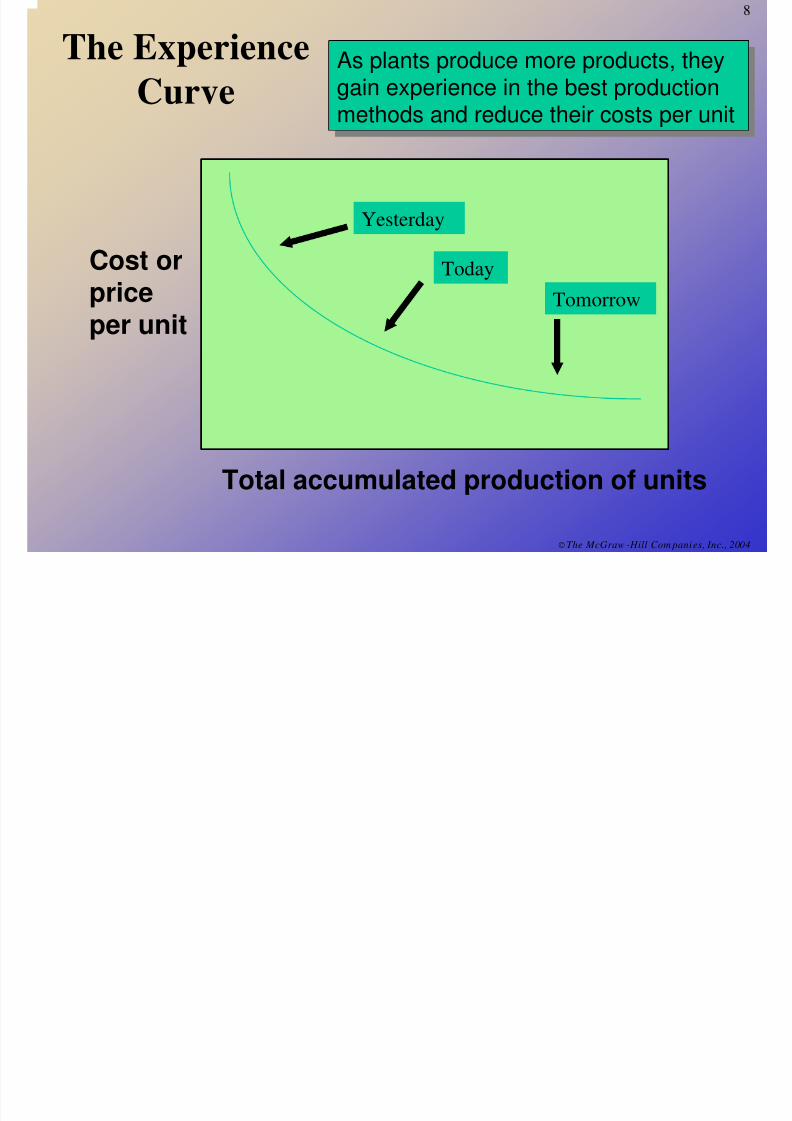
The Experience
Curve
As plants produce more products, they
gain experience in the best productionmethods and reduce their costs per unit
As plants produce more products, they
gain experience in the best productionmethods and reduce their costs per unit
Total accumulated production of units
Cost or
priceper unit
Yesterday
Today
Tomorrow
9
7/31/2019 Admin is Trac Ion de La Capacidad
http://slidepdf.com/reader/full/admin-is-trac-ion-de-la-capacidad 9/26
9
©The McGraw -Hill Com panies, Inc., 2004
Capacity Focus
• The concept of the focused factory holdsthat production facilities work best when
they focus on a fairly limited set of
production objectives
• Plants Within Plants (PWP) (fromSkinner)– Extend focus concept to operating level
10

7/31/2019 Admin is Trac Ion de La Capacidad
http://slidepdf.com/reader/full/admin-is-trac-ion-de-la-capacidad 10/26
10
©The McGraw -Hill Com panies, Inc., 2004
Capacity Flexibility
• Flexible plants
• Flexible processes
• Flexible workers
11
7/31/2019 Admin is Trac Ion de La Capacidad
http://slidepdf.com/reader/full/admin-is-trac-ion-de-la-capacidad 11/26
11
©The McGraw -Hill Com panies, Inc., 2004
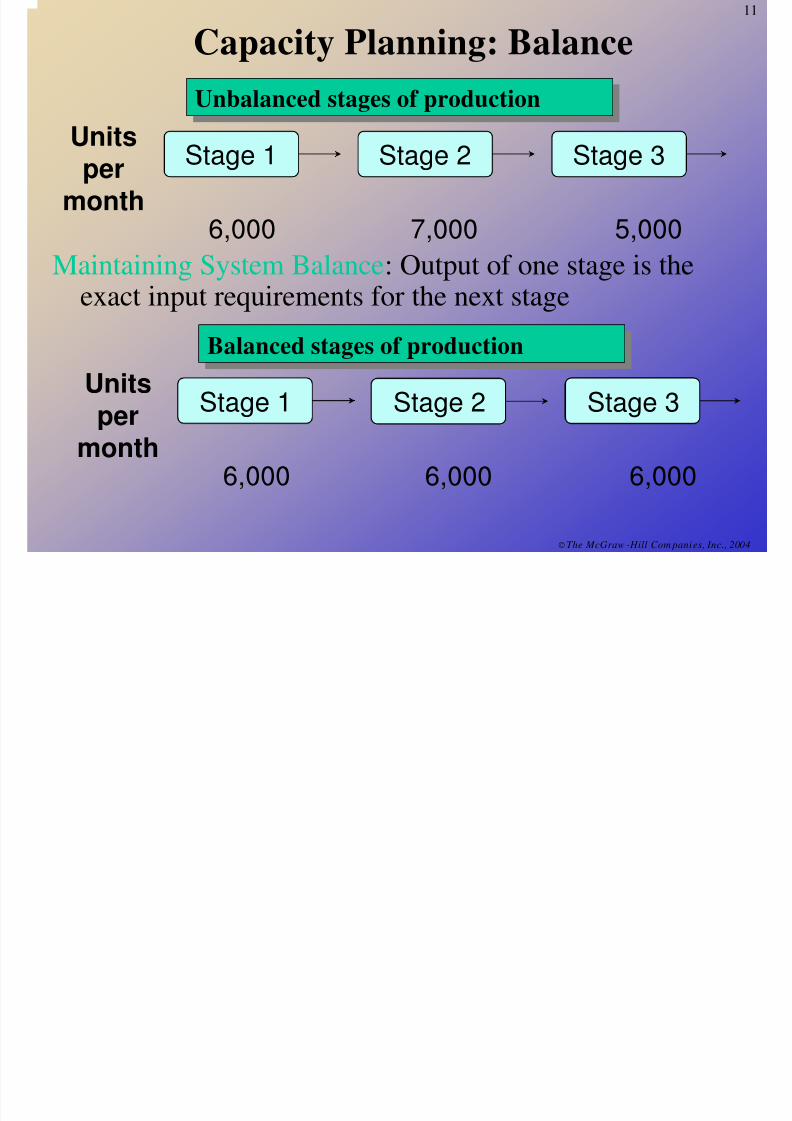
Capacity Planning: Balance
Stage 1 Stage 2 Stage 3Unitsper
month6,000 7,000 5,000
Unbalanced stages of productionUnbalanced stages of production
Stage 1 Stage 2 Stage 3Unitsper
month
6,000 6,000 6,000
Balanced stages of productionBalanced stages of production
Maintaining System Balance: Output of one stage is the
exact input requirements for the next stage
12
7/31/2019 Admin is Trac Ion de La Capacidad
http://slidepdf.com/reader/full/admin-is-trac-ion-de-la-capacidad 12/26
12
©The McGraw -Hill Com panies, Inc., 2004
Capacity Planning
• Frequency of Capacity Additions
• External Sources of Capacity
13
7/31/2019 Admin is Trac Ion de La Capacidad
http://slidepdf.com/reader/full/admin-is-trac-ion-de-la-capacidad 13/26©The McGraw -Hill Com panies, Inc., 2004
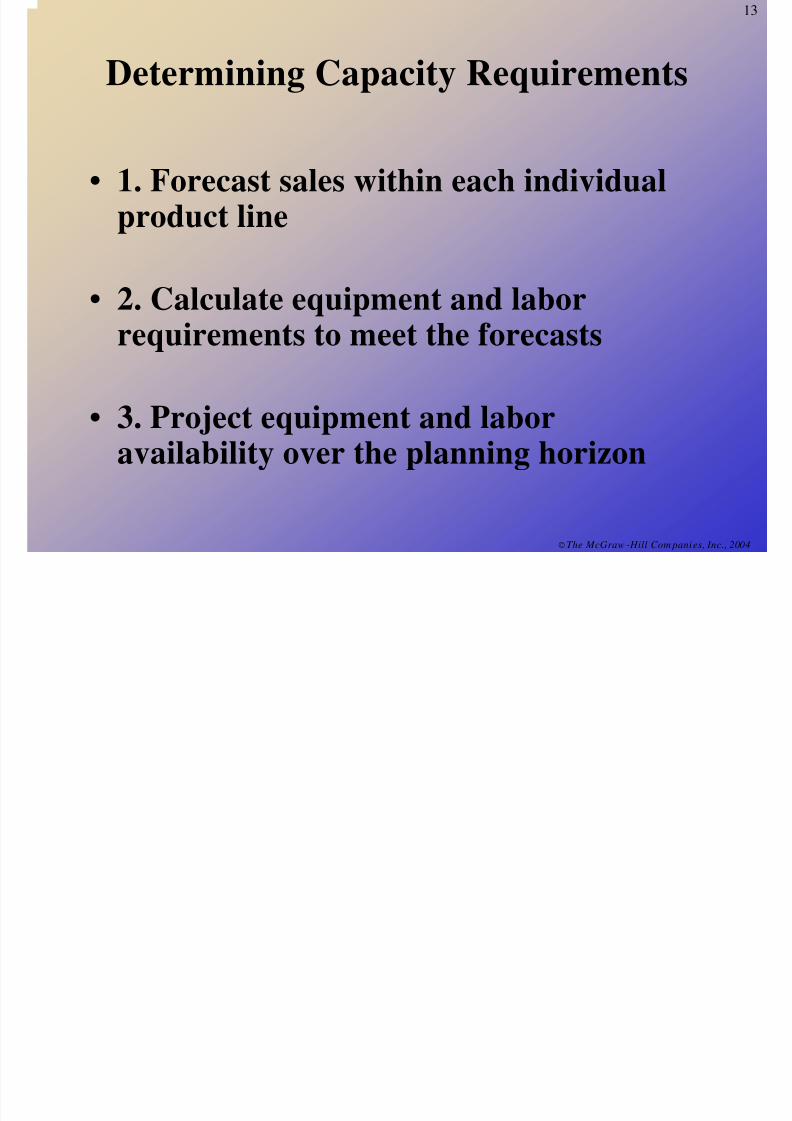
Determining Capacity Requirements
• 1. Forecast sales within each individualproduct line
• 2. Calculate equipment and laborrequirements to meet the forecasts
• 3. Project equipment and laboravailability over the planning horizon
14
7/31/2019 Admin is Trac Ion de La Capacidad
http://slidepdf.com/reader/full/admin-is-trac-ion-de-la-capacidad 14/26
©The McGraw -Hill Com panies, Inc., 2004
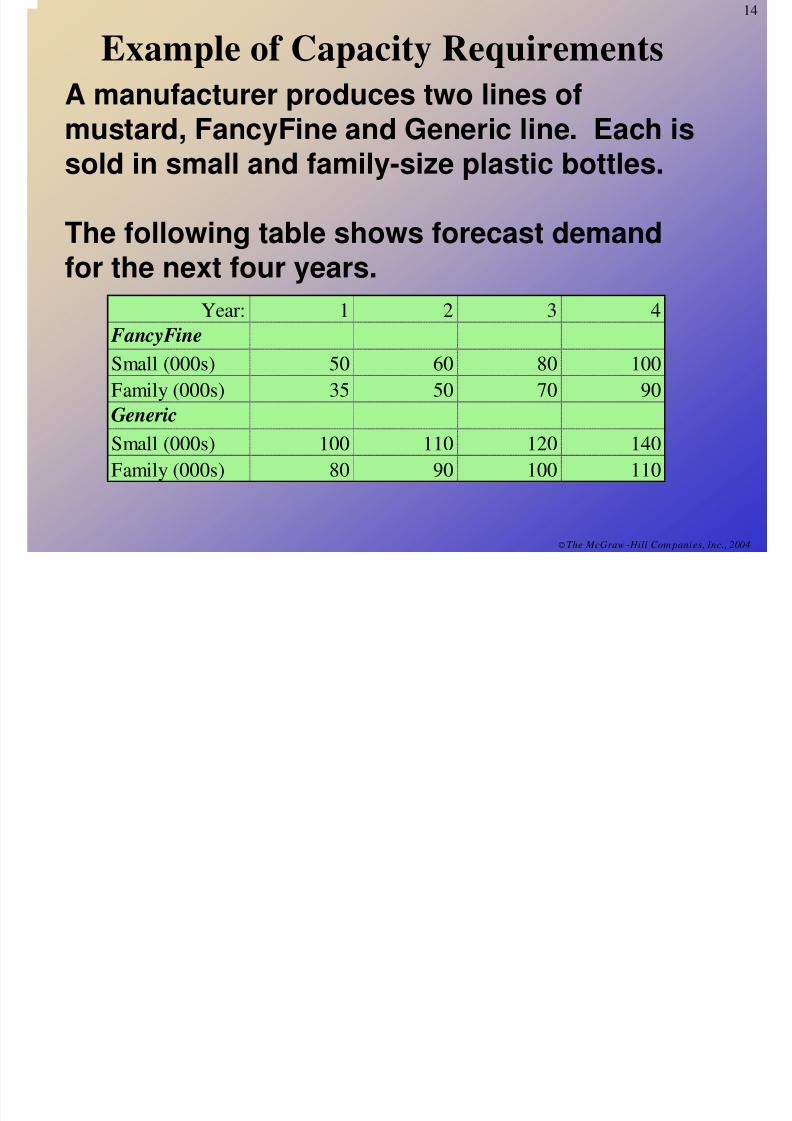
Example of Capacity Requirements
A manufacturer produces two lines ofmustard, FancyFine and Generic line. Each issold in small and family-size plastic bottles.
The following table shows forecast demandfor the next four years.
Year: 1 2 3 4
FancyFine
Small (000s) 50 60 80 100
Family (000s) 35 50 70 90Generic
Small (000s) 100 110 120 140
Family (000s) 80 90 100 110
15
7/31/2019 Admin is Trac Ion de La Capacidad
http://slidepdf.com/reader/full/admin-is-trac-ion-de-la-capacidad 15/26
©The McGraw -Hill Com panies, Inc., 2004
Example of Capacity Requirements
(Continued): Product from a CapacityViewpoint
• Question: Are we really producing two
different types of mustards from the standpoint
of capacity requirements?
• Answer: No, it’s the same product just
packaged differently.
• Question: Are we really producing twodifferent types of mustards from the standpoint
of capacity requirements?
• Answer: No, it’s the same product just
packaged differently.
16
7/31/2019 Admin is Trac Ion de La Capacidad
http://slidepdf.com/reader/full/admin-is-trac-ion-de-la-capacidad 16/26
©The McGraw -Hill Com panies, Inc., 2004
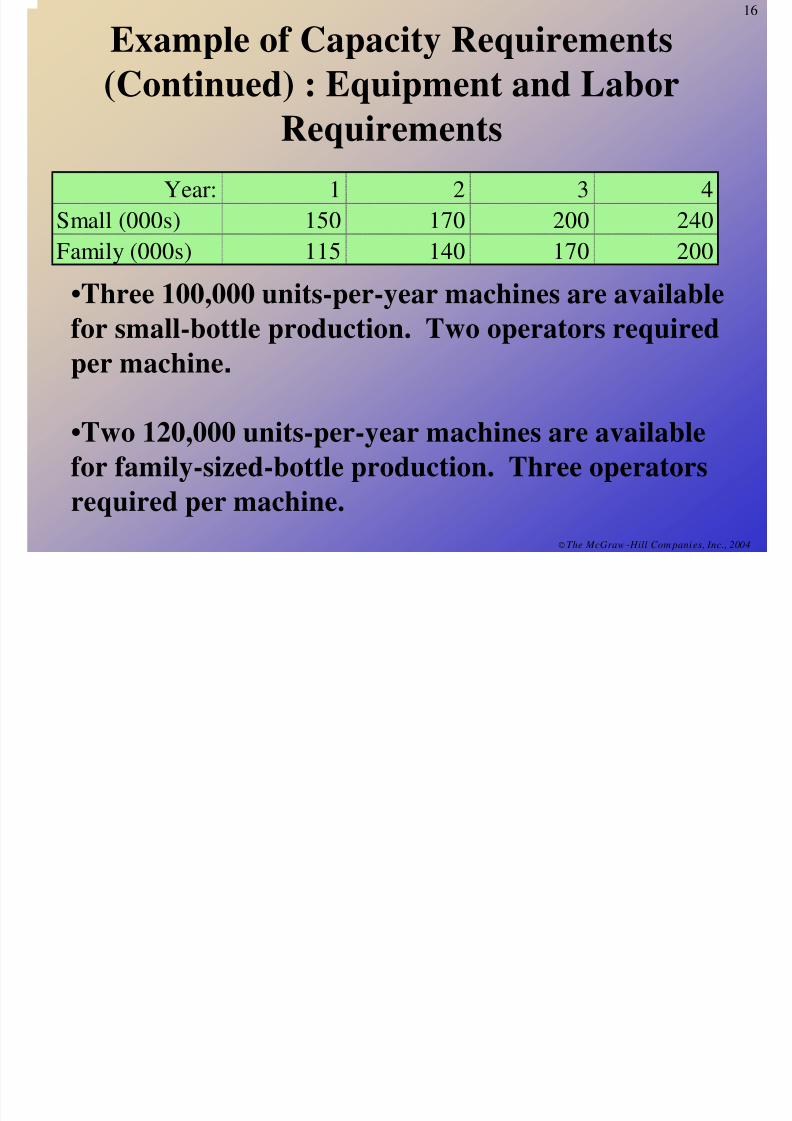
Example of Capacity Requirements
(Continued) : Equipment and LaborRequirements
Year: 1 2 3 4Small (000s) 150 170 200 240
Family (000s) 115 140 170 200
•Three 100,000 units-per-year machines are availablefor small-bottle production. Two operators required
per machine.
•Two 120,000 units-per-year machines are available
for family-sized-bottle production. Three operators
required per machine.
17
7/31/2019 Admin is Trac Ion de La Capacidad
http://slidepdf.com/reader/full/admin-is-trac-ion-de-la-capacidad 17/26
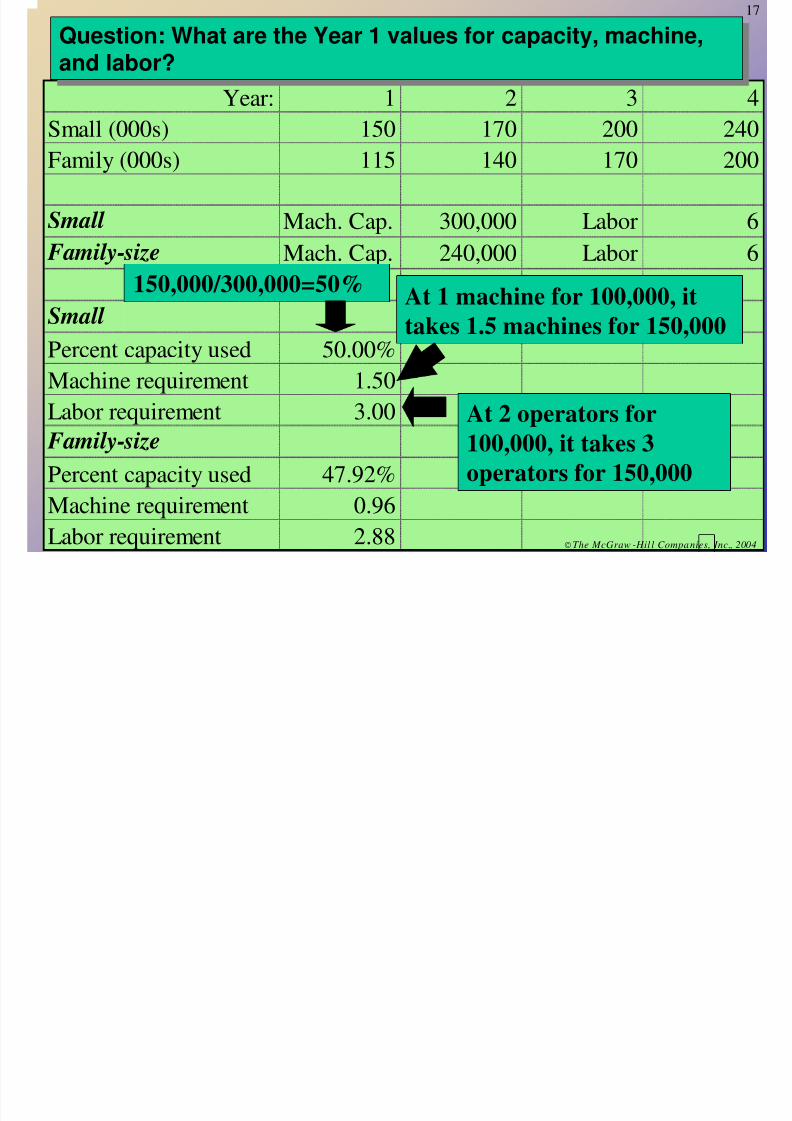
Year: 1 2 3 4Small (000s) 150 170 200 240
Family (000s) 115 140 170 200
Small Mach. Cap. 300,000 Labor 6
Family-size Mach. Cap. 240,000 Labor 6
Small
Percent capacity used 50.00%
Machine requirement 1.50Labor requirement 3.00
Family-size
Percent capacity used 47.92%
Machine requirement 0.96
Labor requirement 2.88
Question: What are the Year 1 values for capacity, machine,and labor?
Question: What are the Year 1 values for capacity, machine,and labor?
150,000/300,000=50%
At 2 operators for
100,000, it takes 3
operators for 150,000
At 1 machine for 100,000, ittakes 1.5 machines for 150,000
©The McGraw -Hil l Companies, Inc., 2004
18
7/31/2019 Admin is Trac Ion de La Capacidad
http://slidepdf.com/reader/full/admin-is-trac-ion-de-la-capacidad 18/26
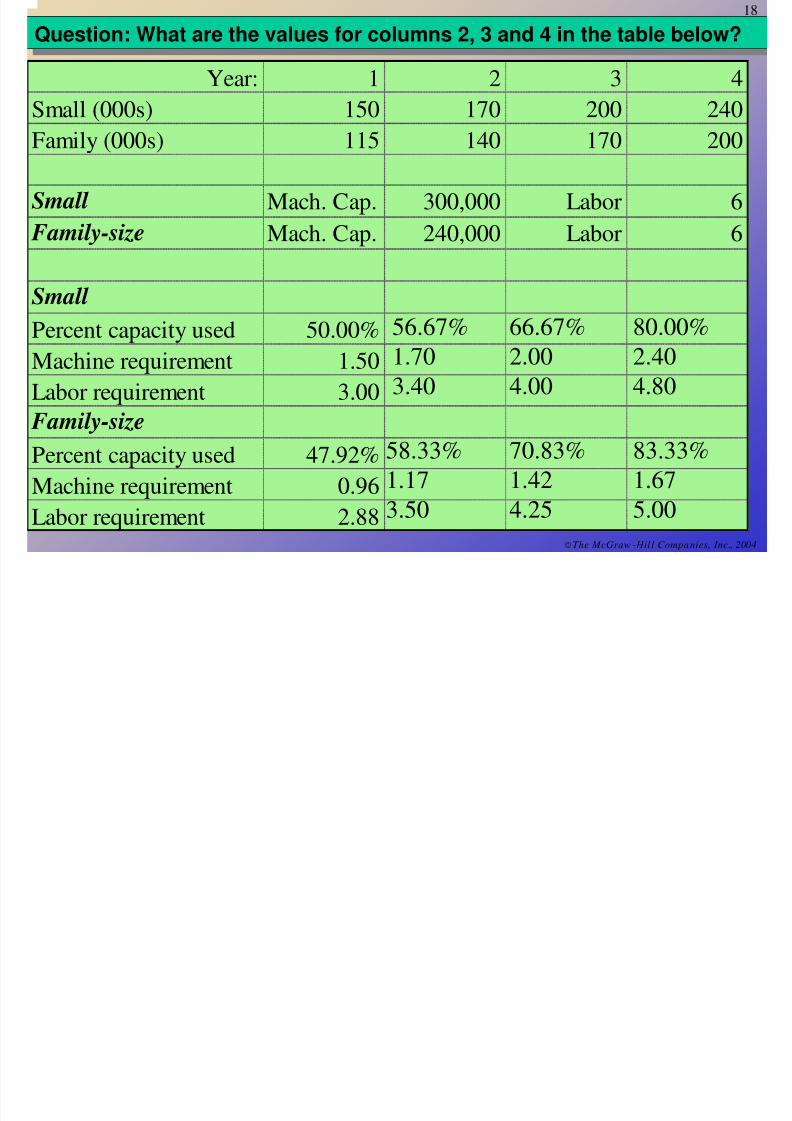
Year: 1 2 3 4
Small (000s) 150 170 200 240
Family (000s) 115 140 170 200
Small Mach. Cap. 300,000 Labor 6Family-size Mach. Cap. 240,000 Labor 6
Small Percent capacity used 50.00%
Machine requirement 1.50
Labor requirement 3.00Family-size
Percent capacity used 47.92%
Machine requirement 0.96Labor requirement 2.88
Question: What are the values for columns 2, 3 and 4 in the table below?Question: What are the values for columns 2, 3 and 4 in the table below?
56.67%
1.70
3.40
58.33%
1.173.50
66.67%
2.00
4.00
70.83%
1.424.25
80.00%
2.40
4.80
83.33%
1.675.00
©The McGraw -Hil l Companies, Inc., 2004
7/31/2019 Admin is Trac Ion de La Capacidad
http://slidepdf.com/reader/full/admin-is-trac-ion-de-la-capacidad 19/26
20
7/31/2019 Admin is Trac Ion de La Capacidad
http://slidepdf.com/reader/full/admin-is-trac-ion-de-la-capacidad 20/26
©The McGraw -Hill Com panies, Inc., 2004
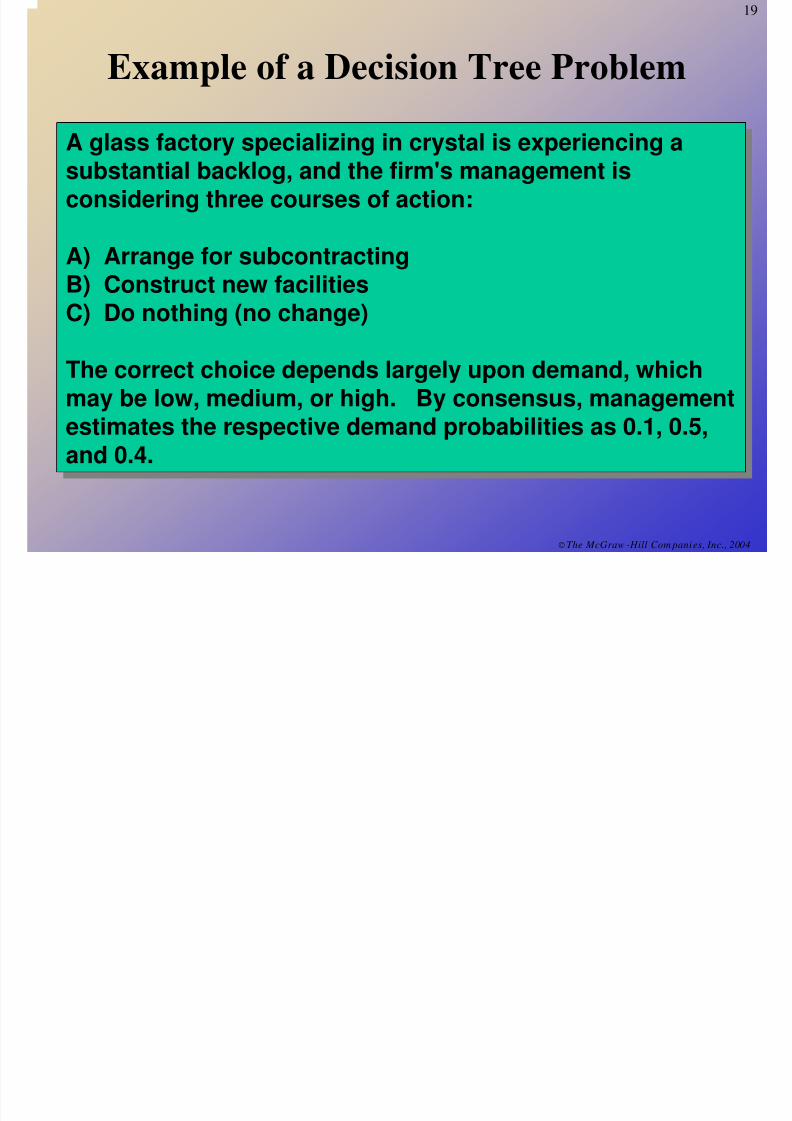
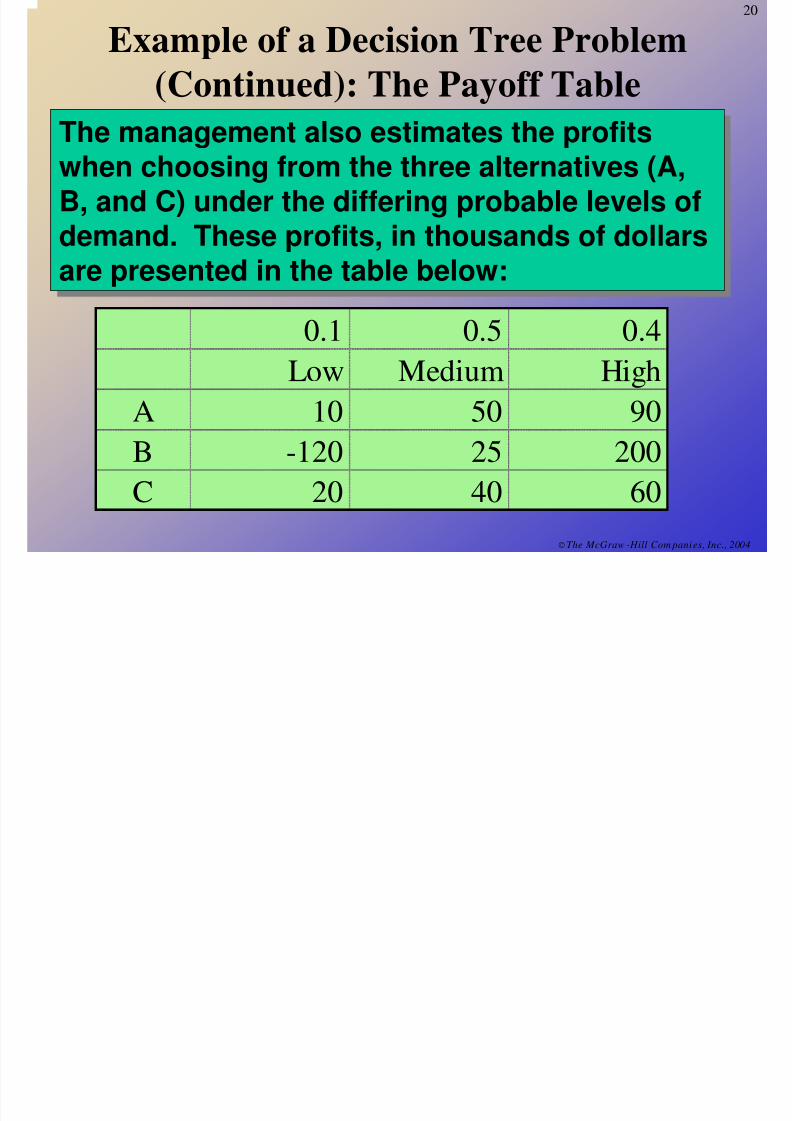
Example of a Decision Tree Problem
(Continued): The Payoff Table
0.1 0.5 0.4
Low Medium High
A 10 50 90
B -120 25 200
C 20 40 60
The management also estimates the profitswhen choosing from the three alternatives (A,
B, and C) under the differing probable levels ofdemand. These profits, in thousands of dollarsare presented in the table below:
The management also estimates the profitswhen choosing from the three alternatives (A,
B, and C) under the differing probable levels ofdemand. These profits, in thousands of dollarsare presented in the table below:
21
7/31/2019 Admin is Trac Ion de La Capacidad
http://slidepdf.com/reader/full/admin-is-trac-ion-de-la-capacidad 21/26
©The McGraw -Hill Com panies, Inc., 2004
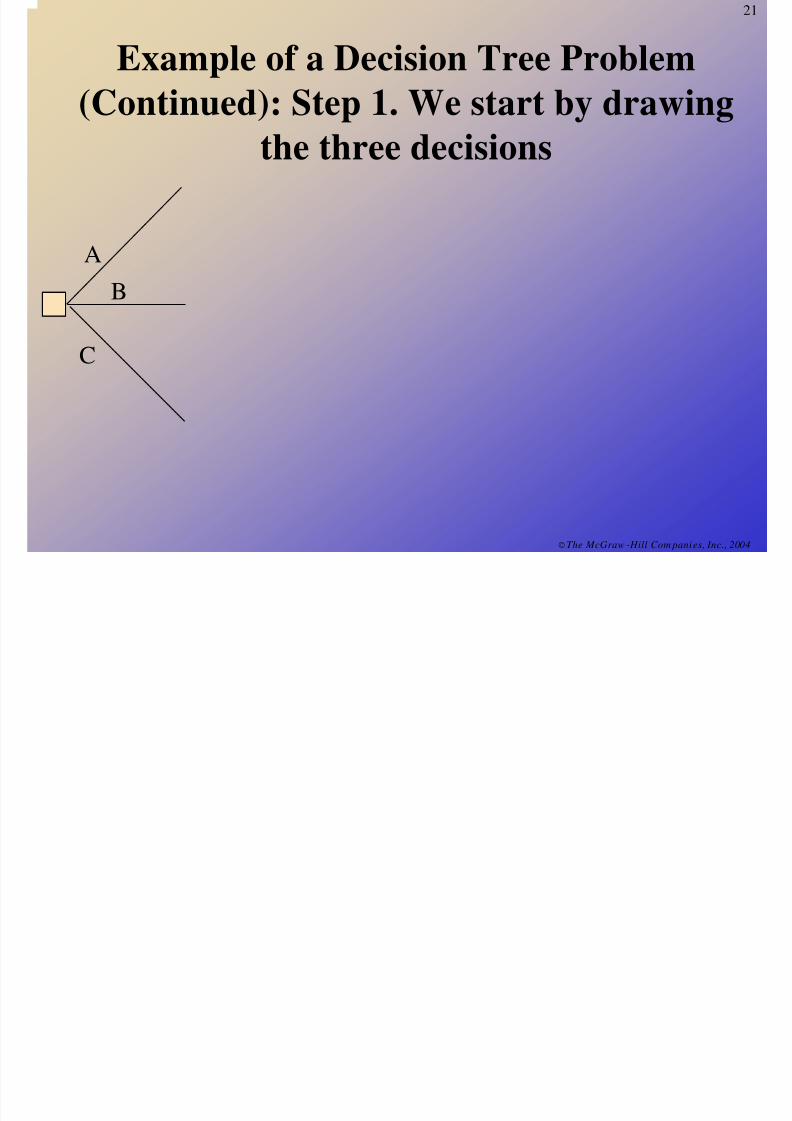
Example of a Decision Tree Problem
(Continued): Step 1. We start by drawingthe three decisions
A
B
C
22
E l f D i i T P bl
7/31/2019 Admin is Trac Ion de La Capacidad
http://slidepdf.com/reader/full/admin-is-trac-ion-de-la-capacidad 22/26
©The McGraw -Hill Com panies, Inc., 2004
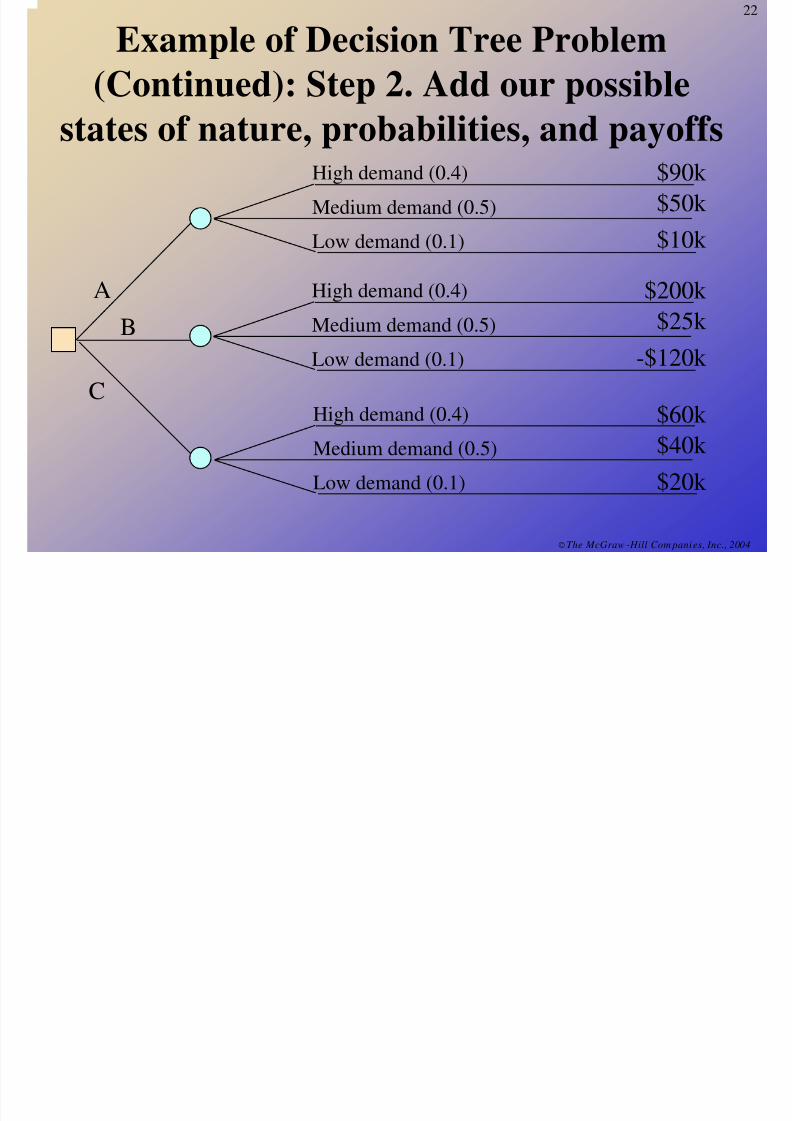
Example of Decision Tree Problem
(Continued): Step 2. Add our possiblestates of nature, probabilities, and payoffs
AB
C
High demand (0.4)
Medium demand (0.5)
Low demand (0.1)
$90k
$50k
$10k
High demand (0.4)Medium demand (0.5)
Low demand (0.1)
$200k $25k
-$120k
High demand (0.4)
Medium demand (0.5)
Low demand (0.1)
$60k
$40k
$20k
23
7/31/2019 Admin is Trac Ion de La Capacidad
http://slidepdf.com/reader/full/admin-is-trac-ion-de-la-capacidad 23/26
©The McGraw -Hill Com panies, Inc., 2004
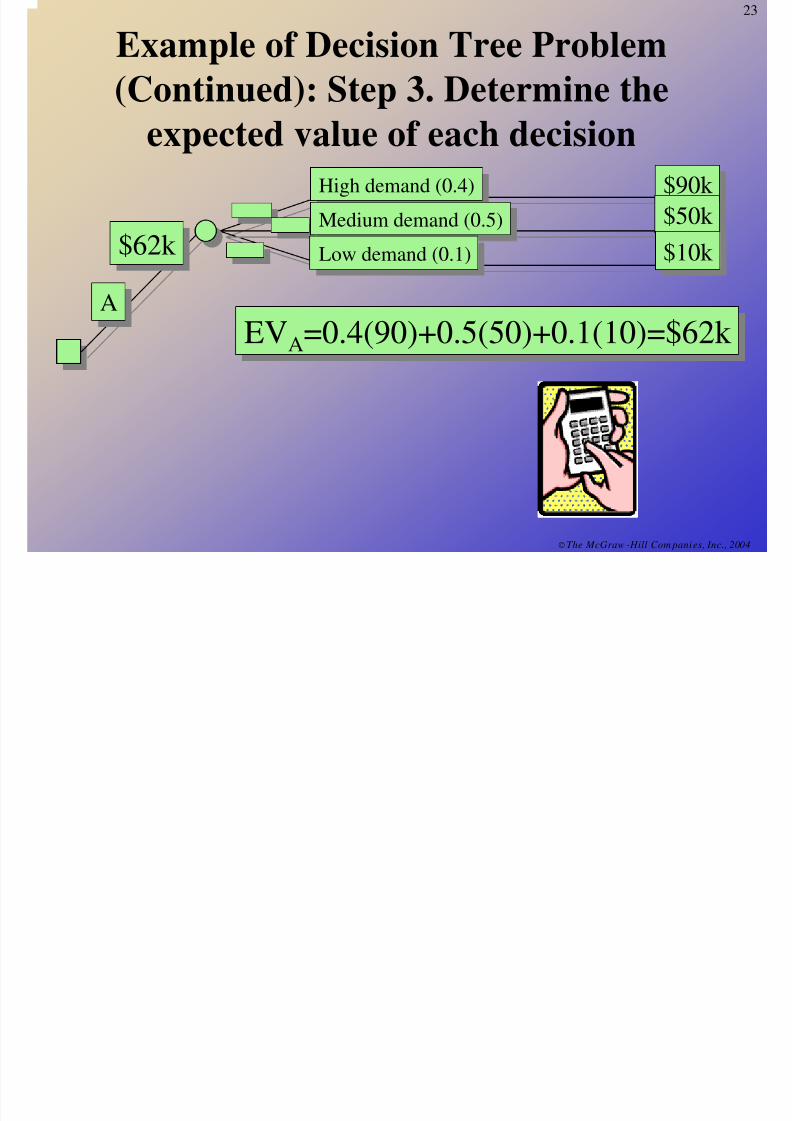
Example of Decision Tree Problem
(Continued): Step 3. Determine theexpected value of each decision
High demand (0.4)High demand (0.4)
Medium demand (0.5)Medium demand (0.5)
Low demand (0.1)Low demand (0.1)
AA
$90k $90k
$50k $50k
$10k $10k
EVA=0.4(90)+0.5(50)+0.1(10)=$62k EVA=0.4(90)+0.5(50)+0.1(10)=$62k
$62k $62k
24
7/31/2019 Admin is Trac Ion de La Capacidad
http://slidepdf.com/reader/full/admin-is-trac-ion-de-la-capacidad 24/26
©The McGraw -Hill Com panies, Inc., 2004
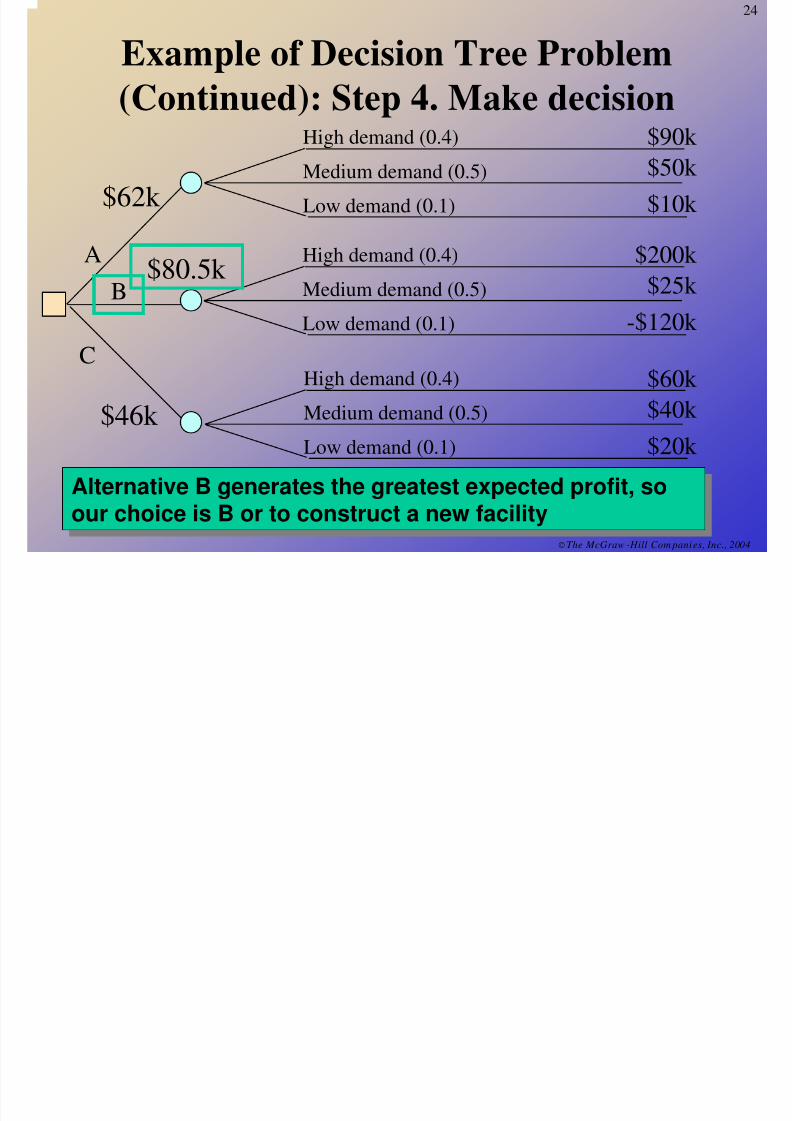
Example of Decision Tree Problem
(Continued): Step 4. Make decisionHigh demand (0.4)
Medium demand (0.5)
Low demand (0.1)
High demand (0.4)
Medium demand (0.5)Low demand (0.1)
A
B
CHigh demand (0.4)
Medium demand (0.5)
Low demand (0.1)
$90k
$50k
$10k
$200k
$25k -$120k
$60k
$40k
$20k
$62k
$80.5k
$46k
Alternative B generates the greatest expected profit, soour choice is B or to construct a new facilityAlternative B generates the greatest expected profit, soour choice is B or to construct a new facility
25
7/31/2019 Admin is Trac Ion de La Capacidad
http://slidepdf.com/reader/full/admin-is-trac-ion-de-la-capacidad 25/26
©The McGraw -Hill Com panies, Inc., 2004
Planning Service Capacity vs.
Manufacturing Capacity
• Time: Goods can not be stored for later use and
capacity must be available to provide a service
when it is needed
• Location: Service goods must be at the
customer demand point and capacity must be
located near the customer
• Volatility of Demand: Much greater than in
manufacturing
26
7/31/2019 Admin is Trac Ion de La Capacidad
http://slidepdf.com/reader/full/admin-is-trac-ion-de-la-capacidad 26/26
©The McGraw -Hill Com panies, Inc., 2004
Capacity Utilization &
Service Quality
• Best operating point is near 70% of capacity
• From 70% to 100% of service capacity, what
do you think happens to service quality?