administrative budget request and financial plans · pdf fileadministrative budget request and...
TRANSCRIPT

BOARD APPROVED: SEPTEMBER 11, 2014
NEW YORK STATE HOUSING FINANCE AGENCY STATE OF NEW YORK MORTGAGE AGENCY
NEW YORK STATE AFFORDABLE HOUSING CORPORATION STATE OF NEW YORK MUNICIPAL BOND BANK AGENCY
TOBACCO SETTLEMENT FINANCING CORPORATION
Administrative Budget Request
and
Financial Plans
Fiscal Year Ending October 31, 2015
(Fiscal Year Ending March 31, 2016 for AHC)
HFA, SONYMA, AHC, MBBA and TSFC
TABLE OF CONTENTS
PAGE Certification by the Chief Operating Officer ...................................................................................1 Explanation of Public Authority’s Governmental Relationships ………...……………………… 2 Description of the Budget Process ……………...…………………………………………….......3 Budget Time Line ............................................................................................................................6 HFA, SONYMA, AHC, MBBA and TSFC Administrative Budget Request
FY 2015 Administrative Budget Request ............................................................................8
Staffing ...............................................................................................................................11
Significant Budget Items....................................................................................................13
Revenue Sources ................................................................................................................16
Expense Allocations ...........................................................................................................17
FY 2014 Administrative Budget Performance (by Agency) as of June 30, 2014 .............18 FY 2014 Administrative Budget Performance Projections ...............................................19
Administrative Expense Projections to 2018 .....................................................................20
Administrative Expense Projection Assumptions ..............................................................21
FY 2013 Administrative Budget Performance (by Agency) .............................................22
New York State Housing Finance Agency
Financial Plan.....................................................................................................................24 Risks, Assumptions and Other Information .......................................................................26

TABLE OF CONTENTS (continued)
PAGE State of New York Mortgage Agency
Financial Plan.....................................................................................................................28 Risks, Assumptions and Other Information .......................................................................30
State of New York Municipal Bond Bank Agency
Financial Plan.....................................................................................................................32 Risks, Assumptions and Other Information .......................................................................34
Tobacco Settlement Financing Corporation
Financial Plan.....................................................................................................................36 Risks, Assumptions and Other Information .......................................................................38
New York State Affordable Housing Corporation
Financial Plan.....................................................................................................................40 Risks, Assumptions and Other Information .......................................................................42
New York State Housing Finance Agency and State of New York Municipal Bond Bank Agency
Preliminary Cash Budgets ..................................................................................................43


HFA, SONYMA, AHC, MBBA and TSFC
EXPLANATION OF THE PUBLIC AUTHORITY’S RELATIONSHIP WITH THE UNIT OR UNITS OF GOVERNMENT, IF ANY,
ON WHOSE BEHALF OR BENEFIT THE AUTHORITY WAS ESTABLISHED
The State of New York Mortgage Agency ("SONYMA"), the New York State Housing Finance Agency ("HFA"), and the State of New York Municipal Bond Bank Agency ("MBBA") (collectively, along with their subsidiaries, the "Agencies") are corporate governmental agencies, constituting public benefit corporations of the State of New York. Each Agency is created pursuant to state statute, and each Agency's powers and obligations are set forth in their enabling statutes. Each is governed by Boards of Directors (or Members in the case of HFA). Each has adopted By-laws that govern the functioning of each Agency. None of the Agencies have taxing powers. Their governing boards are comprised of certain ex officio members, the State Comptroller or a member appointed by the State Comptroller, the Chairman of HFA, and members appointed by (i) the Governor, with the advice and consent of the Senate, (ii) the Co-Leaders of the State Senate, and (iii) the Speaker of the Assembly. Each Agency has its own independent board. The New York State Affordable Housing Corporation ("AHC"), and the Tobacco Settlement Financing Corporation ("TSFC") are subsidiaries of HFA and MBBA, respectively, and have the same boards as their parent corporations.
2

HFA, SONYMA, AHC, MBBA and TSFC
DESCRIPTION OF THE BUDGET PROCESS
General Information The fiscal year end for HFA, SONYMA, MBBA and TSFC is October 31. AHC’s fiscal year end is March 31. Administrative Budget The New York State Housing Finance Agency, the State of New York Mortgage Agency, the New York State Affordable Housing Corporation, the State of New York Municipal Bond Bank Agency and the Tobacco Settlement Financing Corporation (collectively referred to as the “Agencies” or individually the “Agency”) share offices, administrative functions and staff. As such, one administrative budget accounts for the administrative expenses of all of the Agencies. In general, expenses and contracts are processed through HFA or SONYMA. Common operating expenses are typically shared equally by HFA and SONYMA while other more specific expenses are directly charged to either Agency or allocated based on each respective Agencies’ payroll allocation (discussed below). Certain expenses are allocated to the AHC, MBBA and TSFC on a direct charge or payroll allocation basis. The Administrative budget is prepared on a modified accrual basis. Cash Budgets HFA and MBBA annually prepare “Program Budgets” which are required by bond resolution, and are filed with the bond trustees. These budgets account for the “restricted” funds held by HFA and MBBA- those used to collect principal and interest on loans and pay debt service on bonds. These budgets are prepared on a cash basis and demonstrate to bond holders that there will be sufficient cash to pay debt service on the bonds in the upcoming year. Financial Plan The financial plan for each Agency is prepared on a modified accrual basis. Each Agency files its own financial plan.
3

Budget Process Administrative Budget The budget process begins with a review of the current expense categories and accounts to determine if reclassifications of expenses or new expense categories are warranted. This review takes place in early May to insure that all system changes can be made on a timely basis. At this time the budget officer also reviews the Agencies’ organization chart and insures that the proper authorizations for the unit budget preparation, entry and approval are in place. The second step in the budget process, which also takes place in May, is to circulate to each unit head a “Staff Allocation Table”. This report lists each employee and the time allocated to each of the five Agencies (based on each employee’s best estimate). This allocation becomes the basis for the monthly allocation of salaries and employee benefits to each of the five Agencies. A meeting is scheduled with the President of Professional Services, Chief Financial Officer (“CFO”) and budget officer to discuss the staffing levels and overall budget plan. Based on current and anticipated fiscal needs, a general direction for discretionary spending is determined. Restrictions on travel and any other State mandates are taken into consideration as well. By mid-June, unit supervisors are asked to submit a budget for select administrative expenses expected to be incurred by their unit. For example, all units will be asked to justify expenditures for travel, consultants, membership fees, education, books & periodicals and temporary help. The Facilities Administration unit will also be asked to budget for postage, auto expenses, office supplies and purchase of furniture & fixtures among other things. To assist in the budget process, each unit is provided with two years of expense information, as well as the current year-to-date data. At this time, the Agencies’ Comptroller (“Comptroller”) is asked to prepare the program budgets (fiscal plans) with a forecast of revenues and expenses for the next three years. Once each unit has entered their budget request, the budget officer compiles all of the unit requests and begins the review process. Budget requests may be reduced where expenses are not substantiated, or prior spending does not support the current request. A proposed budget request is then drafted and circulated to the Chief Executive Officer (“CEO”), the CFO and the President of Professional Services for comment. Final changes are incorporated and the budget is prepared for distribution. Ninety days before the beginning of the fiscal year (August 1st for HFA, SONYMA, MBBA and TSFC; January 1st for AHC) the proposed budget is posted on the Public Authorities Reporting Information System (“PARIS”) and notification of such posting is delivered to the Authority Budget Office, Chairman of the Assembly Ways and Means Committee, NYS Division of the Budget and the Chairman of the Senate Finance Committee. Thirty days before the September board meetings, the budget is posted on the Agencies’ web site for public inspection. The proposed budget is presented to and approved by the respective Boards at the September Board meetings. In accordance with the State Comptrollers’ regulations, within seven days of the beginning of the fiscal year, the approved budget is to be posted on the Agencies’ web site and in no less than five convenient places for the public to inspect. An approved budget is also sent to the State Comptroller. Every other month, a year to date expenditure report is circulated to unit supervisors, as well as the
4

President of Professional Services and the CFO. The report highlights any expenditures over the budgeted amounts. On a quarterly basis, an information report is prepared for the Boards, updating them on the status of the Agencies’ budget. Cash Budget During May and June the Assistant Treasurer (in the Treasury unit) collects information from various sources and prepares preliminary cash budgets for HFA and MBBA as required by each bond resolution. The cash budget demonstrates to the respective trustees that the Agencies will be able to meet their debt service requirements. Financial Plan In late June to early July the Comptroller collects information from various sources and prepares a financial plan for each Agency. The financial plans do not include information on conduit debt. The financial plans are prepared using the modified accrual basis and are intended to give information to the reader as to whether the Agencies will have excess revenues or a deficit based on a particular year’s projected activities. The financial plan includes a three year projection of revenues and expenses. All budgetary assumptions are reviewed and documented. On a quarterly basis, an information report is prepared for the Boards updating them on the status of each Agency’s Financial Plan.
5

HFA, SONYMA, AHC, MBBA and TSFC
Fiscal Year 2015 Financial Plan and Administrative Budget Time Line 2014 May 1 - 14 CFO/PRES/CEO have preliminary discussions on budget parameters, staffing,
changes to budget categories and changes to departmental structure May 15 - July 17 Preparation of cash budgets by Treasury (HFA and MBBA) [email to MO] May 16 - 23 Update budget software and load April 2014 year-to-date expense data May 19 Issue Staff Allocation memo to Senior Vice Presidents (responses due May 27) May 27 Issue Fiscal 2015 Budget Request memo to Senior Vice Presidents (responses due Jun 13) May 28 Request debt issuance and financing projections from appropriate sources (responses due Jun 20) June 16 CFO/President have preliminary meeting to discuss conceptual overview of 2015
budget and current status of 2014 budget June 16 - July 11 Formulation of financial plans and administrative budgets July 11 Preliminary budget to CFO/PRES for review and comment July 18 CFO/CEO/President meeting for review and comment on draft budget request July 21 - July 31 Production of budget and supporting documentation August 1 Mail proposed Budget to ABO, Assembly Ways & Means, DOB & Senate Finance Committee. Enter budget data on PARIS (to transmit to OSC) August 8 Post proposed FY 2015 Financial Plan and Administrative Budget on website (Legal will post to five other locations) September 3 Transmit Budget to Audit Committee & Board for approval September 9 Present to Audit Committee for Approval September 11 Request Board Approval October 17 Make approved budget available on website (Legal will post to five other locations) December 15 Prepare Final 2014 Budget Analysis for Board Presentation 2015 January 2 Send agenda item to Legal for 2014 budget analysis January 9 Finalize budget data for Board Presentation January 14 Finalize Board memo with 2014 data January 28 Present final 2014 budget vs actual to the Board
6

NEW YORK STATE HOUSING FINANCE AGENCY STATE OF NEW YORK MORTGAGE AGENCY
NEW YORK STATE AFFORDABLE HOUSING CORPORATION STATE OF NEW YORK MUNICIPAL BOND BANK AGENCY
TOBACCO SETTLEMENT FINANCING CORPORATION
Administrative Budget Request
Fiscal Year Ending October 31, 2015
7

NEW YORK STATE HOUSING FINANCE AGENCY
STATE OF NEW YORK MORTGAGE AGENCY NEW YORK STATE AFFORDABLE HOUSING CORPORATION
STATE OF NEW YORK MUNICIPAL BOND BANK AGENCY TOBACCO SETTLEMENT FINANCING CORPORATION
FISCAL YEAR 2015 ADMINISTRATIVE BUDGET REQUEST
The administrative budget is an estimate of the resources needed to administer the New York State Housing Finance Agency (HFA), the State of New York Mortgage Agency (SONYMA), the Affordable Housing Corporation (AHC), the State of New York Municipal Bond Bank Agency (MBBA), and the Tobacco Settlement Financing Corporation (TSFC) (together the “Agencies” or individually the “Agency”). Although a consolidated budget request is presented for approval, all expenses are tracked by Agency.
Expenses that are not directly attributable to a particular Agency are allocated. The allocation of expenses among the Agencies is as follows:
Salaries and benefits are allocated to each Agency based on a “Salary Allocation” table which is updated as employee responsibilities change.
Rent, office supplies and other “common” costs are allocated 50% to HFA and 50% to SONYMA. HFA’s share is further allocated to MBBA and TSFC.
Please refer to the “Expense Allocation” section for more detailed information on allocation of expenses.
Expenses are subdivided into five categories: Personal Services (which includes salaries and benefits) Other Than Personal Services Capital Expenses (which includes leasehold improvements and purchases of furniture,
office equipment and computer hardware) State Assessments and Other Banking, Financing and Servicing Fees
Individual expenses are detailed in each category.
The Agencies process three separate payrolls (HFA, SONYMA and AHC). The number of budgeted positions for the combined Agencies is 221.
8

Please note that this administrative budget does not include expenses or identify revenues pertaining to funds held by depositories or trustees that are restricted by bond resolution. A separate “Program Budget” is prepared by bond indenture, and is submitted to the Board for approval and distributed to the bond trustee in accordance with the requirements of the governing bond resolution. Other operating expenses and revenues are identified in each Agency’s financial plan.
The attached Fiscal Year 2015 Administrative Budget Request (for the period November 1, 2014 to October 31, 2015) totals $56.8 million. This is a $1.103 million increase from the FY 2014 budget. A brief summary by expense category is as follows: 2013 2014 2014 2015 14/15 Budget Actuals Budget Projected Request $ Variance / % (dollars in thousands) Personal Services $22,942 27,802 26,889 28,793 +991/3.56% Other than Personal Services 10,260 10,709 9,519 10,747 +38/0.35% Capital Expenses 442 586 558 738 +152/25.94% State Assessments and Other 15,106 15,225 15,335 15,384 +159/1.04% Banking, Financing & Servicing 1,345 1,384 1,384 1,147 -237/-17.12% TOTALS: $50,095 55,706 53,685 56,809 +1,103/1.98% Discretionary vs Non-Discretionary - 2014 budget request compared to the 2015 budget request: 2014 2015 % Change $ Change (dollars in thousands) Non-Discretionary Spending: $51,836 52,904 2.06% 1,068 Discretionary Spending: $3,870 3,905 0.90% 35 Discretionary Spending In this budget request, discretionary spending represents less than 7% of the Agencies’ projected expenditures.
9

2014 / 2015FY 2014 FY 2015 Variance:
FY 2013 Approved Budget IncreaseActuals Budget Request (Decrease)
Salaries - Regular 14,427$ 17,300 18,190 890 5.14%Salaries - Overtime 62 95 81 (14) -14.74%Temporary / Hourly Employees 239 237 239 2 0.84%Subtotal - Salaries 14,728 17,632 18,510 878 4.98%
Dental Insurance Premiums 320 395 440 45 11.39%Disability Insurance 64 75 83 8 10.67%Transportation Mobility Tax 47 56 63 7 12.50%Education - Contractual 33 51 56 5 9.80%FICA Taxes 1,059 1,267 1,373 106 8.37%Health Insurance Premiums 3,763 4,700 4,990 290 6.17%Miscellaneous 33 38 33 (5) -13.16%Optical Plan 75 92 92 0 0.00%Pension Fund Payments 2,546 3,200 2,845 (355) -11.09%Unemployment Insurance 7 20 20 0 0.00%Vacation Exchange 235 236 248 12 5.08%Workers Compensation 32 40 40 0 0.00%Subtotal - Benefits 8,214 10,170 10,283 113 1.11%
TOTAL PERSONAL SERVICE 22,942 27,802 28,793 991 3.56%
Audit Fees 524 446 440 (6) -1.35%Automobile Expenses 50 51 52 1 1.96%Books and Periodicals 22 37 35 (2) -5.41%Cleaning and Minor Repairs 118 118 123 5 4.24%Communication / Telephone 386 209 212 3 1.44%Consultants 825 1,007 850 (157) -15.59%Courier Service 28 28 25 (3) -10.71%IT Disaster Recovery 92 102 105 3 2.94%E - Services 118 129 149 20 15.50%Education - Agency Directed 38 86 88 2 2.33%Information Technology - Maintenance 576 539 640 101 18.74%Insurance 252 284 298 14 4.93%Legal Expenses 772 895 905 10 1.12%Marketing and Advertising 811 740 740 0 0.00%Membership Fees 30 48 48 0 0.00%Miscellaneous Other Than Personal Services 1 3 3 0 0.00%Office Equipment - Rental and Maintenance 144 129 129 0 0.00%Office Supplies 133 130 110 (20) -15.38%Postage 12 25 21 (4) -16.00%Printing 4 30 30 0 0.00%Rent 5,191 5,368 5,383 15 0.28%Travel Expenses 130 300 355 55 18.33%Workshops & Counseling Fees 3 5 6 1 20.00%
TOTAL OTHER THAN PERSONAL SERVICE 10,260 10,709 10,747 38 0.35%
TOTAL ADMINISTRATIVE EXPENSES 33,202 38,511 39,540 1,029 2.67%
Furniture and Fixtures 52 67 68 1 1.49%Information Technology - Acquisition 387 461 620 159 34.49%Leasehold Improvements 0 18 18 0 0.00%Purchase of Office Equipment 3 40 32 (8) -20.00%
TOTAL CAPITAL EXPENSES 442 586 738 152 25.94%
TOTAL ADMINISTRATIVE AND CAPITAL 33,644 39,097 40,278 1,181 3.02%
Cost Recovery 10,961 10,961 10,961 0 0.00%Department of Civil Service 6 9 7 (2) -22.22%Department of Health Mortgage Servicing 50 25 25 0 0.00%Department of Taxation and Finance 278 275 279 4 1.45%DHCR Mortgage Servicing 3,524 3,703 3,833 130 3.51%State Archives 12 2 4 2 100.00%Funding of Capital Grant Program 275 250 275 25 10.00%
TOTAL STATE ASSESSMENTS & OTHER 15,106 15,225 15,384 159 1.04%
BANKING, FINANCING, SERVICING FEES 1,345 1,384 1,147 (237) -17.12%
GRAND TOTAL 50,095$ 55,706 56,809 1,103 1.98% *
Discretionary 3,499$ 3,870$ 3,905$ 35 0.90%Non-discretionary 46,596$ 51,836 52,904 1,068 2.06%Grand Total 50,095$ 55,706 56,809 1,103 1.98%
* FY 2015 Budget Request does not include costs for IT systems conversion.
Change
HFA / SONYMA / AHC / MBBA / TSFC - FY 2015 Analysis Worksheet(dollars in thousands)
Percent2014 / 2015
10

as of July 31, 2014
EXECUTIVE OFFICEOffice of the President / CEO 2 2 0Internal Audit 7 4 (3)Mortgage Insurance Fund 9 10 1Legal Services 19 17 (2)Office of the SVP / COO 2 3 1
Facilities and Admininistrative Services 7 11 4Information Technology 13 14 1
59 61 2OFFICE OF THE PRESIDENT: Finance and Development
Office of the President 2 3 1Debt Issuance 3 6 3Single Family 34 35 1Multi Family Finance 11 13 2Special Projects 5 4 (1)Loan Servicing Department 6 6 0Development 0 1 1
61 68 7OFFICE OF THE PRESIDENT: Professional Services
Office of the President 4 3 (1)Fair Housing / EEO 4 6 2Intergovernmental 1 1 0Policy 1 2 1Office of the SVP / CFO 2 2 0Accounting 21 20 (1)Treasury 9 7 (2)Office of the SVP / CAO 1 1 0Human Resources 4 5 1Procurement 0 3 3External Communications 7 8 1
54 58 4OFFICE OF THE PRESIDENT: Community Renewal
Affordable Housing 9 9 0Neighborhood Stabilization 2 2 0
11 11 0OFFICE OF THE PRESIDENT: Housing Preservation
Housing Portfolio Management 19 19 0Construction & Environmental Services 4 4 0
23 23 0
TOTAL 208 221 13
VACANCIES 13 0 (13)
TOTAL AUTHORIZED POSITIONS 221 221 0
HFA, SONYMA, AHC, MBBA and TSFCSTAFFING TABLE - FISCAL YEAR 2015
FY 2014 Budgeted Positions
FY 2015 Budget Request
Variance Increase
(Decrease)
(see notes to staffing table)11

HFA, SONYMA, AHC, MBBA and TSFC
STAFFING NOTE
1. The Staffing Table includes all Agency staff, regardless of allocation. The following
schedule shows the breakdown of staff allocation to the various Agencies. 2. The 221 full time equivalent (“FTE”) positions presented in the Staffing Table are
anticipated to be allocated as follows:
FTEs
New York State Housing Finance Agency 111.6
State of New York Mortgage Agency 88.8 Single Family Programs 70.1 Mortgage Insurance Fund (“MIF”) 18.7
New York State Affordable Housing Corporation 16.8
State of New York Municipal Bond Bank Agency 1.9
Tobacco Settlement Financing Corporation 1.9
TOTAL 221.0
12

HFA, SONYMA, AHC, MBBA and TSFC
SIGNIFICANT BUDGET ITEMS
Fiscal Years (“FY”) 2015 and 2014
Personal Service Salaries – Regular FY 2015: $18.19 million
FY 2014: $17.30 million
The FY 2015 budget request will be used to pay current salaries, salaries for the vacancies expected to be filled, the cost of salary increases approved for eligible Management Confidential Staff and the cost of funding a contingency for collective bargaining negotiations.
Benefits Dental Insurance Premiums FY 2015: $440,000
FY 2014: $395,000
The increase in the budget request is due to an anticipated increase in dental insurance premiums, as well as an increase in the number employees participating in the plan.
Health Insurance Premiums FY 2015: $4.99 million
FY 2014: $4.70 million
The Agencies anticipate a 4% increase in health insurance premiums over the FY 2014 budget request amount due to increased premiums as well as an increase in the number of employees participating in the plan. Pension Fund FY 2015: $2.85 million
FY 2014: $3.20 million
The pension fund contribution is based on projections received from the New York State and Local Retirement System (the “System”). In order to reduce pension costs, the Agencies have elected to pay the amount due in full on the “prepay” date, taking advantage of all of the “discounts” offered.
13

Other Than Personal Service
Audit Fees FY 2015: $440,000
FY 2014: $446,000
In June 2010, the Audit Committees and Boards approved a contract with Ernst & Young LLP (with Mitchell & Titus LLP) to perform the Agencies annual financial audits through FY 2015 (FY 2016 for AHC). Additionally, the budget request includes funding for the AHC compliance audits, the NYS Department of Financial Services examination of SONYMA, and HUD single audit requirements relating to federally funded programs. The Agencies anticipate a de minimus change in total FY 2015 audit fees.
Consultants FY 2015: $850,000 FY 2014: $1.007 million
The Agencies are requesting a total of $850,000 (a decrease of $157,000 from the 2014 budget amount) for outside consultants to provide technical assistance in the following areas:
Informational Technology $400,000 Servicing and legal support for the Mitchell Lama Portfolio $250,000 Communications $40,000 Off-site Records Imaging $31,000 SONYMA Advisory Council $24,750 Contingency and other $104,250
Information Technology - Maintenance FY 2015: $640,000
FY 2014: $539,000
General systems maintenance, security software, licensing fees and contingencies are estimated at $354,000. Additionally, maintenance and hosting fees for SONYMA Express are estimated at $282,000. Insurance FY 2015: $298,000
FY 2014: $284,000 The Facilities and Administration Services Unit has requested $298,000 for insurance. The largest portion of insurance cost is attributable to Directors and Officer Liability coverage in the amount of $204,200.
14

Rent FY 2015: $5.38 million FY 2014: $5.37 million
The Agencies lease agreement runs through 2018 for their 641 Lexington Avenue
location in New York City. The requested budget also includes rent for the Buffalo office and rental storage. The budget request covers escalations in excess of the minimum annual rent. Travel Expenses FY 2015: $355,000
FY 2014: $300,000
The travel budget increase is necessitated by a new budget unit requiring a modest travel allocation, as well as an increase in the number of professional staff requiring travel to multiple Agency locations. There is also a small increase in planned off-site training, conferences, and seminars.
Capital Expenses
Information Technology - Acquisition FY 2015: $620,000
FY 2014: $461,000
In order to address its aging IT infrastructure, the Agencies are requesting $550,000 for new PCs, Emphasis system enhancements, a new data storage solution, malware protection software, and other necessary IT upgrades. The Single Family Unit has requested approximately $65,000 for SONYMA Express enhancements and software upgrades to track escrow payments on rehab loans.
State Assessments and Other
DHCR Mortgage Servicing FY 2015: $3.83 million
FY 2014: $3.70 million HFA is billed on a quarterly basis for mortgage serving by DHCR. The FY 2015 budget request is based on actual invoices received through June 2014.
15

HFA, SONYMA, AHC, MBBA and TSFC
REVENUE SOURCES FISCAL 2015 BUDGET
Unrestricted operating revenues from HFA, SONYMA, AHC, MBBA and TSFC support
this administrative budget. Most revenues received by the Agencies are restricted by bond resolution or law. Each Agency contributes to the budget at a level which approximates the actual cost of the resources committed to that Agency. To the extent that AHC or MBBA revenues are insufficient to support their allocated administrative expenses, HFA may need to subsidize their operations. HFA - Revenues available to pay administrative expenses are derived predominantly from ongoing servicing fees (currently approximately $21 million annually), up-front financing fees and earnings on certain investments. In addition, the Agency may receive program administration fees (Neighborhood Stabilization Program). Most of the monies available to pay operating expenses are deposited in the HFA Operating Fund. As of June 30, 2014, cash and investments total $146 million.
SONYMA - Funds to pay administrative expenses are available from the “spread” or difference between what SONYMA collects on its mortgage loans and what it pays on its bonds outstanding used to finance those loans. This excess accumulates in the bond resolution accounts and is transferred to pay expenses when needed and only after passing certain resolution funding tests. In addition, the Agency may receive administration fees from certain programs (Student Loan Program) or be reimbursed for expenses relating to certain programs (Neighborworks Programs). The share of costs allocable to the Mortgage Insurance Fund are funded through mortgage surtax receipts. AHC – AHC currently receives an administration fee of $275,000 annually from the State. Beginning with fiscal 2015, AHC will request $750,000 on an annual basis. This amount is appropriated annually and is subject to change. The administrative fee, together with earnings on investments, goes toward paying AHC’s share of administrative expenses. Any shortfall is taken from accumulated earnings or subsidized by HFA. MBBA – Servicing fees are expected to total approximately $255,000 in fiscal 2015. The fee is based on the amount of bonds outstanding. Any shortfall is taken from available fund balance which includes funds received in fiscal 2014 relating to the recent TSFC refunding. TSFC - In accordance with the Master Servicing Agreement with the State, TSFC’s expenses are reimbursed from the Tobacco Settlement Revenues.
Sources of funds to pay the Fiscal 2015 Administrative Budget expenses are expected to be as follows:
Agency % Share Allocation HFA 57.81 $32,842,000 SONYMA 37.42 21,257,000 AHC 2.13 1,209,000 MBBA .80 457,000 TSFC 1.84 1,044,000
100.00% $56,809,000 16

HFA, SONYMA, AHC, MBBA and TSFC
EXPENSE ALLOCATIONS
There are three basic methodologies for allocating expenses:
Staff Allocation Table: Personal services and attendant benefits are allocated based on an annual survey of staff time devoted to each of the Agencies.
As a result of the survey, it was determined that salaries and benefits would be allocated to each Agency as follows:
Salaries % Allocation of Benefits Cost HFA $ 9,602,000 51.88% SONYMA $ 6,901,000 37.28% AHC $ 1,470,000 7.94% MBBA $ 230,000 1.24% TSFC $ 307,000 1.66%
$ 18,510,000
Common Cost Allocation: Common costs are shared equally between HFA and SONYMA. Common costs include all expense items except personal services (including fringe benefits), consultant fees, membership fees, printing, audit fees, travel expenditures, marketing and advertising, State Assessments, servicing fees, rating agency fees, trustee and paying agent fees and any other expenses which are directly charged to the appropriate Agency.
Expenses allocated to SONYMA are further charged to Single Family (75%) and MIF (25%). Expenses allocated to HFA are further allocated to MBBA, TSFC and individual programs that maintain available fund balances.
Direct Charges: These are costs that are attributable to a specific Agency.
17

FY 2014APPROVED
BUDGETHFA SONYMA AHC MBBA TSFC
COMBINED TOTAL
Salaries - Regular 17,300$ 4,924 3,515 761 118 158 9,476 55%Salaries - Overtime 95 17 26 3 46 48%Temporary / Hourly Employees 237 86 78 3 2 3 172 73%Subtotal - Salaries 17,632 5,027 3,619 767 120 161 9,694 55%Dental Insurance Premiums 395 126 92 19 3 4 244 62%Disability Insurance 75 26 18 4 1 1 50 67%Transportation Mobility Tax 56 17 11 2 1 31 55%Education - Contractual 51 12 8 2 22 43%FICA Taxes 1,267 361 261 56 9 12 699 55%Health Insurance Premiums 4,700 1,607 1,074 260 38 49 3,028 64%Miscellaneous 38 13 10 1 24 63%Optical Plan 92 20 14 4 1 1 40 43%Pension Fund Payments 3,200 1,308 951 200 33 43 2,535 79%Unemployment Insurance 20 4 2 1 7 35%Vacation Exchange 236 132 100 19 3 5 259 110%Workers Compensation 40 9 9 1 19 48%Subtotal - Benefits 10,170 3,635 2,550 569 88 116 6,958 68%
TOTAL PERSONAL SERVICE 27,802 8,662 6,169 1,336 208 277 16,652 60%Audit Fees 446 52 34 13 5 5 109 24%Automobile Expenses 51 16 16 1 33 65%Books and Periodicals 37 9 9 18 49%Cleaning and Minor Repairs 118 39 41 1 1 82 69%Communication / Telephone 209 62 54 1 2 119 57%Consultants 1,007 303 171 23 2 4 503 50%Courier Service 28 5 6 11 39%IT Disaster Recovery 102 30 32 1 1 64 63%E - Services 129 28 34 5 1 1 69 53%Education - Agency Directed 86 9 8 17 20%Information Technology - Maintenance 539 37 363 1 401 74%Insurance 284 109 116 2 4 231 81%Legal Expenses 895 45 53 39 137 15%Marketing and Advertising 740 8 378 386 52%Membership Fees 48 22 24 1 47 98%Misc Other Than Personal Services 3 1 1 33%Office Equipment - Rental & Maintenance 129 34 35 1 1 71 55%Office Supplies 130 23 25 1 49 38%Postage 25 6 5 11 44%Printing 30 1 1 3%Rent 5,368 1,664 1,731 26 55 3,476 65%Travel Expenses 300 61 35 1 4 2 103 34%Workshops 5 0 1 1 20%TOTAL OTHER THAN PS 10,709 2,564 3,171 42 44 119 5,940 55%TOTAL ADMIN EXPENSES 38,511 11,226 9,340 1,378 252 396 22,592 59%Furniture and Fixtures 67 19 19 38 57%Information Technology - Acquisition 461 17 18 1 36 8%Leasehold Improvements 18 0 0%Purchase of Office Equipment 40 2 3 1 6 15%
TOTAL CAPITAL EXPENSES 586 38 40 0 0 2 80 14%
TOTAL ADMIN & CAPITAL 39,097 11,264 9,380 1,378 252 398 22,672 58%Cost Recovery 10,961 6,405 4,556 10,961 100%Department of Civil Service 9 5 5 56%Department of Health Mortgage Servicing 25 6 6 24%Department of Taxation and Finance 275 171 35 206 75%DHCR Mortgage Servicing 3,703 2,749 2,749 74%State Archives 2 0 0 0%Funding of Capital Grant Program 250 250 250 100%
TOTAL STATE ASSESSMENTS & OTHER 15,225 9,586 4,556 35 0 0 14,177 93%
BANKING, FINANCING, SERVICING FEES 1,384 528 59 3 84 674 49%
GRAND TOTAL 55,706$ 21,378 13,995 1,413 255 482 37,523 67%Percent of Overall Expenditures 57.0% 37.3% 3.8% 0.7% 1.3%
*NOTE: As of June 30, 2014 the fiscal 2014 budget year is 67% completed
June 30, 2014 EXPENSE ALLOCATION
HFA, SONYMA, AHC, MBBA and TSFCReport of Actual Administrative Expenses by Agency
(dollars in thousands)
Percent
of Budget Completed*
Fiscal year ending October 31, 2014 (AHC ending March 31, 2015) as of June 30, 2014
18

FY 2014 Actuals Projected Percent
Approved as of Expense to of
Budget June 30, 2014 Oct. 31, 2014 Budget
Salaries - Regular 17,300 9,476 55% 17,300 Salaries - Overtime 95 46 48% 69Temporary / Hourly Employees 237 172 73% 258Subtotal - Salaries 17,632 9,694 55% 17,627 99.97%
Dental Insurance Premiums 395 244 62% 366Disability Insurance 75 50 67% 75Transportation Mobility Tax 56 31 55% 46Education - Contractual 51 22 43% 33FICA Taxes 1,267 699 55% 1,267Health Insurance Premiums 4,700 3,028 64% 4,540Miscellaneous 38 24 63% 36Optical Plan 92 40 43% 60Pension Fund Payments 3,200 2,535 79% 2,542Unemployment Insurance 20 7 35% 10Vacation Exchange 236 259 110% 259Workers Compensation 40 19 48% 28Subtotal - Benefits 10,170 6,958 68% 9,262 91.07%
TOTAL PERSONAL SERVICE ("PS") 27,802 16,652 60% 26,889 96.72%
Audit Fees 446 109 24% 446Automobile Expenses 51 33 65% 49Books and Periodicals 37 18 49% 27Cleaning and Minor Repairs 118 82 69% 123Communication / Telephone 209 119 57% 178Consultants 1,007 503 50% 860Courier Service 28 11 39% 16IT Disaster Recovery 102 64 63% 96E - Services 129 69 53% 103Education - Agency Directed 86 17 20% 25Information Technology - Maintenance 539 401 74% 601Insurance 284 231 81% 264Legal Expenses 895 137 15% 300Marketing and Advertising 740 386 52% 740Membership / Sponsorship Fees 48 47 98% 70Miscellaneous Other Than Personal Services 3 1 33% 1Office Equipment - Rental and Maintenance 129 71 55% 129Office Supplies 130 49 38% 100Postage 25 11 44% 21Printing 30 1 3% 1Rent 5,368 3,476 65% 5,214Travel Expenses 300 103 34% 154Workshops 5 1 20% 1
TOTAL OTHER THAN PS 10,709 5,940 55% 9,519 88.89%
TOTAL OPERATING EXPENSES 38,511 22,592 59% 36,408 94.54%
Furniture and Fixtures 67 38 57% 67Information Technology - Acquisition 461 36 8% 461Leasehold Improvements 18 0 0% 18Purchase of Office Equipment 40 6 15% 12
TOTAL CAPITAL EXPENSES 586 80 14% 558 95.22%
TOTAL OPERATING AND CAPITAL 39,097 22,672 58% 36,966 94.55%
Cost Recovery 10,961 10,961 100% 10,961Department of Civil Service 9 5 56% 5Department of Health Mortgage Servicing 25 6 24% 9Department of Taxation and Finance 275 206 75% 275DHCR Mortgage Servicing 3,703 2,749 74% 3,833State Archives 2 0 0% 2Funding of Capital Grant Program 250 250 100% 250
TOTAL STATE ASSESSMENTS & OTHER 15,225 14,177 93% 15,335 100.72%
BANKING, FINANCING, SERVICING 1,384 674 49% 1,384 100.00%
GRAND TOTAL 55,706 37,523 67% 53,685 96.37%
Completed
HFA, SONYMA, AHC, MBBA and TSFCFISCAL YEAR 2014: ACTUALS (June 30, 2014) & PROJECTED TO YEAR END
(dollars in thousands)
Percent
of Budget
19

FY 2014 FY 2015Approved Budget Projected Projected Projected
Budget Request 2016 2017 2018
Salaries - Regular 17,300 18,190 18,372 18,556 18,741Salaries - Overtime 95 81 79 78 76Temporary / Hourly Employees 237 239 239 239 239Subtotal - Salaries 17,632 18,510 18,690 18,873 19,056Dental Insurance Premiums 395 440 453 467 481Disability Insurance 75 83 83 83 83Transportation Mobility Tax 56 63 64 64 65Education - Contractual 51 56 57 57 58FICA Taxes 1,267 1,373 1,387 1,401 1,415Health Insurance Premiums 4,700 4,990 5,539 6,148 6,824Miscellaneous 38 33 33 33 33Optical Plan 92 92 93 94 95Pension Fund Payments 3,200 2,845 3,016 3,197 3,388Unemployment Insurance 20 20 20 20 21Vacation Exchange 236 248 255 263 271Workers Compensation 40 40 40 40 40Subtotal - Benefits 10,170 10,283 11,040 11,867 12,774
TOTAL PERSONAL SERVICE 27,802 28,793 29,730 30,740 31,830Audit Fees 446 440 440 440 440Automobile Expenses 51 52 53 53 54Books and Periodicals 37 35 35 35 35Cleaning and Minor Repairs 118 123 124 125 127Communication / Telephone 209 212 214 216 218Consultants 1,007 850 680 687 694Courier Service 28 25 25 26 26IT Disaster Recovery 102 105 105 105 105E - Services 129 149 150 152 154Education - Agency Directed 86 88 89 90 91Information Technology - Maintenance 539 640 512 512 512Insurance 284 298 298 298 298Legal Expenses 895 905 724 724 724Marketing and Advertising 740 740 740 740 740Membership Fees 48 48 48 48 48Miscellaneous Other Than Personal Services 3 3 3 3 3Office Equipment - Rental and Maintenance 129 129 129 129 129Office Supplies 130 110 110 110 110Postage 25 21 21 21 21Printing 30 30 30 30 30Rent 5,368 5,383 5,491 5,600 5,712Travel Expenses 300 355 355 355 355Workshops and Counseling Fees 5 6 6 6 6
TOTAL OTHER THAN PERSONAL SERVICE 10,709 10,747 10,382 10,505 10,632TOTAL ADMINISTRATIVE EXPENSES 38,511 39,540 40,112 41,245 42,462Furniture and Fixtures 67 68 65 61 58Information Technology - Acquisition 461 620 620 620 626Leasehold Improvements 18 18 18 18 18Purchase of Office Equipment 40 32 30 31 31
TOTAL CAPITAL EXPENSES 586 738 733 730 733TOTAL ADMINISTRATIVE AND CAPITAL 39,097 40,278 40,845 41,975 43,195Cost Recovery 10,961 10,961 10,961 10,961 10,961Department of Civil Service 9 7 7 7 7Department of Health Mortgage Servicing 25 25 25 25 25Department of Taxation and Finance 275 279 282 285 287DHCR Mortgage Servicing 3,703 3,833 3,833 3,833 3,833State Archives 2 4 4 4 4Funding of Capital Grant Program 250 275 278 281 283
TOTAL STATE ASSESSMENTS & OTHER 15,225 15,384 15,390 15,396 15,400
BANKING, FINANCING, SERVICING FEES 1,384 1,147 1,170 1,193 1,217
GRAND TOTAL 55,706 56,809 57,405 58,564 59,812
BUDGET PERCENTAGE CHANGE PROJECTED 1.98% 1.05% 2.02% 2.13%
HFA, SONYMA, AHC, MBBA and TSFCFISCAL YEAR 2015 ADMINISTRATIVE BUDGET REQUEST and PROJECTION to 2018
(dollars in thousands)
20

The following represents the Agencies' assumptions, based on recent trends and our best estimates, for the projected budgets:
Notes
Salaries - Regular + 1%A 1% increase at the current staffing authorization level, for each of the next 3 years.
Salaries - Overtime - 2% each year for the next 3 yearsTemporary / Hourly Employees no changeDental Insurance Premiums + 3% each year for the next 3 yearsDisability Insurance no changeTransportation Mobility Tax + 1% each year for the next 3 yearsEducation - Contractual + 1% each year for the next 3 yearsFICA Taxes + 1% each year for the next 3 yearsHealth Insurance Premiums + 11% each year for the next 3 yearsMiscellaneous no changeOptical Plan + 1% each year for the next 3 yearsPension Fund Payments + 6% each year for the next 3 yearsUnemployment Insurance + 1% each year for the next 3 yearsVacation Exchange + 3% each year for the next 3 yearsWorkers Compensation no changeAudit Fees no changeAutomobile Expenses + 1% each year for the next 3 yearsBooks and Periodicals no changeCleaning and Minor Repairs + 1% each year for the next 3 yearsCommunication / Telephone + 1% each year for the next 3 years
ConsultantsA 20% decrease for FY 2016, and increase of 1% from the prior year's levels for both FYs 2017 and 2018.
Courier Service + 1% each year for the next 3 yearsDisaster Recovery no changeE - Services + 1% each year for the next 3 yearsEducation - Agency Directed + 1% each year for the next 3 years
Information Technology - MaintenanceA 20% decrease for FY 2016 which will be held flat for FYs 2017 and 2018.
Insurance no change
Legal ExpensesA 20% decrease for FY 2016 which will be held flat for FYs 2017 and 2018.
Marketing and Advertising no changeMembership / Sponsorship Fees no changeMiscellaneous Other Than Personal Services no changeOffice Equipment - Rental and Maintenance no changeOffice Supplies no changePostage no changePrinting no change
Rent + 2%2% is factored in for rent escalators for each of the years projected.
Travel Expenses no changeWorkshops no changeFurniture and Fixtures - 5% each year for the next 3 years
Information Technology - AcquisitionNo change is projected for FY 2016 and 2017, and a 1% increase to the new base in 2018.
Leasehold Improvements no change
Purchase of Office EquipmentA 5% decrease is projected for FY 2016, and spending anticipated to remain at that level for FYs 2017 and 2018.
Cost Recovery no changeDepartment of Civil Service no changeDepartment of Health Mortgage Servicing no changeDepartment of Taxation and Finance + 1% each year for the next 3 yearsDHCR Mortgage Servicing no changeState Archives no changeFunding of Capital Grant Program + 1% each year for the next 3 yearsBanking, Financing and Servicing Fees + 2% each year for the next 3 years
Annual Percentage
Change
HFA, SONYMA, AHC, MBBA and TSFCBUDGET PROJECTION ASSUMPTIONS
for Fiscal Years 2016, 2017 and 2018
21

HFA AHC MBBA TSFC SONYMACOMBINED
TOTAL
Salaries - Regular 7,276 1,179 170 201 5,601 14,427Salaries - Overtime 18 3 1 40 62Temporary / Hourly Employees 136 1 2 2 98 239Subtotal - Salaries 7,430 1,183 172 204 5,739 14,728
Dental Insurance Premiums 158 25 4 4 129 320Disability Insurance 32 5 1 1 25 64Transportation Mobility Tax 24 4 1 18 47Education - Contractual 17 5 11 33FICA Taxes 533 87 12 15 412 1,059Health Insurance Premiums 1,901 310 44 52 1,456 3,763Miscellaneous 16 1 1 15 33Optical Plan 37 6 1 1 30 75Pension Fund Payments 1,292 213 27 37 977 2,546Unemployment Insurance 3 4 7Vacation Exchange 117 19 3 3 93 235Workers Compensation 16 3 13 32Subtotal - Benefits 4,146 678 93 114 3,183 8,214
TOTAL PERSONAL SERVICE 11,576 1,861 265 318 8,922 22,942
Audit Fees (Independent/Compliance Audits) 255 27 23 24 195 524Automobile Expenses 24 1 25 50Books and Periodicals 11 11 22Cleaning and Minor Repairs 56 1 2 59 118Communication / Telephone 191 3 6 186 386Consultants 372 6 14 433 825Courier Service 13 1 14 28Disaster Recovery 43 1 2 46 92E - Services 49 9 1 2 57 118Education - Agency Directed 18 1 19 38Information Technology - Maintenance 70 1 2 503 576Insurance 119 2 5 126 252Legal Expenses 369 277 126 772Marketing and Advertising 13 1 797 811Membership / Sponsorship Fees 15 15 30Misc Other Than Personal Services 1 1Office Equipment - Rental & Maintenance 70 2 2 70 144Office Supplies 63 1 2 67 133Postage 6 6 12Printing 2 1 1 4Rent 2,467 44 95 2,585 5,191Travel Expenses 74 3 2 1 50 130Workshops 0 3 3TOTAL OTHER THAN PS 4,301 39 88 439 5,393 10,260
TOTAL OPERATING EXP 15,877 1,900 353 757 14,315 33,202
Furniture and Fixtures 25 1 26 52Information Technology - Acquisition 184 3 7 193 387Leasehold Improvements 0Purchase of Office Equipment 1 2 3
TOTAL CAPITAL EXPENSES 210 0 3 8 221 442
TOTAL OPERAT & CAPITAL 16,087 1,900 356 765 14,536 33,644
Cost Recovery 6,405 4,556 10,961Department of Civil Service 6 6Department of Health Mortgage Servicing 50 50Department of Taxation and Finance 228 50 278DHCR Mortgage Servicing 3,524 3,524State Archives 4 4 4 12Funding of Capital Grant Program 275 275
TOTAL STATE ASSESSMTS 10,492 50 4 4,560 15,106
BANKING, FINANCING, SERVICING FEES 661 22 18 644 1,345
GRAND TOTAL 27,240 1,950 382 783 19,740 50,095
Percent of Overall Expenditures 54.4% 3.9% 0.8% 1.5% 39.4% 100.0%
HFA, SONYMA, AHC, MBBA and TSFCDetail Report of FY 2012 Administrative Expenses by Agency
November 1, 2012 to October 31, 2013(dollars in thousands)
22
NEW YORK STATE HOUSING FINANCE AGENCY
Financial Plan
Fiscal Year Ending October 31, 2015 with projections for
FY 2016, 2017 and 2018
23
Last Year (Actual) 2013
Current Year (Estimated) 2014
Next Year (Adopted) 2015
Proposed 2016
Proposed 2017
Proposed 2018
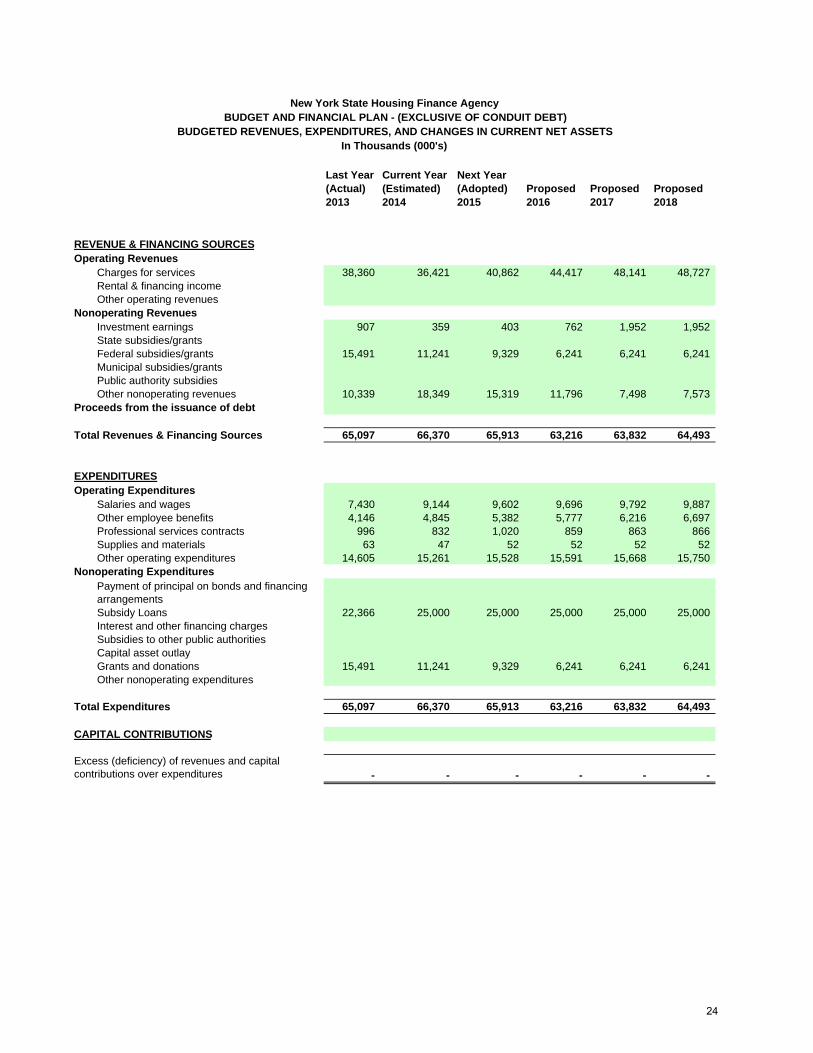
REVENUE & FINANCING SOURCESOperating Revenues
Charges for services 38,360 36,421 40,862 44,417 48,141 48,727 Rental & financing income Other operating revenues
Nonoperating RevenuesInvestment earnings 907 359 403 762 1,952 1,952 State subsidies/grantsFederal subsidies/grants 15,491 11,241 9,329 6,241 6,241 6,241 Municipal subsidies/grantsPublic authority subsidies Other nonoperating revenues 10,339 18,349 15,319 11,796 7,498 7,573
Proceeds from the issuance of debt
Total Revenues & Financing Sources 65,097 66,370 65,913 63,216 63,832 64,493
EXPENDITURES Operating Expenditures
Salaries and wages 7,430 9,144 9,602 9,696 9,792 9,887 Other employee benefits 4,146 4,845 5,382 5,777 6,216 6,697 Professional services contracts 996 832 1,020 859 863 866 Supplies and materials 63 47 52 52 52 52 Other operating expenditures 14,605 15,261 15,528 15,591 15,668 15,750
Nonoperating ExpendituresPayment of principal on bonds and financing arrangementsSubsidy Loans 22,366 25,000 25,000 25,000 25,000 25,000 Interest and other financing chargesSubsidies to other public authoritiesCapital asset outlayGrants and donations 15,491 11,241 9,329 6,241 6,241 6,241 Other nonoperating expenditures
Total Expenditures 65,097 66,370 65,913 63,216 63,832 64,493
CAPITAL CONTRIBUTIONS
Excess (deficiency) of revenues and capital contributions over expenditures - - - - - -
New York State Housing Finance AgencyBUDGET AND FINANCIAL PLAN - (EXCLUSIVE OF CONDUIT DEBT)
BUDGETED REVENUES, EXPENDITURES, AND CHANGES IN CURRENT NET ASSETSIn Thousands (000's)
24

NEW YORK STATE HOUSING FINANCE AGENCY
Budget and Financial Plan Line Explanation
2014 – 2018
HFA is presented as a conduit debt issuer. Therefore, bond issuances and related items are excluded from the Budget and Financial Plan.
Charges for services – Includes monthly servicing fees due from borrowers and anticipated fees projected to be received in connection with mortgage closings over the budgetary period.
Investment earnings – Includes projected earnings only on accounts considered unrestricted. In this case, it reflects projected earnings in the Agency’s Operating Fund. The investments are assumed to earn approximately .11% in 2014, and increase over the period to approximately 1.0% in 2018. Federal subsidies/grants and Grants and donations – Represents Federal Funds estimated to be received and disbursed under the NSP and Section 8 Programs. Other nonoperating revenues – Represents Agency reserves used to fund current operations.
Operating Expenditures – Represents direct costs of the Agency as well as allocated expenses from the overall budget. Such amounts may include fees paid to trustees.
Subsidy Loans – Represents the disbursement of Subsidy loans which is estimated to be $25 million annually throughout the budget period.
25

NEW YORK STATE HOUSING FINANCE AGENCY
Financial Plan Projection
2014 - 2018 For purposes of the Budget and Financial Plan, conduit debt activities are excluded. The Office of the State Comptroller has allowed for the exclusion of conduit debt because conduit debt is not required to be reported by Generally Accepted Accounting Principles (GAAP). This exclusion is in an attempt to provide more useful information about HFA's available operating funds. Budgetary Assumptions:
Projections of future loans in the Agency’s pipeline are used in the calculation of “Charges for services”. Charges for service include certain one-time closing fees and monthly servicing fees to be collected after closing.
This forecast assumes no delays or changes in the Agency's financing plans.
This forecast assumes no changes to the Agency's overall mission.
This forecast assumes markets will be stable and interest rates will rise slightly over the next five years.
Subsidy loans are included in the forecast as an estimation based on the current pipeline and on historical performance. Any significant repayments on subsidy loans are not expected to begin until fiscal year 2021.
Economic conditions could impact the Agency’s financial assumptions.
Forecast assumes that expenses will remain relatively stable during the period. Budgetary Risks:
The Agency will not issue bonds as forecasted. This will result in the Agency not earning the amount of fee income that is projected.
A large number of mortgagors pay their loans in full which will result in a reduction in fee income.
Increase in operating costs outpaces increase in operating income.
26

STATE OF NEW YORK MORTGAGE AGENCY
Financial Plan
Fiscal Year Ending October 31, 2015 with projections for
FY 2016, 2017 and 2018
27

State of New York Mortgage AgencyBUDGET AND FINANCIAL PLAN
BUDGETED REVENUES, EXPENDITURES, AND CHANGES IN CURRENT NET ASSETSIn Thousands (000's)
Last Year (Actual)
2013
Current Year (Estimated)
2014
Next Year (Adopted)
2015Proposed
2016Proposed
2017Proposed
2018
REVENUE & FINANCING SOURCESOperating Revenues
Charges for services 835 1,000 1,000 1,000 1,000 1,000 Rental & financing income 147,891 142,451 135,152 134,075 133,436 132,963 Other operating revenues 14,306 13,000 13,000 13,000 13,000 13,000
Nonoperating RevenuesInvestment earnings 21,813 24,818 28,201 34,500 40,250 46,000 State subsidies/grants - - - - - - Federal subsidies/grants - - - - - - Municipal subsidies/grants - - - - - - Public authority subsidies - - - - - - Other nonoperating revenues 520,143 727,933 385,372 369,064 368,658 373,448
Proceeds from the issuance of debt 424,725 302,920 250,000 250,000 250,000 250,000
Total Revenues & Financing Sources 1,129,713 1,212,122 812,725 801,639 806,344 816,411
EXPENDITURES Operating Expenditures
Salaries and wages 5,739 6,573 6,901 6,968 7,035 7,103 Other employee benefits 3,183 3,382 3,755 4,029 4,327 4,651 Professional services contracts 754 547 776 648 651 653 Supplies and materials 221 51 56 56 56 56 Other operating expenditures 9,843 9,420 9,769 9,710 9,769 9,832
Nonoperating ExpendituresPayment of principal on bonds and financing arrangements 633,885 639,680 285,440 263,005 262,905 264,000 Interest and other financing charges 107,471 102,160 91,264 92,509 90,993 87,967 Subsidies to other public authorities - - - - - - Capital asset outlay-COI - - - - - - Grants and donations - - - - - - Other nonoperating expenditures 371,556 440,900 405,500 406,200 406,800 407,400
Total Expenditures 1,132,652 1,202,713 803,461 783,125 782,536 781,662
CAPITAL CONTRIBUTIONS
Excess (deficiency) of revenues and capital contributions over expenditures (2,939) 9,409 9,264 18,514 23,808 34,749
28

STATE OF NEW YORK MORTGAGE AGENCY
Budget and Financial Plan Line Explanation
2014 - 2018
Charges for services – Includes servicing fees for single family mortgages, single family mortgage commitment fees and fees for administering the Student Loan Program.
Rental & financing income – Represents interest due on the Agency’s single family mortgage loans.
Other operating revenues – Includes mortgage insurance premium and application fees received by the Mortgage Insurance Fund (“MIF”).
Investment earnings – The Agency’s investment portfolio is assumed to earn approximately 1% in 2014 and to increase over the period to approximately 2% by 2018
Other nonoperating revenues – Includes principal payment collections (including estimated prepayments) on mortgage loans relating to the Single Family Program and mortgage recording tax receipts relating to the MIF. In 2014 it also includes Agency reserves used in order to call bonds and to fund MIF transfers as directed by the State.
Proceeds from the issuance of debt – Includes bonds anticipated to be issued for the Single Family Program.
Operating Expenditures – Represents direct costs of the Agency as well as allocated expenses from the overall budget. Such amounts may include fees paid to trustees.
Payments of principal on bonds – This amount includes estimated bonds to be called or redeemed for the Single Family Program along with scheduled maturities.
Interest and other financing charges – This amount includes interest expense for the Single Family Program. Bond issuance expenses are also included on this line.
Other nonoperating expenses – Includes insurance reserves retained, payments made by the MIF to State and its Agencies and single family mortgage purchases.
29
STATE OF NEW YORK MORTGAGE AGENCY
Financial Plan Projection
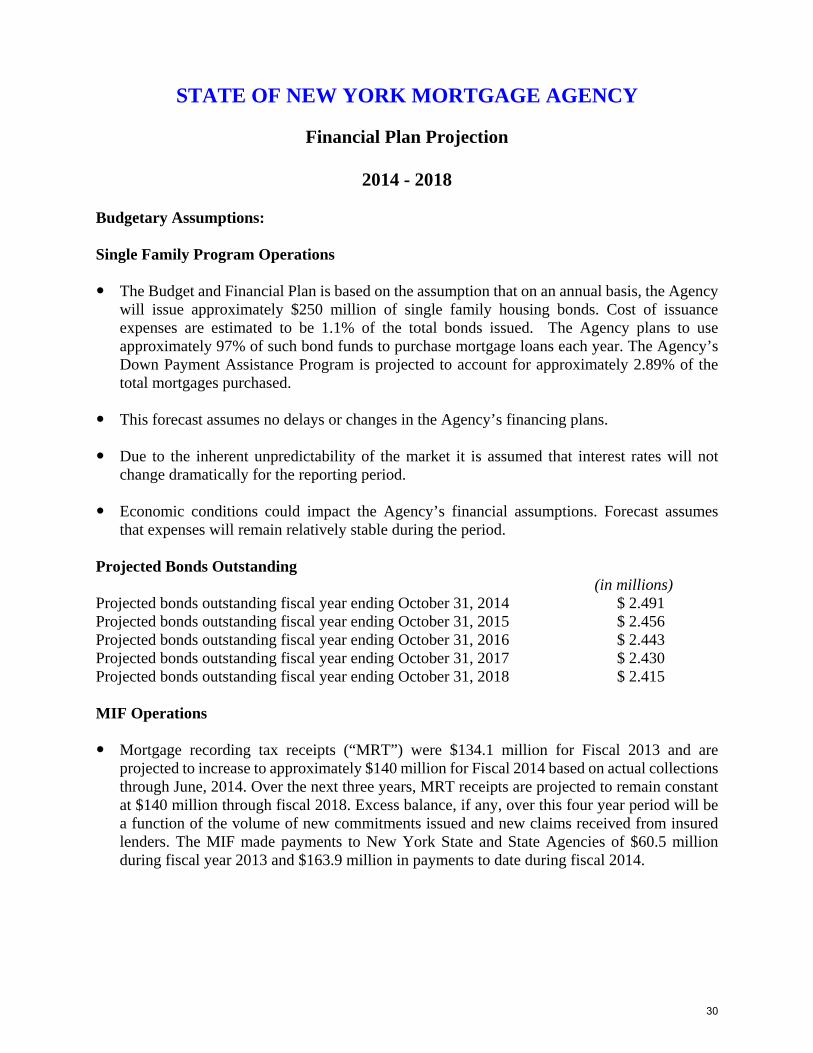
2014 - 2018 Budgetary Assumptions: Single Family Program Operations The Budget and Financial Plan is based on the assumption that on an annual basis, the Agency
will issue approximately $250 million of single family housing bonds. Cost of issuance expenses are estimated to be 1.1% of the total bonds issued. The Agency plans to use approximately 97% of such bond funds to purchase mortgage loans each year. The Agency’s Down Payment Assistance Program is projected to account for approximately 2.89% of the total mortgages purchased.
This forecast assumes no delays or changes in the Agency’s financing plans. Due to the inherent unpredictability of the market it is assumed that interest rates will not change dramatically for the reporting period. Economic conditions could impact the Agency’s financial assumptions. Forecast assumes that expenses will remain relatively stable during the period. Projected Bonds Outstanding (in millions) Projected bonds outstanding fiscal year ending October 31, 2014 $ 2.491 Projected bonds outstanding fiscal year ending October 31, 2015 $ 2.456 Projected bonds outstanding fiscal year ending October 31, 2016 $ 2.443 Projected bonds outstanding fiscal year ending October 31, 2017 $ 2.430 Projected bonds outstanding fiscal year ending October 31, 2018 $ 2.415 MIF Operations Mortgage recording tax receipts (“MRT”) were $134.1 million for Fiscal 2013 and are
projected to increase to approximately $140 million for Fiscal 2014 based on actual collections through June, 2014. Over the next three years, MRT receipts are projected to remain constant at $140 million through fiscal 2018. Excess balance, if any, over this four year period will be a function of the volume of new commitments issued and new claims received from insured lenders. The MIF made payments to New York State and State Agencies of $60.5 million during fiscal year 2013 and $163.9 million in payments to date during fiscal 2014.
30

STATE OF NEW YORK MUNICIPAL BOND BANK AGENCY
Financial Plan
Fiscal Year Ending October 31, 2015 with projections for
FY 2016, 2017 and 2018
31

Last Year (Actual) 2013
Current Year (Estimated) 2014
Next Year (Adopted) 2015
Proposed 2016
Proposed 2017
Proposed 2018
REVENUE & FINANCING SOURCESOperating Revenues
Charges for services 343 299 255 243 218 195 Rental & financing incomeOther operating revenues
Nonoperating RevenuesInvestment earnings - 2 2 2 2 2 State subsidies/grants - 34,000 - - - - Federal subsidies/grantsMunicipal subsidies/grantsPublic authority subsidiesOther nonoperating revenues 39 121 200 225 263 300
Proceeds from the issuance of debt
Total Revenues & Financing Sources 382 34,422 457 470 483 497
EXPENDITURES Operating Expenditures
Salaries and wages 172 218 230 232 234 236 Other employee benefits 93 118 130 140 150 161 Professional services contracts 29 23 23 23 23 23 Supplies and materials - - - - - - Other operating expenditures 88 63 74 75 76 77
Nonoperating ExpendituresPayment of principal on bonds and financing arrangementsInterest and other financing chargesSubsidies to other public authoritiesCapital asset outlayState grants and donations - 34,000 - - - - Other nonoperating expenditures
Total Expenditures 382 34,422 457 470 483 497
CAPITAL CONTRIBUTIONS
Excess (deficiency) of revenues and capital contributions over expenditures - - - - - -
BUDGETED REVENUES, EXPENDITURES, AND CHANGES IN CURRENT NET ASSETS
State of New York Municipal Bond Bank Agency
In Thousands (000's)
BUDGET AND FINANCIAL PLAN - (EXCLUSIVE OF CONDUIT DEBT)
32

STATE OF NEW YORK MUNICIPAL BOND BANK AGENCY
Budget and Financial Plan Line Explanation
2014 – 2018
MBBA is presented as a conduit debt issuer. Therefore, bond issuances and related items are excluded from the Budget and Financial Plan. Charges for services – Includes the semi-annual servicing fees collected from municipalities over the budgetary period. Investment earnings – Earnings on investments held in the MBBA operating funds. State subsidy/grants – Represents funds received from the MIF which have been designated by the State for assistance to municipalities. Other nonoperating revenues – Each year includes a portion of the fee received relating to the December 2013 TSFC refinancing in the amount of $375,000 and other Agency reserves used to fund current operations. Operating Expenditures – Represents direct costs of the Agency as well as allocated expenses from the overall budget. Such amounts may include fees paid to trustees. Grants and donations – Represents the disbursement of funds designated by the State for assistance to municipalities.
33

STATE OF NEW YORK MUNICIPAL BOND BANK AGENCY
Financial Plan Projection
2014 – 2018
The Agency was created to provide municipalities with an alternative mechanism for selling general obligation bonds. Administrative costs (including personnel) of TSFC are paid by MBBA. TSFC reimburses MBBA when funds are available. No bonds have been issued since fiscal 2011 when the Agency issued one series of bonds to purchase local bonds issued by five municipalities in the State to finance or refinance purposes eligible in whole or in part for subsidies under the American Recovery and Reinvestment Act of 2009 (“ARRA”). Budgetary Assumptions: For purposes of the Budget and Financial Plan, conduit debt activities are excluded. The
Office of the State Comptroller has allowed for the exclusion of conduit debt because conduit debt is not required to be reported by Generally Accepted Accounting Principles (GAAP). This exclusion is an attempt to provide more useful information about MBBA's available operating funds.
Fees will decrease each year due to the declining principal balance of the outstanding
bonds. Economic conditions could impact the Agency’s financial assumptions. Forecast assumes
that revenues and expenses will remain relatively stable during the period. Sufficient funds are on deposit in the MBBA operating fund to cover the projected
deficiencies.
34

TOBACCO SETTLEMENT FINANCING CORPORATION
Financial Plan
Fiscal Year Ending October 31, 2015 with projections for
FY 2016, 2017 and 2018
35

Last Year (Actual) 2013
Current Year (Estimated)
2014
Next Year (Adopted)
2015Proposed
2016Proposed
2017Proposed
2018
REVENUE & FINANCING SOURCESOperating Revenues
Charges for servicesRental & financing income 394,908 391,425 402,802 401,182 399,456 399,018 Other operating revenues
Nonoperating RevenuesInvestment earnings 2,896 2,747 2,682 4,399 7,017 6,903 State subsidies/grantsFederal subsidies/grantsMunicipal subsidies/grantsPublic authority subsidiesOther nonoperating revenues 6,923 19,289 50,133 20,580 7,428 -
Proceeds from the issuance of debt
Total Revenues & Financing Sources 404,727 413,461 455,617 426,161 413,901 405,921
EXPENDITURES Operating Expenditures
Salaries and wages 204 293 307 310 313 316 Other employee benefits 114 154 171 183 196 210 Professional services contracts 457 112 285 231 231 231 Supplies and materials 2 2 2 2 2 2 Other operating expenditures 806 291 279 283 288 292
Nonoperating ExpendituresPayment of principal on bonds and financing arrangements 280,120 308,450 367,715 356,730 361,895 371,980 Interest and other financing charges 123,024 103,729 86,408 68,322 50,876 32,840 Subsidies to other public authoritiesCapital asset outlay-COIGrants and donations Other nonoperating expenditures - 430 450 100 100 50
Total Expenditures 404,727 413,461 455,617 426,161 413,901 405,921
CAPITAL CONTRIBUTIONS
Excess (deficiency) of revenues and capital contributions over expenditures - - - - - -
In Thousands (000's)
Tobacco Settlement Financing Corporation (State of New York)BUDGET AND FINANCIAL PLAN
BUDGETED REVENUES, EXPENDITURES, AND CHANGES IN CURRENT NET ASSETS
36
TOBACCO SETTLEMENT FINANCING CORPORATION
Budget and Financial Plan Line Explanation
2014 – 2018
Rental and financing income – Represents pledged revenues expected to be received by the Corporation from the State to be used to pay principal and interest to the bondholders in June and December of the current calendar year and the Corporation’s administrative expenses. Such amounts vary from year to year and are primarily based on tobacco sales. The pledged revenues budgeted for 2014 – 2018 are the amounts presented in the 2013 official statement, except for 2014 where it is the actual amount received in April. When pledged revenues exceed the amount necessary for scheduled principal and interest, the excess is used for the early extinguishment of debt. These bond calls affect the average life of the outstanding bonds. Investment earnings – Earnings on U.S. Treasuries are assumed to earn approximately 0.11% in 2014, and increase over the period to approximately 1.00% by 2018. Other nonoperating revenues – To the extent such funds were eligible to call bonds in June 2014, this represents the receipt of disputed claims and a litigation settlement payment received in fiscal 2014. Non-operating revenues also represent remaining pledged revenue funds on deposit at year end to pay interest in December of the following fiscal year. Operating Expenditures – Represents direct costs of the Corporation as well as allocated expenses from the overall budget. Such amounts may include fees paid to trustees. Nonoperating Expenditures – Include principal and interest paid to bondholders. When excess pledged revenues are received and utilized for the early extinguishment of debt, future interest expense of the Corporation declines. Other nonoperating expenses – Include expenses of the Attorney General’s Office for litigation.
37

TOBACCO SETTLEMENT FINANCING CORPORATION
Financial Plan Projection
2014 – 2018 Background Information Pursuant to the Act and the Purchase and Sale Agreement, the State has sold to the Tobacco Settlement Financing Corporation (“TSFC” or “Corporation”) 100% of the annual payments, strategic contribution payments and lump sum payments payable to the State, pursuant to the Master Settlement Agreement, less certain unsold payments which remain the property of the State. Administrative costs (including personnel) of TSFC are paid by MBBA. TSFC reimburses MBBA when pledged revenues are received. The Corporation does not have any employees. The Corporation receives Settlement Revenues in April of each fiscal year. The amount received along with investment earnings is used to cover scheduled principal payments due bondholders on June 1st, interest due to bondholders on June 1st and December 1st and administrative expenses. Excess funds received over this amount can be used to retire bonds prior to their stated maturities. On December 05, 2013, the Corporation issued Series 2013 Bonds in the amount of $1.225 Billion. The proceeds of the Series 2013 bonds were used to refund certain TSFC bonds and to pay for the costs of issuance expenses. Refunding bonds are not included in the Budget and Financial Plan. Budgetary Assumptions
No new bonds will be issued, however, refunding bonds may be issued. Receipt of additional pledged revenues or other funds received will enable TSFC to call or
retire bonds prior to their stated maturity dates. Settlement Revenues are budgeted at the levels presented in the 2013 official statement.
Budgetary Risks
Receipt of sufficient pledged revenues to meet TSFC’s commitment to bondholders. Projected Bonds Outstanding (without early bond calls) (In millions) Projected bonds outstanding fiscal year ending 10/31/14 $ 1.745 Projected bonds outstanding fiscal year ending 10/31/15 $ 1.377 Projected bonds outstanding fiscal year ending 10/31/16 $ 1.020 Projected bonds outstanding fiscal year ending 10/31/17 $ .659 Projected bonds outstanding fiscal year ending 10/31/18 $ .287
38

NEW YORK STATE AFFORDABLE HOUSING CORPORATION
Financial Plan
Fiscal Year Ending March 31, 2016 with projections for
FY 2017, 2018 and 2019
39

Last Year (Actual) 2014
Current Year (Estimated) 2015
Next Year (Adopted) 2016
Proposed 2017
Proposed 2018
Proposed 2019
REVENUE & FINANCING SOURCESOperating Revenues
Charges for services 275 750 750 750 750 750Rental & financing incomeOther operating revenues
Nonoperating RevenuesInvestment earnings 417 417 459 505 555 611State subsidies/grants 24,725 24,250 24,250 24,250 24,250 24,250Federal subsidies/grantsMunicipal subsidies/grantsPublic authority subsidies Other nonoperating revenues 1,984 1,924 1,867 1,811 1,756 1,704
Proceeds from the issuance of debt
Total Revenues & Financing Sources 27,401 27,341 27,326 27,316 27,311 27,315
EXPENDITURES Operating Expenditures
Salaries and wages 1,393 1,399 1,470 1,484 1,499 1,514Other employee benefits 500 763 845 911 978 1,055Professional services contracts 20 92 91 83 83 84Supplies and materials Other operating expenditures 58 55 61 62 62 63
Nonoperating ExpendituresPayment of principal on bonds and financing arrangementsInterest and other financing chargesSubsidies to other public authoritiesCapital asset outlayState grants and donations 24,146 24,250 24,250 24,250 24,250 24,250Other nonoperating expenditures 1,776 1,900 1,805 1,805 1,715 1,715
Total Expenditures 27,893 28,459 28,522 28,595 28,587 28,681
CAPITAL CONTRIBUTIONS
Excess (deficiency) of revenues and capital contributions over expenditures (492) (1,118) (1,196) (1,279) (1,276) (1,366)
BUDGET AND FINANCIAL PLANBUDGETED REVENUES, EXPENDITURES, AND CHANGES IN CURRENT NET ASSETS
New York State Affordable Housing Corporation
In Thousands (000's)
40

NEW YORK STATE AFFORDABLE HOUSING CORPORATION
Budget and Financial Plan Line Explanation
2015 - 2019
Charges for services - Represents the portion of the Corporation’s annual appropriation projected to be allocated to cover its’ administrative expenses.
Investment earnings - The Corporation invests primarily in municipal securities. The total earnings on investments are projected to remain flat in the current year and rise 10% annually from 2016 to 2019.
State subsidies/grants - New York State funds grant disbursements annually, subject to annual State appropriation. The amount approved by the State for fiscal 2015 is set at the historic amount of $25 million. It is anticipated that this will continue to be the approved amount throughout the period of the Budget and Financial Plan.
Other nonoperating revenues - Repayment funds received, and available for funding “Special Programs” of the Corporation (i.e. Flood, NSP etc.).
Operating Expenditures - Represent administrative expenses of the Corporation.
State grants and donations - Disbursement of New York State funds to grantees.
Other nonoperating expenditures - Disbursement of accumulated repayment funds for use in funding “Special Programs” of the Corporation (i.e. Flood, NSP etc.).
41
NEW YORK STATE AFFORDABLE HOUSING CORPORATION
Financial Plan Projection 2015 - 2019
The New York State Affordable Housing Corporation (the “Corporation”) was created under the provisions of the New York State Private Housing Financing Law. The Corporation was established as a public benefit corporation and is a subsidiary of the New York State Housing Finance Agency (“the Agency”). The Corporation does not have financial accountability to the Agency; accordingly, it is not a component unit of the Agency in accordance with the requirements of Governmental Accounting Standards Board (“GASB”) Statement No. 14, The Financial Reporting Entity and GASB Statement No. 39, Determining Whether Certain Organizations are Component Units. Therefore, the financial activities of the Corporation are not included in the Agency’s financial statements. The Corporation is a component unit of the State of New York and accordingly is included in the State’s financial statements. The Corporation’s fiscal year end date is March 31st. In order to fund its programs, upon approval by the New York State Division of the Budget and the Office of the State Comptroller, the Corporation receives an annual appropriation directly from the State of New York (the “State”). The amount of annual appropriation, recorded as Grant Revenue, has historically been $25 million per year. Budgetary Assumptions Appropriations from the State have historically been $25 million per year and are assumed to
continue to be funded at that level throughout the budget period. The Corporation’s enabling statue includes a provision allowing for administrative expenses to
be covered by a portion of its annual appropriation. Currently, the enacted budget provides for up to 5% of the annual $25 million appropriation to be used for administrative expenses. For fiscal year 2015, the Corporation intends to request $750 thousand from the annual appropriation to cover administrative expenses. The remaining administrative costs will be covered by available investment earnings and administrative funds transferred from HFA.
Economic conditions could impact the Agency’s financial assumptions. The forecast assumes that expenses will remain relatively stable during the period.
Budgetary Risks The Corporation may receive an amount less than $25 million per year in appropriated funds
from the State. The Division of Budget may not allow the Corporation to fund administrative expenses at a
sufficient level to cover it administrative expenses. The Corporation may not receive appropriated funds on a timely basis which may result in an
inability to meet its commitments.
42
NEW YORK STATE HOUSING FINANCE AGENCY
AND STATE OF NEW YORK MUNICIPAL BOND BANK
AGENCY
Preliminary Cash Budgets
Fiscal Year Ending October 31, 2015
These documents can be found at: http://www.nyshcr.org/AboutUs/Investor/InvestorRelations.aspx
43