administrative draft greenhouse gas inventory city of palm
TRANSCRIPT

ADMINISTRATIVE DRAFT Greenhouse Gas Inventory
City of Palm Springs, California
Prepared for:
City of Palm Springs 3200 East Tahquitz Canyon Way
Palm Springs, CA 92262 760-323-8299
Contact: Michele Catherine Mician, MS
Manager, Office of Sustainability
Prepared by: Michael Brandman Associates 340 S. Farrell Drive, Suite A210
Palm Springs, CA 92262
Contact: Frank Coyle, REA Author: Cori Wilson
Project Number: 02270004
October 26, 2010

City of Palm Springs Greenhouse Gas Inventory Table of Contents
Michael Brandman Associates iii
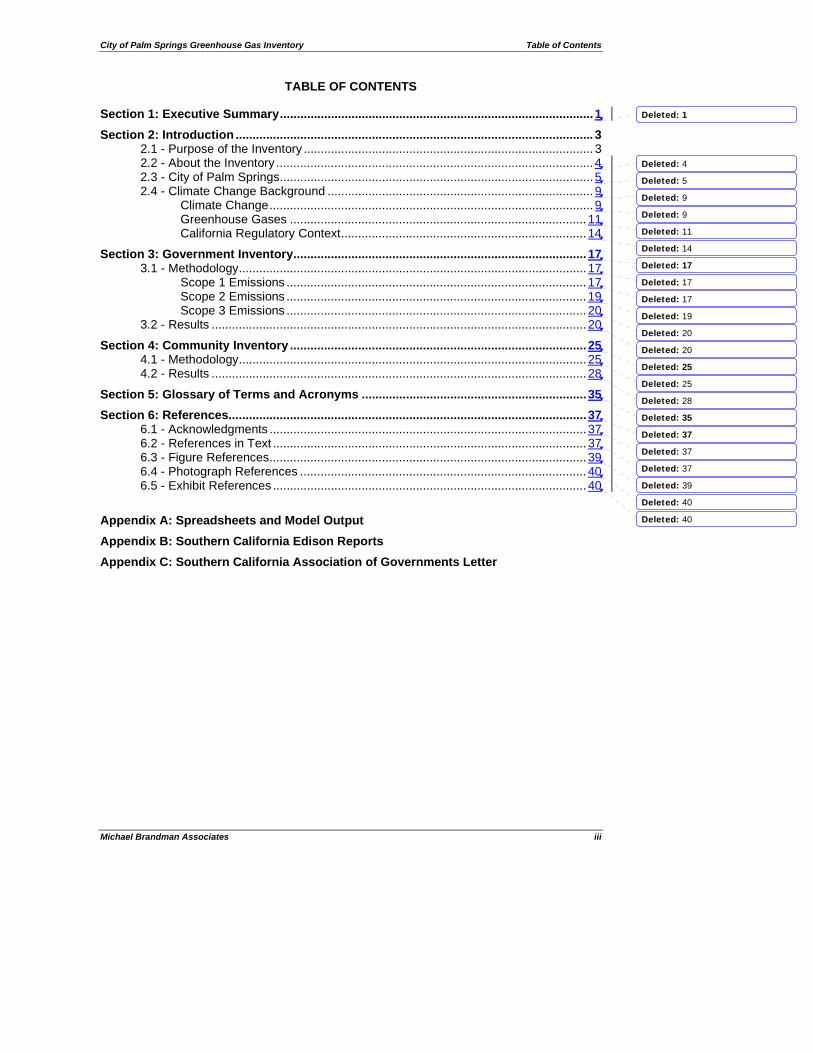
TABLE OF CONTENTS
Section 1: Executive Summary............................................................................................ 1 Section 2: Introduction ......................................................................................................... 3
2.1 - Purpose of the Inventory ..................................................................................... 3 2.2 - About the Inventory ............................................................................................. 4 2.3 - City of Palm Springs............................................................................................5 2.4 - Climate Change Background .............................................................................. 9
Climate Change............................................................................................... 9 Greenhouse Gases ....................................................................................... 11 California Regulatory Context........................................................................ 14
Section 3: Government Inventory...................................................................................... 17 3.1 - Methodology......................................................................................................17
Scope 1 Emissions ........................................................................................ 17 Scope 2 Emissions ........................................................................................ 19 Scope 3 Emissions ........................................................................................ 20
3.2 - Results .............................................................................................................. 20 Section 4: Community Inventory .......................................................................................25
4.1 - Methodology......................................................................................................25 4.2 - Results .............................................................................................................. 28
Section 5: Glossary of Terms and Acronyms ..................................................................35 Section 6: References.........................................................................................................37
6.1 - Acknowledgments ............................................................................................. 37 6.2 - References in Text ............................................................................................ 37 6.3 - Figure References............................................................................................. 39 6.4 - Photograph References .................................................................................... 40 6.5 - Exhibit References ............................................................................................ 40
Appendix A: Spreadsheets and Model Output Appendix B: Southern California Edison Reports Appendix C: Southern California Association of Governments Letter
Deleted: 1
Deleted: 4
Deleted: 5
Deleted: 9
Deleted: 9
Deleted: 11
Deleted: 14
Deleted: 17
Deleted: 17
Deleted: 17
Deleted: 19
Deleted: 20
Deleted: 20
Deleted: 25
Deleted: 25
Deleted: 28
Deleted: 35
Deleted: 37
Deleted: 37
Deleted: 37
Deleted: 39
Deleted: 40
Deleted: 40
Introduction City of Palm Springs Greenhouse Gas Inventory
iv Michael Brandman Associates
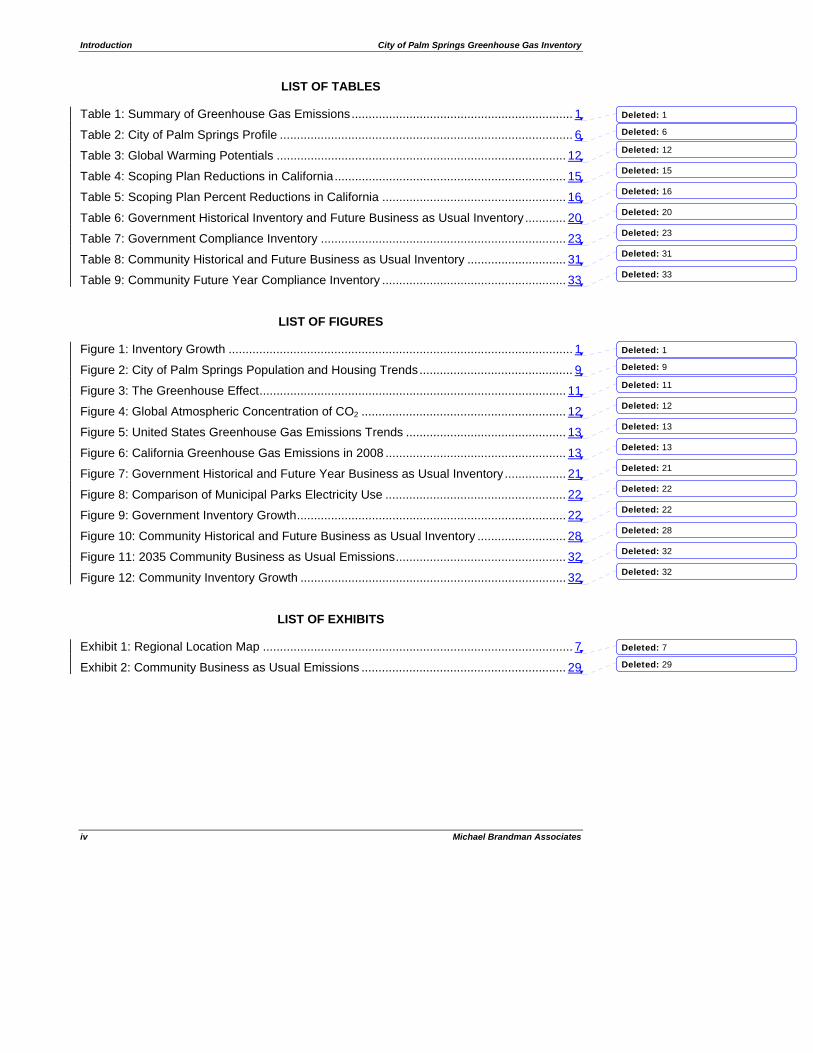
LIST OF TABLES
Table 1: Summary of Greenhouse Gas Emissions................................................................. 1 Table 2: City of Palm Springs Profile ...................................................................................... 6 Table 3: Global Warming Potentials ..................................................................................... 12 Table 4: Scoping Plan Reductions in California.................................................................... 15 Table 5: Scoping Plan Percent Reductions in California ...................................................... 16 Table 6: Government Historical Inventory and Future Business as Usual Inventory ............ 20 Table 7: Government Compliance Inventory ........................................................................ 23 Table 8: Community Historical and Future Business as Usual Inventory ............................. 31 Table 9: Community Future Year Compliance Inventory ...................................................... 33
LIST OF FIGURES
Figure 1: Inventory Growth ..................................................................................................... 1 Figure 2: City of Palm Springs Population and Housing Trends............................................. 9 Figure 3: The Greenhouse Effect.......................................................................................... 11 Figure 4: Global Atmospheric Concentration of CO2 ............................................................ 12 Figure 5: United States Greenhouse Gas Emissions Trends ............................................... 13 Figure 6: California Greenhouse Gas Emissions in 2008 ..................................................... 13 Figure 7: Government Historical and Future Year Business as Usual Inventory .................. 21 Figure 8: Comparison of Municipal Parks Electricity Use ..................................................... 22 Figure 9: Government Inventory Growth............................................................................... 22 Figure 10: Community Historical and Future Business as Usual Inventory .......................... 28 Figure 11: 2035 Community Business as Usual Emissions.................................................. 32 Figure 12: Community Inventory Growth .............................................................................. 32
LIST OF EXHIBITS
Exhibit 1: Regional Location Map ........................................................................................... 7 Exhibit 2: Community Business as Usual Emissions ............................................................ 29
Deleted: 1
Deleted: 6
Deleted: 12
Deleted: 15
Deleted: 16
Deleted: 20
Deleted: 23
Deleted: 31
Deleted: 33
Deleted: 1
Deleted: 9
Deleted: 11
Deleted: 12
Deleted: 13
Deleted: 13
Deleted: 21
Deleted: 22
Deleted: 22
Deleted: 28
Deleted: 32
Deleted: 32
Deleted: 7
Deleted: 29
City of Palm Springs Greenhouse Gas Inventory Executive Summary
Michael Brandman Associates 1
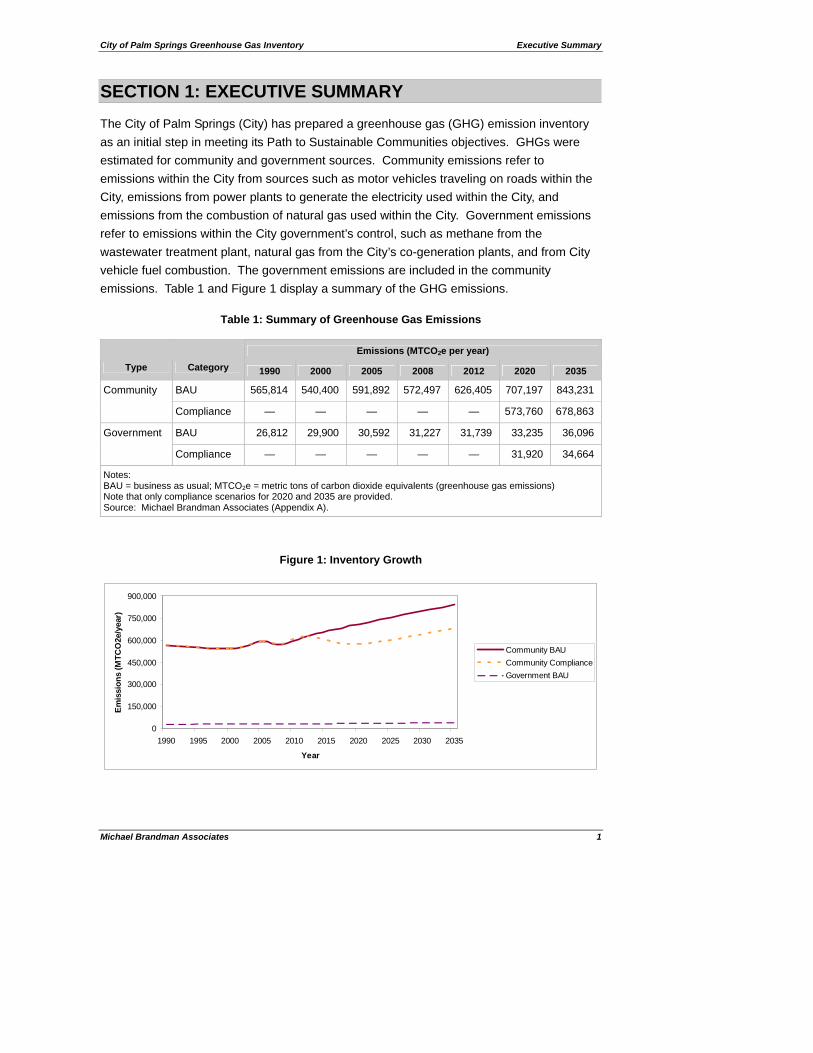
SECTION 1: EXECUTIVE SUMMARY The City of Palm Springs (City) has prepared a greenhouse gas (GHG) emission inventory as an initial step in meeting its Path to Sustainable Communities objectives. GHGs were estimated for community and government sources. Community emissions refer to emissions within the City from sources such as motor vehicles traveling on roads within the City, emissions from power plants to generate the electricity used within the City, and emissions from the combustion of natural gas used within the City. Government emissions refer to emissions within the City government’s control, such as methane from the wastewater treatment plant, natural gas from the City’s co-generation plants, and from City vehicle fuel combustion. The government emissions are included in the community emissions. Table 1 and Figure 1 display a summary of the GHG emissions.
Table 1: Summary of Greenhouse Gas Emissions
Emissions (MTCO2e per year)
Type Category 1990 2000 2005 2008 2012 2020 2035
BAU 565,814 540,400 591,892 572,497 626,405 707,197 843,231 Community
Compliance — — — — — 573,760 678,863
BAU 26,812 29,900 30,592 31,227 31,739 33,235 36,096 Government
Compliance — — — — — 31,920 34,664
Notes: BAU = business as usual; MTCO2e = metric tons of carbon dioxide equivalents (greenhouse gas emissions) Note that only compliance scenarios for 2020 and 2035 are provided. Source: Michael Brandman Associates (Appendix A).
Figure 1: Inventory Growth
0
150,000
300,000
450,000
600,000
750,000
900,000
1990 1995 2000 2005 2010 2015 2020 2025 2030 2035
Year
Emis
sion
s (M
TCO
2e/y
ear)
Community BAUCommunity ComplianceGovernment BAU


City of Palm Springs Greenhouse Gas Inventory Introduction
Michael Brandman Associates 3
SECTION 2: INTRODUCTION
2.1 - Purpose of the Inventory
This inventory serves the following purposes:
It identifies sectors that would provide the greatest opportunity for reductions.
In the future, the City may prepare a Climate Action Plan; the greenhouse gas (GHG) inventory would be part of that Climate Action Plan. Climate Action Plans typically contain reduction targets and describe how strategies and policies within the Climate Action Plan will meet the reduction target.
This inventory fulfills Objective 1.1 in the Palm Springs Path to a Sustainable Community, a document prepared by the City in 2009. A summary of the vision of the document as well as the three climate change objectives is presented below.
Palm Trees in the City of Palm Springs
The Palm Springs Path to a Sustainable CommunityMarch 25, 2009
Vision
Palm Springs is a thriving community that maximizes its renewable resources and conserves and restores its limited resources, so that residents can be assured of a future that is economically viable and in balance with the local environment.
Palm Springs aspires to be a place where:
• Citizens are engaged and share a vision of a sustainable future. • Businesses support clean technology, the production of renewable energy and the internationally
renowned eco-destination thrives. • Children learn that sustainability is the local culture early, and this learning continues throughout life. • Water and materials are recycled and reused. • Homes, businesses and neighborhoods are built to high green building standards. • Local businesses are supported and new ideas flourish.
Climate Change
Goal: Palm Springs is carbon neutral.
Objective 1: Establish a baseline inventory and forecast, ongoing tracking and reporting mechanism for GHG emissions.
1. Develop a comprehensive GHG emissions inventory for City government and the City of Palm Springs geographic area in partnership with other area governments.
2. Annually inventory and report GHG emissions so that reductions can be tracked in a transparent, consistent and accurate manner.

Introduction City of Palm Springs Greenhouse Gas Inventory
4 Michael Brandman Associates
2.2 - About the Inventory
The City of Palm Springs GHG inventory contains GHG emissions from the municipal government and the community. Emissions are reported as a quantity over time, such as in tons per year. This inventory does not report concentrations of pollutants in the air, which is a measure of the total amount of a pollutant, typically measured in parts per million, parts per billion, or micrograms per cubic meter (µg/m3) of air.
This inventory only estimates GHGs and does not contain an estimate of criteria air pollutants (ozone, particulate matter, carbon monoxide, nitrogen dioxide, sulfur dioxide, and lead), nor does it contain an inventory of toxic air pollutants (diesel particulate matter, benzene, etc.).
The inventory incorporates two entities: the community and the municipal government. The community emissions refer to emissions within the City, such as emissions from motor vehicle use and from generating electricity to power buildings within the City. The municipal government inventory consists of emissions within the control of the government, such as electricity to power City Hall and City fleet vehicle emissions.
The inventory estimates emissions for the years 1990, 2000, 2005, and 2008. The year 1990 was selected to be consistent with Climate Change Objective 2 in the Palm Springs Path to a Sustainable Community. The year 2000 was selected because data was available. The year 2005 was selected because it was prior to the adoption of Assembly Bill (AB) 32;
Objective 2: Develop strategies to reduce contributions to GHG emissions to 1990 levels by 2020 and carbon neutrality by 2030.
1. Develop a local climate change action plan to reduce GHGs for Palm Springs. 2. Retrofit and install Light-Emitting Diode (LED) energy efficient lighting in all of the City’s traffic
lights. 3. Improve city-wide traffic signalization, including permission left turn lanes. 4. Lead a valley-wide effort to improve traffic signalization and incorporate permission left turn lanes
throughout the Coachella Valley. 5. Review current zoning and building codes to minimize the impact of GHG. 6. Participate in the development and implementation of regional strategies to meet the requirements
of AB 32. 7. Establish incentives and disincentives to reduce production of GHGs by sectors in the City (such
as energy production, transportation and real estate residential, commercial, and industrial). 8. Participate in a regional carbon offset program, carbon trading or “cap and trade” system to capture
funding for local/regional actions to reduce contributions to GHGs.
Objective 3: Pursue energy efficient transportation options that reduce GHG emissions.
1. Reduce employee vehicle miles traveled in city vehicles by promoting teleconferences and the availability of alternative transportation options for business and trips.
2. Encourage telecommuting and flexible hours policies to avoid at least one commuting day per month per employee (average).
3. Work with the building industry to reduce vehicle trips to and from construction sites.

City of Palm Springs Greenhouse Gas Inventory Introduction
Michael Brandman Associates 5
thus, reductions from regulations pertaining to AB 32 are not shown. Year 2008 was selected because it is the most recent year for which data is available.
Emissions for 2012, 2020, and 2035 were projected for two scenarios: compliance and business as usual. The compliance scenario incorporates planned regulations that will go into effect by 2012 and 2020, such as the Pavley regulations, which will reduce emissions from new motor vehicles. Business as usual refers to the emissions that do not take into account regulations or any measures of which the City is planning to reduce emissions.
GHG inventories consider a wide range of human activities. Estimating the amount of GHGs generated by these activities requires using a multiplicity of data sources and a diverse set of methodologies. Emission inventories are by nature the reflection of the best available data and the most applicable methods at the time of their compilation. As data grows and understanding develops, the inventories can be updated and improved. Emissions calculated for this inventory reflect current best estimates; in some cases, however, estimates are based on assumptions and incomplete data. Therefore, this inventory contains uncertainties.
Emissions inventories are organized by source categories or sectors. The State of California organizes its emission inventory by the following sectors:
Agriculture High global warming potential gases
Commercial and residential Recycling and waste
Electricity Transportation
Industry
This inventory provides emission estimates for all of the sectors except for agriculture and industry. Palm Springs has limited agriculture and industrial sources, and the emissions from energy use (electricity and natural gas) from industrial sources are included in the commercial sector.
2.3 - City of Palm Springs
The City lies within the Coachella Valley desert region at the base of the San Jacinto and Santa Rosa Mountains, approximately 60 miles east of Riverside. The expansive desert terrain contributes to the City’s warm climate; the mountains provide a dramatic visual
Palm Springs and the San Jacinto Mountains

Introduction City of Palm Springs Greenhouse Gas Inventory
6 Michael Brandman Associates
backdrop and shelter from the winds. Its proximity to metropolitan Los Angeles, Orange, and San Diego counties, combined with the City’s superior physical setting, is a primary reason that Palm Springs has become a popular resort destination.
The City’s incorporated area encompasses 60,440 acres, or 95 square miles; the City’s sphere of influence comprises another 27,160 acres, or 42 square miles. Primary access to the City is provided by Interstate 10 and Highway 111; north–south access to the City is provided via Indian Canyon Drive and Gene Autry Trail (Exhibit 1).
As recommended in the Local Government Operations Protocol, Table 2 presents a profile summary for the City of Palm Springs.
Table 2: City of Palm Springs Profile
Item Data
Jurisdiction name City of Palm Springs
Street address (for City Hall) 3200 East Tahquitz Canyon Way
City, State, Zip Palm Springs, California 92262
County Riverside
Website http://ci.palm-springs.ca.us/
Size 95 square miles
Population1 2009: 47,601
Annual budget2 Total 2010-2011: $146,473,415
Employees (full time equivalent) 2010: 390
Climate zone3 15
Annual heating degree days4 Base 65: 1000; Base 60: 475
Annual cooling degree days4 Base 55: 6715; Base 60: 5196
Contact person Phone Email
Michele Catherine Mician, MS 760-323-8214 [email protected]
Services provided Water treatment and distribution, wastewater treatment and collection, fire protection, police, solid waste collection, airport, street lighting and traffic signals, Angel Stadium, convention center
Sources: 1 Department of Finance, 2009. 2 Palm Springs Resolution No. 22714. 3 California Energy Commission, 2010. 4 Western Regional Climate Center, 2006.

City of Palm Springs Greenhouse Gas Inventory Introduction
Michael Brandman Associates 7
Exhibit 1: Regional Location Map

City of Palm Springs Greenhouse Gas Inventory Introduction
Michael Brandman Associates 9
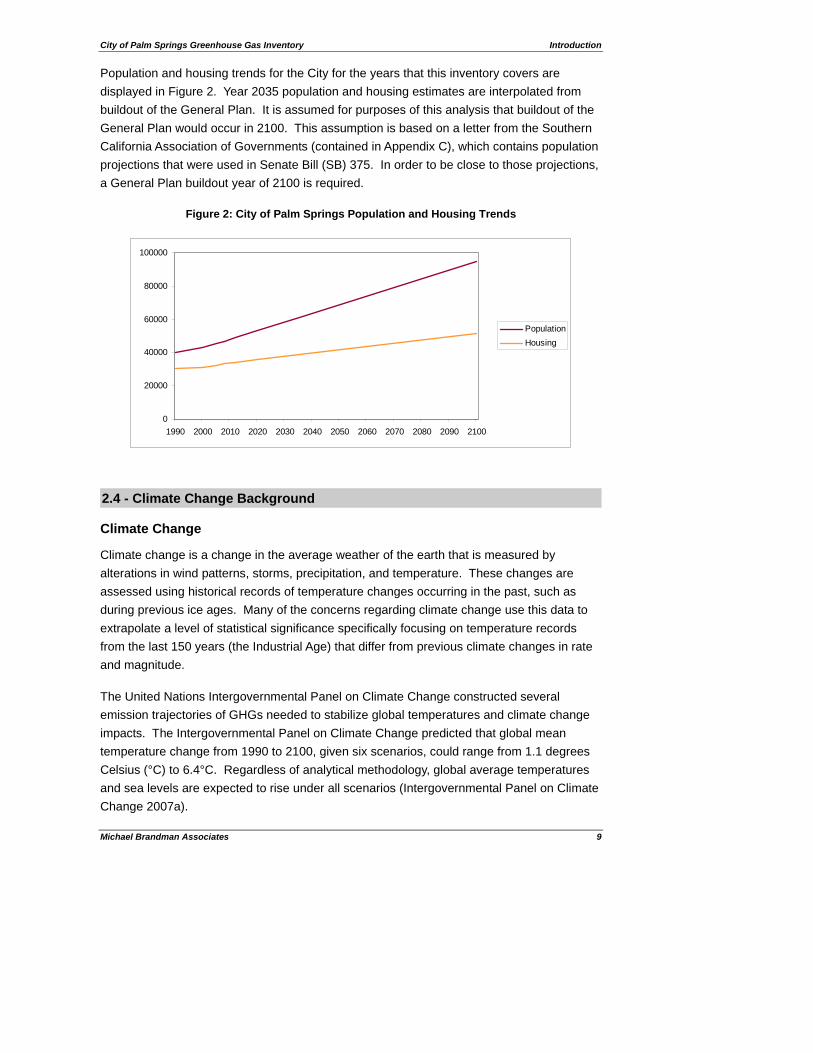
Population and housing trends for the City for the years that this inventory covers are displayed in Figure 2. Year 2035 population and housing estimates are interpolated from buildout of the General Plan. It is assumed for purposes of this analysis that buildout of the General Plan would occur in 2100. This assumption is based on a letter from the Southern California Association of Governments (contained in Appendix C), which contains population projections that were used in Senate Bill (SB) 375. In order to be close to those projections, a General Plan buildout year of 2100 is required.
Figure 2: City of Palm Springs Population and Housing Trends
0
20000
40000
60000
80000
100000
1990 2000 2010 2020 2030 2040 2050 2060 2070 2080 2090 2100
PopulationHousing
2.4 - Climate Change Background
Climate Change
Climate change is a change in the average weather of the earth that is measured by alterations in wind patterns, storms, precipitation, and temperature. These changes are assessed using historical records of temperature changes occurring in the past, such as during previous ice ages. Many of the concerns regarding climate change use this data to extrapolate a level of statistical significance specifically focusing on temperature records from the last 150 years (the Industrial Age) that differ from previous climate changes in rate and magnitude.
The United Nations Intergovernmental Panel on Climate Change constructed several emission trajectories of GHGs needed to stabilize global temperatures and climate change impacts. The Intergovernmental Panel on Climate Change predicted that global mean temperature change from 1990 to 2100, given six scenarios, could range from 1.1 degrees Celsius (°C) to 6.4°C. Regardless of analytical methodology, global average temperatures and sea levels are expected to rise under all scenarios (Intergovernmental Panel on Climate Change 2007a).
Introduction City of Palm Springs Greenhouse Gas Inventory
10 Michael Brandman Associates
Climate Change Consequences In California, climate change may result in consequences such as the following:
A reduction in the quality and supply of water to the State from the Sierra snowpack. If heat-trapping emissions continue unabated, more precipitation will fall as rain instead of snow, and the snow that does fall will melt earlier, reducing the Sierra Nevada spring snowpack by as much as 70 to 90 percent. This can lead to challenges in securing adequate water supplies. It can also lead to a potential reduction in hydropower.
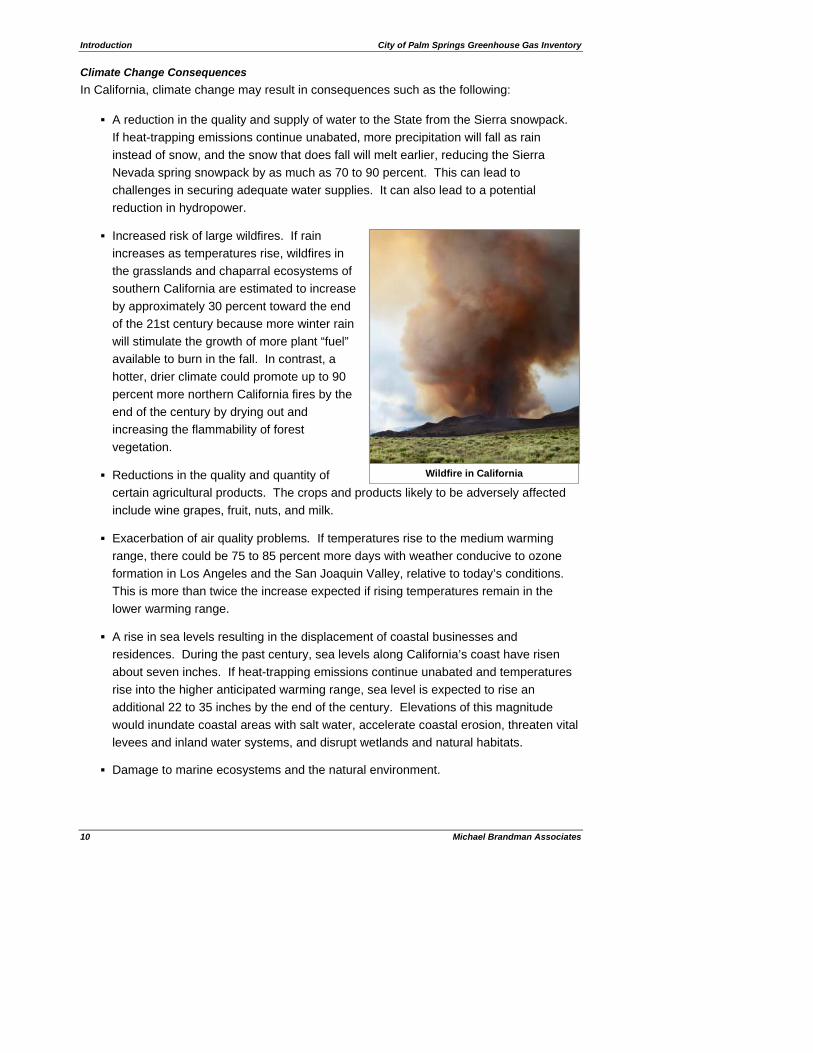
Increased risk of large wildfires. If rain increases as temperatures rise, wildfires in the grasslands and chaparral ecosystems of southern California are estimated to increase by approximately 30 percent toward the end of the 21st century because more winter rain will stimulate the growth of more plant “fuel” available to burn in the fall. In contrast, a hotter, drier climate could promote up to 90 percent more northern California fires by the end of the century by drying out and increasing the flammability of forest vegetation.
Reductions in the quality and quantity of certain agricultural products. The crops and products likely to be adversely affected include wine grapes, fruit, nuts, and milk.
Exacerbation of air quality problems. If temperatures rise to the medium warming range, there could be 75 to 85 percent more days with weather conducive to ozone formation in Los Angeles and the San Joaquin Valley, relative to today’s conditions. This is more than twice the increase expected if rising temperatures remain in the lower warming range.
A rise in sea levels resulting in the displacement of coastal businesses and residences. During the past century, sea levels along California’s coast have risen about seven inches. If heat-trapping emissions continue unabated and temperatures rise into the higher anticipated warming range, sea level is expected to rise an additional 22 to 35 inches by the end of the century. Elevations of this magnitude would inundate coastal areas with salt water, accelerate coastal erosion, threaten vital levees and inland water systems, and disrupt wetlands and natural habitats.
Damage to marine ecosystems and the natural environment.
Wildfire in California

City of Palm Springs Greenhouse Gas Inventory Introduction
Michael Brandman Associates 11
An increase in infections, disease, asthma, and other health-related problems.
A decrease in the health and productivity of California’s forests. 1
Greenhouse Gases
Gases that trap heat in the atmosphere are referred to as GHGs. The effect is analogous to the way a greenhouse retains heat. As shown in Figure 3, the energy influx is maintained by three main factors: the amount of energy coming in, which depends on the earth’s distance from the sun and solar activity; the albedo (the ability of the earth’s surface to reflect light); and the chemical composition of the atmosphere. The presence of GHGs in the atmosphere regulates the earth’s temperature. Without the natural heat trapping effect of GHGs, the earth’s surface would be about 34°C cooler.
Figure 3: The Greenhouse Effect
1 California Climate Change Center, 2006; Moser et al. 2009.
Deleted: Figure 3

Introduction City of Palm Springs Greenhouse Gas Inventory
12 Michael Brandman Associates
The chemical composition of the atmosphere changes over time. Natural processes and human activities emit GHGs. As shown in Figure 4, carbon dioxide concentrations in the atmosphere have steadily increased over time. The global atmospheric concentration of carbon dioxide (CO2) data in Figure 4 prior to 1958 are from ice core measurements, and post-1958 data are from the Mauna Loa measurement site in Hawaii.
Figure 4: Global Atmospheric Concentration of CO2
GHGs have varying global warming potential and atmospheric lifetimes. Carbon dioxide, the reference gas for global warming potential, has a global warming potential of 1. The calculation of the carbon dioxide equivalent (CO2e) is a consistent methodology for comparing GHG emissions, since it normalizes various GHG emissions to a consistent metric. Methane’s warming potential of 21 indicates that methane has a 21 times greater warming affect than carbon dioxide on a molecule per molecule basis. A carbon dioxide equivalent is the mass emissions of an individual GHG multiplied by its global warming potential. Emissions are typically shown in metric tons of carbon dioxide equivalents (MTCO2e) or a million times that, million metric tons of carbon dioxide equivalents (MMTCO2e). Global warming potentials used in this inventory are shown in Table 3.
Table 3: Global Warming Potentials
Greenhouse Gas Global Warming Potential
Carbon dioxide (CO2) 1
Methane (CH4) 21
Nitrous oxide (N2O) 310
Source: Intergovernmental Panel on Climate Change 2007a.

City of Palm Springs Greenhouse Gas Inventory Introduction
Michael Brandman Associates 13
Emissions worldwide were approximately 49,000 MMTCO2e in 2004 (Intergovernmental Panel on Climate Change, 2007b). As shown in Figure 5, emissions in the United States in 2008 were approximately 6,957 MMTCO2e (1 teragram (Tg) is equal to 1 MMT). Carbon dioxide is the main contributor to GHG emissions in the United States (water vapor is also a contributor but is not regulated). As shown in Figure 6, GHG emissions in California in 2008 were approximately 477.7 MMTCO2e, which is 6.8 percent of the United States inventory.
Figure 5: United States Greenhouse Gas Emissions Trends
Figure 6: California Greenhouse Gas Emissions in 2008

Introduction City of Palm Springs Greenhouse Gas Inventory
14 Michael Brandman Associates
California Regulatory Context
California has adopted a variety of regulations aimed at reducing the State’s GHG emissions. While state actions alone cannot stop climate change, the adoption and implementation of this legislation demonstrates California’s leadership in addressing this challenge. Key legislation pertaining to the State’s reduction targets are described below.
Executive Order S-3-05. California Governor Arnold Schwarzenegger announced on June 1, 2005, through Executive Order S 3-05, the following reduction targets for GHG emissions:
By 2010, reduce GHG emissions to 2000 levels;
By 2020, reduce GHG emissions to 1990 levels; and
By 2050, reduce GHG emissions to 80 percent below 1990 levels.
Executive Order S-13-08 directs the Governor’s Office of Planning and Research, in cooperation with the California Resources Agency, to provide land use planning guidance related to sea level rise and other climate change impacts. The order also directs the California Resources Agency to develop a State Climate Adaptation Strategy and to convene an independent panel to complete the first California Sea Level Rise Assessment Report.
Senate Bill (SB) 375. SB 375 aligns regional transportation planning efforts, regional GHG reduction targets, and affordable housing allocations. Metropolitan Planning Organizations are required to adopt a Sustainable Communities Strategy, which allocates land uses in the Metropolitan Planning Organization’s Regional Transportation Plan. Qualified projects consistent with an approved Sustainable Communities Strategy or Alternative Planning Strategy and categorized as “transit priority projects” would receive incentives under new provisions of CEQA.
AB 32. The California State Legislature enacted AB 32, the California Global Warming Solutions Act of 2006. AB 32 requires that GHGs emitted in California be reduced to 1990 levels by the year 2020. GHGs as defined under AB 32 include carbon dioxide, methane, nitrous oxide, hydrofluorocarbons, perfluorocarbons, and sulfur hexafluoride. The California Air Resources Board (ARB) is the state agency charged with monitoring and regulating sources of GHGs.
Wind Turbines in Palm Springs

City of Palm Springs Greenhouse Gas Inventory Introduction
Michael Brandman Associates 15
The ARB approved the Climate Change Scoping Plan in December 2008 (California Air Resources Board, 2008). The Scoping Plan contains measures designed to reduce the State’s emissions to 1990 levels by the year 2020. Local governments must achieve reductions through land use measures that will be substantially dependent on the General Plan for success. Statewide, the ARB expects to target local governments with reducing GHG emissions by 5 MMTCO2e by 2020.
Scoping Plan Reductions The Scoping Plan contains a variety of measures, some of which would not directly reduce emissions in Palm Springs. The measures that could reduce emissions in Palm Springs are presented in Table 4.
Table 4: Scoping Plan Reductions in California
Category Scoping Plan Measure Reductions in 2020
(MMTCO2e)
Pavley (AB 1493) 27.7
Tire Pressure Program 0.74
Low Carbon Fuel Standard 16
Advanced Clean Cars 5.1
Tire Tread Program 0.3
On-road motor vehicles: passenger vehicles
Subtotal 49.84
On-road motor vehicles: heavy duty trucks
Heavy-duty vehicle (Aerodynamic efficiency) 0.93
Limit High GWP Use in Consumer Products 0.23
High-GWP Refrigerant Management Program for Stationary Sources
8
Alternative Suppressants in Fire Protection Systems
0.1
Mitigation Fee on High GWP Gases 5
Stationary Equipment Refrigerant Management Program – Specifications for Commercial and Industrial Refrigeration
4
Ozone-depleting substance substitutes
Subtotal 17.33
Waste Landfill Methane Control Measure 1.5
Renewable Electricity Standard 13.4
Renewables Portfolio Standards 7.9
Electricity
Subtotal 21.3
Notes: MMTCO2e = million metric tons of carbon dioxide equivalents; GWP = global warming potential Source: California Air Resources Board, 2010.

Introduction City of Palm Springs Greenhouse Gas Inventory
16 Michael Brandman Associates
The percent reductions from the measures shown in Table 4 are shown in Table 5. The reductions apply to the California inventory, but similar rates of reduction are expected to occur in Palm Springs. The business as usual emissions for the State’s forecast of 2020 emissions is forecast from 3-year average emissions for 2002–2004. The project’s business as usual forecast was based on emission factors and values for 2005 and 2008; therefore, reductions are applicable to project emissions.
In 2006 and 2008, Southern California Edison delivered approximately 16 percent of power generated by renewable energy (Southern California Edison, 2006 and 2010). The Renewables Portfolio Standards and the Renewable Electricity Standard require a 33-percent renewable energy mix as an average statewide. If Southern California Edison were to increase its renewable energy mix to 33 percent by 2020, it would need to increase it by 17 percent. Therefore, a 15-percent reduction from electricity is a reasonable assumption.
The percent reductions shown in Table 5 are applied to the business as usual emissions to result in the “compliance” emission scenario. Some measures will be implemented before 2020; however, no reductions from these measures are taken for 2012 emissions because emission reduction data is not available.
Table 5: Scoping Plan Percent Reductions in California
Category
Emissions in 2020
(MMTCO2e)
Reductions in 2020
(MMTCO2e) Percent
Reduction (%)
On-road motor vehicles: passenger vehicles 160.8 49.84 31
On-road motor vehicles: heavy duty trucks 48.3 0.93 2
Ozone-depleting substance substitutes 45.0 17.33 39
Waste 7.7 1.5 19
Electricity (California average) 139.2 21.3 15
Notes: MMTCO2e = million metric tons of carbon dioxide equivalents; NA = not available Sources: Emissions in 2020: California Air Resources Board, 2008. Reductions in 2020: Table 4
City of Palm Springs Greenhouse Gas Inventory Government Inventory
Michael Brandman Associates 17
SECTION 3: GOVERNMENT INVENTORY
3.1 - Methodology
The methodology for the government inventory follows the Local Government Operations Protocol (Protocol) (California Air Resources Board, et al. 2010). The emissions are reported are those within operational control of the City. The City has operational control over an operation if the City has the full authority to introduce and implement its operating policies at the source. Operating policies can include operational, health, safety, and environmental policies.
The Protocol divides GHG emissions into scopes. This inventory will include the following emission categories:
Scope 1: All direct GHG emissions
Scope 2: Indirect GHG emissions associated with the consumption of purchased or acquired electricity, steam, heating, or cooling
Scope 3: Although these emissions are optional, emissions associated with employee commute and business travel are reported.
Estimates of emissions for the “forecast” years, or years 2012, 2020, and 2035 were based on various criteria such as population growth and other factors described below.
Scope 1 Emissions
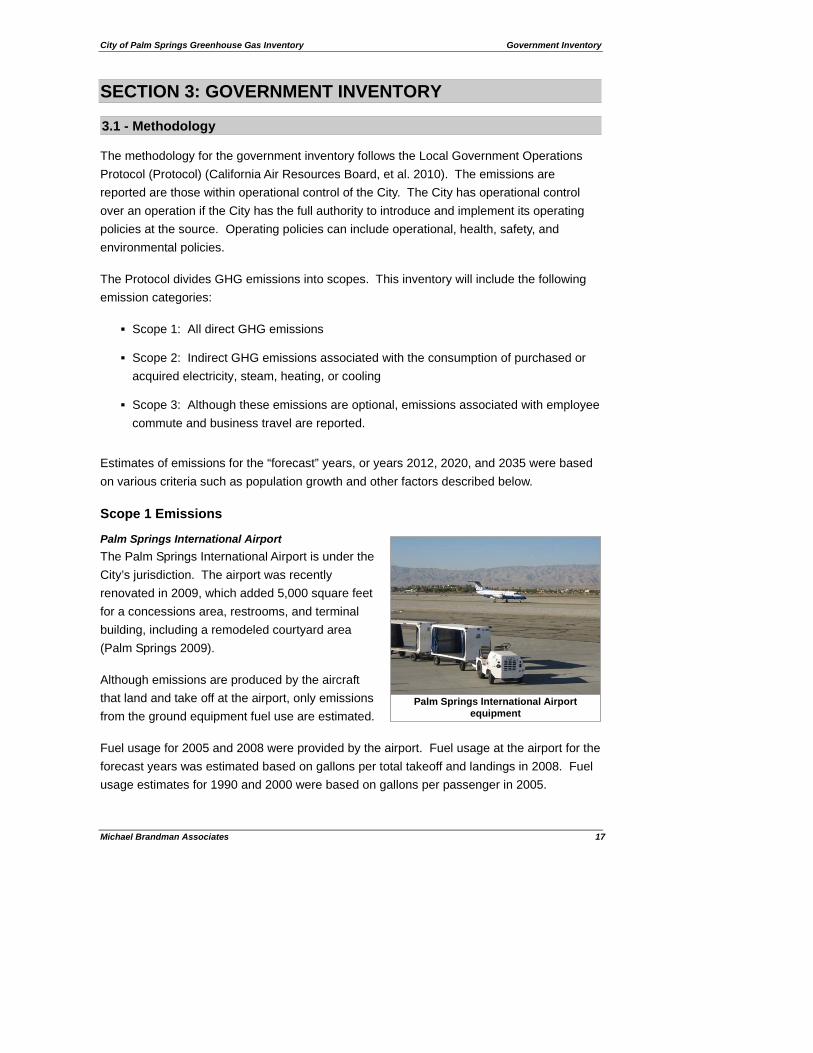
Palm Springs International Airport The Palm Springs International Airport is under the City’s jurisdiction. The airport was recently renovated in 2009, which added 5,000 square feet for a concessions area, restrooms, and terminal building, including a remodeled courtyard area (Palm Springs 2009).
Although emissions are produced by the aircraft that land and take off at the airport, only emissions from the ground equipment fuel use are estimated.
Fuel usage for 2005 and 2008 were provided by the airport. Fuel usage at the airport for the forecast years was estimated based on gallons per total takeoff and landings in 2008. Fuel usage estimates for 1990 and 2000 were based on gallons per passenger in 2005.
Palm Springs International Airport equipment

Community Inventory City of Palm Springs Greenhouse Gas Inventory
18 Michael Brandman Associates
Palm Springs Wastewater Treatment Plant The Palm Springs Wastewater Treatment Plant was originally constructed in 1960 to treat 4.15 million gallons per day (mgd). Two facility expansions were completed in 1979 and 1983, bringing the total design capacity to 10.9 mgd for average annual flow. The treatment processes consist of preliminary screening, grit removal, primary clarification, trickling filters, and secondary clarification. Treated effluent is disposed of onsite in percolation ponds or is supplied to the Desert Water Agency for further treatment to meet reuse standards for offsite irrigation. Biosolids from the treatment process are thickened, then stabilized by anaerobic digestion and dried with sludge drying beds before final disposal (Palm Springs 2010a).
Emissions from the treatment plant include stationary methane emissions from incomplete combustion of digester gas, process methane emissions from wastewater treatment lagoons, and process emissions from the plant without nitrification/denitrification. Emissions for forecast years were estimated from population growth assumptions.
Former Palm Springs Landfill The Former Palm Springs Landfill is an inactive landfill that had accepted predominantly household refuse and construction waste from the early 1930s until the mid-1960s. It is estimated that the volume of landfill debris is approximately 545,000 cubic yards, of which approximately 29 percent and 71 percent of the material are construction and household debris, respectively (Source Group 2003).
In 2004, the Former Palm Springs Landfill was remediated, and the landfill material was moved, recompacted, and capped within a proposed central parking area. A monitoring program was installed to determine if methane or other gases are accumulating in the piping. If there is accumulation, low-flow vacuum pumps purge the gases. There is no gas recovery collection system of methane to generate electricity.
Methane emissions from the landfill (for past, current, and future emissions) are estimated using the ARB’s Landfill Emissions Tool (California Air Resources Board 2010). There is some uncertainty in the emissions estimates, as the waste in cubic yards was converted to waste in tons.
Co-generation Plants There are two co-generation plants located within the City and operated by the City: Municipal and Sunrise Plaza. The co-generation plants use natural gas to power engines to generate electricity and heat. When natural gas is burned, it emits GHGs. Natural gas
Former Palm Springs Landfill Remediation, 2004
City of Palm Springs Greenhouse Gas Inventory Government Inventory
Michael Brandman Associates 19
usage was provided by the City and was entered into the Clean Air and Climate Protection (CACP) model to generate GHG emissions.
The heat byproduct from the co-generation plants is used to produce steam and hot water for the chillers as well as hydronic space heating. A chiller removes heat from a liquid. The liquid is then distributed to heat exchangers or coils, which cool the air in the space where they are located. The liquid is recirculated back to the chiller to be cooled again.
The Municipal co-generation plant provides electricity to the airport, county building, Fire Station #2, the city yard, City Hall, and the police station. Any additional electricity that is required is provided by Southern California Edison (and is shown in the Electricity category of the Government Inventory).
The City is currently conducting a comprehensive energy audit to develop a set of programs that will be combined as a performance-based, single-energy project with the intended purpose to save energy, reduce GHG emissions, and cut the City’s energy and maintenance and capital equipment expenditures throughout all of the City’s facilities, including the two co-generation plants. The future of the co-generation plants is unknown at this time. Therefore, it is assumed that natural gas use in future years is the same as in 2008.
City Vehicle Fleet There are emissions from vehicles driven by City employees, such as police vehicles, firefighting vehicles and trucks, passenger vehicles, and trucks. Fuel use from municipal operations was entered into the CACP model. Fuel use per capita in 2008 was used to estimate fuel use for the forecast years using population growth as a surrogate, as it is anticipated that more City employees and services would be required in proportion to the increase in population.
Ozone-Depleting Substance Substitutes The City of Palm Springs estimated that approximately 90 to 120 pounds of refrigerant (R-22) leaks out of the air conditioning systems used in City facilities, according to City records of replacement of refrigerant required from leakage. These emissions were converted to GHG emissions using the global warming potential for R-22. It is assumed that emissions in forecast years would be the same as current emissions. Even if the type of refrigerant changes in the future, the global warming potential would likely be about the same, as would the leakage.
Scope 2 Emissions
Natural Gas Natural gas usage was not available through Southern California Gas Company. Therefore, natural gas usage is not included in the City’s inventory (with the exception of natural gas used for the co-generation plants).

Community Inventory City of Palm Springs Greenhouse Gas Inventory
20 Michael Brandman Associates
Electricity The City purchases electricity from Southern California Edison for its electricity needs not supplied by the co-generation plants. The electricity usage was provided by Southern California Edison and was converted to GHG emissions using emission factors specific to Southern California Edison, published by eGRID. The emissions for 1990 use the emission factors from eGRID for 1996, the emissions for 2000 use emission factors for 2000, and emissions for later years use emission factors for 2005. Forecasts were estimated by assuming that electricity would increase proportionate to population growth in the City.
Scope 3 Emissions
Employee Commute An employee survey was conducted between August 25, 2010 and October 5, 2010. From a total of 390 employees, 141 surveys, or 36 percent, were completed. The survey was used to obtain the type of vehicle used for employee commutes and the distance to the place of employment from the residence. The average commute was applied to estimate emissions from all the employees. No growth was assumed for the employee commute because, since 1990, the number of employees has declined and is not based on the population within the City.
3.2 - Results
The estimated GHG emissions from government operations are shown in Table 6 and in Figure 7. The fugitive gases (methane and nitrous oxide) from the wastewater treatment plant are the largest source of emissions for all years, followed by the co-generation plants.
Table 6: Government Historical Inventory and Future Business as Usual Inventory
Emissions (MTCO2e per year) Category 1990 2000 2005 2008 2012 2020 2035
Former Palm Springs Landfill1
1,811 1,482 1,341 1,263 1,145 917 632
Wastewater treatment plant (fugitive)1
13,236 14,028 14,847 15,282 15,957 17,308 19,841
Co-generation plants1 6,646 10,020 9,112 8,746 8,746 8,746 8,746
Airport fuel use1 53 79 86 109 115 133 162
City vehicle fleet1 1,687 1,495 1,450 1,559 1,628 1,767 2,026
Ozone-depleting substance substitutes1
99 99 99 99 99 99 99
Electricity – municipal2 834 734 1,809 2,208 2,302 2,467 2,716
Electricity – streetlights2 741 652 633 681 710 761 838

City of Palm Springs Greenhouse Gas Inventory Government Inventory
Michael Brandman Associates 21
Table 6 (cont.): Government Historical Inventory and Future Business as Usual Inventory
Emissions (MTCO2e per year) Category 1990 2000 2005 2008 2012 2020 2035
Employee commute3 1,705 1,312 1,216 1,280 1,036 1,036 1,036
Total 26,812 29,901 30,593 31,227 31,738 33,234 36,096
Notes: 2012, 2020, and 2035 are projections based on business as usual. MTCO2e = metric tons of carbon dioxide equivalents 1 Scope 1 emissions 2 Scope 2 emissions 3 Scope 3 emissions Source: Appendix A.
Figure 7: Government Historical and Future Year Business as Usual Inventory
0
10,000
20,000
30,000
40,000
Emis
sion
s (M
TCO
2e)
1990 2000 2005 2008 2012 2020 2035
Former Palm Springs LandfillEmployee commuteElectricityMobile fuel useCo-generation plantsWastewater treatment plant

Community Inventory City of Palm Springs Greenhouse Gas Inventory
22 Michael Brandman Associates
A comparison of the Scope 2 emissions from electricity generation for City parks and associated buildings is shown in Figure 8.
Figure 8: Comparison of Municipal Parks Electricity Use
0
20
40
60
80
100
120
140
VillageGreen,
Historical
FrancesStevens
Park
Ruth HardyPark
Victoria Park DesertHighland
Park
DeMuth Park Sunrise,Stadium,Library
Elec
tric
ity E
mis
sion
s (M
TCO
2e)
2000 2005 2008
Incorporation of the reductions in the AB 32 Scoping Plan (see Table 5) is shown in Figure 9.
Figure 9: Government Inventory Growth
20,000
25,000
30,000
35,000
40,000
1990 1995 2000 2005 2010 2015 2020 2025 2030 2035
Year
Emis
sion
s (M
TCO
2e/y
ear)
Business as Usual Compliance

City of Palm Springs Greenhouse Gas Inventory Government Inventory
Michael Brandman Associates 23
Compliance emissions for the years 2020 and 2035 are shown in Table 7. As shown in the table, reductions from AB 32 would result in a 4-percent reduction in 2020 and 2035.
Table 7: Government Compliance Inventory
Emissions (MTCO2e per year) Source 2020 2035
Former Palm Springs Landfill 917 632
Wastewater treatment plant (fugitive) 17,308 19,841
Co-generation plants 8,746 8,746
Airport fuel use 133 162
City vehicle fleet 1,297 1,486
Ozone-depleting substance substitutes 60 60
Electricity – municipal 2,097 2,309
Electricity – streetlights 647 712
Employee commute 715 715
Total 31,920 34,663
Reduction from Business as Usual 4% 4%
Notes: 2020 and 2035 are projections and do not represent targets. MTCO2e = metric tons of carbon dioxide equivalents Source: Appendix A.


City of Palm Springs Greenhouse Gas Inventory Community Inventory
Michael Brandman Associates 25
SECTION 4: COMMUNITY INVENTORY
4.1 - Methodology
Detailed information regarding the methodology of the community inventory is contained within Appendix A. There is currently no published guidance regarding methodology for a community inventory. Data was estimated using emission factors in the spreadsheets contained in Appendix A as well as the CACP model.
Mobile Sources Mobile source emissions are from on-road and off-road vehicles traveling and performing work within the City. A description of these two sources is provided below.
On-Road Vehicles On-road vehicles include gasoline and diesel passenger vehicles, light-duty trucks (and sports utility vehicles), and heavy-duty vehicles. Vehicle miles traveled within the City for 2000, 2005, and 2008 are from the California Department of Transportation (Caltrans). Caltrans does not have data available for 1990; therefore, vehicle miles traveled within the City in 1990 was backcast from 2000 per capita estimates (17.3 miles per day per person in 2000). The oldest year for which data is available from Caltrans is 1996, which was not used because the per capita rate is greater than in 2000. The vehicle miles traveled does not contain miles traveled outside of the City. In addition, the vehicle miles traveled data includes pass-through trips, which are trips that do not originate or end in the City. The Palm Springs 2007 General Plan contains average daily traffic for buildout of the General Plan on the main roads within the City, which was converted to vehicle miles traveled by multiplying by the road length and adding a percentage to include the local roads. Vehicle miles traveled projections for 2012, 2020, and 2035 were interpolated from 2008 and General Plan buildout estimates. The vehicle miles traveled data was entered into the CACP model to estimate the GHG emissions.
Off-Road Vehicles Off-road equipment includes construction and mining equipment, generators, industrial equipment, lawn and garden equipment, and recreational equipment (off-road vehicles and all terrain vehicles). Emissions for Riverside County were estimated using the OFFROAD2007 model. Emissions within the City were apportioned from the County emissions on the basis of population. The OFFROAD2007 model also includes forecasts of emissions for future years.
Airport Fuel Use Airport fuel use is estimated as discussed in the Government Inventory section.
Community Inventory City of Palm Springs Greenhouse Gas Inventory
26 Michael Brandman Associates
Energy – Residential Electricity Residential electricity refers to the indirect emissions associated with generating electricity to be used in households in the City. Southern California Edison provided electricity usage for the entire City for 1990, 2000, 2005, and 2008 (reports are located in Appendix B). Emission factors are from eGRID (1990 uses 1996 factors; 2000 uses 2000 factors; and later years use emission factors for 2005). Electricity for future years was forecast by assuming that household growth was equal to an increase in residential electricity. The electricity usage data was converted to GHG emissions using emission factors specific to Southern California Edison.
Natural Gas GHGs are emitted when natural gas is burned. Natural gas is used to heat residences, power dryers, heat water, and/or for natural gas kitchen stoves. The Southern California Gas Company provided natural gas usage for 2005 and 2008. Natural gas usage for other years was projected using the therms per year per residential unit in 2005 and was assumed to grow at the same rate as the number of housing units.
Energy – Non-Residential Electricity Electricity for the non-residential category includes emissions from power plants used to generate electricity that is used for hotels, restaurants, public buildings and uses (such as streetlights), commercial buildings, and industrial buildings. Southern California Edison provided electricity usage for 1990, 2000, 2005, and 2008. Emission factors are from eGRID (1990 uses 1996 factors; 2000 uses 2000 factors; and later years use emission factors for 2005). Municipal, water, and street lighting growth for future years is correlated to an increase in population. Growth in commercial/industrial is correlated to an increase in commercial/industrial acreage assumed at buildout in the Palm Springs 2007 General Plan. Emissions were estimated using emission factors specific to Southern California Edison.
Natural Gas Natural gas from the commercial/industrial/public sector is used for space heating, co-generation plants, to heat water, and industrial processes. Southern California Edison provided natural gas usage for the City for the “commercial/industrial” sector for 2005 and 2008. Natural gas for the future years was estimated using the therms per year per acre of commercial/industrial land in 2005. Natural gas for 1990 and 2000 was backcast using therms per capita in 2005. Emissions were estimated using the CACP model.
Waste Former Palm Springs Landfill Although this landfill has not been active for many years, methane is still emitted. Emissions are estimated as discussed in the Government Inventory.
City of Palm Springs Greenhouse Gas Inventory Community Inventory
Michael Brandman Associates 27
Waste Generated Waste generated by residents, employees, and visitors in the City are sent to a landfill outside of the City, where the trash generates GHG emissions through decomposition processes. The California Department of Resources Recycling and Recovery (2010) maintain records of waste generated by the City.
In 2005, the City expanded its efforts to increase recycling and decrease waste. In 2005, the City’s recycling rate was around 54 percent (City of Palm Springs 2010a). The City worked with Palm Springs Disposal Services to tighten the City’s waste reporting methods. The City also encouraged businesses to recycle by visiting with businesses and speaking at civic events. The City educated residents by producing recycling brochures, recycling wheels, construction and demolition brochures, fliers, refrigerator magnets, recyclable grocery bags, and other pieces of information available at City Hall, the library, other City facilities, and VillageFest. The City also used its website and closed circuit television (CCTV). The City increased the number of e-waste/shredding events. For the last reportable year, the City’s recycling rate was over 69 percent. Between 2005 and 2008, waste decreased in the City by approximately 28,000 tons.
Waste generation for future years was estimated from per capita waste in 2008. The CACP model calculated emissions from waste generation.
Water and Wastewater Emissions in this category include emissions from the electricity required to pump water and fugitive emissions from the wastewater treatment plant. Electricity data was provided by Southern California Edison. Wastewater treatment plant fugitive emissions are estimated as discussed in the Government Inventory.
Ozone-Depleting Substance Substitutes In some cases, high global warming potential gases have been substituted for ozone depleting substances (ODS) in refrigeration and manufacturing processes. ODS are being phased out pursuant to the Montreal Protocol because they are gases that cause chemical destruction of the ozone in the stratosphere (a layer of air in the upper atmosphere). Ozone in the stratosphere is good because it absorbs ultraviolet radiation, which can cause skin cancer, cataracts, and other health problems in humans. Stratospheric ozone is not to be confused with ozone in the troposphere (the layer of air that we breathe), which is an air pollutant that results in health effects.
ODS substitutes can be released into the atmosphere when they leak out of refrigeration and air conditioning equipment contained in stationary and mobile applications. ODS substitutes are also used in solvent cleaning, foam production, sterilization, fire suppressants, and aerosols. Emissions of ODS substitutes consisted of 2.9 percent of California’s GHG inventory in 2008 and are anticipated to increase to 7.5 percent by 2020.

Community Inventory City of Palm Springs Greenhouse Gas Inventory
28 Michael Brandman Associates
The United States is forecasting emissions of ODS substitutes to increase by 168 percent between 2005 and 2020 (United States Environmental Protection Agency 2010). The large increase is due to the growing use of ODS substitutes to replace ODS gases.
The ODS substitutes hydrofluorocarbons (HFCs) and perfluorocarbons (PFCs) have high global warming potentials. The global warming potential is the potential of a gas or aerosol to trap heat in the atmosphere compared with the reference gas, carbon dioxide, which has a global warming potential of 1.
ODS substitutes are estimated for the City by apportioning California emissions on the basis of population. California has data and projections for the State for 1990, 2000, 2005, 2008, and 2020. Emissions for 2012 are interpolated from 2008 and 2020 data. Emission projections for 2035 are based on per capita emissions in 2020.
Sources Not Included: Indigo Power Plant The Wildflower Energy Indigo Generation natural gas peaker power plant’s emissions are not included within this GHG inventory because indirect emissions from power plants are included within the Electricity sector. Reported emissions from the peaker power plant in 2008 were 69,471 MTCO2e and in 2009 were 38,406 MTCO2e (Appendix A).
4.2 - Results
The community business as usual inventory is presented in Figure 10 and Table 8. A series of pie charts that display the percentages of the emissions between 1990 and 2020 is shown in Exhibit 2. ODS substitutes increase from less than 1 percent in 1990 to 7 percent of the emissions in 2035.
Figure 10: Community Historical and Future Business as Usual Inventory
0
200,000
400,000
600,000
800,000
1,000,000
Emis
sion
s (M
TCO
2e)
1990 2000 2005 2008 2012 2020 2035
ODS substitutesWater, wastewaterWaste Energy (non residential)Energy (residential)Mobile vehicles

City of Palm Springs Greenhouse Gas Inventory Community Inventory
Michael Brandman Associates 29
Exhibit 2: Community Business as Usual Emissions


City of Palm Springs Greenhouse Gas Inventory Community Inventory
31 Michael Brandman Associates
Table 8: Community Historical and Future Business as Usual Inventory
GHG Emissions (MTCO2e per year) Category Source 1990 2000 2005 2008 2012 2020 2035
High GWP gases ODS substitutes 49 10,805 15,523 17,239 28,690 54,314 62,282
Electricity-water 11,879 9,724 10,326 10,913 11,376 12,193 13,426 Water, wastewater
Wastewater treatment plant (fugitive) 13,236 14,028 14,847 15,282 15,957 17,308 19,841
Former Palm Springs Landfill 1,811 1,482 1,341 1,263 1,145 917 632 Waste
Waste generated 14,920 18,367 16,879 11,490 11,999 13,018 14,928
Electricity – commercial/industrial 101,743 91,112 84,047 91,259 93,362 97,568 105,454
Natural gas – commercial/industrial 43,634 46,527 49,865 38,269 53,980 58,682 67,498
Electricity – municipal 834 734 1,809 2,208 2,302 2,467 2,716
Energy (non residential)
Electricity – streetlights 741 652 633 681 710 761 838
Electricity 97,594 84,957 84,905 89,656 91,682 95,472 101,761 Energy (residential)
Natural gas 66,838 67,566 70,297 70,554 75,265 78,667 85,046
Airport fuel use 53 79 86 109 115 133 162
Off-road vehicles 123 118 211 207 205 210 250
On-road passenger vehicles 192,081 179,116 218,483 206,505 221,092 251,733 331,876
Mobile vehicles
On-road trucks 20,277 15,135 22,640 16,862 18,523 23,754 36,521
Total 565,813 540,402 591,892 572,497 626,403 707,197 843,231
Per Capita Emissions 14.1 12.6 12.9 12.2 12.8 13.3 13.8
Notes: GHG = greenhouse gas; MTCO2e = metric tons of carbon dioxide equivalents (contains GHGs carbon dioxide, methane, nitrous oxide, and hydrofluorocarbons) GWP = global warming potential; ODS = ozone depleting substances Source: Appendix A.

City of Palm Springs Greenhouse Gas Inventory Community Inventory
32 Michael Brandman Associates
Figure 11 displays the emission percentages for 2035. Mobile vehicles and energy are the largest source of GHG emissions within the City.
Figure 11: 2035 Community Business as Usual Emissions
Mobile vehicles44%
Energy (residential)22%
Energy (non residential)
21%
Waste 2%
Water, wastewater4%
ODS substitutes7%
Figure 12 displays the increase over time of the business as usual emissions and the compliance emissions. Compliance emissions are emissions with the reductions from AB 32. Also shown are the 1990 emissions over time.
Figure 12: Community Inventory Growth
400,000
600,000
800,000
1990 1995 2000 2005 2010 2015 2020 2025 2030 2035
Year
Emis
sion
s (M
TCO
2e/y
ear)
Business as Usual Compliance 1990 Emissions

City of Palm Springs Greenhouse Gas Inventory Community Inventory
Michael Brandman Associates 33
Table 9 displays the GHG emissions inventory of the community emissions with incorporation of reductions afforded by AB 32. As shown in the table, in 2020, the reductions reduce emissions by 18.9 percent from business as usual; in 2035, emissions are reduced by 19.5 percent.
Table 9: Community Future Year Compliance Inventory
Emissions (MTCO2e per year) Category Source 2020 2035
High GWP gases ODS substitutes 33,131 37,992
Electricity - water 10,364 11,412 Water, wastewater
Wastewater treatment plant (fugitive gases)
17,308 19,841
Former Palm Springs Landfill 917 632 Waste
Waste generated 10,545 12,091
Electricity – commercial/industrial 82,933 89,636
Natural gas – commercial/industrial 58,682 67,498
Electricity – municipal 2,097 2,309
Energy (other)
Electricity – streetlights 647 712
Electricity 81,151 86,497 Energy (residential)
Natural gas 78,667 85,046
Airport fuel use 133 162
Off-road vehicles 210 250
On-road passenger vehicles 173,696 228,994
Motor vehicles
On-road trucks 23,279 35,791
Total 573,760 678,863
Per Capita Emissions 10.8 11.1
Reduction from Business as Usual 18.9% 19.5%
Emissions are this percent greater than 1990 emissions 1% 17%
Notes: MTCO2e = metric tons of carbon dioxide equivalents; GWP = global warming potential ODS = ozone depleting substance Compliance emissions for the years 1990, 2000, 2005, 2008, and 2012 are assumed to be the same as business as usual (Table 8). Source: Appendix A.


City of Palm Springs Greenhouse Gas Inventory Glossary of Terms and Acronyms
Michael Brandman Associates 35
SECTION 5: GLOSSARY OF TERMS AND ACRONYMS AB Assembly Bill
ARB The California Air Resources Board is a part of the California Environmental Protection Agency, an organization that reports directly to the Governor’s Office in the Executive Branch of California State Government. The mission of the ARB is to promote and protect public health, welfare, and ecological resources through the effective and efficient reduction of air pollutants while recognizing and considering the effects on the economy of the State.
CEQA The California Environmental Quality Act is a California statute passed in 1970 to institute a statewide policy of environmental protection.
BAU Business as usual: Emissions that are expected to occur in a future year in the absence of emission reduction regulations and controls.
CO2 Carbon dioxide: A naturally occurring gas and a by-product of burning fossil fuels and biomass other industrial processes. It is the reference gas against which other GHGs are measured and therefore has a global warming potential of 1.
Climate Change The statistically significant variation either in the mean state of the climate or in its variability, persisting for an extended period (typically decades or longer).
EPA United States Environmental Protection Agency. The mission of EPA is to protect human health and to safeguard the natural environment—air, water and land—upon which life depends.
GHG Greenhouse gas: A gas that absorbs infrared radiation in the atmosphere. GHGs as defined by AB 32 include carbon dioxide, methane, nitrous oxide, hydrofluorocarbons, perfluorocarbons, and sulfur hexafluoride.
MTCO2e Metric tons of carbon dioxide equivalents: a measure of GHG emissions
MMTCO2e Million metric tons of carbon dioxide equivalents: a measure of GHG emissions
ODS Ozone depleting substances: compounds that contributes to stratospheric ozone depletion. ODS include chlorofluorocarbons (CFCs), hydrochlorofluorocarbons (HCFCs), halons, methyl bromide, carbon tetrachloride, hydrobromofluorocarbons, chlorobromomethane, and methyl chloroform. ODS are generally very stable in the troposphere and only degrade under intense ultraviolet light in the stratosphere. When they break down, they release chlorine or bromine atoms, which then deplete ozone.
SB Senate Bill


City of Palm Springs Greenhouse Gas Inventory References
Michael Brandman Associates 37
SECTION 6: REFERENCES
6.1 - Acknowledgments
The following are individuals who assisted by providing data, peer review, and/or assistance. The names are in alphabetical order.
City of Palm Springs Jan Anderson, Facilities Maintenance Manager David Barakian, Director of Public Works/City Engineer Cindy Berardi, City Clerk’s Office Steve Bowser, Deputy Director of Aviation Gary Calhoun, Recycling Coordinator Craig Ewing, Director of Planning Services Marcus Fuller, Assistant City Engineer/Assistant Director of Public Works Kim Hardcastle, Human Resources Analyst Ken Lyon, Associate Planner Michele Mician, Manager, Office of Sustainability Steve Rakestraw, Fleet Operations/Maintenance Manager
Michael Brandman Associates George Checkal, GIS Technician Ed Livingston, Editor David Mitchell, Air Quality Services Manager Arabesque Said, Analyst
South Coast Air Quality Management District Ian MacMillan, Program Supervisor, CEQA Intergovernmental Review
Southern California Edison Jennifer Menjivar, Region Manager, Local Public Affairs Adrina Young, Analyst-Program/Project
Southern California Gas Company Deborah McGarrey, Public Affairs Manager
6.2 - References in Text
California Air Resources Board, 2008. Greenhouse Gas Inventory – 2020 Forecast. Website: www.arb.ca.gov/cc/inventory/data/forecast.htm.
California Air Resources Board, 2008. Scoping Plan. Website: www.arb.ca.gov/cc /scopingplan/document/scopingplandocument.htm, Accessed October 21, 2010.
References City of Palm Springs Greenhouse Gas Inventory
38 Michael Brandman Associates
California Air Resources Board. 2010. Scoping Plan Measures Implementation Timeline. July 1, 2010. Website: www.arb.ca.gov/cc/scopingplan /sp_measures_implementation_timeline.pdf.
California Air Resources Board, et al. 2010. California Air Resources Board, California Climate Action Registry, ICLEI – Local Governments for Sustainability, and the Climate Registry. Local Government Operations Protocol for the quantification and reporting of greenhouse gas emissions inventories. Version 1.1, May 2010. Website: www.arb.ca.gov/cc/protocols/localgov /localgov.htm. Accessed August 30, 2010.
California Air Resources Board. 2010. California Air Resources Board’s Implementation of IPCC’s Mathematically Exact First-Order Decay Model. June 3. (model output contained in Appendix A)
California Climate Change Center. 2006. Our Changing Climate, Assessing the Risks to California: A Summary Report from the California Climate Change Center. July 2006. CEC-500-2006-077. Accessed July 1, 2010. Website: www.climatechange.ca.gov/publications/biennial_reports/index.html.
California Department of Finance. 2009. E-5 Population and Housing Estimates for Cities, Counties and the State, 2001-2009, with 2000 Benchmark. May. Website: www.dof.ca.gov/research/demographic/reports/estimates/e-5/2009/.
California Energy Commission. 2010. California Energy Maps, California Building Climate Zone Map. Website: www.energy.ca.gov/maps/building_climate_zones.html. Accessed August 30, 2010.
California Department of Resources Recycling and Recovery. Disposal Reporting System: Jurisdiction Disposal and Alternative Daily Cover tons by Facility. Website: www.calrecycle.ca.gov/LGCentral/Reports/DRS/Destination/JurDspFa.aspx, Accessed August 2, 2010.
ICLEI, Local Governments for Sustainability. 2010. Clean Air and Climate Protection 2009 Software. Version 2.2.1b. April.
Intergovernmental Panel on Climate Change 2007a. Climate Change 2007: The Physical Science Basis. Contribution of Working Group I to the Fourth Assessment Report of the Intergovernmental Panel on Climate Change (Solomon, S., D. Qin, M. Manning, Z. Chen, M. Marquis, K.B. Averyt, M.Tignor and H.L. Miller [eds.]). Cambridge University Press, Cambridge, United Kingdom and New York, NY, USA, Website: www.ipcc.ch/ipccreports/ar4-wg1.htm, Accessed July 1, 2010
Intergovernmental Panel on Climate Change 2007b. Climate Change 2007: Synthesis Report. Contribution of Working Groups I, II and III to the Fourth Assessment Report of the Intergovernmental Panel on Climate Change (Core Writing Team, Pachauri, R.K and Reisinger, A. [eds.]). IPCC, Geneva, Switzerland. Website: www.ipcc.ch/publications_and_data/ar4/syr/en/contents.html. Accessed July 1, 2010.
Moser et al. 2009. Moser, Susie, Guido Franco, Sarah Pittiglio, Wendy Chou, and Dan Cayan. 2009. The Future Is Now: An Update on Climate Change Science

City of Palm Springs Greenhouse Gas Inventory References
Michael Brandman Associates 39
Impacts and Response Options for California. California Energy Commission, PIER Energy-Related Environmental Research Program. CEC-500-2008-071. Website: www.energy.ca.gov/2008publications/CEC-500-2008-071/CEC-500-2008-071.PDF Accessed July 1, 2010
Palm Springs, City of, 2009. Inside Palm Springs, News from City Hall. April. Website: www.palmsprings-ca.gov/Modules/ShowDocument.aspx?documentid=7001. Accessed October 18, 2010.
Palm Springs, City of, 2010a. Wastewater Treatment Plant Capital Rehabilitation and Repair Plan. Website: www.palmsprings-ca.gov/index.aspx?page=877. Accessed October 18, 2010.
Palm Springs, City of, 2010b. Gary Calhoun, City of Palm Springs Recycling Coordinator. Personal communication: email. October 18, 2010.
Palm Springs Resolution No. 22714. A Resolution of the City Council of the City of Palm Springs, California, Approving the Budget for Fiscal Year 2010-11 and such other matters as required. Website: www.palmspringsca.gov /index.aspx?page=452. Accessed August 30, 2010.
Southern California Edison. 2010. Greenhouse Gas Initiatives. Website: www.edison.com /environment/eme_ghg.asp. Accessed October 25, 2010.
Southern California Edison. 2006. Southern California Edison signs largest Wind Energy Contract in U.S. Renewable Industry History. Website: http://www.edison.com/pressroom/pr.asp?id=6487. Accessed October 25, 2010.
The Source Group. 2003. Final Draft Removal Action Workplan Former Palm Springs Landfill, Intersection of Gene Autry Trail and Ramon Road, Palm Springs, California. December 16,. Website: www.dtsc.ca.gov/SiteCleanup/Projects /upload/Palm-Springs-Landfill_REP_RAW.pdf.
United States Environmental Protection Agency. 2010. 2010 U.S. Greenhouse Gas Inventory Report – Inventory of U.S. Greenhouse Gas Emissions and Sinks 1990-2008. EPA-430-R-10-006. Washington, D.C. Website: www.epa.gov /climatechange/emissions/usinventoryreport.html. Accessed July 5, 2010.
Western Regional Climate Center. 2006. Palm Springs, California. Period of Record General Climate Summary. From 1927 to 2006. Cooling Degree Days Heating Degree Days. Website: www.wrcc.dri.edu/cgi-bin/cliMAIN.pl?caplms+sca. Accessed August 30, 2010.
6.3 - Figure References
Figure 1. Michael Brandman Associates.
Figure 2: City of Palm Springs Population and Housing Trends. Michael Brandman Associates. See “Population and Housing Summary” spreadsheet in Appendix A.
Figure 3: The Greenhouse Effect. UNEP/GRID-Arendal. Factors influencing the greenhouse effect [Internet]. UNEP/GRID-Arendal Maps and Graphics Library; 2002 (cited

References City of Palm Springs Greenhouse Gas Inventory
40 Michael Brandman Associates
2010 Sep 4). Cartographer/Designer: Philippe Rekacewicz. Website: http://maps.grida.no/go/graphic/factors_influencing_the_greenhouse_effect.
Figure 4: Global Atmospheric Concentration of CO2. UNEP/GRID-Arendal. Global atmospheric concentration of CO2. UNEP/GRID-Arendal Maps and Graphics Library. 2000. Website: http://maps.grida.no/go/graphic/global-atmospheric-concentration-of-co2. Accessed August 28, 2010.
Figure 5: United States Greenhouse Gas Emissions Trends. United States Environmental Protection Agency. Inventory of U.S. Greenhouse Gas Emissions and Sinks 1990-2008. April 15, 2010. Website: www.epa.gov/climatechange/emissions/downloads10/US-GHG-Inventory-Fast-Facts-2008.pdf. Accessed September 3, 2010. EPA 430-R-10-006.
Figure 6: California Greenhouse Gas Emissions in 2008. California Air Resources Board. Greenhouse Gas Inventory Data - Graphs. Website: www.arb.ca.gov/cc/inventory /data/graph/graph.htm. Accessed August 28, 2010.
Figure 7 through Figure 12. Michael Brandman Associates.
6.4 - Photograph References
Cover: Palm Springs. iStock photo 12025754.
Palm Trees in the City of Palm Springs. iStock photo 2610434.
Palm Springs and the San Jacinto Mountains. Palm Springs. View of Palm Springs and Coachella Valley with San Jacinto Mountains in the background. iStock photo 12134415.
Wind Turbines in Palm Springs. iStock photo 12763144. Photo by Lawrence Freytag on April 7, 2010, east of Palm Springs.
Wildfire in California. California desert hills wild fire sparked by lightening. Photo by David Mantel. iStock photo 13790519.
Palm Springs International Airport Equipment. Photo by Michael Brandman Associates.
Former Palm Springs Landfill Remediation. California Environmental Protection Agency, Department of Toxic Substances Control. Brownfields Cleanup. Sara Amir. Website: www.swrcb.ca.gov/losangeles/water_issues/programs/remediation/presentations/04_1118/brownfields%20workshop%20with%20the%20water%20board%203.pdf.
6.5 - Exhibit References
Exhibit 1. Michael Brandman Associates.
Exhibit 2. Michael Brandman Associates.

City of Palm Springs Greenhouse Gas Inventory
Michael Brandman Associates
Appendix A: Spreadsheets and Model Output

City of Palm Springs Greenhouse Gas Inventory
Michael Brandman Associates
Appendix B: Southern California Edison Reports


City of Palm Springs Greenhouse Gas Inventory
Michael Brandman Associates
Appendix C: Southern California Association of Governments Letter