adopted pocd effective 060416 - southington · 2016-05-24 · 3 pocd terminology many sections of...
TRANSCRIPT

SOUTHINGTON 2016 Plan of Conservation and Development
Planning and Zoning Commission Effective June 4, 2016

TABLE OF CONTENTS
Introduction
Welcome
1 Introduction 1
2 Conditions & Trends 5
3 Planning Issues 17
Conservation
Strategies
4 Protect Natural Resources 21
5 Preserve Open Space 27
6 Preserve Community Assets 35
7 Promote Sustainability and Resiliency 45
Development
Strategies
8 Enhance Downtown And Other Places 47
9 Promote Economic Development 63
10 Promote Redevelopment 69
11 Guide Residential Development 73
Infrastructure
Strategies
12 Address Community Facility Needs 81
13 Address Transportation Needs 93
14 Provide For Utility Infrastructure 105
Conclusion
15 Future Land Use Plan 111
16 Implementation 117
17 Conclusion 144
Glossary


GLOSSARY OF TERMS A glossary of some terms and acronyms used in the POCD is located at the end of the document.
POCD MAPS All of the maps in the POCD can be found on the Town website and specific map areas can be enlarged for more detailed viewing. However, these maps are intended for community planning purposes only and are not intended or appropriate for parcel‐level or neighborhood‐level analysis.

1
INTRODUCTION
1
Overview A Plan of Conservation and Development (POCD) is a document whose purpose is to establish a common vision for the future of a community and then identify policies that will help attain that vision. While its key purpose and function is to address the physical development of a community, it will often address issues related to economic and social development. The goals and recommendations of the Plan are intended to reflect an overall consensus of what is considered desirable for Southington and its residents in the future. It is envisioned that the Plan will be used to help:
Preserve and protect things important to residents (conservation strategies),
Guide future growth and change in ways the community wants (de‐velopment strategies), and
Identify facilities and services the community wants or needs in the future (infrastructure strategies).
A POCD is primarily an advisory document. It is intended to guide local boards and commissions and to provide a framework for consistent decision‐making with regard to conservation and development activities in Southington over the next decade or so. While the statutory responsibility to adopt the Plan rests with the Planning and Zoning Commission, implementation will occur only with the diligent efforts of the residents and officials of the Town of Southington. The Plan will be effective only if it is understood and supported by the people of Southington and imple‐mented by local boards and commissions.

2
EXCERPTS FROM CONNECTICUT GENERAL STATUTES SECTION 8‐23 – PLAN OF CONSERVATION AND DEVELOPMENT
The Commission shall:
prepare, adopt and amend a plan of conservation and development ...
review the plan of conservation and development at least once every ten years ...
adopt such amendments to the plan or parts of the plan ... as the commission deems necessary to update the plan.
The Plan shall:
be a statement of policies, goals and standards for the physical and economic develop‐ment of the municipality, ...
show the commission's recommendation for the most desirable use of land within the municipality for residential, recreational, commercial, industrial and other purposes and for the most desirable density of population in the ... parts of the municipality.
be designed to promote with the greatest efficiency and economy the coordinated development of the municipality and the general welfare and prosperity of its people.
be made with reasonable consideration for restoration and protection of the ecosystem and habitat of Long Island Sound ...
make provision for the development of housing opportunities, including opportunities for multifamily dwellings consistent with soil types, terrain and infrastructure capacity, for all residents of the municipality and the planning region ...
promote housing choice and economic diversity in housing, including housing for both low and moderate income households, and encourage the development of housing which will meet the housing needs ...
take into account the state plan of conservation and development ... and note any inconsistencies it may have with said state plan.
consider the use of cluster development to the extent consistent with soil types, terrain, and infrastructure capacity.
The Plan may:
show the commission's recommendation for a system of principal thoroughfares, park‐ways, bridges, streets and other public ways; for airports, parks, playgrounds and other public grounds; for general location, relocation and improvement of public buildings; for the general location and extent of public utilities and terminals, whether publicly or pri‐vately owned for water, sewerage, light, power, transit and other purposes; and for the extent and location of public housing projects.
include recommended programs for the implementation of the plan ...
(include) such other recommendations ... in the plan as will ... be beneficial to the munici‐pality.

3
POCD TERMINOLOGY Many sections of the Plan of Conservation and Development (POCD) contain strategies, policies, and action steps. As used in the Plan of Conservation and Development:
• A “strategy” is a long‐term goal or course of action for Southington
• A “policy” is a principle or course of action intended to help implement the strategy (a policy is an on‐going activity which does not generally have an end date)
• An “action step” is a recommended task that helps implement the strategy (a task has an end date or specific result)
Strategy (Goal)
Policy Action Step
The strategies, policies and action steps are then organized and presented in Chapter 15 of the POCD (Implementation). This Chapter identifies a “leader” for each policy and action step and may include one or more “partners.” The “leader” is the entity considered most likely to bear responsibility for imple‐menting the policy or completing the action step. Partners are other entities likely to be involved in implementation. A legend for “leaders” and “partners” may be found on the inside back cover. Chapter 15 also identifies a preliminary priority for implementation based on an exercise conducted among the members of the POCD Steering Committee.

4
ROLES & RESPONSIBILITIES OF SOME TOWN AGENCIES Planning and Zoning Commission (PZC) ‐ The PZC reviews and authorizes development of major land uses (commercial, industrial, multi‐family residen‐tial, institutional, and subdivisions). The Commissions administers the Zoning Regulations and the Subdivision Regulations. The PZC is the primary user of Plan of Conservation and Development. Town Council ‐ As the chief legislative body, the Town Council establishes policies and programs for the effective delivery of Town services, approves the operating budget and the capital budget, and enacts and implements Town ordinances. Conservation / Wetlands Commission (CWC) ‐ The CWC administers the Wetlands Regulations and reviews proposals which involve the filling or alteration of wetlands or watercourses. In addition, the CWC promotes preservation of Southington's natural resources. Southington Enterprise Zone / Economic Development (SEED) Committee – The SEED Committee advises the Town Council on matters related to the economic growth of the town and assists in the planning, implementation and management of the enterprise zone. Open Space and Land Acquisition Committee (OSLAC) ‐ OSLAC advocates for the preservation of open space lands to protect and maintain the scenic, recreational and cultural landscape, protect natural resources, and for the overall enrichment of the community. The Committee includes representa‐tives from other Town boards and agencies. Zoning Board of Appeals (ZBA) ‐ The ZBA can vary the application of the zoning regulations in special circumstances (where there is a hardship), grant special exceptions where the zoning regulations so indicate, and review appeals from decisions of the Zoning Enforcement Officer.

5
CONDITIONS & TRENDS
2
Overview This Section of the POCD provides a general overview of conditions and trends affecting Southington. It has been prepared as part of the process of formulat‐ing the 2016 Plan of Conservation and Development.
History People
Housing Business
Land Use Fiscal

6
History of Southington The landscape of the area we now know as Southington evolved over millions of years as a result of massive geologic forces. While there is no written record of their early habitation, Native Americans are believed to have lived in this area for about the last 10,000 years. European Settlement Europeans “discovered” this part of the new world in 1614 when Dutch explorer Adriaen Block sailed into what we now call Long Island Sound. Dutch and Euro‐pean trade with Native Americans eventually led to settlement of inland areas along the Connecticut River after 1633. Following the Pequot War of 1637, European settlement began to extend to other areas. Around 1640, Europeans “purchased” land from Native Americans in what is now called Farmington and settlement began in this area. As population grew, land was needed by each family for subsistence farming and settlers moved outwards from Farmington. The first known resident of what we now know as Southington was Samuel Woodruff who, by 1698, estab‐lished a homestead near the present day site of Southington High School. Settlement proceeded slowly. In 1722, a survey of the South Division of Farm‐ington was used to lay out main roads (West Street, Queen Street, and East Street). The survey also granted land to 84 prominent Farmington families, perhaps to entice them to settle in this area. Formation Of A Parish And Then A Town Life was difficult for early settlers and it was made more challenging by the customs of the time where settlers would travel every week to a “meeting‐house” for religious services regardless of season or weather. While the 11‐mile distance to Farmington seems modest today, it would have been a challenge by horse or carriage in the middle of winter. In 1724, permission was granted to establish a new religious parish (the South parish of Farmington). Eventually, the population grew to the point where people no longer wished to travel to Farmington for militia training or for town meetings. A petition was undertaken to create their own municipality and, in 1779, residents received permission from the General Assembly to establish a separate municipality. According to the 1782 Census, there were about 1,800 residents. At this time, the economy of this area was still dominated by subsistence agri‐culture although there were some mills and early stores.

7
Growth Of Manufacturing And The Community Beginning in 1828, Southington became better connected to other places. The Farmington Canal (built to connect Northampton, MA to New Haven, CT) came through Southington and this provided an opportunity to ship local products to other markets. Although the canal was not a major success, the railroad which came in 1848 created more opportunities. Local residents were very inventive and Southington became the base for a number of manufacturing companies making nuts and bolts, carriage bolts, tinware, and other goods. It would not be a stretch to say that Southington residents built better mousetraps since the “break‐neck” mouse trap was in‐vented here. Southington was also a birthplace of the instant photograph (although the rights were sold to Eastman Kodak in 1928). As businesses grew, Southington attracted many new workers (many of them immigrants) eager to work in the factories. Population growth continued and Southington had over 9,000 residents by 1930. In addition, Southington was connected by trolleys to Waterbury and other surrounding communities and was said to have an electric railroad travelling in all four main directions. Spread Of The Automobile Following World War II, Southington experienced the same surge of growth that affected other communities in the area. A cultural trend toward suburban living and the flexibility offered by the automobile supported the development of Southington. Construction of the interstate highway system in the 1950s and 1960s encouraged the suburban development of residential areas and Southing‐ton was no different. Former farms were subdivided and developed and popu‐lation tripled between 1940 and 1970. By 1970, Southington had grown to be a community of over 30,000 people and the overall pattern of the community became established. Growth continued and, by 2010, Southington was a community with over 43,000 residents.
Streetcar Peck, Stow and Wilcox Plant

8
Population Overview and Projections According to the Census, Southington had a year 2010 population of 43,069 persons. This represents an increase of 3,341 persons from the 39,728 persons reported in the 2000 Census. The chart shows Southington population growth since the 1790 Census with a range of population projections to the year 2040.
Southington’s Population (1790 – 2040)
0
5,000
10,000
15,000
20,000
25,000
30,000
35,000
40,000
45,000
50,000
1790 1820 1850 1880 1910 1940 1970 2000 2030
Census
High Projection
Low Projection
Southington’s Population
1790 2,110 1800 1,804 1810 1,807 1820 1,875 1830 1,844 1840 1,887 1850 2,135 1860 3,315 1870 4,314 1880 3,411 1890 5,501 1900 5,890 1910 6,516 1920 8,440 1930 9,237 1940 9,646 1950 13,061 1960 22,797 1970 30,946 1980 36,879 1990 38,518 2000 39,728 2010 43,069 2020 45,043 ‐ 45,136
2030 46,244 ‐ 46,476
2040 46,735 ‐ 47,204 US Census data for 1820 to 2010. Projections are in italics. Low projections are based on Planimetrics cohort survival model. High projections based on Connecticut State Data Center cohort survival model extrapolated to 2040.

9
Dynamics of Population Change As can be seen from the following chart, the number of births in Southington has fluctuated over time but has somewhat settled into a range of 400 to 500 births per year. As for many communities, the number of births declined after 2005 due to concerns over the economy.
Births and Deaths (1950 – 2010)
As shown below, Southington has experienced “natural increase” (more births than deaths) in every decade since 1950. As Southington’s population ages, this trend may change in the future. Southington experienced net in‐migration in every decade except during the 1980s.
Components of Population Change (1950 – 2010) 1950s 1960s 1970s 1980s 1990s 2000s
If the Census indicates the population changed this much in this decade …
+9,736 +8,149 +5,933 +1,639 +1,210 +3,341
And this much change occurred as a result of births and deaths …
+3,545 +3,678 +2,439 +2,028 +1,166 +526
Births 4,890 5,447 4,536 4,630 4,225 4,345 Deaths 1,345 1,769 2,097 2,602 3,059 3,819
Then this many people moved in (or out) of Southington during that decade
+6,191 +4,471 +3,494 (389) +44 +2,815
US Census, Connecticut Health Department reports,

10
Age Composition From 1970 to 2010, the age composition of Southington changed due to the net effect of births, deaths, net migration, longer life expectancies and natural aging. Much of the change in age composition is attributable to the natural aging of people in the “baby boom” (people born between about 1945 and about 1965). From 2010 to 2040, the age composition of Southington is expected to be heavi‐ly influenced by the continued aging of the “baby boom” generation (people born between about 1945 and about 1965). The apparent increase in people aged 55 and over in the following chart does not reflect a sudden influx of a large number of older residents. Rather, it reflects the natural aging (and longer life expectancies) of people who already live in Southington.
Changing Age Composition (1970 – 2040)
0
2,000
4,000
6,000
8,000
10,000
12,000
14,000
16,000
18,000
20,000
1970 1980 1990 2000 2010 2020 2030 2040
Ages 0 ‐ 19
Ages 20 ‐ 34
Ages 35 ‐ 54
Ages 55 +
Overall, assuming past trends continue, the number of older residents is ex‐pected to grow significantly and this will be an important factor in Southington in the future. A changing age composition can result in a changing demand for municipal and housing types.
PROJECTIONS

11
Migration Patterns By comparing the number of people in one age group in the Census to the number of people 10 years younger in the prior Census (10 years earlier) and after considering natural changes (births and deaths), the dynamics of migration in Southington can be evaluated. Since at least 1970, as can be seen from the upward columns in the following chart, net in‐migration to Southington has generally been family age adults (ages 30 to 50) and their children (ages 0 to 15). People in these age groups are probably attracted by the diverse housing options, community services / ameni‐ties, and overall quality of life in Southington. As can be seen from the downward columns in the following chart, net out‐migration generally occurs with teenagers and young adults (ages 15 to 30). People in these age groups might generally be expected to leave Southington during these years of their lives to pursue education or employment. People aged 50 and older have fluctuated between modest net in‐migration and modest net out‐migration over these four decades. Between 2000 and 2010, it appears that there was modest net in‐migration for all of the age groups above age 50.
Migration By Age Group (1970 – 2010)
12
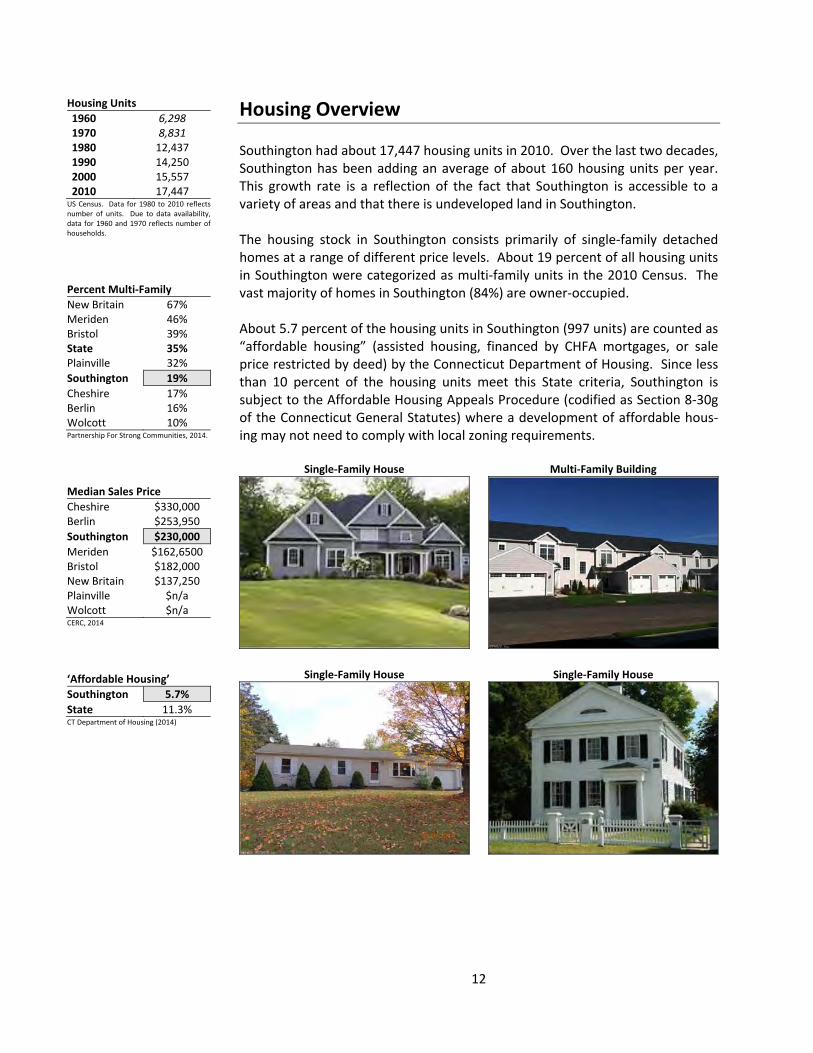
Housing Overview Southington had about 17,447 housing units in 2010. Over the last two decades, Southington has been adding an average of about 160 housing units per year. This growth rate is a reflection of the fact that Southington is accessible to a variety of areas and that there is undeveloped land in Southington. The housing stock in Southington consists primarily of single‐family detached homes at a range of different price levels. About 19 percent of all housing units in Southington were categorized as multi‐family units in the 2010 Census. The vast majority of homes in Southington (84%) are owner‐occupied. About 5.7 percent of the housing units in Southington (997 units) are counted as “affordable housing” (assisted housing, financed by CHFA mortgages, or sale price restricted by deed) by the Connecticut Department of Housing. Since less than 10 percent of the housing units meet this State criteria, Southington is subject to the Affordable Housing Appeals Procedure (codified as Section 8‐30g of the Connecticut General Statutes) where a development of affordable hous‐ing may not need to comply with local zoning requirements.
Single‐Family House Multi‐Family Building
Single‐Family House Single‐Family House
Housing Units
1960 6,298 1970 8,831 1980 12,437 1990 14,250 2000 15,557 2010 17,447
US Census. Data for 1980 to 2010 reflects number of units. Due to data availability, data for 1960 and 1970 reflects number of households.
Percent Multi‐Family
New Britain 67% Meriden 46% Bristol 39% State 35% Plainville 32%
Southington 19%
Cheshire 17% Berlin 16% Wolcott 10% Partnership For Strong Communities, 2014.
Median Sales Price
Cheshire $330,000 Berlin $253,950
Southington $230,000
Meriden $162,6500 Bristol $182,000 New Britain $137,250 Plainville $n/a Wolcott $n/a CERC, 2014
‘Affordable Housing’
Southington 5.7%
State 11.3% CT Department of Housing (2014)

13
Economic Overview A local economy is important in terms of:
providing for jobs for residents,
ensuring a range of goods and services is available for residents, and
providing tax revenue to support local services. In terms of jobs, Southington is an employment center and there are a number of jobs in the community. Southington also benefits from its location relative to other communities and metropolitan areas in terms of access to jobs and the availability of goods and services for residents. The business component of the tax base in Southington is about 13.4 percent. This is lower than the statewide average but is higher than the median Connect‐icut community.
Local Employer Local Business
Jobs In Southington
1960 7,880 1970 10,796 1980 15,260 1990 17,200 2000 16,040 2010 14,654
CT Labor Dept.
Jobs
New Britain 24,772 Bristol 21,592 Meriden 21,549 Cheshire 15,431
Southington 14,833
Berlin 11,623 Plainville 9,277 Wolcott 2,966 CERC, 2014
Median Household Income
Cheshire $110,587 Berlin $85,735 Wolcott $80,655
Southington $78,668
Plainville $61,766 Bristol $58,814 Meriden $53,831 New Britain $39,898 CERC, 2014

14
Land Use Pattern According to the Town’s geographic information system, Southington contains approximately 23,239 acres of land. As can be seen from the following map, most of the land is used for single family residential uses (light yellow color).

15
Zoning Pattern In Southington, according to the Town’s geographic information system:
about 75 percent is zoned for single‐family residential development,
about 8 percent is zoned for two‐family / multi‐family development,
about 7 percent of Southington is zoned for business development, and
about 10 percent is zoned for industrial development.

16
Fiscal Overview Information reflecting the fiscal circumstances of Southington and surrounding communities are presented in the sidebar. On a per capita basis, Southington has a strong tax base and a comparable tax levy. The equalized mill rate (taxes as a percent of market value) is the second lowest among nearby communities). Past studies of communities like Southington have found that residential devel‐opment typically requires more in service costs than it provides in tax revenue.
Tax Base Community Services
Per Capita Tax Base
Berlin $158,906 Cheshire $136,761
Southington $130,644
Wolcott $120,192 Plainville $109,225 Bristol $92,351 Meriden $76,437 New Britain $51,934 CT‐OPM data reflecting the estimated full market value of all taxable property in a municipality (2014)
Per Capita Tax Levy
Berlin $2,873 Cheshire $2,608 Southington $2,315 Plainville $2,269 Bristol $1,942 Wolcott $1,880 Meriden $1,811 New Britain $1,505 CT‐OPM, 2014
Equalized Mill Rate
New Britain 28.33 Meriden 23.71 Bristol 20.94 Plainville 20.93 Cheshire 18.99 Berlin 17.98
Southington 17.57
Wolcott 15.49 CT‐OPM, 2014

17
PLANNING ISSUES
3
Overview Early in the planning process, exercises were conducted to understand issues of concern to the community:
A discussion of issues with the POCD Update Committee,
A discussion of issues with the Planning and Zoning Commission,
Input from members of other boards and commissions,
Input from Town department heads, and
A public meeting to solicit input and listen to Southington residents.

18
“Prouds” and “Sorrys” At a public meeting early in the planning process, residents were asked to place a green dot on a map to identify things in Southington they were proud of. On another map, they were asked to place a red dot to identify things in Southing‐ton they were sorry about. Residents wrote their "prouds" and "sorrys" on cards that were collected during the meeting. In the experience of the consultant who assisted with the meeting, “prouds” tend to represent things residents would like to encourage in the community, and “sorrys” represent things residents would like to discourage in the commu‐nity. A through listing of the "prouds" and "sorrys" is contained in a discussion booklet prepared for the POCD Update Committee as part of the process.
“Prouds” Map “Sorrys” Map
“Prouds” Themes “Sorrys” Themes
• Community Facilities – participants indicated they wereproud of the schools and other facilities and services thatmeet community needs
• Open Space – participants indicated they were proud of theopen spaces and parks in Southington
• Community Character – participants indicated they wereproud of the overall character of the community (people,places, events) that contributed to their quality of life
• Community Character – participants indicated they were sorry about things they felt detracted from the overall character of Southington
• Development – participants indicated they were sorry about overbuilding (residential and business)
• Natural Resources – participants indicated they were sorry about threats to natural resources

19
“Planning Points” People attending the public meeting were given 50 “planning points” to allocate among 12 boxes representing topics typically addressed as part of a Plan of Conservation and Development. Residents were asked to place the five plan‐ning point bills (one bill representing 20 points, two bills representing 10 points each, and two bills representing 5 points each) in the boxes to reflect topics they felt were important for Southington to address as part of the planning process.
20
points 10
points 5
points Total Points
Conservation Issues 1,010
Open Space 180 280 40 500
Natural Resources 220 60 65 345
Community Character 20 40 50 110
Historic Resources 20 0 35 55
Development Issues 335
Residential Development 40 60 10 110
Community Structure 60 20 10 90
Business Development 40 30 20 90
Housing Diversity 20 10 15 45
Infrastructure Issues 600
Community Facilities 120 50 40 210
Traffic and Circulation 20 110 20 150
Walking / Biking / Bus 20 50 50 120
Water / Sewer / Utilities 40 40 40 120
Totals 1,945
In the experience of the consultant who assisted with the meeting, the “plan‐ning points” exercise tends to identify issues which most resonate with the people who participate. Since it is an independent exercise, the results are not dominated by the loudest voices in the room or the people who speak first.

20
Key Issues Based on all of the exercises and surveys, the following themes emerged as being important issues for Southington to consider as part of preparing the Plan of Conservation and Development.
CONSERVATION‐RELATED ISSUES – Things residents would like to protect or preserve in Southington
Preserve open space
Protect water quality / natural resources
Maintain Southington’s character / preserve scenic views
DEVELOPMENT‐RELATED ISSUES – How residents would like to address future growth or change in Southington
Manage residential development o Amount / pace / type of growth o Increase housing diversity (seniors, affordable, etc.)
Enhance Downtown and Plantsville
Promote business development / grow the tax base
INFRASTRUCTURE‐RELATED ISSUES – Services or facilities that residents would like to have available to support the overall quality of life in Southington
Maintain/ enhance the level of community facilities and services
Address traffic circulation and congestion
Encourage walking and biking
Provide adequate utility services for community needs