adoption and usage of mobile payment systems by consumers
TRANSCRIPT

i
Adoption and Usage of Mobile Payment
Systems by Consumers and Merchants
Doctoral Thesis Submitted
In partial fulfilment of the requirements for the award of
the degree of
DOCTOR OF PHILOSOPHY
In
MANAGEMENT
By
SONAL
ID No.15JU11400013
Under the Supervision of
Dr.Kirti Ranjan Swain Dr. Vishal Kumar
(Research Co-Supervisor) (Research Supervisor)
Associate Professor Assistant Professor
IIPM, Rourkela ICFAI University
Odisha Jharkhand, Ranchi
ICFAI UNIVERSITY JHARKHAND
RANCHI March, 2021

ii
THESIS COMPLETION CERTIFICATE
This is to certify that the thesis entitled “Adoption and Usage of Mobile
Payment Systems by Consumers and Merchants” submitted by Sonal in
partial fulfilment of the requirements for the award of Degree of Philosophy is
an original work carried out by her under our joint guidance. It is certified that
work has not been submitted anywhere else for the award of any other
diploma or degree of this or any other university. We also certify that she
complied with the plagiarism guidelines of the university.
Dr.Kirti Ranjan Swain Dr.Vishal Kumar
(Research Co-Supervisor) (Research Supervisor)
Associate Professor Assistant Professor
IIPM Rourkela ICFAI University Jharkhand
Odisha Ranchi

iii
DECLARATION OF AUTHORSHIP
I declare that this research thesis entitled “Adoption and Usage of Mobile
Payment Systems by Consumers and Merchants” submitted by me in
partial fulfilment of the requirements for the award of the degree of Doctor of
Philosophy by ICFAI University, Jharkhand, Ranchi is my own work. It
contains no material previously published or written by another person nor
material which has been accepted for the award of any other degree or
diploma of the university or other institute of higher learning, except where
due acknowledge has been made in the text. I further state that I complied with
the plagiarism guidelines of the University, while preparing the thesis.
Sonal
ID No. 15JU11400013
Address:
Anu Kunj,
Singhmore
PO- Hatia
Ranchi- 834003
Place: Ranchi
Dated: 23rd March, 2021

iv
PLAGIARISM CERTIFICATE

v
ACKNOWLEDGEMENT
This journey of my research work would have been impossible without the
blessing of my beloved god and support and understanding of a number of
people whom I would like to express my gratitude to as it was all their
encouragement and help that made me complete this milestone and kept me
motivated through out even after the hiccups during the process.
I am indebted to the Research Board of the ICFAI University, Jharkhand,
headed by Honorable Vice-Chancellor Prof. ORS Rao and its members Dr
Hari Haran and Dr. Satyendra Kishore of University that contributed in
enabling a quality research by way of their suggestions in the various half-
yearly progress reviews & regular reviews with their critical evaluations. I
would also like to express my gratitude to Dr B M Singh for his support
during the start of my PhD studies.
I would like to express my deepest gratitude to my research supervisor Dr
Vishal Kumar who has been an integral part of my research journey by
constantly motivating, guiding and showing the right path for my work. I
would also like to extend my deepest appreciation to my research co-
supervisor Dr. Kirti Ranjan Swain for his valuable insights on the topic and
showing belief in my work. It was a privilege to work under such supporting,
inspiring and motivating supervisor and co supervisor.
I am grateful to Dr. Barik for his assistance whenever during my research
work. I would like to extend my gratitude to Dr S C Swain and Dr. Rumna
Bhattacharya for their valuable advices and counseling at different stage of my
research process. I am deeply obliged to Dr M Rajkumar for his assistance and
enlightenement in making my research work finer. I would also like to extend
my gratitude to Dr Sudipta Majumdar for his help during my PhD journey. I
am thankful to Dr M. Jha and Dr. Pallavi for their support and advice in my
research that helped me make my research better.

vi
Last but not the least I pay my deepest gratitude to my family and friends for
this research would not have been completed without their contribution in this
journey.
Sonal
Place: Ranchi
Date: 23rd March, 2021

vii
ABSTRACT
Growth in Indian economy and evolving standard of living of Indians have
welcomed room for new technologies in the lives of Indians, leading to the
evolution of plethora of technology based solutions. Smartphone is one such
multifarious technological solution used for connecting with people to
performing financial activities, studying to gaming and shopping. Mobile
payments is the recent trend which intensified lately due to collective affairs
like government promoting digital India through awareness programmes,
demonetization, financial inclusion through JDY, UPI launch, telecom growth
with 4G launch and affordable internet facility, economical handsets, growth
of m- commerce, new entrants in the m-payment industry and most
importantly revamp in the lifestyle of people craving for viable solutions for
everything. This is evident as the transaction of mobile payments has
witnessed sustained growth in terms of volume as well as value in the last five
years as per the RBI data which also indicates involvements by both
merchants and consumers in the use of mobile payments system.
Whenever any new technology is introduced in the country usually advanced
cities or metropolitan cities are the one to adopt it more quickly relatively to
other cities and towns. So, this study takes an opportunity to study the
adoption and usage of mobile payments in tier II city Ranchi comparing it
with a tier I city Kolkata. Plethora of research on the mobile payment systems
have been done in several countries but none have focused on comparison of
actual usage level in two or more cities of same country. So, this study tries to
find the level of awareness and actual usage of mobile payment systems in two
varied cities of different states within the same country. In addition hardly
researchers have studied merchants and consumer usage of mobile payments
together, therefore this work of study focuses on dual aspects - merchants and
consumers. The study also tries to find the impact of the independent variables
and demographic variables on the use of mobile payment systems. Among the

viii
other variables this study tried to find the impact of government initiatives on
the use of mobile payments as the current government played an important
role in creating awareness among the consumers and merchants to use and
accept mobile payments and other digital payments to boost Indian economy.
To study the objectives proper research hypothesis was formulated and tested
using suitable statistical analysis tools using SPSS (version 23). Different
statistical tools used in this research study are - cronbach alpha, factor
analysis, regression analysis, independent sample t-test, one way anova, chi-
square, pie charts, tabulation and frequency.
The findings of the analysis revealed high level of awareness among
merchants and consumers of both Kolkata and Ranchi city. The results
revealed that there was no association between the awareness about mobile
payment system and the demographic variables- city, gender and qualification
whereas demographic variables, occupation, income and personal
innovativeness have a significant relationship with the awareness and use of
mobile payment system for consumers. The results of merchants revealed no
association between the awareness about mobile payment system and the
demographic variables, while association was found between city,
qualification, and personal innovativeness and use of mobile payment system
for merchants. Results from one-way Anova revealed that except city and
gender no variables had significant impact the continued use of mobile
payments for consumer.Whereas for merchant, except personal innovativeness
and technology inclination no other demographic factors showed significant
impact on the continued use of mobile payments. All the other variables
significantly impact the continued use of mobile payments for both customer
and merchants.
This research contributes to the existing research knowledge in Indian context
as it provides the perspectives to why consumers and merchants are actually
using or not using the mobile payments for their daiy payments.

ix
TABLE OF CONTENTS
PART 1
Thesis Completion Certificate ................................................................................ ii
Declaration of Authorship ...................................................................................... iii
Plagiarism Certificate ............................................................................................. iv
Acknowledgement ................................................................................................. v
Abstract ................................................................................................................. vii
Table of contents .................................................................................................... ix
List of Tables ......................................................................................................... xvii
List of Figures ........................................................................................................ xxii
List of Abbreviations ............................................................................................. xxiii
PART 2
CHAPTER 1: INTRODUCTION ........................................................................ 1
1.1 Overview .................................. . .................................................................... 2
1.1.1 Brief History of Currency and Payment Methods ........................................... 5
1.1.2 Mobile Payment and Mobile Payment Industry at a Glance ........................... 6
1.1.2.1 Mobile Payment Definition ........................................................................ 6
1.1.2.2 Mobile Payment Ecosystem ........................................................................ 9
1.1.2.3 Mobile Payment Process ............................................................................. 13
1.1.2.4 Attributes of Mobile Payments ................................................................... 14
1.1.2.5 Mobile payment technologies, types and methods....................................... 14
1.1.2.5.1 Proximity payment .................................................................................. 15
1.1.2.5.2 Proximity and remote payment ................................................................ 16
1.1.2.5.3 Remote payments .................................................................................... 17
1.1.3 Mobile Payment Industry and Key Contributing Elements: Indian
Scenario ................................................................................................................. 18
1.1.3.1 Mobile Payment Scenario in India .............................................................. 18
1.1.3.2 Mobile Payment Players in India ................................................................ 19
1.1.4 Key Contributing Elements ........................................................................... 22
1.1.4.1 Telecom Scenario ....................................................................................... 22
1.1.4.2 Internet Usage Scenario in India ................................................................. 23
1.1.4.3 Mobile Commerce Scenario in India ........................................................... 24
1.1.4.4 Government Initiatives ............................................................................... 25
1.1.4.5 Increase in Digital Transactions .................................................................. 26
1.2 Motivation for the Study .................................................................................. 28
1.3 Relevance of the Topic ..................................................................................... 31
1.4 Scope of the Study .......................................................................................... 32
1.5 Thesis Outline .................................................................................................. 33

x
1.6 Summary .......................................................................................................... 34
CHAPTER 2: REVIEW OF LITERATURE ...................................................... 35
2.1 Overview ......................................................................................................... 36
2.2 Literature Review of Mobile payment ............................................................. 36
2.2.1 Historical Context of Mobile Payment Systems ............................................. 36
2.2.2 Literature review on Consumer Adoption ...................................................... 39
2.2.2.1 Consumer Adoption of M-Payment in Various Countries
Determining Factors ............................................................................................... 41
2.2.2.2 Consumer Adoption of M-Payments’ Different Technology ....................... 53
2.2.3 Merchant Adoption of Mobile Payment: A Literature Review ....................... 59
2.2.4 Literature review on Mobile Payment Research: Indian Context .................... 63
2.2.5 Literature review on Review Papers of Mobile Payment Systems .................. 68
2.2.6 Theories Used in Adoption Research ............................................................. 71
2.2.7 Variables Used in Mobile Payment Research ................................................. 72
2.2.8 Findings from Previous Research Regarding Independent
Variables ................................................................................................................ 74
2.2.9 Brief Summary of Research Work ................................................................. 76
2.3 Research Gap ................................................................................................... 80
2.3.1 Major Research Gaps .................................................................................... 80
2.3.2 Research Gaps Considered for This Research ................................................ 81
2.4 Summary .......................................................................................................... 81
CHAPTER 3: RESEARCH METHODOLOGY ................................................ 83
3.1 Overview ......................................................................................................... 84
3.2 Research Questions .......................................................................................... 85
3.3 Statement of the Problem ................................................................................ 85
3.4 Objective of the Study ..................................................................................... 86
3.5 Research Hypothesis Formulation ................................................................... 87
3.5.1 Definition of Hypothesis ............................................................................... 87
3.5.1.1 Hypothesis for Consumer ........................................................................... 87
3.5.1.2 Hypothesis for Merchant ............................................................................ 93
3.6 Research Design .............................................................................................. 97
3.6.1Research Process ............................................................................................ 98
3.6.2 Research Approach ....................................................................................... 99
3.6.3 Research Method ........................................................................................... 100
3.7 Population ........................................................................................................ 101
3.7.1 Sampling Design ........................................................................................... 101
3.7.2 Sampling Unit and Frame .............................................................................. 102
3.7.3 Sampling Technique ...................................................................................... 102

xi
3.7.4 Sample Size ................................................................................................... 103
3.8 Data Collection ................................................................................................ 104
3.8.1 Data Collection Method and Technique ......................................................... 104
3.8.2 Research Data Collection Instrument ............................................................. 105
3.9 Pilot Survey ..................................................................................................... 106
3.9.1 Results from Pilot Survey .............................................................................. 111
3.9.2 Final Survey Questionnaire ........................................................................... 111
3.10 Summary ........................................................................................................ 112
CHAPTER 4: DATA ANALYSIS AND INTERPRETATION .......................... 113
4.1Introduction....................................................................................................... 114
4.2 Consumer Analysis and Interpretations ............................................................ 114
4.2.1 Demographic Profile of the Respondents ...................................................... 114
4.2.2 Comparison of Level of Awareness, Adoption and Usage of the
Mobile Payment Systems among the Consumers of Ranchi and
Kolkata .................................................................................................................. 117
4.2.2.1 Awareness about the Mobile Payment Systems among
Consumer............................................................................................................... 117
4.2.2.2 Installation of mobile payment applications by the consumer ...................... 119
4.2.2.3 Use of mobile payment systems by consumer ............................................. 120
4.2.3 Non user consumer analysis .......................................................................... 121
4.2.3.1 Awareness and installation of mobile payment systems by non
users ...................................................................................................................... 121
4.2.3.2 Reasons for not using mobile payment systems .......................................... 122
4.2.3.3 Reasons for abandoning mobile payment systems ....................................... 124
4.2.3.4 Possibility of using mobile payment systems in future ................................ 125
4.2.4 User Consumer Analysis ............................................................................... 126
4.2.4.1 Ranking of the payment options preferred by the consumers....................... 126
4.2.4.2 Span of using the mobile payment system by consumers ............................ 127
4.2.4.3 Frequency of using the mobile payment system .......................................... 128
4.2.4.4 Expenditure made through mobile payment systems ................................... 130
4.2.4.5 Loading of balance in consumers mobile wallet .......................................... 131
4.2.4.6 Mobile payment applications installed by consumer ................................... 133
4.2.4.7 Purposes for which mobile payment system is used .................................... 134
4.2.4.8 Feel it is risky to use mobile payment systems ............................................ 136
4.2.4.9 Feeling that merchant may misuse the financial data while
using mobile payment systems ............................................................................... 137
4.2.4.10 Experience of merchant discouragement ................................................... 138
4.2.4.11 Perception about mobile payment in their city .......................................... 139
4.2.4.12 Problems faced by while using mobile payment systems........................... 140
xii
4.2.5 Results of Factor Analysis ............................................................................ 141
4.2.5.1 KMO Bartlett's test results .......................................................................... 142
4.2.5.2 Exploratory Factor Analysis ....................................................................... 142
4.2.5.3 Reliability Analysis .................................................................................... 145
4.2.6 Hypothesis testing for finding association between demographic
variables and awareness about the mobile payment systems ................................... 147
4.2.6.1 Association between City and Awareness about Mobile
Payment Systems ................................................................................................... 147
4.2.6.2 Association between Gender and Awareness about Mobile
Payment Systems ................................................................................................... 149
4.2.6.3 Association between Age and Awareness about Mobile
Payment Systems .................................................................................................. 152
4.2.6.4 Association between Educational Qualification and Awareness
about Mobile Payment Systems.............................................................................. 155
4.2.6.5 Association between Occupation and Awareness about Mobile
Payment Systems ................................................................................................... 158
4.2.6.6 Association between Income and Awareness about Mobile
Payment Systems ................................................................................................... 163
4.2.6.7 Association between Personal Innovativeness and Awareness
about Mobile Payment Systems.............................................................................. 166
4.2.7 Hypothesis testing for finding association between demographic
variables and use of the mobile payment systems ................................................... 170
4.2.7.1 Association between City and Use of Mobile Payment Systems ................. 170
4.2.7.2 Association between Gender and Use of Mobile Payment
Systems.................................................................................................................. 172
4.2.7.3 Association between Age and Use of Mobile Payment Systems .................. 175
4.2.7.4 Association between Educational Qualification and Use of
Mobile Payment Systems ....................................................................................... 178
4.2.7.5 Association between Occupation and Use of Mobile Payment
Systems.................................................................................................................. 182
4.2.7.6 Association between Income and Use of Mobile Payment
Systems.................................................................................................................. 187
4.2.7.7 Association between Personal innovativeness and Use of
Mobile Payment Systems ....................................................................................... 191
4.2.7.8 Association between Awareness and Use of Mobile Payment
Systems.................................................................................................................. 195
4.2.8 Hypothesis testing for demographic factors affecting continued
use of the mobile payment systems ........................................................................ 196
4.2.8.1 Impact of City on Continued use of Mobile Payment Systems .................... 196
4.2.8.2 Impact of Gender on Continued use of Mobile Payment
Systems.................................................................................................................. 197
4.2.8.3 Impact of Age on Continued use of Mobile Payment Systems .................... 199

xiii
4.2.8.4 Impact of Educational qualification on Continued use of
Mobile Payment Systems ....................................................................................... 200
4.2.8.5 Impact of Occupation on Continued use of Mobile Payment
Systems.................................................................................................................. 202
4.2.8.6 Impact of Income on Continued use of Mobile Payment
Systems.................................................................................................................. 203
4.2.8.7 Impact of Personal innovativeness on Continued use of Mobile
Payment Systems ................................................................................................... 205
4.2.9 Hypothesis testing for finding the impact of the other factors on
the continued use of the mobile payment systems through regression ..................... 207
4.3 Merchant Analysis ........................................................................................... 210
4.3.1 Demographic profile of the respondents ........................................................ 210
4.3.1.1 Business profile .......................................................................................... 213
4.3.2 Comparison of level of awareness, adoption and usage pattern
among merchants of Ranchi and Kolkata city ......................................................... 214
4.3.2.1 Awareness about mobile payment system among merchants ....................... 214
4.3.2.2 Use of mobile payment by the merchants .................................................... 216
4.3.3 Non user merchant analysis ........................................................................... 218
4.3.3.1 Awareness and installation among non user ................................................ 218
4.3.3.2 Reason for not using Mobile Payment Systems ........................................... 219
4.3.3.3 Consumer’s demand when Mobile Payments Systems is not
accepted by the Merchant ....................................................................................... 220
4.3.3.4 Reason for abandoning Mobile Payment Systems ....................................... 221
4.3.4 User Merchant Analysis ................................................................................ 222
4.3.4.1 Preference in payment option accepted by merchants.................................. 222
4.3.4.2 Mobile payment application installed by merchants .................................. 223
4.3.4.3 Purposes for which mobile payment system is used by
merchants ............................................................................................................... 225
4.3.4.4 Feeling of risk while using mobile payment systems ................................... 226
4.3.4.5 Encouragement by merchants for using mobile payment
systems .................................................................................................................. 227
4.3.4.6 Mobile payment scenario in both the cities ................................................. 228
4.3.5 Problems faced by merchants while operating mobile payment
systems .................................................................................................................. 229
4.3.6 Results of Factor analysis .............................................................................. 230
4.3.6.1 KMO Bartlett's test results .......................................................................... 231
4.3.6.2 Exploratory Factor Analysis ....................................................................... 231
4.3.7 Reliability Analysis ....................................................................................... 234

xiv
4.3.8 Hypothesis testing for finding association between demographic
variables and awareness about mobile payment systems among
merchant ................................................................................................................ 236
4.3.8.1 Association between City and Awareness about Mobile
Payment Systems ................................................................................................... 236
4.3.8.2 Association between Gender and Awareness about Mobile
Payment Systems ................................................................................................... 239
4.3.8.3 Association between Age and Awareness about Mobile
Payment Systems ................................................................................................... 241
4.3.8.4 Association between Educational qualification and Awareness
about Mobile Payment Systems.............................................................................. 244
4.3.8.5 Association between Personal innovativeness and Awareness
about Mobile Payment Systems.............................................................................. 248
4.3.8.6 Association between Technology inclination and Awareness
about Mobile Payment Systems.............................................................................. 252
4.3.9 Hypothesis testing for finding association between demographic
variables and acceptance of the mobile payment systems by merchant ................... 255
4.3.9.1 Association between City and Acceptance of Mobile Payment
Systems.................................................................................................................. 255
4.3.9.2 Association between Gender and Acceptance of Mobile
Payment Systems ................................................................................................... 257
4.3.9.3 Association between Age and Acceptance of Mobile Payment
Systems.................................................................................................................. 260
4.3.9.4 Association between Educational qualification and Acceptance
of Mobile Payment Systems ................................................................................... 265
4.3.9.5 Association between Personal innovativeness and Acceptance
of Mobile Payment Systems ................................................................................... 270
4.3.9.6 Association between Technology inclination and Acceptance of
Mobile Payment Systems ....................................................................................... 275
4.3.9.7 Association between Awareness and Acceptance of Mobile
Payment Systems ................................................................................................... 278
4.3.10 Hypothesis testing for finding the impact of the demographic
factors on the continued use of the mobile payment systems .................................. 278
4.3.10.1 Impact of City on Continued use of Mobile payment systems ................... 278
4.3.10.2 Impact of Gender on Continued use of Mobile payment
systems .................................................................................................................. 280
4.3.10.3 Impact of Age on Continued use of Mobile payment systems ................... 281
4.3.10.4 Impact of Educational qualification on Continued use of
Mobile payment systems ........................................................................................ 283
4.3.10.5 Impact of Personal innovativeness on Continued use of
Mobile payment systems ........................................................................................ 284
4.3.10.6 Impact of Technology inclination on Continued use of Mobile
payment systems .................................................................................................... 286
xv
4.3.10.7 Hypothesis testing for finding the impact of other factors on
the continued use of the mobile payment systems ................................................... 288
4.4 Summary .......................................................................................................... 291
CHAPTER 5: RESULT, DISCUSSIONS & CONCLUSIONS .......................... 292
5.1Introduction....................................................................................................... 293
5.2 Results & Discussions ...................................................................................... 293
5.2.1Results from objective one ............................................................................. 294
5.2.2 Results from objective two ............................................................................ 296
5.2.2.1 Chi-square for consumers ........................................................................... 296
5.2.2.2 Chi-square for merchants ............................................................................ 298
5.2.2.3 Results from independent sample T-test and ANOVA for
consumers ............................................................................................................. 299
5.2.2.4 Results from independent sample T-test and ANOVA for
merchants ............................................................................................................. 301
5.2.3 Results from objective three .......................................................................... 302
5.2.4 Results from objective four............................................................................ 303
5.2.5 Reasons of the non users for not using mobile payment system ..................... 304
5.2.6 Summary of Findings and Comparison of result with the previous
research findings .................................................................................................... 305
5.2.6.1 Summary of findings for Consumers and Merchants ................................... 305
5.2.6.2 Comparison of result with the previous literature findings .......................... 306
5.3 Managerial Implications and Suggestions ........................................................ 307
5.3.1 Implications for the Service Providers ........................................................... 309
5.3.2 Implications for Government, Regulatory bodies and Policy
makers ................................................................................................................... 310
5.3.3 Implications for Merchants ............................................................................ 310
5.3.4 Implications for Academic Institution ............................................................ 310
5.3.5 Implications for Researchers.......................................................................... 311
5.4 Limitations & Future Scope.............................................................................. 313
5.4.1Limitations of the research ............................................................................ 313
5.4.2 Future Recommendations .............................................................................. 314
5.5 Conclusion ....................................................................................................... 315
BIBLIOGRAPHY ................................................................................................ 319
APPENDICES ...................................................................................................... 363
Questionnaire for Consumers ................................................................................. 370
Questionnaire for Merchants .................................................................................. 375
PUBLICATION AND PRESENTATION ........................................................... 379

xvi
List of Publication .................................................................................................. 379
List of Presentation in Conferences and Seminars .................................................. 379

xvii
PART 3
List of Tables
Table 1.1: Expectations of ecosystem players ........................................................ 12
Table 1.2: Major mobile payments players in India ................................................ 20
Table 1.3: Telecom sector subscriber base distribution ........................................... 23
Table 1.4: Value and volume of digital payments ................................................... 26
Table 2.1: Brief summary of research work ............................................................ 76
Table 3.1: Data collection from area of Ranchi and Kolkata .................................. 102
Table 3.2: Questionnaire of consumer pilot survey ................................................. 107
Table 3.3: Questionnaire of merchant pilot survey .................................................. 108
Table 3.4: Cronbach’s value for consumers’ pilot survey ....................................... 111
Table 3.5: Cronbach’s value for merchants’ pilot survey ........................................ 111
Table 4.1: Demographic profile of consumers ........................................................ 114
Table 4.2: Awareness among consumers about mobile payment ............................. 117
Table 4.3: Installation of mobile payment applications by consumer ...................... 119
Table 4.4: Use of mobile payment systems by consumer ........................................ 120
Table 4.5: Awareness and installation of mobile payment systems by
non users ................................................................................................................ 121
Table 4.6: Reasons for not using mobile payment................................................... 122
Table 4.7: Reasons for not abandoning mobile payment ......................................... 124
Table 4.8: Possibility of using mobile payment systems ......................................... 125
Table 4.9: Ranking of payment options among consumers ..................................... 126
Table 4.10: Span of using the mobile payment systems .......................................... 127
Table 4.11: Frequency of using the mobile payment system ................................... 129
Table 4.12: Expenditure made through mobile payment systems by
consumers .............................................................................................................. 130
Table 4.13: Money balance loaded in mobile payment wallet by
consumers .............................................................................................................. 132
Table 4.14: Mobile payment application installed by consumers ............................ 133
Table 4.15: Purpose for which mobile payment system is used by
consumers .............................................................................................................. 135
Table 4.16: Feeling of risk while using mobile payment by consumers ................... 136
Table 4.17: Feeling of misuse of their credentials by merchants while
using mobile payment system. ................................................................................ 137
Table 4.18: Experience of merchant discouragement .............................................. 138
Table 4.19: Problems faced while use of mobile payment by
consumers .............................................................................................................. 140
Table 4.20: KMO Bartlett's test of consumers ....................................................... 141
Table 4.21: Total variance test of consumers .......................................................... 142
Table 4.22: Rotated component matrix of consumers ............................................. 143
Table 4.23: Cronbach’s alpha value of consumer respondents ................................ 145

xviii
Table 4.24: Cross tabulation city’s influence on awareness about
mobile payment systems ........................................................................................ 147
Table 4.25: Chi-square test for city’s influence on awareness ................................. 148
Table 4.26: Cross tabulation for gender’s influence on awareness .......................... 149
Table 4.27: Chi-square test for gender’s influence on awareness ............................ 151
Table 4.28: Cross tabulation for age’s influence on awareness ............................... 152
Table 4.29: Chi-square test for age’s influence on awareness ................................. 154
Table 4.30: Cross tabulation for qualification’s influence on awareness ................. 155
Table 4.31: Chi-square test for qualification’s influence on awareness ................... 157
Table 4.32: Cross tabulation for occupation’s influence on awareness .................... 158
Table 4.33: Cross tabulation for occupation’s influence on awareness .................... 162
Table 4.34: Cross tabulation for income’s influence on awareness ......................... 163
Table 4.35: Chi-square test for income’s influence on awareness ........................... 165
Table 4.36: Cross tabulation personal innovation’s influence on
awareness ............................................................................................................... 166
Table 4.37: Chi-square test for personal innovation’s influence on
awareness ............................................................................................................... 169
Table 4.38: Cross tabulation for use and city .......................................................... 170
Table 4.39: Chi-square test for use and city ............................................................ 171
Table 4.40: Cross tabulation for use and gender ..................................................... 172
Table 4.41: Chi-square test for use and gender ....................................................... 174
Table 4.42: Cross tabulation for use and age .......................................................... 175
Table 4.43: Chi-square test for use and age ............................................................ 177
Table 4.44: Cross tabulation for use and educational qualification .......................... 178
Table 4.45: Chi-square test for use and education ................................................... 181
Table 4.46: Cross tabulation for use and occupation ............................................... 182
Table 4.47: Chi-square test for use and occupation ................................................. 186
Table 4.48: Cross tabulation for use and monthly income ....................................... 187
Table 4.49: Chi-square test for use and monthly income ......................................... 190
Table 4.50: Cross tabulation for use and personal innovativeness ........................... 191
Table 4.51: Chi-square test for use and personal innovativeness ............................. 194
Table 4.52: Chi-square test for awareness and use .................................................. 195
Table 4.53: Group Statistics of consumers’ city ...................................................... 196
Table 4.54: T-test analysis for consumer respondents’ city ..................................... 197
Table 4.55: Group Statistics of consumers’ gender ................................................. 198
Table 4.56: T-test analysis for consumer respondents’ gender ................................ 198
Table 4.57: Group Statistics of consumers’ age ...................................................... 199
Table 4.58: Test of Homogeneity of Variances ....................................................... 199
Table 4.59: One way ANOVA analysis for consumer respondents’ age .................. 200
Table 4.60: Descriptive of consumers’ educational qualification ............................ 201
Table 4.61: Test of Homogeneity of Variances ....................................................... 201
Table 4.62: One way ANOVA analysis for consumer respondents’
educational qualification ........................................................................................ 201
Table 4.63: Group Statistics of consumers’ occupation........................................... 202
Table 4.64: Test of Homogeneity of Variances ....................................................... 203

xix
Table 4.65: One way ANOVA analysis for consumer respondents’
occupation.............................................................................................................. 203
Table 4.66: Group Statistics of consumers’ income ................................................ 204
Table 4.67: Test of Homogeneity of Variances ....................................................... 204
Table 4.68: One way ANOVA analysis for consumer respondents’
income. .................................................................................................................. 204
Table 4.69: Group Statistics of consumers’ personal innovativeness....................... 205
Table 4.70: Test of Homogeneity of Variances ....................................................... 206
Table 4.71: One way ANOVA analysis for consumer respondents’
personal innovation ................................................................................................ 206
Table 4.72: Correlation of all independent and dependent variables........................ 208
Table 4.73: Model summary ................................................................................... 209
Table 4.74: ANOVA test ........................................................................................ 209
Table 4.75: Coefficients ......................................................................................... 210
Table 4.76: Demographic profile of merchants ....................................................... 210
Table 4.77: Business profile of merchants .............................................................. 213
Table 4.78: Awareness among consumers about mobile payment ........................... 214
Table 4.79: Installation of mobile payment applications by merchants ................... 215
Table 4.80: Use of mobile payment systems by consumer ...................................... 216
Table 4.81: Awareness and installation among by non user .................................... 217
Table 4.82: Reason for not using mobile payment system....................................... 219
Table 4.83: Consumer demand when Mobile Payments Systems is not
accepted ................................................................................................................. 220
Table 4.84: Reason for abandoning mobile payment system ................................... 221
Table 4.85: Payment preference by merchants ........................................................ 222
Table 4.86: Payment application installed by merchants ......................................... 223
Table 4.87: Purpose of use of mobile payment by merchants .................................. 225
Table 4.88: Risk feeling in use of mobile payment by merchants ............................ 226
Table 4.89: Encouragement to customers for use of mobile payment ...................... 227
Table 4.90: Problems in use of mobile payment by merchants ................................ 229
Table 4.91: KMO Bartlett’s test of merchants ........................................................ 231
Table 4.92: Total variance test of merchants ........................................................... 231
Table 4.93: Rotated component matrix of merchants .............................................. 233
Table 4.94: Cronbach’s alpha value of merchant responses .................................... 234
Table 4.95: Cross tabulation for awareness and city ............................................... 236
Table 4.96: Chi square test for awareness and city .................................................. 238
Table 4.97: Cross tabulation for awareness and gender ........................................... 239
Table 4.98: Chi square test for awareness and gender ............................................. 240
Table 4.99: Group statistics of merchants’ age ....................................................... 241
Table 4.100: Cross tabulation for awareness and age .............................................. 241
Table 4.101: Chi square test for awareness and age ................................................ 243
Table 4.102: Group statistics of merchants’ educational qualification ..................... 244
Table 4.103: Cross tabulation for awareness and qualification ................................ 244
Table 4.104: Chi square test for awareness and educational
qualification ........................................................................................................... 247
Table 4.105: Group statistics of merchants’ personal innovativeness ...................... 248

xx
Table 4.106: Cross tabulation awareness and personal innovativeness .................... 248
Table 4.107: Chi square test for awareness and personal innovativeness ................. 251
Table 4.108: Independent sample test for technology inclination ............................ 252
Table 4.109: Cross tabulation awareness and technology inclination ...................... 252
Table 4.110: Chi square test for awareness and technology inclination ................... 254
Table 4.111: Cross tabulation of use and age .......................................................... 255
Table 4.112: Chi square test for use and city .......................................................... 256
Table 4.113: Cross tabulation of use and gender ..................................................... 257
Table 4.114: Chi square test for use and gender ...................................................... 259
Table 4.115: Cross tabulation of use and age .......................................................... 260
Table 4.116: Chi square test for use and age ........................................................... 264
Table 4.117: Cross tabulation use and education qualification ................................ 265
Table 4.118: Chi square test for use and educational qualification .......................... 269
Table 4.119: Cross tabulation use and personal innovativeness .............................. 270
Table 4.120: Chi square test for use and personal innovativeness ........................... 274
Table 4.121: Cross tabulation use and technology inclination ................................. 275
Table 4.122: Chi square test for use and technology inclination .............................. 277
Table 4.123: Cross tabulation awareness and acceptance ........................................ 278
Table 4.124: Group statistics for merchants’ city .................................................... 279
Table 4.125: T test for merchants’ continued use with city ..................................... 279
Table 4.126: Group statistics for merchants’ gender ............................................... 280
Table 4.127: T test for merchants’ continued use with gender ................................ 280
Table 4.128: Group statistics for merchants’ age .................................................... 281
Table 4.129: Test of Homogeneity of Variances ..................................................... 282
Table 4.130: One way ANOVA test for use and age ............................................... 282
Table 4.131: Group statistics for merchants’ educational qualification ................... 283
Table 4.132: Test of Homogeneity of Variances ..................................................... 283
Table 4.133: One way ANOVA test for use and educational
qualification ........................................................................................................... 284
Table 4.134: Group statistics for merchants’ personal innovativeness ..................... 285
Table 4.135: Test of Homogeneity of Variances ..................................................... 285
Table 4.136: One way ANOVA test for use and personal
innovativeness........................................................................................................ 285
Table 4.137: Group statistics for merchants’ technology inclination ....................... 286
Table 4.138: Test of Homogeneity of Variances ..................................................... 287
Table 4.139: One way ANOVA test for use and technology inclination .................. 287
Table 4.140: Correlation of all independent and dependent variables ...................... 288
Table 4.141: Model summary ................................................................................. 289
Table 4.142: ANOVA test ...................................................................................... 289
Table 4.143: Regression coefficients ...................................................................... 290
Table 5.1: Chi square table for consumer awareness and consumer use .................. 296
Table 5.2: Chi square table for merchant awareness and merchant use ................... 298
Table 5.3: Demographic factors affecting continued use of mobile
payment by consumers ........................................................................................... 299

xxi
Table 5.4: Demographic factors affecting continued use of mobile
payment by merchants ........................................................................................... 301
Table 5.5: Linear Regression of Consumers ........................................................... 302
Table 5.6: Linear Regression of Merchants ............................................................ 303
Table 5.7: Summary of findings ............................................................................. 305
Table 5.8: Summary of findings ............................................................................. 305
Table 5.9: Result comparison with previous literature findings for
consumers .............................................................................................................. 306
Table 5.10: Result comparison with previous literature findings for
consumers .............................................................................................................. 307

xxii
List of Figures
Figure 1.1: History of money ................................................................................. 5
Figure 1.2: Major mobile payment ecosystem players ............................................ 9
Figure 1.3: Mobile payment process ....................................................................... 13
Figure 1.4: Mobile payment types .......................................................................... 15
Figure 3.1: Flow chart of research process ............................................................. 97
Figure 3.2: Flow chart of sampling design .............................................................. 100
Figure 4.1: Awareness among consumers about the mobile payment
systems .................................................................................................................. 118
Figure 4.2: Installation of mobile payment application by consumers ..................... 119
Figure 4.3: Use of mobile payment systems by consumer ....................................... 120
Figure 4.4: Awareness and installation by non users ............................................... 121
Figure 4.5: Reason for not using mobile payment systems by consumer ................. 123
Figure 4.6: Reason for abandoning mobile payment systems by
consumer ............................................................................................................... 124
Figure 4.7: Possibility of using mobile payment by consumer ................................ 125
Figure 4.7: Possibility of using mobile payment by consumer ................................ 125
Figure 4.8: Span of using mobile payment systems ................................................ 128
Figure 4.9: Frequency of using mobile payment by consumers ............................... 129
Figure 4.10: Expenditure made through mobile payment systems by
consumer ............................................................................................................... 131
Figure 4.11: Money balance in mobile payment wallet by consumer ...................... 132
Figure 4.12: Applications installed for mobile payment by consumers ................... 134
Figure 4.13: Purpose which mobile payment system is used by
consumers .............................................................................................................. 135
Figure 4.14: Feeling of risk while using mobile payment by consumers ................. 136
Figure 4.15: Feeling of misuse of their credentials by merchants while
using mobile payment system................................................................................. 137
Figure 4.16: Experience of merchant discouragement ............................................. 138
Figure 4.17: Perception about mobile payment in their city .................................... 139
Figure 4.18: Problems faced in using mobile payment by consumers...................... 140
Figure 4.19: Awareness about mobile payment among merchants .......................... 214
Figure 4.20: Installation of mobile payment applications ........................................ 215
Figure 4.21: Usage of mobile payment by merchants ............................................ 216
Figure 4.22: Awareness and installation among non user ........................................ 217
Figure 4.23: Reason for not using mobile payment by merchants ........................... 219
Figure 4.24: Consumer’s demand when mobile payment not accepted ................... 220
Figure 4.25: Reason for abandoning mobile payment ............................................. 221
Figure 4.26: Payment application installed by merchants........................................ 223
Figure 4.27: Purpose of use of mobile payment by merchants ................................ 225
Figure 4.28: Risk feeling in use of mobile payment by merchants .......................... 226
Figure 4.29: Encouragement for use of mobile payment by merchants ................... 227
Figure 4.30: Mobile payment scenario in Ranchi and Kolkata ................................ 228
Figure 4.31: Problems faced in use of use of mobile payment by
merchants ............................................................................................................... 229

xxiii
List of Abbreviations
AD- After Death
AEPS- Aadhar Enabled Payment System
BC- Before Christ
DG- Director General
GDP- Gross Domestic Product
GST- Goods and Service tax
IMPS- Interbank Mobile Payment System
MDR- Merchant Discount Rate
MMID- Mobile Money Identifier
MNOs- Mobile Network Operators
MNSPs- Mobile Network Service Providers
MP- Mobile payment
MPS- Mobile payment System
MPIN- Mobile banking Personal Identification number
NFC- Near Field Communication
NPCI- National Payments Corporation of India
PoS- Point of Sale
QR- Quick Response
RFID- Radio Frequency Identification
SMEs- Small & Medium Enterprises
SMS- Short Message Service
UPI- Unified Payment Interface
USSD- Unstructured Supplementary Service Data

1
CHAPTER 1:
INTRODUCTION

2
CHAPTER 1: INTRODUCTION
1.1 Overview
Smartphone, with its manifold tasking ability and portability has become the
way of life (Falke et al., 2007), providing convenience, independence and
flexibility (Sarwar & Soomro., 2013), mobility, quick access (Leung & Wei,
2000), and ubiquity (Karnouskos, 2004), to the users enhancing productivity
in all spheres of their life. Technology has revolutionized the value of
smartphone in people’s life by performing day to day activities like booking
tickets, studying, socializing, gaming, entertainment, shopping, banking
finances, bill payments (Aydin & Burnaz, 2016), person-to-person transfer,
account transfer, mobile marketing and other kinds of payments (Oliveira et
al.,2016). This multi-functionality of smartphone has revolutionized the retail
industry (Shanker et al. 2010) as consumers are willing to shop through their
smartphone (Cliquet et al., 2014). According to a survey by Economic Times
(2019), Indians spend one-third of their waking time on internet using their
smartphones. Indian smartphone market is growing exponentially as a result of
one of the largest youth population in the world (Wani & Ali, 2015). This
potential of smartphone combined with high speed internet facility has
revamped the market scenario (Mallat, 2007; CII, 2016; Shaw, 2018) driving
the marketers of all class to focus on providing all kinds of goods and services
through mobile. Today there is an app for anything one could think of. This
concurrence of internet with mobile communication, the two fastest growing
industries of this era has led to the creation of an emerging market for mobile
commerce (Islam et al., 2011) and mobile app has become efficacious
(Karnouskos, 2004) thus every businessman, big or small today are
developing mobile based solutions (Singh & Islam, 2016). The ever increasing
number of mobile phone users, as well as the fast paced evolution of mobile

3
technologies has resulted in online shopping and online banking (Shin et al,
2014; Satinder & Niharika, 2015), creating space for mobile payment systems
in the e-commerce industry (Au & Kauffman, 2008; Kumar et al., 2012;
Wasiq et al., 2016). As any m-commerce activity needs an efficient payment
settlement through mobile phone (Phonthanukitithaworn et al., 2016),
therefore mobile payment is gaining popularity globally in the area of m-
commerce (Carr, 2007).
With two third rural population and 25% of illiterate population in India
financial inclusion is a tough task. Even after government initiatives of JAM
Trinity (Jan Dhan, AADHAR & Mobile) where JDY witnessed a massive
success with an opening of 25.68 crore bank account, still 190 million adult
are unbanked lacking financial access in India. There is low penetration of
banks in rural areas as it has only 6.2 branches per 100,000 people in India,
whereas it is 14.2 branches per 100,000 in urban area (Grant Thorton, 2020).
M-payment is viewed as branchless banking (Ivatury & Mas, 2008). Brick
mortar bank opening in rural areas is a costly affair for banks, as cost of
establishing bank for lower socio-economic group will not give high returns to
the bank. According to Quartz India 2018, with 48% of inactive bank accounts
(which had no transaction in a year), India has largest number of inactive
accounts in the world. But according to the same report 66% of inactive users
have a mobile phone which could be used as an efficient mode for banking
channels. As a mobile phone can be used as a mode of banking, financial
inclusion can be achieved if power of mobile technology is utilized in the right
way. Kenya’s M-pesa launched by Safaricom is a well known example where
technology played a great role in enhancing financial inclusion (Arun and
Kamath, 2015) and today about 90% of youth has M-Pesa account in Kenya.
Digital financial inclusion will act as boon for economic boost (Ozili, 2017).
Mobile payment being a next level e-payment solution (Mallat, 2007; Carr,
2007, Islam et al., 2011) has revolutionized financial services (Ouma et al.,
2017). Mobile payment being easily and cheaply (Cracknell, 2004) reaching

4
out to the financially deprived can act as a bridge between the financially
deprived population and financial services (Resendiz, 2017) in a developing
country (like India) where people owning mobile phone supersedes the bank
account holders (Porteous, 2006), to access financial services such as money
transfer (DBT), making deposit, making payments for services and utilities,
withdrawing money.
Mobile payment is visioned to have a bright future (Au & Kauffman, 2008;
Bezhovski, 2016), as it is considered a killer app by many (Hu et al., 2008;
Ondrus et al, 2009). Many authors found that mobile payment provides
definite value to consumers and merchants (Lai & Chuah, 2010). Mobile
payment through its freedom from cash (Karnouskus & Fokus, 2004),
convenience and ubiquity (Chen & Nath, 2008; Mallat, 2007; Liebana
Cabanilas et al., 2017), is gaining global popularity (Chen & Nath, 2008). The
awareness about abilities of mobile payment services in providing economic
benefits to the society at much lower than cash and card based solutions, is
wide spreading (Arvidsson, 2014) making m- payment as a convenient life
style (Teng et al., 2018). The ability of implementing services to merchant and
consumer at the same time has made mobile payment more convenient
(Tartiana et al., 2016). Mobile payment is not mere mobilization of e-payment
(Karnouskus & Fokus, 2004) it also plays a significant role in the growth of
m- commerce (Yang et al., 2012), as it is heavily dependent on the acceptance
of mobile payment by consumers (Yang et al., 2015). Mobile payment
provides consumer with all time financial access (Mallat, 2006) through which
people can pay for anything for e.g. transportation tickets or car parking
(Begonha et al., 2002), electronic billing, digital content such as ring tones,
logos, news, music, or games (Dahlberg et al., 2007), checking bank balances
(Tiwari et al., 2007), shopping, services, fund transfer, investment and much
more (Kim et al., 2010; Singh et al., 2017). Merchant is benefitted with
acceptance of m-payment as it increases transaction speed and open new
possibilities for better implementation of business strategies through m-

5
commerce (Liébana Cabanillas et al., 2016). Despite much advantage of
mobile payment for both consumer and merchant (Dahlberg et al., 2015),
adoption rate is yet unsatisfactory (Mallat, 2006; Pousttchi et al., 2009), thus
widespread adoption of mobile payments is yet to occur (Zhou, 2014).
1.1.1 Brief History of Currency and Payment Methods
Figure 1.1 History of evolution of means of payment (Source: Luna, 2017)
The concept of money arose with the dawn of human civilization. It was
basically a medium of trade of goods between two individuals. The concept of
what can be considered as money has changed from time to time from
livestock, shells, coins, notes to now cryptocurrency. Barter system was the
stepping stone in the trade of goods which came into existence around 9000
BC. In this system, one could exchange goods among themselves with no
standard technique e.g.- A person can exchange an axe with a goat. Times
changed and then a standard item was considered as a base for purchasing
Barter (9000 BC)
Sea shell (1200 BC)
Coin (770 BC)
Paper currency (800
AD)Cheque
Credit card (1946 AD)
Mobile payment
(1998 AD)
Digital currency
(2008 AD)

6
goods. These were generally valuables found naturally like shells, special
types of stones etc. which varied from region to region. Around 700 BC, with
the development of metallurgy, precious metals such as gold and silver were
declared as money by kingdoms. Gradually kingdoms shifted towards cheaper
metals such as copper and other alloys such as bronze. Coins made of such
materials were much cost-effective to fabricate and were given the status of
value marked on it. Chinese with invention of paper around 700 A.D. have
revolutionized the system of money. Soon, the paper printed with its value and
other specific information was considered as money. It was way easier to carry
than coins and much easier to print than complex metallurgical processes of
fabricating coins. Paper notes then became popular all over the world which is
still in practice. Another paper based cheque system was launched by a British
banker in 1762 AD. This was issued by bank and was distributed among
consumers, and with valid number and signature, the cheque could be
encashed. With the launch of credit card by a bank in Brooklyn in the year
1946, plastic money came into existence. This plastic money also changed the
way payments were made as wallets started becoming cashless, and a new
sense of comfort of not carrying cash was being liked by masses. Coca Cola in
the year 1997, introduced the system of mobile payment to the world, in which
the vending machines were enabled to accept payments by sending SMS from
any mobile phone. Gradually mobile wallets came into existences that are
basically software applications loaded on mobile phone for making payments.
Many banks and other third party companies have launched. Mobile wallet has
now evolved with many other NFC and UPI technologies. Cryptocurrencies
have also attained the status of money in recent year
1.1.2 Mobile Payment and Mobile Payment Industry at a Glance
1.1.2.1 Mobile Payment Definition
Mobile payment is defined as any payment made through mobile handset
(Krueger, 2001). Van der Heijden (2002) referred mobile payment as a

7
conventional or new payment securely made by use of mobile network system
from peer to peer or business to peer. Karnouskos and Fokus (2004) have
referred mobile payment as a killer solution not just only for e-payments, but
also to intensify e-commerce and m-commerce. They defined m-payment as
any type of payment which requires a mobile device to begin, activate and/or
approve that payment. Pousttchi (2003) recognized mobile payment as
pivotal, and suggested wide acceptance of mobile payment by merchants and
consumers not keeping it limited to mobile commerce. Turowski and Pousttchi
(2004) defined mobile payment an electronic payment transaction procedure
where mobile communication technique is employed by the player in
coexistence with mobile device for the completion of payment through
initiation, authorization or realization of payment. Zhong (2009) supports the
definition of (Karnouskos and Fokus, 2004; Turowski and Pousttchi, 2004)
discovering mobile payment as a new payment alternative to traditional
payment by confirmation. De Bel and Gâza (2011) also suggested initiation
and confirmation in mobile payment transaction, but did not include
authorization in their definition. Diniz et al. (2011) summarized mobile
payment as digital payment via mobile handheld devices which may or may
not use telecom network, and the inclusion of financial institutions and banks
being not mandatory. Ondrus and Pigneur (2006) defined mobile payment as
any wireless transaction made between two parties by use of any mobile
device. Further they stated the physical appearance of the mobile device can
vary and should be capable of securely processing the payment. Dahlberg et al
(2007) & Ghezzi et al. (2010) in addition to the definition of Ondrus and
Pigneur (2006) stated that other communication technologies (NFC, Bluetooh,
RFID etc) than wireless network can also be used for making payment for
goods, services, bills through mobile phone, smartphone or any personal
digital assistant (PDA). Further Dahlberg et al (2015) extended definition of
mobile payment as “type of virtual payment enabled by mobile device, in
which money is transferred remotely or near-by from a payer to receiver via
an intermediary or directly in exchange for a service, a product or as a money

8
transfer”. As per Au Kaufmann (2007), “mobile payment (m-payment) is a
point-of-sale (PoS) transaction made or received with a mobile device”. For
merchants m-payment is mobile phone based payment providing a new
alternative of transaction with their consumers (Lai & Chuah, 2010). Various
other authors too have defined m-payment such as Tobbin & Kuwornu (2011),
Shin (2010), The European Commission Green Paper (2012), Luna (2017),
Dewan & Chen (2005) etc.
Mobile payment can be used for payment for peer-to-business in wide areas
like payment for ticketing, bill payment of phone and other utilities, payment
for digital services (games, subscription, games, ringtones etc), payment at
PoS, vending machines and many other possible points (Mallat, 2006). Peer-
to-peer payment is also possible in which money can be transferred from one
person’s digital wallet to another’s. Just as any other technology, mobile
payments too have their own advantages and disadvantages. Mobile payment
gives easy accessibility of anytime anywhere payment (Begonha et al., 2002)
for various payment platforms, gives feel of security being cashless, and extra
perks of cashbacks and offers. Major disadvantage being the money is stuck in
phone, if battery dies or network is poor payment cannot be done. Other
problems being complexity of procedure, lack of merchant acceptance and
issues of risk and security (Mallat, 2006). From merchants’ perspective mobile
payments help them increase as consumer tend to spend more by cashless
modes, increase in consumer loyalty, and faster transaction time helps them to
attend more consumers (Smart Card Alliance, 2007). Major drawbacks being
some consumers feel mobile payment as troublesome process, cost incurred by
merchants on initial equipment setup and fraud practices (Hayashi &
Bradford, 2014).

9
1.1.2.2 Mobile Payment Ecosystem
Figure 1.2: Major mobile payment ecosystem players (source:
Karnouskos & Fokus, 2004; Dennehy & Sammon, 2015)
Mobile payment ecosystem consists of
1. Consumer – The person who initiates, activates and confirms payment
through mobile device. The consumer is the payer, the party who
makes the payment (Karnouskos & Fokus, 2004). Consumers are the
end user which owns a mobile phone. It is the consumer who should be
convinced that mobile payment has an edge over all other payment
options. The key to mobile payment acceptance lies in the hands of
consumers(Pousttchi,2003).
2. Merchant i.e. stores and web portals –The physical store or web portals
from where goods and services are purchased through mobile
payments are termed as merchants. The merchant is the player who
accepts the payment and known as payee (Karnouskos & Fokus, 2004).
Software provider
Device
manufacturer Mobile network
operator
MOBILE PAYMENT
Financial
institutions
Merchant
Government
Consumer
Service
provider

10
The work of merchant (usually any real/virtual POS) in the ecosystem
is providing the consumer with the necessary transaction details,
invoices (Karnouskos & Vilmos). The merchant has to get enrolled in
the mobile payment service provider merchants list. When the
merchant accepts the payment from the consumer, the payment is
processed through a channel, and digital money gets deposited in either
his bank account or digital wallet (Raina, 2014).
3. Financial institutions (banks, credit card companies & payment
processor) –They create and offer banking services for mobile payment
transaction (Luna, 2017). It acts as the acquirer that interacts with
merchant and as the issuer that interacts with consumer (Karnouskos &
Fokus, 2004). Whenever consumer initiates any mobile payment, the
issuer bank after identifying the consumer and verifying the legitimacy
of payment request check for fund availability and finally forwards the
payment request to the merchant’s payment processor. After receiving
the payment notice acquirer bank identifies the merchant and requests
him for confirmation of transaction, on the final confirmation, the
payment is done notifying all the parties about this payment (Luna,
2017).
4. Mobile Payment Service providers– They develop wallet application or
user interface for NFC applications (Penttilä et al., 2016), which can be
downloaded from application store. The developing party can be from
any related field or from third party. The application providers have
responsibility of securely saving virtual money and perform transfer
only after proper authentication.
5. Mobile Network Operators- MNOs are the one who provide
infrastructure for mobile payment and have huge consumer base.
Mobile network operators control SIM (subscriber indentify module)

11
& WIM (wireless indentify module) card of mobile device
(Karnouskos & Fokus, 2004). Telecom companies provides with high
speed network for efficient functioning of transaction. The situation
can be very gruesome if a consumer wants to pay for the commodity,
and he is not able to pay because of non availability of network.
6. Mobile device manufacture- Constant upgradation of technology by
enhancing the device capability for the executing the mobile payment
services is the main job of device manufacturer (Karnouskos & Fokus,
2004). Mobile device should act as a trust intermediary between bank
and MNOs (Dennehy & Sammon, 2015). The manufacturer has
responsibility of providing a safe and reliable device at a reasonable
price.
7. Software provider- They develop standard compliance software apt for
the user and make it available in the market (Karnouskos & Fokus,
2004). It also includes servers and their maintenance staffs, as without
which such huge amount of database management is not possible.
8. Government- Government is the regulatory body that defines the rules
and constraints so all mobile payment solutions should be developed
accordingly (Karnouskos & Fokus, 2004). These rules can be imposed
by government legislations and regulations at national or international
level. They need to provide secure and efficient system for mobile
payment operation (Dennehy & Sammon, 2015), to protect individuals
and encourage favorable financial environment (Luna, 2017).
The expectations of various players of the mobile payment ecosystem are
listed in the table below:

12
Table 1.1- Expectations of ecosystem players (Source: Karnouskos and
Fokus, 2004; Carr, 2007; Thoi, 2016)
Player Expectations
Merchant Quicker transaction
Low or zero initial and usage cost
Integration possible with existing payment
system
High level of security and trust in mobile
payment service
Instant payment settlements
Consumer Trust and security
Less learning time
Personalized service
Low or zero initial and usage cost
Easy switchable between devices, MNOs and
banks
Robust technical support
Easy registration process
Anytime, anywhere and any currency payment
Real-time transaction overview
Peer-to-peer transaction possibility
Mobile network
operator
Potential for value added services
New revenue generation possibility per user
Increase consumer loyalty
Device
manufacturer
Large scale acceptance of new
software/hardware of the device
Interoperable, widely used standards
Low cost of new integrated technology
Multi-application support
Relations with other element of ecosystem

13
Low R&D time
Bank Branding and consumer loyalty
New business opportunity
Secure payment and scam loss minimization
Integration with existing infrastructure
Government Revenue generation through tax
Reduced cost of cash handling
Payment service
provider
Profit maximization
Brand image recognition
Software
developer
Get business from other stakeholders
Constant upgradation in technology
1.1.2.3 Mobile Payment Process
Figure 1.3: Mobile payment process (source: advantio.com, 2019)
The user at first provides a payment token to merchant’s PoS by scanning a
QR code or via NFC. The merchant then sends this encrypted token to
acquiring account. The token is then routed to the payment network which

14
then forwards it to the token service provider for checking the authencity of
the token. If everything is found ok, the payment network requests the issuing
bank to release the payment. The release amount is deposited in the acquiring
bank account, and the merchant as well as the customer gets the payment
completion notification.
1.1.2.4 Attributes of Mobile Payments
Various research studies (Dahlberg and Mallat, 2002; Van der Hejiden, 2002;
Pousttchi, 2003; Karnouskos and Fokus, 2004; Wilmos and Karnouskos,
2004; Mallat N. 2006; Darren et al., 2013; Jinkyung, 2018) have suggested
many attributes for mobile payment to succeed in the market such as
Accesibility, Availability, Compatibility, Complexity, Cost, Cross-border
payments, Customer Data Control, Customer Shopping Experience,
Integration of legacy approaches, Interoperability, Local market
understanding, Merchant Acceptance, Network externalities, Observability,
secured, convenience, Speed, Trialability and Universality.
1.1.2.5 Mobile payment technologies, types and methods
In India, types of m-payment can be grouped on basis such as closeness
between people involved in transaction, message payments, contactless
payment, hybrid payment device and category of owner of the system- Bank-
led wallets, Telco-led wallets, and Independent wallets (M. Manikandan,
2016). The major types of mobile payment option available in India are given
below.

15
Figure 1.4: Mobile payment types (source: mobiletransaction.org, 2018)
1.1.2.5.1 Proximity payment
This category of payments can be done when the payer and payee are in close
proximity of each other. This payment style is best for payment at shops and
in public transports like bus and metro.
a) NFC- Near Field Communication (NFC) is a close-range wireless
technology that enables the exchange of data between different
devices. The exchange of data can be carried out for wide varieties of
tasks including processing of payment (Luna, 2017). Smartphones or
PDAs which are enabled with radio frequency ID, capable of emitting
low energy sensing technology, can be used to perform payment
through NFC (Kerviler et al., 2016). When a NFC enabled phone
comes in close proximity means within inches of NFC enabled card
machine, they exchange encrypted radio frequencies, and money gets
Proximity payment
NFC payments
Sound wave payments
MST payments
Proximity & remote
payment
Mobile wallets
QR codes
Remote payment
SMS payments
Mobile banking
Internet payments
Direct carrier billing

16
deducted from the card information stored in the device. Apple pay and
Samsung pay are the examples of such technology.
b) Sound-wave based payment- In this new cutting edge technology,
unique sound signal waves is used to transmit the details of payments,
from phone to the payment terminal. The best part of this system is that
there is no requirement of internet for this type of communication; just
a simple software installation can enable any type mobile phone into a
payment facilitating device. This technology can be very helpful in
areas where owning smartphones is still a luxury.
c) Magnetic secure transmission (MST) payments- MST is similar to
sound based payment, in this magnetic waves are generated to imitate
the magnetic strip present on cards. It is through this signal that the
card terminal processes as if physical card has been swiped. This helps
to avoid card scamming frauds and card loss can be avoided.
1.1.2.5.2 Proximity and remote payment
This category of payments can be done when in both close proximity and even
remotely.
a) Mobile wallets- These are virtual wallets which uses a secure and
complex system to perform payment process. It is usually a mobile
application installed in a smartphone which adds money by taking
bank/card credentials from consumers. The phone acts as a transmitter
of payment information and this added money can be used to pay at
close proximity or through the online payment platforms
(Abadzhmarinova, 2014). Oxigen was the first mobile wallet launched
in India in August 2004.

17
b) QR codes- QR is abbreviation of quick response. A large amount of
alphanumeric data information is encoded within a square of different
sizes that can be interpreted from any angle by scanning. Additionally,
QR codes are free from errors, easy to produce and serve many
applications (Codes-qr.com, 2016). On pointing the mobile camera
towards it after opening special applications, the money gets
transferred to the payee. As only pointing a camera phone is required,
the code can be even remotely scanned the available picture.
1.1.2.5.3 Remote payments
This category of payments can be done remotely.
a) SMS payments- In this payment method, a text message is sent to a
specific USSD code with complete payment information in standard
format (Crowe et al., 2010). The number used to send text message is
linked with the bank account, and user has a unique MMID and MPIN.
On verifying the security PIN, the money gets credited from one’s
account and gets deposited in target account. E.g- m-Pesa. First SMS
payment was done in the year 2002 in India.
b) Mobile banking- It is simply an app developed by any bank and it asks
its consumers to install the app on their smartphone. On verifying that
the SIM inserted in phone is same as the phone number linked to the
account, the app can be used to access the account. Then, the
smartphone can be used to do many operations such as checking
account balance, transaction history, doing account transfer and
generating statements. (Shankar & Kumari, 2016). This eases pressure
on bank branches and employees, thus is beneficial for banks in cost-
saving. This app can even be used to recharge mobile, pay bills, for
shopping etc.
c) Internet payments- It is a type of payment which is done by using
mobile browser such as chrome, safari etc. and on entering card details

18
or clicking on links the money gets paid to the payee. The digital bill
can be sent to the consumer after payment gets settled via SMS or e-
mail.
d) Direct carrier billing- In this type of payment system, mobile network
operators is used to make the payment instead of bank. There is a
system of entering phone number and after authenticating it, the
amount gets deducted from prepaid account or gets added in postpaid
bill, and consumer settles bill with the telecom company (Carr, 2007).
1.1.3 Mobile Payment Industry and Key Contributing Elements: Indian
Scenario
1.1.3.1 Mobile Payment Scenario in India
With constant technology upgradation, affordable smartphone backed with dirt
cheap internet, inclination towards shopping through mobile and support of
the government, m-payment adoption has witnessed a exponential rise. Mobile
wallets in India though launched in 2004, m-payments were growing in
number at snails pace. Lack of awareness, security, costly phone and costly
internet data were the main reasons for such growth. The industry needed
much and all around support to perform better. The help came from
government in form of IMPS money transfer system. While inaugurating
IMPS in Nov, 2010 in Mumbai, Smt Shyamala Gopinath, the DG of Reserve
Bank of India said reduction in cash usage in India is the need of the hour, and
with launch of IMPS she aimed to increase the use of mobile wallet (Kapoor et
al., 2015). Though it was basically for internet and mobile banking, this
system attracted people’s faith as money got credited in account within few
seconds. Slowly and gradually mobile payments started gaining popularity
with budget smartphones being launched in market and interesting cashback
offers from the mobile payment service providers. M-payment was
predominated by few third-party payment providers initially, just with launch

19
of UPI in 2016 by NPCI diversification in m-payment players started in India.
Visualizing the tremendous potential in this industry gradually other
stakeholders of the mp ecosystem launched their own mp product. Mobile
wallets were launched by banks e.g.- iPockets by ICICI & Yono by SBI,
telecom network providers e.g. Jio & Airtel money, third party tech giants e.g.
Google pay and PayPal. Government too came on board by launching its own
payment app named BHIM. E-commerce mammoth also entered the industry
to magnify their profits e.g. PhonePe (acquired by FlipKart), Freecharge
(acquired by Snapdeal), and similarly Amazon pay, Ola money have been
launched by respective companies. Altogether, they are painting a new picture
in the payment scenario of India. Cash to GDP ratio of India is around 12%
which is much higher that developed economies like USA & UK. As per
KPMG’s report in 2019, non cash transactions are expected to reach till 20%
by 2023. The Indian Digital Payments report by the payments company
Worldline India (WI) reported that in 2019 UPI recorded a transactional
volume of 10.8 billion with a 188% Y.o.Y increase. As of December 2019, a
total of 143 banks are providing UPI services, with 9 more banks were added
in 2019 to the UPI ecosystem. UPI transactions crossed one billion
transactions in a single month in 2019, for the first time since its launch,
processing nearly 11 billion transactions in the year 2019 (S&P Global, 2020).
According to the same report, value of cards and mobile payment crossed the
value of ATM withdrawals in 2019, whereby, UPI payment has dominated
cards. This increase in UPI transactions may be a threat to banks and card
network, similar to situation in China where people are going digital directly
from cash to mobile payments ignoring use of cards (S&P Global, 2020).
1.1.3.2 Mobile Payment Players in India
There are more than 45 mobile wallet providers and approx 50 UPI-based
wallet providers in India, according to KPMG (source: Devere-vault, 2019).
M-payment in India has diversified players from its ecosystem. Banks, e-
commerce giants, third party and government are all providing mobile

20
payment services in India Major players and their downloads are listed
below.
Table 1.2- Major mobile payments players in India (Source:
Socialbeat.com)
S.No. Name of the wallet Key features User base
(July,
2020)
Category
1 PayTm Owned by
One97Communications
Launched in 2010,
PayTM works on a
semi-closed model
300
million
Independent
service
provider
2 PhonePe Initially emerged in
2015 as a basic wallet
to be used for mobile
recharges and bill
payments, but was
game changer in UPI
payments after being
bought by Flipkart
150
million
Independent
service
provider
3 Google Pay
(formerly Tez)
Google ecosystem has
helped it scale up their
user base really
quickly, in spite of
being a late entrant in
Sept 2017
100
million
Independent
service
provider

21
4 Freecharge Launched on August,
2010, Later Snapdeal
acquired FreeCharge in
April 2015 and in Oct
2017 it was acquired
by Axis Bank from
Snapdeal
54 million Independent
service
provider
5 MobiKwik Founded in April, 2009 55 million Independent
service
provider
6 BHIM Founded in Dec, 2016
is first of UPI
payments. Has
partnered with over
100 banks for smoothly
onboarding consumers
135
million
Government
service
provider
7 Airtel Money Founded in January
2017.
30 million Mobile
network
operator
service
provider
8 Jio Money Founded in May 2016. 16 million Mobile
network
operator
service
provider
9 SBI Yono Founded in November,
2017
10 million Banking
service
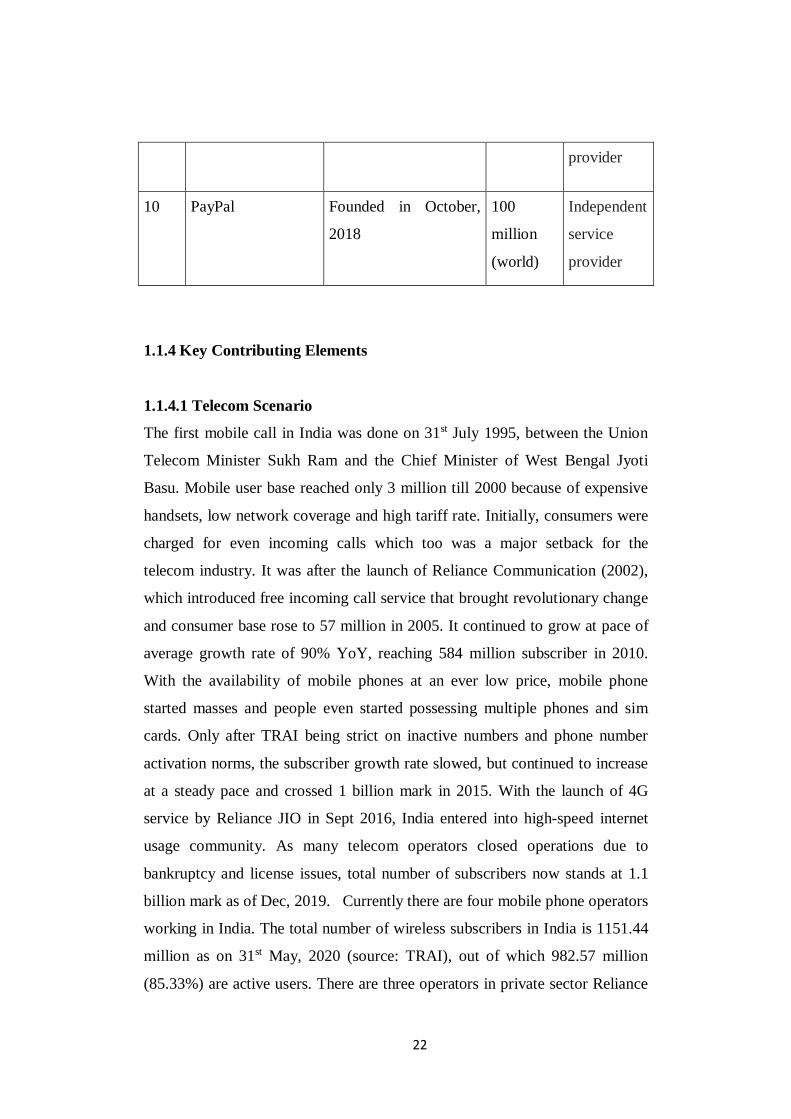
22
provider
10 PayPal Founded in October,
2018
100
million
(world)
Independent
service
provider
1.1.4 Key Contributing Elements
1.1.4.1 Telecom Scenario
The first mobile call in India was done on 31st July 1995, between the Union
Telecom Minister Sukh Ram and the Chief Minister of West Bengal Jyoti
Basu. Mobile user base reached only 3 million till 2000 because of expensive
handsets, low network coverage and high tariff rate. Initially, consumers were
charged for even incoming calls which too was a major setback for the
telecom industry. It was after the launch of Reliance Communication (2002),
which introduced free incoming call service that brought revolutionary change
and consumer base rose to 57 million in 2005. It continued to grow at pace of
average growth rate of 90% YoY, reaching 584 million subscriber in 2010.
With the availability of mobile phones at an ever low price, mobile phone
started masses and people even started possessing multiple phones and sim
cards. Only after TRAI being strict on inactive numbers and phone number
activation norms, the subscriber growth rate slowed, but continued to increase
at a steady pace and crossed 1 billion mark in 2015. With the launch of 4G
service by Reliance JIO in Sept 2016, India entered into high-speed internet
usage community. As many telecom operators closed operations due to
bankruptcy and license issues, total number of subscribers now stands at 1.1
billion mark as of Dec, 2019. Currently there are four mobile phone operators
working in India. The total number of wireless subscribers in India is 1151.44
million as on 31st May, 2020 (source: TRAI), out of which 982.57 million
(85.33%) are active users. There are three operators in private sector Reliance

23
Jio, Airtel and Vodafone-Idea, and one in public sector BSNL with subscriber
base as shown.
Table 1.3- Telecom sector subscriber base distribution (Source: TRAI, as
on 31st May, 2020)
S. no Wireless telecom company Subscribers (in
millions) Market share
1 Reliance Jio 392.74 34.43%
2 Vodafone-Idea 309.92 27.17%
3 Bharti Airtel 317.80 27.88%
4 BSNL 119.96 10.52%
Private telecom players are playing most important in the mobile payment
ecosystem by providing all important networks to most of the Indian
population. The telecom sector has to work round the clock to maintain this
network system. Some network operators taking advantage of their subscriber
base have started their own mobile wallet e.g.- Airtel money and Jio money.
Airtel has also financially included its subscribers by launching the Airtel
payment bank.
1.1.4.2 Internet Usage Scenario in India
Internet was used only by military before 1995 in India and research purposes
without access to public (source: webnots). Internet was offered to public in
six cities through telephone connection by VSNL on 15th August, 1995. It
continued to grow at a slow pace till a decade reasons being high cost and
slow internet speed. Indian railway started the online booking through internet
website in the year 2001. Internet penetration was only 3.6% (40 million) in
2006 which increased to 7% (81 million) in 2009 and 36% (462 million) in

24
2016 (source: internetworldstats, 2019). Currently, India has second highest
number of internet users in the world with 560 million users (source:
internetworldstats), and internet penetration will increase by around 829
million Indians by 2021 as per the CISCO report. While internet users in urban
India grew by 7%, there was an increase in users in rural India by 35% in 2018
(source: Economic Times, 2019). With this quest for data in rural areas, well
internet connected India with no digital gap between urban and rural India is
not a distant dream. Not only are the new users adding up but also their
internet activeness is high, as reports suggest Indian adults spend 3.5 hours on
internet daily (source: emarketer, 2019). Interestingly almost 97% of internet
is accessed through mobile phone now in India. This has opened up a huge
window of opportunity for m-commerce industry. Mobile commerce is easily
making way into new users with exciting deals and offers, eventually paving
path for m-payments as by making payments through m-payments option will
give the users extra benefits and comfort.
1.1.4.3 Mobile Commerce Scenario in India
Mobile commerce is a process in which all commercial activities from
selecting, buying and paying of products and services are done through
wireless devices (Tarasewich et al., 2002). Smartphone fuelled with
affordable internet has become part and parcel of individual in this fast-
growing world economy. With Smartphone enabling consumer to search for
goods and services, at own comfort round the clock , it has been found out
that ordering a product from an app takes 150% less time than ordering from
desktop site as users get crisp information rather than scrolling through piles
of irrelevant pages and pop-ups. According to CII report (2016) m-commerce
accounts 60% of online sales, out of which 30-50% purchases by m-commerce
is from tier II and III cities. As per Worldpay Inc (2019), annual CAGR of m-
commerce is 28%, and is expected to grow to $54 billion by 2022 in India.
Currently, out of total online sales, 51% are via mobile devices and according

25
to PayPal, 7 in 10 consumers prefer mobile shopping (enterprenuer, 2020).
M-commerce allows shoppers to pay digitally thus paving scope of growth of
m- payments. M-commerce market is now collaborating with payment
industry and we can see today major m-commerce industry players like
Amazon, Flipkart, Myntra have either their own payment apps like Amazon
pay or have collaborated with already existing m-payments. Thus with the
growth of m-commerce, m –payment will boom too.
1.1.4.4 Government Initiatives
The government is working towards ways to incentivize cashless transactions
and discourage cash payments, in order to curb black money and corruption in
India. The government’s initiatives such as JAM Trinity (Jan Dhan, AADHAR
& Mobile) would also facilitate this transformation, as less financial inclusion
and lack of digital knowledge are major hurdles in a cashless economy. JDY
has witnessed a massive success with an opening of 25.68 crore bank accounts
which is really commendable. Aadhar card has helped a lot in this mission,
and with 89% of Indian population being aadhar enabled financial inclusion
has become very easy (source: timesofindia), as in Jan Dhan Yogna scheme,
bank account with zero balance can be opened using aadhar card. A
nationwide digital literacy program has been launched name National Digital
Literacy Mission with a target to give higher level of digital skills at least one
person per household by 2020. The National Digital Literacy Mission is an
integrated platform of digital literacy awareness and education that will help
rural communities fully participate in the global digital economy. The central
government has also promoted cashless transactions through UPI, USSD,
AEPS and Rupay Card. The government is mulling over to bringing insurance
in the mobile wallet similar to debit and credit card segment. Government
asked banks to install additional 10 lakh PoS terminals in different parts of the
country. Government other moves such as Payment banks, 100 smart cities all
across India, implementation of GST will also eventually help in going

26
digital.“Go digital”, was the slogan given by PM Mr. Narendra Modi in his
radio talk “Mann ki baat”. Kerala is the first digital state in India whereas
Akodara is first “digital village” free from cash hassles. Akoli a village in
Telangana too is 100 percent digital. These commendable moves by these
villages alarm us towards the need of the day calling us to be updated and
aware of the changes in our surroundings and call us to join their move in
making India cashless or less cash country dream come true.
1.1.4.5 Increase in Digital Transactions
Cash has always been the king of payment transactions in India, unless for a
brief time period when government demonetized 85% of currency notes in
circulation in Nov 2016. Though Indian’s love for cash has rather increased as
currency in circulation on 4th Nov 2016 was Rs. 17.74 lakh crore (source:
Economictimes), has now increased to 26.56 lakh crore as on 25th Sept 2020
(source: The Hindu Business). But it also cannot be denied that digital
payments are reaching new heights since then. The major digital payments
used by consumers are listed in the table with its transaction value and
volume.
Table 1.4: Value and volume of digital payments (Source:RBI annual
report)
Financial
Year
2015-16 2016-17 2017-18 2018-19 2019-20 Percentage
Change
from 2016-
17 to 2019-
20
UPI
Volume (in
lakhs)
- 179 9,152 53,915 1,25,186 69836%

27
UPI Value
(in crores) - 6900 1,09,832 8,76,971 21,31,730 30794%
IMPS
Volume (in
lakhs)
2208 5067 10,098 17,529 25,792 409%
IMPS
Value (in
crores)
1,622 4,116 8,92,498 15,90,257 23,37,541 56691%
Prepaid
Payment
Instruments
(PPIs) (in
lakhs)
7480 19637 34,591 46,072 53,318 171%
Prepaid
Payment
Instruments
(PPIs) (in
crores)
48800 83800 1,41,634 2,13,323 2,15,558 157%
Card
payments
Volume (in
lakhs)
19593 34864 47,486 61,769 73,012 109%
Card
payments
Value (in
crores)
3,99,600 6,58,300 9,19,035 11,96,888 15,35,765 133%
As it can be seen that card payments and PPIs (which includes mobile wallets)
has just grown by 133% and 157% respectively in value from year 2016-17 to
2019-20. On the other hand, UPI has increased 69836% and IMPS has
inceased 56691% in value during same time period.

28
1.2 Motivation for the Study
Mobile payment in India was present since 2003, but it took almost a decade
for the industry to get mass acknowledgement. It was after 2014, when mobile
payment got its recognisation mainly after the three major transformations in
Indian society. Firstly, Digital India movement launched by the government
aimed at reaching and digitally educating each and every citizen of India, thus
creating digital awareness among them. Launch of Reliance JIO in Sept 2016,
gave a major push to government’s dream by providing high speed internet at
dirt cheap price, bringing per GB price to one of the lowest in the world.
Secondly, UPI launched by NPCI brought a great advancement in the mobile
payment industry by eliminating a major drawback of mobile wallets in which
money did not get credited in bank account directly. UPI system was designed
to credit money directly in the bank account that too within few seconds. Last
but not the least government’s major move of demonetization which
abandoned use of currency notes of Rs. 500 & Rs. 1000 which constituted
85% of cash in market, created a friendly environment and massive scope for
the use of mobile payment. India has always been a cash loving society but it
was only after demonetization that India started operating at less cash, and
eventually operating at $ 33 billion less (Gupta & Auerswald, 2019). So these
changes pave the path for use of other alternatives of payments like m-
payments.
After the demonetization, not only the consumers but merchants too have
boarded m-payments in India. From big shops to small shopkeepers everyone
started using m-payments and other e-payments after demonetization.
Especially for penny transactions, m-payment has proved to be a problem
solver. It is important for a business to be updated with latest form of
technology and to meet consumers’ needs. Merchant is the key to unlock
cashless society, as it is they who should believe in the system and if

29
merchants are unable to accept it, the whole system will be worthless
(Dahlberg et al., 2015). There is only 4.9 million PoS terminal (source: RBI
bulletin, Jan, 2020) for nearly about 65 million retailers in India, showing a
huge gap in digital acceptance. Around 2 lakh crores per year will be saved by
the government as cost of printing and transporting cash will decrease.
Government is also constantly urging banks and mobile network providers to
strengthen their digital infrastructure, for providing safe and secure
transactions for consumers and merchants so that more and more people can
opt for cashless payments and help boost economy and curb black money. The
government has well supported and encouraged merchants to be part of their
cashless movement lowering transaction fees and raising transaction limits.
Government has reduced MDR charges (cost paid by merchant to bank for
accepting digital payments), and is charging zero MDR for payment through
RuPay card and UPI mode of payment from Jan 2020. Government of India
has also launched Digital India scheme with aim to connect all village
panchayats by optical fiber cable. This not only will help the core of India i.e.
villages be digitally enabled, but also make them believe in digital system.
Government even encouraged rural banks to issue debit cards for farmers so
that agriculture related activities can be done through digital means.
Viewing the huge potentials of m-payment market in India, new aspirants in
the form of big giants like Google pay, PayPal, Apple and Samsung grasped
this opportunity and entered this segment. WhatsApp, which is now owned by
another tech giant Facebook, too is on its way to launch its m-payment. If not
directly launched m-payment, many globally renowned companies has
invested in Indian mobile payment market like around $2 billion by Alibaba
and SoftBank, and $356 million by Berkshire Hatahaway has been invested in
PayTM. Parent company FlipKart invested 700 crores in PhonePe, and
Mobikwik has raised around $ 118 million. Also financial institutions, m-
commerce giants and existing m-payment players are collaborating among

30
themselves (e.g. Axis bank bought Freecharge, Flipkart bought PhonePe) to
provide efficient service and take advantage of this progressive sector.
These above changes have led to a reformed India where everyone is playing
some part in cashless India motto and e-payment and m-payment has become
the latest trend. With smartphone playing potent role in daily activities and
commerce of people of India and expectation of its growth in subsequent years
as mobile payment industry in India is expected to record a CAGR of 22% to
reach US$ 1 trillion (source: globenewswire), it is important to study how well
people are making payments through mobile at present. Therefore, it is crucial
to know how well the merchants and consumers have adopted mobile payment
in their life, and what factors affect continued use of mobile payment.
Mobile payment services (MPSs) are expected to be one of the fastest growing
segments of mobile marketing. Mobile payment technology has aided in
socio-economic development through financial inclusion and protective
security during crises. Mobile payment system has emerged as an important
medium of transaction with the growth in mobile communications and
information systems. The recent development in the mobile payments with
launch of UPI by the NPCI and affordable high speed internet have created
reform in this industry and is thus a motivation to study the change in the
usage of mobile payments after this massive development. Additionally,
demonetization had a huge impact on the consumer inclination towards the
usage of mobile payment systems which has further motivated to pursue the
study. In India, mobile payment systems is still in its nascent stage, therefore,
it is imperative to understand the underlying factors which motivate the
continued usage by consumers and merchants.
The present study will contribute to the study of mobile payments by
providing the actual reasons of use of mobile payments by consumers and
merchants and understanding the role of government initiatives in the use of

31
mobile payments. This study will contribute significantly in uderstanding the
gap in the level of usage and awareness in two different cities of India.
1.3 Relevance of the Topic
In a developing country like India, where still about 190 million adults don’t
own a bank account (Forrest, 2020), providing banking services through
traditional banks can be costly and time consuming affair. Further, minimum
balance rules of bank accounts, service charges, annual maintainance charges
etc even make it harder for poor people to hold a bank account. Government
schemes’ benefits are less likely to reach the beneficiary in absence of bank
account dues to corruption. This is hindering inclusive growth of the society,
and disparity in overall development is observed. An easy and effective
solution to these problems is financial inclusion through m-payment.
Mobile payment adoption research is still regarded in its early stage by some
researchers (Slade et al., 2013). Consumer adoption intension, although being
a widely researched area of mobile payment research (Dahlberg et al., 2015;
Dahlberg et al., 2008), not much work has been done on examining the
intention to continue use of such payment (Shaikh & Karjaluoto, 2015; Zhu et
al., 2017). Thus this research aims at finding the reasons for the merchants and
consumers to continue their use of mobile payments in future. Also despite
plenthora research of m-payments, it appears from the literature review that
most previous m-payments research has been undertaken from the perspective
of consumer adoption, rather than with the focus on merchant (Dahlberg et
al.,2007; Dennehy & Sammon, 2015; Cabanillas et al., 2016). As a result of
limited existing research, a lot remains unknown about the merchant
perspective of adoption (Dahlberg et al., 2015). Besides, study of one aspect
solely will lead to restricted knowledge about mobile payments (Dahlberg et
al., 2015). Merchants’ participation in promoting a payment service is vital for
wider points of acceptance (Dahlberg et al., 2007). Although there is

32
exponential rise in global adoption of m-payments, merchants’ acceptance is
the major disruption in the growth process. Narrow acceptance of mobile
payment by merchants will discourage the consumers too (Au & Kaufmann,
2008), as consumer use of payment systems is simultaneously connected with
merchants’ mobile payment adoption (Pousttchi, 2008) and likewise
merchants are unwilling to invest in the systems needed to enable an m-
payment transaction unless there is consumer demand (Sammon & Dennehy,
2015). So it is important we study both consumer and merchant acceptance
side by side.
M-payment topic is worth studying in country like India as M-payment is a
recent trend here. Although few studies on m-payment adoption have been
done in India in the past, in the context of cities such as Bangalore (Padashetty
& Kishore, 2013), Mumbai & Delhi (Thakur, 2013), Hyderabad (Vally &
Divya, 2018), NCR (Tiwari et al, 2019), Chennai (Manikandan & Jayakodi,
2017), Ahmedabad (Brahmbhatt, 2018). Comparative study between two or
more cities is lacking. Previous literature (Dahlberg et al., 2015; Dennehy and
Sammon, 2015) suggested multi-market and multi-country study and also
previous researchers suggest that different socio economic status and different
lifestyle could have impact on the adoption of mobile payments therefore this
work is aimed at a comparative study between two different cities of India to
see if difference in standard of living has any impact on use of mobile
payment or not. So to understand the actual impact we have selected two
different tier cities Ranchi and Kolkata to have a comparative study in
awareness and use of mobile payments.
1.4 Scope of the Study
This study primarily focuses the dual side perspective of both the
merchant and consumer in knowing about the acceptance and adoption
of the mobile payment systems. Thus, awareness and usage level of

33
Mobile Payment System has been studied. Also future continuance of
use of Mobile Payment System has been studied
However, this study does a comparative study between capitals of two
different states only i.e. West Bengal and Jharkhand. Thus covers
Kolkata city and Ranchi city covering total population of about 60 lacs.
Further this research focuses on the impact of demographic factors and
other adoption related factors on the use of mobile payment sytem.
1.5 Thesis Outline
Chapter 2- Literature review
This chapter covers the literature work done in the areas – factors of mobile
payment adoption in various countries, various technologies used and theories
involved for both consumers and merchants, and the linkage of these
literatures with this research has been studied. This chapter highlights the gap
found in the current literature, and discusses how this research will fill this
gap.
Chapter 3- Research Methodology
This chapter throws light on the strategies adopted by the researcher to find
the results. It contains objectives the researcher wants to achieve, details of
sample size, research instrument used, area coverage of data collection, pilot
survey and main survey. In this chapter hypothesis formulation was done
which will find the results.
Chapter 4- Data Analysis and interpretation
This chapter covers the details of analysis of data collected after pilot survey
and main survey. The statistical tools used for the analysis were discussed.
Effect of demographic factors was studied on continued use of mobile
payment. Hypothesis testing was done to find the factors which influence
continued use of mobile payments.
Chapter 5- Results, Discussion and Conclusion

34
This chapter gives the summary of the findings of the research, and discussion
on the results has been done. The implications of the study have been
discussed, and conclusion has been drawn.
1.6 Summary
This chapter summarizes the basic concept of mobile payment, its types, uses,
advantages and disadvantages etc. Motivation behind the research was
presented, and relevance of the research was explained. The scenarios of
mobile payment and its supporting industries were discussed. The outline of
chapters which will follow has also been drawn.

35
CHAPTER 2: REVIEW OF
LITERATURE

36
CHAPTER 2: REVIEW OF
LITERATURE
2.1 Overview
The purpose of this chapter is to thoroughly review the previous literatures in
the area of mobile payment and then briefly explain the essence of the
appropriate literatures. A literature review is the most important part of any
research and it is most enlightening and informative. Extensive research was
done to know about various concepts and model theories related to the topic.
This chapter briefly explores the historical context of the mobile payment
system. This chapter covered literatures related to both merchants and
consumer adoption and also covered important and most cited literatures in the
field of mobile payments from across the world. The most recent researches
have been discussed later in this chapter. Research were searched from few
keywords like – consumer, adoption, merchant adoption, m-payment, mobile
money, cashless, e-wallet, m-wallet, intention to adopt, nfc payment, TAM,
UTAUT, e-payments. Research papers were taken from the database of
Google scholar, researchgate, inflibnet. Researches published in both
renowned and not much recognized journals were considered.
2.2 Literature Review of Mobile payment
2.2.1 Historical Context of Mobile Payment Systems
Mobile payment is the recent development in the field of mobile technology
and is thus popular research topic. Many mobile payments have been
developed in different countries till date some providing their services

37
domestically whereas others globally. There are many mobile payments
alternatives available in the market to choose from for both consumers and
merchants. There are lots of P2P mobile payments options available like
N26’s Moneybeam, Elopay, Kesh, Paypal, Cringle, Lendstar, Vostar and
Hallo Freunde in Germany, similarly PayM in the UK (Slade et al., 2015) and
TextPayMe in US is too peer-to-peer mobile system. There are various other
types of m-payments available globally with functions of peer to peer transfer,
use of mobile as wallet, ticketing, VAS etc. M-payments available in different
places – in Asia are – UMPay, Oxicash SMS pay, Shinginko, Moneta,
Turkcell, S!Felica, G-cash Alipay (Ayodele A., et al. 2013) KakaoTalk (Shin
et al., 2014), in Europe are Paybox, TagPay, PosteMobile, Mpay wallet,
Mobipay, Zong (Liébana-Cabanillas et al., 2014), in Africa, M-Pesa, U-MO,
PocketMoni, POCit, Airtel Money, Orangemoney, in America are Obopay,
P2P cash, Synovus, Boku, Eficash, Zong. Some of the most popular mobile
payments worldwide are ApplePay, GooglePay, SamsungPay, PayPal (Harris
et al., 2019; Vishwanathan, 2018). In case of India, some of the most used
mobile payment systems are Oxigen wallet, PayTm, MobiKwik, Ola Money,
FreeCharge, BHIM, SBI buddy, Pay U Money (Pal et al., 2019; Routray et al.,
2019). PayTm constitutes half of the total mobile wallet’s user base in India
(Joshi et al., 2019), whereas BHIM, being the payment app introduced by the
government made a major reform in making mobile payment industry (Pal et
al., 2019).
Mobile payment ranges from success to failure whereby some services
providers even discontinued their services (Mallat, 2007). There is history of
success in some market like Kenya where M-Pesa is highly successful since
2007 (Mbogo, 2010), which was later imbibed by Philippines, India,
Bangladesh and Pakistan (Islam, 2016). But same M-Pesa is not much
successful in other countries like South Africa, Philippines and Ghana, also
not in India (Sinha et al., 2018). Similarly Z-Pesa was not successful in
Tanzania (Anthony & Mutalemwa, 2014). M-payments have been very
38
successful in countries such as Singapore, Norway, Austria, Japan and South
Korea (Lee et al., 2004; Schaettgen and Taga, 2010), experiencing low
adoption rates or failure to date (Cellan-Jones, 2012). Mobile payment is
viewed to strive hard to succeed in developed companies due to various
competent existing alternatives to it (Hampshire, 2017 ; Slade et al., 2015) but
still use in mobile payment has taken upsurge in various countries such as UK
(UK Finance, 2019 ; Slade et al., 2015). mobile payments solutions have also
been less successful in Europe and North America (Au & Zafar, 2008) in
comparison with Asian and developing countries (Schierz et al., 2010; UK
Payments Council, 2013). Egypt and the Democratic Republic of Congo use
mobile payments as a form of quasi-money (Batchelor, 2007). M- payments is
gladly adopted by unbanked markets (Au & Zafar , 2008) to meet the financial
gap, as a result of poor existing means of payments (Bourreau & Verdier,
2010) and poor financial infrastructure (Cellan-Jones, 2012). Many
researchers (Barutcu, 2008; Matthews et al., 2009; Xu et al., 2010; Andreev et
al., 2011) also claim that consumer lack interest in mobile payments as
compared to other functions of their mobile phones such as mobile
advertising, mobile coupons, mobile social media and mobile media.
There is an increase in annual publication from 65 to 121 from the year 2007
to the year 2016 and cumulative publication increase from 444 to 630
publications from 2007-11 to 2012-16. This means m-payment research
continued to be studied throughout the spanned period (Gupta et al., 2017)
Further the study also found that India with 6.98% share ranked 3rd among the
top 10 countries of the largest global publication to China being first with
26.26% share and USA being 2nd with 9.59% share.

39
2.2.2 Literature Review on Consumer Adoption
Intensive research has been done in technology adoption area covering
different domains like m-commerce, e commerce, internet banking, m-
banking, e-payments, e-wallets, m-payments etc.
Kurnia and Ali (2012) did a B2B e-commerce adoption comparative study
among grocery industry of Indonesia and Bahrain. Lack of proper government
intervention was found to be a barrier to adoption. Thakur and Srivastava
(2012) studied about the consumer adoption intention of mobile commerce in
Indian context by developing a research model with the use of technology
acceptance model and innovation resistance theory. They too found out
perceived usefulness and perceived ease of use as two significant determinants
in context of mobile commerce impacting the technology adoption readiness.
Social influence was also found to be of significant importance for technology
adoption readiness indicating high influence of pear group in the m-commerce
adoption decision. Also, perceived credibility risk (security risk and privacy
risk) strongly affected the adoption intention negatively. Makame et al. (2014)
studied the factors affecting e-commerce adoption in Tanzania by use of
extended TAM model, adding National Policy Initiatives and Trust to the
original model. By analyzing data using LISREL, findings revealed trust as an
important factor for e-commerce adoption, which is affected by technology
infrastructure. Further, National Policy Initiatives was found to bear strong
influence on perceived ease of use, perceived usefulness, technology
infrastructure and trust. Singh & Islam (2016) too did a study on emergence of
M-commerce in India and explained the advantages & drawbacks of m-
commerce and factors influencing the m-commerce growth and its adoption.
Another study was done in North America by Shaw & Sergueeva (2016),
where they studied adoption of smartphones among consumer for m-
commerce and used UTAUT2 model including the privacy calculus and the
theory of convenience. 352 samples from Canada was taken out of which 300

40
valid data was analyzed. The results revealed perceived value, perceived
convenience and hedonic motivation were the most significant factors in
determining intention to use of m-commerce.
Donner and Tellez (2008) studied various cases on emergence and acceptance
of m-banking/m-payments. Malhotra & Singh (2010) did an exploratory study
to find the factors determining adoption of internet banking for 88 banks in
India. Dash, Bhushan and Samal (2014) empirically examined the consumer’s
adoption factors of mobile banking. They incorporated Diffusion of
Innovation (DOI) theory with mimetic force and tried to gain an insight into
mobile banking adoption. Their research findings suggested compatibility and
trialibility as strong predictors of attitude with regards to mobile banking
adoption. Hanafizadeh et al. (2013) did a systematic review of 165 research
articles published on the adoption of Internet banking during 1999 and 2012.
Martins et al. (2014) presented an integrated UTAUT+PCR research model
combining UTAUT with perceived risk, considering seven different kinds of
risk for adoption and use of internet banking, where addition of risk in the
model was found to be of significance in explaining 56 % of the variance of
behavior intension. Ruangkanjanases & Wongprasopchai (2017) empirically
examined the factors affecting adoption of m-banking among Gen Y (born
during 1977 to 1994) and Gen Z (born after 1994) in Thailand. Analyzing data
from 400 respondents, they found out compatibility, self efficacy and
perceived usefulness to be positive and significant factors influencing
consumers’ adoption decision for both the generations. Gen Z was highly
influenced by the social groups. Tam and Oliveira (2017) in their research
paper studied 64 research articles from top journals in the span of 2002 to
2016. Perceived ease of use and perceived usefulness was found to be of most
influencing factors for m-banking adoption intension. Foroughi et al., (2019)
recently found out the factors determining the continuance intention to use
through technology continuance theory (TCT) and added self-efficacy and
channel preference to the theory.

41
After reviewing the existing literature it was found researchers have studied
Mobile Payment in context of various countries depending on their place of
residence, study and interest out of which maximum work has been done in
the field of consumer acceptance / adoption / use concerning factors
influencing or determining that adoption/ acceptance/ use behavior decision of
the individual (Cabanillas et al., 2014; Mallat, 2007; Pham & Ho, 2015). Some
study has been done in context of adoption of different technologies involved
in mobile payment. Few researchers have also studied adoption by consumer
in different scenarios. Different research studies have been done in the context
of various countries such as United States of America, Canada, UK, Finland,
Sweden, Netherlands, Germany, Spain, Switzerland, Turkey, Kenya, Zambia,
Tanzania, New Zealand, Australia, , Vietnam, China, Hong Kong, Thailand,
Taiwan, Bangladesh, India and many other countries. Some of the latest
researches with most relevance are discussed below.
2.2.2.1 Literature Review on Consumer Adoption of M-Payment in
Various Countries Determining Factors
Schierz et al., (2010) through their empirical study, focused on the factors
determining consumer’s acceptance of mobile payment services of German
people. For their study the 1447 respondents, who were mobile users were
considered. They developed an extended Technology Acceptance Model with
constructs of perceived usefulness, perceived ease of use, attitude towards use,
perceived compatibility, perceived security, individual mobility, subjective
norm and intention to use and used structural equation modeling to test their
model. Finding disclosed that perceived compatibility has most significant
influence on the intention to use mobile payment services whereas individual
mobility was found to be the key driver of mobile payment acceptance. Also

42
their research proved to be with the most significant predictive ability till date
with 84 percent of variance in predicting dependent variables association with
consumer acceptance of mobile payment services. Petrova & Mehra (2010)
through an exploratory study investigated how mobile service-oriented
features and demographic factors influence consumers in forming their
attitudes towards mPayment in New Zealand. They developed a research
framework with the constructs derived from TAM and Input Process Output
(IPO). Regression analysis showed that convenience and affordability were
significant predictors affecting PU. Also, monthly mobile spending and the
variations of this spending may strongly influence perceived usefulness.
Peng et al. (2012) explored factors influencing tourists acceptance of tourism
m-payment in China. They adopted extended TAM model by adding
perceived compatibility, perceived security, destination m-payment knowledge
and interpersonal susceptibility. They found out that in addition to PU &
PEOU, perceived security plays important role in tourist intension to use.
PEOU is affected by knowledge of destination m-payment, and PU is affected
by perceived compatibility and perceived security. Another study in China of
Yang et al. (2012) attempted to identify the determinants of pre- adoption of
mobile payment services and explore the temporal evolution of these
determinants across the pre-adoption and post-adoption stages from a holistic
perspective including behavioral beliefs, social influences, and personal traits.
Their most significant findings show that behavioral beliefs in combination
with social influences and personal traits are all important determinants for
mobile payment services adoption and use, but their impacts on behavioral
intention do vary across in different stages.
Ayodele et al. (2013) investigated the level of adoption of mobile payments in
Nigeria. They used TAM model constructs integrated with relative advantage,
compatibility, complexity, cost and trust and security to formulate their own

43
research model. 227 valid responses were taken out of total 250 responses.
Data analyzed using multiple regression revealed relative advantage was the
strongest predictor in explains behavioral intention to use mobile payments,
followed by ease of use, trust and usefulness respectively. Further, it was seen
that Nigerian are willing to opt cashless options due to its advantage of
convenience, ease of use, ease of access, reduced time of transaction.
Anthony and Mutalema (2014) studied about factors influencing the use
intention of Zantel’s Z-pesa services in Tanzania. They too used Extended
Technology Acceptance Model, including perceived mobility, perceived low
cost of the mobile payment services, perceived expressiveness, perceived trust,
perceived support from mobile services provider , as the other extended
variables. Through convenience sampling they only used 120 responses which
they analyzed and found out cost and added utility of mobile payments as
major hindrance in the use intention. Overall Z- pesa showed lot of flaws as it
was perceived as not so easy, non trustworthy lacking mobility and service
availability.
Li et al. (2014) studied the factors and the influence mechanism which effect
Chinese adaption intention of mobile payment based on TAM model, theory
of social psychology and innovation diffusion. Factors were ranked as the
most significant factors for use of mobile payments in the order of altitude,
consumer’s trust in the operator, number of merchants, scope of service, cost
to use, subjective normalization and operation scenario.
Phonthanukitithaworn et al. (2014) investigated factors affecting consumer
intention to adopt m-payment services in Thailand. The result found out that
m-payments service was determined by four factors: compatibility, subjective
norms, perceived trust and perceived cost. Recent studies explain BI as being
influenced and shaped by one’s attitude and subjective beliefs, which in turn
are shaped by their beliefs associated with motivations and evaluation of
beliefs. (Phonthanukitithaworn, et al., 2014), that the influence of friends,

44
parents, and colleagues can become a critical determinant in improving
consumers’ willingness to use m-payment
Shaw (2014) investigated the factors that influence consumers to adopt the
mobile wallet in Canada. They extended TAM by adding construct of trust,
informal learning and mobile wallet self-efficacy. Perceived usefulness was
found to be the most significant factor and trust also was significant factor,
whereas perceived ease of use was insignificant. There was a significant
impact of self-efficacy on perceived ease of use but insignificant on perceived
usefulness. Further informal learning on intention to use was found to be
significant, mediated by trust.
Cabanillas et al. (2015) did an empirical research and proposed a model to find
the factors determining use of mobile payment system in Spain. Age was used
as a moderating factor, and it was found to be significant in influencing users’
decision. It was found out that younger users are more inclined towards new
technological tools than the older.
Kabata (2015) investigated the motivational factors that influence the use of
mobile payment services in Kenya. The regression results revealed six
variables; perceived usefulness (PU), perceived ease of use (PEOU) and
perceived enjoyment (PE), perceived security (PS), age and education level
significantly influenced consumer use of mobile payment services in Kenya.
Whereas, social influence and gender did not influence the use of mobile
payment services.
Wang & Idertsog (2015) studied user intention to use mobile payments in
Taiwan. This study used an extended technology acceptance model integrated
with perceived ease of use, security, attitude toward using M-payment service
and behavior intention to use M-payment. Regression analysis was done and
the findings were consistent with previous studies and it was found that

45
security and perceived ease of use were significant predictors of the attitude to
use mobile payment service.
Aydin & Burnaz (2016) studied factors impacting attitude development
towards mobile payment use in Turkey. For this they extended TAM model
with personal innovativeness, perceived security, compatibility and social
influence. Data was collected from 640 respondents through random sampling
out of 54,000 downloaders of mobile wallet application. Affect of
innovativeness was main concern for the study, and it was found out that
almost all the respondents were innovative, and had positive attitude towards
mobile payment system. Independent variables explained 62.2% variance on
attitude towards intention to use; usefulness and ease of use were the strongest
predictor having direct influence, whereas compatibility and security too had
significant influence towards attitude intension towards mobile payment.
Mobile payment is believed to be in its early stage in Turkey.
Aydin & Burnaz (2016) studied adoption of Mobile wallet by consumers and
factors affecting users and non users in Turkey. For their research, sample size
of 1395 was taken from the mobile wallet application of one of the leading
mobile network operators in Turkey using stratified random sampling.
Constructs studied were – Personal Innovativeness, Perceived Security, Ease
of Use, Compatibility, Perceived Usefulness, Social Influence, Rewards,
Attitude, and Use Intention. Data was analyzed through PLS- SEM method
and revealed that social norms had very low impact on use intention which is
unsupported by many previous researchers. Ease of use was found as the most
influencing factor on mobile wallet use among users and second important
factor for non users. Personal innovativeness showed no direct impact on
attitudes and had insignificant influence on use intentions for users and had
low impact on non-users. People perceived as more innovative have positive
attitude towards use intention and thus they find mobile wallet easier to use.

46
Gan (2016) investigated factors influencing mobile payment service adoption
intention of users in China. They too used extended TAM model adding
subjective norm and use context as additional constructs, and tested it through
PLS method. Total of 375 valid responses were obtained and analyzed. The
model explained 60.2% of the variance in intention to use mobile payment
services. PU, EOU and use context significantly influenced behavioral
intention to use mobile payment system, whereas subjective norm was found
to be insignificant.
Kim et al. (2016) in South Korea studied factors of adoption of mobile
payment for fintech services. They adopted ELM (elaboration likelihood
model), to examine the influence of personal mobility, perceived usefulness
perceived ease of use, credibility, social influence, concern for information
privacy, self-efficacy on the acceptance of fintech-type payment services. By
testing the relationship among the central and peripheral paths in the
acceptance of fintech-type payment services, it was found that the central path
was found to have more influence than the peripheral path. Usefulness, ease of
use, self efficacy and social influence were found to have a positive influence
on intension to use.
Lesa and Tembo (2016) studied consumer’s behavioral intention to use or not-
use m-payment services by applying extended Technology Acceptance Model
(TAM) to their research work in Zambia. 152 respondents were selected from
current-users, capable-users, regulators, and bank staff. According to the
regression result, 55.7 percent of the variance among dependent construct was
explained by the research model. Social norm proved to be the most important
factor followed by perceived usefulness and perceived ease of use on
behavioral intention to use m- payments. Similar to Diniz et al., 2011, in their
research also cost showed negative effect on m-payment but it was of least
significance on consumer’s use intention of m-payment.

47
In Bangladesh, Islam (2016) investigated drivers and barriers stimulating in
the acceptance of mobile payment, for which extended Tam model was
adopted. Data was collected from two mobile financial service institutions and
mobile network operator, also 260 consumers of Mobile Money service of m-
payment using different MNO and MFS. Regression analysis revealed that
behavioral intension had the greatest significance on actual use of mobile
payment. Perceived risk had greatest significance on behavioral intension,
followed by perceived cost and perceived ease of use. Subjective norm was
seen as significant mediator factor for perceived usefulness and perceived ease
of use to influence behavioral intension to use mobile payment service. Mobile
payment was found to be in early stage.
Nguyen et al. (2016) examined the factors that influence consumer intention to
use mobile payment services in Vietnam. A total of 489 data were collected
from shopping malls, supermarkets, electronics and appliance stores, and
resident neighborhoods. The regression results revealed 83.9% of the variance
for the constructs on the intention to use mobile payments. Among all the
constructs, perceived trust came out as the strongest predictor of mobile
payment services use intention followed by perceived ease of use, perceived
enjoyment, perceived behavioral control, perceived usefulness and subjective
norm. Perceived trust also showed strongest influence on behavioral intention.
Oliveira et al. (2016) identified the main determinants of mobile payment
adoption with the intention to recommend this technology in the future. For
their study, they developed a conceptual model combining UTAUT2 and
attributes of DOI theory, along with perceived technology security. Data were
collected from students and alumni of universities in Portugal and analyzed
using Structured equation modeling (SEM). The model was validated
explaining 71.8% of behavioral intention to adopt mobile payment. The result
revealed the highest influence of compatibility on behavioral intention to
adopt mobile payments, followed by perceived technology security,

48
performance expectancy, innovativeness, and social influence. These factors
showed a direct positive influence on behavioral intention to adopt mobile
payment and the intention to recommend this technology. Consumers showed
interest to recommend the use of mobile payment to others through their social
networks etc. Effort expectancy, facilitating conditions, hedonic motivation
and price value were insignificant predictors of behavioral intention.
Phonthanukitithaworn, et al. (2016) identified the factors influencing an
individual’s intention to use m-payment services focusing comparison among
two groups i.e, current users (adopters) with potential users (non-adopters).
According to the study results compatibility, subjective norms, perceived trust,
and perceived cost influenced current users’ intentions to use m-payment
services. Whereas, potential users’ intentions to use m-payment were
influenced by subjective norms, compatibility, ease of use, and perceived risk.
In terms of their intentions to use m-payment services, subjective norms and
perceived risk had the strongest influence on potential users, while perceived
cost had the strongest influence on current users. Similarly, Pal et al. (2015)
examined the difference between the adoption pattern of early adapters and
late adapters in Thailand. For this purpose authors developed an extended
TAM model in which they added two users constructs (Personal
innovativeness & NFC knowledge) & four system constructs (user mobility,
reachability, compatibility & user convenience). Sample size for the empirical
analysis was 270, and the Chi-square test was used to for hypothesis testing.
The results suggested that previous knowledge about NFC technology is
important to PEOU for early adopters, and user’s convenience is important for
late adopters. It was found out that early adopters are doubtful about the
usefulness of the NFC.
Pinchot et al. (2016) explored the barriers to adoption of mobile payment
among American university students. Data was collected 136 undergraduate
and graduate students of Mid-Atlantic University were taken as sample
through convenience sampling. The included lack of awareness, lack of

49
availability and perceived security risk, and all were found to be significant
barriers in the adoption of mobile payment.
Mu & Lee (2017) investigated factors that influence users’ intention to adopt
third party mobile payment. They compared mobile payment provided by two
companies in China, Alipay and WeChat pay. TRA & TPB were used for
model formulation and constructs taken were trust, ubiquity, communication,
social influence, compatibility and usefulness. The findings suggested that
intension to use is influenced by trust and PU. Compatibility and social
influence positively influenced trust and PU.
In Taiwan, Yeh and Tseng (2017) studied college students’ behavioral
intension of using mobile payment. They used UTAUT2 model to see the
influencing factors on consumer’s intension. They found out the better
performance expectancy, facilitating conditions and habit, to be influence the
use of mobile payment the most. Whereas, behavior intension negatively
influenced by hedonic motivation.
Zhu et al. (2017) studied intention to continue use of mobile payment provided
by a specific provider Alipay in China. ELM model was adopted by them with
constructs of Intention to Use, Competitors’ marketing efforts, trust, subjective
norms, perceived usefulness, perceived integration, and source credibility. A
total of 332 samples were collected from the Alipay users out of which 320
valid response were analysed through PLS method. Consistent with Zhou
(2014) trust was found as an important factor for use intention. Subjective
norm was also found to be significant .It was found out that source credibility,
perceived usefulness, and perceived integration have significant impact on
intention to continue use and they were also found to affect trust. Trust was
found as an important factor for use intention.

50
In China, Yu et al. (2018) investigated the mechanism of enhancing trust when
consumer shifts from online payment to mobile payment, and examined that
how satisfaction and continuance intention of users is affected by trust. A total
of 219 respondents were selected for analysis, which had past experience of
using Alipay’s desktop site and application both. Findings suggested trust in
online payment imposes trust on mobile payment. Also, the consumers who
find similarity between online payment and mobile payment, there is high
level of trust. The trustworthy service provider enhances usage experience and
their satisfaction is high.
Humbani & Wiese (2018) investigated factors that influence adoption of
mobile payment. Multiple regression analysis was indicated that convenience
and compatibility drive consumers’ adoption whereas risk, cost and insecurity
are barriers in South Africa.
Vallespín et al. (2018) investigated the level of trust in mobile payment among
tourists. For this purpose he surveyed 456 regular travelers using smartphones.
Upon using Chi-square test, it was found out that education, income and
marital status has no impact on trust level. The results suggested that there is a
medium level of trust among tourists in Spain.
Mobile payment is used for payments of various utilities. Consumer Adoption
of m-payments has been studied in various utility contexts like for payment of
fees, e- government services, restaurants bill payment. Ahsan et al (2012) in
Australia studied use of mobile payment for various e-government services
and the factors affecting the adoption of such services. Based on their
literature review they found discarded theory and instead used characteristics
of mobile payments as constructs for their study summarizing 13 positive
influencing features (Ubiquitously available, Simple to use, Time-independent
, Place-independent , Diversified services, Used in lieu of cash , Spent more
time on mobile than PC, Credit facility, Instant confirmation of transaction,
Less time to complete a transaction, Now technology, Access to internet

51
service and Savings on fixed cost), and 14 negative influencing features
(Privacy, Confidentiality, Personal details, Transparency, Traceability,
Authentication, Trustworthiness, Non-repudiation, Legal provision, Technical
knowledge, Dispossession, Data interception, Hacking & Virus) for
acceptance of mobile payment. Out of 13 factors Convenience, Technological
Impulse and Credit Facility added to the acceptance of mobile payment in e-
Government services whereas out of 14 negative factors also only 3 factors
Operational Reliability Risks, Technological Protection of Security and Casual
and Incidental Risks obstructs the acceptance. Transportation service was
found to be the most appropriate service out of all services for making good
utilization of mobile payment technology in the e-Government environment.
Tossy (2012) examined the use of the mobile phone for making payment of
school fees in Tanzania. For this various candidates of primary and secondary
school examinations were surveyed. To discover the factors affecting the
payment of fees through mobile he proposed the adaptation of the UTAUT
model where he added perceived risk and trust as the additional constructs.
The rationale of this study was based on the increase in numbers of ownership,
access and usage in mobile phones among primary and secondary school
students. Out of six factors four were found to be significant factors:
performance expectancy, social influences and trust and perceived risk.
Hamza and Shah (2014) in Nigeria studied adoption of mobile payment
among students of tertiary institutions. But they also examined relationship
among gender and other factors. They used extended TAM model adding
perceived compatibility and social norms to original constructs (perceived
ease of use and perceived usefulness). Sample population was 214 respondents
from Bayero University Kano (BUK), North-West University, and Kano
University of Science and Technology (KUST) Wudil, Kano, Nigeria. By
regression analysis, variables explained 34 percent of the variance in
behavioral intention to adopt mobile payment system. Perceived usefulness,
perceived ease of use and social norms were found to have most impact on
behavioral intension to adopt mobile payment system. Also, the independent

52
T-test result revealed that gender has an impact on the influence of perceived
ease of use and social norms on intension to adopt mobile payment, where
male PEOU influenced male over female, and contrary SN influenced female
over male.
Mobile payment adoption has been compared among culturally different
countries lately to understand the global adoption of mobile payment. Zhong
(2009) did a comparative study of mobile payment procedures in two different
markets – Chinese and Finnish. It is believed that mobile payment consumer
penetration is faster in China as compared to Finland. He studied several cases
of mobile payment services in Finland such as transport ticket service, shopper
service, value-added services, electronic mobile payment service and
international mobile payment service. In China, he studied third party payment
procedures of companies such as Union Mobile Pay, SmartPay,
ChinaDotMan, YeePay and PayEase. Findings suggested developing a
generally accepted mobile payment solution with interoperability for different
markets with different benefits. Ting et al. (2016) used the theory of planned
behaviour (TPB) to investigate the influence of attitude, subjective norm and
perceived behavioural control with their respective predictors of behavioural
beliefs, normative beliefs and control beliefs on the intention to use mobile
payment system by comparing Malays and Chinese residing in Malaysia as
they are ethnically and culturally different. They used purposive sampling
technique so selected only the one who possessed mobile phone. By multiple
regression and t-test it was revealed that attitude, perceived behavioural
control and subjective norm are predicted positively by their respective belief
factors having a positive influence on use intention. Both Malays and Chinese
differ in perceived safety, interpersonal and external influences, subjective
norm, normative beliefs and use intention. This suggests that the two ethnic
groups have different intentions for the use of mobile payments. Zhang et al.
(2018) did a cross culture adoption comparison of mobile payment between
China and USA. They developed their own model combining the constructs of

53
two most preferred models TAM and UTAUT. Chinese were more influenced
by their social and peer groups than the Americans. In comparison to Chinese,
Americans proved to be more rational and risk avoiders worrying about the
security and privacy breach. The findings suggested that social influence and
personality traits have directly impacted technology acceptance, whereas
demographics, past behavior, socioeconomic status, and culture play different
moderating roles.
2.2.2.2 Consumer Adoption of M-Payments’ Different Technology
Mobile payment uses different technologies to function. Early research has
focused mainly on SMS technology (Mallat, 2006; Ondrus & Pigneur, 2006),
even now some researcher focus on remote payment (Slade et al., 2015).
Proximity payment being recent technology became popular for study lately
(Balachandran & Tan , 2015; Kerviler et al., 2016; Leong et al., 2013; Li et
al., 2014; Luna et al., 2017; Pal et al.,2015; Pham & Ho, 2015; Ondrus &
Pignuer, 2006; Slade et al., 2014). Some researchers even did composite study
on both remote and proximity payments like Cabanillas et al., 2017; Luna et
al., 2019; Shin et al., 2014). Kapoor et al., 2013 and Kapoor et al., 2015
studied Interbank mobile payments Service in India. Andreev et al., 2011;
Shaw, 2018 studied adoption of mobile payments through use of individual’s
mobile phone. Wearable is the latest technology used for making mobile
payments. Contactless bracelet such as Celego is used to pay for tickets of
transport (Gemalto, 2016). Smart watch such as Apple smart watch is used
globally for micropayments with the help of ApplePay (Apple, 2017).
Similarly, Samsung smart watch is also used for payments (Samsung, 2017).
Microsoft with the use of its Microsoft band 2 allows the consumer to pay at
Starbucks (Luna, 2017).
NFC came in 2007 and is considered as future of mobile payment (Ondrus &
Pigneur, 2009). Adequate researches have been carried out covering NFC
technology in mobile payments since then. NFC is more popular in USA,

54
Canada, Korea, Japan (Pal et al., 2015). Ondrus & Pignuer (2009) evaluated
potential of NFC for mobile payment and whether it will prevail in the future
market of Sweden. For this purpose they organized a roundtable conference of
16 industry experts from various sectors such as finance, telecom, retail,
technology, and public transport. After data interpretation, it was found out
that all industries appreciated NFC technology, and would like NFC to prevail
in the market. Balachandran & Tan (2015) investigated the factors that affect
intension to adopt NFC based mobile payment by consumers in Malaysia. For
this purpose they combined Innovation Diffusion Theory, and the attributes
considered for adoption are relative advantage, complexity, compatibility,
trialability and observability. The findings suggested that relative advantage is
not important for intension to adopt, if consumers perceive NFC difficult to
understand they will not use it, compatibility favours intension to adopt,
complete information about NFC will intend to use it, consumers will adopt
NFC if it comes with other services in addition to payment, consumers will
adopt NFC if cost of using and maintaining NFC is low. Pal et al. (2015)
studied the adoption of NFC technology in m-payments. The result revealed
that people with a high degree of personal innovation find the NFC payment
system easy to use and people posing some prior background knowledge about
the NFC payment system can easily adapt it. Pham & Ho (2015) studied
factors affecting intension to adopt NFC payments in Taiwan. The results
showed compatibility, perceived usefulness, additional values, trialability and
perceived risk were among the greatest determinants of behavioral intension,
whereas perceived ease of use, trust and cost were found to be unimportant. Li
et al. (2014) used extended Tam model to find factors affecting consumers’
adoption of NFC. Luna et al. (2017) investigated factors that directly or
indirectly affect the adoption of NFC technology in Brazil. They found
increase in the use of NFC technology with rise in use of other mobile related
application. As NFC is easy to use with unlimited functionality, it is gaining
popularity among the user. Personal innovation in IT, attitude and perceived
usefulness are factors affecting of future use of NFC technology. Another
55
study by Ramos de Luna et al. (2018), examined the factors of consumer
acceptance of mobile payment systems using NFC technology through a
conceptual model. The research was based on the TAM and included the
perceived compatibility, perceived security, personal innovativeness and
individual mobility in the research model. Their results indicated that variables
such as attitude, subjective norms and personal innovativeness are
determinants of the future intention to make payments via the NFC
technology.
Kerviler et al. (2016) investigated consumer adoption of proximity mobile
payment systems in France. They tested the low penetration of mobile
payment services using value theory. They compared risk associated with
proximity mobile payment with its perceived benefits (utilitarian, hedonic, and
social) and effects of perceived benefits, perceived risk, greater experience
with an in-store mobile service, in store m-info search effect of m-service
experience on intension to use proximity mobile payment. They found out
that perceived benefits and risks more strongly impact proximity payment than
proximity m-info search, and suggested that to pay through a smartphone an
extra push of offers is needed.
Lee et al. (2012) studied the factors related to the use intention of mobile
financial services in Korea. They included general technology perceptions,
technology-specific perceptions, user characteristics, and task user
characteristics of the service. 240 of respondents from bank participated in the
study. Duane et al. (2014) studied about consumer willingness to use their
smartphone to make m- payments in Ireland. For this, they investigated the
impact of trust, personal innovativeness, and perceived ease of use, perceived
usefulness and mobile self-efficacy in explaining consumers’ willingness to
use Smart Phones to make M-Payments. 59 of mobile phone users after
meeting the required criteria were considered for the study and the data
obtained were analyzed through PLS (SEM) which explained 53.4% of the
construct’s variance. Trust came out to be the most important variable among

56
all for consumer’s willingness to pay through their mobile, perceived ease of
use and perceived usefulness showed less importance while mobile self-
efficacy and personal innovativeness were almost insignificant. Kapoor et al.’s
(2014) empirically tested and compared the impact of innovative attributes,
taken from three different sets (Rogers, 1969; Tornatzky and Klein’s ,1982;
Moore and Benbasat, 1991) on adoption of Inter-bank mobile payment
services in the Indian context. The constructs were relative advantage,
compatibility, complexity, trialability, and observability taken from Rogers’,
1969, cost, communicability, riskiness, and social approval from Tornatzky
and Klein’s ,1982 and finally voluntariness, image, result demonstrability, and
visibility from Moore and Benbasat , 1991. Additionally behavioral intention
and adoption was studied to find the impact of above mentioned 13 attributes
on them. To get a homogeneous data response, total of 74 adopters and 249
non-adopters were selected from four different cities i.e, Delhi from north,
Bangalore from the south, Kolkata from east, and Mumbai from the west. The
result from linear regression analysis, revealed that except observability rest
all other four construct (i.e, relative advantage , compatibility , complexity and
trialability) adapted from Rogers’, 1969, were found to be significant
predictors of behavioral intentions of the consumers. Whereas out of 4
attributes, adapted from Tornatzky and Klein’s ,1982 , three attributes namely
cost, communicabilityand social approval were found to be significant
predictors while only riskiness was found insignificant on behavioral
intentions of the consumers to use interbank mobile payment services. Finally
out of 4 attributes, adapted from Moore and Benbasat, 1991, two variables i.e,
voluntariness and result demonstrability were significant predictors while
other two i.e, image and visibility were found as insignificant predictors
variables on consumer behavioral intention. With adjusted R-square ,
comparison among all three sets of attributes showed that attributes from
Rogers’, 1969 provided highest satisfaction followed by Moore and Benbasat ,
1991 and Tornatzky and Klein’s, 1982.

57
Consumer acceptance of Mobile payment was even compared for different
technology associated with m-payment by the researchers. Cabanillas et al.
(2017) compared the factors that influence consumers in using close proximity
NFC payment and remote SMS payment to find out the factors influencing
their consumer use. This study was done in Brazil by using TAM Model
integrated with perceived risk and subjective norm factors. Attitude was
found as the most important variable for both SMS and NFC payments
affecting consumer use intention. It was also found that next important factor
for SMS payments was perceived usefulness whereas social influence counted
as second significant factor for NFC types payments .Other two important
factors for SMS payments in sequence of significance were subjective norms,
and perceived security while for NFC payments it were perceived usefulness
and perceived security. Further, I.R. de Luna et al. (2019) did a comparative
analysis of factors affecting consumer acceptance in three different
technologies associated to m-payments. For this SMS (Short Message
Service), NFC (Near Field Communication) and QR (Quick Response) were
considered to find out the factors that influence the adoption of these m-
payment systems. This study was done in Spain and included TAM model
integrated with perceived risk and subjective norm factors. While Subjective
norm was the most important variable for SMS, it was also found important
factors for the other two technologies. Perceived usefulness, perceived ease of
use, perceived security and attitude was found important affecting all three
technologies but perceived usefulness was most important factor for QR
mobile payment system. This indicated that consumers do behave differently
in using different technology of m-payment systems. Further interrelationship
between the dependent variables indicated significant difference except for the
following- perceived usefulness and intention to use, attitude and intention to
use and perceived security and intention to use.
Shin et al. (2014) did a comparative studied between two culturally different
countries Korea and USA, where they considered both proximity and remote

58
mobile payment systems for the study. The sample size was taken as 283
American respondents and 314 Korean respondents. Regression analysis was
used to test three important factors- security, cost and convenience to find out
the influence on mobile payment frequency. They found out that the adoption
of mobile payment is low in USA as compared to Korea, because Americans
are satisfied with available card payment system. The regression analysis
showed mobile payment security is the strongest factor in both countries
which influences payment frequency. Slade et al. (2015) studied factors
affecting the adoption of proximity mobile payments (NFC) for non users in
UK which was believed to be first research of such kind in UK. They used
UTAUT2 model integrated with trust and risk as the two additional constructs
and suggested use of UTAUT 2 for future studies as suggested by Venkatesh
et al., 2012 and Leong et al., 2013. Their study suggested that NFC too is
being recognized among the users as remote mobile payments and believed it
as the future of mobile payments. They opted for convenience sampling to
select their respondent and gather data for their research. By performing
multiple regression their result revealed the strongest influence of performance
expectancy on non users’ intention to adopt NFC m-payments. Habit, social
influence, trust and perceived risk also influence non users’ intention to adopt
such payments. UTAUT 2 was validated by the researcher and the role of trust
and risk was also established in the adoption of mobile paymentsS. Hedonic
motivation which was significant by Venkatesh et al., 2012 was found to be
insignificant in this study with this inclusion of risk and trust. Slade et al.
(2015) studied adoption intension of RMP (Remote mobile payments) first
time in the UK. They used the UTAUT model in their current study by adding
three additional constructs namely innovativeness, risk and trust and taking
knowledge about mobile payment as moderating factors. They suggested to
use the UTAUT model in future research too as it was believed to be useful by
Williams et al., 2011. They used convenience sampling in this research by
taking staffs and students as their respondents from two educational
institutions. Snowball technique was also used as the initial respondents were

59
urged to help in getting more respondents by sharing this survey. A monetary
lottery was 59ebruary to strengthen the response rate which was suggested by
Deutskens et al., 2004; Sauermann & Roach, 2013. Structural equation
modeling (SEM) was preferred by them and they found that social influence,
performance expectancy, innovativeness, and perceived risk significantly
influenced non-users adoption intention for remote mobile payments, social
influence being the greatest predictor among all. But non-users who pose
previous knowledge about remote mobile payment finds trust more important
while the ones without previous knowledge find utility of remote mobile
payment most important for adoption of such payments.
2.2.3 Merchant Adoption of Mobile Payment: A Literature Review
M-payment adoption has also been studied in the context of merchants but it is
very recent and less in comparison to the consumer adoption aspect of m-
payment system. M-payments for merchants have been studied to basically
find out the factors which lead to investment decision of merchant in m-
payments technology and barriers faced by them in adopting m-payments.
Hayash & Bradford (2010) explored the mobile payment adoption in retail.
For this purpose open-ended questionnaire was used to gather information
from 21 industry experts in HongKong. The findings suggested that
applications that are widely accepted are more likely to integrate more
merchants. Lai & Chuah (2010) investigated the external forces and
merchant’s own capabilities which influence the adoption of mobile payment
by merchants in Hong Kong. A semi-structured survey was carried out on 21
industry experts to find the insides of retail adoption of mobile payment. The
findings suggested that retail merchants must give special attention to young
consumers and micro-payment transaction for increased usage, and give
attention to promotion. Market forces and organizational enablers play a
crucial role in influencing adoption. Mbogo (2010) investigated the success
factors that contributed in the use of mobile payment by micro business

60
operators using M-Pesa in Kenya. M-pesa has been very successful in Kenya,
and subscriber base was increasing at rapid during research, and majority of
micro business operators were using M-pesa for various services. By using the
extended TAM model, it was found out that the money transfer technology
plus its accessibility, cost, support from government and service provider, and
security factors are responsible for intention to use and actual usage of the
mobile payment services by the micro businesses. Behavioral intension to use
is highly correlated with perceived convenience, and significantly correlated
with actual usage.
Ahsan et al (2012) examined the factors that influenced consumer adoption of
mobile payments and what influenced consumers to pay through mobile
payments for e-Government services in Australia. An online questionnaire-
based survey was used to find out the positive and negative factors of
adoption. It was found out three factors influenced the acceptance of mobile
payment in e-Government services, which were ‘Convenience’,
‘Technological Impulse’ and ‘Credit Facility’. On the other hand, three
negative factors which were, ‘Operational Reliability Risks’, ‘Technological
Protection of Security’ and ‘Casual and Incidental Risks’ hinder the
acceptance. Peng et al (2012) investigated the effects of perceived security,
perceived compatibility, destination m-payment knowledge, and tourist
susceptibility on use of m-payment by the tourists at tourist destination. By
face-to-face questionnaire surveying and using the Structured Equation Model,
they found out these factors strongly supported use of mobile payment by
tourists. It is important for tourists to make tourists feel safe using mobile
payment.
Chandrashekhar & Nandagopal (2013) discussed problems faced by merchants
in using m-payment at retail PoS in India. By interviewing 33 merchants in
Coimbatore city, they found out that there is very low merchant readiness for
implementation of m-payment, and this is mostly because of trust issues. They

61
suggested that merchants should be made aware about the benefits of m-
payment.
Petrova & Wang (2013) did a qualitative study to find out the factors and
challenges related to adoption of mobile money by small businesses. By
conducting interviews with semi- structured questionnaire, it was found that
merchants found m-payments are efficient and time-saving leading to higher
revenue generation possibility. So, service providers need to develop m-
payment with the keeping interests of SME businesses in mind.
Chale & Mbamba (2014) studied the influence of mobile money in the growth
of SMEs in Tanzania By doing multiple regression analysis, it was found out
that the businesses which used mobile money for sales transactions, efficiency
in purchase of stock, receiving payment, payment of goods and services,
savings as well as money transfer, showed positive growth in their business.
Otieno & Kahonge (2014) investigated that when an organization thinks of
adopting mobile payment, how technological, organizational and
environmental variables affect their decision, or are there any unknown
possible extra reasons for them to consider by SMEs in Kenya. For this
purpose they used Structured Equation Model (SEM) and concluded that there
was significant effect of various technological, environmental and
organizational factors on the adoption of mobile payment.
Guo & Bouwman (2015) analyzed m-payment ecosystem from the merchant’s
point of view, by conducting interviews to identify thirteen elements resource
configurations, strategy orientations, managerial issues , compatibility,
perceived security, trust, consumer readiness, critical mass, marketing
strategies, platform openness, partner readiness, intuitional pressure and
market opportunity that play an important role in merchants’ adoption of m-
payment in China.

62
Sidek (2015) discovered the factors that influence both consumers and
merchants in adopting e-payment in Malaysia and find out the interconnection
if any. 100 business owners, 500 consumers and 37 director-level officers of
service providing various companies were questioned for survey data. The
findings suggested that decision of a business to adopt e-payment technology
was affected by seven organizational factors (human resources, business
resources, technology resources, governance, business strategy, commitment
and awareness). Business characteristics identified as moderators for the
business model were firm age, firm size, and business performance.
Meanwhile, for consumers’ age, gender, level of education, and usage
experience were the moderators for the consumer model.
Sokobe (2015) inspected how background of the entrepreneur and their ease of
use of electronic gadgets influence adoption e-payment in SMEs. Electronic
payment is advantageous for SMEs as it reduces their transaction time, help in
credit processing, help design consumer products and financing terms. After
using a close ended questionnaire to survey 50 hotel managers in Kisii town,
he found out that the background characteristics of entrepreneurs such as age,
level of education, and relevant basic skills strongly influence the adoption of
electronic payment by SME hotels.
Thoi (2016) investigated the benefits perceived by merchants influencing them
to adopt mobile payment in Sweden. 14 merchants from various industries
were considered for analysis. The findings suggest that knowledge is required
to pass the instep threshold, taking advantage of each other’s installed base,
acting on their own behalf to increase consumer base, expenses rather than
profitability, enables the implementation of loyalty programs, enables
conversion of physical cards into virtual, perceive barriers as low and perceive

63
enough values are the key mechanisms for merchants to adopt mobile
payments within the Swedish market.
Cabanillas & Rubio (2017) examined the perspective of merchants regarding
adoption of mobile payments. Semi-structured questionnaire was used to
interview merchants and neural network analysis was done to find out that,
micro-sized enterprises are more likely to adopt mobile payment as they find it
advantageous.
Cabanillas et al (2017) examined the reasons because of which merchants
refuse to adopt mobile payment systems in Spain, through exploratory and
qualitative investigated the determinants of m payments. Upon surveying 151
retail merchants, it was found out that demand for mobile payments has to be
increased, trust in new technology is to be developed, cost effectiveness,
secured infrastructure and increase in turn over will strongly influence the
merchants to adopt.
2.2.4 Literature review on Mobile Payment Research: Indian Context
Goyal et al. (2012) evaluated perception of urban mobile banking users in
India. Through structured questionnaire 100 respondents were surveyed. On
using one way ANOVA for testing, it was found out that mobile handset
operability & security are critical issues. They suggested that players of m-
banking ecosystem should come up with solutions to ensure consumers a safe
m-banking environment.
Raina (2014) gave an overview of all available technologies of mobile
payment available in India, and detailed process of performing the emerging e-
payments. This also included the security point of view at transaction, network

64
and application level. He concluded that mobile payments converges different
stakeholders MNOs, telecom companies, handset manufacturers and payment
service providers on a single platform.
Roy & Sinha (2014) examined the factors influencing consumers’ adoption of
e-payment, popular options, check the level of awareness and its usage and
find suggestions for improvement of e-payment in Kolkata city. After
randomly surveying 650 consumers from various fields, it was found out that
Perceived ease of use (PEOU) is most significant factor in continued use of e-
payment and consumer attitude had least significance for adoption.
Yadav et al. (2014) investigated consumer’s intention to adopt internet
banking by combining TPB and extended TAM. Sample size of 210 young
consumers was used for the survey. Structured Equation Modeling was used to
find the results which showed that perceived usefulness, attitude, subjective
norms and perceived behavioral control strongly influenced consumers’
intention to adopt. Results showed that consumer do not find using internet
banking easy and they feel internet banking is a risky affair.
Sikdar and Makkad (2015) investigated a five-factor model of adoption of
online banking by Indian consumers. The sample size was taken as 280.
Findings suggested that trust, usage constraint, ease of use, accessibility and
intension to use are valid factors that determine internet banking adoption
among Indian consumers.
Singh & Islam (2015) used secondary data to find out there has been constant
rise in all deciding factors which support e-commerce industry, making path
easy for m-commerce to flourish. M-payment with secure payment sessions
will transform the future as per authors.

65
Wani & Ali (2015) in their article Review & Scope in the Study of Adoption
of Smartphones in India, summarized theory of innovation diffusion, showed
the present scenario of smartphone market in India, and suggested a model for
adoption of smartphones in India. They suggested that, on adding additional
constructs of TAM, will give insights of consideration for buying
smartphones.
Shankar & Kumari (2016) examined the factors which influenced adoption
rate of m-banking in Indian consumers. After collecting data of 248 consumers
and on conducting exploratory factor analysis, it was found out that usefulness
had most impact on adoption, with awareness, ease of use, compatibility, self
efficacy and social influence have positive impact on adoption of mobile
banking. Security and privacy are major concerns for consumer, which
negatively impact adoption rate.
Kumar et al. (2017) investigated the intension of use of mobile wallet among
university students. Using TAM in addition of cash crunch factor, it was found
out that cash crunch significantly influenced adoption of mobile wallet.
Manikandan & Jayakodi (2017) studied consumer perception toward mobile
wallet, factors influencing its adoption and problems faced by consumers in
use of mobile wallet in Chennai city. Upon analyzing responses of 150
respondents, it was found out that there will be tremendous growth in mobile
wallet usage as they have a large base of satisfied consumers. Brand loyalty
and convenience play important role in adoption of mobile wallet and security
concerns negatively impact user adoption.
Podile & Rajesh (2017) investigated the impact of transaction related factors
including convenience, security, costs, incentives and procedures on cashless
transactions in India, technical factors, lack of technical knowledge to
consumers, financial limitations and delayed reimbursements. After collecting
66
data from 195 respondents through questionnaire and performing Chi-square
test, it was found that people are getting comfortable with cashless mode of
payments, but negative issues such as security, poor network and lack of
merchants’ willingness are impacting the cashlessness drive. If the problems
are rightly addressed by government and banks, India can achieve it dream of
cashless India.
Roy & Sinha (2017) examined the variables that influence adoption of e-
payments and investigated how demographic factors influence in adoption of
e-payments. Authors determined 465 as their sample size, and chose chi-
square test, one way Analysis of Variance (ANOVA), Correlation analysis,
Regression analysis, Factor analysis, Multiple regression for hypothesis
testing, and SEM was used to test the difference in adoption level. The results
indicated that PU, PEOU and perceived risk are indicators of consumers’
adoption of e-payment. The study suggested that it was important to educate
consumers about security features of e-payment as it is hindering adoption of
e-payment.
Sahu & Singh (2017) examined the factors that will help India become a
cashless economy in Allahabad city. After conducting qualitative analysis,
through literature review and interviews of experts, 13 factors were found like
government policies, market, type of card, type of mobile etc. influenced the
usage of mobile payment in India.
Shukla (2017) developed a model to predict consumers’ liking and
investigated business trends. By studying secondary data from RBI and
sampling 400 respondents from Lucknow, it was found out that lack of
awareness, poor promotion and poor internet connectivity are major issues in
growth of m-wallets. He suggested that the service providers should focus on
age group above 45 for larger business volume.

67
Singh et al. (2017) tested model of consumers’ satisfaction and intension
towards mobile payment. Sample size of 204 North Indian consumers was
taken for the survey. Regression analysis, descriptive analysis and ANOVA
tests were done, and the result suggested consumer’s perception, preference
and satisfaction show strong relationship among each other.
Tripathi and Nanda (2017) investigated impact of digital payments on retail
industry and on shopping behavior of consumers in Delhi NCR region.
Primary and secondary data were analyzed to find the results which showed
that India is getting ready for cashless economy and if consumer’s needs are
understood online retailing will boom.
Ashoka & Ramaprabha (2018) in their research measured the perception of
consumers in usage of mobile banking and investigated that does region has
impact on adoption of m-banking. The major findings suggested that, age
group and occupation has no influence on mobile banking usage. Study
revealed that perceived ease will lead to perceived usefulness.
Lonare et al. (2018) inspected the variation between user base to two different
tier cities, studied adoption by small retailers and trends which brought
increase in e-wallet usage. The authors found out that users in metro cities are
more than tier-2 cities, and ease of use supported adoption of e-wallet. There
is less impact of e-wallets due to demonetization and the wholesaler vendors
still have not adopted e-wallets.
Vidyashree et al. (2018) investigated people’s attitude towards digital money
and whether people prefer to use it. The authors found out that people have
positive attitude towards digital payment, and suggested that banking
institutions should build secure and fast online transactions for better adoption
rate.

68
Vally and Divya (2018) investigated that do demographic factors have positive
impact on digital payment system after demonetization. Primary data was
collected from 183 respondents from Hyderabad and Chi-square test was used
for analysis. It was found that technological development have improved
performance of banking sector and awareness plays a crucial role in usage of
technology.
Eswaran (2019) investigated the impact of demographic factors on adoption of
digital payments mode. 150 were taken as sample size, and ANOVA test was
used for hypothesis testing. It was found out that except education, no other
demographic factor has impact on adoption of digital payment.
Tiwari et al. (2019) investigated adoption of digital wallets in NCR region and
suggested ways to increase adoption of digital wallet. The sample was 200
respondents and ANOVA test was done to find the results. It was found out
that gender and age had impact on level of awareness. It was found that there
existed a strong relationship between demographic and preference of digital
wallets over cash.
2.2.5 Literature review on Review Papers on Mobile Payment Systems
Dahlberg et al. (2008), reviewed previous literature on mobile payment
services, analyzed the different factors that impact the market, and gave
directions for future research on this field. They proposed a framework of four
contingency and five competitive factors, and organized the contemporary
mobile payment research under the proposed framework for their analysis.
The findings showed that social/cultural factors are scarcely studied in the
mobile payment context. Also, factors like legal, regulatory and
standardization environment and its influence on mobile payment services
development are not studied. More research considering merchants was also
69
suggested by them. Another similar study was done after 7 years by Dahlberg
et al., (2015) in their research paper named. A critical review of mobile
payment research, where they studied 188 articles published during the last
eight years (2007-2014), of which 87 were in major conferences or in journals
with an impact factor greater than 1.0. Findings revealed that even after 15
years of research next to nothing is known about merchant adoption,
competition between mobile and other payment instruments, and the impacts
of changes in commercial, legal, regulatory, social and cultural environments.
Also, the study reveals that the researchers have continued to study adoption
interest only.
Diniz et al., (2011) in their research Mobile Money and Payment:
a literature review based on academic and practitioner-oriented publications
(2001-2011) , studied 94 peer-reviewed articles and 92 non-peer-reviewed
practitioner-oriented publications. The work focused on mobile
payment/mobile money (as opposed to mobile financing in general) with a
special stress on local development (but not limited to works that deal with
development or developing countries). They suggested future researchers to
consider the works done so far by previous researchers and suggested studies
on social and economic factors affecting adoption of mobile payment.
Albuquerque et al. (2016) in their another paper, Mobile payments: a scoping
study of the literature and issues for future research, studied 94 peer-reviewed
papers published between 2001 and 2011 to provide a comprehensive picture
of the knowledge, production and dissemination about mobile payments . The
study revealed some major gaps in the previous researches. Many of the
reviewed papers relied on TAM and its variations to determine the factors that
may influence the adoption of payment by consumers and/or merchants at the
micro (individual) level, neglecting other important contextual and
institutional factors, such as regulation and socio-economic implications. Also
there was lack of in-depth case studies that closely analyze the wider socio-
economic implications (i.e. at the meso-level of communities and macro level

70
of countries) of practical mobile payment schemes. The study also revealed
that most of the previous researchers concentrated only on those few mobile
payment projects that have become famous and established, and thus have
ignored more recent and smaller projects. Another observation was that there
was lack of primary multiple case studies with cross-country comparisons of
mobile-payment schemes.
Dennehy & Sammon (2015) studied 40 papers including top twenty cited
papers since 1999 and the twenty most recently published papers on m-
payments since August 2014. The study aimed at identifying the key research
themes and methodologies researched. Study revealed that there has been a
shift in focus by researchers examining the m-payment phenomenon with an
increase in empirical studies which suggests that m-payments as a research
phenomenon has stabilized in recent years as researchers in general have
established the characteristics of an m-payment system that are widely
accepted by the research community. The study also reveals an increase in
studies examining the legal, regulatory & standardization issues and the
technology, security & architecture issues and their impact on multiple
stakeholders, indicating that these are influential factors that shape the design
of the m-payment business model, as well as being a key driver for the
adoption of an m-payment system. Similar to the findings of Dahlberg et al.,
(2007), consumer adoption continues to be a popular aspect of research
throughout the time frames this research and researchers have continued to use
TAM as a model for understanding technology adoption.
Harris et al. (2019), reviewed 57 research papers with prime focus on
consumer mobile payment adoption in the past. Similar to the findings of
Dahlberg et al. (2015), TAM and UTAUT/UTAUT2 were found to be the
primary models for the adoption research.
Jain & Singhal (2019) provided a systematic review of literature on digital
banking adoption published from Jan 2005-2018 of 27 national articles of

71
Indian origin and 73 International articles appeared in 53 journals and
represent a reasonably deep view in the field of digital banking acceptance
research. Findings suggest that TAM and its modification to explain the usage
of m-banking technology. One of the findings of the study is that of all the
researchers conducted worldwide on internet banking, mobile banking, m-
wallets or e-wallets the target population is youth i.e. university or college
students. Very few numbers of studies are conducted on 30+ age groups. Also
social variable is the most prominent factor in adoption of technology.
2.2.6 Theories Used in Adoption Research
Various theories have been developed to study the adoption behavior. These
theories are used solely or in combination for further development of research
models by the researchers in their study to study the behavioral intention of
individual towards a particular technology. Researchers have focused on
developing and testing models using these theories since three decades to
predict the information system (IS) adoption and usage. TAM has been the
most successful and most adopted theory that has been tested by significant
number of researchers. TAM was first conceptualized by Davis in 1985,
which was later first model was developed in 1986 and finally the first
modified version was given by Davis et al in 1989 and later in 1996 final
version of TAM was released by Venkatesh & Davis.
Davis (1989) developed new scales for perceived usefulness and perceived
ease of use, which are main constructs of TAM. Venkatesh and Bala (2008)
developed an integrated TAM model by including individual IT adoption.
Subjective norm, Image, Job relevance, Output quality, Result
demonstrability, Computer self-efficacy, Perceptions of external control,
Computer anxiety, Computer playfulness, Perceived enjoyment, Objective
Usability, Experience, Voluntariness.

72
TAM is most popular among all the models and is used in almost most of the
technology acceptance research (Lee et al., 2013) because of its simplicity to
use (Lai, 2017). As per Bagozzi 1992 best model to be incorporated is one
with most parsimony. TAM is considered as a mature model (Im, Hong and
Kang, 2011). TAM is the one of the most used models for mobile payment
research in Indian context (Pal et al., 2019).
2.2.7 Variables Used in Mobile Payment Research
The term demographics refers to particular characteristics of a population
which includes age, race, gender, city, religion, income, education,
occupation, home ownership, gender, marital status, size of the family, health
and disability status, and psychiatric diagnosis. Regarding technology
adoption, demographic variables affecting the adoption intension are age,
gender, education, income, occupation, city etc. Venkatesh et al. (2003) stated
that gender and age are important factors in technology adoption. Dahlberg
and Oorni (2006) found that age and occupation are differentiating factors for
mobile payment adoption. Alafeef et al. (2011) studied affect of demographic
factors on adoption of mobile banking in Malaysia, where they revealed that
demographic factors (age, gender, income, education) have superior impact
than any other adoption factor. Chan & Chong (2013) too studied
demographic factors and their effect on technology adoption.
• Age- Wood (2002) found out that age group of below 25 yrs
easily adopt new technology, than older generation. Dai et al.
(2007) found out that older people use more m-commerce than
younger generation in China, because of their less income.
Perera (2007) and Alafeef et al. (2011) found that age has
impact on use of m-payment services. Padashetty & Kishor
(2013) found out that teenagers are willing to learn and adopt

73
new technology, than adults of past generation. Li et al. (2014)
stated that people of different age groups show different
willingness to use mobile payment services. Cabanillas et al
(2014) found out that age has significant role on behavior and
technological acceptance. Another study by Kabata (2015) in
Kenya too showed similar results where age was found to
strongly influence use of mobile payment services. Shaw
(2015) found out that there is no difference in intension to use
mobile wallet between young and old consumers.
• Gender- Gender as a moderating variable was studied by many
researchers. Venkatesh & Morris (2000) found gender to be a
vital factor in technology adoption and usage in which they
found out that males are more inclined towards adoption of
technology than females. Liaw (2002) revealed that male
students used web technology more than the female students.
Similarly, Perera (2007) and Chen & Nath (2008) in USA,
found that gender has impact on use of m-payment services.
The finding of Alafeef et al. (2011) in the context of gender was
consistent with the findings of the above mentioned researchers.
Shaouf and Altaqqi (2018) did a literature review regarding
gender difference in IT domain including research papers of the
period 2000-2017, and suggested gender difference as an
important factor in moderating relationship between different
influencing variables, where they found out that men have
positive tendency to try a new information technology than
women.
Dai et al. (2007), and Hamza & Shah (2014) found no
significant difference in adoption of mobile payments. Similar
finding was observed by Li et al. (2014) in case of willingness
of purchase through mobile payment and Jaradat & Faqih

74
(2014) on adoption of m-payment technology in Jordan. Kabata
(2015) showed that gender has no influence on use of mobile
payment services in Kenya.
• Income- Mattila et al. (2003) found level of education as an
important factor for use of internet banking. Monsuwe et al.
(2004) found out that higher income group will tend to adopt
new technology early. Dai et al (2007) too supported the above
findings. Alafeef et al. (2011) found income has great impact on
adoption of mobile banking in Jordan. Chan & Chong (2013)
found out that education level influence m-commerce activities.
Li et al. (2014) stated that people of different income groups
positively influence use mobile payment services. Abayomi et
al. (2019) too found that education qualification as influencing
factor for adoption of mobile banking services in Nigeria.
• Education- Burke (2002) found out that higher education will
lead higher inclination online modes of shopping. Mattila et al.
(2003) found out that internet banking adoption is highly
influenced by the education level of respondents. Alafeef et al.
(2011) found education has great impact on adoption of mobile
banking in Jordan. Chan & Chong (2013) found out that
education level influence m-commerce activities. Similarly,
Kabata (2015) too supported the finding.
Abayomi et al. (2019) found that education qualification is not
significant for adoption of mobile banking services in Nigeria.
• Occupation- Abayomi et al. (2019) found that occupation as
influencing factor for adoption of mobile banking services in
Nigeria.

75
2.2.8 Findings from Previous Research Regarding Independent Variables
i. Perceived usefulness- Perceived usefulness as defined by Davis
(1989) as “the degree to which an individual believes that using a
particular system would enhance his or her job performance”
ii. Perceived ease of use- is one of the main construct of TAM model.
Perceived ease of use is defined by Davis (1989) as “the degree to
which an individual believes that using a particular system would
be free of effort.”
Several studies have proved positive role of both perceived usefulness and
perceived ease of use on technology adoption decision by consumers. Chen
and Adams (2005) found out perceived ease and perceive usefulness has
significant importance for use intention of consumers to adopt m-payments.
Cheong & Park (2005) found both the variables of utmost importance for
mobile internet adoption in Korea, whereas, Wu & Wang (2005) found both
the variables as important factors for mobile commerce adoption. Dahlberg et
al (2008) too proposed that both out perceived ease and perceive usefulness
exerts great impact on users intention to adopt m-payments. Kim et al (2010)
too supported the importance of perceived usefulness and ease of use for
consumer’s adoption of mobile payment. Jeong and Yoon (2013) found
positive impact of perceived ease of use on mobile payment system.
According to research review done by Karsen et al. (2019) of research papers
between 2014 & 2018, perceived ease of use and perceived usefulness are the
most important factor for using mobile payments system. Pal et al. (2019)
also found perceived usefulness and perceived ease of use as the most studied
factor in the Indian context.
iii. Social influence – Park et al. (2007) in their study found social
influence to affect adoption decision. Scheirz et al. (2010) too
found out subjective norm to have greater impact on consumer’s

76
decision to adopt mobile payment. Yang et al (2012) also
suggested that social influence poses high impact on potential users
to take adoption decision. Social influence is among the top 10
factors for using mobile payment system (Karsen et al., 2019).
2.2.9 Brief Summary of Research Work
Table 2.1: Brief summary of research work
Sl.
No.
Literature
Reviewed
(Title of the
paper, article
etc. along with
the source, i.e.
the name of
the Journal,
magazine,
Book etc.)
Literature
Type (Research
paper, Review
paper, Chapter
of the book etc.)
Author/s
Gist of Points
Gained
Linkage to
this
Research
1
Mobile
Payment: A
Journey
Through
Existing
Procedures
And
Standardization
Initiatives
IEEE
Communications
Surveys &
Tutorials
Stamatis
Karnouskos
&
Fraunhofer
Fokus
(2004)
Concept of
mobile
payments,
players of
mobile
payment
ecosystem,
characteristics
, mobile
payment
procedures are
dealt in this
research
This research
paper is of
very
importance as
this provides
the basic
knowledge
about mobile
payment
system.
2
Mobile
payments:
Moving
towards a
wallet in the
cloud?
Communications
& Strategies
Sophie
Pernet-
Lubrano
(2010)
Mobile
payment could
be the initial
step towards
ubiquitous
means of
payment.
Wallet cloud
It helped in
arriving at
future scope
of mobile
payment

77
e.g. TV, car,
game console,
tablets etc.
could be used
for future
payments.
3
Influence of
age in the
adoption of
new mobile
payment
systems
Computers in
Human
Behavior
Francisco
Liebana-
Cabanillas,
Francisco
Munoz-
Leiva and
Juan
Sanchez-
Fernandez
(2015)
Age of users
has been
studied as the
moderating
variable with
other variables.
This research
helped in
finding
impact of age
on mobile
payment
adoption
4
Mobile
payment
services
adoption across
time: An
empirical study
of the effects
of behavioral
beliefs, social
influences, and
personal traits
Computers in
Human
Behavior
Shuiqing
Yang,
Yaobin Lu,
Sumeet
Gupta,
Yuzhi Cao
and Rui
Zhang
(2012)
Factors
affecting pre-
adoption and
post adoption
including
behavioral
beliefs, social
influences, and
personal
Traits.
This research
helped me in
finding the
factors for my
research
5
A Study on the
Scope of the
Virtual Wallets
in Indian
Market –Issues
and Challenges
International
Journal of
Multifaceted
And
Multilingual
Studies
Mr. Sai
Kalyan
Kumar
Sarvepalli
and Dr. N.
R. Mohan
Prakash
(2016)
The researcher
has proposed a
model helpful
for the virtual
wallet
companies-
EARN Model,
E – Empathize,
A – Adoption,
R – Reiterate,
N – Nexus.
This research
also discusses
the advantages,
This helped
me in
understanding
about virtual
wallet in
Indian
context.

78
disadvantages,
issues and
challenges of
Indian virtual
market.
6
A Comparative
Study Of
Smartphone
User’s
Perception And
Preference
Towards
Mobile
Payment
Methods In
The U.S. And
Korea
The Journal of
Applied
Business
Research
Seungjae
Shin, Won-
Jun Lee and
Dustin
Odom
(2014)
Two
technically
advanced
countres
Korea and U S
has been
compared for
mobile
payments
adoption
where
adoption was
seen more in
Korea in
comparison to
US
This research
helped in
comparative
study among
Ranchi and
Kolkata
7
Determinants
of behavioral
intention to use
mobile wallets
– a
conceptual
model
Journal of
Management
Prajod
Sunny and
Ajimon
George
(2018)
Adoption of
mobile wallet
is studied
where
demonetization
has been
studied as one
of the
independent
variables.
This research
helped in
finding
impact of
government
on mobile
payment
adoption
8
Trends in
mobile
payments
research: A
literature
review
Journal of
Innovation
Management
Denis
Dennehy
and David
Sammon
(2015)
This paper
reviewed
literature from
1999 to august
2014 and
identified the
key research
themes and
methodologies
used for m-
payment
This helped
me work on
the gaps to
avoid
repetitive
work

79
research
studies.
9
The economics
of mobile
payments:
Understanding
stakeholder
issues for an
emerging
financial
technology
application
Electronic
Commerce
Research and
Applications
(Research paper)
Yoris A. Au
and Robert
J.
Kauffman
(2006)
This research
discusses the
mobile
payment
system,
theoretical
background
and gave a
framework of
m-payment
ecosystem.
They also
analysed the
issues of
various
stakeholders
involved.
This helped
to understand
basics of
mobile
payment
system.
10
A
Compendious
Study of
Online
Payment
Systems: Past
Developments,
Present Impact,
and Future
Considerations
International
Journal of
Advanced
Computer
Science and
Applications
(Research paper)
Burhan UI
Islam Khan,
Rashidah F
Olanrewaju,
Asifa
mehraj
Baba, Adil
Ahmad
Langoo and
Shahul
Assad
(2017)
Discusses the
current
scenario of
various
electronic
payments
worldwide.
The
informations
of this
research
paper helped
in
understanding
the various e-
payments and
adoption
factors
11
An Empirical
investigation
on the
Relationship
Between
Technological
Infrastructure
and
International
Journal of Arts
and Commerce
(Research paper)
Mberia Paul
Muthure,
Dr.Gorretty
A Ofafa,
Muathe
Stephen M
A. and Ms.
Jedidah
Poor
Technological
infrastructure
and excessive
taxes paid by
m-payment
agents to to
government is
Role of
technology
and
government
in use of m-
payment

80
2.3 Research Gap
2.3.1 Major Research Gaps
Based on the literature review done, following major research gaps were
observed:
• Not much research has been done on merchant adoption in India
• Research considering more than one stakeholders or more than one
elements of ecosystem is rare in Indian context.
• Plenty of research has been done on the concept of intension to adopt
and not considering the actual acceptance.
• Cross city research in same the country has not done in India
• Legal, regulatory and standardization issues on various stake holders
has not been rarely studied.
• Ample research done on model formulation based on TAM and its
succeeding variations such as TRA, UTAUT, TPB, DTPB
Government
Regulations on
Effective
Operations of
m-Payment in
Kenya
Muli
(2013)
major
hinderance in
developing
country like
Kenya for m-
payments
12
Biometric
Electronic
Wallet for
Digital
Currency
International
Journal of
Research in
Engineering and
Technology
Suhas M S,
Abhilash C
B, Vikas K
C and Amit
Pareek
(2014)
There is need
for biometric
electronic
wallet to store
and transfer
digital
currencies for
higher
security.
This research
helped me
understand
the future
possibilities
of digital
wallets and
how a safe
digital wallet
could be
given to
clients.

81
• There is no study studying the advantages and disadvantages of various
mobile payments available in India.
• Target population of most of the researchers were youths i.e. university
and college students.
• Gaps in terms of factors that are not properly dealt
➢ Changing commercial environment
➢ Social and cultural environment
2.3.2 Research Gaps Considered for This Research
There is a major gap in the merchant adoption area as in India there has not
been much research covering the merchant adoption issues so the merchant
aspect needs to be paid attention.
• There has not been much study covering the merchant adoption of
mobile payment system. Therefore, this study tries to cover merchant
aspect too.
• Maximum researchers in the past, have concentrated on the adoption
intension not focusing on the actual usage of mobile payment system
by merchants and consumers. Therefore, this research study primarily
aims at studying the actual usage level rather than the adoption
intension.
• Very little importance has been given to tier II cities for this topic. Here
in India where we see that small village like Adodara is going cashless,
alarming us that its high time we focus on tier II cities and towns not
just keeping our research confined to metro cities. Therefore this study
considers tier II city like Ranchi for this study.
2.4 Summary
This chapter has reviewed many available researches on m-payment, e-
payment, mobile/net banking and various technology-based payment systems

82
of both consumer and merchant adoption. The researches were reviewed from
countries and cities all over the world. Various factors were considered
suitable for our own research, and hence the researcher decided to study them
in their own research.
Various theories given by researchers since the past decades which were
related to adoption research were also studied. Research reviews done by past
researchers were also studied. Based on the literature reviewed, research gaps
were identified.

83
CHAPTER 3: RESEARCH
METHDOLOGY

84
CHAPTER 3: RESEARCH
METHDOLOGY
3.1 Overview
This chapter deals with the complete research plan consisting of research
question arising out of the research problem and formulation of research
objective from the research questions. Further to meet the objectives, research
hypothesis is formulated and tested. This chapter describes about the research
methodology adopted in this research in detail. Research methodology is a
blueprint to solve the research problem. Therefore, research methodology not
only talks about the research methods to be used but also the rationale behind
selecting the method in the context of research study, explaining why a
particular method or technique is used so that research results are capable of
being evaluated either by the researcher himself or by others (Kothari and
Garg, 2014). The research methodology is different from research methods or
technique. Various methods or techniques adopted by the researchers in their
research operations are referred as research methods.
The discussion in this chapter will throw light on the research design, source
of data, sampling design, research instruments opted for data collection, and
analysis tools used for analysis. The purpose of this study is to analyze the
factors that influence consumers’ and merchants’ adoption of mobile payment
system in Ranchi and Kolkata cities. The research study is based on
descriptive research design.

85
3.2 Research Question
a) What is the acceptance level of mobile payment systems among the
merchant and consumers in India?
b) What is the frequency and usage level of mobile payment system?
c) Is there any difference in the level of awareness and usage of the
mobile payment system among both consumers and merchants of
Ranchi and Kolkata?
d) What is the effect of demographic factors on the level of awareness
and use of the mobile payment system for both merchants and
consumers?
e) How positively do usefulness, ease of use, government initiatives,
social influence, consumer influence and application providers affect
the continued use of mobile payment?
f) What are the obstacles faced by merchants and consumers while using
mobile payment systems? What are the reasons of not using mobile
payment?
3.3 Statement of the Problem
Technology has driven the Indian society in the recent past (Singh et al., 2017)
and so has the use of mobile phones and its services increased by the Indians
(Pal et al., 2019). Mobile payment system surged in India after
demonetisation, still mobile payment system has not attained the growth it was
expected to (Sinha et al., 2018). So, there is a need for a fresh study to see if
still there is a low adoption of mobile payment systems in India or not.
Most of the previous researchers have examined the same variables for their
study such as perceived usefulness, perceived ease of use, social influence etc.
These factors have proved to be important predictors of adoption intention but

86
we also need to study new variables for payment research. So, this research
adds new variables by taking government initiatives and application providers
for this study.
The success of the mobile payment system depends on its acceptance by both
merchants and consumers simultaneously. Merchants are the one who acts as
the facilitator of the mobile payment services to the consumers whereas
consumers are the final end users. So it is vital for the mobile payment service
providers like mobile network operators, banks, third party etc to make both
the parties accept their service at the same time. Therefore, this study aims at
studying the adoption and usage of mobile payment services by both merchant
and consumers.
Also doing the literature review (Thakur, 2013; Singh et al., 2017; Sinha et al.,
2018) it was found that mobile payment study in India is limited to few region
and yet there is hardly any research done in Ranchi region. Further there is
lack of comparative study among different states in the mobile payment study
field so this study has done a comparative study among Ranchi and Kolkata
which is capital of two different states Jharkhand and West Bengal
respectively. Both the states have different living standard so, this study is
done to see if there is impact of the different standard of living of the people
on the use of mobile payment.
3.4 Objective of the Study
Objective of the research is to find the answers to the research questions.
• To study the awareness, adoption and usage of consumer and
merchants about mobile payment system
• To find the influence of demographic factors on the awareness and use
of mobile payment system.

87
• To study the impact of other factors that influence consumers and
merchants to continue the use of mobile payment system.
• To find out the obstacles faced by merchants and consumers while
using mobile payments.
3.5 Research Hypotheses
3.5.1 Definition of Hypothesis
When a prediction or a hypothesis relationship is to be tested by scientific
methods, it is termed as research hypothesis. The research hypothesis is a
predictive statement that relates an independent variable to a dependent
variable (Kothari and Garg, 2014).
3.5.1.1 Hypotheses for Consumer
Demographics Variables
Demographic factors such as age, gender, income, occupation, and
qualification have shown to have significance importance on adoption and
usage of technology. Many previous researchers such as Venkatesh et al.
(2003), Dahlberg and Oorni (2007), Alafeef et al. (2011) Chang and Chong
(2013), Kabata (2015), have revealed that demographic factors have
significance role on the adoption and usage decision.
Therefore, this study has considered impact of demographic variables on the
awareness and use of mobile payment. The various hypotheses formulated on
demographic variables is given below.
1. City

88
H01a-There is no association between the awareness about the mobile payment
system and city of the consumer
H11a-There is association between the awareness about the mobile payment
system and city of the consumer
H01b-There is no association between the use of mobile payment system and
city of the consumer
H11b-There is association between the use of mobile payment system and city
of the consumer
H01c-There is no significant difference in the continued use of mobile
payment system and city of the consumer
H11c- There is significant difference in the continued use of mobile payment
system and city of the consumer
2. Gender
H02a-There is no association between the awareness about the mobile payment
system and gender of the consumer
H12a –There is association between the awareness about the mobile payment
system and gender of the consumer
H02b-There is no association between the use of mobile payment system and
gender of the consumer
H12b-There is association between the use of mobile payment system and
gender of the consumer
H02c-There is no significant difference in the continued use of mobile
payment system and gender of the consumer
H12c-There is no significant difference in the continued use of mobile
payment system and city of the consumer

89
3. Age
H03a-There is no association between the awareness about the mobile payment
system and age of the consumer.
H13a-There is association between the awareness about the mobile payment
system and age of the consumer.
H03b-There is no association between the use of mobile payment system and
age of the consumer.
H13b-There is association between the use of mobile payment system and age
of the consumer.
H03c-There is no significant difference in the continued use of mobile
payment system and age of the consumer.
H13c-There is significant difference in the continued use of mobile payment
system and age of the consumer.
4. Educational Qualification
H04a-There is no association between the awareness about the mobile payment
system and educational qualification of the consumer.
H14a-There is association between the awareness about the mobile payment
system and educational qualification of the consumer.
H04b-There is no association between the use of mobile payment system and
educational qualification of the consumer.
H14b-There is association between the use of mobile payment system and
educational qualification of the consumer.
H04c-There is no significant difference in the continued use of mobile
payment system and educational qualification of the consumer.
H14c-There is significant difference in the continued use of mobile payment
system and educational qualification of the consumer.

90
5. Occupation
H05a-There is no association between the awareness about the mobile payment
system and occupation of the consumer.
H15a-There is association between the awareness about the mobile payment
system and occupation of the consumer.
H05b-There is no association between the use of mobile payment system and
occupation of the consumer.
H15b-There is association between the use of mobile payment system and
occupation of the consumer.
H05c-There is no significant difference in the continued use of mobile
payment system and occupation of the consumer.
H15c-There is significant difference in the continued use of mobile payment
system and occupation of the consumer.
6. Income
H06a-There is no association between the awareness about the mobile payment
system and income of the consumer.
H16a-There is association between the awareness about the mobile payment
system and income of the consumer.
H06b-There is no association between the use of mobile payment system and
income of the consumer.
H16b-There is association between the use of mobile payment system and
income of the consumer.
H06c-There is no significant difference in the continued use of mobile
payment system and income of the consumer.

91
H16c-There is significant difference in the continued use of mobile payment
system and income of the consumer.
7. Personal Innovativeness
H07a-There is no association between the awareness about the mobile payment
system and personal innovativeness of the consumer.
H17a-There is association between the awareness about the mobile payment
system and personal innovativeness of the consumer.
H07b-There is no association between the use of mobile payment system and
personal innovativeness of the consumer.
H17b-There is association between the use of mobile payment system and
personal innovativeness of the consumer.
H07c-There is no significant difference in the continued use of mobile
payment system and personal innovativeness of the consumer.
H17c-There is significant difference in the continued use of mobile payment
system and personal innovativeness of the consumer.
Other Variables
Usefuleness was found to be one of the most significant factors in technology
adoption research. Various researchers Nguyen et al (2016); Kabata (2015);
Yan & Yang (2015); Padashetty & Kishore (2013); Ahrenstedt et al (2015);
Li et al (2014); Lesa & Tembo (2016); Mbogo (2010); Daştan & Gürler
(2016); Phonthanukitithaworn et al (2015); Luna et al (2017); Chandrasekhar
(2017); Hamza & Shah (2014) have considered usefulness as a vital factor for
mobile payment adoption.
8. Usefulness

92
H08- Usefulness will not significantly influence the continued use of mobile
payment system by the consumer.
H18- Usefulness will significantly influence the continued use of mobile
payment system by the consumer.
Varoious researcher in past such as Kabata (2015); Yan & Yang (2015);
Yakubu (2012); Dahlberg and Mallat (2002); Perera (2007); Peng et al (2012);
Ahrenstedt et al (2015); Lesa & Tembo (2016); Mbogo (2010); Daştan &
Gürler (2016); Phonthanukitithaworn et al (2015); Hamza & Shah (2014);
Ayodele et al (2013 have found ease of use to be an influencing factor for
mobile payment adoption
9. Ease of Use
H09-Ease of Use will not significantly influence the continued use of mobile
payment system by the consumer.
H19- Ease of Use will significantly influence the continued use of mobile
payment system by the consumer.
Researchers around the globe have considered that adoption decision is
influenced by the peers and friends and thus many researchers : Nguyen et al
(2016); Kabata (2015); Tossy (2014); Ahrenstedt et al (2015); Li et al (2014);
Lesa & Tembo (2016); Phonthanukitithaworn et al (2015); Abrahão et al
(2016); Yang et al (2011); Hamza & Shah (2014) have studied the influence of
social influence on adoption of mobile payments.
10. Social Influence
H010- Social Influence will not significantly influence the continued use of
mobile payment system by the consumer.
H110- Social Influence will significantly influence the continued use of mobile
payment system by the consumer.

93
11. Government Initiatives
H011- Government Initiatives will not significantly influence the continued
use of mobile payment system by the consumer.
H111- Government Initiatives will significantly influence the continued use of
mobile payment system by the consumer.
12. Application Provider
H012- Application Provider will not significantly influence the continued use
of mobile payment system by the consumer.
H112- Application Provide will significantly influence the continued use of
mobile payment system by the consumer.
3.5.1.2 Hypotheses for Merchant
Demographics
13. City
H013a-There is no association between the awareness about the mobile
payment system and city of the merchant.
H113a-There is association between the awareness about the mobile payment
system and city of the merchant.
H013b-There is no association between the use of mobile payment system and
city of the merchant.
H113b-There is association between the use of mobile payment system and
city of the merchant.
H013c-There is no significant difference in the continued use of mobile
payment system and city of the merchant.
H113c-There is no significant difference in the continued use of mobile
payment system and city of the merchant.

94
14. Gender
H014a-There is no association between the awareness about the mobile
payment system and gender of the merchant.
H114a-There is association between the awareness about the mobile payment
system and gender of the merchant.
H014b-There is no association between the use of mobile payment system and
gender of the merchant.
H114b-There is association between the use of mobile payment system and
gender of the merchant.
H014c-There is no significant difference in the continued use of mobile
payment system and gender of the merchant.
H114c-There is significant difference in the continued use of mobile payment
system and gender of the merchant.
15. Age
H015a- There is no association between the awareness about the mobile
payment system and age of the merchant.
H115a- There is association between the awareness about the mobile payment
system and age of the merchant.
H015b-There is no association between the use of mobile payment system and
age of the merchant.
H115b-There is association between the use of mobile payment system and
age of the merchant.
H015c-There is no significant difference in the continued use of mobile
payment system and age of the merchant.

95
H115c- There is significant difference in the continued use of mobile payment
system and age of the merchant.
16. Educational Qualification
H016-There is no association between the awareness about the mobile
payment system and educational qualification of the merchant.
H116a-There is association between the awareness about the mobile payment
system and educational qualification of the merchant.
H016b-There is no association between the use of mobile payment system and
educational qualification of the merchant.
H116b-There is association between the use of mobile payment system and
educational qualification of the merchant.
H016c-There is no significant difference in the continued use of mobile
payment system and educational qualification of the merchant.
H116c- There is no significant difference in the continued use of mobile
payment system and educational qualification of the merchant.
17. Personal Innovativeness
H017a-There is no association between the awareness about the mobile
payment system and personal innovativeness of the merchant.
H117a-There is association between the awareness about the mobile payment
system and personal innovativeness of the merchant.
H017b-There is no association between the use of mobile payment system and
personal innovativeness of the merchant.
H117b-There is association between the use of mobile payment system and
personal innovativeness of the merchant.

96
H017c-There is no significant difference in the continued use of mobile
payment system and personal innovativeness of the merchant.
H117c-There is significant difference in the continued use of mobile payment
system and personal innovativeness of the merchant.
18. Technology Inclination
H018a-There is no association between the awareness about the mobile
payment system and technology inclination of the merchant.
H118a-There is association between the awareness about the mobile payment
system and technology inclination of the merchant.
H018b-There is no association between the use of mobile payment system and
technology inclination of the merchant.
H118b-There is association between the use of mobile payment system and
technology inclination of the merchant.
H018c-There is no significant difference in the continued use of mobile
payment system and technology inclination of the merchant.
H118c-There is significant difference in the continued use of mobile payment
system and technology inclination of the merchant.
Independent Variables
19. Usability
H019-Usability will not significantly influence the continued use of mobile
payment system by the merchant.
H119-Usability will significantly influence the continued use of mobile
payment system by the merchant.

97
20. Consumer Influence
H020-Consumer influence will not significantly influence the continued use of
mobile payment system by the merchant.
H120-Consumer influence will significantly influence the continued use of
mobile payment system by the merchant.
21. Government Initiatives
H021-Government initiatives will not significantly influence the continued use
of mobile payment system by the merchant.
H121-Government initiatives will significantly influence the continued use of
mobile payment system by the merchant.
22. Application Provider
H022-Application provider will not significantly influence the continued use
of mobile payment system by the merchant.
H122-Application provider will significantly influence the continued use of
mobile payment system by the merchant.
3.6 Research design
Research design is a framework or blueprint for conducting the research
project (Malhotra and Dash, 2011). It is the detail of all the necessary steps
taken to obtain the information required to solve the research problem. A
research design is the arrangement of conditions for collection and analysis of
data in manner that aims to combine relevance to the research purpose with
economy in procedure (Kothari and Garg, 2014).
Descriptive research is a type of conclusive research which is concerned with
describing the characteristics of particular individual or a group (Kothari and
Garg, 2014). A descriptive design requires a clear specification of the who,
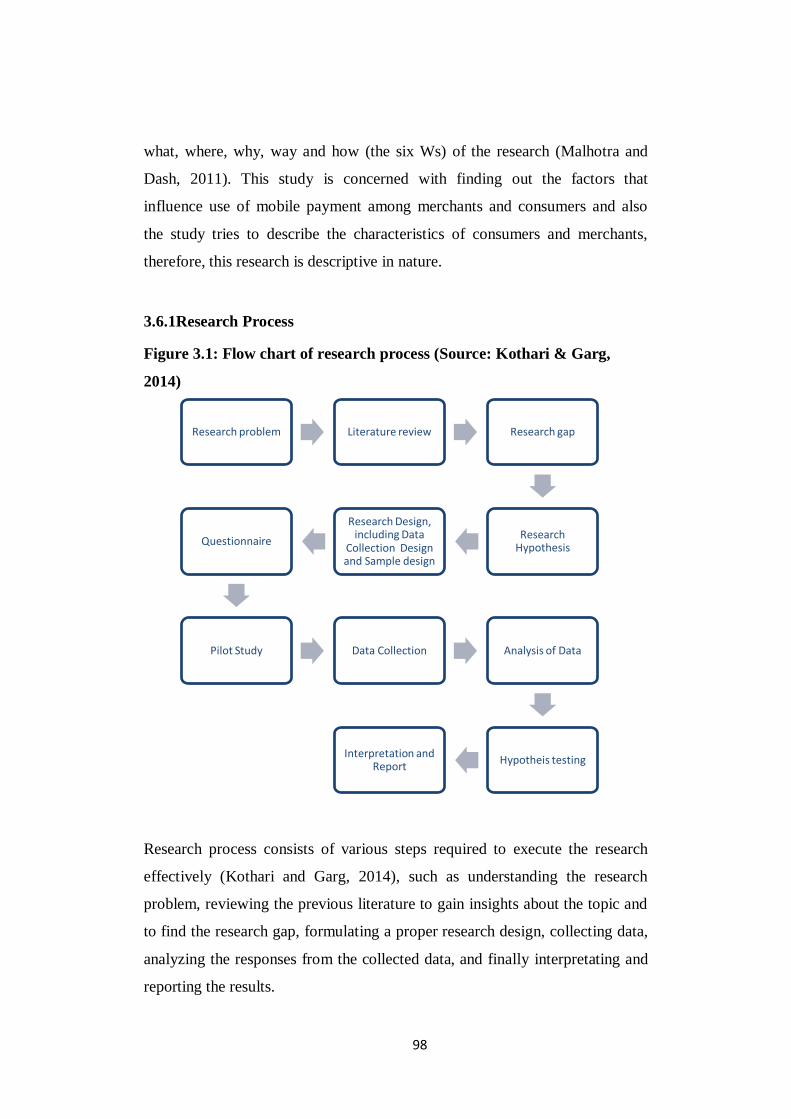
98
what, where, why, way and how (the six Ws) of the research (Malhotra and
Dash, 2011). This study is concerned with finding out the factors that
influence use of mobile payment among merchants and consumers and also
the study tries to describe the characteristics of consumers and merchants,
therefore, this research is descriptive in nature.
3.6.1Research Process
Figure 3.1: Flow chart of research process (Source: Kothari & Garg,
2014)
Research process consists of various steps required to execute the research
effectively (Kothari and Garg, 2014), such as understanding the research
problem, reviewing the previous literature to gain insights about the topic and
to find the research gap, formulating a proper research design, collecting data,
analyzing the responses from the collected data, and finally interpretating and
reporting the results.
Research problem Literature review Research gap
Research Hypothesis
Research Design, including Data
Collection Design and Sample design
Questionnaire
Pilot Study Data Collection Analysis of Data
Hypotheis testingInterpretation and
Report

99
3.6.2 Research Approach
Many researchers have tried to review and classify research approaches in the
IR (information research) area. The research approach can be classified into
two basic types – Quantitative approach and Qualitative approach (Kothari
and Garg, 2014). Quantitative research approach is used when there are clearly
defined variables to be examined. A quantitative research approach will need
quantitative research design (Grover, 2015). Qualitative research is used to
explore and understand how people experience in a given research issue. It is
effective when the researcher needs to identify intangible factors, such as
social influence, socioeconomic status, gender roles, city, and religion (Mack
et al., 2005). Mixed method is a new research approach advanced by Creswell
(2009), which involves mix of both qualitative and quantitative approach to
collect the data.
Quantitative research emphasises on gathering data which can be quantified or
expressed in terms of numbers (Goundar, 2012). According to Creswell,
quantitative research first needs a literature review to arrive at the research
problem and to develope a theory or hypotheses. Survey is one of the main
tool used in quantitative research to obtain data (Creswell, 2014: Goundar,
2012 ).
This research study has applied quantitative research method. Literature
review was done to arrive at the variables for this study. Survey method was
opted to gather primary data using the paper – based questionnaire. All the
datas were analysed using statistical test.

100
3.6.3 Research Method
Research method is often misunderstood as research methodology. Research
method is part of research methodology which deals with various procedures
by which research is performed into a subject or a topic (Goundar, 2012).
Research methods comprises of three things- Methods by which data is
collected, Statistical techniques used to analyze the data, and methods to
evaluate the accuracy of the results (Kothari and Garg, 2014). Majority of IS
research uses surveys, interviews, experiments and case studies as the pre-
dominant research methods (Choudhrie and Dwivedi, 2005), whereby most
used method is survey followed by case studies. This study used survey as the
research method.
Survey – Survey is one of the major methods used in descriptive research. It is
defined as the process of obtaining desired information from the sample
population through a well structured questionnaire (Malhotra and Dash, 2011).
Survey is used in both types of research approaches Quantitative and
Qualitative. Survey data tends to be reliable as the responses are generally
restricted to the alternatives stated. Survey can be collected through several
methods such as face to face interviewing, telephone interviewing, mail
interviewing and electronic interviewing. Survey method has been opted by
plethora of researchers in the context of mobile payment (Diniz et al., 2011;
Mondego and Gide, 2018). Many mobile payment researchers such as
Dahlberg (2007), Kim et al. (2010), Liebana-Cabanillas (2014), Shaw (2014)
etc. have opted survey method to obtain the data. This study too has used
questionnaire as the survey tool to collect the data for pilot and main study.
For the pilot study, apart from personally distributing the questionnaires to the
respondents, web based questionnaire by the use of google forms were also
sent to the respondents.

101
3.7 Population
All the items under consideration in any field of enquiry constitute a
‘universe’ or ‘population’. A complete enumeration of all the items in the
‘population’ is known as a census enquiry (Kothari and Garg, 2014).
Population for the study is divided into two major categories:- Consumers and
Merchants.
3.7.1 Sampling Design
Sample design is a well defined plan used by researcher to obtain a sample
from the selected population for the study (Kothari and Garg, 2014).
Figure 3.2: Flow chart of sampling design (Source: Kothari and Garg,
2014)
The target population for the study was grouped into four set of people as
follows:
1. Ranchi consumers
Define the target population
Determine the sampling frame
Select a sampling technique(s)
Determine the sample size
Execute the sampling process

102
2. Kolkata consumers
3. Ranchi retail merchants
4. Kolkata retail merchants
3.7.2 Sampling Unit and Frame
Sampling frame is a representation of the element of the target population
(Malhotra and Dash, 2011). Consumers above the 15 years of age were
considered for this study, whereas, in case of merchants only retailers were
considered. Sample unit for this study is any individual consumer and
individual merchant of Ranchi and Kolkata (capital city of Jharkhand and
West Bengal respectively).
The respondent will be categorized into two categories-
1. The users (one who are using mobile payment system)
2. The non users (one who are not using the payment system)
3.7.3 Sampling Technique
For getting diversified sample, the consumers and merchants were contacted
from major areas of both Ranchi and Kolkata cities. Further convenient
sampling technique was used to get the data from those selected areas. Ten
most famous hotspots for consumer availability were considered in this case
and densely populated retail market areas were visited for data collection.
Table 3.1: Data collection from area of Ranchi and Kolkata
City Area covered
Kolkata Gariahat Market
College Street

103
Hatibagan Market
South City Mall
Mani Square Shopping Mall
Avani Riverside Shopping Mall
Burrabazar Market
Chowringhee Road
Quest Mall
Dakshinapan Shopping Center
Ranchi Nucleus Mall, Ranchi
Sector market, Dhurwa
Club complex, Ranchi
Doranda market, Ranchi
Hatia market, Ranchi
Kutchery market
Ratu road
Harmu
Main road
Namkum
3.7.4 Sample size
Total sample size considered for this study is 600, with 300 respondents each
from Ranchi and Kolkata city. Further, 300 respondents are divided among
consumers and merchants in the ratio of 2:1.
To calculate our sample size, we have used Slovin’s formula. The formula is
described as
n = N/{1+N(e)2}

104
Here, n= sample size
N= total population
e= margin of error
The population of Ranchi is 13,09,860 and that of Kolkata is 44,96,694, so
total population (N)= 58,06,554 and we have taken 5% as margin of error (e).
n= 5806554/(1+5806554*0.052)
n= 5806554/14517.4
n= 399.98
So, we get sample size (n) as 400 after rounding off.
We have taken total sample size as 600 as population size is large, dividing it
into two categories i.e., Consumers and Merchants, in the ratio of 2:1, wherein
we will be covering 200 consumers and 100 merchants from each city.
Out of 200 respondents from Ranchi there were 129 users and 71 non users.
While out of 200 respondents from Kolkata there were 144 users and 56 non
users.
For merchants 100 respondents from each city, there were 58 users from
Ranchi and 74 users from Kolkata, whereas 31 non users from Ranchi and 13
non users from Kolkata, while 11 were the one who abandoned using mobile
payment in Ranchi and 13 abandoned mobile payment in Kolkata.
3.8 Data Collection
3.8.1 Data Collection Method and Technique
• Primary data: The data which are collected afresh and for the first time,
and thus happen to be original in character (Kothari and Garg, 2014).

105
• Secondary data: The data which have already been collected by
someone else and which have already been passed through the
statistical process (Kothari and Garg, 2014).
For any research, data is either collected afresh or previously acquired data or
information is used to gain a new insight out of it. In this research both
primary and secondary data is used for the accomplishment of the research
objectives. First and foremost secondary data was used in form of existing
online publications like research papers, articles, survey reports, research
thesis etc. to gain the insight over the topic. Deeper knowledge was gained on
the factors having impact on mobile payment acceptance, methodology used
in the mobile payment research and analysis techniques to be payment system
adopted. Then primary data was used to get the required information to test the
research hypothesis. Primary data can be collected through – observation
method, interviews, questionnaire and schedules. Data for this research was
collected through survey method from respondents. Questionnaire was
selected as the research data instrument to gather the information from the
respondents.
3.8.2 Research Data Collection Instrument
Questionnaire being the vital part of research design is treated as the heart of
the survey method (Kothari & Garg, 2015). Questionnaire was preferred for
this research as it is most organized instrument to get the responses out of
respondents. Questionnaire was used being economical and effective way to
get responses. A well designed questionnaire is very important for the survey
(Bhattacherjee, 2012). Questionnaire in English language was formulated
with easy understandable words. Questionnaire design consisted of three
sections. The first section dealt with the demographic characteristics of the
individuals like gender, age, qualification, occupation and income. Second
section of the questionnaire is regarding the perception of the respondent
106
about the mobile payment system and third is regarding their personal
responses such as name, contact number. Questionnaire consisted questions of
multiple choice, dichotomous questions and scaled questions. Five point
Likert scale was used in the questionnaire on a scale of 1-5 ranging from
strongly disagree to strongly agree.
3.9 Pilot Study
Pilot study is a small scale study done to test research methodology intended
to be used for a larger study (Kim, 2010; Zailinawati et al., 2006). Pilot study
is very vital in the research process, as it is done to find out the issues in the
research instrument and research protocol, and allows any kind of change in
the main study to be done the researcher (Kim, 2010; Zailinawati et al., 2006).
Pilot study was done before the final study to find if there was any drawback
in the questionnaire and if there existed any problem faced by the respondents
in filling the questionnaire and the researcher during the pilot survey. For this,
pilot survey was done through a proper questionnaire which was designed to
meet the research objectives. Data for the pilot survey was obtained from 50
consumers and 30 merchants, each from Kolkata and Ranchi.
A total of 40 items for consumers were asked which comprised of
demographic, likert scale, usage information etc. Similar questionnaire was
designed for merchants with total of 46 items. Questionnaire was distributed
in-person to both the consumers as well as to the merchants. Respondents for
the pilot study were taken from all age groups and, also both males and
females were included for data collection to get a diversified response.
Questionnaire format for both consumer and merchant are given below.

107
Table 3.2: Questionnaire of consumer pilot survey
Consumers Pilot Survey Questionnaire
Q.No. Parameters Type of Questions
1 Native of the city Demographics
2 Gender Demographics
3 Age Demographics
4 Marital status Demographics
5 Family type Demographics
6 Educational qualification Demographics
7 Occupation Demographics
8 Income Demographics
9 Do you use smartphone Usage info
10 How comfortable are you with smart
phone
Usage info
11 Do you use mobile internet Usage info
12 How often do you use mobile internet Usage info
13 Awareness about mobile payment
systems
Usage info
14 Installation of application Usage info
15 Use of mobile payment Usage info
16 Reason for not using Usage info
17 Use if problems solved Usage info
18 Ranking of feature used in smartphone Usage info
19 Preference of payment Usage info
20 Installation of applications Usage info
21 Performance rating of applications Usage info
22 Time since mobile payment systems use Usage info
23 Purpose of mobile payment Usage info
24 Frequency of mobile payment Usage info
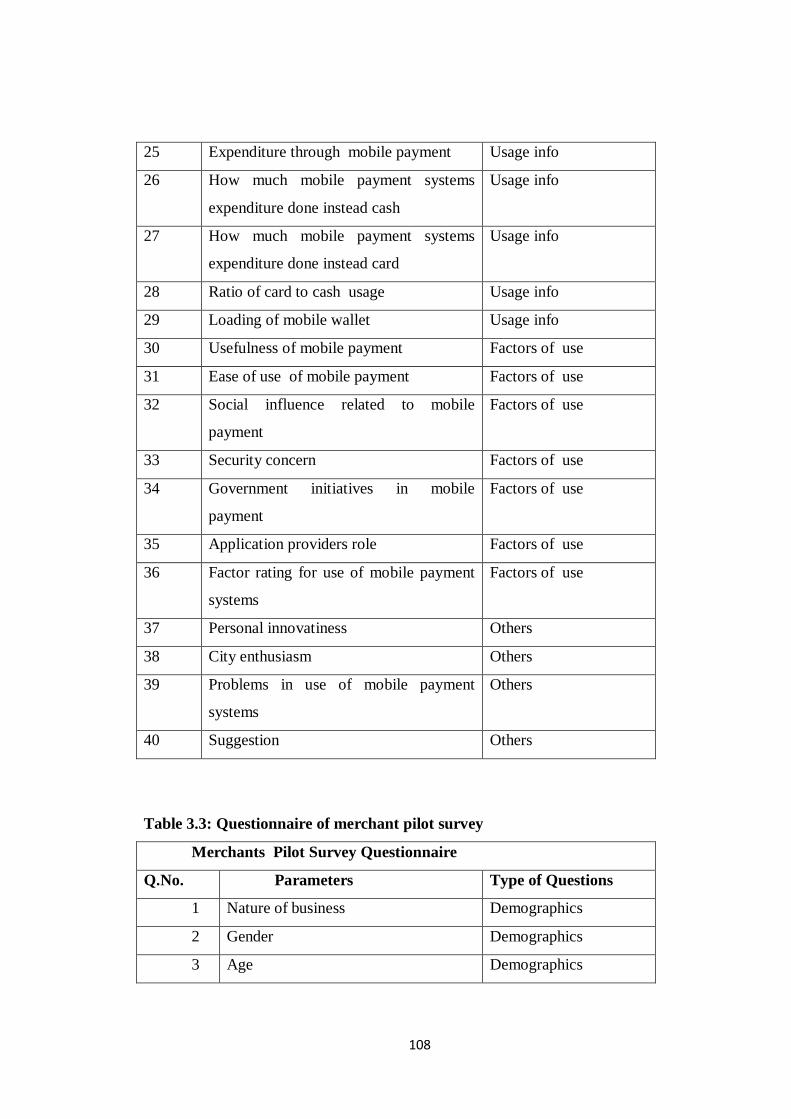
108
25 Expenditure through mobile payment Usage info
26 How much mobile payment systems
expenditure done instead cash
Usage info
27 How much mobile payment systems
expenditure done instead card
Usage info
28 Ratio of card to cash usage Usage info
29 Loading of mobile wallet Usage info
30 Usefulness of mobile payment Factors of use
31 Ease of use of mobile payment Factors of use
32 Social influence related to mobile
payment
Factors of use
33 Security concern Factors of use
34 Government initiatives in mobile
payment
Factors of use
35 Application providers role Factors of use
36 Factor rating for use of mobile payment
systems
Factors of use
37 Personal innovatiness Others
38 City enthusiasm Others
39 Problems in use of mobile payment
systems
Others
40 Suggestion Others
Table 3.3: Questionnaire of merchant pilot survey
Merchants Pilot Survey Questionnaire
Q.No. Parameters Type of Questions
1 Nature of business Demographics
2 Gender Demographics
3 Age Demographics

109
4 Marital status Demographics
5 Family type Demographics
6 Educational qualification Demographics
7 Occupation Demographics
8 Turnover Demographics
9 Do you use smartphone Usage info
10 How comfortable are you with smart
phone
Usage info
11 Do you use phone for business
promotion
Usage info
12 Do you use mobile internet Usage info
13 How often do you use mobileinternet Usage info
14 Awareness about mobile payment
ystems
Usage info
15 Installaton of application Usage info
16 Use of mobile payment Usage info
17 Reason for not accepting Usage info
18 Percent of consumer demand for not
accepting
Usage info
19 Use if problems solved Usage info
20 Ranking of feature used in smartphone Usage info
21 Preference of payment Usage info
22 Installation of applications Usage info
23 Time since mobile payment systems
use
Usage info
24 Frequency of mobile payment Usage info
25 Expenditure through mobile payment Usage info
26 How much mobile payment systems
transaction done instead cash
Usage info
27 How much mobile payment systems Usage info

110
transaction done instead card
28 Ratio of card to cash transaction Usage info
29 Is mobile payment necessity for e
commerce
Usage info
30 Performance rating of applications Usage info
31 Purpose of mobile payment Usage info
32 Monthly sales through mobile
payment
Usage info
33 Do you have to assist consumers in
mobile payment systems
Usage info
34 Do you encourage consumer to pay
through mobile payment systems
Usage info
35 Will you use mobile payment systems
more if business promoted
Usage info
36 Usefulness of mobile payment Factors of use
37 Ease of use of mobile payment Factors of use
38 Social influence related to mobile
payment
Factors of use
39 Security concern Factors of use
40 Government initiatives in mobile
payment
Factors of use
41 Application providers role Factors of use
42 Factor accepting use of mobile
payment systems
Factors of use
43 City enthusiasm Others
44 Most important in success of mobile
payment systems
Others
45 Problems in use of mobile payment
systems
Others
46 Suggestion Others

111
3.9.1 Results from Pilot Survey
Reliability test was done to check the internal consistency among the
variables. All the variables for both merchants and consumers had Cronbach’s
alpha value of more than 0.7 which indicates good internal consistency among
the constructs of the variables. The tables depicting Cronbach’s alpha value
are shown below.
Table 3.4: Cronbach’s value for consumers’ pilot survey
Table 3.5: Cronbach’s value for merchants’ pilot survey
3.9.2 Final Survey Questionnaire
Questionnaire for the final study were distributed to consumers and merchants
personally and they were made to fill in front of the researcher so that in case
Consumer Usefuln
ess
Ease
of use
Social
influe
nce
Governmen
t initiative
App
provide
r
Merchan
t
Kolkata .717 .852 .795 .849 .720 .731
Ranchi .779 .730 .796 .637 .781 .711
Merch
ant
Usefu
lness
Eas
e of
use
Compet
ition
Consu
mer
App
provi
der
Govern
ment
initiativ
e
Techn
ical
Cos
t
Kolkat
a
.716 .847 .967 .897 .778 .797 .765 .946
Ranchi .887 .960 .925 .728 .814 .890 .772 .725

112
of any querry researcher could assist the respondents. While majority of
respondents faced no difficulty in filling the responses, there were some
consumers for whom the researcher had to brief the questions and then they
filled their responses. Also, there were few merchants who due to lack of time
insisted the researcher to fill the questionnaire for them as per the responses
given by them. Final questionnaire was reduced in length after pre-testing the
questionnaire as the questionnaire was bit lengthy and time taking for the
respondents.
The changes made in the questionnaire are summarized below
A) Survey reports were reduced considering the long time taken by the
respondent and many respondents were not willing to complete the
questionnaire. Many respondent submitted incomplete questionnaire
leaving questions of the end unanswered. Also considering the fact that
the respondent were in a hurry or busy while filling the questionnaire,
the questionnaire had to be short.
B) As there were maximum incomplete questionnaire in the pilot survey
so it was decided to only go for the offline mode of questionnaire for
the main survey.
C) The variables were reduced from 7 to 5
D) For better understanding certain vocabulary was changed.
3.10 Summary
This chapter has described research methodology and research design
followed to get the desired results. The justifications of the choices made for
factors, variables, sample size and data collection methods have been given
briefly. The result of the pilot study has been presented and the changes made
in the final questionnaire were documented. The analysis of the data thus
collected has been given in the next chapter.

113
CHAPTER 4: DATA
ANALYSIS AND
INTERPRETATION

114
CHAPTER 4: DATA ANALYSIS
AND INTERPRETATION
4.1 Introduction
This chapter deals with the analysis of the data collected from the consumers
and merchants to test the hypothesis formulated. The chapter begins with the
reliability analysis followed by factor analysis, regression coefficients etc.
Various analysis test used were Chi-square, independent sample t-test, one
way ANOVA, regression, which are discussed in detail in the subsequent part
of the chapter.
4.2 Consumer Analysis and Interpretations
4.2.1 Demographic Profile of the Respondents
Table 4.1: Demographic profile of the consumers
Characteristi
cs
Profile
Ranchi Kolkata
Total
frequen
cy Frequen
cy
Perce
nt
Frequen
cy
Perce
nt
Gender Male 137 68.5 128 64 265
Female 63 31.5 72 36 135
Age group
15 to 25yrs 61 30.5 64 32 125
26 to 40yrs 99 49.5 101 50.5 200
41 to 60yrs 28 14 27 13.5 45
Above
60yrs 12 6 8 4 20

115
Education
Below
intermediat
e
8 4 12 6 20
Intermediat
e 29 14.5 25 12.5 54
Graduate 116 58 126 64 242
PG &
above 47 23.5 37 18.5 84
Occupation
Student 40 20 34 17 74
Businessm
an 34 17 47 23.5 81
Occupation
al 21 10.5 24 12 45
Governme
nt
employee
26 13 14 7 40
Private
employee 57 28.5 55 27.5 112
Housewife 14 7 16 8 30
Unemploy
ed 8 4 10 5 18
Income
Below Rs.
10k 69 34.5 72 36 141
Rs. 10k to
30k 54 27 50 25 104
Rs. 30k to
50k 36 18 33 16.5 69
Rs. 50k to
1 lakh 28 14 32 16 60
Above Rs.
1 lakh 13 6.5 13 6.5 26
When a new
technology is
introduced in
the market
I am
usually
among the
first to use
63 31.5 44 22 107

116
I wait for
others to
use first
69 34.5 94 47 163
I am
among late
users
49 24.5 41 20.5 90
I prefer
using old
technology
only
19 9.5 21 10.5 40
The above table depicts that in Ranchi 68.5% of respondents are male and
31.5% are female respondents. In case of the age of the respondents, the table
shows that 49.5% in the age group of 26 to 40 yrs, followed by 30.5% of
respondents are in the age groups of 15 to 25 yrs, 14% in the age group 41 to
60 yrs and only 6% are in the age group of above 60. Regarding the education
of the respondents, 58% had completed graduation, 23.5% had PG & above
degrees, 14.5% of the respondents had done intermediate, and only 4% were
below intermediate. In respect of occupation, 28.5% were private employee,
27.5% were in business /professionals, 20% were students, 13% were
government employees, and 11% were housewife/unemployed. About the
income of the respondents, 34.5% had monthly income below Rs. 1000, 27%
earned between Rs. 10,001 to 30,000 monthly, 18% earned between Rs.
30,001 and 50,000, 14% earned between Rs. 50,001 to 1lakh and only 6.5%
earned above Rs. 1,00,000. For Personal innovativeness findings revealed that
34.5% of respondents waited for others to use first, 31.5% of respondents are
among first to use new technology, 24.5% are late users and only 9.5% are the
ones who prefer to use old technology.
For Kolkata, 64% of respondents are male and 36% are female respondents. In
case of the age of the respondents, the table shows that 50.5% in the age group

117
of 26 to 40 yrs, 32% of respondents are in the age groups of 15 to 25 yrs,
13.5% in the age group 41 to 60 yrs and only 4% are in the age group of above
60. Regarding the education of the respondents, 64% had completed
graduation, 18.5% have PG & above degrees, 12.5% of the respondents had
done intermediate, and only 6% are below intermediate. In respect of
occupation, 35.5% were in business /professionals, 27.5% were private
employee, 17% were students, 13% were housewife/unemployed, and only 7%
were government employees. About the income of the respondents, 36% had
monthly income below Rs. 1000, 25% earned between Rs. 10,001 to 30,000
monthly, 16.5% earned between Rs. 30,001 and 50,000, 16% earned between
Rs. 50,001 to 1 lakh and only 6.5% earned above Rs. 1,00,000. For Personal
innovativeness findings revealed that 47% of respondents waited for others to
use first, 22% of respondents are among first to use new technology, 20.5%
are late users and only 10.5% are the ones who prefer to use old technology.
4.2.2 Comparison of Level of Awareness, Adoption and Usage of the
Mobile Payment Systems among the Consumers of Ranchi and Kolkata
4.2.2.1 Awareness about the Mobile Payment Systems among Consumer
Table 4.2: Awareness among consumers about mobile payment
Awareness about
mobile payment
Ranchi Kolkata
Frequency Percentage Frequency Percentage
Yes 180 90% 184 92%
No 20 10% 16 8%
Grand total 200 100% 200 100%

118
Figure 4.1: Awareness among consumers about the mobile payment
systems
In case of Ranchi, 90% of the total respondents are aware about mobile
payment system and only 10% of the respondents do not know about Mobile
Payment Systems.
Whereas, in case of Kolkata 92% of the total respondents are aware about
mobile payment system and only 8% of the respondents do not know about
Mobile Payment Systems .

119
4.2.2.2 Installation of mobile payment applications by the consumer
Table 4.3: Installation of mobile payment applications by consumer
Mobile payment
applications
installed
Ranchi Kolkata
Frequency Percentage Frequency Percentage
Yes 137 68% 152 76%
No 63 32% 48 24%
Grand total 200 100% 200 100%
Figure 4.2: Installation of mobile payment application by consumers
Out of the total respondents in Ranchi, 68% have mobile payment application
installed in their phone and 32% have not installed mobile payment
application in their phone. Whereas, Out of the total respondents in Kolkata,
76% have mobile payment application installed in their phone and 24% do not
have mobile payment application installed in their phone.

120
4.2.2.3 Use of mobile payment systems by consumer
Table 4.4: Use of mobile payment systems by consumer
Using mobile
payment
Ranchi Kolkata
Frequency Percentage Frequency Percentage
Yes 129 64% 144 72%
No 71 36% 56 28%
Grand total 200 100% 200 100%
Figure 4.3: Use of mobile payment systems by consumer
Out of the total respondents, 64% uses the mobile payment systems and 36%
do not use any such payment options in Ranchi. Whereas, Out of the total
respondents, 72% uses the mobile payment systems and 28% do not use any
such payment options in Kolkata.

121
Out of total 400 consumers of mobile payment system, 273 were users
consisting of 144 from Kolkata & 129 from Ranchi while 127 were non-users
comprising of 71from Ranchi & 56 from Kolkata. This study has not gone
into deeper analysis of the non user side. Apart from their demographic
profile, only few questions were asked to the non users, analysis of which is
done below and the users analysis is done thereafter.
4.2.3 Non Users Data Analysis
Analysis was done for total of 127 non users which is shown below.
4.2.3.1 Awareness and installation of mobile payment systems by non
users
Table 4.5: Awareness and installation of mobile payment systems by non
users
City Ranchi Kolkata
Param
eters
Yes No Yes No
Frequ
ency
Percen
tage
Frequ
ency
Percen
tage
Frequ
ency
Percen
tage
Frequ
ency
Percen
tage
Aware
ness 52 73% 19 27% 40 71% 16 29%
Install
ation 9 13% 62 87% 9 16% 47 84%
Figure 4.4: Awareness and installation by non users
Yes73%
No27%
Awareness among non-user (Ranchi)
Yes71%
No29%
Awareness among non-user (Kolkata)

122
In case of Ranchi, 73% of the total non users are aware about mobile payment
system and only 27% of the respondents do not know about Mobile Payment
Systems. Regarding, installation of payment apps, 87% of non users do not
have any such apps installed in their mobile phones while remaining 13% of
non users have some kind of mobile payment apps installed in their phones.
Whereas, in case of Kolkata 71% of the total respondents are aware about
mobile payment system and only 29% of the respondents do not know about
Mobile Payment Systems. Regarding, installation of payment apps, 84% of
non users do not have any such apps installed in their mobile phones while
remaining 16% of non users have some kind of mobile payment apps installed
in their phones.
4.2.3.2 Reason for not using mobile payment system
Table 4.6: Reason for not using mobile payment
City Ranchi Kolkata
Reasons for
not using Frequency Percentage Frequency Percentage
Abandoned 7 10% 7 13%
Don't know 13 18% 12 21%
13%
87%
Installation of mobile payments apps (Ranchi)
Yes No
16%
84%
Installation mobile payments app (Kolkata)
Yes No

123
to use MPS
Don't trust
MPS 12 17% 8 14%
Find it
useless
10 14%
8 14%
Convenient
with cash &
card
22
31%
14
25%
Not
convenient
with
smartphone
7
10%
7
13%
Total 71 100% 56 100%
Figure 4.5: Reason for not using mobile payment systems by consumers
Convenience with cash and card is most prominent reason for consumers to
not use mobile payment as 31% of users in Ranchi and 25% of users in
Kolkata do not use mobile payment due to this. Not knowing how to use is
also a concern as 18% of non users in Ranchi have this problem, where as
21% of non users in Kolkata have this issue. Not trusting mobile payment is
issue of 14% of non users in Ranchi and for 14% of non users in Kolkata. 14%
10
18 17
14
31
10
13
21
14 14
25
13
0
5
10
15
20
25
30
35
Abandoned Don't know touse MPS
Don't trustMPS
Find it useless Convenientwith cash &
card
Notconvenient
withsmartphone
Ranchi Kolkata

124
of non users in both city felt that mobile payment is useless. Abandoned and
inconvenience with smartphone is the reason for not using for 10% of Ranchi
and 13% of Kolkata non users.
4.2.3.3 Reason for abandoning mobile payment systems
Table 4.7: Reason for abandoning mobile payment systems City Ranchi Kolkata
Reasons for
abandoning
Frequency Percentage
Frequency Percentage
Feel insecure 5 72% 2 29%
Complex
process 1 14%
3 43%
Find it useless 1 14% 1 14%
Time taking 0 0% 1 14%
Total 7 100 7 100
Figure 4.6: Reason for abandoning mobile payment by consumers
72
14 14
0
29
43
14 14
0
10
20
30
40
50
60
70
80
Feel insecure Complex process Find it useless Time taking
Ranchi Kolkata

125
The feeling of insecurity among consumers of Ranchi who abandoned mobile
payment system is very high i.e. 72%, as compared to that of Kolkata i.e. 29%.
Complexity of process is the most prominent reason for consumers of Kolkata
i.e. 43% for abandoning mobile payment system, as compared to 14% in
Ranchi. 14% of people who abandoned found it useless in each city. 14% of
abandoned users found it time taking in Kolkata, whereas none in Ranchi city
felt the same.
4.2.3.4 Possibility of using mobile payment systems in future
Table 4.8: Possibility of using mobile payment systems City Ranchi Kolkata
Possibility Frequency Percentage Frequency Percentage
Yes 33 53% 29 52%
No 38 47% 27 48%
Total 71 100% 56 14%
Figure 4.7: Possibility of using mobile payment by consumer
In case of Ranchi, about 53% of the non users are not willing to use mobile
payments even when their issues are solved but 47 % do want to use such
payments if their issues are resolved.
Yes47%No
53%
Will use if issues are resolved (Ranchi)
Yes52%
No48%
Will use if issues are resolved(Kolkata)

126
Regarding, Kolkata, 52% of the non users are willing to use mobile payments
once their issues are solved but 48 % do not want to use any such payments
even then.
4.2.4 User Consumer Analysis
Analysis was done for total of 273 users which is shown below.
4.2.4.1 Ranking of the payment options preferred by consumers
To know about the preference of Mobile Payment System as payment options
among consumer question was asked where respondents were asked to rank
their preference from 1 as most preferred to 5 as least preferred. Based on the
consumer responses, observation about both the cities is given below.
Table 4.9: Ranking of payment options among consumers
Payment option
Ranchi Kolkata
Mean
Rank Rank
Mean
Rank Rank
Cash 2.54 1 2.59 1
Debit card 2.78 2 3.12 3
Credit card 3.48 5 2.89 2
Net banking 3.18 4 3.59 5
Mobile payment 2.98 3 3.24 4

127
In case of Ranchi consumers, cash is given the first preference for payment
method, debit card is preferred next, followed by mobile payment, then net
banking and credit card is the least preferred payment method.
In case of Kolkata consumers, cash is given the first preference for payment
method, credit card is preferred next, followed by debit card, mobile payments
and net banking respectively.
4.2.4.2 Span of using the mobile payment system by consumers
Question was asked to know about for how long people have been using
mobile payments in both the cities where respondents were given select option
from below 1 year to above 4 years. The responses from both cities are
presented below.
Table 4.10: Consumers’ span of using the mobile payment systems
Duration of using
mobile payments
Ranchi Kolkata
Frequency Percentage Frequency Percentage
0-1 yr 31 24% 11 8%
1-2 yrs 52 40% 54 38%
2-4 yrs 33 26% 59 41%
above 4 yrs 13 10% 20 14%
Grand Total 129 100% 144 100%

128
Figure 4.8: Span of using the mobile payment systems
The above graph depicts that in case of Ranchi city, 40% users were using
mobile payment systems since about 1-2 years, 26% of users were using it
from about 2-4 years, almost 24% of the users were using mobile payment
systems since 0-1 years, and only 10% were using it since above 4 yrs.
For Kolkata, 41% of users were using it from about 2-4 years, 38% users were
using mobile payment systems since about 1-2 years, only 14% were using it
since above 4 yrs and only 8% of the users were using mobile payment
systems since 0-1 years.
4.2.4.3 Frequency of using the mobile payment system
Also there was a question to know about the regularity of use of mobile
payment systems, respondents were asked about their frequency of use of
mobile payment systems and the result is shown below.

129
Table 4.11: Frequency of using the mobile payment system
Frequency of use
Ranchi Kolkata
Frequency Percentage Frequency Percentage
Daily several times 9 7% 22 15%
Daily once 12 9% 28 19%
Weekly once 61 47% 61 42%
Monthly once 47 36% 33 23%
Grand Total 129 100% 144 100%
Figure 4.9: Frequency of using mobile payment by consumers
Above graph explains that for Ranchi, Maximum number of users i.e. 47%
was found using mobile payment once in a week, 36% of users used it once in
a month, 9% of the users used mobile payment once daily, and only 7% of
users were using mobile payments several times daily.

130
While for Kolkata, , Maximum number of users i.e. 42% was found using
mobile payment once in a week, 23% of users used it once in a month, 19% of
the users used mobile payment once daily and 15% of users were using mobile
payments several times daily.
4.2.4.4 Expenditure made through mobile payment systems by consumers
To find out how much do consumers spent on mobile payment systems
transactions in a month, respondents were requested to choose from the given
options from below 2000 rupees to above 10000 rupees. Table below exhibits
the response given by the consumers.
Table 4.12: Expenditure made through mobile payment systems by
consumers
Monthly
expense on
mobile
payment
Ranchi Kolkata
Frequency Percentage Frequency Percentage
Below Rs. 2000 63 49% 50 35%
Rs. 2001-5000 28 22% 43 30%
Rs. 5001-10000 26 20% 39 27%
Above Rs.
10000 12 9% 12 8%
Grand Total 129 100% 144 100%

131
Figure 4.10: Expenditure made through mobile payment systems by
consumer
Above graph shows the monthly expenditure made by users through mobile
payment systems. Regarding Ranchi, 49% of the total users spend below 2000
monthly, 22% of users spent between Rs. 2001-5000 monthly, 20% of users
spent between Rs. 5001-10000 monthly and only 9% spent above Rs. 10,000
per month through mobile payment. With respect to Kolkata, 35% of the total
users spend below 2000 monthly, 30% of users spent between Rs. 2001-5000
monthly, 27% of users spent between Rs. 5001-10000 monthly and only 8%
user spent above Rs. 10,000 per month through mobile payment.
4.2.4.5 Loading of balance in consumers mobile wallet
In respect to know about if the consumers keep money in their mobile wallets
they were requested to answer if their wallet is loaded or not. Table below
shows the responses given by the consumers.

132
Table 4.13: Money balance loaded in mobile payment wallet by consumer
mobile wallets
loaded with
balance
Ranchi Kolkata
Frequency Percentage Frequency Percentage
Yes it is anytime
loaded 59 46% 39 27%
I load exact sum to
be paid at the time
of transaction
36 28% 63 44%
I load some extra
amount than needed
at that time
34 36% 42 29%
Grand Total 129 100% 144 100%
Figure 4.11: Money balance in mobile payment wallet by consumer
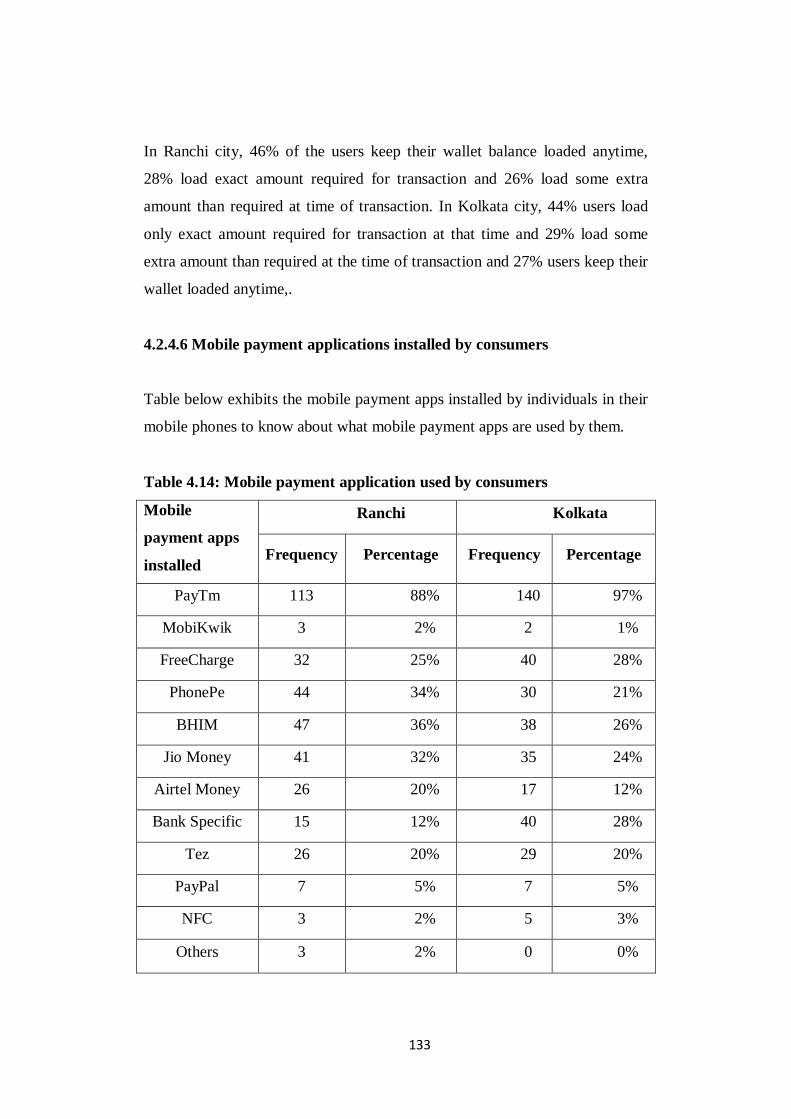
133
In Ranchi city, 46% of the users keep their wallet balance loaded anytime,
28% load exact amount required for transaction and 26% load some extra
amount than required at time of transaction. In Kolkata city, 44% users load
only exact amount required for transaction at that time and 29% load some
extra amount than required at the time of transaction and 27% users keep their
wallet loaded anytime,.
4.2.4.6 Mobile payment applications installed by consumers
Table below exhibits the mobile payment apps installed by individuals in their
mobile phones to know about what mobile payment apps are used by them.
Table 4.14: Mobile payment application used by consumers
Mobile
payment apps
installed
Ranchi Kolkata
Frequency Percentage Frequency Percentage
PayTm 113 88% 140 97%
MobiKwik 3 2% 2 1%
FreeCharge 32 25% 40 28%
PhonePe 44 34% 30 21%
BHIM 47 36% 38 26%
Jio Money 41 32% 35 24%
Airtel Money 26 20% 17 12%
Bank Specific 15 12% 40 28%
Tez 26 20% 29 20%
PayPal 7 5% 7 5%
NFC 3 2% 5 3%
Others 3 2% 0 0%

134
Figure 4.12: Applications used for mobile payment by consumers
Regarding the most installed Mobile Payment System among consumers,
PayTm was found to be the most used mobile payment application in both
cities with 88% in Ranchi and 97% in Kolkata. BHIM was used by 36% of the
users in Ranchi and 26% of the users in Kolkata. PhonePe was used by 34%
users in Ranchi and 21% users in Kolkata. Use of remaining applications
were insignificant in percentage and showed almost similar pattern in both
the cities
4.2.4.7 Purposes for which mobile payment system is used
Given below the table shows the purposes for which mobile payment systems
is used by the consumers.

135
Table 4.15: Purpose for which mobile payment system is used by
consumers
Purpose of
using mobile
payment
Ranchi Kolkata
Frequency Percentage Frequency Percentage
Payment for
utilities 49 38% 96 67%
Entertainment 69 53% 79 55%
Journey tickets 62 48% 76 53%
Fund transfer 69 53% 77 53%
Mobile recharge 111 86% 114 79%
Shopping 91 71% 91 63%
Figure 4.13: Purpose which mobile payment system is used by consumers
Based on the question about for what purposes was mobile payment used
among the consumers it was revealed that mobile payments is used for all the
six options given in the question. Mobile Payments were mostly used for
mobile recharge in Ranchi, almost 86% uses it for mobile recharge followed
by shopping used by 71%. Even in Kolkata people use Mobile Payments

136
mostly for mobile recharge as 79 % of the respondents use it for mobile
recharge followed by payment for utilities done through mobile by 67% of the
respondents and used for shopping by 63% of the respondents.
4.2.4.8 Feel it is risky to use mobile payment systems
Table 4.16: Feeling of risk while using mobile payment by consumers
Risk of financial
data
Ranchi Kolkata
Frequency Percentage Frequency Percentage
Yes 49 38% 46 32%
No 80 62% 98 68%
Grand total 129 100% 144 100%
Figure 4.14: Feeling of risk while using mobile payment by consumers
To know about the sense of risk among users about the use of mobile
payment, users were asked to reply in Yes or No. It was observed that 62% of
the Ranchi users feel no risk in using mobile payment, whereas 68% of the
Kolkata users felt the same. 38% of the Ranchi users felt risk in using mobile
payment, whereas 32% of users in Kolkata felt the same.

137
4.2.4.9 Feeling that merchant may misuse the financial data while using
mobile payment systems
Table 4.17: Feeling of misuse of their credentials by merchants while
using mobile payment system
Feeling of
misuse of data
by merchants
Ranchi Kolkata
Frequency Percentage Frequency Percentage
Yes 40 31% 35 24%
No 89 69% 109 76%
Grand total 129 100% 144 100%
Figure 4.15: Feeling of misuse of their credentials by merchants while
using mobile payment system
To know about the sense of misuse of credentials by merchants among users
about the use of mobile payment, users were asked to reply in Yes or No. It
was observed that 69% of the Ranchi users felt that merchants will not misuse
their credential in using mobile payment, whereas 76% of the Kolkata users
felt so. 31% of the Ranchi users felt that merchants may misuse their
credentials in using mobile payment, only whereas 24% of users in Kolkata
felt so.

138
4.2.4.10 Experience of merchant discouragement
Table 4.18: Experience of merchant discouragement
Merchant
discouragement
for mobile
payment use
Ranchi Kolkata
Frequency Percentage Frequency Percentage
Yes 49 38% 44 69%
No 80 62% 100 31%
Grand total 129 100% 144 100%
Figure 4.16: Experience of merchant discouragement
To know about level of discouragement faced by consumers from merchants
while using mobile payment, users were asked to reply in yes or no. It was
found out that 38% of users in Ranchi faced discouragement from merchant in
paying through mobile payment, where as 69% users in Kolkata faced the
same from merchants. 62% merchants did not discourage people in doing

139
mobile payment in Ranchi, whereas 31% users of Kolkata did not face this
issue.
4.2.4.11 Perception about mobile payment in their city
Figure 4.17: Perception about mobile payment in their city
Majority of consumers in Ranchi, i.e. 76 % feel that there is less awareness
about mobile payment systems in their city, while 65% of Kolkata consumers
feel so. 77% of the respondents in Ranchi city agree with the fact that mobile
payment not being accepted everywhere in the city, whereas 67% of the
Kolkata respondents feel so. Digital illiteracy among merchants is felt by 76%
of Ranchi respondents, whereas same is felt by 68% of Kolkata respondents.
About mobile payment being recent trend in the city, 76% of Ranchi city
respondents felt so, while 63% of Kolkata respondents felt so. Wide
acceptance of mobile payment seems to be distant dream to 78% of the Ranchi
respondents, while 59% of Kolkata respondents agree to this.

140
4.2.4.12 Problems faced by while using mobile payment systems
Table 4.19: Problems faced while use of mobile payment by consumers
Problems while
using mobile
payment
Ranchi Kolkata
Frequency Percentage Frequency Percentage
Transaction failure 68 53% 87 60%
Monthly limitation 26 20% 18 13%
Network failure 77 60% 80 56%
Merchant
discouragement 31 24% 36 25%
Wide acceptance 46 36% 35 24%
Digital literacy 40 31% 52 36%
Figure 4.18: Problems faced in using mobile payment by consumers
To know about the problems faced by the consumers, six options were given
in which consumers could choose more than one option. 60% of the users in
Ranchi faced the issue of network failure in using mobile payment systems,
whereas 56% of the users in Kolkata faced the same issue. 53% of the users in
Ranchi faced the issue of transaction failure in using mobile payment systems,
whereas 60% of the users in Kolkata faced the same issue. Merchant

141
discouragement was faced by 24% users in Ranchi and 25% users in Kolkata.
Wide acceptance and digital literacy were also similarly faced by the users of
both cities. Monthly limitation was least bothering issue for users as it was
faced by only 20% users in Ranchi and 13% users in Kolkata.
4.2.5 Results of Factor Analysis
Factor analysis is done for only users comprising 273 respondents.
4.2.5.1 KMO Bartlett’s Test Results
Bartlett’s test of sphericity and the Kaiser-Meyer-Olkin (KMO) measure of
sampling adequacy help to access the factorability of the data. P-value of
Bartlett’s test of sphericity should be less than 0.05 for factor analysis to be
considered suitable. KMO index should lie between 0 to 1, and if higher than
0.6, it is considered good for a factor analysis (Pallant, 2005).
Table 4.20: KMO Bartlett’s test of consumers
KMO and Bartlett’s Test
Kaiser-Meyer-Olkin Measure of Sampling
Adequacy
.912
Bartlett’s Test
of Sphericity
Approx. Chi-
Square
3641
.047
df 253
Sig. .000

142
In the case of consumers, KMO value is 0.912 (which is above 0.6), we have
p-value 0.000 (which is ≤0.5), therefore factor analysis is appropriate.
4.2.5.2 Exploratory Factor Analysis
Table 4.21: Total variance test of consumers
Total Variance Explained
Comp
onent
Initial Eigenvalues
Extraction Sums of
Squared Loadings
Rotation Sums of
Squared Loadings
Total
% of
Varia
nce
Cumul
ative
% Total
% of
Varia
nce
Cumul
ative %
Tota
l
% of
Varia
nce
Cumulat
ive %
1 9.318
40.51
2 40.512
9.31
8
40.51
2 40.512
4.04
8
17.59
8 17.598
2 2.302
10.01
0 50.522
2.30
2
10.01
0 50.522
2.98
0
12.95
4 30.552
3 1.504 6.538 57.060
1.50
4 6.538 57.060
2.88
0
12.52
2 43.075
4 1.199 5.213 62.273
1.19
9 5.213 62.273
2.83
2
12.31
3 55.388
5 1.035 4.501 66.774
1.03
5 4.501 66.774
2.61
9
11.38
6 66.774
6 .839 3.648 70.422
7 .789 3.432 73.854
8 .668 2.906 76.760
9 .622 2.703 79.463
10 .566 2.460 81.922
11 .492 2.138 84.061
12 .482 2.096 86.157
13 .454 1.975 88.132
14 .393 1.709 89.841
15 .377 1.638 91.479
16 .353 1.536 93.015
17 .299 1.302 94.316
18 .272 1.180 95.497
19 .254 1.103 96.600
20 .222 .967 97.567

143
21 .220 .958 98.525
22 .195 .850 99.375
23 .144 .625
100.00
0
Percentage of variance as shown in table 4.3 shows total variance attributed to
each factor. Principal components analysis revealed the presence of five
components with eigenvalues exceeding 1, explaining 17.60 per cent, 12.96
per cent, 12.51 per cent, 12.31 and 11.39 per cent of the variance respectively.
Table 4.22: Rotated component matrix of consumers
Rotated Component Matrixa
Component
1 2 3 4 5
I find it very useful (v1) .829 .174 .084 .107 .236
It makes my payment quick (v2) .857 .083 .096 .156 .191
I can use it from anywhere at anytime (v3) .798 .117 .101 .172 .175
It helps me to keep track of my day to day expense
(v4) .441 .415 .390 .261 -.178
It eases my transaction while shopping online or
booking tickets (v5) .605 .124 .188 .349 .122
It is easy to use (v6) .382 .002 .164 .776 .124
I may not carry wallet, but I carry my mobile
everywhere (v7) .292 .018 .231 .597 .063
It is compatible with my lifestyle (v8) .349 .410 .096 .647 .075
It was easy for me to learn its process (v9) .285 .270 .095 .724 .114
It was easy for me to become skilful in using it
(v10) .201 .202 .161 .718 .275
I think it will add to my image in my community
(v11) -.045 .618 .326 .390 .171
I encourage my family and friends to use mobile
payment (v12) .424 .679 .076 .200 .151
People important to me use it (v13) .019 .847 .209 .128 .191
It has made life of my family and friends easier
(v14) .142 .740 .245 .130 .238
I support cashless India (v15) .293 .185 .571 .237 .177

144
I use to help in curbing black money (v16) .250 .149 .713 .260 .109
I have started using mobile payment after
demonetisation (v17) -.023 .195 .701 -.027 .274
I prefer to use mobile payment launched by the
government (v18) .070 .154 .763 .134 .196
I trust my app provider (v19) .226 .348 .408 .112 .462
I use mobile payment because cashbacks are given
(v20) .220 .263 .099 -.106 .707
I want cross wallet transfer feature in mobile
payment (v21) .164 .121 .211 .153 .749
I am concerned about my refund in case of
transaction failure (v22) .209 .068 .153 .295 .675
I trust my app provider because of good reviews in
mass/social media (v23) .114 .154 .362 .336 .551
Extraction Method: Principal Component Analysis.
Rotation Method: Varimax with Kaiser Normalization.
a. Rotation converged in 7 iterations.
Interpretation – From the above table, it is found that v1, v2, v3, v4 and v5
show more loadings under the first component and thus it can be named as
Usefulness Factors. These are the variables that have utility on use of mobile
payment system. Similarly v11, v12, v13 & v14 have more loadings under the
second component and thus it can be named as Social Influence Factors.
Likewise, v15, v16, v17 & v18 have more loadings under the third component
and thus it can be named as Government Initiatives Factors. It was further
found that v6, v7, v8, v9 & v10 have more loadings under the fourth
component and thus it can be named as Ease of Use Factors and finally v19,
v20, v21, v22 & v23 show more loadings under the fifth component and thus
it can be named as Application Providers Factors. So total of five factors were
extracted.

145
4.2.5.3 Reliability analysis
Cronbach’s alpha was used to check the reliability of all the factors taken in
the questionnaire and to check the internal consistency within each factor. The
factors with Cronbach’s value equal to or greater than 0.7, are considered as
reliable and shall be considered for further analysis. The Cronbach’s alpha
value of the items of each factor is mentioned below.
Table 4.23: Cronbach’s alpha value of consumer respondents
Factor Description Cronbach’s
Alpha value
Usefulness I use mobile payment because I find it very
useful
0.844
I use mobile payment because it makes my
payment quick
I use mobile payment because I can use it from
anywhere at anytime
I use mobile payment because it helps me to
keep track of my day to day expense
I use mobile payment because it eases my
transaction while shopping online or booking
tickets
Ease of use I use mobile payment because easy to use 0.834
I use mobile payment because I may not carry
wallet, but I carry my mobile everywhere
I use mobile payment because it is compatible
with my lifestyle
I use mobile payment because it was easy for
me to learn its process
I use mobile payment because it was easy for
me to become skilful in using it

146
Social
influence
I use mobile payment because I think it will
add to my image in my community
0.844
I encourage my family and friends to use
mobile payment
I use mobile payment because my family and
friends use it
I use mobile payment after seeing that it has
made life of my family and friends easier
Government I use mobile payment to support cashless India 0.781
I use mobile payment to help in curbing black
money
I have started using mobile payment systems
after demonetisation
I prefer to use mobile payment launched by the
government
Application
provider
I use mobile payment because I trust my app
provider
0.813
I use mobile payment systems because
cashbacks are given
I want cross wallet transfer feature in mobile
payment systems
I am concerned about my refund in case of
transaction failure
I trust my app provider because of good
reviews in mass/social media

147
4.2.6 Hypotheses testing for finding association between demographic
variables and awareness about the mobile payment systems
Chi-square test is done to explore the relationship between two categorical
variables. In other words, we use chi square to find if categorical dependent
variable and categorical independent variables are related.
4.2.6.1 Association between City and Awareness about Mobile Payment
Systems
Table 4.24: Cross tabulation city’s influence on awareness about mobile
payment systems
City * Awareness Crosstabulation
Awareness
Total Yes No
City Ranchi Count 181 19 200
Expected Count 182.5 17.5 200.0
% within City 90.5% 9.5% 100.0%
% within
Awareness 49.6% 54.3% 50.0%
% of Total 45.3% 4.8% 50.0%
Kolkata Count 184 16 200
Expected Count 182.5 17.5 200.0
% within City 92.0% 8.0% 100.0%
% within 50.4% 45.7% 50.0%
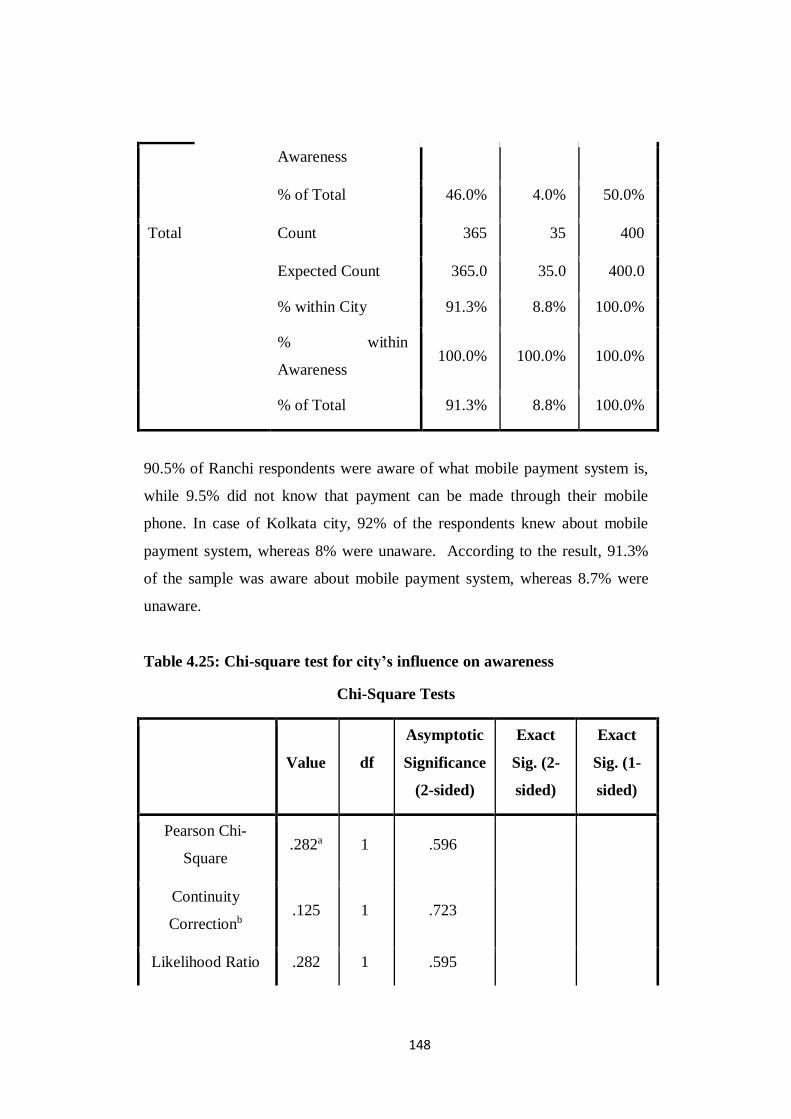
148
Awareness
% of Total 46.0% 4.0% 50.0%
Total Count 365 35 400
Expected Count 365.0 35.0 400.0
% within City 91.3% 8.8% 100.0%
% within
Awareness 100.0% 100.0% 100.0%
% of Total 91.3% 8.8% 100.0%
90.5% of Ranchi respondents were aware of what mobile payment system is,
while 9.5% did not know that payment can be made through their mobile
phone. In case of Kolkata city, 92% of the respondents knew about mobile
payment system, whereas 8% were unaware. According to the result, 91.3%
of the sample was aware about mobile payment system, whereas 8.7% were
unaware.
Table 4.25: Chi-square test for city’s influence on awareness
Chi-Square Tests
Value df
Asymptotic
Significance
(2-sided)
Exact
Sig. (2-
sided)
Exact
Sig. (1-
sided)
Pearson Chi-
Square .282a 1 .596
Continuity
Correctionb .125 1 .723
Likelihood Ratio .282 1 .595

149
Fisher’s Exact
Test .724 .362
Linear-by-Linear
Association .281 1 .596
N of Valid Cases 400
a. 0 cells (0.0%) have expected count less than 5. The minimum expected
count is 17.50.
b. Computed only for a 2x2 table
H01a-There is no association between the awareness about the mobile payment
system and city of the consumer.
To be significant the Sig. value needs to be .05 or smaller. In this case, the
significance value of .723 is larger than the alpha value of .05, so we can
conclude that our result is not significant. This means that the proportion of
Ranchi people that are aware about the mobile payment is not significantly
different from the proportion of Kolkata people that are aware about the
mobile payment system.
4.2.6.2 Association between Gender and Awareness about Mobile
Payment Systems
Table 4.26: Cross tabulation for gender’s influence on awareness
Gender * Awareness Crosstabulation
Awareness
Total Yes No
Gender Male Count 245 20 265
Expected Count 241.8 23.2 265.0

150
% within Gender 92.5% 7.5% 100.0%
% within Awareness 67.1% 57.1% 66.3%
% of Total 61.3% 5.0% 66.3%
Female Count 120 15 135
Expected Count 123.2 11.8 135.0
% within Gender 88.9% 11.1% 100.0%
% within Awareness 32.9% 42.9% 33.8%
% of Total 30.0% 3.8% 33.8%
Total Count 365 35 400
Expected Count 365.0 35.0 400.0
% within Gender 91.3% 8.8% 100.0%
% within Awareness 100.0% 100.0% 100.0%
% of Total 91.3% 8.8% 100.0%
92.5% of the total males were aware about mobile payment system, while
7.5% were unaware. For females, 88.9% were aware, while, 11.1% were
aware about mobile payment system. According to the result, 91.3% of the
sample was aware about mobile payment system, whereas 8.7% were
unaware.

151
Table 4.27: Chi-square test for gender’s influence on awareness
Chi-Square Tests
Value df
Asymptotic
Significance
(2-sided)
Exact
Sig. (2-
sided)
Exact
Sig. (1-
sided)
Pearson Chi-
Square 1.423a 1 .233
Continuity
Correctionb 1.011 1 .315
Likelihood Ratio 1.377 1 .241
Fisher’s Exact
Test .263 .157
Linear-by-Linear
Association 1.419 1 .234
N of Valid Cases 400
a. 0 cells (0.0%) have expected count less than 5. The minimum expected
count is 11.81.
b. Computed only for a 2x2 table
H02a-There is no association between the awareness about the mobile payment
system and gender of the consumer.
To be significant the Sig. value needs to be .05 or smaller. In this case the
value of .315 is larger than the alpha value of .05, so we can conclude that our
result is not significant. This means that the proportion of male that are aware

152
about the mobile payment system is not significantly different from the
proportion of female that are aware about the mobile payment system.
4.2.6.3 Association between Age and Awareness about Mobile Payment
Systems
Table 4.28: Cross tabulation for age’s influence on awareness
Age * Awareness Crosstabulation
Awareness
Total
Yes No
Age
15 to 25 yrs
Count 114 11 125
Expected Count 114.1 10.9 125.0
% within Age 91.2% 8.8% 100.0%
% within
Awareness 31.2% 31.4% 31.3%
% of Total 28.5% 2.8% 31.3%
26 to 40 yrs
Count 189 11 200
Expected Count 182.5 17.5 200.0
% within Age 94.5% 5.5% 100.0%
% within
Awareness 51.8% 31.4% 50.0%
% of Total 47.3% 2.8% 50.0%
41 to 60 yrs
Count 49 6 55
Expected Count 50.2 4.8 55.0
% within Age 89.1% 10.9% 100.0%

153
% within
Awareness 13.4% 17.1% 13.8%
% of Total 12.3% 1.5% 13.8%
Above 61
yrs
Count 13 7 20
Expected Count 18.3 1.8 20.0
% within Age 65.0% 35.0% 100.0%
% within
Awareness 3.6% 20.0% 5.0%
% of Total 3.3% 1.8% 5.0%
Total
Count 365 35 400
Expected Count 365.0 35.0 400.0
% within Age 91.3% 8.8% 100.0%
% within
Awareness 100.0% 100.0% 100.0%
% of Total 91.3% 8.8% 100.0%
In case of age group of 15 to 25 yrs about 91.2% were aware about mobile
payment system and 8.8% were unaware. In case of age group of 26 to 40 yrs
about 94.5% were aware about mobile payment system and 5.5% were
unaware. In case of age group of 41 to 60 yrs about 94.5% were aware about
mobile payment system and 5.5% were unaware. In case of age group of
above 61 yrs about 65% were aware about mobile payment system and 35%
were unaware. According to the result, 91.3% of the sample was aware about
mobile payment system, whereas 8.7% were unaware.

154
Table 4.29: Chi-square test for age’s influence on awareness
Chi-Square Tests
Value df
Asymptotic
Significance (2-
sided)
Pearson Chi-Square 20.228a 3 .000
Likelihood Ratio 13.903 3 .003
Linear-by-Linear
Association 6.550 1 .010
N of Valid Cases 400
a. 2 cells (25.0%) have expected count less than 5. The minimum expected
count is 1.75.
H03a-There is no association between the awareness about the mobile payment
system and age of the consumer.
To be significant the Sig. value needs to be .05 or smaller. In this case the
value of .000 is smaller than the alpha value of .05, so we can conclude that
our result is significant. This means that there is association between the
awareness about the mobile payment system and age of the consumer.
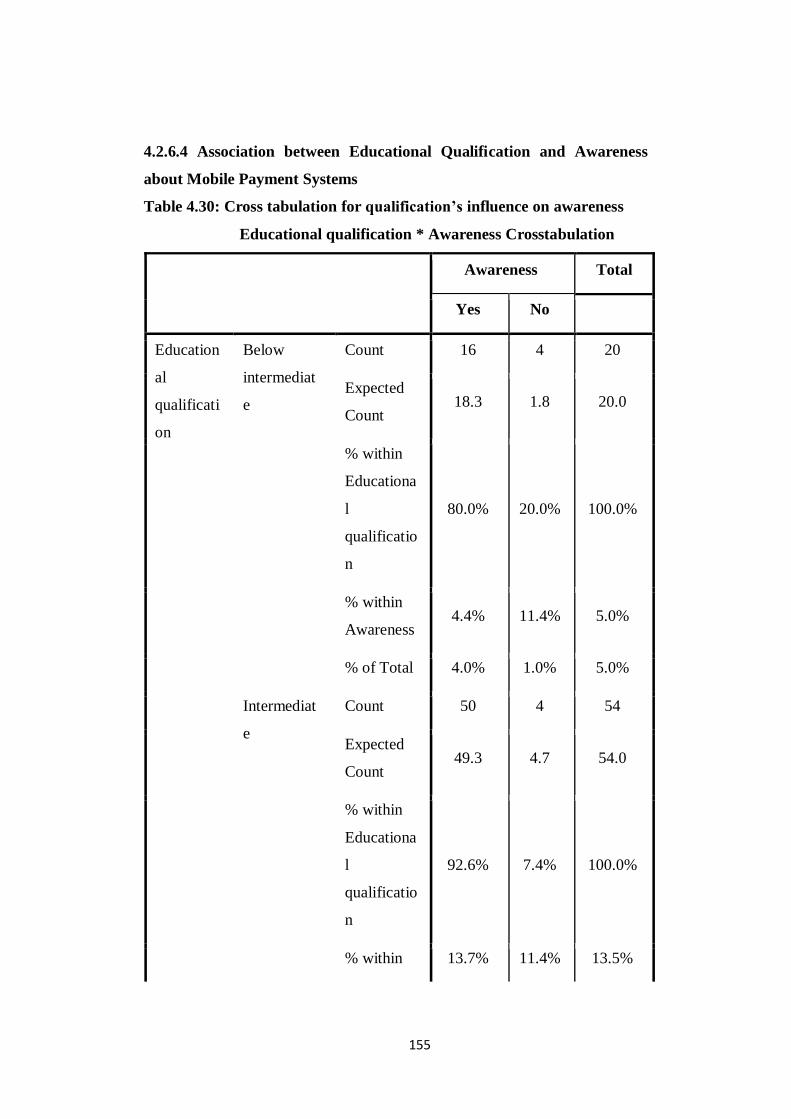
155
4.2.6.4 Association between Educational Qualification and Awareness
about Mobile Payment Systems
Table 4.30: Cross tabulation for qualification’s influence on awareness
Educational qualification * Awareness Crosstabulation
Awareness Total
Yes No
Education
al
qualificati
on
Below
intermediat
e
Count 16 4 20
Expected
Count 18.3 1.8 20.0
% within
Educationa
l
qualificatio
n
80.0% 20.0% 100.0%
% within
Awareness 4.4% 11.4% 5.0%
% of Total 4.0% 1.0% 5.0%
Intermediat
e
Count 50 4 54
Expected
Count 49.3 4.7 54.0
% within
Educationa
l
qualificatio
n
92.6% 7.4% 100.0%
% within 13.7% 11.4% 13.5%

156
Awareness
% of Total 12.5% 1.0% 13.5%
Graduate Count 225 17 242
Expected
Count 220.8 21.2 242.0
% within
Educationa
l
qualificatio
n
93.0% 7.0% 100.0%
% within
Awareness 61.6% 48.6% 60.5%
% of Total 56.3% 4.3% 60.5%
PG and
above
Count 74 10 84
Expected
Count 76.7 7.4 84.0
% within
Educationa
l
qualificatio
n
88.1% 11.9% 100.0%
% within
Awareness 20.3% 28.6% 21.0%
% of Total 18.5% 2.5% 21.0%
Total Count 365 35 400
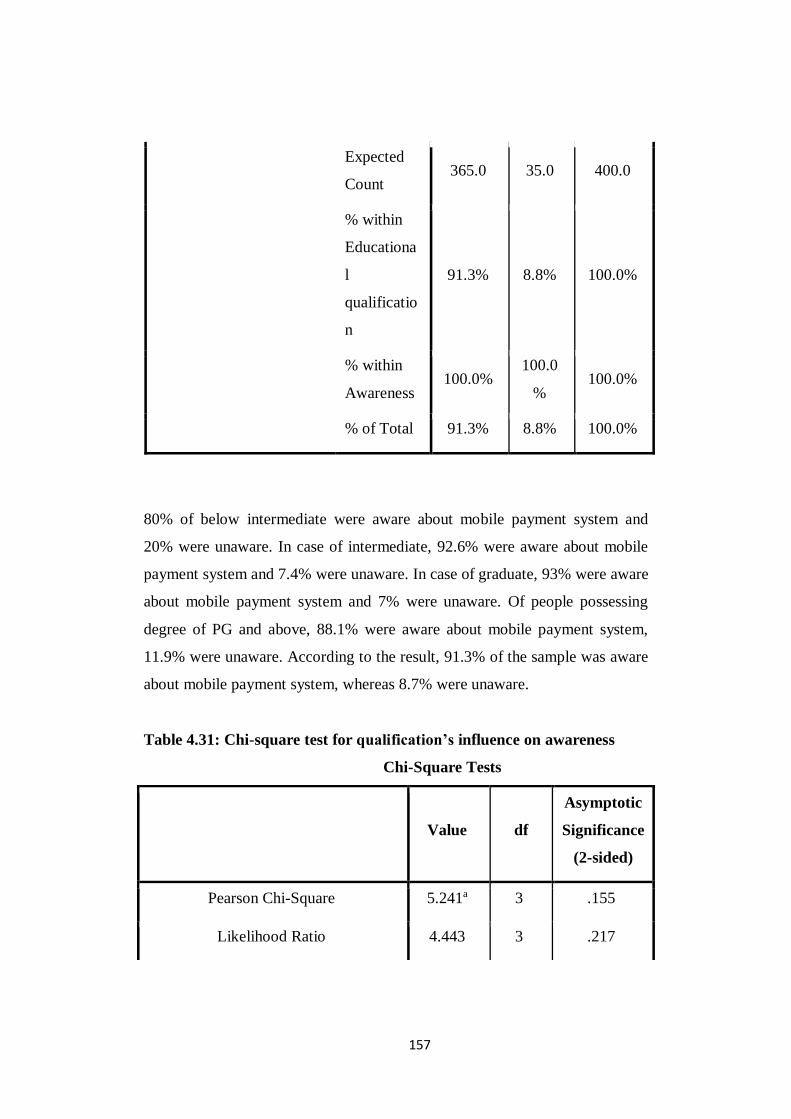
157
Expected
Count 365.0 35.0 400.0
% within
Educationa
l
qualificatio
n
91.3% 8.8% 100.0%
% within
Awareness 100.0%
100.0
% 100.0%
% of Total 91.3% 8.8% 100.0%
80% of below intermediate were aware about mobile payment system and
20% were unaware. In case of intermediate, 92.6% were aware about mobile
payment system and 7.4% were unaware. In case of graduate, 93% were aware
about mobile payment system and 7% were unaware. Of people possessing
degree of PG and above, 88.1% were aware about mobile payment system,
11.9% were unaware. According to the result, 91.3% of the sample was aware
about mobile payment system, whereas 8.7% were unaware.
Table 4.31: Chi-square test for qualification’s influence on awareness
Chi-Square Tests
Value df
Asymptotic
Significance
(2-sided)
Pearson Chi-Square 5.241a 3 .155
Likelihood Ratio 4.443 3 .217

158
Linear-by-Linear Association .073 1 .788
N of Valid Cases 400
2 cells (25.0%) have expected count less than 5. The minimum expected count
is 1.75
H04a-There is no association between the awareness about the mobile payment
system and educational qualification of the consumer.
To be significant the Sig. value needs to be .05 or smaller. In this case the
value of .155 is larger than the alpha value of .05, so we can conclude that our
result is not significant. This means that there is no association between the
awareness about the mobile payment system and educational qualification of
the consumer.
4.2.6.5 Association between Occupation and Awareness about Mobile
Payment Systems
Table 4.32: Cross tabulation for occupation’s influence on awareness
Occupation * Awareness Crosstabulation
Awareness
Total Yes No
Occupatio
n
Student Count 68 6 74
Expected
Count 67.5 6.5 74.0
% within
Occupatio91.9% 8.1% 100.0%

159
n
% within
Awareness 18.6% 17.1% 18.5%
% of Total 17.0% 1.5% 18.5%
Businessman Count 75 6 81
Expected
Count 73.9 7.1 81.0
% within
Occupatio
n
92.6% 7.4% 100.0%
% within
Awareness 20.5% 17.1% 20.3%
% of Total 18.8% 1.5% 20.3%
Occupationa
l
Count 41 4 45
Expected
Count 41.1 3.9 45.0
% within
Occupatio
n
91.1% 8.9% 100.0%
% within
Awareness 11.2% 11.4% 11.3%
% of Total 10.3% 1.0% 11.3%
Govt
employee
Count 38 2 40
Expected
Count 36.5 3.5 40.0

160
% within
Occupatio
n
95.0% 5.0% 100.0%
% within
Awareness 10.4% 5.7% 10.0%
% of Total 9.5% 0.5% 10.0%
Pvt
employee
Count 106 6 112
Expected
Count 102.2 9.8 112.0
% within
Occupatio
n
94.6% 5.4% 100.0%
% within
Awareness 29.0% 17.1% 28.0%
% of Total 26.5% 1.5% 28.0%
Housewife Count 25 5 30
Expected
Count 27.4 2.6 30.0
% within
Occupatio
n
83.3% 16.7% 100.0%
% within
Awareness 6.8% 14.3% 7.5%
% of Total 6.3% 1.3% 7.5%
Unemployed Count 12 6 18

161
Expected
Count 16.4 1.6 18.0
% within
Occupatio
n
66.7% 33.3% 100.0%
% within
Awareness 3.3% 17.1% 4.5%
% of Total 3.0% 1.5% 4.5%
Total Count 365 35 400
Expected
Count 365.0 35.0 400.0
% within
Occupatio
n
91.3% 8.8% 100.0%
% within
Awareness
100.0
%
100.0
% 100.0%
% of Total 91.3% 8.8% 100.0%
99.1% of students were aware about mobile payment system, 8.1% were
unaware. 92.6% of businessman were aware about mobile payment system,
7.4% were unaware. 91.1% of professionals were aware about mobile
payment system, 8.9% were unaware. 94.6% of government employees were
aware about mobile payment system, 4.4% were unaware. 83.3% of
housewives were ware about mobile payment system, 16.7% were unaware.
83.3% of private employees were unaware about mobile payment system,
while 16.7% were unaware. 66.7% of unemployed were aware about mobile

162
payment system, 33.3% were unaware. According to the result, 91.3% of the
sample was aware about mobile payment system, whereas 8.7% were
unaware.
Table 4.33: Chi-square test for occupation’s influence on awareness
Chi-Square Tests
Value df
Asymptotic
Significance
(2-sided)
Pearson Chi-Square 18.521a 6 .005
Likelihood Ratio 13.329 6 .038
Linear-by-Linear
Association 2.973 1 .085
N of Valid Cases 400
a. 4 cells (28.6%) have expected count less than 5. The minimum
expected count is 1.58.
H05a-There is no association between the awareness about the mobile payment
system and occupation of the consumer.
To be significant the Sig. value needs to be .05 or smaller. In this case the
value of .005 is smaller than the alpha value of .05, so we can conclude that
our result is significant. This means that there is association between the
awareness about the mobile payment system and occupation of the consumer.

163
4.2.6.6 Association between Income and Awareness about Mobile
Payment Systems
Table 4.34: Cross tabulation for income’s influence on awareness
Monthly Income * Awareness Crosstabulation
Awareness
Total Yes No
Monthly
Income
Upto Rs.
10k
Count 121 20 141
Expected Count 128.7 12.3 141.0
% within
Monthly Income 85.8% 14.2% 100.0%
% within
Awareness 33.2% 57.1% 35.3%
% of Total 30.3% 5.0% 35.3%
Rs. 10k-
30k
Count 97 7 104
Expected Count 94.9 9.1 104.0
% within
Monthly Income 93.3% 6.7% 100.0%
% within
Awareness 26.6% 20.0% 26.0%
% of Total 24.3% 1.8% 26.0%
Rs. 30k-
50k
Count 67 2 69
Expected Count 63.0 6.0 69.0
% within
Monthly Income 97.1% 2.9% 100.0%

164
% within
Awareness 18.4% 5.7% 17.3%
% of Total 16.8% 0.5% 17.3%
Rs. 50k-
1lakh
Count 55 5 60
Expected Count 54.8 5.3 60.0
% within
Monthly Income 91.7% 8.3% 100.0%
% within
Awareness 15.1% 14.3% 15.0%
% of Total 13.8% 1.3% 15.0%
Above
Rs. 1lakh
Count 25 1 26
Expected Count 23.7 2.3 26.0
% within
Monthly Income 96.2% 3.8% 100.0%
% within
Awareness 6.8% 2.9% 6.5%
% of Total 6.3% 0.3% 6.5%
Total Count 365 35 400
Expected Count 365.0 35.0 400.0
% within
Monthly Income 91.3% 8.8% 100.0%
% within
Awareness 100.0% 100.0% 100.0%
% of Total 91.3% 8.8% 100.0%

165
85.8% of respondents having monthly income of upto Rs. 10,000 were aware
about mobile payment system, whereas 14.2% were unaware. In case of
income group of Rs 10,001-30,000, 93.3% were aware about mobile payment
system, 6.7% were unaware. For income group of Rs. 30,001-50,000, 97.1%
were aware about mobile payment system and 2.9% were unaware. For
income group of Rs. 50,001-1lakh, 91.7% were aware about mobile payment
system, while 8.3% were unaware. For respondents earning above Rs. 1lakh,
96.2% were aware and 3.8% were unaware. According to the result, 91.3% of
the sample was aware about mobile payment system, whereas 8.7% were
unaware.
Table 4.35: Chi-square test for income’s influence on awareness
Chi-Square Tests
Value df
Asymptotic
Significance (2-
sided)
Pearson Chi-Square 9.501a 4 .050
Likelihood Ratio 9.933 4 .042
Linear-by-Linear
Association 4.979 1 .026
N of Valid Cases 400
a. 1 cells (10.0%) have expected count less than 5. The minimum
expected count is 2.28.
H06a-There is no association between the awareness about the mobile payment
system and income of the consumer.

166
To be significant the Sig. value needs to be .05 or smaller. In this case the
value of .05 is equal to the alpha value of .05, so we can conclude that our
result is significant. This means that there is association between the
awareness about the mobile payment system and income of the consumer.
4.2.6.7 Association between Personal innovativeness and Awareness about
Mobile Payment Systems
Table 4.36: Cross tabulation personal innovation’s influence on
awareness
Personal innovativeness * Awareness Crosstabulation
Awareness
Total Yes No
When a
new
technolog
y is
introduce
d in the
market
I am
usually
among
the first to
use
Count 106 1 107
Expected
Count 97.6 9.4 107.0
% within
Personal
innovatine
ss
99.1% 0.9% 100.0%
% within
Awareness 29.0% 2.9% 26.8%
% of Total 26.5% 0.3% 26.8%
I wait for
others to
Count 149 14 163
Expected 148.7 14.3 163.0

167
use first Count
% within
Personal
innovatine
ss
91.4% 8.6% 100.0%
% within
Awareness 40.8% 40.0% 40.8%
% of Total 37.3% 3.5% 40.8%
I am
among
late users
Count 82 8 90
Expected
Count 82.1 7.9 90.0
% within
Personal
innovatine
ss
91.1% 8.9% 100.0%
% within
Awareness 22.5% 22.9% 22.5%
% of Total 20.5% 2.0% 22.5%
I prefer
using old
technolog
y only
Count 28 12 40
Expected
Count 36.5 3.5 40.0
% within
Personal
innovatine
ss
70.0% 30.0% 100.0%
% within 7.7% 34.3% 10.0%

168
Awareness
% of Total 7.0% 3.0% 10.0%
Total Count 365 35 400
Expected
Count 365.0 35.0 400.0
% within
Personal
innovatine
ss
91.3% 8.8% 100.0%
% within
Awareness
100.0
%
100.0
% 100.0%
% of Total 91.3% 8.8% 100.0%
99.1% of people among the first to use technology were aware about mobile
payment system, while only 0.9% were unaware. In case of the one who waits
for others to use first, 91.4% were aware about mobile payment system, while
8.6% were unaware. For the late users, 91.1% were aware, 8.9% were
unaware. Among the ones preferring old technology, 70% were aware about
mobile payment system, 30% were unaware. According to the result, 91.3% of
the sample was aware about mobile payment system, whereas 8.7% were
unaware.

169
Table 4.37: Chi-square test for personal innovation’s influence on
awareness
Chi-Square Tests
Value df
Asymptotic
Significance (2-
sided)
Pearson Chi-Square 30.815a 3 .000
Likelihood Ratio 27.681 3 .000
Linear-by-Linear Association 23.383 1 .000
N of Valid Cases 400
a. 1 cells (12.5%) have expected count less than 5. The minimum expected
count is 3.50.
H07a-There is no association between the awareness about the mobile payment
system and personal innovativeness of the consumer.
To be significant the Sig. value needs to be .05 or smaller. In this case the
value of .000 is smaller than the alpha value of .05, so we can conclude that
our result is significant. This means that there is association between the
awareness about the mobile payment system and personal innovativeness of
the consumer.

170
4.2.7 Hypotheses testing for finding association between demographic
variables and use of the mobile payment systems
4.2.7.1 Association between City and Use of Mobile Payment Systems
Table 4.38: Cross tabulation for use and city
City * Do you use mobile payment system Crosstabulation
Do you use mobile
payment system
Total Yes No
City Ranchi Count 129 71 200
Expected Count 136.5 63.5 200.0
% within City 64.5% 35.5% 100.0%
% within Do you
use mobile
payment system
47.3% 55.9% 50.0%
% of Total 32.3% 17.8% 50.0%
Kolkata Count 144 56 200
Expected Count 136.5 63.5 200.0
% within City 72.0% 28.0% 100.0%
% within Do you
use mobile
payment system
52.7% 44.1% 50.0%
% of Total 36.0% 14.0% 50.0%
Total Count 273 127 400

171
Expected Count 273.0 127.0 400.0
% within City 68.3% 31.8% 100.0%
% within Do you
use mobile
payment system
100.0% 100.0% 100.0%
% of Total 68.3% 31.8% 100.0%
64.5% of Ranchi respondents were using mobile payment system is, while
35.5% did not use mobile payment. In case of Kolkata city, 72% of the
respondents were using mobile payment system, whereas 8% were non users.
According to the result, 68.3% of the sample was using mobile payment
system, whereas 31.7% were not using.
Table 4.39: Chi-square test for use and city
Chi-Square Tests
Value df
Asymptotic
Significance
(2-sided)
Exact Sig.
(2-sided)
Exact Sig.
(1-sided)
Pearson Chi-
Square 2.596a 1 .107
Continuity
Correctionb 2.261 1 .133
Likelihood Ratio 2.600 1 .107
Fisher’s Exact
Test .132 .066
Linear-by-Linear 2.589 1 .108

172
Association
N of Valid Cases 400
a. 0 cells (0.0%) have expected count less than 5. The minimum expected count is 63.50.
b. Computed only for a 2x2 table
H01b-There is no association between the use of mobile payment system and
city of the consumer
To be significant the Sig. value needs to be .05 or smaller. In this case the
value of .133 is larger than the alpha value of .05, so we can conclude that our
result is not significant. This means that the proportion of Ranchi people that
uses the mobile payment system is not significantly different from the
proportion of Kolkata people that uses the mobile payment system.
4.2.7.2 Association between Gender and Use of Mobile Payment Systems
Table 4.40: Cross tabulation for use and gender
Gender * Do you use mobile payment system Crosstabulation
Do you use mobile
payment system
Total Yes No
Gender Male Count 187 78 265
Expected Count 180.9 84.1 265.0
% within Gender 70.6% 29.4% 100.0%
% within Do you
use mobile
payment system
68.5% 61.4% 66.3%

173
% of Total 46.8% 19.5% 66.3%
Female Count 86 49 135
Expected Count 92.1 42.9 135.0
% within Gender 63.7% 36.3% 100.0%
% within Do you
use mobile
payment system
31.5% 38.6% 33.8%
% of Total 21.5% 12.3% 33.8%
Total Count 273 127 400
Expected Count 273.0 127.0 400.0
% within Gender 68.3% 31.8% 100.0%
% within Do you
use mobile
payment system
100.0% 100.0% 100.0%
% of Total 68.3% 31.8% 100.0%
70.6% of the total males were using mobile payment system, while 29.4%
were not using it. For females, 63.7% were using, while, 36.3% were non
users of mobile payment system. According to the result, 68.3% of the sample
was using mobile payment system, whereas 31.7% were not using.

174
Table 4.41: Chi-square test for use and gender
Chi-Square Tests
Value df
Asymptotic
Significance
(2-sided)
Exact
Sig. (2-
sided)
Exact
Sig. (1-
sided)
Pearson Chi-
Square 1.944a 1 .163
Continuity
Correctionb 1.640 1 .200
Likelihood Ratio 1.923 1 .166
Fisher’s Exact
Test .174 .101
Linear-by-Linear
Association 1.939 1 .164
N of Valid Cases 400
a. 0 cells (0.0%) have expected count less than 5. The minimum expected
count is 42.86.
b. Computed only for a 2x2 table
H02b-There is no association between the use of mobile payment system and
gender of the consumer
To be significant the Sig. value needs to be .05 or smaller. In this case the
value of .200 is larger than the alpha value of .05, so we can conclude that our
result is not significant. This means that the proportion of male that uses the
mobile payment system is not significantly different from the proportion of
female that uses the mobile payment system.

175
4.2.7.3 Association between Age and Use of Mobile Payment Systems
Table 4.42: Cross tabulation for use and age
Age * Do you use mobile payment system Crosstabulation
Do you use mobile
payment system
Total Yes No
Age 15 to 25
yrs
Count 90 35 125
Expected Count 85.3 39.7 125.0
% within Age 72.0% 28.0% 100.0%
% within Do you
use mobile
payment system
33.0% 27.6% 31.3%
% of Total 22.5% 8.8% 31.3%
26 to 40
yrs
Count 143 57 200
Expected Count 136.5 63.5 200.0
% within Age 71.5% 28.5% 100.0%
% within Do you
use mobile
payment system
52.4% 44.9% 50.0%
% of Total 35.8% 14.3% 50.0%
41 to 60
yrs
Count 36 19 55
Expected Count 37.5 17.5 55.0
% within Age 65.5% 34.5% 100.0%

176
% within Do you
use mobile
payment system
13.2% 15.0% 13.8%
% of Total 9.0% 4.8% 13.8%
Above
61 yrs
Count 4 16 20
Expected Count 13.7 6.4 20.0
% within Age 20.0% 80.0% 100.0%
% within Do you
use mobile
payment system
1.5% 12.6% 5.0%
% of Total 1.0% 4.0% 5.0%
Total Count 273 127 400
Expected Count 273.0 127.0 400.0
% within Age 68.3% 31.8% 100.0%
% within Do you
use mobile
payment system
100.0% 100.0% 100.0%
% of Total 68.3% 31.8% 100.0%
In case of age group of 15 to 25 yrs about 72% were using mobile payment
system and 28% were non users. In case of age group of 26 to 40 yrs about
71.5% were users of mobile payment system and 28.5% were non users. In
case of age group of 41 to 60 yrs about 65.5% were using mobile payment
system and 34.5% were not using it. In case of age group of above 61 yrs only
20% were using mobile payment system and 80% were non users. According

177
to the result, 68.3% of the sample was using mobile payment system, whereas
31.7% were non users.
Table 4.43: Chi-square test for use and age
Chi-Square Tests
Value df
Asymptotic
Significance (2-
sided)
Pearson Chi-Square 23.472a 3 .000
Likelihood Ratio 21.772 3 .000
Linear-by-Linear Association 11.636 1 .001
N of Valid Cases 400
a. 0 cells (0.0%) have expected count less than 5. The minimum expected
count is 6.35.
H03b-There is no association between the use of mobile payment system and
age of the consumer.
To be significant the Sig. value needs to be .05 or smaller. In this case the
value of .000 is smaller than the alpha value of .05, so we can conclude that
our result is significant.This means that there is association between the use of
the mobile payment system and age of the consumer.

178
4.2.7.4 Association between Educational Qualification and Use of Mobile
Payment Systems
Table 4.44: Cross tabulation for use and educational qualification
Educational qualification * Do you use mobile payment system
Crosstabulation
Do you use
mobile payment
system
Total Yes No
Educational
qualification
Below
intermediate
Count 13 7 20
Expected
Count 13.7 6.4 20.0
% within
Educational
qualification
65.0% 35.0% 100.0%
% within
Do you use
mobile
payment
system
4.8% 5.5% 5.0%
% of Total 3.3% 1.8% 5.0%
Intermediate Count 31 23 54
Expected
Count 36.9 17.1 54.0
% within 57.4% 42.6% 100.0%

179
Educational
qualification
% within
Do you use
mobile
payment
system
11.4% 18.1% 13.5%
% of Total 7.8% 5.8% 13.5%
Graduate Count 167 75 242
Expected
Count 165.2 76.8 242.0
% within
Educational
qualification
69.0% 31.0% 100.0%
% within
Do you use
mobile
payment
system
61.2% 59.1% 60.5%
% of Total 41.8% 18.8% 60.5%
PG and
above
Count 62 22 84
Expected
Count 57.3 26.7 84.0
% within
Educational
qualification
73.8% 26.2% 100.0%

180
% within
Do you use
mobile
payment
system
22.7% 17.3% 21.0%
% of Total 15.5% 5.5% 21.0%
Total Count 273 127 400
Expected
Count 273.0 127.0 400.0
% within
Educational
qualification
68.3% 31.8% 100.0%
% within
Do you use
mobile
payment
system
100.0% 100.0% 100.0%
% of Total 68.3% 31.8% 100.0%
65% of below intermediate were using mobile payment system and 35% were
not using it. In case of intermediate, 57.4% were users of mobile payment
system and 42.6% were non users. In case of graduate, 69% were using mobile
payment system and 31% were not using. Of people possessing degree of PG
and above, 73.8% were users of mobile payment system, 26.2% were non
users. According to the result, 68.3% of the sample was users of mobile
payment system, whereas 31.7% were non users.

181
Table 4.45: Chi-square test for use and education
Chi-Square Tests
Value df
Asymptotic
Significance (2-
sided)
Pearson Chi-Square 4.289a 3 .232
Likelihood Ratio 4.189 3 .242
Linear-by-Linear Association 2.956 1 .086
N of Valid Cases 400
a. 0 cells (0.0%) have expected count less than 5. The minimum expected
count is 6.35.
H04b-There is no association between the use of mobile payment system and
educational qualification of the consumer.
To be significant the Sig. value needs to be .05 or smaller. In this case the
value of .232 is larger than the alpha value of .05, so we can conclude that our
result is not significant.This means that there is no association between the use
of the mobile payment system and age of the consumer.

182
4.2.7.5 Association between Occupation and Use of Mobile Payment
Systems
Table 4.46: Cross tabulation for use and occupation
Occupation * Do you use mobile payment system Crosstabulation
Do you use
mobile payment
system
Total Yes No
Occupation Student Count 53 21 74
Expected
Count 50.5 23.5 74.0
% within
Occupation 71.6% 28.4% 100.0%
% within
Do you use
mobile
payment
system
19.4% 16.5% 18.5%
% of Total 13.3% 5.3% 18.5%
Businessman Count 63 18 81
Expected
Count 55.3 25.7 81.0
% within
Occupation 77.8% 22.2% 100.0%
% within
Do you use 23.1% 14.2% 20.3%

183
mobile
payment
system
% of Total 15.8% 4.5% 20.3%
Occupational Count 31 14 45
Expected
Count 30.7 14.3 45.0
% within
Occupation 68.9% 31.1% 100.0%
% within
Do you use
mobile
payment
system
11.4% 11.0% 11.3%
% of Total 7.8% 3.5% 11.3%
Govt
employee
Count 28 12 40
Expected
Count 27.3 12.7 40.0
% within
Occupation 70.0% 30.0% 100.0%
% within
Do you use
mobile
payment
system
10.3% 9.4% 10.0%
% of Total 7.0% 3.0% 10.0%
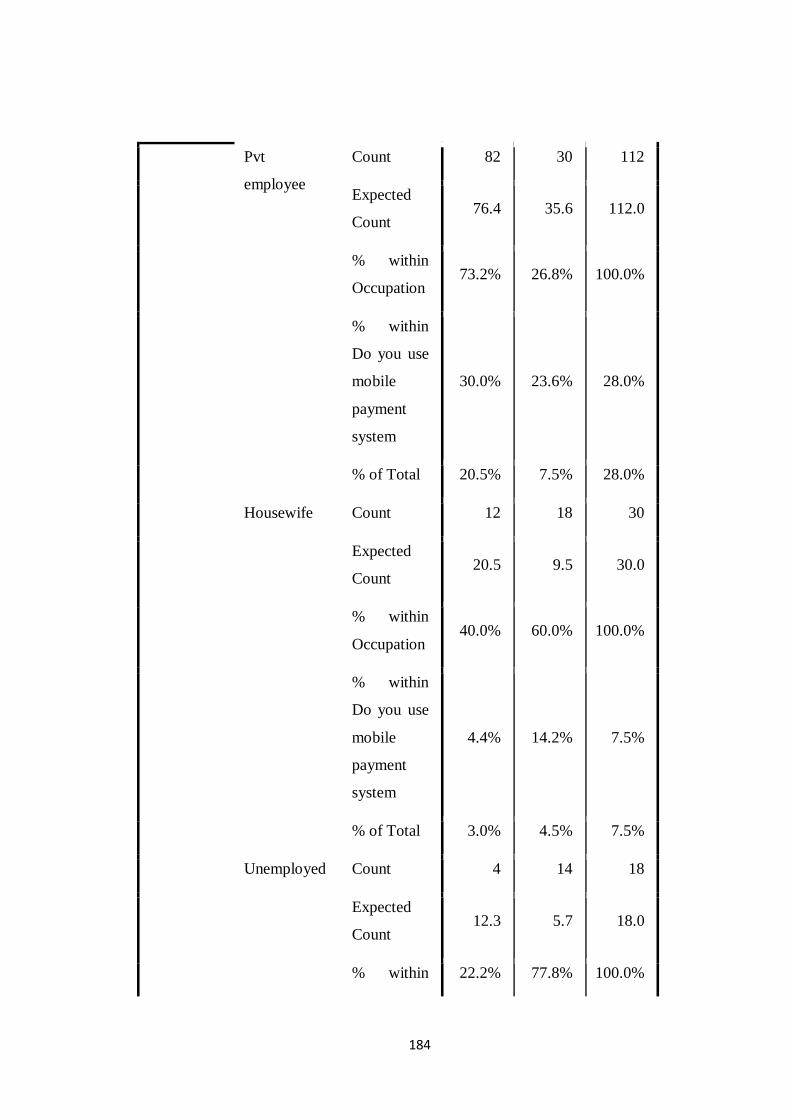
184
Pvt
employee
Count 82 30 112
Expected
Count 76.4 35.6 112.0
% within
Occupation 73.2% 26.8% 100.0%
% within
Do you use
mobile
payment
system
30.0% 23.6% 28.0%
% of Total 20.5% 7.5% 28.0%
Housewife Count 12 18 30
Expected
Count 20.5 9.5 30.0
% within
Occupation 40.0% 60.0% 100.0%
% within
Do you use
mobile
payment
system
4.4% 14.2% 7.5%
% of Total 3.0% 4.5% 7.5%
Unemployed Count 4 14 18
Expected
Count 12.3 5.7 18.0
% within 22.2% 77.8% 100.0%

185
Occupation
% within
Do you use
mobile
payment
system
1.5% 11.0% 4.5%
% of Total 1.0% 3.5% 4.5%
Total Count 273 127 400
Expected
Count 273.0 127.0 400.0
% within
Occupation 68.3% 31.8% 100.0%
% within
Do you use
mobile
payment
system
100.0% 100.0% 100.0%
% of Total 68.3% 31.8% 100.0%
71.6% of students were users of mobile payment system, 28.4% were non
users. 77.8% of businessman were using mobile payment system, 22.2% were
not using mobile payment. 68.9% of professionals were users mobile payment
system, 31.1% were non users. 70% of government employees were using
mobile payment system, 30% were non users. 73.2% of private employees
were users of mobile payment system, while 26.8% were non users. 40% of
housewives were using mobile payment system, 60% were non users. In the
case of unemployed, only 22.2% were using mobile payment system, while

186
77.8% were non users. According to the result, 68.3% of the sample was users
of mobile payment system, whereas 31.8% were non users.
Table 4.47: Chi-square test for use and occupation
Chi-Square Tests
Value df
Asymptotic
Significance (2-
sided)
Pearson Chi-Square 33.767a 6 .000
Likelihood Ratio 31.595 6 .000
Linear-by-Linear Association 12.271 1 .000
N of Valid Cases 400
a. 0 cells (0.0%) have expected count less than 5. The minimum expected
count is 5.72.
H05b-There is no association between the use of mobile payment system and
occupation of the consumer.
To be significant the Sig. value needs to be .05 or smaller. In this case the
value of .000 is smaller than the alpha value of .05, so we can conclude that
our result is significant. This means that there is association between the use of
the mobile payment system and occupation of the consumer.

187
4.2.7.6 Association between Income and Use of Mobile Payment Systems
Table 4.48: Cross tabulation for use and monthly income
Monthly Income * Do you use mobile payment system Crosstabulation
Do you use mobile
payment system
Total Yes No
Monthly
Income
Upto Rs.
10k
Count 76 65 141
Expected Count 96.2 44.8 141.0
% within
Monthly
Income
53.9% 46.1% 100.0%
% within Do
you use mobile
payment system
27.8% 51.2% 35.3%
% of Total 19.0% 16.3% 35.3%
Rs. 10k-
30k
Count 80 24 104
Expected Count 71.0 33.0 104.0
% within
Monthly
Income
76.9% 23.1% 100.0%
% within Do
you use mobile
payment system
29.3% 18.9% 26.0%
% of Total 20.0% 6.0% 26.0%

188
Rs. 30k-
50k
Count 54 15 69
Expected Count 47.1 21.9 69.0
% within
Monthly
Income
78.3% 21.7% 100.0%
% within Do
you use mobile
payment system
19.8% 11.8% 17.3%
% of Total 13.5% 3.8% 17.3%
Rs. 50k-
1lakh
Count 42 18 60
Expected Count 41.0 19.1 60.0
% within
Monthly
Income
70.0% 30.0% 100.0%
% within Do
you use mobile
payment system
15.4% 14.2% 15.0%
% of Total 10.5% 4.5% 15.0%
Above
Rs. 1lakh
Count 21 5 26
Expected Count 17.7 8.3 26.0
% within
Monthly
Income
80.8% 19.2% 100.0%
% within Do
you use mobile 7.7% 3.9% 6.5%

189
payment system
% of Total 5.3% 1.3% 6.5%
Total Count 273 127 400
Expected Count 273.0 127.0 400.0
% within
Monthly
Income
68.3% 31.8% 100.0%
% within Do
you use mobile
payment system
100.0% 100.0% 100.0%
% of Total 68.3% 31.8% 100.0%
53.9% of respondents having monthly income of upto Rs. 10,000 were using
mobile payment system, whereas 46.1% were non users. In case of income
group of Rs 10,001-30,000, 76.9% were using mobile payment system, 23.1%
were non users. For income group of Rs. 30,001-50,000, 78.3% were using
mobile payment system and 21.7% were non users. For income group of Rs.
50,001-1lakh, 70% were using mobile payment system, while 30% were non
users. For respondents earning above Rs. 1lakh, 80.8% were users and 19.2%
were non users. According to the result, 68.3% of the sample was aware about
mobile payment system, whereas 31.8% were non users.

190
Table 4.49: Chi-square test for use and monthly income
Chi-Square Tests
Value df
Asymptotic
Significance
(2-sided)
Pearson Chi-Square 22.164a 4 .000
Likelihood Ratio 21.990 4 .000
Linear-by-Linear Association 10.870 1 .001
N of Valid Cases 400
0 cells (0.0%) have expected count less than 5. The minimum expected count
is 8.26.
H06b-There is no association between the use of mobile payment system and
income of the consumer.
To be significant the Sig. value needs to be .05 or smaller. In this case the
value of .000 is smaller than the alpha value of .05, so we can conclude that
our result is significant. This means that there is association between the use of
the mobile payment system and income of the consumer.

191
4.2.7.7 Association between Personal innovativeness and Use of Mobile
Payment Systems
Table 4.50: Cross tabulation for use and personal innovativeness
Personal innovativeness * Do you use mobile payment system
Crosstabulation
Do you use
mobile payment
system
Total Yes No
When a
new
technolog
y is
introduce
d in the
market
I am
usually
among
the first
to use
Count 94 13 107
Expected
Count 73.0 34.0 107.0
% within
Personal
innovatines
s
87.9% 12.1% 100.0
%
% within
Do you use
mobile
payment
system
34.4% 10.2% 26.8%
% of Total 23.5% 3.3% 26.8%

192
I wait for
others to
use first
Count 118 45 163
Expected
Count 111.2 51.8 163.0
% within
Personal
innovatines
s
72.4% 27.6% 100.0
%
% within
Do you use
mobile
payment
system
43.2% 35.4% 40.8%
% of Total 29.5% 11.3% 40.8%
I am
among
late users
Count 57 33 90
Expected
Count 61.4 28.6 90.0
% within
Personal
innovatines
s
63.3% 36.7% 100.0
%

193
% within
Do you use
mobile
payment
system
20.9% 26.0% 22.5%
% of Total 14.3% 8.3% 22.5%
I prefer
using old
technolog
y only
Count 4 36 40
Expected
Count 27.3 12.7 40.0
% within
Personal
innovatines
s
10.0% 90.0% 100.0
%
% within
Do you use
mobile
payment
system
1.5% 28.3% 10.0%
% of Total 1.0% 9.0% 10.0%
Total Count 273 127 400
Expected
Count 273.0 127.0 400.0

194
% within
Personal
innovatines
s
68.3% 31.8% 100.0
%
% within
Do you use
mobile
payment
system
100.0
%
100.0
%
100.0
%
% of Total
68.3% 31.8% 100.0
%
87.9% of people among the first to use technology were using mobile payment
system, while only 12.1% were not using it. In case of the one who waits for
others to use first, 72.4% were using the mobile payment system, while 27.6%
were not using it. For the late users, 63.3% were users, 36.7% were non users.
Among the ones preferring old technology, 10% were using mobile payment
system, 90% were not using. According to the result, 68.3% of the sample was
using mobile payment system, whereas 31.7% were not using.
Table 4.51: Chi-square test for use and personal innovativeness
Chi-Square Tests
Value df
Asymptotic
Significance
(2-sided)
Pearson Chi-Square 83.898a 3 .000

195
Likelihood Ratio 84.443 3 .000
Linear-by-Linear Association 68.750 1 .000
N of Valid Cases 400
0 cells (0.0%) have expected count less than 5. The minimum expected
count is 12.70.
H07b-There is no association between the use of mobile payment system and
personal innovativeness of the consumer.
To be significant the Sig. value needs to be .05 or smaller. In this case the
value of .000 is smaller than the alpha value of .05, so we can conclude that
our result is significant. This means that there is association between the use of
the mobile payment system and personal innovativeness of the consumer.
4.2.7.8 Association between Awareness and Use of Mobile Payment
Systems
Table 4.52: Chi-square test for awareness and use
Chi-Square Tests
Value df
Asymptotic
Significance
(2-sided)
Exact Sig. (2-
sided)
Exact Sig. (1-
sided)
Pearson Chi-Square 82.451a 1 .000
Continuity Correctionb 79.035 1 .000
Likelihood Ratio 87.832 1 .000
Fisher's Exact Test .000 .000
Linear-by-Linear
Association 82.245 1 .000
N of Valid Cases 400
a. 0 cells (0.0%) have expected count less than 5. The minimum expected count is 11.11.
b. Computed only for a 2x2 table

196
Since the p- value .000 is less than the significance value .05, we can conclude
that there is association between the awareness about the mobile payment
system and use of mobile payments system among consumers.
4.2.8 Hypothesis testing for demographic factors affecting continued use
of the mobile payment systems
4.2.8.1 Impact of City on Continued use of Mobile Payment Systems
Independent t-test was done to find out the impact of city on continued use of
mobile payment. City was taken as the categorical independent variable and
continued use of mobile payment system as the dependent variable. For this
purpose, respondents were divided into two groups; a) Ranchi & b) Kolkata.
Table 4.53: Group Statistics of consumers’ city
Group Statistics
City N Mean
Std.
Deviation
Std. Error
Mean
I will continue using
mobile payment in
future
Ranchi 129 4.047 .8087 .0712
Kolkata 144 3.840 .6862 .0572

197
Table 4.54: T-test analysis for consumer respondents’ city
Levene’s Test
for Equality of
Variances t-test for Equality of Means
F Sig. t df
Sig. (2-
tailed)
I will
continue
using mobile
payment in
future
Equal
variances
assumed
2.285 .132 2.279 271 .023
Equal
variances
not
assumed
2.258
252.371 .025
H01c-There is no significant difference in the continued use of mobile
payment system and city of the consumer.
There was significant difference in scores for Ranchi (M=4.05, SD=.809) and
Kolkata (M=3.84, SD=.686); t (271)= 2.28, p=.023. Since p = 0.023 is less
than α = 0.05, the null hypothesis is rejected. That means there is significant
difference in the continued use of mobile payment system and city of the
consumer.
4.2.8.2 Impact of Gender on Continued use of Mobile Payment Systems
Independent t-test was done to find out the impact of gender on continued use
of mobile payment. Gender was taken as the categorical independent variable
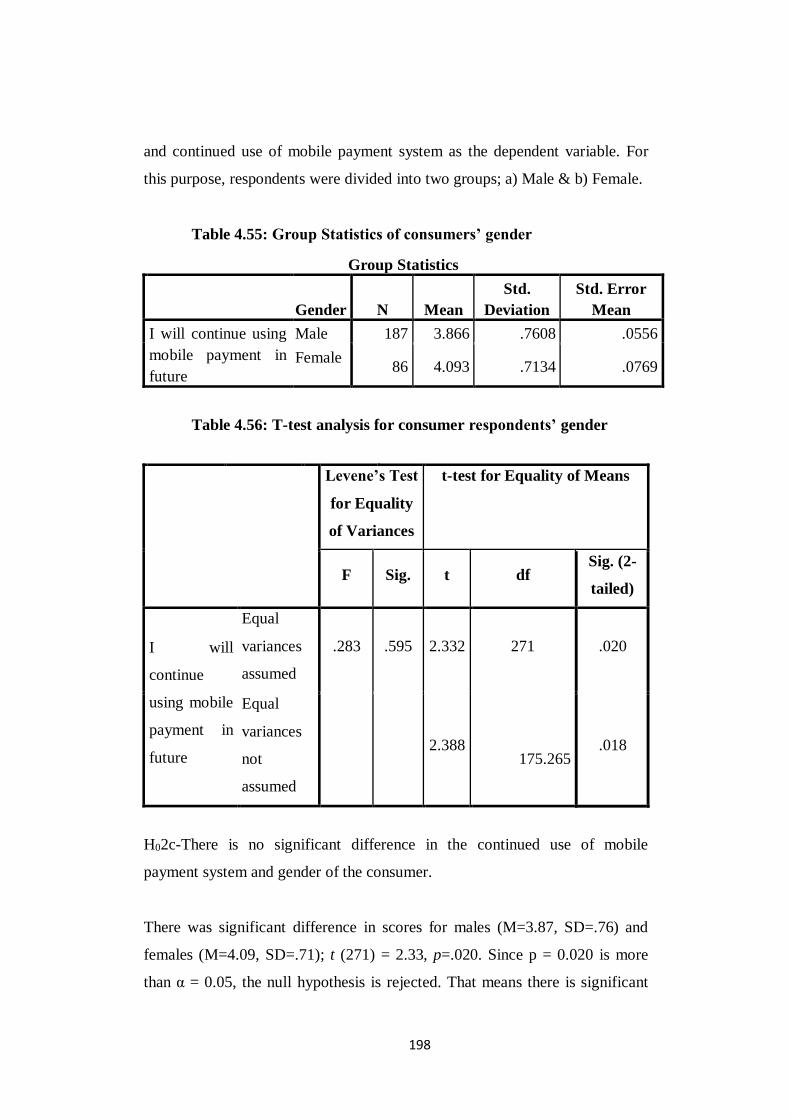
198
and continued use of mobile payment system as the dependent variable. For
this purpose, respondents were divided into two groups; a) Male & b) Female.
Table 4.55: Group Statistics of consumers’ gender
Group Statistics
Gender N Mean
Std.
Deviation
Std. Error
Mean
I will continue using
mobile payment in
future
Male 187 3.866 .7608 .0556
Female 86 4.093 .7134 .0769
Table 4.56: T-test analysis for consumer respondents’ gender
Levene’s Test
for Equality
of Variances
t-test for Equality of Means
F Sig. t df Sig. (2-
tailed)
I will
continue
using mobile
payment in
future
Equal
variances
assumed
.283 .595 2.332 271 .020
Equal
variances
not
assumed
2.388
175.265 .018
H02c-There is no significant difference in the continued use of mobile
payment system and gender of the consumer.
There was significant difference in scores for males (M=3.87, SD=.76) and
females (M=4.09, SD=.71); t (271) = 2.33, p=.020. Since p = 0.020 is more
than α = 0.05, the null hypothesis is rejected. That means there is significant

199
difference in the continued use of mobile payment system and gender of the
consumer.
4.2.8.3 Impact of Age on Continued use of Mobile Payment Systems
One way ANOVA test was done to explore the impact of age group on use of
mobile payment. Age of the respondents was taken as the categorical
independent variable. Subjects were divided into four groups; a) 15 to 25yrs,
b) 26 to 40yrs, c) 41 to 60yrs and d) 61 and above yrs, and use of mobile
payment was taken the continuous dependent variable.
Table 4.57: Group Statistics of consumers’ age
Group Statistics
N Mean Std. Deviation Std. Error
15 to 25 yrs 90 4.033 .7854 .0828
26 to 40 yrs 143 3.916 .7552 .0632
41 to 60 yrs 36 3.806 .6684 .1114
Above 61 yrs 4 3.750 .5000 .2500
Total 273 3.938 .7523 .0455
Table 4.58: Test of Homogeneity of Variances
Levene
Statistic df1 df2 Sig.
.099 3 269 .961
Since the significance value is .961, which is greater than .05, there is no
violation of homogeneity test of variance assumption.

200
Table 4.59: One way ANOVA analysis for consumer respondents’ age
ANOVA
Sum of
Squares df
Mean
Square F Sig.
Between Groups 1.659 3 .553 .977 .404
Within Groups 152.282 269 .566
Total 153.941 272
H03c-There is no significant difference in the continued use of mobile
payment system and age of the consumer.
There was no statistically significant difference at the p<.05 level in the scores
for all 4 age groups [F(3, 269=.98, p=.40]. Since p = 0.404 is more than α =
0.05, the null hypothesis is accepted. That means use of mobile payment is not
significantly influenced by age group.
4.2.8.4 Impact of Educational qualification on Continued use of Mobile
Payment Systems
One way ANOVA test was done to explore the impact of educational
qualification on use of mobile payment. Educational qualification of the
respondents was taken as the categorical independent variable, which was
divided into four groups; a) below inter, b) intermediate, c) graduate and d)
post graduate or higher. Use of mobile payment was taken as the continuous
dependent variable.

201
Table 4.60: Descriptives of consumers’ educational qualification
Descriptives
N Mean Std.
Deviation Std. Error
Below intermediate 13 4.000 .7071 .1961
Intermediate 31 3.774 .8450 .1518
Graduate 167 3.970 .7479 .0579
PG and above 62 3.919 .7310 .0928
Total 273 3.938 .7523 .0455
Table 4.61: Test of Homogeneity of Variances
Levene
Statistic df1 df2 Sig.
.324 3 269 .808
Since the significance value is .808, which is greater than .05, there is no
violation of homogeneity test of variance assumption.
Table 4.62: One way ANOVA analysis for consumer respondents’
educational qualification
ANOVA
Sum of
Squares df
Mean
Square F Sig.
Between Groups 1.075 3 .358 .631 .596
Within Groups 152.866 269 .568

202
Total 153.941 272
H04c-There is no significant difference in the continued use of mobile
payment system and educational qualification of the consumer.
There was no statistically significant difference at the p<.05 level in the scores
for the qualification groups [F(3, 269)=0.63, p=.6]. Since p = 0.596 is more
than α = 0.05, the null hypothesis is accepted. That means, use of mobile
payment is not influenced by educational qualification of the respondents.
4.2.8.5 Impact of Occupation on Continued use of Mobile Payment
Systems
One way ANOVA test was done to explore the impact of occupation on use of
mobile payment. Occupation was taken as the categorical independent
variable, for which the respondents were divided into seven groups a) student,
b) businessman, c) occupational, d) Government employee, e) Private
employee, f) Housewife and g) Unemployed. Use of mobile payment was
taken the continuous dependent variable.
Table 4.63: Group Statistics of consumers’ occupation
N Mean Std. Deviation Std. Error
Student 53 3.981 .7719 .1060
Businessman 63 3.937 .7378 .0929
Occupational 31 3.903 .7002 .1258
Govt employee 28 4.036 .7445 .1407
Pvt employee 82 3.841 .7930 .0876
Housewife 12 4.333 .4924 .1421
Unemployed 4 3.750 .9574 .4787
Total 273 3.938 .7523 .0455

203
Table 64: Test of Homogeneity of Variances
Levene
Statistic df1 df2 Sig.
.403 6 266 .876
Since the significance value is .876, which is greater than .05, there is no
violation of homogeneity test of variance assumption.
Table 4.65: One way ANOVA analysis for consumer respondents’
occupation
ANOVA
Sum of
Squares df
Mean
Square F Sig.
Between Groups 3.185 6 .531 .936 .469
Within Groups 150.757 266 .567
Total 153.941 272
H05c-There is no significant difference in the continued use of mobile
payment system and occupation of the consumer.
There was no statistically significant difference at the p<.05 level in the scores
for all occupation groups [F(6, 266)=.94, p=.47]. Since p = 0.469 is more than
α = 0.05, the null hypothesis is accepted. That means, use of mobile payment
is not influenced by the respondents’occupation.
4.2.8.6 Impact of Income on Continued use of Mobile Payment Systems
One way ANOVA test was done to explore the impact of income on use of
mobile payment system. Income was taken as the categorical independent
variable, for this respondents were divided into five groups; a) below Rs.
10000, b) Rs.10,001 -30,000 , c) Rs. 30,001- 50,000, d) Rs. 50,001-

204
1,00,000 and e) above Rs. 1,00,00. Use of mobile payment systems was taken
as the continuous dependent variable.
Table 4.66: Group Statistics of consumers’ income
Descriptives
N Mean Std.
Deviation Std. Error
Upto Rs. 10k 76 3.987 .7745 .0888
Rs. 10k-30k 80 4.000 .7116 .0796
Rs. 30k-50k 54 4.019 .7646 .1040
Rs. 50k-1lakh 42 3.738 .7345 .1133
Above Rs. 1lakh 21 3.714 .7838 .1710
Total 273 3.938 .7523 .0455
Table 4.67: Test of Homogeneity of Variances
Levene Statistic df1 df2 Sig.
.784 4 268 .537
Since the significance value is .537, which is greater than .05, there is no
violation of homogeneity test of variance assumption.
Table 4.68: One way ANOVA analysis for consumer respondents’ income
ANOVA
Sum of
Squares df
Mean
Square F Sig.
Between
Groups 3.568 4 .892 1.590 .177
Within Groups 150.373 268
.561

205
Total 153.941 272
H06c-There is no significant difference in the continued use of mobile
payment system and income of the consumer.
There was no statistically significant difference at the p<.05 level in the scores
for all income groups [F(4, 268)=1.6, p=.18. Since p = 0.177 is more than α =
0.05, the null hypothesis is accepted. That means, use of mobile payment is
not influenced by the income of the respondents.
4.2.8.7 Impact of Personal innovativeness on Continued use of Mobile
Payment Systems
One way ANOVA test was done to explore the impact of personal
innovativeness on use of mobile payment. Personal innovativeness was taken
as the categorical independent variable, for this respondents were divided into
four groups; a) first to use, b) wait for others to use, c) among late users and d)
prefer to use older technology. Use of mobile payment was taken the
continuous dependent variable.
Table 4.69: Group Statistics of consumers’ personal innovativeness
N Mean
Std.
Deviat
ion
Std.
Error
95% Confidence
Interval for Mean
Lower
Bound
Upper
Bound
First to u
se 94 3.894 .7961 .0821 3.731 4.057

206
Wait for
others to
use
118 3.915 .7230 .0666 3.783 4.047
Among
late users 57 4.070 .7526 .0997 3.870 4.270
Prefer
older
technolog
y
4 3.750 .5000 .2500 2.954 4.546
Total 273 3.938 .7523 .0455 3.848 4.027
Table 4.70: Test of Homogeneity of Variances
Levene Statistic df1 df2 Sig.
.226 3 269 .878
Since the significance value is .878, which is greater than .05, there is no
violation of homogeneity test of variance assumption.
Table 4.71: One way ANOVA analysis for consumer respondents’
personal innovation
Sum of
Squares df
Mean
Square F Sig.
Between
Groups 1.383 3 .461 .813 .488
Within Groups 152.558 269 .567
Total 153.941 272

207
H07c-There is no significant difference in the continued use of mobile
payment system and personal innovativeness of the consumer.
There was no statistically significant difference at the p<.05 level in the scores
for TAP groups [F(3,269)=.81, p=.49]. Since p = 0.488 is more than α = 0.05,
the null hypothesis is rejected. That means, use of mobile payment is
influenced by the technology inclination of the respondents.
4.2.9 Hypothesis testing for finding the impact of the other factors on the
continued use of the mobile payment systems through regression
Usefulness
H08- Usefulness will not significantly influence the continued use of mobile
payment system by the consumer
Ease of Use
H09- Ease of Use will not significantly influence the continued use of mobile
payment system by the consumer
Social Influence
H010- Social Influence will not significantly influence the continued use of
mobile payment system by the consumer
Application Provider
H011- Application Provide will not significantly influence the continued use of
mobile payment system by the consumer
Government Initiatives
H012- Government Initiatives will not significantly influence the continued
use of mobile payment system by the consumer

208
Table 4.72: Correlation of all independent and dependent variables
Correlations
I will
continue
using
mobile
payment
in future SI GOVT U EOU APP
Pearson
Correlation
I will continue
using mobile
payment in
future
1.000 .598 .574 .637 .621 .594
SI .598 1.000 .565 .492 .563 .567
GOVT .574 .565 1.000 .487 .509 .603
U .637 .492 .487 1.000 .726 .521
EOU .621 .563 .509 .726 1.000 .530
APP .594 .567 .603 .521 .530 1.000
Sig. (1-
tailed)
I will continue
using mobile
payment in
future
. .000 .000 .000 .000 .000
SI .000 . .000 .000 .000 .000
GOVT .000 .000 . .000 .000 .000
U .000 .000 .000 . .000 .000
EOU .000 .000 .000 .000 . .000
APP .000 .000 .000 .000 .000 .
N I will continue
using mobile
payment in
future
273 273 273 273 273 273
SI 273 273 273 273 273 273
GOVT 273 273 273 273 273 273
U 273 273 273 273 273 273
EOU 273 273 273 273 273 273
APP 273 273 273 273 273 273

209
Table 4.73: Model summary
Model Summaryb
Model R R Square
Adjusted R
Square
Std. Error of the
Estimate
1 .756a .571 .563 .4974
a. Predictors: (Constant), APP, U, SI, GOVT, EOU
b. Dependent Variable: I will continue using mobile payment in future
Model summary shows R-value as 0.756, which means there is good correlation
between dependent and independent variable. R-square=0.571, which means that
57.1% of the variance in the continued use of mobile payment can be explained by
all the independent variables. That means, continued use of mobile payment is
strongly predicted by all the independent variables.
Table 4.74: ANOVA test
ANOVAa
Model Sum of Squares df Mean Square F Sig.
1 Regression 87.886 5 17.577 71.048 .000b
Residual 66.056 267 .247
Total 153.941 272
a. Dependent Variable: I will continue using mobile payment in future
b. Predictors: (Constant), APP, U, SI, GOVT, EOU
ANOVA table shows the p-value as 0.00, therefore the result is significant as
the p-value is less than significant value 0.05. Also F-ratio value is 71, which
is considered as good.

210
Table 4.75: Coefficients
Coefficientsa
Unstandardized
Coefficients
Standardized
Coefficients
Model B Std. Error Beta t Sig.
(Constant) .480 .196 2.451 .015
SI .166 .045 .201 3.691 .000
GOVT .134 .048 .153 2.815 .005
PU .294 .065 .272 4.513 .000
PEOU .143 .064 .141 2.235 .026
APP .173 .056 .171 3.082 .002
a. Dependent Variable: I will continue using mobile payment in future
All the null hypothesis is rejected as the significance value is less than 0.05 for
all independent variable. This shows that all the independent variables
(usefulness, ease of use, social influence, application provider and government
initiatives) have a significant positive relationship with the continued use of
mobile payment.
4.3 Merchant Analysis
4.3.1 Demographic profile of the respondents
Table 4.76: Demographic profile of merchants
Characteristi
cs Profile
Ranchi Kolkata Total
frequen
cy
Frequen
cy
Perce
nt
Frequen
cy
Perce
nt
Gender
Male 86 86 83 83 169
Female 14 14 17 17 31
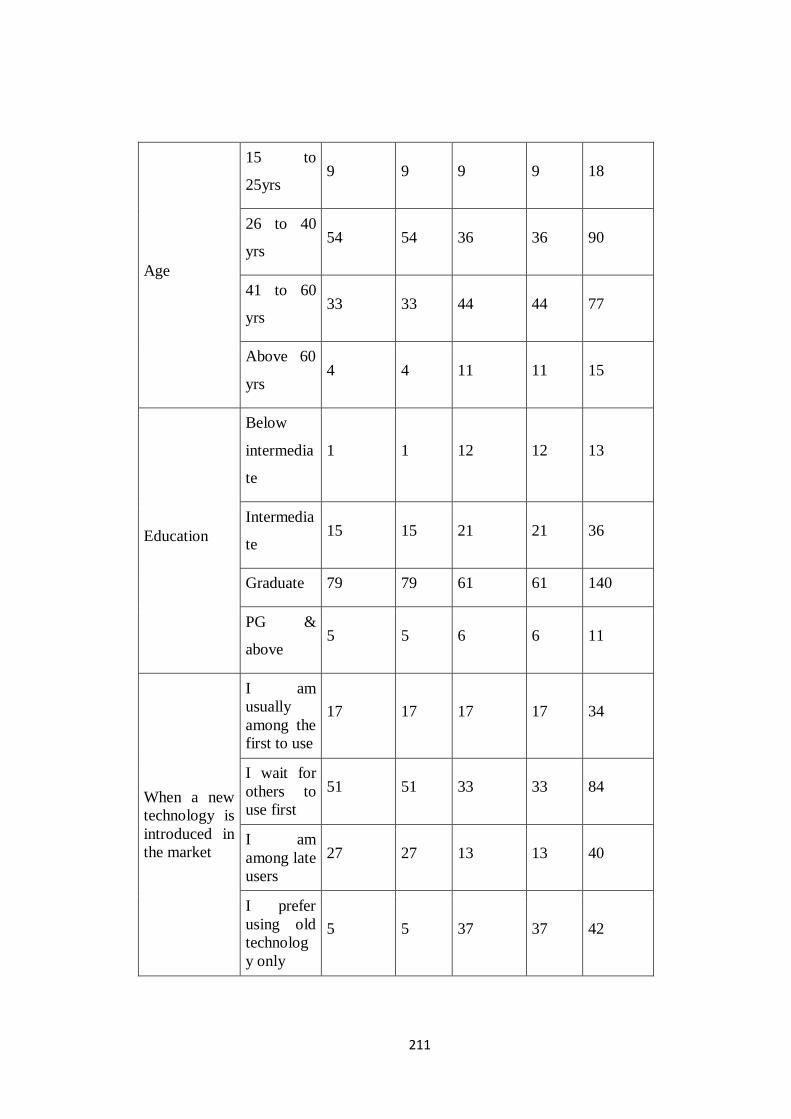
211
Age
15 to
25yrs 9 9 9 9 18
26 to 40
yrs 54 54 36 36 90
41 to 60
yrs 33 33 44 44 77
Above 60
yrs 4 4 11 11 15
Education
Below
intermedia
te
1 1 12 12 13
Intermedia
te 15 15 21 21 36
Graduate 79 79 61 61 140
PG &
above 5 5 6 6 11
When a new
technology is
introduced in
the market
I am
usually
among the
first to use
17 17 17 17 34
I wait for
others to
use first
51 51 33 33 84
I am
among late
users
27 27 13 13 40
I prefer
using old
technolog
y only
5 5 37 37 42

212
Do you keep
your business
updated with
latest
technology
Yes 62 62 19 19 81
No 38 38 81 81 119
The above table depicts that in Ranchi, 86% of respondents are male and 14%
are female respondents. In case of the age of the respondents, the table shows
that 54% in the age group of 26 to 40 yrs, 33% in the age group 41 to 60 yrs,
9% of respondents are in the age groups of 15 to 25 yrs, and only 4% are in
the age group of above 60. Regarding the education of the respondents, 79%
had completed graduation 15% of the respondents had done intermediate, 5%
have PG & above degrees, and only 1% are below intermediate. Personal
innovativeness profile suggest, 51% are the ones wait for others to use first,
27% are late users, 17% of respondents are usually among the first ones to use,
and only 5% preferred using old technology only.
In Kolkata, 83% of respondents are male and 17% are female respondents. In
case of the age of the respondents, the table shows that 44% in the age group
41 to 60 yrs, 36% in the age group of 26 to 40 yrs, 11% are in the age group of
above 60, and only 9% of respondents are in the age groups of 15 to 25 yrs.
With respect to the education of the respondents, 61% had completed
graduation, 21% of the respondents had done intermediate, 12% are below
intermediate, and 6% have PG & above degrees. Regarding Personal
innovativeness, 37% preferred using old technology, 33% are the ones wait for
others to use first, 17% of respondents are usually among the first ones to use,
and 13% are late users.

213
4.3.1.1 Business Profile of the merchants
Table 4.77: Business profile of merchants
Ranchi Kolkata
Profile user
user
%
non
user
non
user
%
user user
%
non-
user
non-
user
%
Total
Count
electro
nics 1 11% 8 89% 2 33% 4 67% 15
food
stalls 13 72% 5 28% 21 78% 6 22% 45
footwa
re 5 56% 4 44% 2 67% 1 33% 12
garmen
ts 6 60% 4 40% 10 83% 2 17% 22
general 8 67% 4 33% 5 63% 3 37% 20
gift 2 100
% 0 0% 5 83% 1 17% 8
medica
l 8 67% 4 33% 8 80% 2 20% 22
misc 6 38% 10 62% 5 63% 3 37% 24
mobile 6 100
% 0 0% 9 90% 1 10% 16
service 1 33% 2 67% 4 67% 2 33% 9
station 2 67% 1 33% 3 75% 1 25% 7

214
Small scale retailers from almost all business segments were considered for
the study from both the cities. The idea was to get insights of the whole
market. So, retailers from food, footware, garment, gift, medical, mobile and
others were included in the study. The distribution of merchants has been
shown above.
4.3.2 Comparison of level of awareness, adoption and usage of mobile
payment systems among merchants of Ranchi and Kolkata city
4.3.2.1 Awareness about mobile payment system among merchants
Table 4.78: Awareness about mobile payment among merchants
Awareness about
mobile payment
Ranchi Kolkata
Frequency Percentage Frequency Percentage
Yes 95 95% 99 99%
No 5 5% 1 1%
Grand total 100 100% 100 100%
ary
Total 58 42 74 26 200

215
Figure 4.19: Awareness about mobile payment among merchants
In Ranchi city, it was seen that 95% of the sample population was aware about
mobile payment system and 5% were unaware, whereas 99% were aware in
Kolkata city and only 1% were unaware.
Table 4.79: Installation of mobile payment applications among merchants
Installation of mobile
payment application
Ranchi Kolkata
Frequency Percentage Frequency Percentage
Yes 68 68% 80 80%
No 32 32% 20 20%
Grand total 100 100% 100 100%

216
Figure 4.20: Installation of mobile payment applications
In Ranchi city, 68% of the merchants have installed mobile payment
applications in their phone and 32% did not install. In the case of Kolkata city,
it was seen that 80% of the merchants have installed mobile payment
applications and 20% did not.
4.3.2.2 Use of mobile payment by the merchants
Table 4.80: Use of mobile payment by merchants
Use of mobile
payment
Ranchi Kolkata
Frequecy Percentage Frequency Percentage
Yes 58 58% 74 74%
No 31 31% 13 13%
Abandoned 11 11% 13 13%
Grand total 100 100% 100 100%
68
80
32
20
0
10
20
30
40
50
60
70
80
90
Ranchi Kolkata
Yes NoInstallation of mobile payment application

217
Figure 4.21: Usage of mobile payment by merchants
Out of the sample population in Ranchi, 58% were users, 31% were non users
and 11% abandoned after using mobile payment system. Out of the sample
population in Kolkata, 74% were users, 13% were non users and 13%
abandoned after using mobile payment system.
Out of total 200 merchants, 132 were users consisting of 74 users from
Kolkata & 58 from Ranchi while 68 were non-users comprising of 42 from
Ranchi & 26 from Kolkata.

218
4.3.3 Non User Merchant Analysis
Analysis was done for total of 68 non users and the analysis is shown below.
4.3.3.1 Awareness and installation among non user
Table 4.81: Awareness and installation among non user City Ranchi Kolkata
Yes No Yes No
Frequ
ency
Percen
tage
Frequ
ency
Percen
tage
Frequ
ency
Percen
tage
Frequ
ency
Percen
tage
Aware
ness 27 87 4 13 12 92 1 8
Install
ation 1 3 30 97 0 0 13 100
Figure 4.22: Awareness and installation among non user
Yes87%
No13%
Non user awareness (Ranchi)
Yes92%
No8%
Non user awareness (Kolkata)
Yes3%
No97%
Non user installation (Ranchi) Non user installation (Kolkata)
Yes
No
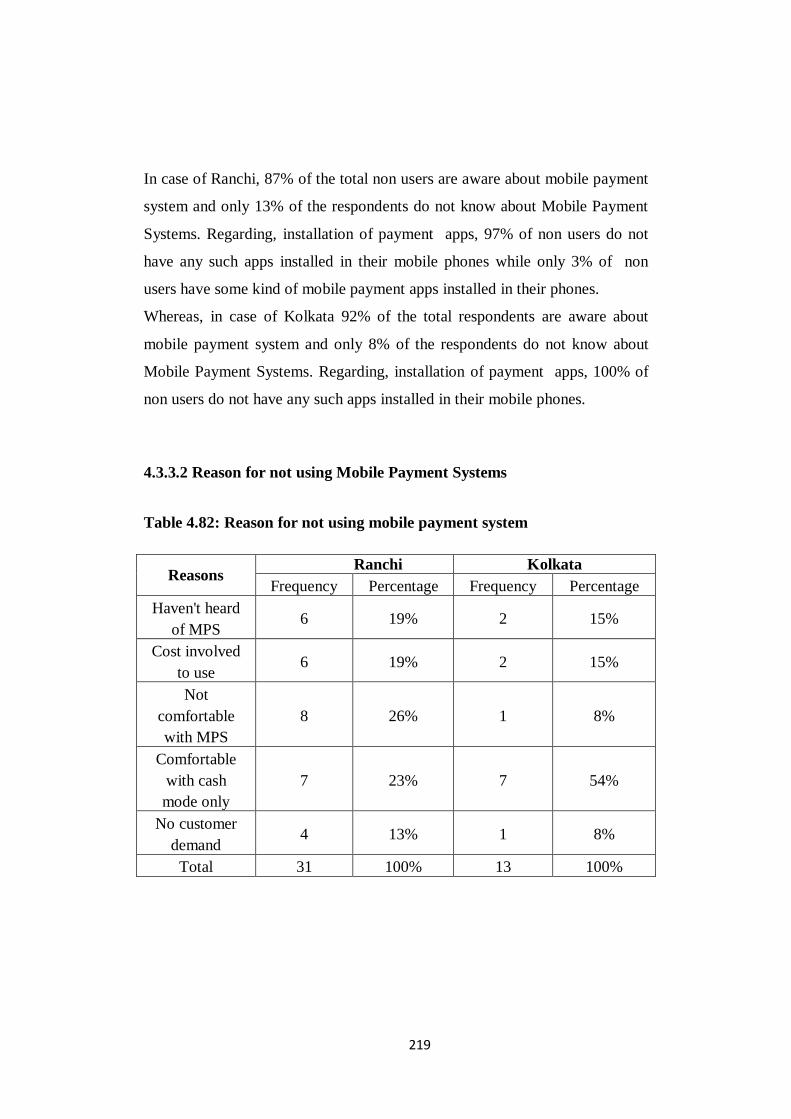
219
In case of Ranchi, 87% of the total non users are aware about mobile payment
system and only 13% of the respondents do not know about Mobile Payment
Systems. Regarding, installation of payment apps, 97% of non users do not
have any such apps installed in their mobile phones while only 3% of non
users have some kind of mobile payment apps installed in their phones.
Whereas, in case of Kolkata 92% of the total respondents are aware about
mobile payment system and only 8% of the respondents do not know about
Mobile Payment Systems. Regarding, installation of payment apps, 100% of
non users do not have any such apps installed in their mobile phones.
4.3.3.2 Reason for not using Mobile Payment Systems
Table 4.82: Reason for not using mobile payment system
Reasons Ranchi Kolkata
Frequency Percentage Frequency Percentage
Haven't heard
of MPS 6 19% 2 15%
Cost involved
to use 6 19% 2 15%
Not
comfortable
with MPS
8 26% 1 8%
Comfortable
with cash
mode only
7 23% 7 54%
No customer
demand 4 13% 1 8%
Total 31 100% 13 100%

220
Figure 4.23: Reason for not using mobile payment by merchants
Merchant who do not accept mobile payment systems were asked about reason
behind it. Being comfortable with cash is most prominent reason for not using
mobile payment in Kolkata with 54% of the non users felt the same as
compared to 23% in Ranchi. In Ranchi uncomfortable process of mobile
payment was faced by 26% of the non users, whereas in Kolkata only 8% felt
the same. No consumer demand, haven’t heard and cost involved where other
issues due to which merchants were not using mobile payment.
4.3.3.3 Consumer’s demand when Mobile Payments Systems is not
accepted by the Merchant
Table 4.83: Consumer demand when Mobile Payments Systems is not
accepted
Customer
demand when
not accepting
Ranchi Kolkata
Frequency Percentage Frequency Percentage
1-5% 13 42 11 85

221
6-10% 18 58 3 15
Total 31 100 13 100
Figure 4.24: Consumer’s demand when mobile payment not accepted
In case of Ranchi, 58% of the total non user merchants said that about 6-10%
customer demand for mobile payments when they don’t accept such payments,
and 42% said that 1-5% customer demand for it.
Whereas, in case of Kolkata 85% of the total non user merchants said that
about 1-5 % customer demand for mobile payments when they don’t accept
such payments, while 15% said that 6-10% customer demand for it.
4.3.3.4 Reason for abandoning Mobile Payment Systems
Table 4.84: Reason for abandoning mobile payment
City Ranchi Kolkata
Reasons Frequency Percentage Frequency Percentage
Extra charges 2 18 2 15
Problems faced
in using 4 36 1 8
Customer not
using 5 46 10 77
Total 11 100 13 100
1-5%42%
6-10%58%
Customer demand when not accepting mobile
payment (Ranchi)
1-5%85%
6-10%15%
Customer demand when not accepting mobile payment
(Kolkata)

222
Figure 4.25: Reason for abandoning mobile payment
The merchants who used mobile payment systems before hand and then
abandoned later were asked about reason behind it. Consumer not paying
through mobile payments is the most important reason due to which merchants
have abandoned the mobile payment system in both cities i.e. 46% in Ranchi
and 77% in Kolkata city. More merchants in Ranchi faced problem in using
mobile payment systems than that in Kolkata as 36% of the Ranchi merchants
faced this issue whereas 8% of the Kolkata merchant felt the same. Extra
charges had similar impact in both cities.
4.3.4 User Merchant Analysis
Analysis was done for total of 132 users and the analysis is shown below.
4.3.4.1 Preference in payment option accepted by merchants
To know about the preference of Mobile Payment System as payment options
among the merchants question was asked where respondents were asked to
rank their preference from 1 as most preferred to 4 as least preferred. Based on
the merchants’ responses, observation about both the cities is given below.

223
Table 4.85: Payment preference by merchants
Payment option
Ranchi Kolkata
Mean
Rank Rank
Mean
Rank Rank
Cash 1.14 1 1.22 1
Debit/ Credit card 2.45 2 2.18 2
Net banking 3.83 4 3.23 4
Mobile payment 2.59 3 3.32 3
In case of Ranchi merchants, cash is given the first preference for accepting
payments followed by debit/ credit cards, mobile payments is preferred after
cards and net banking is the least preferred method.
In case of Kolkata merchants, also cash is given the first preference for
accepting payments followed by debit/ credit cards, mobile payments is the
third preferred option and net banking is least preferred.
4.3.4.2 Mobile payment application installed by merchants
Table below exhibits the mobile payment apps installed by merchant to accept
payments for their business transactions.

224
Table 4.86: Payment application installed by merchants
Which mobile
payment apps have
you installed
Ranchi Kolkata
Frequency Percentage Frequency Percentage
PayTm 56 97% 72 97%
Airtel Money 7 12% 0 0%
BHIM 4 7% 8 11%
MobiKwik 1 2% 32 43%
NFC 0 0% 24 32%
Bank Specific 0 0% 0 0%
PhonePe 2 3% 0 0%
FreeCharge 2 3% 9 12%
Tez 1 2% 0 0%
Figure 4.26: Payment application installed by merchants
To know about most accepted Mobile Payment System among Merchants,
question was asked about the various Mobile Payments option provided by
them to the consumers. PayTm is the most installed and accepted mode among
numerous mobile payments options available in both the cities with 97% of
the merchants installing it. In Ranchi, apart from PayTm, Airtel Money,
BHIM, Mobikwik, Phone Pe, Freecharge and Google Pay are also provided by

225
few merchants. Whereas in Kolkata few merchants provide options of BHIM,
Mobikwik, NFC, Phone Pe, and Freecharge.
4.3.4.3 Purposes for which mobile payment system is used by merchants
Table below exhibits the purposes for which mobile payment systems is used
by the merchants.
Table 4.87: Purpose of use of mobile payment by merchants
For what purpose do
you use mobile
payment
Ranchi Kolkata
Frequency Percentage Frequency Percentage
Sales transaction 58 100% 74 100%
Payment to vendors 4 7% 3 4%
Purchasing of services 0 0% 0 0%
Purchasing of stock 0 0% 1 1%
Payment of utilities 0 0% 8 11%
Paying insurance
premium 0 0% 1 1%
Figure 4.27: Purpose of use of mobile payment by merchants

226
Based on the Question about for what purposes was mobile payment used
among by merchants in their business it was revealed that in Ranchi mobile
payments were mostly used for sales transactions as 100% respondents uses it
for sales transaction. Very few for about 7 % of respondents used it for
payments to vendors. None uses it for purchasing of services, purchasing of
stocks, payments of utilities and paying insurance premium.
In Kolkata also 100% of respondents use mobile payments for sales
transaction followed by payments of utilities of business by 11 % respondents.
Payments to vendor is done by only 4 % respondents of Kolkata while only 1
% respondents uses Mobile Payments for purchasing stock and paying
insurance premium. None of the merchants uses mobile payment systems for
purchasing of services.
4.3.4.4 Feeling of risk while using mobile payment systems
Table 4.88: Risk feeling in use of mobile payment by merchants
Do you feel risk
while using mobile
payment
Ranchi Kolkata
Frequency Percentage Frequency Percentage
Yes 16 28% 10 14%
No 42 72% 64 86%
Grand total 58 100% 74 100%

227
Figure 4.28: Risk feeling in use of mobile payment by merchants
When asked about the feeling of risk in using mobile payment system about
28% of the Ranchi merchants feel risk in using mobile payment systems and
rest 72 percent feel no risk. Only 14% of merchants in Kolkata feel risk in
using mobile payment systems whereas majority of respondents, for about
86% feel safe in using mobile payment systems.
4.3.4.5 Encouragement by merchants for using mobile payment systems
Table 4.89: Encouragement to customers for use of mobile payment
Do you encourage
consumer to pay
through mobile
payment
Ranchi Kolkata
Frequency Percentage Frequency Percentage
Yes 22 38% 3 4%
No 36 62% 71 96%
Grand total 58 100% 74 100%

228
Figure 4.29: Encouragement for use of mobile payment by merchants
To know about Merchant role in motivating consumers to use mobile payment
systems question was asked about if they encourages payments through
mobile payment systems. 38% of Ranchi merchants encourage consumers to
pay through mobile payment systems whereas rest 62% does not encourage
consumers from their side. In case of Kolkata only 4% merchants encourage
through mobile payment systems whereas most of the merchants for about 96
% of them do not encourage such payments on their own.
4.3.4.6 Mobile payment scenario in both the cities
Figure 4.30: Mobile payment scenario in Ranchi and Kolkata

229
78% of the Ranchi merchants have the feeling of less awareness about mobile
payment in the city, whereas only 59% of the Kolkata merchants agree to it.
The feeling of mobile payment being not accepted everywhere in the city is
among 94% of the Ranchi merchants and only 55% of the Kolkata merchants
feel so. Majority of the respondents in both the cities felt that mobile payment
is a new trend in their city, with 63% merchants in Ranchi and 58% in Kolkata
agreeing to this. About 87% of Ranchi merchants think that mobile payment is
a distant dream in in their city, while only 47% of Kolkata merchants felt so.
4.3.5 Problems faced by merchants while operating mobile payment
systems
Table 4.90: Problems in use of mobile payment by merchants
Problems while
using mobile
payment
Ranchi Kolkata
Frequency Percentage Frequency Percentage
Cash & card still
preferred 43 74% 71 96%
Poor promotion by
app provider 16 28% 5 7%
Low consumer
interest 38 66% 33 45%
Network availability 10 17% 22 30%
Security 14 24% 0 0%
Low digital literacy 29 50% 18 24%

230
Figure 4.31: Problems faced in use of use of mobile payment by
merchants
Preference of cash and card is major obstacle faced by the merchant of both
the cities as 74% of the Ranchi merchants and 96% of the Kolkata merchants
faced this issue. Low consumer interest (66% for Ranchi and 50% in Kolkata)
and low digital literacy (50% in Ranchi and 24% in Kolkata) are next major
obstacles faced by merchants.
4.3.6 Results of Factor analysis
As we are analyzing only the users of mobile payment, further analysis is done
on 132 respondents, who are users and not total 200.

231
4.3.6.1 KMO Bartlett’s test results
Table 4.91: KMO Bartlett’s test of merchants
KMO and Bartlett’s Test
Kaiser-Meyer-Olkin Measure of Sampling Adequacy .906
Bartlett’s Test of Sphericity Approx. Chi-Square 1985.193
Df 231
Sig. .000
In the case of merchants, KMO value is 0.906 (which is above 0.6), we have
p-value 0.000 (which is ≤0.5), and therefore factor analysis is appropriate.
4.3.6.2 Exploratory Factor Analysis
Table 4.92: Total variance test of merchants
Total Variance Explained
Com
pone
nt
Initial Eigenvalues
Extraction Sums of
Squared Loadings
Rotation Sums of
Squared Loadings
Total
% of
Varia
nce
Cumul
ative %
Tot
al
% of
Vari
ance
Cumul
ative %
To
tal
% of
Varia
nce
Cumul
ative %
1 9.964
45.29
1 45.291
9.96
4
45.2
91 45.291
6.9
14
31.42
5 31.425
2 2.386
10.84
6 56.137
2.38
6
10.8
46 56.137
2.8
74
13.06
2 44.487
3 1.359 6.179 62.316
1.35
9
6.17
9 62.316
2.8
69
13.04
0 57.527
4 1.099 4.995 67.311
1.09
9
4.99
5 67.311
2.1
52 9.783 67.311
5 .877 3.987 71.298
6 .774 3.520 74.818

232
7 .721 3.277 78.095
8 .633 2.879 80.974
9 .583 2.649 83.623
10 .473 2.149 85.772
11 .461 2.095 87.867
12 .410 1.866 89.733
13 .355 1.615 91.347
14 .320 1.455 92.802
15 .291 1.324 94.126
16 .252 1.145 95.270
17 .237 1.078 96.348
18 .223 1.014 97.362
19 .201 .915 98.277
20 .165 .750 99.026
21 .116 .527 99.553
22 .098 .447 100.000
Extraction Method: Principal Component Analysis.
Percentage of variance as shown above, shows total variance attributed to each
factor. Principal components analysis revealed the presence of four
components with eigenvalues exceeding 1, explaining 31.43 per cent, 13.06
per cent, 13.04 per cent and 9.78 per cent of the variance respectively.

233
Table 4.93: Rotated component matrix of merchants
Rotated Component Matrixa
Component
1 2 3 4
To keep out of change issue (v1) .729 .060 .290 .257
The problem of accepting card in case of small penny
transaction is now resolved by mobile payment (v2) .799 .112 .203 .101
It has reduced time in processing payment (v3) .811 .032 .319 .158
It has made money transfer very easy (v4) .776 .081 .291 .105
Very useful during rush hours (v5) .664 .104 .179 .250
To avoid card transaction failures (v6) .774 .094 .174 .196
It helps me to go digital, without paying PoS terminal
charges to bank (v7) .812 .164 .269 .124
It adds on to my business sales volume (v8) .433 .036 .219 .433
It was easy for me to adapt mobile payment (v9) .663 .351 .173
-
.005
Receiving money through mobile payment is very
easy (v10) .789 .342 .200 -
.047
I find it very convenient as I don’t have to handle cash
or swipe card (v11) .768 .290 .263 .041
My customers insist to pay through it (v12) .309 .025 .156 .699
To give customer an extra payment option (v13) .095 .351
-
.033 .737
I don’t want lose customers to other merchants (v14) -
.014 .308 .110 .746
I feel merchant technical- support of mobile payment
system is appropriate (v15) .257 .745 .224 .118
I have full trust on my mobile payment app provider
(v16) .233 .778 .116 .190
I am fully satisfied from the current offerings by app
provider (v17) .200 .722 -
.001 .145
I feel that per day/month limit should be increased
(v18) -
.011 .701 .017 .151
I accept mobile payment to support cashless India
(v19) .533 .124 .669 .076
I accept mobile payment to curb black money (v20) .440 .193 .712 .039
I have started accepting mobile payment after
demonetisation (v21) .348 -
.051 .785 .139
I still think government should give more relaxation to
merchant community for accepting mobile payment
(v22) .284 .178 .751 .149

234
Extraction Method: Principal Component Analysis.
Rotation Method: Varimax with Kaiser Normalization.
a. Rotation converged in 6 iterations.
Interpretation – From the above table, it is found that v1, v2, v3, v4, v5, v6,
v7, v8, v9, v10 & v11 show more loadings under the first component and thus
it can be named as Usability Factors. These are the variables that have utility
on use of mobile payment system. Similarly, v15, v16, v17 & v18 show more
loadings under the second component and thus it can be named as Application
Providers Factors. Likewise, v19, v20, v21 & v22 have more loadings under
the third component and thus it can be named as Government Initiatives
Factors. It was further found that v12, v13 & v14 have more loadings under
the fourth component and thus it can be named as Consumer Influence. So
total of four factors were extracted.
4.3.7 Reliability Analysis
Cronbach’s alpha was used to check the reliability of all the factors taken in
the questionnaire and to check the internal consistency within each factor. The
factors with Cronbach’s value equal to or greater than 0.7, are considered as
reliable and shall be considered for further analysis. The Cronbach’s alpha
value of the items of each factor is mentioned below.
Table 4.94: Cronbach’s alpha value of merchant responses
S.No. Description Cronbach’s
Alpha value
Usability I accept mobile payment to keep out
of change issue
0.943
The problem of accepting card in
case of small penny transaction is

235
now resolved by mobile payment
I accept mobile payment because it
has reduced time in processing
payment
I use mobile payment as it has made
money transfer very easy
I find mobile payment very useful
during rush hours
I accept mobile payment to avoid
card transaction failures
I accept mobile payment as it helps
me to go digital, without paying
PoS terminal charges to bank
I accept mobile payment as it adds
on to my business sales volume
I accept mobile payment because it
was easy for me to adapt mobile
payment systems
I accept mobile payment because
receiving money through mobile
payment is very easy
I accept mobile payment because I
find it very convenient as I don’t
have to handle cash or swipe card
Consumer
influence
I accept mobile payment because
my consumers insist to pay through
it
0.720
I accept mobile payment to give
consumer an extra payment option
I accept mobile payment so that I
don’t lose consumers to other
merchants
Application
provider
I feel merchant technical- support of
mobile payment system is
appropriate
0.792
I have full trust on my mobile

236
payment app provider
I am fully satisfied from the current
offerings by app provider
I feel that per day/month limit
should be increased
Government
initiative
I accept mobile payment to support
cashless India
0.866
I accept mobile payment to curb
black money
I have started accepting mobile
payment after demonetisation
I still think government should give
more relaxation to merchant
community for accepting mobile
payment
4.3.8 Hypothesis testing for finding association between demographic
variables and awareness about mobile payment systems among merchant
4.3.8.1 Association between City and Awareness about Mobile Payment
Systems
Table 4.95: Cross tabulation for awareness and city
City * Awareness Crosstabulation
Awareness
Total Yes No
City Ranchi Count 95 5 100
Expected Count 97.0 3.0 100.0
% within City 95.0% 5.0% 100.0%

237
% within
Awareness 49.0% 83.3% 50.0%
% of Total 47.5% 2.5% 50.0%
Kolkata Count 99 1 100
Expected Count 97.0 3.0 100.0
% within City 99.0% 1.0% 100.0%
% within
Awareness 51.0% 16.7% 50.0%
% of Total 49.5% 0.5% 50.0%
Total Count 194 6 200
Expected Count 194.0 6.0 200.0
% within City 97.0% 3.0% 100.0%
% within
Awareness 100.0% 100.0% 100.0%
% of Total 97.0% 3.0% 100.0%
95% of Ranchi respondents were aware of what mobile payment system is,
while 5% did not know that payment can be made through their mobile phone.
In case of Kolkata city, 99% of the respondents knew about mobile payment
system, whereas 1% did not know about mobile payment.

238
Table 4.96: Chi square test for awareness and city
Chi-Square Tests
Value df
Asymptotic
Significance
(2-sided)
Exact
Sig. (2-
sided)
Exact
Sig. (1-
sided)
Pearson Chi-
Square 2.749a 1 .097
Continuity
Correctionb 1.546 1 .214
Likelihood Ratio 2.994 1 .084
Fisher’s Exact
Test .212 .106
Linear-by-Linear
Association 2.735 1 .098
N of Valid Cases 200
a. 2 cells (50.0%) have expected count less than 5. The minimum expected
count is 3.00.
b. Computed only for a 2x2 table
H013a-There is no association between the awareness about the mobile
payment system and city of the merchant.
To be significant the Sig. value needs to be .05 or smaller. In this case the
value of .214 is larger than the alpha value of .05, so we can conclude that our
result is not significant. This means that the proportion of Ranchi’s merchants
that are aware about the mobile payment system is not significantly different

239
from the proportion of Kolkata’s merchants that are aware about the mobile
payment system.
4.3.8.2 Association between Gender and Awareness about Mobile
Payment Systems
Table 4.97: Cross tabulation for awareness and gender
Gender * Awareness Crosstabulation
Awareness
Total Yes No
Gender Male Count 165 4 169
Expected Count 163.9 5.1 169.0
% within Gender 97.6% 2.4% 100.0%
% within Awareness 85.1% 66.7% 84.5%
% of Total 82.5% 2.0% 84.5%
Female Count 29 2 31
Expected Count 30.1 .9 31.0
% within Gender 93.5% 6.5% 100.0%
% within Awareness 14.9% 33.3% 15.5%
% of Total 14.5% 1.0% 15.5%
Total Count 194 6 200
Expected Count 194.0 6.0 200.0
% within Gender 97.0% 3.0% 100.0%
% within Awareness 100.0% 100.0% 100.0%

240
% of Total 97.0% 3.0% 100.0%
97.6% of the total males were aware about mobile payment system, while
2.4% were unaware. For females, 93.5% were aware while, 6.5% were aware
about mobile payment system. According to the result, 97% of the sample was
aware about mobile payment system, whereas 3% were unaware.
Table 4.98: Chi square test for awareness and gender
Chi-Square Tests
Value df
Asymptotic
Significance
(2-sided)
Exact
Sig. (2-
sided)
Exact
Sig. (1-
sided)
Pearson Chi-
Square 1.502a 1 .220
Continuity
Correctionb .426 1 .514
Likelihood Ratio 1.212 1 .271
Fisher’s Exact
Test .234 .234
Linear-by-Linear
Association 1.494 1 .222
N of Valid Cases 200
a. 1 cells (25.0%) have expected count less than 5. The minimum expected
count is .93.
b. Computed only for a 2x2 table

241
H014a-There is no association between the awareness about the mobile
payment system and gender of the merchant.
To be significant the Sig. value needs to be .05 or smaller. In this case the
value of .514 is larger than the alpha value of .05, so we can conclude that our
result is not significant. This means that the proportion of male that are aware
about the mobile payment system is not significantly different from the
proportion of female that are aware about the mobile payment system.
4.3.8.3 Association between Age and Awareness about Mobile Payment
Systems
Table 4.99: Group statistics of merchants’ age
N Mean Std. Deviation Std. Error
15 to 25 yrs 11 3.455 .9342 .2817
26 to 40 yrs 65 3.523 .6871 .0852
41 to 60 yrs 50 3.440 .6749 .0954
Above 61 yrs 6 3.167 .7528 .3073
Total 132 3.470 .7037 .0613
Table 4.100: Cross tabulation for awareness and age
Age * Awareness Crosstabulation
Awareness
Total Yes No
Age 15 to 25
yrs
Count 17 1 18
Expected Count 17.5 .5 18.0

242
% within Age 94.4% 5.6% 100.0%
% within
Awareness 8.8% 16.7% 9.0%
% of Total 8.5% 0.5% 9.0%
26 to 40
yrs
Count 89 1 90
Expected Count 87.3 2.7 90.0
% within Age 98.9% 1.1% 100.0%
% within
Awareness 45.9% 16.7% 45.0%
% of Total 44.5% 0.5% 45.0%
41 to 60
yrs
Count 75 2 77
Expected Count 74.7 2.3 77.0
% within Age 97.4% 2.6% 100.0%
% within
Awareness 38.7% 33.3% 38.5%
% of Total 37.5% 1.0% 38.5%
Above 61
yrs
Count 13 2 15
Expected Count 14.6 .5 15.0
% within Age 86.7% 13.3% 100.0%
% within
Awareness 6.7% 33.3% 7.5%
% of Total 6.5% 1.0% 7.5%
Total Count 194 6 200

243
Expected Count 194.0 6.0 200.0
% within Age 97.0% 3.0% 100.0%
% within
Awareness 100.0% 100.0% 100.0%
% of Total 97.0% 3.0% 100.0%
In case of age group of 15 to 25yrs about 94.4% were aware about mobile
payment system and 5.6% were unaware. In case of age group of 26 to 40 yrs
98.9% were aware about mobile payment system and 1.1% were unaware. In
case of age group of 41 to 60 yrs about 97.4% were aware about mobile
payment system and 2.6% were unaware. In case of age group of above 61 yrs
about 86.7% were aware about mobile payment system and 13.3% were
unaware. According to the result, 97% of the sample was aware about mobile
payment system, whereas 3% were unaware.
Table 4.101: Chi square test for awareness and age
Chi-Square Tests
Value df
Asymptotic
Significance
(2-sided)
Pearson Chi-Square 7.054a 3 .070
Likelihood Ratio 4.854 3 .183
Linear-by-Linear Association 1.609 1 .205
N of Valid Cases 200
a. 4 cells (50.0%) have expected count less than 5. The minimum expected
count is .45.

244
H015a- There is no association between the awareness about the mobile
payment system and age of the merchant.
To be significant the Sig. value needs to be .05 or smaller. In this case the
value of .070 is larger than the alpha value of .05, so we can conclude that our
result is significant. This means that there is no association between the
awareness about the mobile payment system and age of the merchant.
4.3.8.4 Association between Educational qualification and Awareness
about Mobile Payment Systems
Table 4.102: Group statistics of merchants’ educational qualification
N Mean Std. Deviation Std. Error
Below intermediate 4 2.750 .5000 .2500
Intermediate 19 3.263 .7335 .1683
Graduate 101 3.515 .6872 .0684
PG and above 8 3.750 .7071 .2500
Total 132 3.470 .7037 .0613
Table 4.103: Cross tabulation for awareness and qualification
Qualification * Awareness Crosstabulation
Awareness
Total Yes No
Qualificatio
n
Below
intermediat
e
Count 12 1 13
Expected
Count 12.6 .4 13.0
% within
Qualificatio92.3% 7.7%
100.0
%

245
n
% within
Awareness 6.2% 16.7% 6.5%
% of Total 6.0% 0.5% 6.5%
Intermediat
e
Count 34 2 36
Expected
Count 34.9 1.1 36.0
% within
Qualificatio
n
94.4% 5.6% 100.0
%
% within
Awareness 17.5% 33.3% 18.0%
% of Total 17.0% 1.0% 18.0%
Graduate Count 137 3 140
Expected
Count 135.8 4.2 140.0
% within
Qualificatio
n
97.9% 2.1% 100.0
%
% within
Awareness 70.6% 50.0% 70.0%
% of Total 68.5% 1.5% 70.0%
PG and
above
Count 11 0 11
Expected
Count 10.7 .3 11.0

246
% within
Qualificatio
n
100.0
% 0.0%
100.0
%
% within
Awareness 5.7% 0.0% 5.5%
% of Total 5.5% 0.0% 5.5%
Total Count 194 6 200
Expected
Count 194.0 6.0 200.0
% within
Qualificatio
n
97.0% 3.0% 100.0
%
% within
Awareness
100.0
%
100.0
%
100.0
%
% of Total 97.0% 3.0%
100.0
%
92.3% of below intermediate were aware about mobile payment system and
7.7% were unaware. In case of intermediate, 94.4% were aware about mobile
payment system and 5.6% were unaware. In case of graduate, 97.9% were
aware about mobile payment system and 2.1% were unaware. Of people
possessing degree of PG and above, 100% were aware about mobile payment
system. According to the result, 97% of the sample was aware about mobile
payment system, whereas 3% were unaware.

247
Table 4.104: Chi square test for awareness and educational qualification
Chi-Square Tests
Value df
Asymptotic
Significance (2-
sided)
Pearson Chi-Square 2.485a 3 .478
Likelihood Ratio 2.404 3 .493
Linear-by-Linear Association 2.426 1 .119
N of Valid Cases 200
a. 4 cells (50.0%) have expected count less than 5. The minimum expected
count is .33.
H016a-There is no association between the awareness about the mobile
payment system and educational qualification of the merchant.
To be significant the Sig. value needs to be .05 or smaller. In this case the
value of .478 is larger than the alpha value of .05, so we can conclude that our
result is not significant. This means that there is no association between the
awareness about the mobile payment system and educational qualification of
the merchant.

248
4.3.8.5 Association between Personal innovativeness and Awareness about
Mobile Payment Systems
Table 4.105: Group statistics of merchants’ personal innovativeness
N Mean Std. Deviation Std. Error
First to use 32 3.781 .6082 .1075
Wait for others 57 3.439 .6818 .0903
Late users 25 3.440 .7118 .1424
Prefer old 18 3.056 .7254 .1710
Total 132 3.470 .7037 .0613
Table 4.106: Cross tabulation awareness and personal innovativeness
Personal innovation * Awareness Crosstabulation
Awareness
Total Yes No
When a
new
technolog
y is
introduce
d in the
market
I am
usually
among
the first
to use
Count 34 0 34
Expected
Count 33.0 1.0 34.0
% within
Personal
innovatines
s
100.0
% 0.0%
100.0
%
% within
Awareness 17.5% 0.0% 17.0%
% of Total 17.0% 0.0% 17.0%
I wait for Count 82 2 84

249
others to
use first
Expected
Count 81.5 2.5 84.0
% within
Personal
innovatines
s
97.6% 2.4% 100.0
%
% within
Awareness 42.3% 33.3% 42.0%
% of Total 41.0% 1.0% 42.0%
I am
among
late users
Count 38 2 40
Expected
Count 38.8 1.2 40.0
% within
Personal
innovatines
s
95.0% 5.0% 100.0
%
% within
Awareness 19.6% 33.3% 20.0%
% of Total 19.0% 1.0% 20.0%
I prefer
using old
technolog
y only
Count 40 2 42
Expected
Count 40.7 1.3 42.0
% within
Personal
innovatines
s
95.2% 4.8% 100.0
%

250
% within
Awareness 20.6% 33.3% 21.0%
% of Total 20.0% 1.0% 21.0%
Total Count 194 6 200
Expected
Count 194.0 6.0 200.0
% within
Personal
innovatines
s
97.0% 3.0% 100.0
%
% within
Awareness
100.0
%
100.0
%
100.0
%
% of Total 97.0% 3.0%
100.0
%
100% of people among the first to use technology were aware about mobile
payment system. In case of the one who waits for others to use first, 97.6%
were aware about mobile payment system, while 2.4% were unaware. For the
late users, 95% were aware, 5% were unaware. Among the ones preferring old
technology, 95.2% were about mobile payment system, 4.8% were unaware.
According to the result, 97% of the sample was aware about mobile payment
system, whereas 3% were unaware.
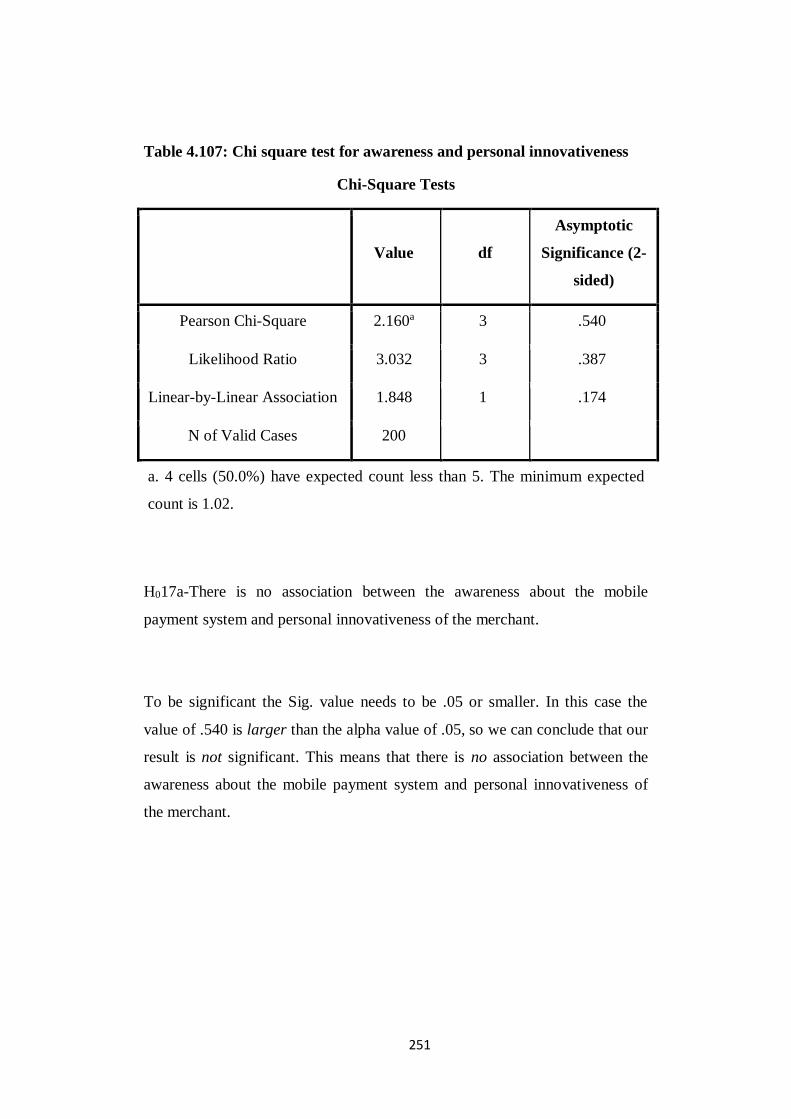
251
Table 4.107: Chi square test for awareness and personal innovativeness
Chi-Square Tests
Value df
Asymptotic
Significance (2-
sided)
Pearson Chi-Square 2.160a 3 .540
Likelihood Ratio 3.032 3 .387
Linear-by-Linear Association 1.848 1 .174
N of Valid Cases 200
a. 4 cells (50.0%) have expected count less than 5. The minimum expected
count is 1.02.
H017a-There is no association between the awareness about the mobile
payment system and personal innovativeness of the merchant.
To be significant the Sig. value needs to be .05 or smaller. In this case the
value of .540 is larger than the alpha value of .05, so we can conclude that our
result is not significant. This means that there is no association between the
awareness about the mobile payment system and personal innovativeness of
the merchant.

252
4.3.8.6 Association between Technology inclination and Awareness about
Mobile Payment Systems
Table 4.108: Independent sample test for technology inclination
Independent Samples Test
Levene’s Test for
Equality of
Variances
t-test for
Equality of
Means
F Sig. t df
I will continue
using mobile
payment
Equal variances
assumed .266 .607 2.610 130
Equal variances
not assumed 2.605 119.825
Table 4.109: Cross tabulation awareness and technology inclination
Technology updated * Awareness Crosstabulation
Awareness
Total Yes No
Technology
updated
Yes Count 80 1 81
Expected Count 78.6 2.4 81.0
% within
Technology
updated
98.8% 1.2% 100.0%
% within
Awareness 41.2% 16.7% 40.5%
% of Total 40.0% 0.5% 40.5%

253
No Count 114 5 119
Expected Count 115.4 3.6 119.0
% within
Technology
updated
95.8% 4.2% 100.0%
% within
Awareness 58.8% 83.3% 59.5%
% of Total 57.0% 2.5% 59.5%
Total Count 194 6 200
Expected Count 194.0 6.0 200.0
% within
Technology
updated
97.0% 3.0% 100.0%
% within
Awareness 100.0% 100.0% 100.0%
% of Total 97.0% 3.0% 100.0%
98.8% of the merchants who kept their business updated with new technology
were aware about mobile payment system, while 1.2% did not know about
mobile payment system. 95.8% of respondents who did not kept business
updated with new technology were aware about mobile payment system, while
4.2% were unaware.

254
Table 4.110: Chi square test for awareness and technology inclination
Chi-Square Tests
Value df
Asymptotic
Significance
(2-sided)
Exact
Sig. (2-
sided)
Exact
Sig. (1-
sided)
Pearson Chi-
Square 1.458a 1 .227
Continuity
Correctionb .617 1 .432
Likelihood Ratio 1.637 1 .201
Fisher’s Exact
Test .404 .222
Linear-by-Linear
Association 1.451 1 .228
N of Valid Cases 200
Sa. 2 cells (50.0%) have expected count less than 5. The minimum expected
count is 2.43.
b. Computed only for a 2x2 table
H018a-There is no association between the awareness about the mobile
payment system and technology inclination of the merchant.
To be significant the Sig. value needs to be .05 or smaller. In this case the
value of .432 is larger than the alpha value of .05, so we can conclude that our
result is significant. This means that there is no association between the
awareness about the mobile payment system and personal innovativeness of
the merchant.

255
4.3.9 Hypothesis testing for finding association between demographic
variables and acceptance of the mobile payment systems by merchant
4.3.9.1 Association between City and Acceptance of Mobile Payment
Systems
Table 4.111: Cross tabulation of use and city
City * Do you accept payment through mobile payment system
Crosstabulation
Do you accept payment through
mobile payment system
Total Yes No Abandoned
City Ranchi Count 58 31 11 100
Expected Count 66.0 22.0 12.0 100.0
% within City 58.0% 31.0% 11.0% 100.0%
% within Do
you accept
payment through
mobile payment
system
43.9% 70.5% 45.8% 50.0%
% of Total 29.0% 15.5% 5.5% 50.0%
Kolkata Count 74 13 13 100
Expected Count 66.0 22.0 12.0 100.0
% within City 74.0% 13.0% 13.0% 100.0%
% within Do
you accept
payment through
mobile payment
system
56.1% 29.5% 54.2% 50.0%
% of Total 37.0% 6.5% 6.5% 50.0%
Total Count 132 44 24 200
Expected Count 132.0 44.0 24.0 200.0
% within City 66.0% 22.0% 12.0% 100.0%
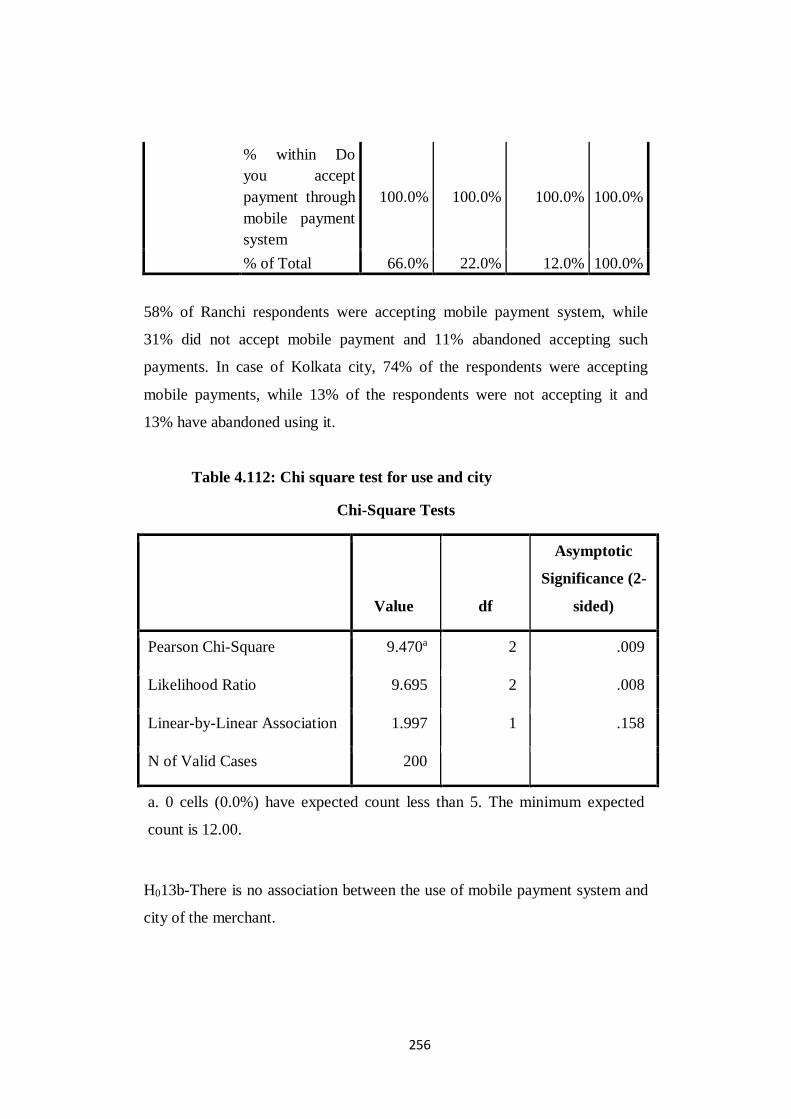
256
% within Do
you accept
payment through
mobile payment
system
100.0% 100.0% 100.0% 100.0%
% of Total 66.0% 22.0% 12.0% 100.0%
58% of Ranchi respondents were accepting mobile payment system, while
31% did not accept mobile payment and 11% abandoned accepting such
payments. In case of Kolkata city, 74% of the respondents were accepting
mobile payments, while 13% of the respondents were not accepting it and
13% have abandoned using it.
Table 4.112: Chi square test for use and city
Chi-Square Tests
Value df
Asymptotic
Significance (2-
sided)
Pearson Chi-Square 9.470a 2 .009
Likelihood Ratio 9.695 2 .008
Linear-by-Linear Association 1.997 1 .158
N of Valid Cases 200
a. 0 cells (0.0%) have expected count less than 5. The minimum expected
count is 12.00.
H013b-There is no association between the use of mobile payment system and
city of the merchant.

257
To be significant the Sig. value needs to be .05 or smaller. In this case the
value of .009 is smaller than the alpha value of .05, so we can conclude that
our result is significant. This means that there is association between the
awareness about the mobile payment system and city of the merchant.
4.3.9.2 Association between Gender and Acceptance of Mobile Payment
Systems
Table 4.113: Cross tabulation of use and gender
Gender * Do you accept payment through mobile payment system
Crosstabulation
Do you accept payment
through mobile payment
system
Total Yes No
Abandone
d
Gende
r
Male Count 116 34 19 169
Expecte
d Count 111.5 37.2 20.3 169.0
%
within
Gender
68.6% 20.1% 11.2% 100.0
%
%
within
Do you
accept
payment
through
87.9% 77.3% 79.2% 84.5%

258
mobile
payment
system
% of
Total 58.0% 17.0% 9.5% 84.5%
Femal
e
Count 16 10 5 31
Expecte
d Count 20.5 6.8 3.7 31.0
%
within
Gender
51.6% 32.3% 16.1% 100.0
%
%
within
Do you
accept
payment
through
mobile
payment
system
12.1% 22.7% 20.8% 15.5%
% of
Total 8.0% 5.0% 2.5% 15.5%
Total Count 132 44 24 200
Expecte
d Count 132.0 44.0 24.0 200.0
%
within 66.0% 22.0% 12.0%
100.0
%

259
Gender
%
within
Do you
accept
payment
through
mobile
payment
system
100.0
%
100.0
% 100.0%
100.0
%
% of
Total 66.0% 22.0% 12.0%
100.0
%
68.6% of the male respondents were accepting payment mobile, while 20.1%
were not accepting and 11.2% have abandoned using it. For females, 51.6%
were accepting mobile payment, 32.3% were not accepting payment through
mobile and 16.1% have abandoned using it. According to the result, 66% of
the sample was accepting mobile payment system, whereas 22% were not
accepting it and 12% have abandoned using it .
Table 4.114: Chi square test for use and gender
Chi-Square Tests
Value df
Asymptotic
Significance (2-
sided)
Pearson Chi-Square 3.427a 2 .180
Likelihood Ratio 3.282 2 .194

260
Linear-by-Linear Association 2.562 1 .109
N of Valid Cases 200
a. 1 cells (16.7%) have expected count less than 5. The minimum expected
count is 3.72.
H014b-There is no association between the use of mobile payment system and
gender of the merchant.
To be significant the Sig. value needs to be .05 or smaller. In this case the
value of .180 is larger than the alpha value of .05, so we can conclude that our
result is significant. This means that there is association between the
awareness about the mobile payment system and gender of the merchant.
4.3.9.3 Association between Age and Acceptance of Mobile Payment
Systems
Table 4.115: Cross tabulation of use and age
Age * Do you accept payment through mobile payment system
Crosstabulation
Do you accept payment through
mobile payment system
Total Yes No Abandoned
Age 15 to
25 yrs
Count 11 3 4 18
Expected
Count 11.9 4.0 2.2 18.0
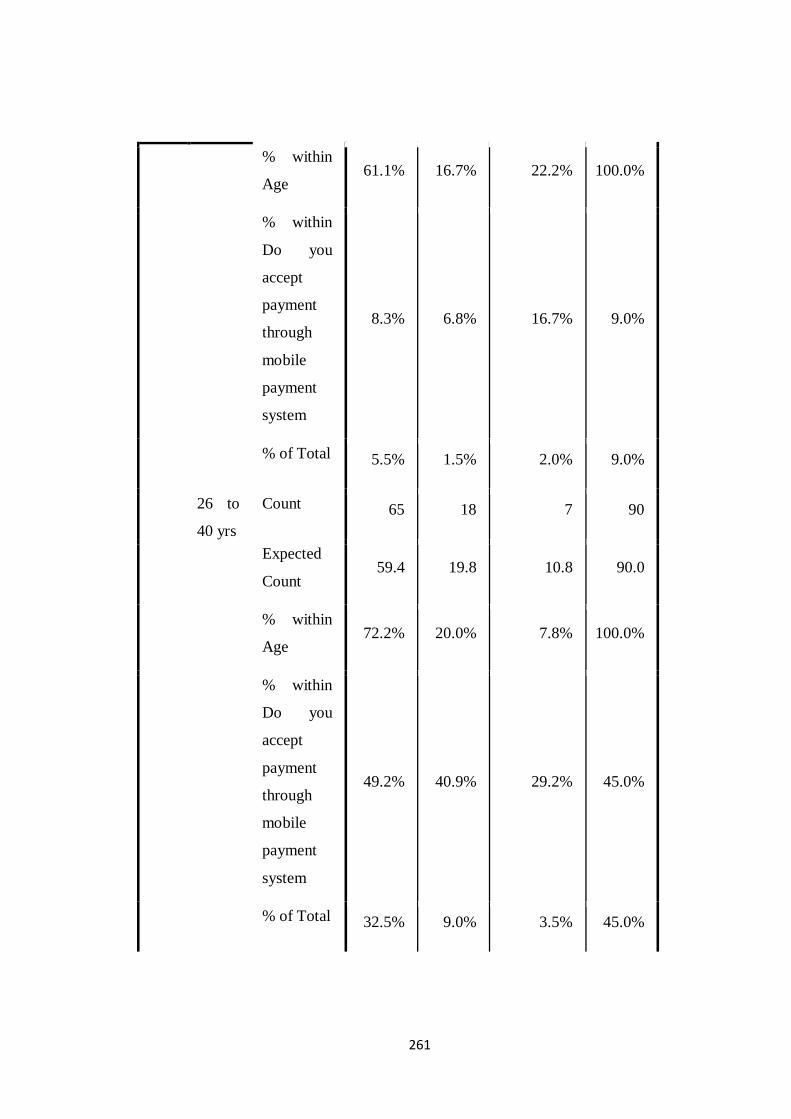
261
% within
Age 61.1% 16.7% 22.2% 100.0%
% within
Do you
accept
payment
through
mobile
payment
system
8.3% 6.8% 16.7% 9.0%
% of Total 5.5% 1.5% 2.0% 9.0%
26 to
40 yrs
Count 65 18 7 90
Expected
Count 59.4 19.8 10.8 90.0
% within
Age 72.2% 20.0% 7.8% 100.0%
% within
Do you
accept
payment
through
mobile
payment
system
49.2% 40.9% 29.2% 45.0%
% of Total 32.5% 9.0% 3.5% 45.0%

262
41 to
60 yrs
Count 50 16 11 77
Expected
Count 50.8 16.9 9.2 77.0
% within
Age 64.9% 20.8% 14.3% 100.0%
% within
Do you
accept
payment
through
mobile
payment
system
37.9% 36.4% 45.8% 38.5%
% of Total 25.0% 8.0% 5.5% 38.5%
Above
61 yrs
Count 6 7 2 15
Expected
Count 9.9 3.3 1.8 15.0
% within
Age 40.0% 46.7% 13.3% 100.0%
% within
Do you
accept
payment
through
mobile
payment
4.5% 15.9% 8.3% 7.5%
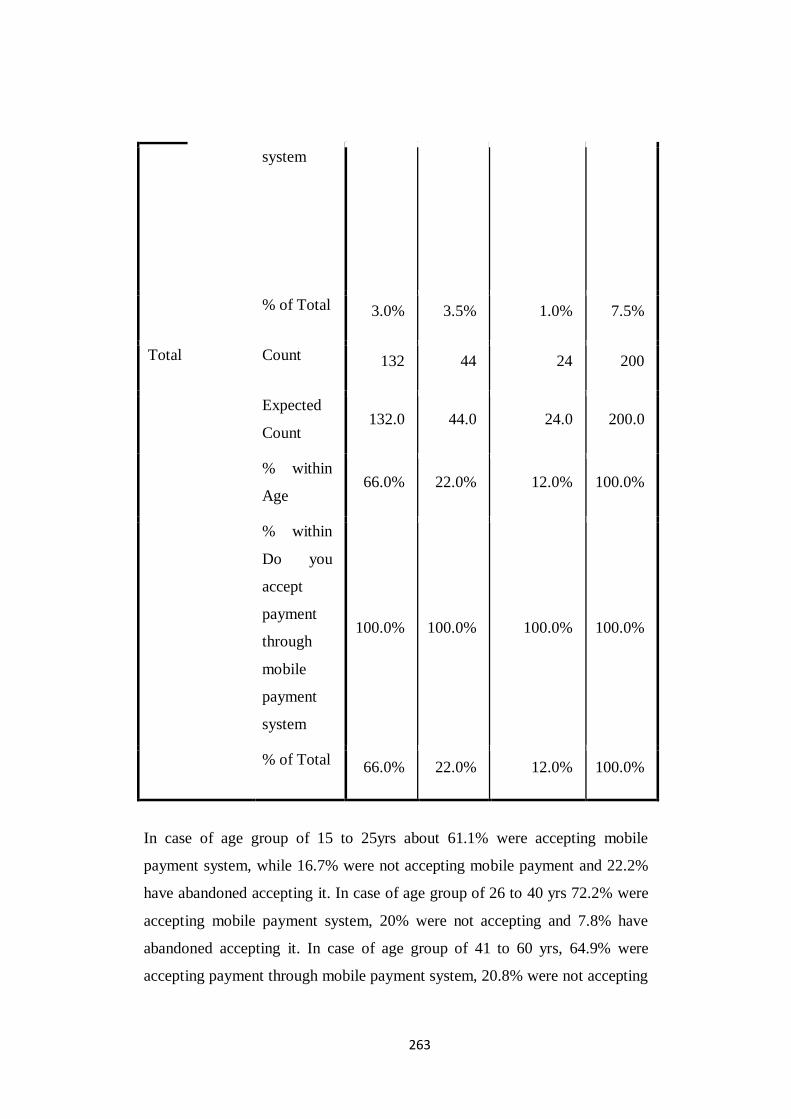
263
system
% of Total 3.0% 3.5% 1.0% 7.5%
Total Count 132 44 24 200
Expected
Count 132.0 44.0 24.0 200.0
% within
Age 66.0% 22.0% 12.0% 100.0%
% within
Do you
accept
payment
through
mobile
payment
system
100.0% 100.0% 100.0% 100.0%
% of Total 66.0% 22.0% 12.0% 100.0%
In case of age group of 15 to 25yrs about 61.1% were accepting mobile
payment system, while 16.7% were not accepting mobile payment and 22.2%
have abandoned accepting it. In case of age group of 26 to 40 yrs 72.2% were
accepting mobile payment system, 20% were not accepting and 7.8% have
abandoned accepting it. In case of age group of 41 to 60 yrs, 64.9% were
accepting payment through mobile payment system, 20.8% were not accepting
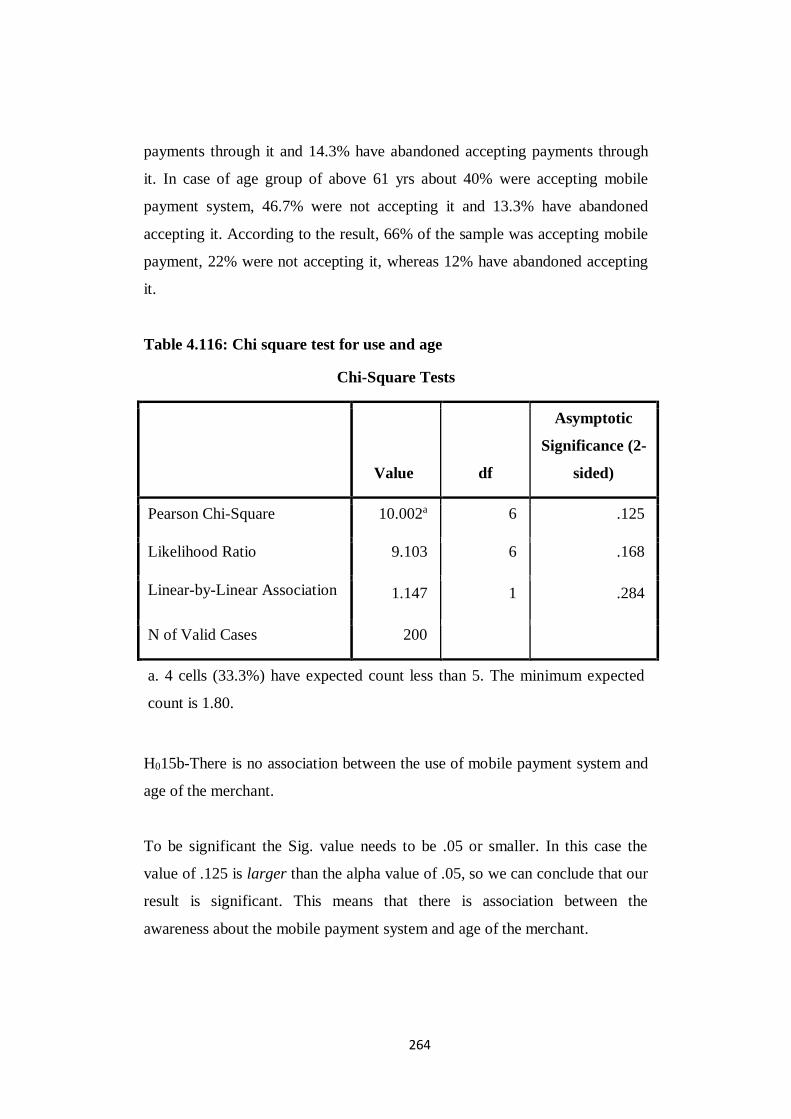
264
payments through it and 14.3% have abandoned accepting payments through
it. In case of age group of above 61 yrs about 40% were accepting mobile
payment system, 46.7% were not accepting it and 13.3% have abandoned
accepting it. According to the result, 66% of the sample was accepting mobile
payment, 22% were not accepting it, whereas 12% have abandoned accepting
it.
Table 4.116: Chi square test for use and age
Chi-Square Tests
Value df
Asymptotic
Significance (2-
sided)
Pearson Chi-Square 10.002a 6 .125
Likelihood Ratio 9.103 6 .168
Linear-by-Linear Association 1.147 1 .284
N of Valid Cases 200
a. 4 cells (33.3%) have expected count less than 5. The minimum expected
count is 1.80.
H015b-There is no association between the use of mobile payment system and
age of the merchant.
To be significant the Sig. value needs to be .05 or smaller. In this case the
value of .125 is larger than the alpha value of .05, so we can conclude that our
result is significant. This means that there is association between the
awareness about the mobile payment system and age of the merchant.

265
4.3.9.4 Association between Educational qualification and Acceptance of
Mobile Payment Systems
Table 4.117: Cross tabulation use and education qualification
Qualification * Do you accept payment through mobile payment
system Crosstabulation
Do you accept payment
through mobile payment
system Total
Yes No Aband
oned
Qualif
icatio
n
Below
interme
diate
Count 4 6 3 13
Expecte
d Count 8.6 2.9 1.6 13.0
%
within
Qualific
ation
30.8% 46.2% 23.1% 100.0%
%
within
Do you
accept
payment
through
mobile
payment
system
3.0%
13.6%
12.5% 6.5%

266
% of
Total 2.0% 3.0% 1.5% 6.5%
Interme
diate
Count 19 11 6 36
Expecte
d Count 23.8 7.9 4.3 36.0
%
within
Qualific
ation
52.8% 30.6% 16.7% 100.0
%
%
within
Do you
accept
payment
through
mobile
payment
system
14.4% 25.0% 25.0% 18.0%
% of
Total 9.5% 5.5% 3.0% 18.0%
Graduat
e
Count 101 26 13 140
Expecte
d Count 92.4 30.8 16.8 140.0
%
within
Qualific
ation
72.1% 18.6% 9.3% 100.0
%

267
%
within
Do you
accept
payment
through
mobile
payment
system
76.5% 59.1% 54.2% 70.0%
% of
Total 50.5% 13.0% 6.5% 70.0%
PG and
above
Count 8 1 2 11
Expecte
d Count 7.3 2.4 1.3 11.0
%
within
Qualific
ation
72.7% 9.1% 18.2% 100.0
%
%
within
Do you
accept
payment
through
mobile
payment
system
6.1% 2.3% 8.3% 5.5%
% of 4.0% 0.5% 1.0% 5.5%
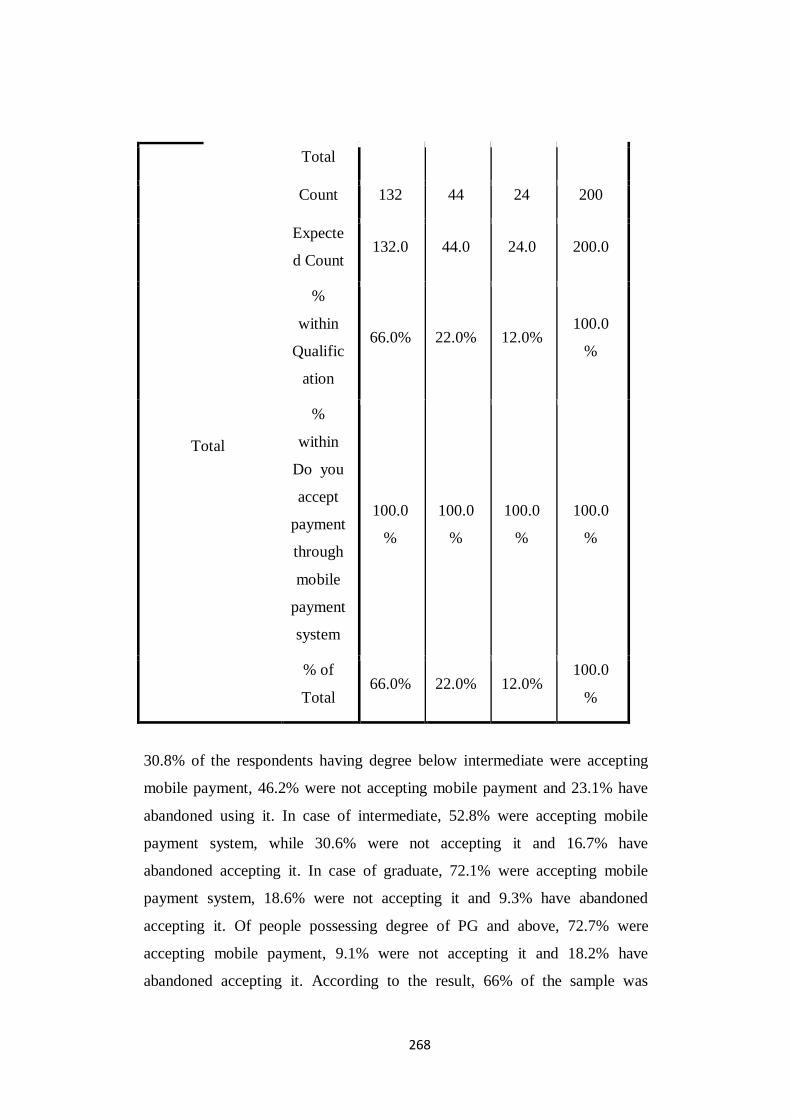
268
Total
Total
Count 132 44 24 200
Expecte
d Count 132.0 44.0 24.0 200.0
%
within
Qualific
ation
66.0% 22.0% 12.0% 100.0
%
%
within
Do you
accept
payment
through
mobile
payment
system
100.0
%
100.0
%
100.0
%
100.0
%
% of
Total 66.0% 22.0% 12.0%
100.0
%
30.8% of the respondents having degree below intermediate were accepting
mobile payment, 46.2% were not accepting mobile payment and 23.1% have
abandoned using it. In case of intermediate, 52.8% were accepting mobile
payment system, while 30.6% were not accepting it and 16.7% have
abandoned accepting it. In case of graduate, 72.1% were accepting mobile
payment system, 18.6% were not accepting it and 9.3% have abandoned
accepting it. Of people possessing degree of PG and above, 72.7% were
accepting mobile payment, 9.1% were not accepting it and 18.2% have
abandoned accepting it. According to the result, 66% of the sample was

269
accepting mobile payment, 22% were not accepting it, whereas 12% have
abandoned accepting it.
Table 4.118: Chi square test for use and educational qualification
Chi-Square Tests
Value df
Asymptotic
Significance (2-
sided)
Pearson Chi-Square 13.693a 6 .033
Likelihood Ratio 13.331 6 .038
Linear-by-Linear Association 8.143 1 .004
N of Valid Cases 200
a. 5 cells (41.7%) have expected count less than 5. The minimum expected
count is 1.32.
H016b-There is no association between the use of mobile payment system and
educational qualification of the merchant.
To be significant the Sig. value needs to be .05 or smaller. In this case the
value of .033 is smaller than the alpha value of .05, so we can conclude that
our result is significant. This means that there is no association between the
awareness about the mobile payment system and educational qualification of
the merchant.

270
4.3.9.5 Association between Personal innovativeness and Acceptance of
Mobile Payment Systems
Table 4.119: Cross tabulation use and personal innovativeness
Personal innovativeness * Do you accept payment through mobile
payment system Crosstabulation
Do you accept payment
through mobile payment
system Total
Yes No Abando
ned
When
a new
techno
logy
is
introd
uced
in the
marke
t
I am usually
among the
first to use
Count 32 1 1 34
Expected
Count 22.4 7.5 4.1 34.0
% within
Technolo
gyAdopti
on Phase
94.1% 2.9% 2.9% 100.0
%
% within
Do you
accept
payment
through
mobile
payment
system
24.2% 2.3% 4.2% 17.0%
% of 16.0% 0.5% 0.5% 17.0%

271
Total
I wait for
others to use
first
Count 57 19 8 84
Expected
Count 55.4 18.5 10.1 84.0
% within
Personal
innovatin
ess
67.9% 22.6
% 9.5%
100.0
%
% within
Do you
accept
payment
through
mobile
payment
system
43.2% 43.2
% 33.3% 42.0%
% of
Total 28.5% 9.5% 4.0% 42.0%
I am among
late users
Count 25 11 4 40
Expected
Count 26.4 8.8 4.8 40.0
% within
Personal
innovatin
ess
62.5% 27.5
% 10.0%
100.0
%

272
% within
Do you
accept
payment
through
mobile
payment
system
18.9% 25.0
% 16.7% 20.0%
% of
Total 12.5% 5.5% 2.0% 20.0%
I prefer using
old
technology
only
Count 18 13 11 42
Expected
Count 27.7 9.2 5.0 42.0
% within
Personal
innovatin
ess
42.9% 31.0
% 26.2%
100.0
%
% within
Do you
accept
payment
through
mobile
payment
system
13.6% 29.5
% 45.8% 21.0%
% of
Total 9.0% 6.5% 5.5% 21.0%

273
Total Count 132 44 24 200
Expected
Count 132.0 44.0 24.0 200.0
% within
Personal
innovatin
ess
66.0% 22.0
% 12.0%
100.0
%
% within
Do you
accept
payment
through
mobile
payment
system
100.0
%
100.0
% 100.0%
100.0
%
% of
Total 66.0%
22.0
% 12.0%
100.0
%
94.1% of people among the first to use technology were accepting mobile
payment, while 2.9% were not accepting it, and 2.9% have abandoned
accepting mobile payment. In case of the one who waits for others to use first,
67.9% were accepting mobile payment, while 22.6% were not accepting it and
9.5% have abandoned accepting it. For the late users, 62.5% were accepting it,
27.5% were not accepting and 10% have abandoned using it. Among the ones
preferring old technology, 42.9% were accepting mobile payment, 31% were
not accepting it and 26.2% have abandoned accepting mobile payment.
According to the result, 66% of the sample was accepting mobile payment,
22% were not accepting it, whereas 12% have abandoned accepting it.

274
Table 4.120: Chi square test for use and personal innovativeness
Chi-Square Tests
Value df
Asymptotic Significance
(2-sided)
Pearson Chi-Square 25.243a 6 .000
Likelihood Ratio 27.626 6 .000
Linear-by-Linear
Association 20.111 1 .000
N of Valid Cases 200
a. 2 cells (16.7%) have expected count less than 5. The minimum expected
count is 4.08.
H017b-There is no association between the use of mobile payment system and
personal innovativeness of the merchant.
To be significant the Sig. value needs to be .05 or smaller. In this case the
value of .000 is smaller than the alpha value of .05, so we can conclude that
our result is significant. This means that there is association between the
awareness about the mobile payment system and personal innovativeness of
the merchant.

275
4.3.9.6 Association between Technology inclination and Acceptance of
Mobile Payment Systems
Table 4.121: Cross tabulation use and technology inclination
Technology updated * Do you accept payment through mobile payment
system Crosstabulation
Do you accept payment
through mobile payment
system
Total Yes No
Abandone
d
Technolog
y updated
Ye
s
Count 57 18 6 81
Expected
Count 53.5 17.8 9.7 81.0
% within
Technolog
y updated
70.4% 22.2% 7.4% 100.0
%
% within
Do you
accept
payment
through
mobile
payment
system
43.2% 40.9% 25.0% 40.5%
% of Total 28.5% 9.0% 3.0% 40.5%
No Count 75 26 18 119
Expected 78.5 26.2 14.3 119.0

276
Count
% within
Technolog
y updated
63.0% 21.8% 15.1% 100.0
%
% within
Do you
accept
payment
through
mobile
payment
system
56.8% 59.1% 75.0% 59.5%
% of Total 37.5% 13.0% 9.0% 59.5%
Total Count 132 44 24 200
Expected
Count 132.0 44.0 24.0 200.0
% within
Technolog
y updated
66.0% 22.0% 12.0% 100.0
%
% within
Do you
accept
payment
through
mobile
payment
system
100.0
%
100.0
% 100.0%
100.0
%

277
% of Total 66.0% 22.0% 12.0%
100.0
%
70.4% of the merchants who kept their business updated with new technology
were accepting mobile payment, 22.2% were not accepting mobile payment
and 7.4% abandoned accepting mobile payment. 63% of respondents who did
not kept business updated with new technology were accepting mobile
payment, while 21.8% were not accepting mobile payment and 15.1% have
abandoned accepting mobile payment.
Table 4.122: Chi square test for use and technology inclination
Chi-Square Tests
Value df
Asymptotic
Significance (2-
sided)
Pearson Chi-Square 2.790a 2 .248
Likelihood Ratio 2.940 2 .230
Linear-by-Linear Association 2.228 1 .136
N of Valid Cases 200
a. 0 cells (0.0%) have expected count less than 5. The minimum expected
count is 9.72.
H018b-There is no association between the use of mobile payment system and
technology inclination of the merchant.
To be significant the Sig. value needs to be .05 or smaller. In this case the
value of .248 is larger than the alpha value of .05, so we can conclude that our

278
result is significant. This means that there is association between the
awareness about the mobile payment system and technology inclination of the
merchant.
4.3.9.7 Association between Awareness and Acceptance of Mobile
Payment Systems
Table 4.123: Cross tabulation awareness and acceptance
Chi-Square Tests
Value df
Asymptotic
Significance (2-
sided)
Pearson Chi-Square 14.771a 2 .001
Likelihood Ratio 14.427 2 .001
Linear-by-Linear Association 6.293 1 .012
N of Valid Cases 200
a. 3 cells (50.0%) have expected count less than 5. The minimum
expected count is .72.
Since the p- value .001 is less than the significance value .05, we can conclude
that there is association between the awareness about the mobile payment
system and use of mobile payments system among merchants.
4.3.10 Hypotheses testing for finding the impact of the demographic
factors on the continued use of the mobile payment systems
4.3.10.1 Impact of City on Continued use of Mobile payment systems
Independent t-test was done to find out the impact of city on continued use of
mobile payment. City was taken as the categorical independent variable and
continued use of mobile payment system as the dependent variable. For this
purpose, respondents were divided into two groups a) Ranchi & b) Kolkata.

279
Table 4.124: Group statistics for merchants’ city
Group Statistics
City N Mean
Std.
Deviation
Std. Error
Mean
I will continue using
mobile payment
Ranchi 58 3.707 .6491 .0852
Kolkata 74 3.284 .6928 .0805
Table 4.125 : T test for merchants’continued use with city
Independent Samples Test
Levene’s Test for
Equality of
Variances
t-test for Equality of Means
F Sig. t df Sig. (2-
tailed)
I will
continu
e using
mobile
payme
nt
Equal
variance
s
assumed
1.696 .195 3.580 130 .000
Equal
variance
s not
assume
d
3.608 125.874 .000
H013c-There is no significant difference in the continued use of mobile
payment system and city of the merchant.
.

280
There was significant difference in scores for males (M=3.71, SD=.65) and
females (M=3.28, SD=.69); t (130)=1.7, p=.000.
Since p = 0.00 is less than α = 0.05, the null hypothesis is rejected. That means
there is significant difference in the continued use of mobile payment system
and city of the merchant.
4.3.10.2 Impact of Gender on Continued use of Mobile payment systems
Independent t-test was done to find out the impact of gender on continued use
of mobile payment. Gender was taken as the categorical independent variable,
for this respondents were divided into two groups a) Male & b) Female, and
continued use of mobile payment was taken the continuous dependent
variable.
Table 4.126: Group statistics for merchants’ gender
Group Statistics
Gender N Mean
Std.
Deviation
Std. Error
Mean
I will continue using
mobile payment
Male 116 3.448 .7021 .0652
Female 16 3.625 .7188 .1797
Table 4.127 : T test for merchants’ continued use with gender
Independent Samples Test
Levene’s Test
for Equality
of Variances
t-test for Equality of
Means
F Sig. t df
Sig. (2-
tailed)
I
willcontinueusing
mobile payment
Equal
variances
assumed
.125 .724 -.941 130 .348

281
Equal
variances
not
assumed
-.924 19.165 .367
H014c-There is no significant difference in the continued use of mobile
payment system and gender of the merchant.
There was significant difference in scores for Ranchi (M=3.44, SD=.702) and
Kolkata (M=3.63, SD=.72); t (130)=.125 p=.348.
Since p = 0.348 is more than α = 0.05, the null hypothesis is accepted. That
means there is no significant difference in the continued use of mobile
payment system and gender of the merchant.
4.3.10.3 Impact of Age on Continued use of Mobile payment systems
One way ANOVA test was done to explore the impact of age group on use of
mobile payment. Age was taken as the categorical independent variable, for
this respondents were divided into four groups a) 15 to 25yrs, b) 26 to 40yrs,
c) 41 to 60yrs and d) 61 and above yrs, and continued use of mobile payment
was taken the continuous dependent variable.
Table 4.128: Group statistics for merchants’ age
N Mean Std. Deviation
15 to 25yrs 11 3.455 .9342
26 to 40yrs 65 3.523 .6871
41 to 60yrs 50 3.440 .6749
61 and above yrs 6 3.167 .7528
Total 132 3.470 .7037

282
Table 4.129: Test of Homogeneity of Variances age
I will continue using mobile payment
Levene Statistic df1 df2 Sig.
1.011 3 128 .390
Since the significance value is .390, which is greater than .05, there is no
violation of homogeneity test of variance assumption.
Table 4.130: One way ANOVA test for use and age
ANOVA
I will continue using mobile payment
Sum of
Squares Df
Mean
Square F Sig.
Between
Groups .783 3 .261 .521 .669
Within
Groups 64.096 128 .501
Total 64.879 131
H015c-There is no significant difference in the continued use of mobile
payment system and age of the merchant.
There was no statistically significant difference at the p<.05 level in the scores
for all 4 age groups [F(3, 128=.52, p=.67].

283
Since p = 0.669 is more than α = 0.05, the null hypothesis is accepted. That
means age group of the respondents has no significance impact on the
continued use of mobile payment system.
4.3.10.4 Impact of Educational qualification on continued use of mobile
payment systems
One way ANOVA test was done to explore the impact of educational
qualification on use of mobile payment. Educational qualification was taken as
the categorical independent variable, for this respondents were divided into
four groups a) below inter, b) intermediate, c) graduate and d) post graduate or
higher, and use of mobile payment was taken the continuous dependent
variable.
Table 4.131: Group statistics for merchants’ educational qualification
N Mean Std. Deviation Std. Error
Below intermediate 4 2.750 .5000 .2500
Intermediate 19 3.263 .7335 .1683
Graduate 101 3.515 .6872 .0684
Post graduate or higher 8 3.750 .7071 .2500
Total 132 3.470 .7037 .0613
Table 4.132: Test of Homogeneity of Variances
I will continue using mobile payment
Levene Statistic df1 df2 Sig.
.707 3 128 .549
Since the significance value is .549, which is greater than .05, there is no
violation of homogeneity test of variance assumption.

284
Table 4.133: One way ANOVA test for use and educational qualification
ANOVA
I will continue using mobile payment
Sum of
Squares Df Mean Square F Sig.
Between
Groups 3.717 3 1.239 2.593 .056
Within Groups 61.162 128 .478
Total 64.879 131
H016c-There is no significant difference in the continued use of mobile
payment system and educational qualification of the merchant.
There was no statistically significant difference at the p<.05 level in the scores
for all 4 age groups [F(3, 128=2.59, p=.06].
Since p = 0.056 is more than α = 0.05, the null hypothesis is accepted. That
means continued use of mobile payment is not influenced by educational
qualification of the merchant.
4.3.10.5 Impact of Personal innovativeness on continued use of Mobile
payment systems
One way ANOVA test was done to explore the impact of personal
innovatiness on use of mobile payment. Personal innovatiness was taken as the
categorical independent variable, for this respondents were divided into four
groups a) first to use, b) wait others to use, c) among late users and d) prefer to

285
use older technology, use of mobile payment was taken the continuous
dependent variable.
Table 4.134: Group statistics for merchants’ personal innovativeness
N Mean Std.
Deviation
Std.
Error
First to use 32 3.781 .6082 .1075
Wait others to use 57 3.439 .6818 .0903
Among late users 25 3.440 .7118 .1424
Prefer to use older
technology 18 3.056 .7254 .1710
Total 132 3.470 .7037 .0613
Table 4.135: Test of Homogeneity of Variances
I will continue using mobile payment
Levene Statistic df1 df2 Sig.
1.631 3 128 .185
Since the significance value is .185, which is greater than .05, there is no
violation of homogeneity test of variance assumption.
Table 4.136: One way ANOVA test for use and personal innovativeness
ANOVA
I will continue using mobile payment
Sum of
Squares Df
Mean
Square F Sig.
Between 6.271 3 2.090 4.565 .005

286
Groups
Within Groups 58.608 128 .458
Total 64.879 131
H017c-There is no significant difference in the continued use of mobile
payment system and personal innovativeness of the merchant.
There was no statistically significant difference at the p<.05 level in the scores
for all 4 age groups [F(3, 128=4.57, p=.005].
Since p = 0.005 is less than α = 0.05, the null hypothesis is rejected. That
means continued use of mobile payment is influenced by personal
innovativeness of the merchant.
4.3.10.6 Impact of Technology inclination on Continued use of Mobile
payment systems
One way ANOVA test was done to explore the impact of technology
inclination on use of mobile payment. Technology inclination was taken as the
categorical independent variable, for this respondents were divided into two
groups a) people who kept their business updated with new technology, and b)
people who preferred old technology only, use of mobile payment was taken
the continuous dependent variable.
Table 4.137: Group statistics for merchants’ technology inclination
N Mean
Std.
Deviation
Std.
Error
Yes 57 3.649 .6941 .0919
No 75 3.333 .6844 .0790
Total 132 3.470 .7037 .0613

287
Table 4.138: Test of Homogeneity of Variances
I will continue using mobile payment
Levene Statistic df1 df2 Sig.
.266 1 130 .607
Since the significance value is .607, which is greater than .05, there is no
violation of homogeneity test of variance assumption.
Table 4.139: One way ANOVA test for use and technology inclination
ANOVA
I will continue using mobile payment
Sum of
Squares Df
Mean
Square F Sig.
Between
Groups 3.230 1 3.230 6.810 .010
Within
Groups 61.649 130 .474
Total 64.879 131
H018c-There is no significant difference in the continued use of mobile
payment system and technology inclination of the merchant.
There was no statistically significant difference at the p<.05 level in the scores
for all 4 age groups [F(3, 130=6.81, p=.01].

288
Since p = 0.010 is less than α = 0.05, the null hypothesis is accepted. That
means continued use of mobile payment is not influenced by technology
inclination of the merchant.
4.3.10.7 Hypothesis testing for finding the impact of other factors on the
continued use of the mobile payment systems
H019-Usability will not significantly influence the continued use of mobile
payment system by the merchant.
H020-Consumer influence will not significantly influence the continued use of
mobile payment system by the merchant.
H021-Government initiatives will not significantly influence the continued use
of mobile payment system by the merchant.
H022-Application provider will not significantly influence the continued use
of mobile payment system by the merchant.
Table 4.140: Correlation of all independent and dependent variables
Correlations
I will
continue
using
mobile
payment U CUST APP GOVT
Pearson
Correlation
I will continue using
mobile payment 1.000 .628 .568 .616 .597
U .628 1.000 .380 .429 .732
CUST .568 .380 1.000 .449 .304
APP .616 .429 .449 1.000 .325
GOVT .597 .732 .304 .325 1.000
Sig. (1-tailed) I will continue using
mobile payment . .000 .000 .000 .000
U .000 . .000 .000 .000
CUST .000 .000 . .000 .000

289
APP .000 .000 .000 . .000
GOVT .000 .000 .000 .000 .
N I will continue using
mobile payment 132 132 132 132 132
U 132 132 132 132 132
CUST 132 132 132 132 132
APP 132 132 132 132 132
GOVT 132 132 132 132 132
Table 4.141: Model summary
Model Summaryb
Model R R Square
Adjusted R
Square
Std. Error of the
Estimate
1 .796a .633 .622 .4328
a. Predictors: (Constant), GOVT, CUST, APP, U
b. Dependent Variable: I will continue using mobile payment
Model summary shows R-value as 0.796, which means there is good
correlation between dependent and independent variable. R-square=0.633,
which means that 63.3% of the total variance in the continued use of mobile
payment can be explained by all the independent variables. That means,
continued use of mobile payment is strongly predicted by all the four
independent variables.
Table 4.142: ANOVA test
ANOVAa
Model
Sum of
Squares df Mean Square F Sig.
1 Regression 41.093 4 10.273 54.852 .000b
Residual 23.786 127 .187
Total 64.879 131

290
a. Dependent Variable: I will continue using mobile payment
b. Predictors: (Constant), GOVT, CUST, APP, U
ANOVA table shows the p-value as 0.00, therefore the result is significant as
the p-value is less than significant value 0.05. Also F-ratio value is 54.9,
which is considered as good.
Table 4.143: Regression coefficients
Coefficientsa
Unstandardized
Coefficients
Standardi
zed
Coefficient
s
Model B
Std.
Error Beta t Sig.
(Constant) -1.155 .374 -3.087 .002
U .154 .069 .186 2.231 .027
CUST .420 .097 .267 4.311 .000
APP .439 .085 .327 5.174 .000
GOVT .233 .067 .274 3.471 .001
All the null hypothesis is rejected as the significance value is less than 0.05 for
all independent variable. This shows that all the independent variables
(usability, customer influence, application provider and government
initiatives) have a significant positive relationship with the continued use of
mobile payment.

291
4.4 Summary
In this chapter analysis of data was done for both consumers and merchants
using MS Excel for tables and graphs, whereas one way ANOVA, regression
ANOVA, T-test and Chi- square tests were done using IBM SPSS ver. 23. The
hypotheses thus accepted or rejected have been documented in the next
chapter.

292
CHAPTER 5: RESULT,
DISCUSSIONS &
CONCLUSIONS

293
CHAPTER 5: RESULT,
DISCUSSIONS & CONCLUSIONS
5.1 Overview
This chapter concludes the major findings of the research. This study analyzed
demographic factors influencing the awareness and use of mobile payments
among consumers and merchants of Ranchi and Kolkata cities. Also the
impact of independent variables on the continued use of mobile payments was
studied. The result of comparison between the merchants and consumers of
mobile payment has been documented. This chapter also provided practical
implications for mobile payment stakeholders and came up with suggestions
too. The chapter concluded with the limitations of the research methodology,
geographical location, time framework and thus finally recommended the
scope for the future researcher.
5.2 Results & Discussions
This study covered both Merchants and Consumers of Ranchi and Kolkata
city. This study aimed at understanding the actual level of awareness and
usage of mobile payment system with the problems faced while using for both
consumers and merchants and comparing it in two different cities. The study
also tried to find the impact of independent factors and demographic factors on
the use of mobile payment systems. The study was done to meet four
objectives of the research and the summary is presented below for all the
objectives.

294
5.2.1 Results of objective one
Objective one-To study the awareness, adoption and usage of consumer and
merchants about mobile payment system and compare the awareness and
usage level of mobile payment systems in Ranchi and Kolkata.
Statistical tools used- Frequency and mean
Consumer analysis results – There is a high level of awareness among the
consumers of the both the cities as almost 90 percent of the sample population
is aware about the mobile payment system and more than 60 percent of people
are actually using it in both the cities but the usage level is high in Kolkata in
comparison to Ranchi by 8 percent.
Cash is the most preferred payment option for both Ranchi and Kolkata
Mobile payment is preferred to net baning and credit cards in Ranchi while the
case is opposite in Kolkata where mobile payment is the last preferred
payment method.
Mobile payment seems to be recent trend in Ranchi as almost 65% of users are
using mobile payment from last 2 years. Whereas, opposite case is seen in
Kolkata where more than 55% of the users have been using mobile payment
for more than 2 years. In case of expenditure, only 50% of the users in Ranchi
used mobile payment for payments of more than Rs 2000, whereas 67% of the
users in Kolkata pay through mobile payment for such transactions.
PayTm was used by almost all the respondents of both the cities. Freecharge,
PhonePe, BHIM, Jio Money, G-Pay were the other used payment apps but
these were used by very fewer respondents in both the cities.

295
Merchants Analysis- It revealed that almost every merchant was aware about
mobile payment system in Kolkata with 99% of awareness level whereas, 95%
of merchants were aware about the mobile payment system in Ranchi. The
number of merchants accepting mobile payments is much higher in Kolkata as
compared to Ranchi. 74% of merchants are accepting payments through
mobile in Kolkata whereas only 58% of merchants are accepting such
payments in Ranchi. In both the cities significant percentage of merchants
have used and abandoned mobile payment as 11% of Ranchi merchants have
abandoned the use of mobile payments and 13% of Kolkata merchants have
done so.
Mobile payment is the third preferred payment options among merchants of
both the cities. Cash was found to be the most preferred option for accepting
payments in both the cities followed by card payments, whereas net banking is
least preferred by merchants. Findings indicate that traditional payment
methods are still popular among merchants. PayTm is accepted by almost
every merchant in both the cities with 97% of merchants accepting payTm in
both the cities. Further research done on PayTM (Vikas & Kumar, 2018) has
found Paytm app more secure than cash and encourages cashless economy in
India. Also after talking to merchants it was found that PayTM is preferred
because of good image building through advertisement.
NFC is accepted in Kolkata by significant numbers of merchants but it is not
accepted by Ranchi merchants. Mobikwik is also accepted by good numbers
of merchants in Kolkata but insignificant number of merchants accepts it in
Ranchi. All other mobile payment systems have quite low acceptance among
merchants in both cities.
Mobile payment is used mainly for sales transaction by all the merchants in
both cities. Majority of merchants find it safe to use mobile payment system.
72% of Ranchi merchants and 86% of Kolkata merchants feel so. Ranchi

296
merchants somewhat encourage their consumers to pay through their mobile
as 38% encourages their customers, while, hardly there is such encouragement
by Kolkata merchant as only 4% of merchants actually encourages their
customer to make mobile payments.
5.2.2 Results of objective two
Objective two: To find the influence of demographic factors on the awareness
and use of mobile payment system
Statistical Tools used- Chi-square was used to find the association between the
demographic variables and awareness about the mobile payment system and
demographic variables and use of mobile payment system among the
consumers and merchant group. Secondly, t-test and one –way Anova was
used to find the impact of demographic variables on continued use of mobile
payment system.
Results- Table below depicts the summary of the findings from chi-square.
5.2.2.1 Chi- square for Consumers
Table 5.1: Chi square table for consumer awareness and consumer use
Variable
Awareness Use
p-value
Null
hypothesis
Accept/Re
ject
p-
value
Null
hypothesis
Accept/Reject
City .723 Accept .133 Accept
Gender .315 Accept .200 Accept

297
Age .000 Reject .000 Reject
Qualification .155 Accept .232 Accept
Occupation .005 Reject .000 Reject
Income .050 Reject .000 Reject
Personal
Innovativeness
.000 Reject .000 Reject
Results from the above table 5.1, with regard to awareness about Mobile
Payment Systems, show demographic factors city, gender and qualification
had p-value 0.723, 0.315 and 0.155 respectively. Since the p-value is more
than the significance value 0.05, we accept the null hypothesis. This means
that demographic variables city, gender and qualification have no significant
relationship with the awareness about mobile payment system for consumers.
While, demographics age, occupation, income and personal innovativeness
had p-value 0.000, 0.005, 0.050 and 0.000 respectively. Since the p-value is
less than the significance value 0.05, we reject the null hypothesis. This means
that demographic variables, occupation, income and personal innovativeness
have a significant relationship with the awareness about mobile payment
system for consumers.
Similarly, for use of mobile payment systems, demographic factors city,
gender and qualification had p-value 0.133, 0.200 and 0.232 respectively.
Since the p-value is more than the significance value 0.05, we accept the null
hypothesis and reject the alternate hypothesis. This means there is no
relationship between the use of mobile payment system and demographic
variables city, gender and qualification for consumers. While, demographics
age, occupation, income and personal innovativeness had p-value 0.000,

298
0.000, 0.000 and 0.000 respectively. Since the p-value is less than the
significance value 0.05, we reject the null hypothesis and accept the alternate
hypothesis. This means there is relationship between the demographic
variables age, occupation, income and personal innovativeness, and use of
mobile payment system for consumers.
5.2.2.2 Chi-square for merchants
Table 5.2: Chi square table for merchant awareness and merchant use
Variable
Awareness Use
p-value
Null
hypothesis
Accept/Rejec
t
p-value
Null
hypothesis
Accept/Rej
ect
City .214 Accept .009 Reject
Gender .514 Accept .180 Accept
Age .070 Accept .125 Accept
Qualification .478 Accept .033 Reject
Personal
Innovativeness .540 Accept .000 Reject
Technology
inclination .432 Accept .248 Accept

299
Results from the above table 5.2, shows demographic factors city, gender, age,
qualification, personal innovativeness and technology inclination had p-value
0.214, 0.514, 0.070, 0.478, 0.540, and 0.432 respectively. Since the p-value is
more than the significance value 0.05, we accept the null hypothesis and reject
the alternate hypothesis. This means that there is no relationship between the
awareness of mobile payment system and demographic variables for
merchants.
Similarly, demographic factors gender, age, and technology inclination had p-
value 0.180, 0.125 and 0.248 respectively. Since the p-value is more than the
significance value 0.05, we accept the null hypothesis. This means there is no
relationship between the use of mobile payment system and demographic
variables gender, age, and technology inclination for merchants. While,
demographics factors city, qualification and personal innovativeness had p-
value 0.009, 0.033, and 0.000 respectively. Since the p-value is less than the
significance value 0.05, we reject the null hypothesis. This means there is a
relationship between the demographic variables city, qualification and
personal innovativeness, and use of mobile payment systems for merchants.
5.2.2.3 Results from independent sample T-test and ANOVA for
consumers
Table 5.3: Demographic factors affecting continued use of mobile
payment by consumers
Variables Null hypothesis P value Accept/Reje
ct
City H01c-There is no significant
difference in the continued use of
mobile payment and city
0.023 Reject null
hypothesis

300
Gender H02c-There is no significant
difference in the continued use of
mobile payment and gender
0.020 Reject null
hypothesis
Age H03c-There is no significant
difference in the continued use of
mobile payment and age of the
consumer
0.404 Accept Null
hypothesis
Educational
qualification
H04c-There is no significant
difference in the continued use of
mobile payment and educational
qualification of the consumer
0.596 Accept Null
hypothesis
Occupation H05c- There is no significant
difference in the continued use of
mobile payment and occupation of
the consumer
0.469 Accept Null
hypothesis
Income H06c- There is no significant
difference in the continued use of
mobile payment and income of the
consumer
0.177 Accept Null
hypothesis
Personal
innovativene
ss
H07c- There is no significant
difference in the continued use of
mobile payment and personal
innovativeness of the consumer
0.488 Accept Null
hypothesis
Results from above table shows, demographic factors age, qualification,
occupation, income and personal innovativeness had p-value 0.404, 0.596,
0.469, 0.177 and 0.488 respectively. Since the p-value is more than the
significance value 0.05, we reject the alternate hypothesis. This means that
age, qualification, occupation, income and personal innovativeness do not
impact continued use of mobile payment system for consumer. While,
demographics factors city and gender had p-value 0.023, and 0.020
respectively. Since the p-value is less than the significance value 0.05, we

301
reject the null hypothesis. This means that city and gender significantly impact
the continued use of mobile payments for consumer.
5.2.2.4 Results from independent sample T-test and ANOVA for
merchants
Table 5.4: Demographic factors affecting continued use of mobile
payment by merchants
Variables Hypothesis p value Accept/Reject
City
H013c-There is no significant
difference in the continued
use of mobile payment and
city
0.000 Reject null
hypothesis
Gender
H014c-There is no significant
difference in the continued
use of mobile payment and
gender
.348 Accept null
hypothesis
Age
H015c-There is no significant
difference in the continued
use of mobile payment and
age
.669 Accept Null
hypothesis
Educational
Qualification
H016c-There is no significant
difference in the continued
use of mobile payment and
educational qualification
0.056 Accept Null
hypothesis
Personal
innovativeness
H017c-There is no significant
difference in the continued
use of mobile payment and
personal innovativeness
0.005 Reject Null
hypothesis
Technology
Inclination
H018c-There is no significant
difference in the continued
use of mobile payment and
technology inclination
0.010 Reject Null
hypothesis

302
Results from the above table, demographic factors gender, age and
qualification had p-value 0.348, 0.669 and 0.060 respectively. Since the p-
value is more than the significance value 0.05, we accept the null hypothesis.
This means that gender, age and qualification do not impact continued use of
mobile payment system for merchants. While, demographics factors city,
personal innovativeness and technology inclination had p-value 0.000, 0.005,
and 0.010 respectively. Since the p-value is less than the significance value
0.05, we reject the null hypothesis. This means that city, personal
innovativeness and technology inclination significantly impact the continued
use of mobile payments for merchants.
5.2.3 Results of objective three
Objective three: To find the impact of other variables on the continued use of
mobile payment system
Statistical tools used- linear regression
Table 5.5: Linear Regression of Consumers
Standardized Coefficients Hypothesis
support
Model Beta t Sig.
(Constant) 2.451 .015
SI .201 3.691 .000 H110: supported
GOVT .153 2.815 .005 H112: supported
PU .272 4.513 .000 H18: supported
PEOU .141 2.235 .026 H19: supported
APP .171 3.082 .002 H111: supported
MODEL DETAILS
Adjusted R square= 0.563; F= 71.04 : Significance= 0.00

303
Linear regression was done where I will continue using mobile payment was
taken as the dependent variable and usefulness, ease of use, social influence,
application provider and government initiatives as the five independent
variables. The resultant model significantly predicted the continued use of
mobile payment system by the consumers explaining 56.3% of the total
varaiance. All the five variables were found to have a significant impact on the
dependent variable.
Table 5.6: Linear Regression of Merchants
Standardized Coefficients Hypothesis support
Model Beta t Sig.
(Constant) -3.087 .002
U .186 2.231 .027 H119: supported
CUST .267 4.311 .000 H120: supported
APP .327 5.174 .000 H121: supported
GOVT .274 3.471 .001 H122: supported
MODEL DETAILS
Adjusted R square= 0.622; F=54.85 : Significance=0.00
Linear regression was done where I will continue using mobile payment was
taken as the dependent variable and usability, consumer influence, application
provider and government initiatives as the four independent variables. The
resultant model significantly predicted the continued use of mobile payment
system by the merchants explaining 62.2% of the total varaiance. All the four
variables were found to have a significant impact on the continued use of
mobile payment.
5.2.4 Results of objective four
Objective four: To find out the obstacles faced by merchants and consumers
while using mobile payments.

304
Statistical tool used- Frequency
Result for consumers- Transaction failure and network failure were the most
common obstacles for the respondents of both the city with more than 50% of
the users facing these issues while accepting mobile payments.
Result for Merchants- Merchants of both the cities, prefer cash and card still to
mobile payments. They also feel that there is less demand for mobile
payments by the consumers group.
5.2.5 Reasons of the non users for not using mobile payment system
About 76% of consumers in Kolkata have installed mobile payment app in
their mobile phone but 72% are using, while 68% of consumers have installed
mobile payment app in Ranchi among which 64% are using it. So there is a
gap of about 4% in both the city. According to techARC DIGIT report, there
are some people who install app but never use it as they tend to install apps
without giving much thought about it.
Maximum non-using consumers are the one who are still convenient with cash
and card transactions. People are not using mobile payment because they are
not convenient with either using a mobile phone or using mobile payment
system, and finding mobile payment both useless and insecure. Further people
who have abandoned mobile payment found mobile payment complex, time
taking, insecure and useless. The feeling of insecurity among the non users is
very high in case of Ranchi consumers, whereas for Kolkata non users, mobile
payment is viewed as a complex procedure by majority of them. Most of the
non users, who abandoned it are not willing to use mobile payment even if
their issues get resolved.
Merchants too are mostly not using mobile payment due to their comfort with
cash. Charges involved and no consumer demand were also reasons for not
accepting mobile payment. Many merchants of Ranchi are not comfortable

305
with mobile payment, indicating a less tech-savvy population. Consumers
demand for mobile payment is much higher in Ranchi city than in Kolkata.
5.2.6 Summary of Findings and Comparison with previous research
findings
5.2.6.1 Summary of findings for Consumers and Merchants
Table 5.7: Summary of findings
Parameters Ranchi
Consumer
Kolkata
Consumer
Ranchi
Merchant Kolkata
Merchant Yes No Yes No Yes No Yes No
Awareness 90% 10% 92% 8% 95% 5% 99% 1%
Installation 68% 32% 76% 24% 68% 32% 80% 20%
Use 64% 36% 72% 28% 58% 42% 74% 26%
Feeling of
risk by users
38% 62% 32% 68% 28% 72% 14% 86%
Table 5.8: Summary of findings
Parameters Ranchi
customer
Kolkata
customer
Ranchi
merchant
Kolkata
merchant
Most preferred
payment mode Cash Cash Cash Cash
Least preferred
payment mode Credit card Net banking Net banking Net banking
Most used mobile
payment app PayTm PayTm PayTm PayTm
Obstacles faced
while using
Transaction
& Network
failure
Transaction
& Network
failure
Cash & cards
still preferred,
and less
customer
demand
Cash & cards
still preferred,
and less
customer
demand
Reason for not
using
Convenient
with cash
and card
Convenient
with cash
and card
Not
comfortable
with mobile
payment
Convenient
with cash and
card

306
5.2.6.2 Comparison of result with the previous literature findings
Table 5.9: Result comparison with previous literature findings for
consumers
Customer My findings Similar to Contradictory
to
demographic
variable of
consumer
with the
awareness
about mobile
payment
system
city, gender,
and
qualification
have no
significant
relationship
Sumathy & Vipin (2017)
for gender and
qualification.
Kesh (2017) for gender
Kesh (2017) for
qualification
Tiwari et al.,
2019 for gender
occupation,
age, income
and personal
innovativeness
have a
significant
relationship
Kesh (2017) for age &
occupation
Tiwari et al., 2019 for age
demographic
variable of
consumer
with use of
mobile
payment
system
there is no
relationship of
city,gender and
educational
qualification
Gender- mobile payment
(Kabata,2015; Hamza and
Shah,2015).Mobile
banking( Vanisree,2013)
Vanisree, 2013
for education.
there is
relationship
between age,
occupation,
income and
personal
innovativeness
Age- mobile banking
(Vanisree,2013: Ashoka
& Ramaprabha,2018) ; m-
wallet – (Kabata,2015;
Vasantha & Sarika.,
2019)
Occupation-( Ashoka &
Ramaprabha,2018)
Vanisree
(2013)regarding
income and
profession
Other factors
with
continued use
usefulness,
ease of use,
social
influence,
application
provider and
government
PU & PEOU- internet
banking (Yadav et al.,
2015); e- payment/ m-
payment (Sinha 2015;
Bailey et al. 2017;Roy,
2017; Roy & Sinha,
2017);
Social
influence- Roy
& Sinha, 2017;
Vasantha &
Sarika., 2019

307
initiatives
significantly
impact the
continued use
of mobile
payments for
consumers.
Social Influence- internet
banking (Yadav et al.,
2015); Mobile payments
(Thakur,2013;Phonthanuk
itithaworn et al.,2016)
Table 5.10: Result comparison with previous literature findings for
merchants
Merchant My findings Other researcher
relationship
between the use of
mobile payment
system and
demographic
variables
Gender, age, and technology
inclination for merchants has
no relationship with use
Use of mobile payment
systems for merchants has
significant association with
city, qualification and
personal innovativeness
Omotayo & Dahunsi,
2015 found no impact of
demographics on use of
mobile payments
Chogo and Sedoyeka,
2015, found age and
qualification impact the
use of m-payment.
Other factors with
continued use
All the independent variables
usability, consumer influence,
application provider and
government initiatives
significantly impact the
continued use of mobile
payments for merchants.
Otieno and Kahonge,
2014 supported the
impact of independent
variables on use of m-
payment
5.3 Managerial Implications and Suggestions
This research provides new dimensions in the mobile payment adoption
research where the focus is primarily on the actual awareness and usage of
mobile payment system with a comparative study within two cities with

308
different living standards, in India. Previous studies mostly focus on pre
adoption of mobile payment systems not the actual use or post adoption (Yu et
al., 2018). The geographical location selected for this study, i.e. Ranchi was
never considered for any research of such kind in the past. This study
presented the actual scenario of the mobile payment system of both cities and
problems faced while using it. This would help in the formulation of strategies
to boost mobile payments in the country and eliminate the obstacles in the
growth of mobile payment systems. This research studied government
initiatives which were new in the country so this can help in using this variable
for another context of technology continuance study. Also, this research has
worked on a major gap of not considering merchants in the mobile payment
study by taking both merchant and consumers for the study. This new
perspective could be used in the future in different contexts like mobile
banking.
This research included the study of characteristics of both merchants and
consumers and its impact on the usage of the mobile payment system. It is
very important for the consumers and merchants to accept mobile payments in
their lives for the vision of Digital India to come true. The more efficient and
technologically upgraded the society is, the more advanced the nation will
become. Also in this dynamic and evolving technological era, it is very
important to be up-to-date with the current technology so that the nation
should not be left behind in the race.
There is high level of awareness among both consumers and merchants but
usage among both consumers and merchants are not upto the awareness level
which means that though much of consumers and merchants are aware, all of
them are not using it. So there is a gap which needs to be addressed. Further,
significance percentage of merchant from both the city has abandoned the use
of mobile payment due to insecurity in Ranchi and it was considered as a
complex process for merchants of Kolkata.

309
As one of the most important factor affecting the continuance use of mobile
payment is usefulness for consumers, mobile payment service providers need
to advertise more on creating awareness about the benefits of the mobile
payment systems (F. Liebana- Cabanillas et al., 2017; Humbani and Weise,
2017) to capture the vast market.
5.3.1 Implications for the Service Providers
Both merchants and consumers feel that mobile payment is not widely
accepted and used in their cities so it is high time that service providers try to
capture both merchants and consumers simultaneously. Still, there is a tough
competition to the mobile payment systems by the traditional modes of
payment like cash and cards so mobile payment industry needs to work a lot
on their promotions. Also, as both merchant and consumer that use mobile
payment systems, showed trust in the service provider and do not find much
risk in the use of mobile payment, this is the right time to expand the market
with proper safe infrastructure to gain more trust.
These findings will help the mobile payment service providers companies to
efficiently make strategies for the retention, growth and expansion of m-
payments by solving the issues and making it penetrate well in the market,
after clearly understanding the reasons for acceptance and non –acceptance of
m-payments and why some people abandon the use of m-payments. Also as
PayTm was found to be the most accepted mobile payments among both
merchant and consumers group. PayTM is the most downloaded mobile
payment app (Regalix, 2018) and seventh most Indian downloaded application
among all kinds of apps (source: 42 matters). Also, PayTm has 50% of market
share of merchant, till Aug 2020 (source: yourstory). This will help the other
service providers to strategize their marketing plans and understand why still
PayTm is the king and what keeps them lagging behind.

310
5.3.2 Implications for Government, Regulatory bodies and Policy makers
As government initiative showed a positive impact on continuance of mobile
payments for both merchants and consumers, government should continue
creating awareness about the benefits of mobile payment systems for economy
and giving relaxation to both merchants and service providers to facilitate
wider acceptance of mobile payment systems. Also central government along
with the state government should work on better safe infrastructure for the
mobile payment system.
The study may be helpful to regulatory body and policy makers to create
confidence in customer regarding mobile payment system. With the help of
this study regulatory body can identify factors which play an important role in
adoption of payment system. RBI can look into more strict policies and
restriction on the mobile payment service providers to provide safe interface
for the users so that more people could be motivated to use it for daily
payments.
5.3.3 Implications for Merchants
This research provides thorough study about the reasons why consumers do
not use mobile payments and what are the problems faced by consumer while
making payments through mobile. These findings can help merchant group to
solve those issues at their end to enhance consumer’s payment process
experience.
5.3.4 Implications for Academic Institution
The study can also help the institutions to design the courses related to
technology used in financial services. Special course could be added in
institution for imparting digital literacy and mobile technology. Knowlegde
about mobile payments is important as mobile payment is the future of

311
FINTECH in India. One such course for students will bridge the gap we find
in the usage level of different tier cities so that each one is aware beforehand.
5.3.5 Implications for Researchers
This research study has several important implications. From a theoretical
perspective, the present study provides an important empirical step towards
understanding the adoption and uses of Mobile payment system.The findings
of this research bring out the significance of various factors which impact the
actual use of mobile payment system which were not tested before. Factors of
TAM Model and Government initiatives could be used as a starting point for
models to include various other factors that have not been tested or evaluated
before. Hence, the present study adds to the ongoing research on Mobile
payment system.
Suggestions
Following suggestion will lead to expansion and flourishing of m-payments
industry and thus help in better financial inclusion which is urged by the
present government to boost our economy.
All the stakeholders involved need to play their role in the upliftment
of the m-payments industry and try out ways to promote m-payments
to boost the economy. Vigorous promotion of m-payments is needed
by not only the government but also the m-payment service providers
including the independent third party, banks, mobile network service
providers. The finding of the research suggests that there is quite
awareness about mobile payment system in both cities but the use is
limited. The proper advertisement should be done and awareness
should be created of the benefits of using m-payment and its impact on

312
boosting the economy. The awareness about the benefits of m-
payments to the low income people and older people should be made
and they should be further encouraged and provided with extra offers
as these group are less using the mobile payment systems in
comparison to the other groups.
Network failure was found to be a major obstacle in this study,
therefore, government and mobile network operators should strive to
provide a secure and efficient infrastructure for m-payments.
Transaction cost was a hindrance for few merchants so government
and mobile network service providers should also make efforts to
minimize it. Poor internet facility was further thought as a barrier by
few people which is supported by Shukla, 2017 where he found that
poor internet connectivity was major hinderance for m-payments
success, so there is a need for strong secure and free wi-fi availability
everywhere from big cities to small towns. Internet provider should
work on their servers to give high-speed internet at every place.
As maximum consumers feel that there is less encouragement from
their merchants to use m-payments, more and more Merchants should
be brought on board by the service provider and government because
m-payment adoption is a two-way process. The more the merchant will
adopt more the consumer will. M-payments should be accepted by
every Kirana shop and Pan shops. Also, the merchant should take up
the responsibility in uplifting the economy and encourage the
consumers to use M-payments. Whereas the consumer too should opt
for M-payments and demand M-payment platform from the merchants.

313
Application service providers and payment gateways (e.g. Visa,
RuPay) should try to make the transactions safe and secure for the
user. They should call for immediate and successful transaction from
their end to avoid multiple drops of transactions.
The merchants who deal in heavy amount of transactions like
electronics etc. do not accept mobile payment. So, this implies that
mobile service providers should encourage and motivate merchants
and consumers to opt mobile payment for heavy transactions also.
Also, cashback and coupons were seen as a positive construct for use
of mobile payment, so the mobile payment service provider can
continue giving such lucrative offers to sustain their consumers and
add on new consumers too. Also, the daily transaction limit was
concern for the merchants and therefore government should push the
limit to high so the larger amount transaction can be made through m-
payments.
In the future there can be the creation of one single solution m-
payments where people will not have to download multiples of
payment apps as this research study found out that consumers need
cross wallet transfer.
5.4 Limitations & Future Scope
5.4.1Limitations of the research
While this research was a new of its kind it also has multiple limitations which
need to be mentioned below to provide fruitful avenues for future research.

314
First and foremost the researcher studied the acceptance of mobile payments
by two most vital elements for the prosperity of mobile payments industry
among the various players of mobile payments ecosystem i.e, merchant and
consumer which bring in the limitation of not considering the other elements
of the ecosystem like mobile payment service providers, mobile network
operators, financial institution, govt etc.
Second limitation was that this study has focused on detail study for users
while only few questions were asked to the non users therefore non users are
not much explored in this study which brings in another limitation.
Thirdly, another limitation is that India though being home of many cities this
study was conducted within geographical boundaries of only two capital cities
of two states of India. The results may vary if larger geographical area is
considered. Also, total sample size of the respondent was taken as 600, which
is very less to generalise the vast population of both the cities.
Fourth limitation was with the sampling technique used which was
convenience sampling which further adds to the limitation of this research.
The research has been carried considering only smart phone as a mobile
payment option, and not normal feature phones and any other PDAs. Also,
time frame of data collection is another limitation as there may be variations in
the finding due to changes made after the data collection period in the mobile
payment industry. As after 2018 many changes have taken place in this
industry such as new entrants in mobile payment providers, conversion of
wallets to UPI, change in KYC rules, increased relaxation for merchants,
recent COVID pandemic etc. Also this research lacked development of
theoretical model which the researchers are working on currently.
5.4.2 Future Recommendations
This study has primarily focused on dual aspects of mobile payment systems
and two parties of the mobile payment ecosystem i.e. merchants and consumer
providing a valuable insight about the merchants and consumers acceptance in
the Indian context. The findings can be used as a foundation for such type of

315
research in future. In future researcher could further explore various
stakeholders of mobile payments together in the Indian context.
Also, comparison study could be made upon more than 2 states and cities in
India to get a broader generalized picture about the acceptance of mobile
payments system. Moreover rural and urban areas could also be compared to
understand the penetration of mobile payment. Mobile payments can be
studied in multi countries in same continent or different continents with
different cultures and city.
The future researcher could also study and compare various technologies used
in mobile payment simultaneously and various m-payments available in
market.
The future study could be done focusing on the non users, with detailed study
in this field. Also a comparative study can be done among the challenges and
issues faced by both users and non users regarding mobile payments.
Data could be collected in different times and pos scenarios in the future and
assessed to understand if there is an impact of different scenarios like busy pos
or no busy pos and long queues at pos or short queues at pos.
Also different types of merchants like small, medium, big enterprises can be
considered for future study and compared for acceptance level of mobile
payment systems.
Also the recent pandemic COVID became a blessing in disguise for mobile
payments where people feared use of cash and cards. So, a fresh study can be
done to study the impact of COVID on mobile payment industry. Also,
comparison can be done between the scenario of post and pre COVID
pandemic.
5.5 Conclusion
Mobile payment industry has witnessed a lot of transformation in the last two
decades. A lot of reforms came in last five years from launch of UPI to
demonetization, lowering of MDR charges to making it zero for UPI.

316
Government has tried hard to educate people about benefits of going cashless
and digital through its various tutorials, awareness programmess. RBI too
through its campaigns such as UPI chalega etc has promoted mobile payments.
Further reform in its ecosystem with cheaper internet plans to cheaper
smartphones, have all made a favourable scenario for this industry to blossom.
Mobile payment service providers are competing with each other by luring
customers with offers and discounts of all kinds. Also they are trying hard in
getting merchants on board. PayTm which was king till 2018 is getting tough
competition from Google Pay in customer segments and PhonePe in
merchants segments. Recently Whatsapp too have launced its mobile
payments which may become a big threat to all existing players as the kind of
popularity it has among Indians.
Consumers have accepted the benefits of mobile payments and are using it for
many things such as payment for utilities to payment of shopping,
entertainments, mobile recharge, shopping etc. These days mobile payments
have come up with various other options than just payments such as mutual
fund investments with freecharge, PayTm has opened its payment bank, offers
digital gold, insurance, shopping, investments etc. So there are yet lots of
opportunities to be catered by this industry in near future from just a payment
service provider.
The most important reasons for using mobile payment among consumers were
easy to use and quicker payment option. Getting cashbacks and giving support
to cashless India also were found to be the reasons of usage. Moreover,
merchant uses mobile payment system as their customers demand for such
payments. Also they find it easy to adopt and transferring money through it is
easy.
For consumers, demographic factors such as gender and educational
qualification has no influence on the awareness and use of mobile payment
317
system whereas it was found that people above the age of 60 are less aware
and thus are less using the mobile payments. The one who are not much
technically inclined are also not using mobile payment much. People with
monthly income below rs 10000 and unemployed are also among the less
users. So, these sections of people should be targeted and utility of mobile
payments should be explained to them. Merchants of both gender, all age
groups and with any type of educational qualification are well aware about
mobile payment but the one with lower degree than intermediate are less using
it. Service providers should target the merchants who are not that educated and
make them aware about the benefits of using mobile payments for their
business and society. Further it was found out that consumers of both cities are
equally aware about mobile payment system and using it but in case of
merchants though there is no difference in the awareness level about mobile
payments within the cities but there is significance difference in the use of
mobile payments by merchants of both the city where Ranchi merchants are
less using it. Therefore, Ranchi merchants need to be focused more by the
service providers.
Also all the other variables like usefulness, ease of use, social influence,
government initiatives, application providers were found to have strong
influence on the continuance use of mobile payments by consumers.
Usefulness and social influence were the strongest predictors among all five
variables. For merchants, consumer influence and application provider were
the strongest predictors of continued use mobile payment systems, followed
by government initiatives and usability.
Both merchants and consumers have shown trust in their application
proveiders and majority of them do not find risk in using mobile payments.
Also maximum people keep their wallet preloaded which is further sign of
trust on their app providers. Major hinderance is regarding the network failure
and transaction failure so the service providers have to collaborate well with

318
the telecom providers to solve these issues and provide hassle free transactions
to the users. Inspite of all benefits mobile payment offer and the fact that the
users trust their mobile payment service providers, cash still is the ruler
because of the habit, ease and free from technical glitches. Therefore, it is
important for the other payment methods to cope up with cash.
It is understood from this research that mobile payment is a known
terminology for Indians and people have also accepted itfor daily payments.
Further as mobile phones are the new habit and lifestyle of people, mobile
payments can be expected to grow exponentially in coming future. Mobile
payment has proved to be a savior in tough times like demonetization in past
and COVID recently. ATM cash withdrawals have withnessed a drop after the
hit of COVID and there has been a tremendous increase in the UPI
transactions since then. According to Business standard UPI volume has
almost doubled since last year. So, its high time mobile payment service
provider should utilize these opportunity and make mobile payment part and
parcel of everybody’s life. Also its important for all players of the mobile
payment ecosystem to join hands and play their part and create not only the
awareness but educate people how to operate such payment system along with
its utilities for both people and economy.

319
BIBLIOGRAPHY

320
Books
1. Malhotra, N. K., & Dash, S., (2011) Marketing Research, An Applied
Orientation. 6th Edition, Pearson, India.
2. Kothari, C.R. & Garg, G. (2014). Research Methodology: Methods and
Techniques (3rd edition). New Delhi: New Age International (P) Ltd.
E-Books
3. Bhattacherjee, Anol. (2012). Social Science Research: Principles,
Methods, and Practices Textbooks Collection. Book3
4. Creswell, J. W. (2009). Research Design: Qualitative and Quantitative
Approaches (Second Edition). Thousand Oaks, CA, USA: SAGE
Publications Inc.
5. Creswell, J. W. (2014) Research design: qualitative, quantitative and
mixed methods approaches (fourth edititon). Sage publications,
6. Mack, N., Woodsong, C., MacQueen, K.M., Guest, G., & Namey, E.,
(2005), Qualitative Research Methods: A Data Collector’s Field Guide.
ISBN: 0-939704-98-6.
7. Pallant, J. (2005). SPSS survival manual: a step by step guide to data
analysis using SPSS. Allen & Unwin Publication
8. Turowski, K., & Pousttchi, K. (2004). Mobile Commerce: Basics and
Techniques. (Mobile Commerce: Grundlagen und Techniken),
Springer, Heidelberg, Germany.
9. Rogers, E. M. (2010).Diffusion of innovations (4th ed.). Simon and
Schuster.
Ph. D Thesis
321
1. Abadzhmarinova, R.S. (2014). Exploring the effect of speed of
purchase on consumers’ intention to adopt NFC mobile payments,
Copenhagen Business School.
2. Ahrenstedt, S., Huang, J., & Wollny, L. (2015). A study on factors
influencing the acceptance of mobile payment applications in Sweden.
Jonkoping University.
3. Au, Y.A.., & Zafar, H. (2008). A Multi-Country Assessment of
Mobile Payment Adoption. UTSA College of Business Working Paper
Series.
4. Kesh, S.P. (2017). Usage of Plastic Money and Virtual Wallet as
Modes of Payments in and around Bengaluru City. ICFAI University
Jharkhand Ranchi.
5. Hampshire, C. (2016). Exploring UK consumer perceptions of mobile
payments using smart phones and contactless consumer devices
through an extended technology adoption model. (Doctoral
dissertation). University of Chester, United Kingdom.
6. Luna, I.R., (2017). Mobile payments at the point of sale: Key issues,
perspectives and guidelines for future users adoption, University of
Granada
7. Shaw, B. (2018). Moderating Effects of Situational Variable and
Smartphone Addiction on the Factors Influencing Consumers’
Intention to Continued Use of Mobile Payment Services in India.
ICFAI Foundation for Higher Education, Hyderabad.
8. Sidek, N. (2015). Determinants of Electronic Payment Adoption in
Malaysia: The Stakeholders’ Perspectives. The University of
Queensland, School of Agriculture and Food Science.

322
9. Thoi, M. (2016). Exploring merchants’ adoption of mobile payments:
A qualitative study on Swedish merchants’ perspectives. University of
Gothenburg, Sweden.
Conferences
1. Ahsan, A., Chang, V., & Issa, T. (2012). Community Perception of
Mobile Payment ine-Government Services.23rd Australasian
Conference on Information Systems. 3-5 Dec 2012, Geelong.
2. Amoroso, D. L. (2010). Mobile Payment Industry: Toward a
Comprehensive Research Model, Annual Conference of Japan
Society for Management Information 2010 Autumn.
3. Andreev, P., Duane, A., and O’Reilly, P., (2011). Conceptualising
consumer perceptions of contactless m-payments through smart
phones. International Federation for Information Processing: IFIP
WG8.2.
4. Aydin, G., and Burnaz, S. (2016). Innovativeness Impact on Attitude
Development Towards Mobile Payment Applications. Conference
Paper, 204-211.
5. Chen, J.J., & Adams, C. (2005). User Acceptance of Mobile
Payments: A Theoretical Model for Mobile Payments. Proceedings
of the Fifth International Conference on Electronic Business, 619 -
624.
6. Dahlberg, T., & Mallat, N. (2002). Mobile Payment Service
Development- Managerial Implications of Consumer Value
Perceptions, ECIS. 649-657.
7. Dahlberg, T., & Oorni, A. (2006). Understanding Changes in
Consumer Payment Habits- Do Mobile Payments Attract

323
Consumers? Proceedings of Helsinki Mobility Roundtable.
Sprouts: Working Papers on Information Systems, 6(36).
8. Dahlberg, T., & Oorni, A., (2007). Understanding changes in
consumer payment habits: Do mobile payments and electronic
invoices attract consumers? In: Proceedings of the 40th Annual
Hawaii International Conference on System Sciences. 1-10.
9. Dai, H., Singh, R., & Iyer, L. (2007). Intention to Use Mobile
Commerce: A Demographic Analysis of the Chinese Market.
AMCIS 2007 Proceedings. 263.
10. Diniz, E.H., Albuquerque, J.P., & Cernev, A.K. (2011). Mobile
Money and Payment: a literature review based on academic and
practitioner-oriented publications (2001-2011). Proceedings of SIG
GlobDev Fourth Annual Workshop, Shanghai, China.
11. Gan, C. (2016). The Impact of Use Context on Mobile Payment
User Adoption: An Empirical Study in China. The Fifteenth Wuhan
International Conference on E-Business-Mobile Technologies
and Ubiquitous Services Proceedings, 31, 264-271.
12. Harris, M A., Chin, A. G., & Beasley, J. (2019). Mobile Payment
Adoption: An Empirical Review and Opportunities For Future
Research. Proceedings of the Southern Association for Information
Systems Conference, St. Simon’s, Island, GA, USA March 22nd–
23rd, 2019, 1-6.
13. Heijden, H. (2002). Factors Affecting the Successful Introduction
of Mobile Payment Systems. 15th Bled Electronic Commerce
Conference Reality: Constructing the eEconomy Bled, Slovenia.

324
14. Hu, X., Li, W., & Hu, Q. (2008). Are Mobile Payment and
Banking the Killer Apps for Mobile Commerce? Proceedings of
the 41st Annual Hawaii International Conference on System
Sciences (HICSS 2008).
15. Jinkyung, H. (2018). Consumer valuation of Fintech: The case of
Mobile Payment in Korea. 22nd Biennial Conference of the
International Telecommunications Society (ITS): "Beyond the
Boundaries: Challenges for Business, Policy and Society", Seoul,
Korea, 24th-27th June, 2018, International Telecommunications
Society (ITS), Calgary.
16. Karsen, M., Chandra, Y. U., & Juwitasary, H. (2019)
Technological Factors of Mobile Payment: A Systematic Literature
Review.4th International Conference on Computer Science and
Computational Intelligence 2019 (ICCSCI), 12–13 September.
17. Krueger, M. (2001). The future of m-payments – business options
and policy issues. Electronic Payment Systems Observatory (ePSO)
Institute for Prospective Technological Studies.
18. Kurnia, S. & Ali, M. (2012). B2B e-commerce adoption by the
grocery industry in developing countries: Indonesia versus Bahrain.
Paper presented at System Science (HICSS) 45th Hawaii
International Conference on. 4-7 Jan. 2012.
19. Lai, P.M., & Chuah, K.B. (2010). Developing an Analytical
Framework for Mobile Payments Adoption in Retailing:A Supply-
Side Perspective. International Conference on Management of e-
Commerce and e-Government, 356-361.

325
20. Li, H., Liu, Y. and Heikkila, J. (2014). Understanding the factors
driving NFC-enabled mobile payment adoption: An empirical
investigation. Pacific Asia Conference on Information Systems
(PACIS) 2014 Proceedings, 231.
21. Mallat, N. (2006). Exploring Consumer Adoption of Mobile
Payments – A Qualitative Study. Proceedings of Helsinki Mobility
Roundtable. Sprouts: Working Papers on Information Systems,
6(44).
22. Ondrus, J., Lyytinen, K., & Pigneur, Y. (2009). Why mobile
payments fail? towards a dynamic and multi-perspective
explanation. In: Proceedings of the 42nd Annual Hawaii
International Conference on System Sciences (HICSS). IEEE
Computer Society Press, Washington, DC.
23. Pal, D., Vanijja, D., & Papasratorn, B. (2015). An Empirical
Analysis towards the Adoption of NFC Mobile Payment System by
the End User. The 7th International Conference on Advances in
Information Technology, Procedia Computer Science 69 (2015) 13
– 25.
24. Petrova, K., & Mehra, R. (2010). Mobile Payment: An Exploratory
Study of Consumer Attitudes. Wireless and Mobile
Communications (ICWMC), 2010 6th International Conference.
25. Pham, T. T. T., & Ho, J. C. (2015, July). What are the core drivers
in consumer adoption of NFC-based mobile payments?: A
proposed research framework. In Management of engineering &
technology (PICMET), Portland International Conference on,
3041-3049.

326
26. Pousttchi, K. (2003). Conditions for acceptance and usage of
mobile payment procedures. In proceedings of the Second
International Conference on Mobile Business (mBusiness). 201-
210.
27. Pousttchi, K., & Schurig, M. (2004). Assessment of today’s mobile
banking applications from the view of consumer requirements.
Proceedings of the 37th Annual Hawaii International Conference
on System Sciences. IEEE, 1-10.
28. Pousttchi, K., & Wiedemann, D. G. (2007). What Influences
Consumers’ Intention to Use Mobile Payments. LA Global
Mobility Round table.
29. Resendiz, R.M. (2017). The role of payment systems and services
in financial inclusion – the Latin American and Caribbean
perspective. IFC Satellite Seminar.
30. Rogers, E.M. (2002). Diffusion of preventive innovations.
Addictions 2002 Conference on Integrating Substance Abuse
Treatment and Prevention in the Community, Eindhoven, The
Netherlands, September 15–17.
31. Sahu, G., & Singh. N. K. (2017). Paradigm Shift of Indian Cash-
Based Economy to Cash-Less Economy: A Study on Allahabad
City. 16th Conference on e-Business, e-Services and e-Society
(I3E), 453-461.
32. Satinder & Niharika, (2015). The Impact of Mobile Commerce In
India: A SWOT Analysis. 2nd International Conference on
Science, Technology and Management, New Delhi. 2503-2513.

327
33. Shaw, N. & Sergueeva, K., (2016). Convenient or Useful?.
Consumer Adoption of Smartphones for Mobile Commerce. DIGIT
2016 Proceedings.
34. Shaw, N. (2015). Younger Persons are More Likely to Adopt the
Mobile Wallet than Older Persons, or are they? The Moderating
Role of Age. Twenty-first Americas Conference on Information
Systems, Puerto Rico, 1-15.
35. Tiwari, P., Garg, V., & Singhal, A. (2019). A study of Consumer
adoption of Digital Wallet special Reference to NCR. 9th
International Conference on Cloud Computing, Data Science &
Engineering (Confluence) IEEE 2019, 664-669
36. Tiwari, R., Buse, S., & Herstatt, C.H. (2007). Mobile services in
banking sector: the role of innovative business solutions in
generating competitive advantage. Proceedings of the International
Res Conference on Quality, Innovation and Knowledge
Management. New Delhi; 200, 886–94.
37. Williams, M., Rana, N., Dwivedi, Y. & Lal, B. (2011). Is UTAUT
really used or just cited for the sake of it? A systematic review of
citations of UTAUT’s originating articles. ECIS 2011 Proceedings.
231. https://aisel.aisnet.org/ecis2011/231.
38. Yeh, M.L., & Tseng, Y.L. (2017). The College Students’ Behavior
Intention of Using Mobile Payments In Taiwan: An Exploratory
Research. Proceedings of IASTEM International Conference,
Singapore, January 2017.
39. Zhong, J. (2009). A comparison of mobile payment procedures in
Finnish and Chinese markets. Proceedings of the 22nd Bled

328
eConference eEnablement: Facilitating an Open, Effective and
Representative eSociety, Bled.
Journals/Articles
40. Abayomi, A. C., Olabode, A.C., Reyad, M. A. H., Teye, E.T., Haq,
M. N, & Mensah, E. T. (2019). Effects of Demographic Factors on
Consumers’ Mobile Banking Services Adoption in Nigeria.
International Journal of Business and Social Science, 10(1), 63-71.
41. Ajzen, I. (1991).The theory of planned behavior.Organisational
Behaviour and Human Decision Process, 50(2), 179-211.
42. Alafeef, M., Singh, D., & Ahmad, K. (2011). Influence of
demographic factors on the adoption level of mobile banking
applications in Jordan.Research Journal of Applied Sciences, 6(6),
373-377.
43. de Albuquerque, J.P., Diniz, E.H., & Cernev, A.K.(2016). Mobile
payments: a scoping study of the literature and issues for future
research. Information Development, 32(3), 527-553.
44. Anthony, D., & Mutalemwa, D. K. (2014). Factors influencing the
Use of Mobile Payments in Tanzania: Insights from Zantel’s Z-
pesa services. The Journal of Language, Technology &
Entrepreneurship in Africa, 5(2), 69-90.
45. Arun, T., & Kamath, R. (2015). Financial inclusion: Policies and
practices. IIMB Management Review, 27(4), 267-287.

329
46. Arvidsson, N. (2014). Consumer attitudes on mobile payment
services – results from a proof of concept test. International
Journal of Bank Marketing, 32 (2), 150-170.
47. Ashoka, M.L., & Ramaprabha, D. (2018). A study of tam model in
the usage of mobile banking services. International Journal of
Advanced Research and Development, 3(1), 109-113.
48. Au, Y. A., & Kauffman, R. J. (2008). The economics of mobile
payments: Understanding stakeholder issues for an emerging
financial technology application. Electronic Commerce Research
and Applications, 7 (2), 141–164.
49. Aydin, G., & Burnaz, S. (2016). Adoption of Mobile Payment
Systems: A Study On Mobile Wallets. Journal of Business,
Economics and Finance, 5(1), 73-92.
50. Bailey, A. A., Pentina, I., Mishra, A. S., & Mimoun, M. S. B.
(2017). Mobile payments adoption by US consumers: an extended
TAM. International Journal of Retail & Distribution Management,
45 (6), 1-17.
51. Balachandran, D., & Tan, G-W-H. (2015). Regression modelling
of predicting NFC mobile payment adoption in Malaysia.
International Journal Modelling in Operations Management, 5(2),
100–116.
52. Barutcu, S. (2008). Consumers’ attitudes towards mobile
marketing and mobile commerce in consumer markets. Ege
Academic Review, 8 (1), 15–32.
53. Begonha, D.B., Hoffmann, A., & Melin, P. (2002). M-Payments:
Hang up, try again. Credit Card Management, 15(4), 40-44.

330
54. De Bel, J., & Gâza, M. (2011). Mobile Payments 2012 - My
mobile, my wallet? Innopay. Version 1.01.
55. Bezhovski, Z. (2016). The Future of the Mobile Payment as
Electronic Payment System. European Journal of Business and
Management, 8(8), 127-132.
56. Bourreau, M., & Verdier, M. (2010). Cooperation for Innovation
in Payment Systems: The Case of Mobile Payments.
Communications & strategies, 79(3), 95-113
57. Brahmbhatt, M. (2018). A Study on Consumers' Perception
towards E-Wallets in Ahmedabad City, IUJ Journal of
Management. 6(1), 11-15
58. Burhan, U. I. K., Olanrewaju, R. F., Baba, A. M., Langoo, A. A., &
Assad., S. (2017). A Compendious Study of Online Payment
Systems: Past Developments, Present Impact, and Future
Considerations. International Journal of Advanced Computer
Science and Applications, 8(5), 256-271.
59. Burke, R.R. (2002).Technology and the Consumer Interface: What
Consumers Want in the Physical and Virtual Store.Journal of the
Academy of Marketing Science, 30(4), 411-432.
60. Cabanillas, F.L., Luna, I. R., & Ríos, F. M. (2017). Intention to use
new mobile payment systems: a comparative analysis of SMS and
NFC payments. Economic Research-Ekonomska Istraživanja,
30(1), 892-910.
61. Cabanillas, F. L., Leiva, F.M., & Fernández, J.S. (2017).
Examining Merchants’ Refusal to Adopt Mobile Payment Systems
in Spain. Intech, 113-136.

331
62. Carr, M. (2007). Mobile Payment Systems and Services: An
Introduction. In Mobile Payment Forum, 1-12.
63. Chale, P.R., & Mbamba, U. (2014). The Role of Mobile Money
Services on Growth of Small and Medium Enterprises in
Tanzania: Evidence from Kinondoni District in Dar Es Salaam
Region. Business Management Review, 17, 81-96.
64. Chandrasekhar, U., & Nandagopal, R. (2013). Mobile Payments At
Retail Point Of Sale - An Indian Perspective. Life Science Journal
2013, 10(2).2684- 2688.
65. Chandra, S., Srivastava, S.C., & Theng, Y. L. (2010). Evaluating
the Role of Trust in Consumer Adoption of Mobile Payment
Systems: An Empirical Analysis. Communications of the
Association for Information Systems, 27(1), 561-588.
66. Chan, F., & Chong, Y. (2013). Analysis of the determinants of
consumers’ m-commerce usage activities. Emerald Group
Publishing Limited, Online Information Review, 37(3), 441–466.
67. Chen, L., & Nath, R. (2008). Determinants of Mobile Payments:
An Empirical Analysis. Journal of International Technology and
Information Management, 17(1), 9-20.
68. Cheong, J., & Park. M. (2005). Mobile Internet acceptance in
Korea. Internet Research, 15 (2), 125–140.
69. Chogo, P.J., & Sedoyeka, E. (2015). Exploring Factors Affecting
Mobile Money Adoption in Tanzania. International Journal of
Computing and ICT Research, 8(2), 53-64.

332
70. Chong, S.C., Tan, K.S., Lin, B., & Eze, U.C. (2010). Internet-based
ICT adoption among SMEs Demographic versus benefits, barriers,
and adoption intention. Journal of Enterprise Information
Management, 23(1), 27-55.
71. Choudrie, J., & Dwivedi, Y. K. (2005). Investigating the research
approaches for examining technology adoption issues. Journal of
Research Practice, 1(1), D1: 1-12.
72. Cliquet, G., Picot-Coupey, K., Hure, E., & Gahinet, M. (2014).
Shopping with a Smartphone: A French-Japanese Perspective.
Marketing ZFP, 36(2), 96 – 106.
73. Cracknell, D. (2004). Electronic banking for the poor- panacea,
potential and pitfalls. Small Enterprise Development, 15(4), 8-24.
74. Crowe, M., Rysman, M., & Stavins, J.(2010). Mobile Payments at
the retail point of sale in the United States: Prospects for adoption.
Review of Network Economics, 9(4), Art.2.
75. Dahlberg, T., Guo, J., & Ondrus, J.(2015). A critical review of
mobile payment research. Electronic Commerce Research and
Applications, 14(5), 265-284.
76. Dahlberg, T., Mallat, N., Ondrus, J., & Zmijewska, A. (2007). Past,
present and future of mobile payments research: A literature
review.Electron. Comm. Res. Appl, 10(10),16-21.
77. Dahlberg, T., Mallat, N., Ondrus, J., & Zmijewska, A. (2008).
Mobile Payment Market and Research - Past, Present and Future.
All Sprouts Content. 6(48), 1-16.
78. Dai, H., & Palvia, P. C. (2009). Mobile Commerce Adoption in
China and the United States: A Cross-CulturalStudy. The DATA
BASE for Advances in Information Systems, 40(4), 43-61.

333
79. Dash, M., Bibhuti, B., & Samal, S. (2014). Determinants of
Consumers’ Adoption of Mobile Banking: An Empirical Study by
Intergrating Diffusion of Innovation with Attitude. Journal of
Internet Banking and Commerce, 19(3), 1-21.
80. Davis, F. (1989). Perceived usefulness, perceived ease of use, and
User Acceptance of Information Technology. MIS Quarterly,
13(3), 319–340.
81. Davis, F. D., Bagozzi, R. P., & Warshaw, P. R. (1989). User
acceptance of computer technology: a comparison of two
theoretical models. Manage. Sci., 35(8), 982–1003.
82. Dennehy, D. & Sammon, D. (2015). Trends in mobile payments
research: A literature review. Journal of Innovation Management,
3(1). 49-61
83. Deutskens, E., Ruyter, K., Wetzels, M, & Oosterveld, P. (2004).
Response rate and response quality of internet-based surveys: An
experimental study. Marketing Letters, 15(1), 21-36
84. Dewan, S. G., & Chen, L. D. (2005). Mobile payment adoption in
the US: A cross-industry, cross-platform solution, Journal of
Information Privacy and Security, 1(2), 4-28.
85. Donner, J.,& Tellez, C.A. (2008). Mobile banking and economic
development: Linking adoption, impact, and use. Asian Journal of
Communication, 18 (4), 318-322.
86. Dr. S. Manikandan., & J.Mary Jayakodi. (2017). An Emprical
Study On Consumers Adoption of Mobile Wallet with Special
334
Reference to Chennai City.International Journal of Research-
Granthaalayah, 5(5), 107-115.
87. Duane, A., O’Reilly, P., & Andreev, P. (2014). Realising M-
Payments: modelling consumers' willingness to M-pay using Smart
Phones. Behaviour & Information Technology, 33(4), 318-334.
88. Eswaran, K.K. (2019). Consumer Perception Towards Digital
Payment Mode with Special Reference to Digital Wallets.
Research Explorer-A Blind Review & Refereed Quarterly
International Journal, 5(22), 13-20.
89. Falke, O., Rukzio, E., Dietz, U., Holleis, P., and Schmidt, A.,
Mobile Services for Near Field Communication. Technical Report,
Ludwig-Maximilians-Universität (LMU) Munich, Germany, March
2007, LMU-MI-2007-1, ISSN 1862-5207.
90. Foroughi, B., Iranmanesh, M., & Hyun, S.S. (2019). Understanding
the determinants of mobile banking continuance usage intention.
Journal of Enterprise Information Management, 32(6), 1015-1033.
91. Gallardo, R. K., Olanie, A., Ordóñez R., & Ostrom M. (2015). The
Use of Electronic Payment Machines at Farmers Markets: Results
from a Choice Experiment Study.International Food and
Agribusiness Management Review, 18(1), 79-102.
92. Ghezzi, A, Renga, F, Balocco, R & Pescetto, P. (2010). Mobile
payment applications: offer state of the art in the Italian market.
info, 12(5), 3-22.

335
93. Goundar, S. (2012). Cloud Computing: Understanding the
Technology before Getting “Clouded”. In Recent Progress in Data
Engineering and Internet Technology, 217-222.
94. Goyal, V., Pandey U.S., & Batra, S. (2012).Mobile banking in
India: Practices, Challenges and security issues, International
Journal of Advanced Trends in Computer Science and
Engineering, 1(2), 56-64.
95. Gupta, R., Gupta, B.M., & Kumar, A. (2017). Mobile Payment
Research: A Scientometric Assessment of Global Publications
Output during 2007-16. International Journal of Information
Dissemination and Technology, 7(2). 110-115.
96. Grover, V. K. (2015). Research Approach: An Overview. Golden
Research Thought, 4(8), 1-8.
97. Guo, J., & Bouwman, H. (2015).An analytical framework for an
m-payment ecosystem: A merchants' perspective.
Telecommunications Policy Elsevier, 40(2), 147–167.
98. Hamza, A., & Shah, A. (2014). Gender and Mobile Payment
System Adoption among Students of Tertiary Institutions in
Nigeria. International Journal of Business and Management, 3(1),
13-20.
99. Hanafizadeh, P., Keating, B. W., & Khedmatgozar, H. R. (2013) A
systematic review of Internet banking adoption. Telematics and
Informatics, 31(3), 492-510.

336
100. Hayashi, F. (2012). Mobile Payments: What’s in It for
Consumers? Federal Reserve Bank Of Kansas City,Economic
Review, 97( 1), 35-66.
101. Hayashi, F., & Bradford, T. (2014). Mobile Payments:
Merchants’ Perspectives. Federal Reserve Bank of Kansas City,
Economic Review, Q2, 5-30.
102. Humbani, M., &Wiese, M. (2018). A Cashless Society for All:
Determining Consumers’ Readiness to Adopt Mobile Payment
Services. Journal of African Business, 19(3), 409-429.
103. Im, I., Hong, S., & Kang, M. S. (2011). An international
comparison of technology adoption: Testing the UTAUT
model.Information & Management, 48(1), 1-8.
104. Islam, M.A., Khan, M.A., Ramayah, T., & Hossain, M. M.
(2011). The Adoption of Mobile Commerce Service among
Employed Mobile Phone Users in Bangladesh: Self-efficacy as A
Moderator. International Business Research, 4(2), 80-89.
105. Islam, M. M. (2016). An Investigation of Drivers and Barriers
Stimulating in the Acceptance of Mobile Payment in Bangladesh.
Universal Journal of Industrial and Business Management, 4(4),
104-113.
106. Ivatury, G., & Mas, I. (2008). The early experience with
branchless banking. CGAP Focus Note, (46), 1-16.
107. Jain, P., & Singhal, S. (2019). Digital Wallet Adoption: A
Literature Review. International Journal of Management Studies,
6(1), 1-11.
337
108. Jaradat, M. I. R. M., &. Faqih, K. M. S. (2014). Investigating the
Moderating Effects of Gender and Self-Efficacy in the Context of
Mobile Payment Adoption: A Developing Country Perspective.
International Journal of Business and Management, 9(11), 147-
169.
109. Jeong, B. K., & Yoon, T. E. (2013). An empirical investigation on
consumer acceptance of mobile banking services. Business and
Management Research, 2(1), 31-40.
110. Kabata, D. (2015). Determinants of mobile payment use by
consumers in Kenya. International Journal of Computer
Applications & Information Technology, 8(1), 152–159.
111. Kapoor, K., Dwivedi, Y.K., & Williams, M.D. (2013). Role of
Innovation Attributes in Explaining the Adoption Intention for the
Interbank Mobile Payment Service in an Indian Context. Berlin
Heidelberg: Springer, 203–220.
112. Kapoor, K., Dwivedi, Y. & Williams, M. D. (2015). Examining
the role of three sets of innovation attributes for determining
adoption of the interbank mobile payment service. Information
Systems Frontiers, 17(5), 1039-1056.
113. Karnouskos, S. & Fokus, F. (2004).Mobile Payment: A Journey
Through Existing Procedures And Standardization Initiatives.
IEEE Communications Surveys & Tutorials, 6(4), 44-66.
114. Karnouskos, S., & András Vilmos, A., Universal Approach to
Mobile Payments. Mobile Computing: Concepts, Methodologies,
Tools, and Applications, Pages: 9 DOI: 10.4018/978-1-60566-054-
7.ch182

338
115. de Kerviler, G., Demoulin, N.T.M., & Zidda, P. (2016). Adoption
of in-store mobile payment: Are perceived risk and convenience
the only drivers? Journal of Retailing and Consumer Services,
31(C), 334-344.
116. Kim, Y. (2010). The Pilot Study in Qualitative Inquiry:
Identifying Issues and Learning Lessons for Culturally Competent
Research. Qualitative Social Work OnlineFirst, 10(2), 190-206.
117. Kim, C., Mirusmonov, M., & Lee, I. (2010). An empirical
examination of factors influencing the intention to use mobile
payment. Computers in Human Behavior, 26(3), 310-322.
118. Kim, C., Tao, W., & Shin Kim, K. (2010). An empirical study of
customers’ perceptions of security and trust in e-payment systems.
Electronic Commerce Research and Applications, 9(1), 84–95.
119. Kim, Y., Choi, J., Park, Y.J., &Yeon, J. (2016).The Adoption of
Mobile Payment Services for “Fintech”.International Journal of
Applied Engineering Research, 11(2), 1058-1061.
120. Kumar, R., Rishi, R., & Kumar, M. (2012). Impact of Mobile
Commerce & Its Application with Security in Indian Context.
International Journal of Recent Trends in Mathematics &
Computing, 1(1), 1-5.
121. Kumar, K., Sivashanmugam, C., & Venkataraman, A. (2017).
Intention to Use Mobile Wallet: Extension of Tam Model.
International Journal of Current Engineering and Scientific
Research, 4 (12), 5-11.

339
122. Lai, W., & Li, C. (2015). Technology Acceptance Model for
Internet Banking: An Invariance Analysis, Information &
Management, 42(2), 373-386.
123. Lai, P. C. (2017). The Literature Review Of Technology
Adoption Models And Theories For The Novelty Technology.
Journal of Information Systems And Technology Management,
14(1), 21-38.
124. Lee, Y., Park. J., Chung, N., & Blakeney, A. (2012). A unified
perspective on the factors influencing usage intention toward
mobile financial services. Journal of Business Research 65(11),
1590–1599.
125. Lee, H. J., Shin, J. I., Kou,K. S., & Ryu, C. H. (2014). Criteria
Requirements of Mobile Payment Application. Journal of Security
Engineering, 11(1), 79-88.
126. Leong, L. Y., Ooi, K. B., Chong, A. Y. L., & Lin, B. (2013).
Modeling the stimulators of the behavioral intention to use mobile
entertainment: Does gender really matter? Computers in Human
Behavior, 29(5), 2109–2121.
127. Lesa, E., & Tembo, S. (2016). Study on Factors Affecting Mobile
Payment Systems Diffusion in Zambia.Management, 6(2), 36-45.
128. Leung, L., & Wei, R. (2000). More than just talk on the move:
Uses and gratifications of the cellular phone. Journalism and Mass
Communication Quarterly, 77(2), 308-320.
129. Li, J., Liu, J. L., Yong, J, H. (2014). Empirical Study of Influence
Factors of Adaption Intention of M-payment based on TAM Model
in China. International Journal of u- and e- Service, Science and
Technology, 7(1), 119–132.

340
130. Liaw, S. (2002). An Internet Survey for Perceptions of Computers
and the World Wide Web: Relationship, Prediction and
Difference.Computers in Human Behavior, 18(1), 17-35.
131. Liébana-Cabanillas, F., Muñoz-Leiva, F., & Sánchez-Fernández,
J. (2015). Influence of age in the adoption of new mobile payment
systems. Revista brasileira de gestão de negócios, 17(58), 1390–
1407.
132. Liébana-Cabanillas, F., Ramos de Luna, I., Montoro-Ríos, F.
(2017). Intention to use new mobile payment systems: a
comparative analysis of SMS and NFC payments. Econ.Res.
Ekonomska istraživanja, 30 (1), 892–910.
133. Liébana-Cabanillas, F., & Rubio J. L. (2017). Predictive and
explanatory modeling regarding adoption of mobile payment
systems. Technological Forecasting & Social Change, 120, 32-40.
134. Liébana-Cabanillas, F., Sanchez-Fernandez, J., &Munoz-Leiva, F.
(2014). Role of gender on acceptance of mobile payment. Ind.
Manag. Data Syst. 114 (2), 220–240.
135. Liébana-Cabanillas, F., Sánchez-Fernández, J., & Muñoz-Leiva,
F. (2014). Antecedents of the adoption of the new mobile payment
systems: The moderating effect of age. Computers in Human
Behavior, 35(1), 464–478.
136. Lin, C., & Nguyen, C. (2011). Exploring e-payment Adoption in
Vietnam and Taiwan. Journal of Computer Information System,
51(4), 41-52.
341
137. Lonare, A., Yadav, A., & Sindhu, S. (2018). E-Wallets: Diffusion
and Adoption in Indian Economy. Indian Journal of Commerce &
Management Studies, 9(2), 9-16.
138. Lu, Y., Yang, S., Chau, P., & Cao, Y. (2011). Dynamics between
the trust transfer process and intention to use mobile payment
services: A cross-environment perspective. Information &
Management, 48(8), 393-403.
139. Lubrano, S. P. (2010). Mobile Payments: Moving Towards a
Wallet in the Cloud? Communications & strategies, 79(3), 63-71.
140. Luna, I.R., Liébana-Cabanillas, F., Sánchez-Fernández, J.,
&Muñoz-Leiva, F. (2019). Mobile payment is not all the same: The
adoption of mobile payment systems depending on the technology
applied. Technological Forecasting & Social Change, 146, 931-
944.
141. Luna, I.R., Montoro-Ríos, F., &Liébana-Cabanillas, F. (2016).
Determinants of the intention to use NFC technology as a payment
system: An acceptance model approach. Information Systems and
e-Business Management, 14(2), 293-314.
142. Malhotra, P., & Singh, B. (2010). An analysis of Internet banking
offerings and its determinants in India.Internet Research, 20(1), 87
– 106.
143. Mallat, N. (2007). Exploring consumer adoption of mobile
payments: A qualitative study. The Journal of Strategic
Information Systems, 16 (4), 413–432.

342
144. Makame, W.H., Kang J., & Park, S. (2014). Factors influencing
electronic commerce adoption in developing countries: The case of
Tanzania. South African Journal of Business Management, 45(2),
83-96.
145. Manikandan, M., & Chandramohan, S. (2015). Mobile Wallet- A
Virtual Physical Wallet to the Consumers. Paripex - Indian Journal
of Research, 4(9), 146-147.
146. Martins, C., Oliveira, T., & Popovič, A. (2014). Understanding
the internet banking adoption: a unified theory of acceptance and
use of technology and perceived risk application.International
Journal of Information Management, 34(1), 1-13.
147. Mattila, M., Karjaluoto, H., & Pento, T. (2003). Internet Banking
Adoption Among Mature Consumers: Early Majority Or Laggards?
Journal of Services Marketing, 17(5), 514 – 528.
148. Mbogo, M. (2010). The impact of mobile payments on the
success and growth of micro-business: The case of M-Pesa in
Kenya. The Journal of Language, Technology and
Entrepreneurship in Africa, 2(1). 180-203.
149. Mondego, D., & Gide, E. (2018). The Effect of Trust on Mobile
Payment Adoption: A Comprehensive Review of Literature.
International Journal of Arts & Sciences, 11(1), 375–390.
150. Monsuwe, T.P., Dellaert, B. G .C., & Ruyter, K. (2004). What
drives consumers to shop online? A literature review. International
Journal of Service Industry Management, 15(1), 102-121.
151. Moore, G. C., & Benbasat, I. (1991). Development of an
instrument to measure the perceptions of adopting an information

343
technology innovation. Information systems research, 2(3), 192-
222.
152. Mu, H., & Lee, Y. (2017). Examining the Influencing Factors of
Third-Party Mobile Payment Adoption: A Comparative Study of
Alipay and WeChat Pay. The Journal of Information Systems,
26(4), 247-284.
153. Muthure, M.P., Ofafa, G.A., Stephen, M.A.M., & Muli, J. (2013).
An Emprical Investigation on The Relationship Between
Technological Infrastructure and Government Regulations on
Effective Operations of M-Payment Systems in Kenya.
International Journal of Arts and Commerce, 2(1), 186-196.
154. Nguyen, T.N., Cao, T. K., Dang, P. L., & Nguyen, H. A. (2016).
Predicting Consumer Intention to Use Mobile Payment Services:
Empirical Evidence from Vietnam. International Journal of
Marketing Studies, 8(1), 117-124.
155. Oliveira, T., Thomas, M., Baptista, G., & Campos, F. (2016).
Mobile payment: Understanding the determinants of consumer
adoption and intention to recommend the technology. Computers
in Human Behavior, 61, 404-414.
156. Omotayo, F., & Dahunsi, O. (2015). Factors Affecting Adoption
of Point of Sale Terminals by Business Organisations in Nigeria.
International Journal of Academic Research in Business and Social
Sciences, 5(10), 115-136.
157. Ondrus, J., & Pigneur, Y. (2006). Towards a holistic analysis of
mobile payments: A multiple perspectives approach. Electronic
Commerce Research and Applications, 5(3), 246-257.
344
158. Ondrus, J., & Pigneur, Y. (2009). Near Field Communication: An
Assessment for Future Payment Systems. Information Systems and
E-Business Management, 7(3), 347-361.
159. Otieno, E.O., & Kahonge, A.M.(2014). Adoption of Mobile
Payments in Kenyan Businesses: A Case Study of Small and
Medium Enterprises (SME) in Kenya. International Journal of
Computer Applications, 107(7) , 5-12.
160. Ouma, S.A., Odongo, T.M., & Were, M. (2017). Mobile financial
services and financial inclusion: Is it a boon for saving
mobilization? Review of Development Finance, 7(1), 29-35.
161. Ozili, P.K. (2017). Impact of digital finance on financial inclusion
and stability. Borsa Istanbul Review, 18(4), 329-340.
162. Padashetty, S., & Kishore S. V. K. (2013). An Empirical Study on
Consumer Adoption of Mobile Payments In Bangalore City – A
Case Study. International Refereed Research Journal, 4(1), 83-94.
163. Pal, A., De, R., Herath, T., & Rao, H. R. (2019). A Review of
Contextual Factors Affecting Mobile Payment Adoption and Use.
Journal of Banking and Financial Technology, 3(1), 43-57.
164. Park, J., Yang, S., & Lehto, X. (2007). Adoption of Mobile
Technologies for Chinese Consumers. Journal of Electronic
Commerce Research, 8(3), 196-206.
165. Peng, R., Xiong, L., & Yang, Z. (2012). Exploring tourist
adoption of tourism mobile payment: An empirical analysis.
Journal of theoretical and applied electronic commerce research,
7(1), 21-33.

345
166. Penttilä, M., Siira, E., & Tihinen, M. (2016). Mobile Payment
Ecosystems in Transition. International journal of scientific and
technical research in engineering, 1(6), 1-15.
167. Petrova, K., & Wang, B. (2013). Retailer Adoption of Mobile
Payment: A Qualitative Study. Journal of Electronic Commerce in
Organizations, 11(4), 70-89.
168. Phonthanukitithaworn, C., Sellitto, C., & Fong, M.W. (2014).
User intentions to adopt mobile payment services: a study of early
adopters in Thailand. Journal of Internet Banking and Commerce,
20(1), 1-29.
169. Phonthanukitithaworn, C., Sellitto, C., & Fong, M. W. L. (2016).
A Comparative Study of Current and Potential Users of Mobile
Payment Services. SAGE Open, 6(4) 1– 14.
170. Pinchot, J. L., Mishra, S., Paullet, K. L., & Kohun, F. G. (2016).
Exploring Barriers To Adoption Of Mobile Payments For
University Students: Lack Of Awareness, Lack Of Availability,
And Perceived Security Risks.Issues In Information Systems, 17(3),
20-30.
171. Podile, V., & Rajesh, P. (2017). Public Perception on Cashless
Transactions in India. Asian Journal of Research in Banking and
Finance, 7(7), 63-77.
172. Pousttchi, K., Schiessler, M., & Wiedemann, D. G. (2009).
Proposing a comprehensive framework for analysis and
engineering of mobile payment business models. Information
Systems and e-Business Management, 7(3), 363-393.

346
173. Raina, V.K. (2014). Overview of Mobile Payment: Technologies
and Security. IGI Global,Chapter 11,186-222.
174. Vohra, N., & Hazra, K. (2018). The state of e-wallets and digital
payments in India 2018. Regalix Research.
175. Routray, S., Khurana, R., Payal, R., & Gupta, R. (2019). A Move
towards Cashless Economy: A Case of Continuous Usage of
Mobile Wallets in India. Theoretical Economics Letters, 9(4),
1152-1166.
176. Roy, S., & Sinha, I. (2014). Determinants of Consumers’
Acceptance of Electronic Payment System in Indian Banking
Sector – A Study. International Journal of Scientific &
Engineering Research, 5(1), 177-187.
177. Roy, S., & Sinha, I. (2017). Factors affecting Consumers’
adoption of Electronic Payment: an Empirical Analysis. IOSR
Journal of Business and Management, 19(12), 76-90.
178. Roy, S. (2017). Factors Affecting Customers’ Adoption Of
Electronic Payment: An Empirical Analysis. International Journal
of Multidisciplinary Research & Advances In Engineering, 9(3),
71-81.
179. Ruangkanjanases, A., & Wongprasopchai, S.(2017). Adoption of
Mobile Banking Services: An Empirical Examination between Gen
Y and Gen Z in Thailand. Journal of Telecommunication,
Electronic and Computer Engineering, 9(3-5), 197-202.
180. Sarvepalli, S. K. K., & Prakash, N. R. M. (2016). A Study on the
Scope of the Virtual Wallets in Indian Market -Issues and

347
Challenges. International Journal Of Multifaceted And
Multilingual Studies, 3(8), 1-10.
181. Sarwar, M., &Soomro, T. R. (2013). Impact of Smartphone’s on
Society. European Journal of Scientific Research, 98(2), 216-226.
182. Sauermann, H., & Roach, M. (2013). Increasing web survey
response rates in innovation research: An experimental study of
static and dynamic contact design features. Research Policy, 42(1),
273-286.
183. Schierz, P. G., Schilke, O., & Wirtz, B. W. (2010). Understanding
consumer acceptance of mobile payment services: An empirical
analysis. Electronic Commerce Research and Applications, 9(3),
209-216.
184. Shaikh, A., & Karjaluoto, H. (2015). Mobile banking adoption: A
literature review. Telematics and Informatics, 32 (1), 129-142.
185. Shankar, A., & Kumari, P. (2016). Factors Affecting Mobile
Banking Adoption Behavior in India. Journal of Internet Banking
and Commerce, 21(1), 1-24.
186. Shankar, V., Venkatesh, A., Hofacker, C., & Naik, P. (2010).
Mobile Marketing in the Retailing Environment: Current Insights
and Future Research Avenues. Journal of Interactive Marketing,
24(2), 111-120.
187. Shaouf, A., & Altaqqi, O. (2018). The Impact of Gender
Differences on Adoption of Information Technology and Related
Responses: A Review. International Journal of Management and
Applied Research, 5(1), 22-41.

348
188. Shaw, N. (2014). The mediating influence of trust in the adoption
of mobile wallet. Journal of Retailing & Consumer Services, 21(4),
449-459.
189. Shin, S., Lee, W. & Odom, D. (2014). A Comparative Study Of
Smartphone User’s Perception And Preference Towards Mobile
Payment Methods In The U.S. And Korea. The Journal of Applied
Business Research, 30(5). 1365-1376.
190. Shin, D.-H. (2010). Modeling the Interaction of Users and Mobile
Payment System: Conceptual Framework. International Journal of
Human-Computer Interaction 26 (10), 917–940.
191. Shukla, U. N. (2017). An Empirical Study on Future of Mobile -
Wallets in India : A Gateway for Cashless Payments. Arthshastra
Indian Journal of Economics & Research, 6 (6), 51-62.
192. Sikdar, P., & Makkad, M. (2015). Online banking adoption A
factor validation and satisfaction causation study in the context of
Indian banking customers. International Journal of Bank
Marketing, 33 (6), 760-785.
193. Singh, N., Srivastava, S. & Sinha, N. (2017). Consumer
preference and satisfaction of Mswallets: a study on North Indian
consumers. International Journal of Bank Marketing, 35 (6), 944-
965.
194. Sinha, I. (2016). Mobile Wallet service Utilisation in India:
emperical analysis of user trust and acceptance factors.
International Journal of Scientific & Engineering Research, 7(4),
1762-1771.

349
195. Sinha, M., Majra, H., Hutchins, J. & Saxena, R. (2018). Mobile
payments in India: the privacy factor. International Journal of
Bank Marketing, 37(1), 192-209.
196. Singh, S., & Islam, J. (2015). Emergence of M-commerce in
India. Advances in Economics and Business Management, 2(5),
529-533
197. Slade, E.L., Williams, M.D., & Dwivedi, Y.K. (2013). Mobile
payment adoption: Classification and review of the extant
literature. The Marketing Review, 13(2),167-190
198. Slade, E.L., Dwivedi, Y.K., Piercy, N.C., & Williams, M.D.
(2015). Modeling consumers' adoption intentions of remote mobile
payments in the United Kingdom: extending UTAUT with
innovativeness, risk, and trust. Psychol. Market. 32 (8), 860–873.
199. Slade, E., Williams, M. D., Dwivedi, Y., & Piercy, N. (2015).
Exploring consumer adoption of proximity mobile payments.
Journal of Strategic Marketing, 23(3), 209-223.
200. Sumathy, M., & Vipin, K.P. (2017). Digital Payment Systems:
Perception and Concerns among Urban Consumers. Journal of
Applied Research, 3(6), 1118-1122.
201. Sunny, P., & George, A. (2018). Determinants of Behavioral
Intention To Use Mobile Wallets – A Conceptual Model. Journal
of Management, 5(5), 52-62.
202. Suhas, M.S., Abhilash, C.B., Vikas, K.C., & Pareek, A. (2014).
Biometric Electronic Wallet For Digital Currency. International

350
Journal of Research in Engineering and Technology, 3(5), 276-
283.
203. Sokobe, E. O.(2015).Factors Influencing Adoption of Electronic
Payment by Small and Medium Hotel Enterprises in Kisii Town,
Kisii County, Kenya. International Journal of Novel Research in
Computer Science and Software Engineering, 2(2), 5-18.
204. Tam, C., & Oliveira, T. (2017). Literature review of mobile
banking and individual performance.International Journal of Bank
Marketing, 35(7), 1042-1065.
205. Tarasewich, P., Nickerson, R.C., & Warkentin, M. (2002). Issues
in Mobile E-Commerce. Communications of the Association for
Information Systems, 8 (1), 41-64.
206. Tawade, P.H. (2017). Future And Scope Of Cashless Economy In
India. IJARIIE, 2(3), 177- 181.
207. Teng, P. K., Ling, T. J., & Seng, K.W. K. (2018). Understanding
Consumer Intention to Use Mobile Payment Services in Nanjing,
China. International Journal of Community Development &
Management Studies, 2(1), 49-60.
208. Thakur, R. (2013). Customer adoption of mobile payment
services by professionals across two cities in India: An empirical
study using modified technology acceptance model. Business
Perspectives and Research, 1(2), 17-29.
209. Thakur, R., & Srivastava, M. (2014). Adoption readiness,
personal innovativeness, perceived risk and usage intention across
consumer groups for mobile payment services in India. Internet
Research, 24(3), 369-392.

351
210. Ting, H., Yacob, Y., Liew, L., & Lau, W.M. (2016). Intention to
Use Mobile Payment System: A Case of Developing Market by
City. Procedia - Social and Behavioral Sciences, 224(1), 368 –
375.
211. Tobbin, P., & Kuwornu, J.K. (2011). Adoption of Mobile Money
Transfer Technology: Structural Equation Modeling Approach.
European Journal of Business and Management, 3(7), 59–77.
212. Tossy, T. (2014). Modelling the Adoption of Mobile Payment
System for Primary and Secondary School Student Examination
Fees in Developing Countries: Tanzanian Experience.
International Journal of Information Technology and Business
Management, 27(1), 1-12.
213. Tornatzky, L. G., & Klein, K. J. (1982). Innovation characteristics
and innovation adoption-implementation: A meta-analysis of
findings. IEEE Transactions on engineering management, 29(1),
28-45.
214. Tripathi, P., & Nanda, N. (2017). Impact of De-Monetization on
Consumers of Delhi/ NCR. International Journal Of Economics &
Finance Research & Applications, 1(1), 16-24.
215. Vallespín, M., Molinillo, S., & Ramos, C. M. Q. (2018). Who
relies on mobile payment systems when they are on vacation? A
segmentation analysis. Tourism, 66(1), 6 – 18.
216. Van der Heijden, H. (2003). User Acceptance of Hedonic
Information Systems.MIS Quarterly, 28(4), 695-704.

352
217. Vanisree, D. (2013). Mobile Banking in India: Barriers in
Adoption and Service Preferences. Paripex - Indian Journal of
Research, 2 (7), 180-183.
218. Vally, K.S., & Divya, K.H. (2018). A Study on Digital Payments
in India with Perspective of Consumer’s Adoption. International
Journal of Pure and Applied Mathematics, 119(15), 1259-1267.
219. Vasantha, S. & P. Sarika, P. (2019). Empirical Analysis of
Demographic Factors Affecting Intention to use Mobile Wallet.
International Journal of Engineering and Advanced Technology,
8(6), 768-776.
220. Venkatesh, V., & Morris, M. G. (2000). Why Don’t Men Ever
Stop to Ask for Directions? Gender, Social Influence and Their
Role in Technology Acceptance and Usage Behaviour. MIS
Quarterly, 24(1), 115–139.
221. Venkatesh, V., Morris, M. G., Davis, G. B., & Davis, F. D.
(2003). User acceptance of information technology: Towards a
unified view. MIS Quarterly, 27(3), 425–478.
222. Venkatesh, V., & Bala, H. (2008). Technology acceptance model
3 and a research agenda on interventions. Decision Sciences, 39(2),
273–315.
223. Venkatesh, V., Thong, J., & Xu, X. (2012). Consumer acceptance
and use of information technology: extending the unified theory of
acceptance and use of technology. MIS Quarterly, 36(1), 157-178.
224. Vidyashree, D.V., Harshitha, J.S., & Darshini, A. (2018). A Study
On People’s Attitude Towards Digital Money. International

353
Journal of Computer Engineering and Applications, 12(special
issue), 1-9.
225. Vikas, D., & Kumar, A.A. (2018). What Indians Think About
Paytm. World Scientific News, 110, 184-196.
226. Wang, H.M., & Idertsog, B. (2015). A Study on User’s Intention
of Using Mobile Payments. International Journal of Sciences:
Basic and Applied Research, 24(6), 433-449.
227. Wang, L. & Yi, Y. (2012). The impact of use context on mobile
payment acceptance: An empirical study in China’, in Xie, A. &
Huang, X. (eds), Advances in computer science and education,
293-300.
228. Wani, T.A., & Ali, S. W. (2015). Review & Scope in the Study of
Adoption of Smartphones in India. Journal of General
Management Research, 3(2), 101–118.
229. Wasiq, M., Ahmad, N., & Burney, M.T. (2016). Future of M-
Commerce Services in India. International Journal of Marketing &
Financial Management, 4(5), 1- 10.
230. Widjaja, N. D., & Tedjawidjaja, A. (2012). A Preliminary Study
of Merchants’ Intention to Adopt Online Payment Gateway in
Indonesia. International Journal of Future Computer and
Communication, 1(2), 155-159.
231. Wood, S.L. (2002). Future fantasies: A social change perspective
of retailing in the 21st century. Journal of Retailing, 78(1), 77–83.

354
232. Wu, J., & Wang, S. (2005). What drives mobile commerce? An
empirical evaluation ofthe revised technology acceptance model.
Information & Management, 42(5), 719-729.
233. Xu, H., Teo, H. H., Tan, B. C. Y., & Agarwal, R. (2010). The role
of push-pull technology in privacy calculus: the case of location-
based services. Journal of Management Information Systems, 26
(3), 137– 176.
234. Yadav, R., Chauhan, V., & Pathak. G.S. (2015). Intention to
adopt internet banking in an emerging economy: a perspective of
Indian youth. International Journal of Bank Marketing, 33 (4), 530
– 544.
235. Yang, S., Lu, Y., Gupta, S., Cao, Y., & Zhang, R. (2012). Mobile
payment services adoption across time: An empirical study of the
effects of behavioral beliefs, social influences, and personal traits.
Computers in Human Behaviour, 28(1), 129-142.
236. Yang, K. (2012). Consumer technology traits in determining
mobile shopping adoption: An application of the extended theory
of planned behavior. Journal of Retailing and Consumer Services,
19(5), 484–491.
237. Yang, Y., Liu, Y., Li, H., & Yu, B. (2015). Understanding
perceived risks in mobile payment acceptance. Industrial
Management & Data Systems, 115(2), 253-269.
238. Yu, L., Cao, X., Liu, Z., Gong, M., &Adeel, L. (2018).
Understanding mobile payment users’ continuance intention: a
trust transfer perspective.Internet Research, 28(2), 456-476.
355
239. Zailinawati, A. H., Schattner, P., & Mazza, D. (2006), Doing a
pilot study: why is it essential? Malaysian Family Physician,
1(2&3), 70-73.
240. Zhang, Y., Sun, J., Yang, Z., & Wang, Y. (2018). What Makes
People Actually Embrace or Shun Mobile Payment: A Cross-
Culture Study. Mobile Information Systems, Article ID.
241. Zhou, T. (2014). Understanding the determinants of mobile
payment continuance usage.Industrial Management & Data
Systems, 114(6), 936-948.
242. Zhu, H.D., Lan, Y.L., & Chang, Y.P. (2017). Understanding the
Intention to Continue Use of a Mobile Payment Provider: An
Examination of Alipay Wallet in China. International Journal of
Business and Information, 12(4), 369-390.
Websites
1. Aite. (2017). Global Consumer Survey: Consumer Trust and Security
Perceptions. Aciworldwide. https://www.aciworldwide.com/-
/media/files/collateral/trends/2017-global-consumer-survey-consumer-
trust-and-security- perceptions.pdf.
2. Anand, N., (2018). Nearly half of Indian bank accounts are rarely
used. Quartz India. https://qz.com/india/1260139/india-has-the-
highest-number-of-inactive-bank-accounts-in-the-world/
3. Apple. (2017). Feature- availability. Apple.
http://www.apple.com/es/ios/feature-availability/#apple-pay

356
4. Batchelor, S. (2007). Sending Money outside the Envelope, One World
A Million Stories. Developments.
http://www.developments.org.uk/articles/loose-talk-saves lives
Current: January 1, 2008.
5. Bhattacharya, A. (2018). Apps Trump Websites for Indian Smartphone
Users. https://qz.com/1221380/flipkart-once-went-app-only-and-
shuttered-its-mobile-site-a-move-ahead-of-its-time/
6. Cellan-Jones, R. (2012). Mobile money - has its moment come? BBC
News: Technology. http://www.bbc.co.uk/news/technology- 17057570
7. CII Report. (2016). E-commerce in India – A Game Changer for the
Economy. http://italiaindia.com/images/uploads/pdf/april-2016-e-
commerce-in-india.pdf
8. Códigos-qr.com. (2016). QR Codes.Códigos QR. http://www.codigos-
qr.com/
9. David E. Acosta, (2019). Mobile payments with digital wallets and
tokenization. How Google Pay, Apple Pay and Samsung Pay protect
your card details. Advantio. https://www.advantio.com/hs
fs/hubfs/AdvantioBlog_May_David_Diagram2_ENGLISH.png?width
=754&name=AdvantioBlog_May_David_Diagram2_ENGLISH.png
10. Devere (2019). Cashless is king in India: digital transactions growing
faster than anywhere else. https://www.devere-
vault.com/blog/Cashless-is-king-in-India-digital-transactions-grow-
faster-than-anywhere-else.

357
11. Digital marketing. (2019). The Power of Internet: Internet Penetration
in India.E market education. https://www.emarketeducation.in/power-
internet-penetration-online-india/
12. ETCIO, 2017. EconomicTimes. Internet users in India to double by
2021: Cisco VNI.
https://cio.economictimes.indiatimes.com/news/internet/internet-users-
in-india-to-double-by-2021-cisco-vni/59066697
13. Economic Times. (2019). No MDR charges applicable on payment via
RuPay, UPI from Jan 1: Sitharaman. Economic Times.
https://economictimes.indiatimes.com/industry/banking/finance/bankin
g/no-mdr-charges-applicable-on-payment-via-rupay-upi-from-jan-
1sitharaman/articleshow/73008967.cms?utm_source=contentofinterest
&utm_medium=text&utm_campaign=cppst
14. Enterprenuer staff. 2020. How M-commerce is Changing the
Landscape of E-commerce in India.
Entreprenuer.https://www.entrepreneur.com/article/346340
15. ET online. (2019). Indian millennials addicted to samrtphones, spend
one-third of their waking hours on WhatsApp, FB. Economic times.
https://economictimes.indiatimes.com/magazines/panache/indian-
millennials-addicted-to-smartphones-spend-one-third-of-their-waking-
hours-on-whatsapp-fb/articleshow/72902910.cms?from=mdr
16. European Commission. (2012). Green Paper: Towards an integrated
European market for card, internet and mobile payments. Eur-
lex.europa.http://eurlex.europa.eu/LexUriServ/LexUriServ.do?uri=CE
LEX:

358
17. European Payment Council. (2014). Overview of mobile payment
initiatives. European payments council.
http://www.europeanpaymentscouncil.eu/index.cfm/knowledge-
bank/epc-documents/epc-overview-on-mobile-payments-initiatives-
edition-december-2014/epc091-14-v20-epc-overview-on-mobile-
payments-initiatives/
18. Forrest, S. (2020). Study examines India's policies for financial
inclusion of the unbanked. News Illinois.
https://news.illinois.edu/view/6367/808477.
19. Gemalto. (2016). Gemalto Contactless wearable wins Juniper
Research Future Digital Award. Hugin.
http://hugin.info/159293/R/2045150/763901.pdf 117
20. Gemalto. (2016). Rio de Janeiro launches Gemalto contactless
transport ticketing wristband Amsterdam. Gemalto.
http://www.gemalto.com/press/Pages/Rio-de-Janeiro-launches-
Gemalto-contactless-transport-ticketing-wristband.aspx
21. Gent, E., (2019). Will India’s payments ever be fully mobile?
Raconteur. https://www.raconteur.net/finance/mobile-payments-
systems-india.
22. Grant Thorton (2020). Financial inclusion in rural India: Banking and
ATM sector in India. https://vakrangee.in/pdf/reports_hub/financial-
inclusion-in-rural-india-28-jan.pdf
23. Gupta, A., & Auerswald, P.E. (2019). The Ups and Downs of India’s
Digital Transformation. Harvard Business Review.

359
https://hbr.org/2019/05/the-ups-and-downs-of-indias-digital-
transformation.
24. Han, J., (2019). India Time Spent with Media 2019. E marketer.
https://www.emarketer.com/content/india-time-spent-with-media-2019
25. India digital payment report, 2019. Worldline.
https://worldline.com/content/dam/worldline/documents/india/docume
nts/worldline-india-digital-payments-report-2019-a-year-in-review.pdf
26. Internet World Stats. (2019).
https://www.internetworldstats.com/top20.htm
27. Matthews, T., Pierce, J., & Tang, J. (2009). No smart phone is an
island: the impact of places, situations, and other devices on smart
phone use. IBMResearch Report, 1-
10.https://www.researchgate.net/publication/229041304_No_smart_ph
one_is_an_island_the_impact_of_places_situations_and_other_devices
_on_smart_phone_use
28. Mishra, C., (2019). Top 6 Ways of Cashless Payments. Upi payments.
https://upipayments.co.in/digital-payment/
29. Nariyanuri, S.S. (2020). India Mobile Payments Market Report.
spglobal.com/marketintelligence.
30. Porteous, D. (2006). The Enabling Environment for Mobile Banking in
Africa, Bankable Frontier, commissioned by the Department for
International Development. Bankable Frontier.
http://www.bankablefrontier.com/assets/ee.mobil.banking.report.v3.1.p
df

360
31. Prabhudesai, A., (2014). Indian Telecom Growth Story: From 10M to
900M Subscribers In 10Yrs. Trak.in.
https://trak.in/tags/business/2007/06/19/indian-telecommunication-
story-from-10-million-to-150-million-mobile-subscribers-in-5-years/
32. PTI. (2018). Aadhaar covers over 89% population: Alphons. Times of
India. https://timesofindia.indiatimes.com/business/india-
business/aadhaar-covers-over-89-population-
alphons/articleshow/63202223.cms
33. Pymnts. (2019). WhatsApp Mobile Payments Secure 210M Users In
India. Pymnts. https://www.pymnts.com/news/mobile-
payments/2019/whatsapp-pay-india-regulators/
34. PTI, (2019). Internet users in India to reach 627 million in 2019:
Report. Economic Times.
https://economictimes.indiatimes.com/tech/internet/internet-users-in-
india-to-reach-627-million-in-2019-report/articleshow/68288868.cms
35. PTI. (2019). Currency in circulation as percentage of GDP declines
since DeMo: FinMin official. Economic Times.
https://economictimes.indiatimes.com/news/economy/finance/currency
-in-circulation-as-percentage-of-gdp-declines-since-demo-finmin-
official/articleshow/68598744.cms
36. Ramani, K. (2020). Top 10 Mobile Wallets In India – 2020 Edition.
Social Beat. https://www.socialbeat.in/blog/top-10-mobile-wallets-in-
india/
37. RBI. https://www.rbi.org.in/scripts/BS_ViewBulletin.aspx

361
38. Samsung (2017). Samsung Pay. Samsung.
http://www.samsung.com/es/apps/mobile/galaxyapps/samsung-pay/
39. Schaettgen, N., & Taga, K. (2010). An acronym-free primer on mobile
payments. Adlittle.
http://adlittle.nl/uploads/tx_extprism/ADL_PRISM_2_2010_m-
payment.pdf.
40. Sorensen, E. (2018). Different types of mobile payments explained.
Mobile transaction. https://www.mobiletransaction.org/different-types-
of-mobile-payments/
41. Surabhi, (2020). Digital payments rise in COVID times, but then so
does cash in circulation. The Hindu Businessline
https://www.thehindubusinessline.com/economy/digital-payments-rise-
in-COVID-times-but-then-so-does-cash-in
circulation/article32774031.ece
42. The Hindu. (2018). Digital push, going cashless will shrink shadow
economy, boost GDP growth: Meghwal. The Hindu business line.
https://www.thehindubusinessline.com/economy/digital-push-going-
cashless-will-shrink-shadow-economy-boost-gdp-growth-
meghwal/article9546750.ece
43. TRAI.(2020).https://main.trai.gov.in/sites/default/files/PR_No.17of202
0.pdf
44. UK Payments Council. (2013). The Way We Pay. Payment council.org.
http://www.paymentscouncil.org.uk/files/payments_council/statistical_
publications/the_ way_we_pay_-_february_2013.pdf

362
45. UK Finance (2019) UK Payments Markets 2019, London: UK
Finance.https://www.retailresearch.org/mobile-retailing.html
46. Varshney, R. (2020). Paytm dominates merchant payments with a 50
pc market share: report. Yourstory.
https://yourstory.com/2020/08/india-mobile-merchant-payments-
gateway-paytm-redseer
47. Viswanathan, P. (2018). Lifewire: 8 Popular Mobile Payment Apps.
Lifewire. https://www.lifewire.com/most-popular- mobile-payment-
apps-2373179
48. Webnots. (2017). History of Internet Growth in India. Webnots.
https://www.webnots.com/history-of-internet-growth-in-india/
49. Worldpay Inc, 2019. Worldpay, Inc.: mCommerce to overtake desktop
sales by 2020. https://www.prnewswire.com/in/news-
releases/worldpay-inc-mcommerce-to-overtake-desktop-sales-by-
2020-842009420.html
50. Zee media bureau. (2019). Indian m-commerce market to more than
double over next 4 years, set to be worth $54 bn. Zeenews.
https://zeenews.india.com/technology/indian-m-commerce-market-to-
more-than-double-over-next-4-years-set-to-be-worth-54-bn-
2171001.html

363
APPENDICES

364
MODEL BASED RESEARCH
Table : Researches based on models
MODEL NAME AUTHOR (S)
TAM Li et al. (2014); Lesa & Tembo (2016); Dennehy
& Sammon (2015); Mbogo (2010); Wang &
Idertsog (2015); Anthony & Mutalemwa (2014);
Mallat et al. (2009); Schierz et al.(2010)
Extended TAM Ashoka & Ramaprabha (2018); Kumar et
al.(2017); Govender & Sihlali (2014); Pal et al.
(2015); Shaw (2014); Wani & Ali (2015); Hamza
and Shah (2014); Dahlberg et al. (2003); Kim et
al. (2010); Phonthanukitithaworn et al. (2015);
Phonthanukitithaworn et al. (2016)
TAM & IDT Chen & Adams (2005);
TAM & TPB Nguyen et al. (2016); Yadav et al (2014)
TAM & UTAUT Sunny & George (2018)
TAM & TRA Davis et al. (1989)
TDM & TOE Otieno & Kahonge (2014)
UTAUT Tossy (2014); Yeh & Tseng (2017); Widjaja &
Tedjawidjaja (2012); Williams et al. (2015);
Martin et al. (2014); Im et al. (2011);
Elaboration Likelihood
Model (ELM)
Zhu, Lan & Chang (2017); Kim et al. (2016)
TRI model Humbani & Wiese (2017)
TAM, TRA, TPB, &
UTAUT
Aydin & Burnaz (2016)
TRA & TPB Mu & Lee (2017)
Others Amoroso (2010); Chandra et al. (2010)

365
Table : Hypothesis formulation from existing literature
FACTORS AUTHORS
Perceived
usefulness
Nguyen et al (2016); Kabata (2015); Padashetty &
Kishore (2013); Yakubu (2012); Perera (2007); Peng et al
(2012); Ahrenstedt et al (2015); Li et al (2014); Lesa &
Tembo (2016); Mbogo (2010); Phonthanukitithaworn et
al (2015); Luna et al (2017); Chandrasekhar (2017);
Hamza & Shah (2014)
Perceived ease
of use
Kabata (2015); Yakubu (2012); Dahlberg and Mallat
(2002); Perera (2007); Peng et al (2012); Ahrenstedt et al
(2015); Lesa & Tembo (2016); Mbogo (2010);
Phonthanukitithaworn et al (2015); Hamza & Shah
(2014); Ayodele et al (2013);
Social norms
Nguyen et al (2016); Kabata (2015); Tossy (2014);
Ahrenstedt et al (2015); Li et al (2014); Lesa & Tembo
(2016); Phonthanukitithaworn et al (2015); Yang et al
(2012); Hamza & Shah (2014)
Application
provider
Perera (2007); Chogo & Sedoyeka (2015);
Table - Attributes of Mobile Payments
Attribute Definition Adapted from
Accesibility Accesibility means how easily
people can access the product to
be used or consumed
Jinkyung (2018)
Availability Mobile payment is always
available due to mobile network
availability
Jinkyung (2018)
Compatibility The degree to which innovation
is perceived as consistent with
the existing values, past
experiences, and needs of
Rogers (2002);
Mallat N. (2006)

366
potential adopters.
Complexity The degree to which innovation
is perceived as relatively
difficult to understand and use.
Rogers (2002);
Mallat N. (2006)
Cost/ economic The new systems should be, in
the end, more cost effective than
the legacy approaches, e.g. the
technology used may cost more
but fraud is minimized, so
ultimately it is a cost-saving
solution.
Karnouskos and
Fokus (2004);
Mallat N. (2006);
Van der Hejiden
(2002); Darren et
al. (2013); Jinkyung
(2018)
Cross-border
payments
Any global mobile payment
system should be able to handle
cross-border payments in any
currency and at any place and it
should be possible to make
cross-border payments almost as
easily as local payments
Karnouskos and
Fokus (2004)
Customer Data
Control
Payment through mobile helps
merchants with customers’ data,
which is beneficial in further
promotions
Hayashi and
Bradford (2014)
Customer Shopping
Experience
Mobile payment will enhance
customer’s shopping experience
providing immediate payment
option
Hayashi and
Bradford (2014)
Integration of legacy
approaches
Existing channels, such as pre-
/post accounts, credit card
infrastructures, etc., should be
supported, and the user should
Karnouskos and
Fokus (2004)

367
be free to choose the processing
partner (e.g. bank, MNO, credit
card) on a per transaction basis
Interoperability /
Scalability
MP component development
should be based on standards
and open technologies that will
allow any system to interact
with another system on a global
scale at all levels (e.g. any
mobile with any POS, any
payment software should run on
a wide range of mobiles etc.).
Karnouskos and
Fokus (2004); Van
der Hejiden (2002)
Local market
understanding
Approaches that wish to be
sustainable must either improve
their functionality and usability,
or be creative in making users
and merchants perceive it as
beneficial. Furthermore, the
same success criteria may not
apply to every country due to
local social conditions.
Karnouskos and
Fokus (2004)
Merchant
Acceptance
Merchant acceptance of mobile
payment is important for
customers willing to make
mobile payment
Hayashi (2012)
Network
externalities and
creation of critical
mass
Consumer decision to adopt a
payment system is therefore
significantly affected by the
amount of other consumers and
merchants using it. Failure in
Mallat N. (2006)

368
creating critical mass has
contributed to discontinuance of
several previous payment
systems
Observability The degree to which the results
of an innovation are visible to
others
Rogers (2002)
Security, trust and
privacy/ secured
Giving access to a checking or
savings account to a software
company is not the same thing,
in most users’ minds, as giving
that same access to an already
trusted entity, such as a bank.
Unless the basis for electronic
payment systems is based on
tried and true secure banking
practices, it is unlikely that users
will adopt it. For merchants they
feel that mobile payments will
help in reduction of fraud
transactions at POS.
Dahlberg and
Mallat (2002); Van
der Hejiden (2002);
Karnouskos and
Fokus (2004);
Mallat N. (2006);
Hayashi and
Bradford (2014)
Simplicity and
usability/ easy to
use/ convinience
Simplicity and usability largely
determine whether users will use
a service. This includes not only
a user-friendly interface, but
also the whole range of goods
and services one can purchase,
the geographical availability of
the service, and the level of risk
the user is taking while using it
Karnouskos and
Fokus (2004);
Wilmos and
Karnouskos (2004);
Dahlberg and
Mallat (2002);
Hayashi (2012)

369
Speed The new payment method
should decrease transaction
time, automate transactions
Karnouskos and
Fokus (2004)
Trialability The degree to which innovation
may be experimented with on a
limited basis.
Rogers (2002)
Universality (and
flexibility)
e-/m-commerce favors the logic
of on-line universal payment
services, integrating, in a user-
transparent fashion, person-to-
person (P2P), business-to-
consumer (B2C), and business-
to-business (B2B), domestic,
regional, and global coverage,
low-value and high-value
payments.
Karnouskos and
Fokus (2004); Van
der Hejiden (2002)
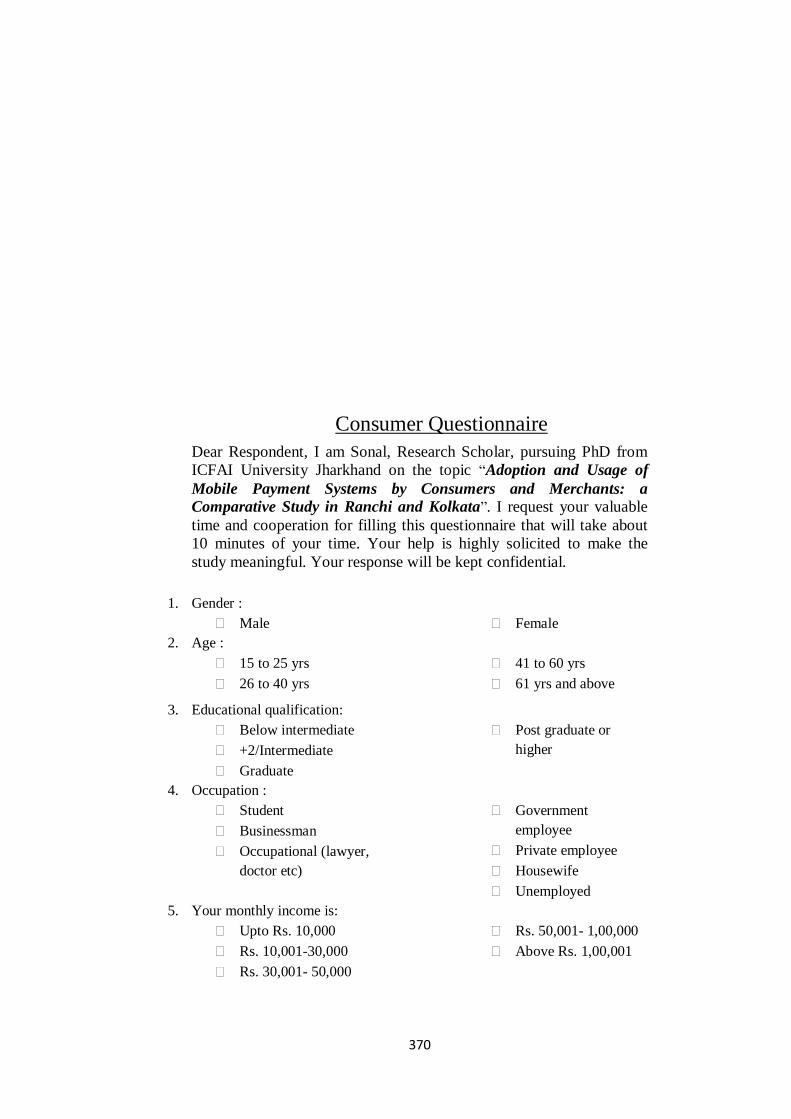
370
Consumer Questionnaire
Dear Respondent, I am Sonal, Research Scholar, pursuing PhD from
ICFAI University Jharkhand on the topic “Adoption and Usage of
Mobile Payment Systems by Consumers and Merchants: a
Comparative Study in Ranchi and Kolkata”. I request your valuable
time and cooperation for filling this questionnaire that will take about
10 minutes of your time. Your help is highly solicited to make the
study meaningful. Your response will be kept confidential.
1. Gender :
Male Female
2. Age :
15 to 25 yrs
26 to 40 yrs
41 to 60 yrs
61 yrs and above
3. Educational qualification:
Below intermediate
+2/Intermediate
Graduate
Post graduate or
higher
4. Occupation :
Student
Businessman
Occupational (lawyer,
doctor etc)
Government
employee
Private employee
Housewife
Unemployed
5. Your monthly income is:
Upto Rs. 10,000
Rs. 10,001-30,000
Rs. 30,001- 50,000
Rs. 50,001- 1,00,000
Above Rs. 1,00,001

371
6. When a new technology is introduced in the market :
I am usually among
the first to use
I wait for others to use
first
I am among late users
I prefer using old
technology only
7. A) Do you know you can make payment through your mobile:
Yes No
B) IF NO, would you like to make such payment if you come to know that it
is available in your city :
Yes No
8. Do you have any mobile payment application installed in your phone:
Yes No
9. Do you use mobile payment system:
Yes No
NON USERS ( I DON’T USE MPS) :-
10. A)Why don’t you use mobile payment system :
I used to earlier, now abandoned
I don’t know how to use mobile payment system
I don’t trust mobile payment system
I find it useless
I am convenient with cash and card only
I am not convenient with smart phone
Others specify …...................................
B) IF ABANDONED, please tick the reason(s), for your such decision:
Feel insecure
Complex process
Time taking
Find it useless
Others specify …...................................
11. Would you like to use the mobile payment system in future, if your issues are
resolved:
Yes No
USERS ( I USE MPS):-
12. Please rank the following method of payments in order of preference, on a
scale of 1 to 5 where 1 is least preferred and 5 is most preferred :
Description Your ranking from 1 to 5
Cash
Debit card
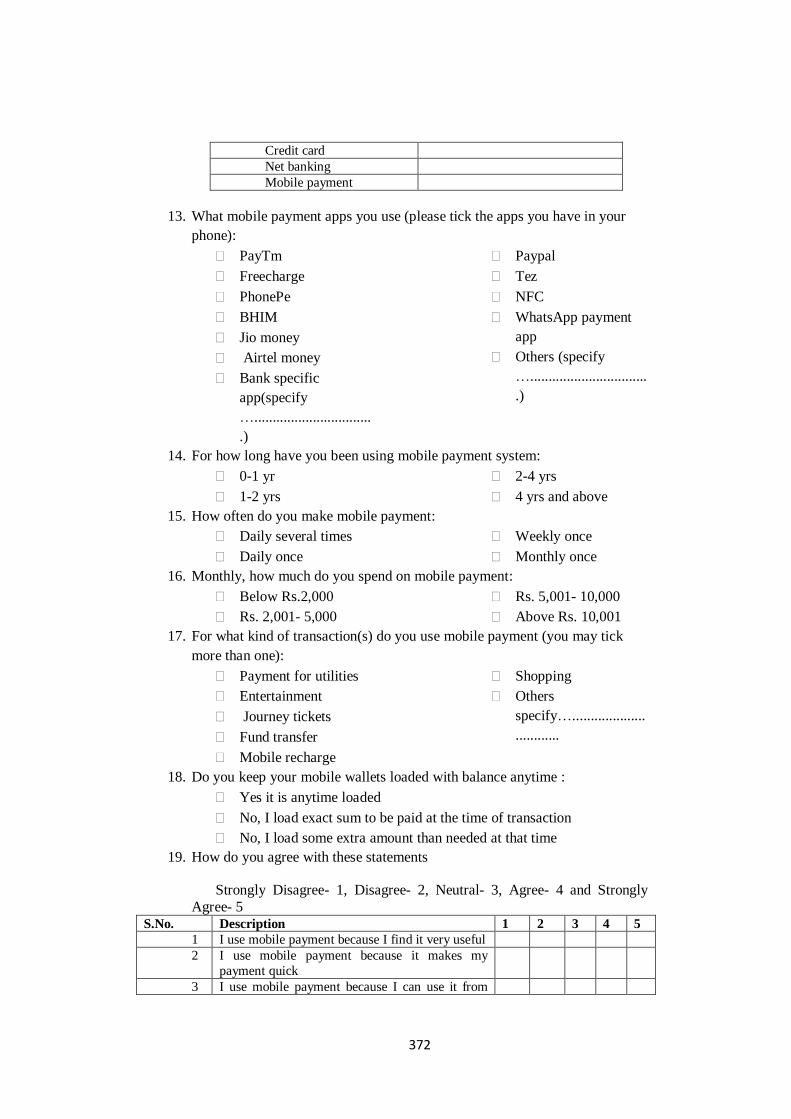
372
Credit card
Net banking
Mobile payment
13. What mobile payment apps you use (please tick the apps you have in your
phone):
PayTm
Freecharge
PhonePe
BHIM
Jio money
Airtel money
Bank specific
app(specify
…................................
.)
Paypal
Tez
NFC
WhatsApp payment
app
Others (specify
…................................
.)
14. For how long have you been using mobile payment system:
0-1 yr
1-2 yrs
2-4 yrs
4 yrs and above
15. How often do you make mobile payment:
Daily several times
Daily once
Weekly once
Monthly once
16. Monthly, how much do you spend on mobile payment:
Below Rs.2,000
Rs. 2,001- 5,000
Rs. 5,001- 10,000
Above Rs. 10,001
17. For what kind of transaction(s) do you use mobile payment (you may tick
more than one):
Payment for utilities
Entertainment
Journey tickets
Fund transfer
Mobile recharge
Shopping
Others
specify…....................
............
18. Do you keep your mobile wallets loaded with balance anytime :
Yes it is anytime loaded
No, I load exact sum to be paid at the time of transaction
No, I load some extra amount than needed at that time
19. How do you agree with these statements
Strongly Disagree- 1, Disagree- 2, Neutral- 3, Agree- 4 and Strongly
Agree- 5 S.No. Description 1 2 3 4 5
1 I use mobile payment because I find it very useful
2 I use mobile payment because it makes my
payment quick
3 I use mobile payment because I can use it from
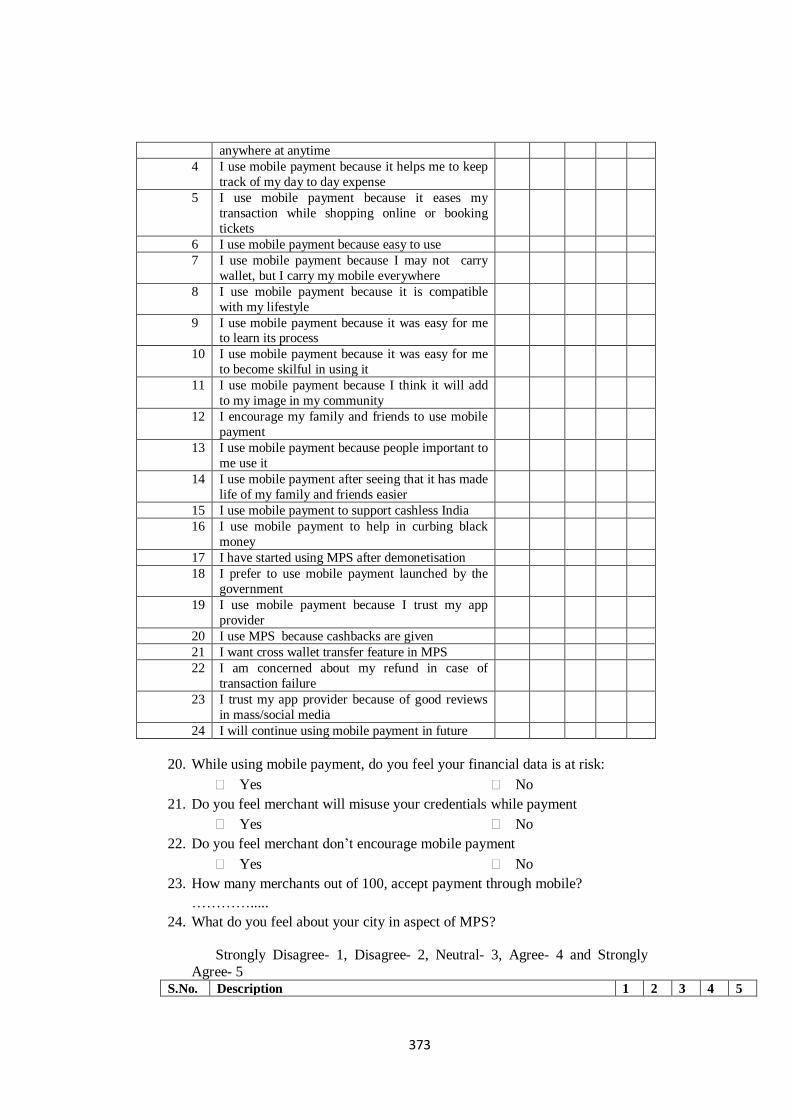
373
anywhere at anytime
4 I use mobile payment because it helps me to keep
track of my day to day expense
5 I use mobile payment because it eases my
transaction while shopping online or booking
tickets
6 I use mobile payment because easy to use
7 I use mobile payment because I may not carry
wallet, but I carry my mobile everywhere
8 I use mobile payment because it is compatible
with my lifestyle
9 I use mobile payment because it was easy for me to learn its process
10 I use mobile payment because it was easy for me
to become skilful in using it
11 I use mobile payment because I think it will add
to my image in my community
12 I encourage my family and friends to use mobile
payment
13 I use mobile payment because people important to
me use it
14 I use mobile payment after seeing that it has made
life of my family and friends easier
15 I use mobile payment to support cashless India
16 I use mobile payment to help in curbing black
money
17 I have started using MPS after demonetisation
18 I prefer to use mobile payment launched by the
government
19 I use mobile payment because I trust my app
provider
20 I use MPS because cashbacks are given
21 I want cross wallet transfer feature in MPS
22 I am concerned about my refund in case of
transaction failure
23 I trust my app provider because of good reviews
in mass/social media
24 I will continue using mobile payment in future
20. While using mobile payment, do you feel your financial data is at risk:
Yes No
21. Do you feel merchant will misuse your credentials while payment
Yes No
22. Do you feel merchant don’t encourage mobile payment
Yes No
23. How many merchants out of 100, accept payment through mobile?
………….....
24. What do you feel about your city in aspect of MPS?
Strongly Disagree- 1, Disagree- 2, Neutral- 3, Agree- 4 and Strongly
Agree- 5 S.No. Description 1 2 3 4 5

374
1 I feel there is less awareness about MPS in my city
2 I feel mobile payment is not accepted everywhere in my city
3 I feel merchant has less digital literacy
4 I feel mobile payment is new trend in my city
5 I find wide acceptance of mobile payment, a distant dream for my city
25. What problems do you encounter while using MPS (you may choose more
than one):
Transaction failure
Monthly limitation
Network failure
Merchant discourage
Wide acceptance
Digital literacy
Others …...................
26. Will you continue using mobile payment:
Yes No
27. Any suggestions you want to give for improvement of MPS.
…………………………………………………………………………………
………………………………………………..
Personal information(optional)
28. Your name …………………………………………………….
29. Phone number ……………………………………………

375
Merchant Questionnaire
Dear Respondent, I am Sonal, Research Scholar, pursuing PhD from
ICFAI University Jharkhand on the topic “Adoption and Usage of
Mobile Payment Systems by Consumers and Merchants: a
Comparative Study in Ranchi and Kolkata”. I request your valuable
time and cooperation for filling this questionnaire that will take about
10 minutes of your time. Your help is highly solicited to make the
study meaningful. Your response will be kept confidential.
1. Gender :
Male Female
2. Age :
15 to 25 yrs
26 to 40 yrs
41 to 60 yrs
61 yrs and above
3. Educational qualification:
Below intermediate
+2/Intermediate
Graduate
Post graduate or
higher
4. When a new technology is introduced in the market :
I am usually among
the first to use
I wait for others to use
first
I am among late users
I prefer using old
technology only
5. Do you keep your business updated with latest technology
Yes No
6. Do you know about Mobile Payment System
Yes No
7. Do you have any Mobile Payment app in your phone
Yes No
8. Do you accept payment through Mobile Payment System :
Yes , using
No, never used
Earlier used to, now abandoned
NON USERS (I DON’T ACCEPT MOBILE PAYMENT) :-
9. Why don’t you accept mobile payment:
Haven’t heard of MPS
Cost involved to use MPS
Not comfortable with mobile payment process
Comfortable with cash mode only
No consumer demand
No lucrative offer from service providers
Not comfortable with smartphone

376
Not compatible with my nature of business
Others please specify …..................................
10. When you don’t accept mobile payment, what percent consumers demand
for this payment option:
1-5%
6-10%
11-15%
More than 15%
ABANDONED (I USED TO ACCEPT MOBILE PAYMENT, NOW
ABANDONED) :-
11. What is reason for abandonment (you may tick more than one option):
Extra charges
Problem faced in using
Consumers not paying through MPS
Not compatible with my business model
No lucrative offer from service providers
Others please specify …..................................
USERS( I ACCEPT MOBILE PAYMENT) :-
12. Please rank the following methods of payment in order of preference of
acceptance, on a scale of 1 to 5 where 1 is least preferred and 5 is most
preferred :
Description Your ranking from 1
to 5
Cash
Debit / Credit card
Net banking
Mobile payment
Others specify ….............
13. What mobile payment modes you have installed:
PayTm
Freecharge
PhonePe
Jio Money
Airtel Money
Bank specific
app(specify
…...............................
..)
Tez
PayPal
BHIM
MobiKwik
NFC
I have my own app
Others please specify
…...............................
...
14. For what purpose/s do you use mobile payment (you may tick more than one
option):
Sales transaction
Purchasing stock
Payment to vendors

377
Purchasing of
services
Payment of
electricity bills etc
Paying insurance
premium
15. What percent of your total monthly sales come through mobile payment:
Less than 5%
6-10%
11-15%
16-20%
More than 20%
16. Out of 100, how many consumers demand for mobile payment option
….........
17. Do you encourage consumer to pay through MPS
Yes No
18. How do you agree with these statements
Strongly Disagree- 1, Disagree- 2, Neutral- 3, Agree- 4 and Strongly Agree- 5
Why do you accept mobile payment? S.No. Description 1 2 3 4 5
1 I accept mobile payment to keep out of change issue
2 The problem of accepting card in case of small penny
transaction is now resolved by mobile payment
3 I accept mobile payment because it has reduced time in
processing payment
4 I use mobile payment as it has made money transfer very
easy
5 I find mobile payment very useful during rush hours
6 I accept mobile payment to avoid card transaction failures
7 I accept mobile payment as it helps me to go digital,
without paying PoS terminal charges to bank
8
I accept mobile payment as it adds on to my business
sales volume
9 I accept mobile payment because it was easy for me to
adapt MPS
10 I accept mobile payment because receiving money
through mobile payment is very easy
11 I accept mobile payment because I find it very convenient as I don’t have to handle cash or swipe card
12 I accept mobile payment because my consumers insist to
pay through it
13 I accept mobile payment to give consumer an extra
payment option
14 I accept mobile payment so that I don’t lose consumers to
other merchants
15 I feel merchant technical- support of mobile payment
system is appropriate
16 I have full trust on my mobile payment app provider
17 I am fully satisfied from the current offerings by app
provider
18 I feel that per day/month limit should be increased

378
19 I accept mobile payment to support cashless India
20 I accept mobile payment to curb black money
21 I have started accepting mobile payment after
demonetisation
22 I still think government should give more relaxation to
merchant community for accepting mobile payment
23 I will continue using mobile payment in future
19. What do you feel about your city in aspect of MPS?
Strongly Disagree- 1, Disagree- 2, Neutral- 3, Agree- 4 and Strongly Agree-
5 S.No. Description 1 2 3 4 5
1 I feel there is less awareness about MPS in my city
2 I feel mobile payment is not accepted everywhere in my
city
3 I feel mobile payment is new trend in my city
4 I find wide acceptance of mobile payment, a distant dream for my city
20. While accepting mobile payment, do you feel your financial data is at risk
Yes No
21. What major obstacle do you feel exist in success of mobile payment (you
may choose more than one) :
Cash & card is still
preferred
Poor promotion by
app provider
Low consumer
interest
Network availability
Security
Low digital literacy
22. Would you like to develop my own mobile payment app
Yes
No
23. Any suggestions you want to give for improvement of MPS
…..............................................................................................
Personal information
24. Your name (optional) …………………………………………………….
25. Phone number (optional)………………………………………………
26. What business are you into ………………………………………………..

379
PUBLICATIONS AND PRESENTATIONS
List of Publications
Sonal., Kumar, V., & Swain, K. R. (2018). Awareness of Mobile
Payment System Among Consumers: A Comparative Study in Ranchi
and Kolkata. IUJ Journal of Management, 6(2), 30-33.
Sonal., Kumar, V., & Swain, K. R. (2018). Usage of Mobile Payment
by Consumers: A Study of Kolkata City. Vaichariki, 8(1), 447-453.
Sonal., & Kumar, V. (2019). Status of M-payment and Its Adoption by
Consumers. IUJ Journal of Management, 7(1), 63-68.
Sonal., Swain, K. R., & Kumar, V. (2020). Mobile Payments: An Aid
to Safe Payments During Pandemic Covid 19. Sambodh, 43(3), 39-44.
List of Presentations in seminars and conferences
Presented a paper titled “Impacts of Cyber Security Threats on
Adoption of Mobile Payment System” in National Seminar on Cyber
Security: Emerging Trends on November 2017.
Presented a paper titled “Mobile Payment System by Merchants in an
Indian Context: A Study on Kolkata City” in Globsyn Management
Conference on March 2018.
Presented a paper titled “Usage of Mobile Payment Systems by
Consumers: A Comparative Study in Ranchi and Kolkata” in 5th
National Seminar on Innovation in Marketing: A Path to Overcome
Economic Slowdown on Febuary 2020
