adoption of integrated pest management technologies: a
TRANSCRIPT
i
Adoption of Integrated Pest Management Technologies: A Case Study of Potato Farmers in Carchi, Ecuador
Maria Mauceri; [email protected], Jeff Alwang; [email protected], George Norton; [email protected], and
Victor Barrera; [email protected]
Selected Paper prepared for presentation at the American Agricultural Economics Association Annual Meeting, Providence, Rhode Island, July 24-27, 2005
Agricultural and Applied Economics Department Virginia Tech
Blacksburg, Virginia
Keywords: Integrated Pest Management, Adoption, Ecuador, Pesticides, Ordered Probit
Copyright © 2005 by M.Mauceri, J. Alwang, G. Norton, and V. Barrera. All rights reserved. Readers may make verbatim copies of this document for non-commercial purposes by any means, provided that this copyright notice appears on all such copies.
1
BACKGROUND
Introduction
Agricultural development is essential for improved well-being in rural Ecuador.
Approximately 40% of the population relies on agriculture as its primary source of
income. In the highlands, potatoes are a major staple, and more than 90,000 producers
grow them on about 60,000 hectares of land. Potato production is associated with heavy
use of chemical inputs--pesticides and fertilizers--to manage pests and optimize profits.
Concerns have emerged about the sustainability of Ecuador�s potato crop as rising input
costs have created a cost squeeze and public health officials are increasingly concerned
about adverse consequences of pesticide over use. These consequences include short and
long-term health problems, water and soil contamination, buildup of resistance in pest
populations, and the killing of beneficial insects. Most pesticides are applied in liquid
form using backpack sprayers and not all farmers utilize protective equipment while
spraying (Crissman et al., 1998). Besides negative health and environmental impacts,
pesticide use incurs a significant economic cost for producers. Pesticide expenditures
typically comprise between 12% and 20% of production cost (Barrera et al., 2003).
Since the 1940s, Carchi province in northern Ecuador has been steadily increasing
its share of potato production and currently produces more than any other region. Carchi
farmers average between 15 and 20 tons per hectare (Barrera et al., 1999) while average
yields for Ecuador are around 7 tons per hectare. Of all cultivated crops in Carchi,
potatoes use the largest quantities of pesticides and fertilizers (citation). Producers need
alternative pest management approaches that are feasible, economically sustainable, and
effective at controlling pests.
2
Integrated Pest Management (IPM) is an approach that can help lower production
costs, reduce exposure to pesticides, and improve long-term sustainability of the
agricultural system. The national agricultural research institution in Ecuador (INIAP),
supported in part by the IPM Collaborative Research Support Project (IPM CRSP)
funded by USAID, has developed technologies to manage potato pests. Information
regarding these technologies reaches farmers through several diffusion mechanisms,
including farmer field schools (FFSs), field days, exposure to other farmers, and written
media (e.g. pamphlets). Given only limited involvement of the public sector in
technology transfer, decision makers need to understand the relative cost effectiveness of
information dissemination methods. This understanding can help promote better
technology transfer and, in so doing, effectively help sustain potato production in
Ecuador.
This study had several objectives: (1)to analyze the extent of IPM use in Carchi
and identify the determinants and constraints to IPM adoption; (2)to evaluate how IPM
technologies are spread among potato farmers in Carchi, Ecuador; and (3)to compare the
cost-effectiveness of the FFSs to other information dissemination methods. Carchi is of
interest because it is Ecuador�s primary potato production region, its potato producers
suffer damage from the three major potato pests, and because it shares a border with
Colombia. There is interest in generating stable agriculture-based livelihoods in the
region.
IPM Solutions
Three main pests significantly impact potato production in Ecuador. They are, in
order of economic significance, late blight (Phytophthora infestans), Andean Potato

3
Weevil (Premnotrypes vorax), and the Central American Tuber Moth (Tecia solanivora).
Studies in the 1990s in northern Ecuador reported that nearly 100% of farmers reported
being affected by late blight, 80% by Andean Weevil and 6% by tuber moth (INIAP,
1998). The IPM CRSP conducted original research (complementing existing research) to
develop strategies for effective management of these three pests.
Late blight is a fungal disease that attacks potatoes around the world. Yield losses
depend on the virulence of the fungal strain and whether farmers have the resources to
use available fungicides. Studies on lower virulence strains estimate losses at 15%-30%
of the crop (Lang, 2001). Without chemical intervention, more lethal strains put farmers
at great risk of losing much of their crop.
The prime means of control for late blight is fungicide applications. Farmers in
Carchi spray their fields between 1 and 11 times during a crop cycle, with most farmers
spraying 6 times (Barrera et al., 2003; Crissman et al., 1998). Because late blight is
difficult to control once the disease has become established, farmers spray as a
preventative strategy. IPM CRSP recommendations include: (1)use of resistant varieties1,
(2)field sanitation, (3)crop rotations, (4)monitoring to determine need for spray
applications , and (5)alternating different types of fungicides to prevent the buildup of
resistance.
The Andean Weevil can also cause significant damage without proper
management. Up to 80% crop damage has been estimated in infested fields in Ecuador
(Muñoz and Cruz, 1984). Farmers typically use three strategies against the Andean
Weevil: (1)insecticides to target the larval stage of the insect, namely Carbofuran and
1 Varieties were developed through a series of CIP-sponsored and IPM CRSP research including breeding and consumer acceptance surveys.

4
Methamidofos (both of which are restricted in the U.S. because of high toxicity), (2)crop
rotations, and (3)use of undamaged seed.
The main mistake in the conventional approach is targeting the larval stage of the
insect. Insecticidal sprays are more effective when targeting adult populations. The IPM
CRSP recommends the use of traps to monitor and target adult populations. Traps consist
of foliage from potato plants baited with Acefato, (a relatively low-toxicity insecticide).
If populations reach a specific threshold, farmers are advised to spray insecticide at the
base of plants since adult weevils tend to remain at soil level. At harvest, all tubers should
be completely removed from the field. Farmers are advised to wait 30 days before
replanting, causing larva to die off before the next crop of potatoes is established.
The tuber moth is not yet a big problem for farmers in Ecuador (Barrera et al.,
1999), however, it has an affinity for temperate valleys like those found in Carchi. It can
cause damage to pre-harvested tubers, as well as stored potatoes. In either case, current
methods of control use highly toxic insecticides (Carbofuran and Carbosulfan).
In the field, IPM techniques include: (1)pheromone traps to monitor and track
adult populations and (2)spraying low doses of Profenos when populations reach a
specified threshold. In storage farmers are advised to use baculovirus to kill insects and
keep the harvested potatoes covered. Other recommendations include: (1)earlier planting
and harvests to avoid the dry season (tuber moths prefer dry weather to slip between
cracks in the soil), (2)hilling up of soil around plants, (3)crop rotations, and
(4)disinfecting seed with low-toxicity pesticides such as Carbaryl and Malathion.

5
IPM vs. Conventional Technologies: Is IPM Profitable?
Because of the absence of public support for agricultural extension in Ecuador,
the IPM CRSP had to explore alternate means of technology dissemination. From 1998-
2003, with funding from FAO and later the IPM CRSP, 18 FFSs were set up in the
Carchi region. In three FFS field trials, cost-benefit analysis was used to compare
conventional to IPM techniques. In all cases, input costs were significantly lower on IPM
plots. Yields were higher in two out of three cases. In the third case, yields were the same
but the costs of production were lower on the IPM plot. Potential factors influencing
differences in yield and production costs include changes in fertilization, type of seed and
pest management strategies. Taking into account costs and benefits, net profits were
higher in all cases for the FFS/IPM plots. Using field data from all 18 FFSs, yield per
dollar of pesticide input was higher in 17/18 cases for IPM over conventional plots. A
similar analysis was done for yield per dollar input of pesticides and labor. In this latter
case, IPM plots were more productive in all cases (Barrera et al., 2003). IPM is a cost-
effective choice for potato farmers and requires no additional capital. Extra labor only
appears to be necessary at harvest time. Inputs such as pesticides and fertilizers are used
less in IPM plots and offset the increase in costs from purchase of improved seed.
Farmer Access to IPM Information
IPM techniques are relatively complex and therefore require sufficient knowledge
acquisition for successful implementation to occur. The complexity of the IPM message
can affect which method of diffusion will have the greatest impact. More complex
messages include knowledge of the pest life cycle, understanding the use of traps and

6
monitoring of pest populations, use of systemic versus protectant pesticides, and use of
different active ingredients to prevent buildup of resistance in pests. Other messages can
be understood with minimum explanation, such as early harvests, crop rotations, and use
of resistant varieties.
FFSs are a relatively recent approach in the education of developing-world
farmers. This program was created in response to deficiencies in other agriculture
education programs. FFS attempt to improve upon previous methods of educating
farmers by using a participatory rather than a top-down approach. FFSs focus on teaching
farmers how to think critically about production problems. This system allows farmers to
evaluate their farm situation and use available technologies according to their needs.
However, because of their high program costs ($30/farmer), FFSs rely upon farmer
networks to facilitate the spread of information and adoption to increase the cost-
effectiveness of the program. Field days are able to give pest management information to
large groups of farmers at one time for a fraction of the cost ($1.50/farmer). However, a
farmer will not receive as much information as a graduate of the FFS program. Pamphlets
are the least expensive ($.50/farmer), but depend largely on farmer literacy and
complexity of the IPM message (Barrera, conversation).
Selection for FFS participants in Carchi is based on four factors: (1)interest in the
program, (2)potatoes are the principle crop on the farmer�s land, (3)desire to share/diffuse
information with other farmers, and (4)farmers who are creative and innovative. The
selection criteria raises questions about an inherent bias in the FFS approach that causes
researchers to over-estimate the impact of FFS on adoption (Feder et al., 2003) FFSs may
7
simply be educating only those farmers who would adopt regardless of the information
source and those that already strive to use alternative strategies.
METHODS
We employed a combination of qualitative and quantitative methods to achieve
the study objectives. A comprehensive survey was conducted of 109 potato farmers in
Carchi. Respondents included 30 FFS participants, 28 farmers who had been exposed to
FFS-participants, and 51 randomly selected farmers. Farmers were asked a series of
questions including the following information categories: demographic and
socioeconomic, potato production, pesticide usage and handling, IPM knowledge and
implemented techniques, and knowledge about the three most significant potato pests.
The quantitative information was combined with qualitative interviews, information on
budgets and costs from the FFSs, and expert opinion.
The analysis involved three steps: (1) determination of spread of information and
sources of information by IPM adoption level and knowledge scores; (2) analysis of the
determinants of adoption using an ordered probit model; and (3) use of the econometric
results and information on program costs to examine cost effectiveness.
For step (1) farmers were asked a series of questions during the survey to
determine knowledge of IPM and use level. Using descriptive statistics and differences in
means, we analyzed the relationships between access to information, IPM knowledge,
and adoption.
In step (2) we use the IPM adoption index value as the dependent variable in an
ordered probit model. The independent variables included three categories of potential

8
determinants of adoption including: farmer characteristics, economic factors, and
institutional factors. Technology characteristics (complexity and labor requirements) and
farmer perceptions (perceived profitability, risk, and preferences) were not considered as
separate variables in the model, but were used qualitatively to provide insights into model
results. Specific variables included in the econometric model were: farmer age,
education, household size, household members over the age of 14 (indication of labor
availability), land holdings (wealth indicator), illness from pesticides, and five variables
representing the sources of information for acquiring knowledge about IPM (noted
above).
In step (3), marginal impacts of significant variables were calculated to compare
the impacts of the significant independent variables. Information on these impacts was
compared to per farmer costs for FFSs, field days, and pamphlets to estimate relative
cost-effectiveness of these information diffusion mechanisms.
Model of Adoption
The adoption model is based on the theory that farmers make decisions to
maximize their expected utility or benefits. Benefits may include increased profitability,
health, food security, lower risk, and environmental sustainability. Farmers adopt
technologies when their expected utility from the new technology exceeds that of the
current technology. Many factors affect farmers� expectations (e.g. farmer characteristics,
economic barriers, access to information, technology characteristics, and farmer
perceptions).

9
Farmer characteristics often considered in adoption models include: age, human
capital (formal or informal education), and household size. Age is typically found to be
negatively correlated with adoption (Adesina and Zinnah, 1993). This relationship is
explained by the assumption that as farmers grow older, there is an increase in risk
aversion and a decreased interest in long-term investment in the farm. Younger farmers
are typically less risk-averse and are more willing to try new technologies.
Formal education increases the farmer�s ability to understand and respond to
information concerning new technologies (Feder and Slade, 1984). Human capital
increases the ability to think analytically, make practical adoption decisions, and use a
technology appropriately (Rahm and Huffman, 1984). Studies show that farmers with
more formal education tend to adopt more agricultural technologies (Chaves and Riley,
2001; Strauss et al., 1991; Feder et al., 1985). Adoption also occurs from increases in
knowledge and human capital due to FFS participation (Bonabana, 1998), participation in
farmer groups (Caviglia-Harris, 2003; Strauss et al., 1991; Adesina et al., 2000), and
exposure to extension information (Bonabana, 1998).
Household size is another consideration of adoption. Larger households adopt
new technologies more often than smaller households, holding other factors constant
(Bonabana, 1998; De Souza Filho et al., 1999). Households containing members able to
participate in on-farm activities enable farmers to adopt labor-intensive technologies
(Feder et al., 1985). If technologies are capital-intensive, household members may work
off-farm to generate income to purchase farm inputs.
Economic barriers may discourage or prevent adoption including: wealth (farm
size, income), access to credit, and labor availability. In general, populations with higher
10
incomes exhibit a willingness to accept more risk and adopt complex technologies (Batz
et al., 1999; Fliegel and Kivlin, 1966). Farmers with larger farms invest more in
information acquisition and accumulate knowledge that leads to adoption (Feder and
Slade, 1984). On the other hand, wealth can be associated with the use of more
pesticides. Some studies suggest that farmers prefer capital-intensive over labor-intensive
technologies (Goodell et al., 1989; Orr, 2003).
Access to information affects farmers� perceptions of risk. Having sufficient
knowledge about the technology enables farmers to optimize these decision-making
processes (Feder et al., 2003). Feder et al found that farmers consider other farmers to be
the most important source of agriculture information, but prefer more specifically trained
sources as the complexity of the message increases. The acquisition of knowledge may
lead to a change in farmer perceptions about risk and profitability. Thus, farmers who are
knowledgeable about profit-enhancing technologies will choose to adopt (Negatu and
Parikh, 1999). Nowak concluded that information is important for the adoption of soil
conservation practices because without information, farmers believe that the technologies
are unprofitable and risky (Nowak, 1987). Technology characteristics, such as capital and
labor requirements, can also affect farmers� decisions to adopt IPM.
The variables affecting adoption included in this study are described in Table 8.
The Empirical Model
Qualitative response models are often used when a dependent variable takes one
of a number of discrete values. Most adoption studies model the decision to adopt as a
dependent categorical variable. Such models estimate the probabilities of adoption using
11
Maximum Likelihood Estimation (MLE) while accounting for the discrete nature of the
dependent (adoption) variable (Greene, 1993).
Binary response models (e.g. probit, logit) are used where adoption is considered
as a yes or no decision by farmers. However, farmers often manage risk through
diversification, and this strategy may be reflected in partial adoption of technologies
(Ersado et al., 2004). In this study, we look not only at whether adoption occurs, but also
at the intensity of adoption. Therefore, the model needs to consider more than two
possible responses. With five possible ordered values for Y (adoption levels), a
categorical ordered response model is required. An ordered probit model allows for
multiple ordered values for the dependent variable and analyzes the effect of each
independent variable on the dependent variable. The ordered probit measures the
probability that this dependent variable (Yi , for the ith household) falls in one of five
discrete categories conditioned on levels of the independent variables(Xi):
P(Y=1|Xi) = P(Y=1|x1, x2 ,...,xk) = E(Yi|Xi) The general ordered probit assumes there is a latent or unobserved variable (Yi*) such that: Yi* = Xiβ + ui (i = 1, 2,...,n) We observe the actual placement in the discrete category: Yi = 0 if Yi* < γ1 Yi = 1 if γ1 ≤ Yi* < γ2
Yi = 2 if γ2 ≤ Yi* < γ3
Yi = 3 if γ3 ≤ Yi* < γ4
Yi = 4 if γ4 ≤ Yi* < γ5
Yi = 5 if γ5 ≤ Yi* where ui are the residuals or error term and the β and γi�s are parameters to be estimated. (see Greene, 1993: pgs. 511-537.)

12
In this model, Y (the dependent variable) represents the potential level of IPM
adoption by farmers. Adoption intensity is defined according to the following five
categories:
1 = 0% adoption 2 = 0% - 25% adoption 3 = 25% - 50% adoption 4 = 50% - 75% adoption 5 = 75% - 100% adoption Adoption percentages were calculated by taking the total number of
recommended IPM activities (17) and determining the percentage of activities utilized by
each farmer.
Probit model coefficients (β) report on the effect of an independent variable on
the probability of adoption in each of the five categories. These coefficients give an
indication of positive or negative impact, but do not relay information concerning the
magnitude of the effect2. Using a transformation function, the model creates a linear
index of the probabilities with a cumulative standard normal distribution. The
probabilities are evaluated by looking at the linear function Φ(Xiβ):
Pr(Yi = 0) = Pr(Yi*<γ1) = Pr(Xiβ+ui< γ1) Pr(Yi = 1) = Pr(γ1≤Yi*< γ2) = Pr(γ1≤Xiβ+ui< γ2) Pr(Yi = 2) = Pr(γ2≤Yi*< γ3) = Pr(γ2≤Xiβ+ui< γ3) Pr(Yi = 3) = Pr(γ3≤Yi*< γ4) = Pr(γ3≤Xiβ+ui< γ4) Pr(Yi = 4) = Pr(γ4≤Yi*< γ5) = Pr(γ4≤Xiβ+ui< γ5) Pr(Yi = 5) = Pr(Yi*≥ γ5) = Pr(Xiβ+ui≥ γ5)
where γi�s represent the thresholds or cutoffs for placement of Yi* in the discrete
adoption categories. Marginal effects are calculated using the linear probability index and
tell us the effect on the probability of adopting in a particular category for changes in the
independent variables (dPr(Y=0,1,2,3,4, and 5)/dXi).
2 See Greene, pp. 512-515 (Binary-response models) and 529-531 (Models for more than two discrete responses).
13
RESULTS - Descriptive Analysis
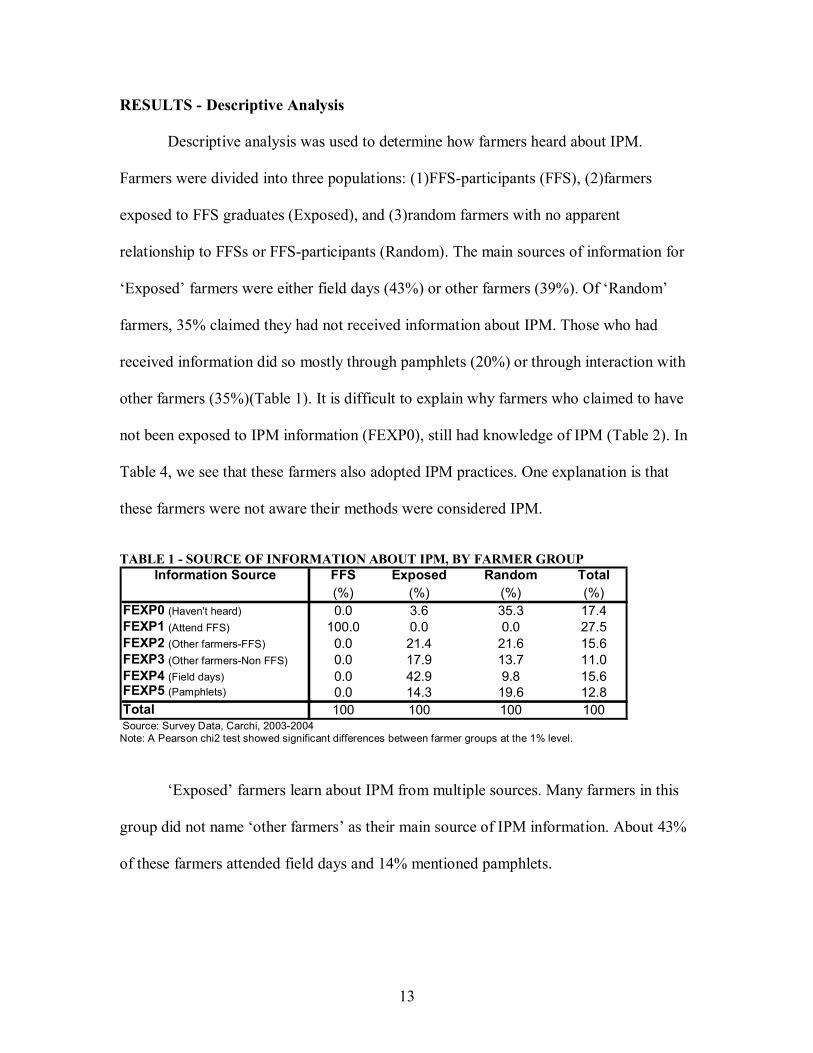
Descriptive analysis was used to determine how farmers heard about IPM.
Farmers were divided into three populations: (1)FFS-participants (FFS), (2)farmers
exposed to FFS graduates (Exposed), and (3)random farmers with no apparent
relationship to FFSs or FFS-participants (Random). The main sources of information for
�Exposed� farmers were either field days (43%) or other farmers (39%). Of �Random�
farmers, 35% claimed they had not received information about IPM. Those who had
received information did so mostly through pamphlets (20%) or through interaction with
other farmers (35%)(Table 1). It is difficult to explain why farmers who claimed to have
not been exposed to IPM information (FEXP0), still had knowledge of IPM (Table 2). In
Table 4, we see that these farmers also adopted IPM practices. One explanation is that
these farmers were not aware their methods were considered IPM.
TABLE 1 - SOURCE OF INFORMATION ABOUT IPM, BY FARMER GROUP
Information Source FFS Exposed Random Total(%) (%) (%) (%)
FEXP0 (Haven't heard) 0.0 3.6 35.3 17.4FEXP1 (Attend FFS) 100.0 0.0 0.0 27.5FEXP2 (Other farmers-FFS) 0.0 21.4 21.6 15.6FEXP3 (Other farmers-Non FFS) 0.0 17.9 13.7 11.0FEXP4 (Field days) 0.0 42.9 9.8 15.6FEXP5 (Pamphlets) 0.0 14.3 19.6 12.8Total 100 100 100 100
Source: Survey Data, Carchi, 2003-2004 Note: A Pearson chi2 test showed significant differences between farmer groups at the 1% level.
�Exposed� farmers learn about IPM from multiple sources. Many farmers in this
group did not name �other farmers� as their main source of IPM information. About 43%
of these farmers attended field days and 14% mentioned pamphlets.
14
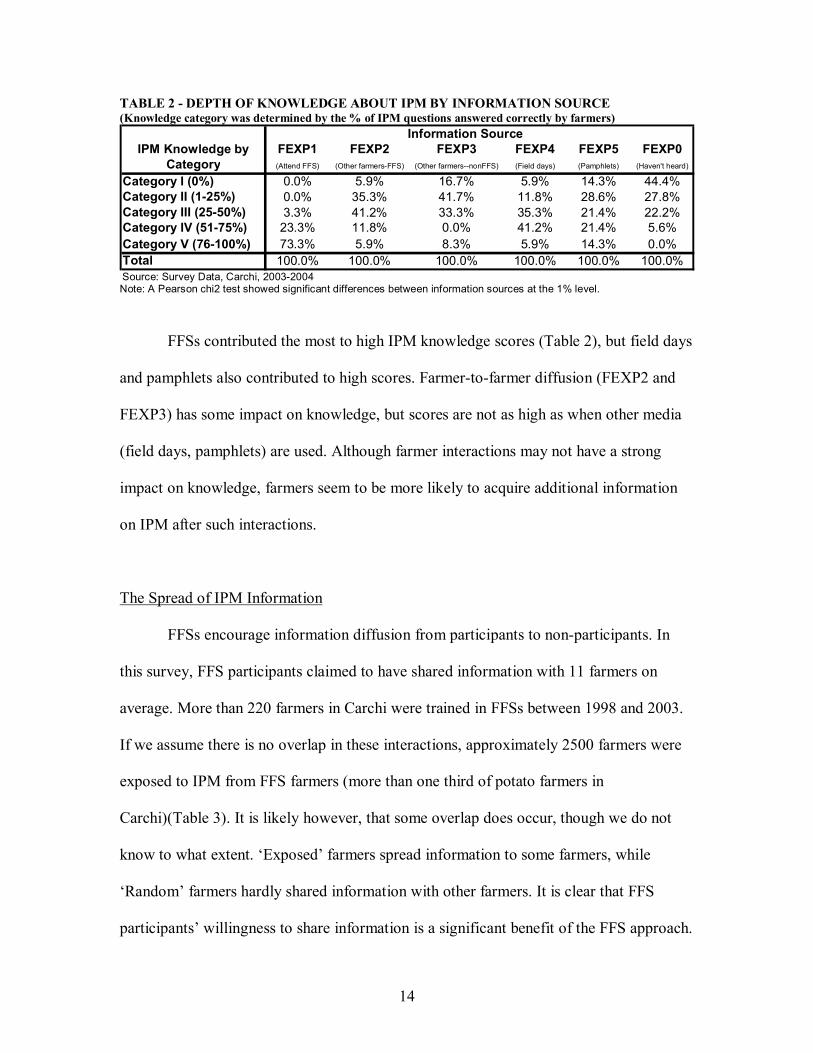
TABLE 2 - DEPTH OF KNOWLEDGE ABOUT IPM BY INFORMATION SOURCE (Knowledge category was determined by the % of IPM questions answered correctly by farmers)
Information SourceIPM Knowledge by FEXP1 FEXP2 FEXP3 FEXP4 FEXP5 FEXP0
Category (Attend FFS) (Other farmers-FFS) (Other farmers--nonFFS) (Field days) (Pamphlets) (Haven't heard)
Category I (0%) 0.0% 5.9% 16.7% 5.9% 14.3% 44.4%Category II (1-25%) 0.0% 35.3% 41.7% 11.8% 28.6% 27.8%Category III (25-50%) 3.3% 41.2% 33.3% 35.3% 21.4% 22.2%Category IV (51-75%) 23.3% 11.8% 0.0% 41.2% 21.4% 5.6%Category V (76-100%) 73.3% 5.9% 8.3% 5.9% 14.3% 0.0%Total 100.0% 100.0% 100.0% 100.0% 100.0% 100.0%
Source: Survey Data, Carchi, 2003-2004 Note: A Pearson chi2 test showed significant differences between information sources at the 1% level.
FFSs contributed the most to high IPM knowledge scores (Table 2), but field days
and pamphlets also contributed to high scores. Farmer-to-farmer diffusion (FEXP2 and
FEXP3) has some impact on knowledge, but scores are not as high as when other media
(field days, pamphlets) are used. Although farmer interactions may not have a strong
impact on knowledge, farmers seem to be more likely to acquire additional information
on IPM after such interactions.
The Spread of IPM Information
FFSs encourage information diffusion from participants to non-participants. In
this survey, FFS participants claimed to have shared information with 11 farmers on
average. More than 220 farmers in Carchi were trained in FFSs between 1998 and 2003.
If we assume there is no overlap in these interactions, approximately 2500 farmers were
exposed to IPM from FFS farmers (more than one third of potato farmers in
Carchi)(Table 3). It is likely however, that some overlap does occur, though we do not
know to what extent. �Exposed� farmers spread information to some farmers, while
�Random� farmers hardly shared information with other farmers. It is clear that FFS
participants� willingness to share information is a significant benefit of the FFS approach.

15
TABLE 3 - FARMER TO FARMER SPREAD OF IPM INFORMATION FFS Exposed Random Total
(#) farmers who spreadIPM info to other farmers 28/30 25/28 4/51 57/109
How many total # of farmersdid they spread info to? 332 61 14 407
On average, how many individual farmers did each 11 2.17 0.27 3.73farmer talk to about IPM?Source: Survey Data, Carchi, 2003-2004
Adoption of IPM
Of 109 farmers, 42.2% had moderately high to high adoption (Cat. IV and V),
37.6% had low to moderate adoption (Cat. II and III), and 20% did not adopt any IPM
(Cat. I) (Table 4). The majority of high level adopters attended FFS (70%). �Exposed�
farmers used less IPM than the FFS participants but more than random farmers.
TABLE 4 - DEGREE OF ADOPTION OF IPM BY INFORMATION SOURCE
Information SourceIPM Use by FEXP1 FEXP2 FEXP3 FEXP4 FEXP5 FEXP0 TotalCategory* (Attend FFS) (Other farmers-FFS) (Other farmers--nonFFS) (Field days) (Pamphlets) (Haven't heard) (%)
Category I (0%) 3.3% 11.8% 33.3% 5.9% 21.4% 61.1% 20.20%Category II (1-25%) 6.7% 29.4% 33.3% 17.6% 21.4% 11.1% 17.40%Category III (25-50%) 20.0% 29.4% 16.7% 23.5% 21.4% 5.6% 20.20%Category IV (51-75%) 43.3% 23.5% 8.3% 47.1% 35.7% 22.2% 32.10%Category V (76-100%) 26.7% 5.9% 8.3% 5.9% 0.0% 0.0% 10.10%Total 100.0% 100.0% 100.0% 100.0% 100.0% 100.0% 100.00%Source: Survey Data, Carchi, 2003-2004 Note: A Pearson chi2 test showed significant differences between information sources at the 1% level. *Use categories are defined by % of IPM techniques adopted
FFS were associated with the highest levels of IPM adoption. Category V
adoption was mainly observed in FFS-participants (Table 4). The highest adoption rates
in Category IV were observed with FFS-farmers, those who attended field days, or those
who read pamphlets (partially attributed to correspondingly high knowledge scores).
Farmer-to-farmer diffusion seemed to be less effective (FEXP2 and FEXP3) as both
16
knowledge scores and adoption rates were lower. The lowest rates of adoption were
observed in the farmers who had heard of IPM from non-FFS farmers (FEXP3) or
claimed they had not received information on IPM (FEXP0). Non-FFS farmers may lack
the expertise to transfer IPM knowledge effectively. In addition, farmers show a
preference for more experienced individuals when learning IPM technologies. (Owens
and Simpson, 2002)
Adoption: Technology Characteristics and Farmer Perceptions
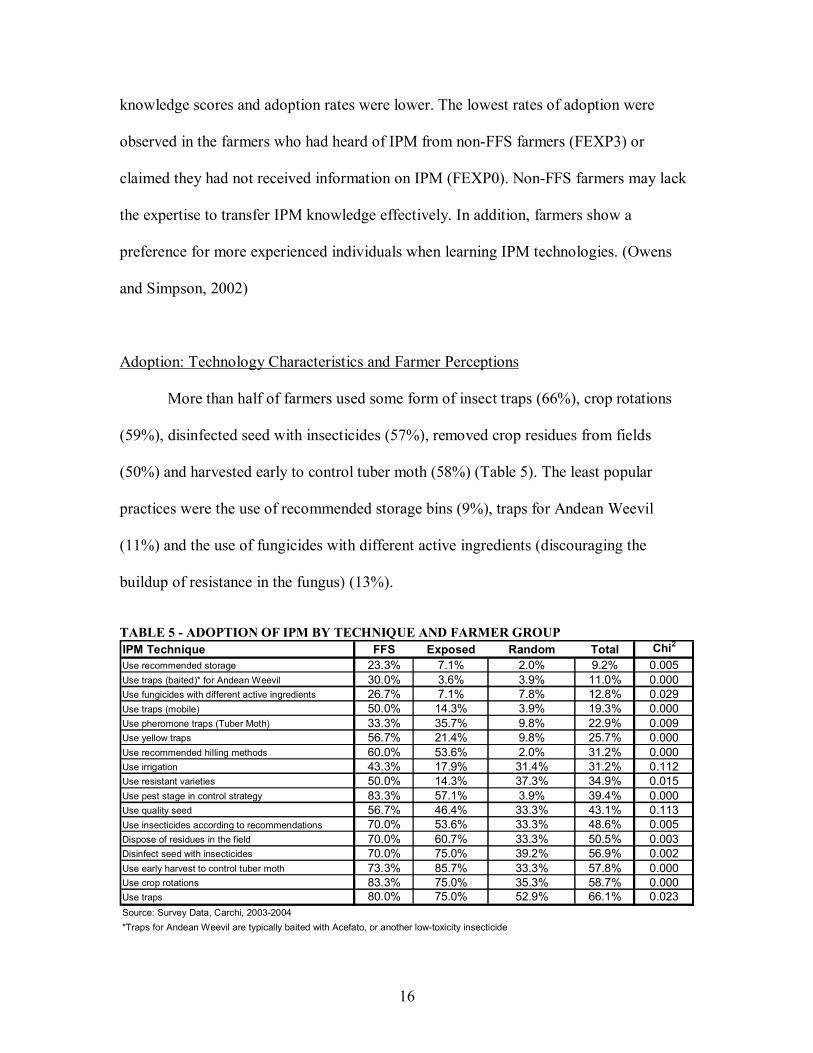
More than half of farmers used some form of insect traps (66%), crop rotations
(59%), disinfected seed with insecticides (57%), removed crop residues from fields
(50%) and harvested early to control tuber moth (58%) (Table 5). The least popular
practices were the use of recommended storage bins (9%), traps for Andean Weevil
(11%) and the use of fungicides with different active ingredients (discouraging the
buildup of resistance in the fungus) (13%).
TABLE 5 - ADOPTION OF IPM BY TECHNIQUE AND FARMER GROUP IPM Technique FFS Exposed Random Total Chi2
Use recommended storage 23.3% 7.1% 2.0% 9.2% 0.005Use traps (baited)* for Andean Weevil 30.0% 3.6% 3.9% 11.0% 0.000Use fungicides with different active ingredients 26.7% 7.1% 7.8% 12.8% 0.029Use traps (mobile) 50.0% 14.3% 3.9% 19.3% 0.000Use pheromone traps (Tuber Moth) 33.3% 35.7% 9.8% 22.9% 0.009Use yellow traps 56.7% 21.4% 9.8% 25.7% 0.000Use recommended hilling methods 60.0% 53.6% 2.0% 31.2% 0.000Use irrigation 43.3% 17.9% 31.4% 31.2% 0.112Use resistant varieties 50.0% 14.3% 37.3% 34.9% 0.015Use pest stage in control strategy 83.3% 57.1% 3.9% 39.4% 0.000Use quality seed 56.7% 46.4% 33.3% 43.1% 0.113Use insecticides according to recommendations 70.0% 53.6% 33.3% 48.6% 0.005Dispose of residues in the field 70.0% 60.7% 33.3% 50.5% 0.003Disinfect seed with insecticides 70.0% 75.0% 39.2% 56.9% 0.002Use early harvest to control tuber moth 73.3% 85.7% 33.3% 57.8% 0.000Use crop rotations 83.3% 75.0% 35.3% 58.7% 0.000Use traps 80.0% 75.0% 52.9% 66.1% 0.023Source: Survey Data, Carchi, 2003-2004*Traps for Andean Weevil are typically baited with Acefato, or another low-toxicity insecticide

17
Some interesting relationships between technology attribute and farmer adoption
emerge (Table 5). Although adoption intensity was significantly different across farmer
groups, the pattern of adoption was similar (i.e. least-adopted and most-adopted
technologies were consistent across groups). The activities adopted least were
recommended storage practices, use of fungicides with different active ingredients, baited
traps for Andean Weevil, irrigation, quality seed, and resistant varieties. These activities
are among the more complex practices and are those perceived to be most risky and
capital-intensive. There is also low adoption on mobile, yellow and pheromone traps (i.e.
tuber moth and leaf miner, both not major pest problems in Carchi). Among the most
adopted technologies are use of traps (in general), residue disposal, crop rotations, early
harvest, disinfection of seeds, and using insecticides as recommended. These
technologies tend to be lower risk, of low to moderate complexity, and not capital-
intensive. Several of these technologies require additional labor, indicating that labor
availability may not be a problem for farmers. Using pest stage as a control strategy has a
high adoption rate among FFS farmers, a moderate rate among �Exposed� farmers and a
low rate among �Random� farmers. Likely, this reflects the high information requirement
associated with this more complex technology.
Use of Pesticide Protective Equipment
Comparing farmer groups, FFS-participants wore the most protective gear when
spraying pesticides (Table 6). Unexpectedly, �Random� farmers used more gear than
�Exposed� farmers (Table 6). Lack of information may cause farmers to be more cautious
concerning pesticide handling.

18
TABLE 6 - PROTECTIVE CLOTHING WORN BY FARMERS (BY FARMER GROUP) FFS Exposed Random Total Chi2
Protective Gear (%) (%) (%) (%) Sig.Boots 83.3% 78.6% 94.1% 87.2% 0.001Mask 50.0% 28.6% 21.6% 31.2% 0.108Glasses 16.7% 0.0% 5.9% 7.3% 0.027Jacket 70.0% 21.4% 35.3% 41.3% 0.000Pants 43.3% 0.0% 15.7% 19.3% 0.000Gloves 83.3% 25.0% 35.3% 45.9% 0.045Source: Survey Data, Carchi, 2003-2004
Note: The disproportionate use of boots over other protective clothing is simply because in farmer fields boots are the norm. Farmer Characteristics
Farmers were predominantly male (93.6%) with a primary school education
(81.7%). Only 12% had a secondary school education. Ages of farmers ranged from 18 to
86 with nearly half between 31 and 50 (Table 7). Mean farming experience was 25.9
years and 40% had been farming for between 21 and 40 years. Household size (FHHS)
was distributed over a range from 1 to 9 members with an average of 4.9 members. The
average number of members age 14 and older (HHOLDb) was 3.7 and 1.3 for members
under the age of 14. Farmer characteristics (i.e. gender, education and age) from this
survey were comparable to other surveys conducted in Ecuador in the last 5 years
(Barrera et al., 1999).
TABLE 7 - SUMMARY STATISTICS ACROSS FARMER GROUPS FFS Partipants Exposed Group Random Sample
VARIABLE Mean SD Mean SD Mean SD F-stat Sig. (n=30) (n=28) (n=51)
FAGE 41.533 13.508 44.500 12.333 44.216 16.453 0.390 0.676EDUC 0.100 0.305 0.214 0.418 0.078 0.272 1.670 0.194FHHS 5.067 1.530 4.786 1.641 4.961 2.068 0.170 0.840HHOLDb 3.633 1.497 3.464 1.347 3.784 1.983 0.320 0.726FHEAL 0.333 0.479 0.214 0.418 0.196 0.401 1.030 0.360LSIZ2 1.460 1.543 1.285 1.138 1.013 1.879 0.760 0.470IPMKNOW *** 83.333 17.167 49.000 24.040 23.216 23.570 69.940 0.000IPMUSE*** 58.431 23.828 41.387 20.091 21.915 26.097 22.370 0.000
(**) Indicates significance at the 10% level(***) Indicates significance at the 5% level
We did not find evidence of an education or income bias in FFS-participants.
Across groups, farmer and household characteristics were essentially the same (Table 7),
although knowledge and use of IPM were significantly higher for FFS-participants.
19
Results - Multivariate Statistical Analysis
Model Iterations and Output
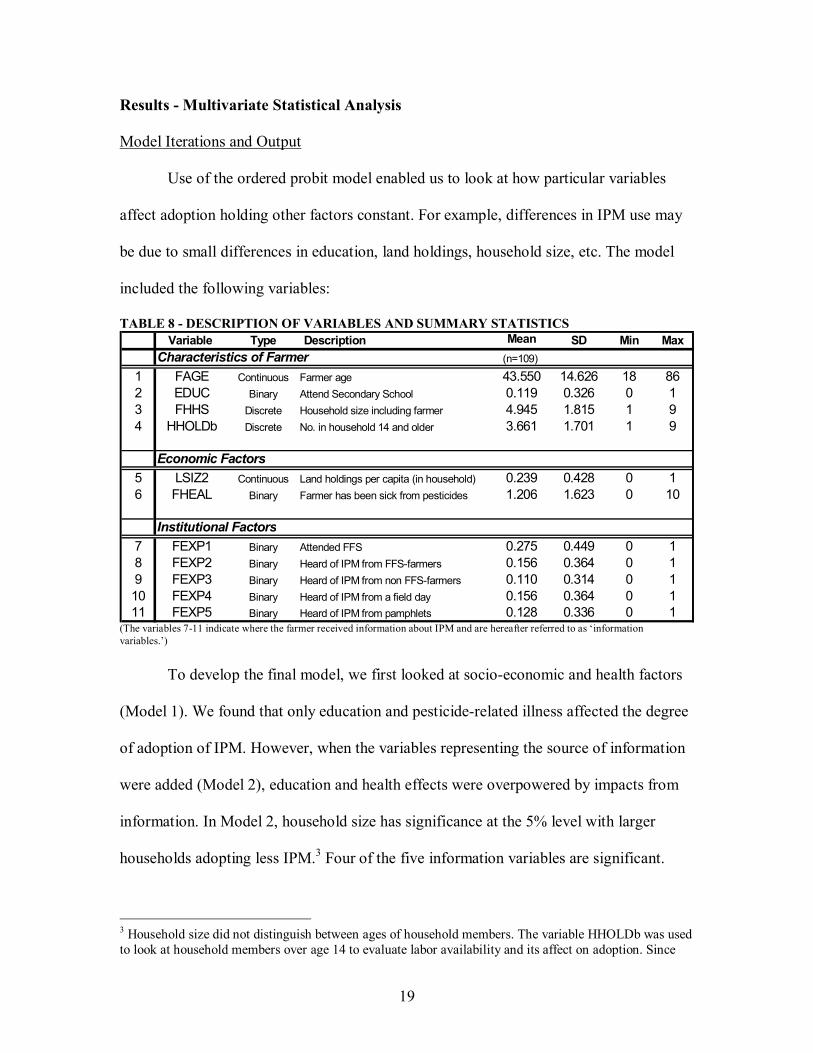
Use of the ordered probit model enabled us to look at how particular variables
affect adoption holding other factors constant. For example, differences in IPM use may
be due to small differences in education, land holdings, household size, etc. The model
included the following variables:
TABLE 8 - DESCRIPTION OF VARIABLES AND SUMMARY STATISTICS Variable Type Description Mean SD Min Max
Characteristics of Farmer (n=109)
1 FAGE Continuous Farmer age 43.550 14.626 18 862 EDUC Binary Attend Secondary School 0.119 0.326 0 13 FHHS Discrete Household size including farmer 4.945 1.815 1 94 HHOLDb Discrete No. in household 14 and older 3.661 1.701 1 9
Economic Factors5 LSIZ2 Continuous Land holdings per capita (in household) 0.239 0.428 0 16 FHEAL Binary Farmer has been sick from pesticides 1.206 1.623 0 10
Institutional Factors7 FEXP1 Binary Attended FFS 0.275 0.449 0 18 FEXP2 Binary Heard of IPM from FFS-farmers 0.156 0.364 0 19 FEXP3 Binary Heard of IPM from non FFS-farmers 0.110 0.314 0 110 FEXP4 Binary Heard of IPM from a field day 0.156 0.364 0 111 FEXP5 Binary Heard of IPM from pamphlets 0.128 0.336 0 1
(The variables 7-11 indicate where the farmer received information about IPM and are hereafter referred to as �information variables.�) To develop the final model, we first looked at socio-economic and health factors
(Model 1). We found that only education and pesticide-related illness affected the degree
of adoption of IPM. However, when the variables representing the source of information
were added (Model 2), education and health effects were overpowered by impacts from
information. In Model 2, household size has significance at the 5% level with larger
households adopting less IPM.3 Four of the five information variables are significant.
3 Household size did not distinguish between ages of household members. The variable HHOLDb was used to look at household members over age 14 to evaluate labor availability and its affect on adoption. Since
20
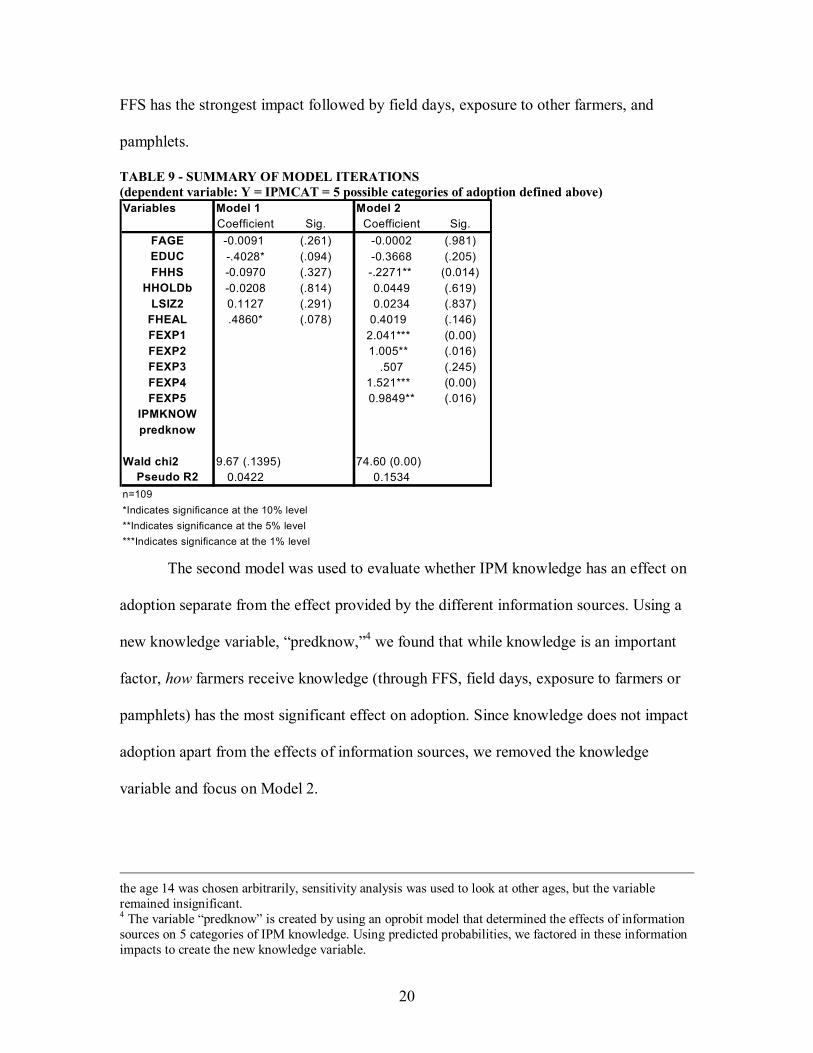
FFS has the strongest impact followed by field days, exposure to other farmers, and
pamphlets.
TABLE 9 - SUMMARY OF MODEL ITERATIONS (dependent variable: Y = IPMCAT = 5 possible categories of adoption defined above) Variables Model 1 Model 2
Coefficient Sig. Coefficient Sig.FAGE -0.0091 (.261) -0.0002 (.981)EDUC -.4028* (.094) -0.3668 (.205)FHHS -0.0970 (.327) -.2271** (0.014)
HHOLDb -0.0208 (.814) 0.0449 (.619)LSIZ2 0.1127 (.291) 0.0234 (.837)
FHEAL .4860* (.078) 0.4019 (.146)FEXP1 2.041*** (0.00)FEXP2 1.005** (.016)FEXP3 .507 (.245)FEXP4 1.521*** (0.00)FEXP5 0.9849** (.016)
IPMKNOWpredknow
Wald chi2 9.67 (.1395) 74.60 (0.00)Pseudo R2 0.0422 0.1534
n=109*Indicates significance at the 10% level**Indicates significance at the 5% level***Indicates significance at the 1% level The second model was used to evaluate whether IPM knowledge has an effect on
adoption separate from the effect provided by the different information sources. Using a
new knowledge variable, �predknow,�4 we found that while knowledge is an important
factor, how farmers receive knowledge (through FFS, field days, exposure to farmers or
pamphlets) has the most significant effect on adoption. Since knowledge does not impact
adoption apart from the effects of information sources, we removed the knowledge
variable and focus on Model 2.
the age 14 was chosen arbitrarily, sensitivity analysis was used to look at other ages, but the variable remained insignificant. 4 The variable �predknow� is created by using an oprobit model that determined the effects of information sources on 5 categories of IPM knowledge. Using predicted probabilities, we factored in these information impacts to create the new knowledge variable.

21
TABLE 10 - MARGINAL EFFECTS OF SIGNIFICANT VARIABLES ON ADOPTION RATES Information Source Degree of Adoption
Category IV (50-75%) Category V (75-100%)FEXP1 (attend FFS) 27.1* (0.000) 41.5* (0.000)FEXP2 (learn from FFS farmers) 21.1* (0.000) 17.4* (0.114)FEXP4 (attend field day) 21.7* (0.001) 32.4* (0.009)FEXP5 (used pamphlets) 20.2* (0.000) 17.4* (0.104)FHHS (household size) -6.4* (0.023) -2.3* (0.024) *Numbers represent the percent increase in the probability of adopting at the Category IV and V rates Numbers in parenthesis show significance levels (FEXP3 omitted because of lack of statistical significance in the model)
In the final model (Model 2), we used marginal analysis to compare the relative
effects of information dissemination methods for the two highest categories of adoption
intensity. Table 10 summarizes the findings for the two highest categories of adoption.
Each additional household member decreased the probability of adopting in
Category IV 6.4%. In Category V, the impact was much less at 2.3%. Of the information
variables, FEXP1 (FFS-participation) increases the probability that the farmer is in
Categories IV and V by 27.1% and 41.5% respectively. Field days had the second highest
impacts, increasing the probability of adoption 32.4% (Cat. IV) and 21.7% (Cat. V). In
Category V, exposure to FFS-participants and use of pamphlets were not significant. For
Category IV adoption, exposure to FFS-participants and pamphlets had similar impacts
on the probability of adoption as field days (21.1% and 20.2% increases).
Clearly, FFS-participation had the strongest impact on high-level adoption. Field
days also had significant impacts and were followed closely by exposure to FFS-
participants and use of pamphlets. Looking at the bigger picture, information access was
more significant than any household effects on adoption.
Using marginal analysis from the ordered probit model and cost data we can
evaluate the relative cost-effectiveness of information dissemination methods. Estimated
costs are $30/farmer for FFS, $1.50/farmer for field days and $.50/farmer for a pamphlet
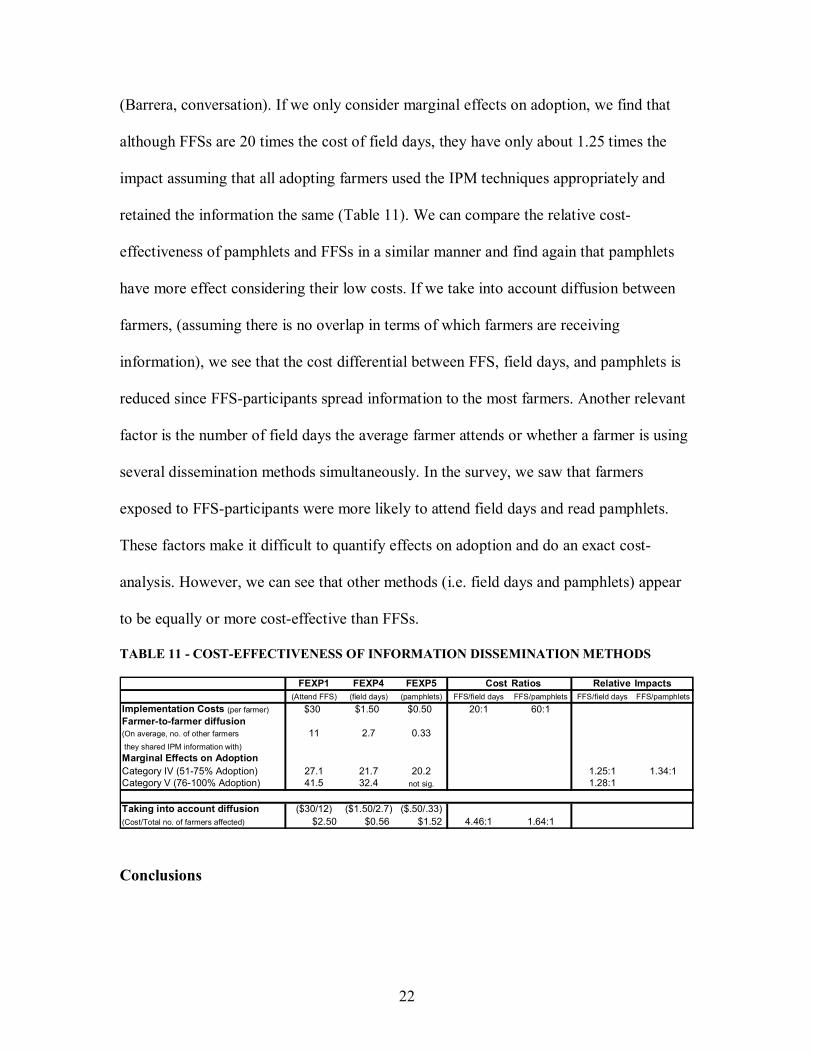
22
(Barrera, conversation). If we only consider marginal effects on adoption, we find that
although FFSs are 20 times the cost of field days, they have only about 1.25 times the
impact assuming that all adopting farmers used the IPM techniques appropriately and
retained the information the same (Table 11). We can compare the relative cost-
effectiveness of pamphlets and FFSs in a similar manner and find again that pamphlets
have more effect considering their low costs. If we take into account diffusion between
farmers, (assuming there is no overlap in terms of which farmers are receiving
information), we see that the cost differential between FFS, field days, and pamphlets is
reduced since FFS-participants spread information to the most farmers. Another relevant
factor is the number of field days the average farmer attends or whether a farmer is using
several dissemination methods simultaneously. In the survey, we saw that farmers
exposed to FFS-participants were more likely to attend field days and read pamphlets.
These factors make it difficult to quantify effects on adoption and do an exact cost-
analysis. However, we can see that other methods (i.e. field days and pamphlets) appear
to be equally or more cost-effective than FFSs.
TABLE 11 - COST-EFFECTIVENESS OF INFORMATION DISSEMINATION METHODS
FEXP1 FEXP4 FEXP5 Cost Ratios Relative Impacts(Attend FFS) (field days) (pamphlets) FFS/field days FFS/pamphlets FFS/field days FFS/pamphlets
Implementation Costs (per farmer) $30 $1.50 $0.50 20:1 60:1Farmer-to-farmer diffusion(On average, no. of other farmers 11 2.7 0.33 they shared IPM information with)Marginal Effects on AdoptionCategory IV (51-75% Adoption) 27.1 21.7 20.2 1.25:1 1.34:1Category V (76-100% Adoption) 41.5 32.4 not sig. 1.28:1
Taking into account diffusion ($30/12) ($1.50/2.7) ($.50/.33)(Cost/Total no. of farmers affected) $2.50 $0.56 $1.52 4.46:1 1.64:1
Conclusions

23
FFSs, field days, and pamphlets are effective mechanisms for transferring IPM
information to farmers and promoting adoption. Field days and pamphlets are relatively
inexpensive and effectively impact farmer knowledge and adoption of IPM. FFSs are
expensive, but have some distinct benefits such as: most complete IPM knowledge; share
information readily; hands-on experience; and use of protective equipment. Farmers
exposed to FFS-participants often go on to learn more about IPM through other
dissemination methods. It is safe to say that each of these dissemination mechanisms has
a role to play in increasing farmer knowledge and promoting adoption. An approach that
integrates the different diffusion mechanisms is recommended.
Implications for the Direction of Future Research
There are two main concerns with the FFS approach. The first concern is program
costs. Feder (2003) suggests that FFSs can lower program costs by (1)limiting the
number of sessions, (2)using better quality trainers, and (3)focusing on the most
significant IPM messages. However, because IPM for potatoes is complex, one must be
careful not to oversimplify the message. It is possible that added profitability from
adoption of IPM would enable farmers to contribute financially to FFS programs (Thiele,
2001). In addition, participants could be trained to facilitate field days and improve the
flow of information from FFS to non-FFS farmers.
The other concern with FFSs is that there is a bias towards more literate and
wealthy farmers, encouraging an education and income gap. Less motivated and illiterate
farmers will continue to know very little about IPM while motivated and literate farmers
will learn and adopt these technologies. Though we did not find evidence of a bias in our

24
study, it is a valid concern for policy making. In addition, Feder (2003) found that quality
of FFSs tend to diminish with large up-scaling. Consequently, it is important to have
other means of transferring information to farmers who are not likely to attend these
schools. Information dissemination mechanisms can supplement each other to reach a
larger and more diverse population of farmers. FFSs should be strategically dispersed
throughout the region. Analysis needs to be done to identify communities that have not
been exposed to IPM and evaluate what is the best approach for that area. Site-specific
studies are necessary in order to understand particular circumstances including: crop
characteristics, severity of pest problems, current use of pesticides, flexibility and
adequacy of IPM packages, and the availability of labor and capital.

25
References Adesina, A., D. Mbila, G. B. Nkamleu, and D. Endamana. �Econometric analysis of the determinants of adoption of alley farming by farmers in the forest zone of southwest Cameroon.� Agriculture, Ecosystems, and Environment 80(2000): 255-265. Adesina, A., and M. Zinnah. �Technology characteristics, farmers� perceptions and adoption decisions: A Tobit model application in Sierra Leone.� Agricultural Economics 9(1993): 297-311. Barrera, V., G. Norton, and O. Ortiz. Manejo de las principales plagas y enfermedades de la papa por los agricultores en la provincia del Carchi, Ecuador. INIAP. Quito, Ecuador. 1999. Barrera, V., L. Escudero, G. Norton and J. Alwang. Encontrando salidas para reducir los costos y la exposición a plaguicidas en los productores de papa. INIAP. Quito, Ecuador. 2003. Batz, F. J., K. J. Peters, and W. Janssen. �The influence of technology characteristics on the rate and speed of adoption.� Agricultural Economics 21(1999): 121-130. Bonabana-Wabbi, Jackline. �Assessing Factors Affecting Adoption of Agricultural Technologies: The Case of Integrated Pest Management (IPM) in Kumi District, Eastern Uganda.� MS thesis, Virginia Polytechnic Institute and State University, 1998. Caviglia-Harris, J. L. �Sustainable Agricultural Practices in Rondonia, Brazil: Do Local Farmer Organizations Affect Adoption Rates?� Economic Development and Cultural Change 52(2003): 23-49. Chaves, B. and J. Riley. �Determination of factors influencing integrated pest management adoption in coffee berry borer in Colombian farms.� Agriculture, Ecosystems, and Environment 87(2001): 159-177. Crissman, C., P. Espinosa, C. E. H. Ducrot, D. C. Cole, and F. Carpio. �The Carchi Study Site: Physical, Health, and Potato Farming Systems in Carchi Province.� in Economic, Environmental, and Health Tradeoffs in Agriculture: Pesticides and the Sustainability of Andean Potato Production. Kluwer Academic Publishers. Boston. 1998. pp. 85-120. De Souza Filho, H. M., T. Young, and M. P. Burton. �Factors Influencing the Adoption of Sustainable Agricultural Technologies Evidence from the State of Espírito Santo, Brazil.� Technological Forecasting and Social Change 60(1999): 97-112. Ersado, Lire, G. Amacher and J. Alwang. "Productivity and Land Enhancing Technologies in Northern Ethiopia: Health, Public Investments, and Sequential Adoption," American Journal of Agricultural Economics 86(2), May 2004: 321-331.

26
Feder, G. and R. Slade. �The acquisition of information and the adoption of new Technology.� American Journal of Agricultural Economics 66(August 1984):312-320. Feder, G., E. R. Just, and D. Zilberman. �Adoption of Agricultural Innovations in Developing Countries: A Survey.� Economic Development and Cultural Change 33 (1985):255-298. Feder G., R. Murgai, and J. B. Quizon. �The Impact of Farmer Field Schools in Indonesia.� World Bank Policy Research Working Paper 3022. April 2003. Goodell, G., K.L. Andrewsm and J. I. López. �The Contributions of Agronomo-anthropologists to on-farm research and extension in integrated pest management.�� Agricultural Systems 32(1990): 321-340. Orr, A. �Integrated Pest Management for Resource-Poor African Farmers: Is the Emperor Naked?� World Development 31(2003): 831-845. Greene, W.H., Econometric Analysis, 2nd Edition. Prentice Hall. Englewood Cliffs, NJ. 1993. Kivlin, J. E. and F. C. Fliegel. �Attributes of Innovations as Factors in Diffusion.� Am. J. Sociol. 72(1966b): 235-248. Lang, James. Notes of a Potato Watcher. Texas A&M University Press. USA. 2001. Muñoz, F. and L. Cruz. Manual del Cultivo de Papa [Potato Cultivation Manual]. Manual No. 5, Estación Experimental �Santa Catalina,� INIAP, Quito, Ecuador. 1984. Negatu, W. and A. Parikh. �The impact of perception and other factors on the adoption of agricultural technology in the Moret and Jiru Woreda (district) of Ethiopia.� Agricultural Economics 21(1999): 205-216. Nowak, P. �The Adoption of Agricultural Conservation Technologies: Economic and Diffusion Explanations.� Rural Sociology 52(1987): 208-220. Owens, M. and B. M. Simpson. �Sending Farmers Back to School Farmer Field Schools as an Extension Strategy: A West African Experience.� Agriculture and Rural Development of the World Bank Group. (2002). Ortiz, O., P. Winters, H. Fano, G. Thiele, S. Guamán, R. Torrez, G.,V. Barrera, J. Unda, and J. Hakiza. �Understanding Farmers� Response to Late Blight: Evidence from Peru, Bolivia, Ecuador and Uganda.� Impact on a Changing World. International Potato Center Program Report 1997-1998. p. 101-109. Lima: CIP, 1999.
27
Rahm, M. R. and W. E. Huffman. �The Adoption of Reduced Tillage: The Role of Human Capital and Other Variables.� American Journal of Agricultural Economics 66(1984): 405-413. Strauss J., M. Barbosa, S. Teixeira, D. Thomas, and R. Gomes Junior, �Role of education and extension in the adoption of technology: a study of upland rice and soybean farmers in Central-West Brazil.� Agricultural Economics 5(1991): 341-359. Thiele, G., R. Nelson, O. Ortiz, and S. Sherwood. �Participatory Research and Training: Ten Lessons from the Farmer Field School (FFS) in the Andes.� Currents-Swedish Academy of Agricultural Sciences 28(2001): 4-11.