adoption of total productive maintenance practices by food
TRANSCRIPT

ADOPTION OF TOTAL PRODUCTIVE MAINTENANCE
PRACTICES BY FOOD PROCESSING FIRMS IN KILIFI COUNTY ,
KENYA
BY
MOHAMED MAHMOUD YUSUF
A RESEARCH PROJECT REPORTSUBMITTED IN PARTIAL
FULFILLMENT OF THE REQUIREMENT FORTHE DEGREE
OF MASTER OF BUSINESS ADMINISTRATION,
DEPARTMENT OF MANAGEMENT SCIENCE,UNIVERSITY
OF NAIROBI
NOVEMBER, 2013

ii
DECLARATION
This research project report is my original work and has not been presented for
examination to any other institution.
Sign:…………………. Date:…………………..
Mohamed Mahmoud Yusuf
D61/69241/2011
This research project report has been submitted for examination with my approval as the
University supervisor:
Sign:………………….. Date:…………………….
Dr. James Njihia
Department Of Management Science
School Of Business,
University Of Nairobi
Sign:…………………. Date:……………..............
Mr. Job Mwanyota
Department Of Management Science
School Of Business,
University Of Nairobi
iii
ACNOWLEDGEMENTS
I would like to thank the beloved Almighty Allah through whose love, grace, guidance
and protection that I have studied and completed this course.
My sincere gratitude goes to all those who contributed immensely in one way or another
to the completion of this research project. They include Wakf Commission of Kenya,
University of Nairobi library and my colleagues specifically Rubeya Abeid.
My special thanks go to my supervisor Mr. Job Mwanyota for his guidance and
immeasurable support throughout the proposal and the entire project. His positive
sentiments greatly enhanced and enriched this study. His uncompromising stance on
quality and details greatly motivated me.
Finally, I am greatly indebted to my family more so, my wife, my brother and my friend
Abdulmajid Said for their constant support and encouragement that I would make it in
life despite the odd challenges of the earth.
God bless you all.

iv
DEDICATION
To the two who sowed the seed, watered it, helped it grow but never saw it ripen, my
dearest the late father Yusuf Mohamed Masoud and my dearest the late uncleSalim
Mohamed Masoud.
v
ABSTRACT
The purpose of the study was to establish the adoption of total productive maintenance in the food processing firms in Kilifi County as well as to determine the factors influencing implementation of total productive maintenance in the food processing firms in Kilifi County. A descriptive survey design was used for this study. The population of the study comprised all food processing firms in the county. According to county industrial officer register there are twenty firms. A census study was conducted, out of 20 firms only 17 firms responded amounting to 85%. The study used primary data which was collected using structured questionnaire. The data collected was analyzed through use of descriptive statistics. From the research it indicated that 29% of the firms maintenance philosophy is somewhat reactive while 24% is reactive and 18% is neither reactive nor proactive this sum up to 70% of the firms within the region maintenance philosophy being not proactive an aspect of TPM findings, from the study the following recommendation are made creation of awareness on modern cost effective ways on maintenance to the food processing firms in the region this will give mileage in further investment, a further study to be conducted on other manufacturing firms in the county to ascertain the level of adoption of total productive maintenance and its economic implication.

vi
TABLE OF CONTENTS
DECLARATION ............................................................................................................. ii
ACKNOWLEDGEMENTS ........................................................................................... iii
DEDICATION ................................................................................................................ iv
ABSTRACT..................................................................................................................... v
ABREVIATIONS AND ACRONYMS......................................................................... ix
LIST OF TABLES ........................................................................................................... x
LIST OF FIGURES ........................................................................................................xi
CHAPTER ONE: INTRODUCTION ..............................................................................1
1.1 Background of the study ................................................................................................1
1.1.1 Total Productive Maintenance .............................................................................2
1.1.2 Food processing Industry in Kenya .....................................................................4
1.2 Research problem...........................................................................................................5
1.3 Research Objectives .......................................................................................................7
1.4 Value of the study ..........................................................................................................7
CHAPTER TWO: LITERATURE REVIEW .................... ........................................... 9
2.1 Introduction ....................................................................................................................9
2.2 Total Productive Maintenance .......................................................................................9
2.3 Framework of Total Productive Maintenance .............................................................12
2.4 Benefit of Total Productive Maintenance Adoption ....................................................14
2.5Factors influencing adoption of Total Productive Maintenance practices.................. 16
2.6 Summary of literature review..................................................................................... 18

vii
CHAPTER THREE:RESEARCH METHODOLOGY................. ........................... 19
3.1 Introduction ..................................................................................................................19
3.2 Research design ...........................................................................................................19
3.3 Populationof the study .............................................................................................19
3.4 Data collection .............................................................................................................20
3.5 Data analysis ................................................................................................................20
CHAPTER FOUR: DATA ANALYSIS, RESULTS AND DISCUSSION S............. 21
4.1 Introduction ..................................................................................................................21
4.2 Duration of operation ...................................................................................................21
4.3 Total number of employees........................................................................................22
4.4 Food processing type ..................................................................................................23
4.5 Appropriateness of maintenance technique ............................................................... 24
4.6Maintenance philosophy .............................................................................................. 24
4.7Autonomous maintenance practices .............................................................................25
4.8Outsourcing maintenance..............................................................................................26
4.9Degree of involvement of machine operator...............................................................27
4.10Healthy, safety and environment measure ..................................................................27
4.11Employee involvement in maintenance activities .......................................................28
4.12 Manufacturing performance measure ...................................................................... 29
4.13 Critical success factor for total productive maintenance ......................................... 30
4.14 Factors to successful total productive maintenance implementation ....................... 32
4.15 Correlation ............................................................................................................... 34
viii
CHAPTER FIVE: SUMMARY CONCLUSION AND RECOMMENDATION ......35
5.1 Introduction ..................................................................................................................35
5.2 Summary .....................................................................................................................35
5.3 Conclusion ..................................................................................................................36
5.4 Recommendations .......................................................................................................36
5.5Limitation of the study ..................................................................................................37
5.6Area of further research ................................................................................................37
REFERENCES. .............................................................................................................. 38
APPENDICES................................................................................................................. 46
Appendix I :Questionnaire…….......................................................................................46
AppendixII: Introductionletter.........................................................................................52

ix
ABREVIATIONS AND ACRONYMS
ERP Enterprise Resource Planning
FDI Foreign Directive Investment
IT Information Technology
JIT Just-In-Time
OVOP One Village One Product
PM Planned Maintenance
SCM Supply Chain Management
SMQE Strategic Maintenance Quality Engineering
SQM Statistical Quality Management
TPM: Total Productive Maintenance
TQM Total Quality Management

x
LIST OF TABLES
Table 1.1The Kenya food processing sector ........................................................................4
Table 4.1 Duration of operation .........................................................................................21
Table 4.2Total number of employees ................................................................................22
Table 4.3 Food processing type ........................................................................................23
Table 4.4 Appropriateness of maintenance techniques .....................................................24
Table 4.5 Maintenance philosophy ....................................................................................24
Table 4.6 Autonomous maintenance practices ..................................................................25
Table 4.7 Outsourcing maintenance ..................................................................................26
Table 4.8Degree of involvement of machine operator ......................................................27
Table 4.9 Healthy, safety and environment measure ........................................................28
Table 4.10 Employee involvement in maintenance activities ...........................................28
Table 4.11 Manufacturing Performance Measure .............................................................29
Table 4.12 Critical success factor for total productive maintenance .................................30
Table 4.13Factors to successful total productive maintenance implementation ................32
Table 4.14 Correlation .......................................................................................................34

xi
LIST OF FIGURES
Figure 1.1: Framework of TPM....................................................................................... 13
Figure 4.1: Total number of employees............................................................................ 23
Figure 4.2: Autonomous maintenance practices............................................................... 26

1
CHAPTER ONE: INTRODUCTION
1.1 Background of the study
Competition is worldwide, and markets are fast becoming more price sensitive.
Achieving manufacturing excellence is seen as essential to survival and economic growth
for any country inthis age of globalization (Singh and Khanduja, 2010). These global
challenges are forcingcompanies to implement various productivity improvement efforts
to meet the needs of ever changing market demand. Manufacturing industry has
experienced an unprecedented degree of change in the last three decades; involving
drastic changes in management approaches, product and process technologies, customer
expectations, supplier attitudes as well as competitive behavior (Ahuja et al., 2006).
TPM is a resource-based maintenance management system which focuses on improving
equipment effectiveness, productivity, workplace safety and environmental issues and
eliminating production losses. Total participation from all employees including top
management and operators is vital in TPM. More importantly, the role of top
management stimulates the contribution of operators to achieve zero breakdowns, zero
stoppages and a safer working environment (Ahuja, 2007). Moreover, TPM consolidates
the preventive and predictive maintenance approaches with an emphasis on employee
participation. The usage of technologies to detect any abnormality or deterioration of the
equipment also supports the predictive maintenance principle. Additionally, TPM
integrates preventive maintenance, condition-based maintenance and predictive
maintenance activities as well (Halim and Ramayah, 2010).

2
The Kenyan food-processing sector, including food, beverages and tobacco, remains the
largest component of the manufacturing industry. In 2008, the sector contracted by 3.9
percent from2007, but still generated over a third (33.4 percent) of the total
manufacturing production, and provided 89,319 jobs (KNBS 2009). High production and
ingredient costs were partially blamed. During 2009 the sector grew 2.1 percent (KNBS
2010).
1.1.1 Total Productive Maintenance
According to Nakajima (1988) Total productive maintenance (TPM) is productive
maintenance carried out by all employees through small group activities. TPM in this
definition covers three areas: equipment, people, and the workplace. The definition of
TPM includes five major elements; overall equipment effectiveness maximization, A
thorough system of preventive maintenance for the equipment’s whole life span,
implementation by various departments (engineering, production, maintenance, etc.),
total employee involvement from top management to the workers on the floor
andmotivation management through small group activities and teamwork.Seiichi
Nakajima the father ofTPM, defined TPM as an innovative approach to maintenance that
eliminatesbreakdowns and promotes autonomous maintenance by operators through day-
to-dayactivities involving total workforce (Conway 1999; Bhadury, 2000). TPM has been
defined as consisting of preventive and productivemaintenance activities implemented by
production workers (Wireman, 2004).
TPM supports the other strategies most often associated with World ClassManufacturing:
Just-in-Time manufacturing (JIT), Total Quality Management (TQM),and Employee

3
Involvement (El) (Schonberger, 1996; Ollila & Malmipuro, 1999, Cuaet al., 2001;
Sharma et al., 2005). TPM is an important world class manufacturingprogram introduced
during the quality revolution. TPM is a highly influentialtechnique that is in the core of
“operations management” and deserves immediateattention by organizations across the
globe (Voss, 2005).The entire edifice of TPM is built and stands, on eight pillars
(Sangameshwran andJagannathan, 2002). TPM paves way for excellent planning,
organizing, monitoringand controlling practices through its unique eight pillar
methodology involvingautonomous maintenance, focused improvement, planned
maintenance, qualitymaintenance, education and training, safety, health and environment,
office TPMand development management (Ireland and Dale, 2001; Shamsuddin et al.,
2005;Rodrigues and Hatakeyama, 2006).
To prosper in today’s economic climate, any organization must be dedicated to never-
ending improvement, and more efficient ways to obtain products or services that
consistently meet customer’s needs. Globalization has forced the engineers and managers
of manufacturing organizations to manufacture their products with high quality at a lower
cost.Cost reduction without compromising on quality’ has become the motto of every
manufacturingorganization, to survive in the global market. In manufacturing industry,
product quality hasbecome a key factor in determining a firm’s success or a failure in a
global market place(Singh and Khanduja, 2010).

4
1.1.2 Food processing industry in Kenya
Major segments of the sector include grain milling, bakery, dairy, spirits, beer and
tobacco, sugar, soft drinks and carbonated waters, animal feeds, and edible oils and fats;
Total production amounted to $3,461 million, of which $2,706 million was exported;
corn meal, wheat flour and other milled grain products led the market with production
valued at $848.5 million, followed by canned vegetables, oil and fats at $794 million, and
bakery products totaling $294 million; There were 1,070 registered food processing
companies, mostly small companies; regarding the relative size of the domestic
processors, 46 percent employed more than 49 people; 19 percent employed between 20
and 49 people, 35 percent employed fewer than 20 people; and Processing inputs were
valued at $2,613 million (KNBS, 2009).
Table 1.1: The Kenya food processing sector
2004 2005 2006 2007 2008
Total output ($ million) 2064 2420 2844 3550 3461
Total input ($ million) 1582 1847 2164 2695 2613
Total number of registered food processers 1124 1232 1038 1031 1070
Labour force in registered companies 83750 85297 86569 89356 89319
Total export of agriculture products($ million) n/a n/a 1746 2050 2706
Exchange rate (Kshs /$) 79.17 75.55 72.10 67.32 69.18
Source: (KNBS, 2009)

5
During 2009 the sector grew 2.1 percent, on the production side can be basically an issue
of total productive maintenance.The production of food products registered a 0.3 per cent
decline in 2012 after experiencing a 1.6 per cent decline in 2011. During the period
2011/12, production of meat and meat products rose by 12.3 per cent. Vegetablesoils and
fats; and grainmilling products went up by 7.5 and 6.4 per cent respectively. Under grain
milling production of wheat flour increased by 9.7 per cent while maize flour rose by 2.0
per cent. Sugar production grew marginally from 490.2 thousand tonnes in 2011 to 493.9
thousand tonnes in 2012. This marginal increase is mainly attributed to an increase in
sugarcane production recorded. However, prepared and preserved fish, processed liquid
milk, production of bakery products dropped by 10.4, 13.7, and 14.9 per cent,
respectively (KNBS, 2013)
Singh and Ahuja (2012) find out thatthe adoption of flexible TPM by manufacturing
organizations results in major competitive advantage.In theMinistry of Industrialization,
Kilifi County industrial office there are twenty food processing in the county ranging
from fruit processing, milk processing, bakery and confectioners, sweet processing and
cashew nuts.
1.2 Research Problem
Maintenance has become more challenging in the current dynamic business environment.
It is considered one of the important strategic decisions in operations management
(Russell and Taylor, 2009; Heizer and Render, 2009, Krawjeski and Ritzman, 2002). The
manufacturing sector has been experiencing tremendous challenges in ensuring all
products are delivered to customers on time, the current business environment and

6
pressures from various parties such as customers, suppliers, governments and so forth
have put manufacturing sectors operate under severe pressure. To operate efficiently and
effectively, manufacturing sectors need to ensure no disruption due to equipment
breakdown, stoppages and failure. More importantly, the rapid change in technologies
and the marketplace requires the manufacturing sector to improve performance by
emphasizing cost reduction, increasing quality and delivery levels, and improving
equipment and human resources flexibility (Ahuja and Khamba, 2008).
According to Kutucuoglu et al. (2001), reliable equipment is regarded as the main
contributor to the performance and profitability of manufacturing systems, especially in a
dynamic and challenging environment.Companies that adopt TPM are overseeing 50 per
cent reduction in breakdown labour rates, 70 per cent reduction in lost production, 50 –
90 per cent reduction in set up, and 60 per cent reduction in costs per maintenance unit
(Koelsch, 1993).Cartel (1999) started the implementation of TPM in the US Shipbuilding
industry achieved higher levels of quality and timeliness and eliminated costly delays in
its shipbuilding operations.In 1996, MRC Bearing implemented a TPM program, and ten
months later their breakdown losses fell to less than 30 hours, a decrease of over 540 per
cent (Aerospace 1999).The popularity of trucks like the F – series meant that the Ford
Windsor Engine plant needed to produce more engines. An increase of 100,000 engines,
announced in April, brought the output for 2000 to 950,000 units(Vasilash, 1999).
In Africa a case study was taken at South Africa pulp and paper company in 2002 by Van
der Wal & lynn, they found that TPM increases productivity, quality and reduction in
cost of production. In Kenya, Mulwa (2000) studied various operation management
7
techniques used in maintenance management. Again Njihia in (1994) dwelt on resource
allocation.From the above it is evident that there was little that had focused on adoption
of TPM in food processing firms in Kenya. This research project intended to find out to
what extent have firms in Kilifi county adopted TPM? What were the challenges of
implementation of TPM?
1.3 Research Objectives
The research seeks to achieves the following specific objectives
i. To establish the adoption of total productive maintenance in the food processing
firms in Kilifi.
ii. To determine thefactors influencingimplementation of total productive
maintenance in the food processing firms in Kilifi County.
1.4 Value of the study
The survey will help the following people:Researchers will use the results of the survey
to gain knowledge by understanding the concept of total productive maintenance(TPM)
and as a source of reference material for future study in a related field.
Food processing firms will need valid information about the food processing performance
after implementing TPM practices to guide their actions, hence this survey will be
beneficial to them. They will be positioned to improve the performance efficiency since it
can eliminate as much waste as possible.

8
The County Government will be able to identify any gaps on existing policies hence set
new guidelines, policies and procedures on total productive maintenance issues. The
government will realize their role in providing the necessary incentives to facilitate
proper implementation of total productive maintenance in food security within the
county.

9
CHAPTER TWO: LITERATURE REVIEW
2.1 Introduction
This chapter presented the literature on Total productive Maintenance (TPM), it gave the
theories, the relationship with other concept like Total Quality Maintenance. It also
highlightedaspects on TPM practices, benefits and challenges.
2.2 Total Productive Maintenance
In order to survive every industry has to improve productivity by utilizing resources like
machinery, men, and material as optimally as possible. In an effort to increase
organizational capabilities, companies have made investments in programs such as JIT
and TQM. However, benefits from these programs have often been limited because of
unreliable or inflexible equipment (Tajiri and Gotoh, 1992). Therefore, many companies
have looked to TPM to augment their JIT and TQM programs in a drive for continual
improvement. TPM brings maintenance into focus as a necessary and vitally important
part of the business. TPM is an innovative approach to maintenance that optimizes
equipment effectiveness, eliminates breakdowns and promotes autonomous operator
maintenance through day-to-day activities involving the total workforce (Nakajima,
1989; Pophaley and Vyas, 2010).
Historically, there were three eras of maintenance in Japan, where TPM originated
(Nakajima, 1988).The first era, known as the preventive maintenance era (1950s),
emphasized establishing maintenance functions. The second era (1960s) was the

10
introduction of productive maintenance, where maintenance prevention, reliability,
maintainability engineering took place. However, the third era, total productive
maintenance in 1970s, put the emphasis on total employee participation and strong
support from top management.
The era of Total Productive Maintenance (TPM) in the 1970s focused on preventive
maintenance efficiency. The emphasis was on individuals and total employee
involvement through a comprehensive system (Nakajima, 1989). TPM shows an
important aspect of employee involvement from all levels, teamwork and continuous
improvement activities. The history of TPM began back in 1969 when the pioneer in
implementing TPM, Nippon Denso Company, was the first company to be awarded the
Distinguished Plant Prize or PM Prize in 1971.
TPM, a resource-based approach, emphasizes the importance of total employee
participation and cooperation among various departments in maintenance activities.
However, the main focus is to allow operators to be actively involved in basic
maintenance jobs.Recent competitive trends have been pushing manufacturing managers
to reconsider the impact and importance of increasing equipment availability and
utilization, increasing maintenance productivity, resource utilization, and increasing
quality and responsiveness of maintenance services for meeting global competition
(Singh et al., 2010). As maintenance departments enhance the organization’s ability to
provide their product or service (Kutucuoglu et al., 2002; Mishra et al., 2007), this has led
many organizations to implement new manufacturing programmers’ and organizational
structures to enhance their competitive position.

11
An effective maintenance programme can make significant contributions to production
efficiency, plant availability, reliability and organizational profitability and to support
production, maintenance must ensure equipment availability to produce products at the
requiredquantity and quality levels (Ahuja and Khamba, 2008a). Muthu et al. (2000) has
proposed a model called ‘Strategic Maintenance Quality Engineering’ (SMQE) to make
the theory of TPM exhaustive and suggest that scope of TPM could be enlarged and
made more powerful by integrating it with the contemporary continuous quality
improvement model called ‘Statistical Quality Management’ (SQM).
The study revealed that use of Information Technology (IT) for benchmarking SMQE can
aid in improving strategic maintenance quality more effectively. It is evident that a well
drawn TPM implementation plan not only improves equipment efficiency and
effectiveness but also brings appreciable improvements in other areas such as reduction
of manufacturing cycle time, size of inventory, customer complaints, and creates
cohesive small group autonomous teams and increases the skill and confidence of
individuals. The resulting system is found to be more productive in terms of both partial
and total productivity measures.Over the years, Just-in-Time (JIT), Total Quality
Management (TQM), Total Productive Maintenance (TPM), Supply Chain Management
(SCM), and Enterprise Resource Planning (ERP) have emerged in response to the
competitive pressures (Wakchaure et al., 2011).
Konecny and Thun (2011) have pointed out that TQM and TPM, supported by HR
practices, have a significant potential to improve plant performance. However, a
simultaneous implementation of both concepts does not necessarily lead to superior
12
performance. As a potential reason for this, human resources are regarded as a limiting
factor that both improvement programs draw on.Seth and Tripathi (2005) have identified
two sets of factors which are critical for the effectiveness of TQM and TPM: universally
significant factors for all the three approaches (TQM alone; TPM alone; both TQM and
TPM together) like leadership, process management and strategic planning; and
approach-specific factors like equipment management and focus on customer satisfaction.
Singh and Ahuja (2012) find out that the adoption of flexible TQM–TPM by
manufacturing organizations results in major competitive advantage. The combined
applications bring out significantly higher improvements than other individual drives to
achieve synergy (Seth and Tripathi, 2006).
2.3 Framework of Total Productive Maintenance
The core TPM initiatives classified into eight TPM pillars or activities for accomplishing
the manufacturing performance improvements include Autonomous Maintenance;
Focused Maintenance; Planned Maintenance; Quality Maintenance; Education and
Training; Office TPM;Development Management; and Safety, Health and Environment
(Ireland & Dale, 2001; Shamsuddin et al., 2005; Rodrigues and Hatakeyama, 2006).

13
(Source; Ahuja and Khamba, 2007)

14
2.4 Benefit of Adopting Total Productive Maintenance
According to Khazraei and Deuse (2011), TPM is a maintenance strategy that focuses on
process and people, and through deterioration prevention aspires to prevent any kind of
slack before occurrence (Ahuja, 2012). TPM has achieved a great response from
industrial organizations worldwide since its evolution and therefore a large number of
industrial organizations have adopted TPM programs, especially in developed and
industrialized nations (Muthu et al., 2000). TPM can be considered the science of
machinery health.
One of the Central tenets of TPM is autonomous maintenance hence there is an implied
loss of job demarcation. McAdam and McGeough(2000)implemented TPM in a heavily
demarcated and unionized organization and reap the benefit (R.W.Evan der Wal and
D.Lynn, 2002).The strategic outcome of TPM implementations is the reduced occurrence
ofunexpected machine breakdowns that disrupt production and lead to losses which
canexceed millions of dollars annually (Gosavi, 2006). TPM initiatives are focused
uponaddressing major losses, and wastes associated with the production systems
byaffecting continuous and systematic evaluations of production system, therebyaffecting
significant improvements in production facilities (Ravishankar et al., 1992;Gupta et al.,
2001, Juric et al., 2006). According to Coetzee(1999), an important success factor for
implementation of TPM is the management“style”, values, principles and ideals (Shields,
2007).
One of the main aims of TPM is to increase productivity of plant and equipment in such a
way as to achieve maximum productivity with only a modest investment in maintenance.
15
Maintenance jobs have been perceived as reactive tasks that require repairs and
replacement of parts or just to fix malfunctioning equipment (Ahuja and Khamba,
2008).Maintenance supports the productiondepartment to achieve the desired quantity
and quality of products produced throughensuring the availability of equipment. Hence,
equipment relies not only on availability, butalso performance and quality (Nakajima,
1988)
Basically, there are many advantages that can be achieved through TPM implementation.
For instance, TPM can lead to improvements in quality cost delivery and flexibility
(Sharma et al., 2006; Cua et al., 2001; McKone et al., 1999, 2001; Seth and Tripathi,
2005; Seth and Tripathi, 2006). Meanwhile, Ahuja and Khamba (2008) critically
analyzed and reviewed TPM related articles to show some importance directions in the
TPM study. It can be clearly observed that TPM is a widely accepted approach to
compete in the global competitive environment (Ahmed et al., 2005; Ahuja and Khamba,
2007, 2008; Brah and Chong, 2004; Seth and Tripathi, 2005, 2006).
TPM can bring in commendable reforms and improvement in terms of realization of
manufacturing excellence in the manufacturing organizations (Ahuja and Singh, 2012).
Another strategic outcome of TPM implementations is reduced occurrence of unexpected
machine breakdowns that disrupt production and lead to losses which can exceed millions
of dollars annually (Gosavi, 2006). The goal of TPM is to continually maintain, improve
and maximize the condition and effectiveness of equipment through complete
involvement of every employee, from top management to shop floor workers (Ireland and
Dale, 2006). TPM addresses the entire production system over the entire life cycle and
16
builds a concrete, shop floor-based mechanism to prevent various losses and wastes
(Sharma et al., 2006). TPM is considered to be an effectivestrategic improvement
initiative for improving quality in maintenance engineering activities (Pramod et al.,
2007).
2.5 Factors influencing adoption ofTotal Productive Maintenance
practices
TPM adoption is a very challenging exercise to be undertaken by a firm. According to
Rogers’ (1995) model, organizations within anestablished social environment will not all
adopt a specificinnovation at the same time (Beatty et al., 2001). Rogers(1995) suggests
that it is possible to classify organizations intoone of five adopter categories determined
by theirinnovativeness relative to other organizations in their socialsystem: innovators,
early adopters, early majority, latemajority and laggards.In terms of organizational
characteristics the mostfrequently measured is size – usually measured throughnumber of
employees or revenues and relates positively toadoption (Nguyen et al., 2003).
For example, larger firmstend to adopt before smaller firms. Blili and Raymond
(1993)recognized that small and medium-sized enterprises (SMEs)– enterprises which
are not in the largest 10 to 20 percent ofindustry firms (OECD, 2000) – encounter unique
problemsin comparison with larger firms: namely limited financialresources, low skills
and minimal strategic management.Traditionally, maintenance has been considered as a
support function, one that is non-productive and not a core function, thus adding little
value to the business (Bamber et al., 1999). According to Al-Najjar and Alsyouf (2003),
17
the maintenance function has become more challenging in maintaining and improving
product quality, safety requirements and plant cost effectiveness.
Teamwork among all employees in various departments in manufacturing companies
canensure better TPM implementation. Indeed, the complexity of getting commitment
andinvolvement from employees is one of the implementation difficulties of TPM (Arca
and Prado, 2008).The employee involvement is nonetheless essential, particularly on the
part of the personwho operates the equipment. Sufficient and effective training programs
can help to detectabnormalities in the equipment condition as soon as possible. Moreover,
it is very importantto follow up on any training and education programmes in order to
ensure that operators’commitment, skills and knowledge are at exceptional level.
Furthermore, through totalemployee involvement, skepticism about maintenance being a
support function,non-productive and not a core function that adds little value to the
business (Bamberet al., 1999) can be avoided.
Rodrigues and Hatakeyama(2006) analyzed the failure of the interaction between
maintenance and production whenimplementing TPM in Brazilian companies and listed
more than 11 factors thatinfluenced the outcome. They concluded that the managers of
the process andthe top administration of the companies were responsible for the failures.
Alsyouf (2009)investigated the maintenance practices that were used in Swedish
industry. The studywas performed by conducting a cross-sectional survey within Swedish
firms that had atleast 100 employees. The main results achieved from the study showed
that the role ofmaintenance was not highly recognized. There was a need for the wider
adoption ofmaintenance concepts such as TPM and reliability-centered maintenance

18
(RCM). Alsyoufasserted that the ineffectiveness of planning and scheduling could
significantly limit themaintenance department in achieving its objectives and could thus
prevent the companyfrom maximizing business profits and offering competitive
advantages. Graisa andAl-Habaibeh (2011) investigated maintenance and production
problems in the cementindustry in Libya, with particular emphasis on the future
implementation of TPM. Theresults of the study found that the four factories under
investigation had lowproductivitywhen compared to design values. There was no
clearTPMstrategy, a lack of training andpersonal development being the main
deficiencies. In addition, employees were found notto be motivated as a result of the lack
of a management strategy and reward structure.
2.6 Summary of literature review
This review identified team work between diverse function as being an important driver
of successful TPM implementation. The review looked at the success factors, adoption
and challenges to TPM implementation. The review showed that more authors advocate
TPM as a viable tool for companies aiming to achieve a sustainable competitive
advantage. The review has noted the research gaps in that the TPM has not been
thoroughly studied in this region. This study is therefore intended to address the gap.
19
CHAPTER THREE: RESEARCH METHODOLOGY
3.1 Introduction
Thischapter examined the research design, the location of the study, population, data
collection methods and procedures, data presentation and analysis techniques to be used.
It described in detail what will be done and how it will be done.
3.2 Research design
Descriptive research design was adopted for this study. A descriptive survey is a present
oriented methodology used to investigate population by selecting sample to analyze and
discover occurrences (Oso and Onen, 2009). This method of investigation entails the
collection and analysis of data in order to describe the problem in its actual status.The
advantages of descriptive research is that it helps to look at the problem and issues in
their current state and thus making it easier to make decisions on issues in their natural
state.This method is also preferred as it also does not manipulate the events and behavior
of the population under study as it is based on events in their original state.
3.3 Populationof the study
This study was carried out in all the food processing firms within Kilifi County.
According to the County industrial office register, there are 20 firms. A census was
done.The method wasadopted because the county has a small number of food processing
firms and we want to incorporate input and views of all the firms.

20
3.4 Data Collection
The instrument used was aquestionnaire, which was covering the objectives of the study
and answers the research question of the study. The questionnaire was going to give a
standard form of information. The questionnaire was structured and it had closed ended
questions.The questionnaire was comprise of section A that aimed to collect
organizational data, section B was to collect data on Total Productive Maintenance
practise, section C was to look onto TPM and processing performance, adoption of TPM
will be in section D and finally section E was looking onto the factors to successful
implementation.
3.5 Data Analysis
After data collection the questionnaires were coded and data input into SPSS for
analysis.Descriptive statistic was used to analyze the collected data. Inferential statistic
was used to analyze the relationship between TPM adoption and Cross tabulation were
particularly used to put a meaning to the data.

21
CHAPTER FOUR: DATA ANALYSIS, RESULTS AND
DISCUSSIONS
4.1. Introduction
This chapter contains the detailed data analysis and findings of the study. The data is
summarized, presented and analyzed in the form of Tables and graphs.
4.2. Duration of operation
Most of the food processing firms within the region are barely less than 10years old, as
indicated in table 2. 58% of the firms are less than ten years in operation.
Table 4.1: Duration of Operation
Duration in Operation
Frequency Percent (%)
Cumulative Percent
(%)
0 - 5 years 7 41.2 41.2
6 - 10 years 3 17.6 58.8
10 - 15 years 2 11.8 70.6
Over 15 years 5 29.4 100.0
Total 17 100.0
22
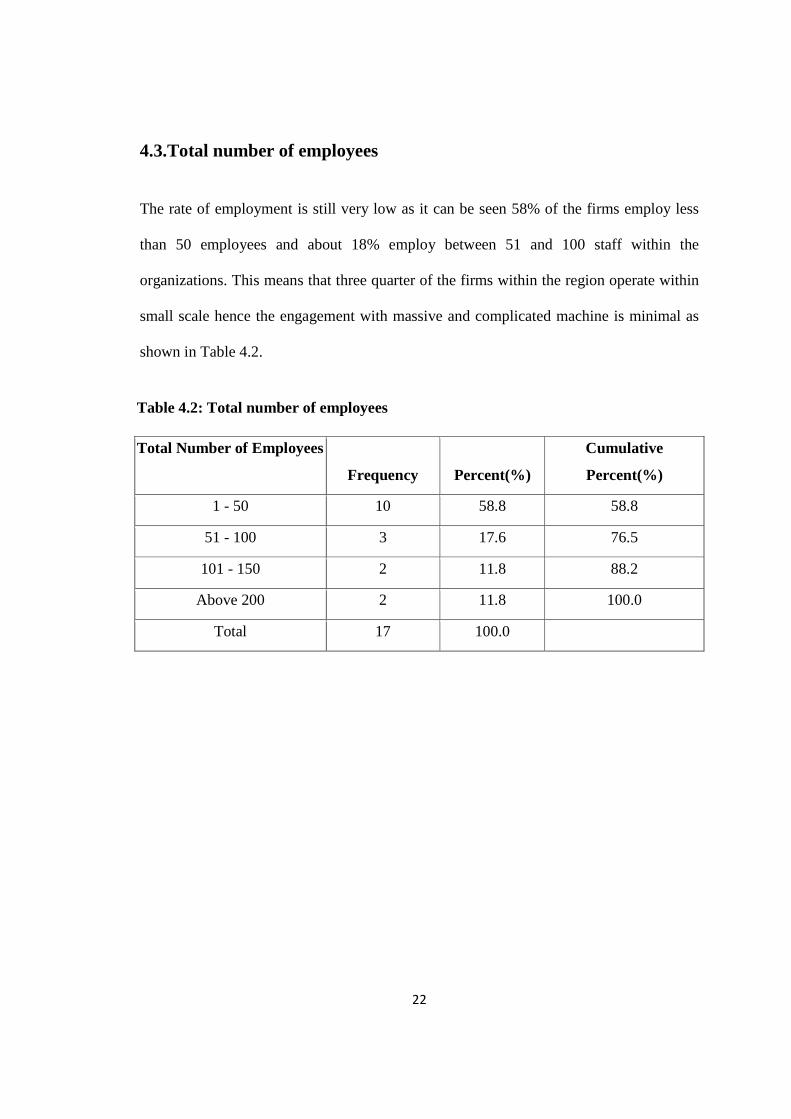
4.3.Total number of employees
The rate of employment is still very low as it can be seen 58% of the firms employ less
than 50 employees and about 18% employ between 51 and 100 staff within the
organizations. This means that three quarter of the firms within the region operate within
small scale hence the engagement with massive and complicated machine is minimal as
shown in Table 4.2.
Table 4.2: Total number of employees
Total Number of Employees
Frequency Percent(%)
Cumulative
Percent(%)
1 - 50 10 58.8 58.8
51 - 100 3 17.6 76.5
101 - 150 2 11.8 88.2
Above 200 2 11.8 100.0
Total 17 100.0

23
Figure 4.1: Total number of employees
4.4. Food processing type
The researcher came across 6 bakery and confectioners firms, 5 dairy and milk
processing firms, 3 fruit processing firms, animal feed processing firm, edible oil
processing firm and one cashew nuts processing firm as shown in table 4.3.
Table 4.3: Food Processing Type
Food Processing Type
Frequency Percent (%)
Cumulative Percent
(%)
Bakery and confection 6 35.3 35.3
Dairy 5 29.4 64.7
Fruit processing 3 17.6 82.4
Animal feeds 1 5.9 88.2
Edible oil 1 5.9 94.1
Cashew Nuts 1 5.9 100.0
Total 17 100.0
58.8
17.6
11.8 11.8
1 - 50 51 - 100 101 - 150 Above 200
Percent

24
4.5 Appropriateness of maintenance techniques
Table 4.4: Appropriateness of maintenance techniques
Appropriateness of Maintenance Technique
Frequency
Percent
(%)
Cumulative Percent
(%)
Yes 17 100.0 100.0
Table 4.4 shows that the survey indicated all firms believe in the maintenance techniques
currently used.
4.6. Maintenance philosophy
The research indicated that 29% of the firms maintenance philosophy is somewhat
reactive while 24% is reactive and 18% is neither reactive nor proactive this sum up to
70% of the firms within the region maintenance philosophy being not proactive an aspect
of TPM as illustrated in table 4.5.
Table 4.5: Maintenance philosophy
Maintenance Philosophy
Frequency
Percent
(%)
Cumulative Percent
(%)
Reactive 4 23.5 23.5
Somewhat reactive 5 29.4 52.9
Neither reactive nor proactive 3 17.6 70.6
Somewhat proactive 2 11.8 82.4
Proactive 3 17.6 100.0
Total 17 100

25
4.7. Autonomous maintenance practices
The survey indicated that 77% of the food processing firms within the Kilifi County do
not undertake autonomous maintenance practices, See table 4.6. That is 3 quarters of the
firms within the region have not embraced the second pillar of TPM which aimed at
changing operator from being reactive to working in a more proactive way to achieve
optimal conditions that eliminate minor equipment shops as well as reducing defects and
breakdowns.
Table 4.6: Autonomous maintenance practices
Autonomous Maintenance Practices Frequency Percent(%) Cumulative Percent(%)
Low 1 5.9 5.9
Average 12 70.6 76.5
Fairly high 2 11.8 88.2
High 2 11.8 100.0
Total 17 100.0

Figure 4.2: Autonomous maintenance practices
4.8. Outsourcing maintenance
The outcome of 53% of the firms within the county outso
picture that the same percentage have not owned
Table 4.7: Outsourcing
Outsourcing Maintenance
Yes
No
Not sure
Total
0
20
40
60
80
Low
5.9
Autonomous maintenance practices
26
Autonomous maintenance practices
Outsourcing maintenance
The outcome of 53% of the firms within the county outsource maintenance is a clear
picture that the same percentage have not owned TPM as shown in Table 4.7
: Outsourcing maintenance
Outsourcing Maintenance
Frequency Percent(%)
9 52.9
4 23.5
Not sure 4 23.5
17 100.0
PercentAverage
Fairly highHigh
70.6
11.811.8
Autonomous maintenance practices
rce maintenance is a clear
TPM as shown in Table 4.7.
Cumulative
Percent(%)
52.9
76.5
100.0
Percent
Autonomous maintenance practices
Percent

27
4.9. Degree of involvement of machine operator
Table 4.8: Degree of involvement of machine operator
Mean Std dev Rank
Machine cleaning 3.7647 1.14725 2
Lubrication: oil checks, greasing etc. 3.5294 1.12459 4
Basic condition monitoring 3.8824 1.11144 1
Tightening of loose connections (spannering) 3.3529 1.16946 5
Machine inspection 3.7647 1.03256 2
Level of operator involvement in the Table 4.8 maintenance activities is between
moderate to high. This means that operators undertake basic conditioning of their
machines this had a mean score of 3.8824 and a standard deviation of 1.11144 while on
the issue of tightening of loose connection had a mean score of 3.3529 and a standard
deviation of 1.16946.
4.10. Health, safety and environment measures
Health, safety and environment is the 8th pillar of TPM and implement a methodology to
drive towards the achievement of zero accident. It is important to note that this is not just
safety related but covers zero accidents, zero overburden (physical and mental stress and
strain on employees) and zero pollution. Quite impressing fromtable 4.9which shows that
this pillar is highly adopted 59% of the firms within the region have taken this pillar
highly.

28
Table 4.9: Health, safety and environment measures
Health, Safety and Environment
Measures Frequency Percent(%)
Cumulative
Percent(%)
Fairly Low 2 11.8 11.8
Average 5 29.4 41.2
Fairly High 3 17.6 58.8
High 7 41.2 100.0
Total 17 100.0
4.11. Employee involvement in maintenance activities
The research shows 53% of the employees are below average on the engagement on
maintenance activities. Only 24% of the employees within firms within the county have a
high involvement on maintenance activities.
Table 4.10: Employee involvement in maintenance activities
Employee Involvement in Maintenance
Activities Frequency
Percent
(%)
Cumulative Percent
(%)
Average 9 52.9 52.9
Fairly High 4 23.5 76.5
High 4 23.5 100.0
Total 17 100.0

29
4.12. Manufacturing performance measure
Table 4.11 Manufacturing Performance Measure
Mean Std dev Rank
What is the levels of product quality
(higher levels of conformance to specifications)
4.2500 0.85635 1
What is the delivery performance (higher percentage of on-
time deliveries and by faster speeds of delivery)
4.1333 0.83381 2
What is the Cost improvements e.g. materials, labour 3.2000 0.77460 13
What is the level in customer complaints 2.0000 1.19523 15
What is the manufacturing cycle time. 3.4286 1.08941 8
What is the level of inventory 3.2500 0.85635 12
What is the level of Improved environmental responsibility 3.5625 0.96393 6
What is the Improvement in overall productivity 3.6000 0.91026 5
What is the level of reduction in lead time 3.3571 0.84190 10
What is the Reduction in processing time 3.2000 0.67612 13
What is the level of Continuous flow production 3.3125 0.70415 11
What is the level of Improved equipment efficiency 3.7500 0.77460 4
What is the level of health and safety standards 3.8125 0.91059 3
What is the level of Elimination of waste 3.5625 1.15289 6
What is the level of Overall processing flexibility
improvements
3.3750 1.02470 9
Table 4.11 showed that Continuous improvement initiatives in maintenance management
had high influence in the level of product quality that is the level of the product quality
conformance to specification with the mean score of 4.2500, the next most influenced
manufacturing priorities by the continuous improvement initiatives was the delivery
performance with mean score of 4.1333 followed by the level of health and safety

30
standard with mean score of 3.8125, the list item with a mean score of 2.0000 was the
level of customer complaints.
4.13. Critical success factor for total productive maintenance
Table 4.12: Critical success factor for total productive maintenance
Mean Std dev Rank
What is the management support and commitment 4.1765 0.80896 1
What is the sense of ownership and responsibility from the
operators
3.7143 0.82542 7
What is the level of Co-operation and involvement of both the
operators and the maintenance workers
3.9375 0.68007 2
What is the level of An attitude change by everybody from
“that's not my job” to “this is what I can do to help”
3.3750 0.95743 12
What is the level of Alignment of management initiatives 3.6667 0.81650 8
What is the level of Financial support for maintenance
activities
3.8125 0.91059 4
What is the level of Cultural change for the operators 3.1250 0.61914 14
What is the level of Operators’ autonomy 3.4000 0.63246 11
What is the level of Greater communication and cooperation
between operations and maintenance departments
3.7500 1.00000 6
What is the level of Training and education 3.4118 1.00367 10
What is the level of Introduction of major maintenance
activities by use of committees/ task teams
3.3125 0.94648 13
What is the level of Open communication and creating a
climate of trust
3.4706 0.94324 9
What is the level of Employee participation 3.7647 0.83137 5
What is the level of Teamwork 3.8235 0.88284 3

31
In determining the level of total productive maintenance adoption in the organization the
survey score on table 4.12 critical factors indicated the management support and
commitment with a mean of 4.1765 followed by the level of cooperation and involvement
of both the operators and the maintenance workers with a mean of 3.9375, the third in the
raw was the level of teamwork with a mean of 3.8235 and the list management
maintenance practice with the mean of 3.1250 was the level of cultural change for the
operator.

32
4.14. Factors to successful total productive maintenance implementation
Table 4.13: Factors to successful total productive maintenance
implementation
Mean Std dev Rank What is the level of top management support and commitment
4.0000 0.93541 1
What is the level of maintenance activities – controlled by tight budget
3.1875 0.98107 2
What is the level on the Pressure of workload 3.0625 0.68007 4 What is the level of Union/ Worker resistance to new maintenance initiatives
2.4375 0.96393 10
What is the level of Senior management’s tolerance of poor behavior
2.7143 1.38278 5
What is the level of Contradiction of management’s initiatives 2.4667 0.99043 9 What is the level of Overly optimistic expectations 2.5385 0.77625 7 What is the level of Lack of a well-defined routine for attaining the objectives of implementation
2.3125 1.13835 12
What is the level of Cultural resistance to change towards new maintenance methodologies
2.4375 0.96393 10
What is the level of Lack of training and education 2.5000 1.09545 8 What is the level of Lack of organizational communication 2.2500 0.85635 13 What is the level of Skilled trades feeling indispensable (e.g. thinking that any new maintenance activity threatens their jobs)
2.6250 0.95743 6
What is the level of Organizational focus on results rather than on activities
3.1250 0.95743 3
What is the level of Inability to change organizational roles and culture
2.1875 0.65511 14
What is the level of Deployment of inexperienced consultants 2.6250 1.08781 6 What is the level of Deviations between officially laid out maintenance policies and actual practices deployed at workplace
2.3750 0.80623 11

33
In determining the successful total productive maintenance implementation as shown in
table 4.13 that the factor that was clear was on the level of top management support and
commitment followed by the level of maintenance activities controlled by tight budget
and the level of organization focusing on result s rather than on activities with the means
score of 4.000, 3.1875 and 3.1250 consequently. The level of inability to change
organizational role and culture score the list mean of 2.1875.

34
4.15. Correlation
Table 4.14: Correlation
Processing
Performance Level of TPM Adoption
Pearson Correlation Processing
Performance
1.000 0.781
Level of TPM
Adoption
0.781 1.000
According to the Pearson correlation coefficient the researcher observed that adoption of
total productive maintenance was perceived to strongly result to improving process
performance. Table 4.14 shows that 78.1% of process performance is as a result of
adoption of total productive maintenance while 21.9% was as a result of factors outside
the model. The 78.1% suits the manufacturing sector performance which meant a lot of
emphasize on cost reduction, increasing quality and delivery levels and improving
equipment and human resource flexibility. The same percentage could also be interpreted
as a key factor in determining product quality.
35
CHAPTER FIVE: SUMMARY, CONCLUSION AND
RECOMMENDATIONS
5.1 Introduction
This chapter provided a summary, conclusion and recommendations drawn from the
study. The conclusions are drawn from the objectives that the study sought to realize as
well as the research findings. The chapter also covered the limitations of the study and
made recommendations on areas that will require more research to enhance greater
understanding of the subject area.
5.2 Summary
The study focused on establishing the adoption level of TPM in the food processing firms
in Kilifi as well as determination of implementation of TPM factors by firms in Kilifi
County. The firms which participated were drawn from the directory of the county
ministry of industrialization office. The study was a census study of 20 firms, 17 firms
responded which amounted to 85% response turn out.
It was found that most of the food processing firms in Kilifi County are less than 10years
in service and have less than 50 employees. It is also apparent that the firms have
maintenance activities but not specific TPM at large.The finding also shows the extent to
which food processing firms in Kilifi have adopted TPM in most of the factors it showed
the level of adoption as moderate to high, the correlation level of processing performance
and TPMwas very positive with a 70% mark of influence.

36
5.3 Conclusions
The researcher drew conclusions based on the research finding (in chapter four) and in
line with the study research objective which was to establish the adoption of total
productive maintenance in food processing firms in Kilifi County and to determine the
factors influencingimplementation of total productive maintenance in the food processing
firms in Kilifi County.
Research finding indicated that the level of total productive maintenance adoption in
Kilifi County food processing firms is moderate to high with critical success factors
applied systematically as indicated in table 4.12, as well the correlation between
processing performance and TPM adoption having a remarkable performance table 4.14.
The researcher outcome conquers with the research conducted in South Africa pulp and
Paper Company in 2002 by Van der Wal & Lynn where TPM increases productivity,
quality & reduction in cost of production (Sharma et al., 2006). The results have
indicated maintenance support the production department to achieve the desired quality
and quantity of product produced (Nakajima 1988).
5.4 Recommendations
The study established that performance is seventy percent influenced by total productive
maintenance practice. Therefore TPM adoption can enhance the operation performance
of the processing firms in the region if fully adopted, the County government investment
or marketing department should categorically mention the benefit of TPM to
manufacturing investors inorder to lure them to the region.
37
5.5 Limitations of the Study
The study was carried out within a short period of time and some firms could not respond
within time,others were reluctant to participate since they had little time to spare and
most indicated that these were their working hours. The fear of firms thinking that an
investigation is being carried against them drags the process. One of the cashewnut firms
was closed down, kilifi plantation milk processing firm has given the work to buzeki
which does part of the processing within the region and a big processing work is done
upcountry. Accessibility of the firms was a challenge. This was because the firms were
highly dispersed and the region is very vast.
5.6 Areas of Further Research
A further study needs to be taken to compare the impact of TPM on other
manufacturing firms in the region and develop a comprehensive standard
recommendation. A research can also be done on specific pillar of the eight pillars of
TPM to ascertain TPM performance in other counties. A study can also be done on the
impact of TPM on financial performance in different sectors such as mining, fishing. It
is hoped that the information accrued from this article will trigger more studies to be
conducted in lean manufacturing.

38
REFERENCES
Aerospace (1999), ‘Aerospace supplier blast off with TPM’, Industrial Maintenance
&plant operation, vol 60 No. 9, pp 44 – 6.
Ahmed, S., Hassan, M.H. & Taha, Z. (2005), “TPM can go beyond maintenance: excerpt
from a case implementation”, Journal of Quality in Maintenance Engineering,
Vol. 11 No. 1, pp. 19-42.
Ahuja, I.P.S., Khamba, J.S. & Choudhary, R. (2006), “Improved organizational behavior
through strategic total productive maintenance implementation”, Proceedings of
2006 ASME International Mechanical Engineering Congress and Exposition
(IMECE), at Chicago, Illinois (U.S.A.), pp. 1-8. (Paper No. IMECE2006-15783).
Ahuja, I.P.S. & Khamba, J.S. (2007), “Total productive maintenance: literature review
and directions”, Journal of Quality in Maintenance EngineeringVol. 13 No. 4, 2007pp. 338-352.
Ahuja, I.P.S. & Khamba, J.S. (2008), “Total productive maintenance: literature review
and directions”, International Journal of Quality & Reliability Management, Vol.
25 No. 7,pp. 709-56.
Ahuja, I.P.S. & Khamba, J.S. (2008a), “An evaluation of TPM initiatives in Indian
industry for enhanced manufacturing performance”, International Journal of
Quality & Reliability Management, Vol. 25 No. 2, pp. 147-72.
Ahuja, I.S. (2012), “Exploring the impact of effectiveness of total productive
maintenance strategies in manufacturing enterprise”, International Journal of
Productivity and Quality Management, Vol. 9, No. 4, pp. 486-501.
Alsyouf, I. (2009), “Maintenance practices in Swedish industries: survey results”,
International Journal of Production and Economics, Vol. 121, pp. 212-223.
39
Al-Najjar, B. & Alsyouf, I. (2003), ‘‘Selecting the most efficient maintenance approach
using fuzzy multiple criteria decision making’’, International Journal of
Production Economics, Vol. 84 No. 1, pp. 85-100.
Arca, J.G. & Pradi, J.C. (2008), “Personnel participation as a key factor for success
inmaintenance program implementation”, International Journal of Productivity
andPerformance Management, Vol. 57 No. 3, pp. 247-58.
Babicz,G.(2000), ‘Teach operators maintenance’, Quality, vol 39 No. 11, pp 72 -3.
Bamber, C.J., Sharp, J.M. & Hides, M.T. (1999), “Factors affecting successful
implementation of total productive maintenance”, Journal of Quality in
Maintenance Engineering, Vol. 5, pp. 162-81.
Blili, S. & Raymond, L. (1993), “Information technology: threats and opportunities for
small and medium-sizedenterprises”, International Journal of Information
Management, Vol. 13 No. 6, pp. 439-48.
Brah, S.A. & Chong, W.K. (2004), “Relationship between total productive maintenance
and performance”, International Journal of Production Research, Vol. 42 No. 12,
pp. 2383-401.
Coetzee, J.L. (1999), “A holistic approach to the maintenance problem”, Journal of
Quality in Maintenance Engineering, Vol. 5 No. 3, pp. 276-80.
Conway, T. & Perry, E. (1999) pp. 281-4, “Incorporating statistical process control into
the team-based TPM environment”, Proceedings of 1999 IEEE International
Symposium on Semiconductor Manufacturing, pp. 1-8.
Cua, K.O., McKone, K.E. & Schroeder, R.G. (2001), “Relationships between
implementation of TQM, JIT, and TPM and manufacturing performance”, Journal
of Operations Management, Vol. 19 No. 6, pp. 675-94.

40
Gosavi, A. (2006), “A risk-sensitive approach to total productive maintenance”,
Automatic, Vol. 42 No. 8, pp. 1321-30.
Graisa,M. & Al-Habaibeh, A. (2011), “An investigation into current production
challenges facingthe Libyan cement industry and the need for innovative total
Productivemaintenance (TPM)strategy”, Journal of Manufacturing Technology
Management, Vol. 22 No. 4, pp. 541-558.
Gupta, R.C., Sonwalkar, J. & Chitale, A.K. (2001), “Overall equipment effectiveness
through total productive maintenance”, Prestige Journal of Management and
Research, Vol. 5 No. 1, pp. 61-72.
Halim Mad Lazim & T. Ramayah (2010), ‘Maintenance strategy in
Malaysianmanufacturing companies: a total productive maintenance (TPM)
approach’, business strategy series vol. 11 no. 6 2010, page 387
Heizer, J. & Render, B. (2009), Operations Management Flexible Edition, 9th ed.,
Pearson Prentice-Hall, Upper Saddle River, NJ.
Heston, T. (2006), “Culture change for maintenance”, Fabrication and Metalworking,
Vol. 5, No. 9, pp. 70-72.
Ireland, F. & Dale, B.G. (2001), “A study of total productive maintenance
implementation”, Journal of Quality in Maintenance Engineering, Vol. 7 No. 3,
pp. 183-92.
Juric, Z., Sanchez, A.I. & Goti, A. (2006), “Money-based overall equipment
effectiveness”, Hydrocarbon Processing (International edition), Vol. 85 No. 5,
pp. 43-5.
Ireland, F. & Dale, B.G. (2006), “Total productive maintenance: criteria for
success”,International Journal of Productivity and Quality Management, Vol. 1,
No. 3, pp. 207–223.
41
Kenya national bureau of statistics (KNBS),’2009 statistical Abstract’.
Kenya national bureau of statistics (KNBS),’the 2010 Economic Survey’.
Kenya national bureau of statistics (KNBS),’the 2013 Economic Survey’.
Khazraei, K. and Deuse, J. (2011), “A strategic standpoint on maintenance taxonomy”,
Journalof Facilities Management, Vol. 9, No. 2, pp. 96-113.
Koelsch, J.R. (1993), “A dose of TPM: downtime needn’t be a bitter pill”, Manufacturing
Engineering, Vol. 110 No. 4, pp. 63-6.
Kodali, R. (2001), “Quantification of Total Productive Maintenance (TPM) benefits
through AHP model”, Productivity, Vol. 42 No. 2, pp. 265-74.
Kodali, R. & Chandra, S. (2001), “Analytical hierarchy process for justification of total
productive maintenance”, Production Planning and Control, Vol. 12 No. 7, pp.
695-705.
Konecny, P.A. & Thun, J.H. (2011), “Do it separately or simultaneously-An empirical
analysis of a conjoint implementation of TQM and TPM on plant performance”,
International Journal of Production Economics, Vol. 133, No. 2, pp. 496-507.
Krawjeski, L.J. & Ritzman, L.P. (2002), Operations Management: Strategy and Analysis,
6th ed. Prentice-Hall, Upper Saddle River, NJ.
Kutucuoglu, K.Y., Hamali, J. & Sharp, J.M. (2002), “Enabling BPR in maintenance
through performance measurement system framework”, The International Journal
of Flexible Manufacturing Systems, Vol. 14, No. 1, pp. 33-52.
Kutucuoglu, K.Y., Hamali, J., Irani, Z. & Sharp, J.M. (2001), “A framework for
managing maintenance using performance measurement systems”, International
Journal of Operations & Production Management, Vol. 21 Nos 1/2, pp. 173-94.

42
McAdam, R. & McGeogh, F. (2000), ‘Implementing total productive maintenancein
multi-union manufacturing organizations: overcoming job demarcation’, Total
quality management, vol. II No.2 pp 187
McKone, K.E., Roger, G.S. & Cua, K.O. (1999), “Total productive maintenance: a
contextual view”, Journal of Operations Management, Vol. 17, pp. 123-44.
McKone, K.E., Roger, G.S. & Cua, K.O. (2001), “The impact of total productive
maintenance practices on manufacturing performance”, Journal of Operations
Management, Vol. 19, pp. 39-58.
Mishra, R.P., Anand, G. & Kodali, R. (2007), “Strengths, weaknesses, opportunities and
threats analysis for frameworks of world-class maintenance”, Journal
ofEngineering Manufacture, Vol. 221, No. 7, pp. 1193-1208.
Mulwa L.(2000), ‘Operation management Techniques in Maintenance
Management,’unpublished MBA Thesis, University of Nairobi.
Muthu, S., Devadasan, S.R., Saleem, A. Suresh, P. & Baldhandayutham, R.
(2000),“Benchmarking for Strategic Maintenance Quality Improvement”,
Benchmarking: An International Journal, Vol. 7, No. 4, pp. 292-303.
Nakajima, S. (1988), Introduction to Total Productive Maintenance (TPM), Productivity
Press, Portland, OR.
Nakajium, S. (1988), Introduction to TPM: Total Productive Maintenance, Productivity
Press, Cambridge, MA. OR.
Nakajima, S. (1989), TPM Development Program: Implementing Total Productive
Maintenance, Productivity Press Inc., Cambridge, MA.
Nguyen, D.T.H.C., Murphy, J. & Olaru, D. (2003),“Investigating the adoption of
electronic customer serviceby Australian businesses”, Managing Service Quality,
Vol. 13No. 6, pp. 492-503.

43
Njihia, M. J (1994),’Resource Allocation for Road Maintenance Funds in the Ministry of
Public Works and Housing: The Application of ‘Hard’ and ‘soft’ Operations
Research,’ unpublished MBA Thesis, University of Nairobi.
Ollila, A. & Malmipuro, M. (1999), “Maintenance has a role in quality”, The TQM
Magazine, Vol. 11 No. 1, pp. 17-21.
Oso, W. Y and Onen, D. (2008). A General guide to writing research proposal and
report.A handbook for Beginning Researchers, second edition. Makerere
university printer, Kampala.
Pophaley, M. & Vyas, R.K. (2010), “Optimizing maintenance management efforts by the
application of TOC: a case study”, The IUP Journal of Operations Management,
Vol. 9, No. 3,pp. 48-61.
Pramod, V.R., Devadasan, S.R. & Raj, V.P.J. (2007), “Receptivity analysis of TPM
among internal customers”, International Journal of Technology, Policy and
Management, Vol. 7, No. 1, pp. 75-88.
Ravishankar, G., Burczak, C. & Vore, R.D. (1992), “Competitive manufacturing through
total productive maintenance”, Semiconductor Manufacturing Science
Symposium, ISMSS 1992, IEEE/SEMI International, 15-16 June, pp. 85-89.
Rodrigues, M. & Hatakeyama, K. (2006), “Analysis of the fall of TPM in companies”,
Journal of Materials Processing Technology, Vol. 179 Nos 1-3, pp. 276-9.
Rogers, E.M. (1995), Diffusion of Innovations, 4th ed., The Free Press, New York, NY.
Russell, R.S. & Taylor, B.W. (2009), Operations Management: Creating Value along the
Supply Chain, 6th ed., Wiley, New York, NY.
Sangameshwran, P. & Jagannathan, R. (2002), “HLL’s manufacturing renaissance”,
Indian Management, November, pp. 30-5.

44
Schonberger, L. (1996), World Class Manufacturing: the Next Decade: Building Power,
Strength and Value,The Free Press, New York, NY.
Seth, D. & Tripathi, D. (2005), “Relationship between TQM and TPM implementation
factors and business performance of manufacturing industry in Indian context”,
The International Journal of Quality & Reliability Management, Vol. 22 Nos 2/3,
pp. 256-77.
Seth, D. & Tripathi, D. (2006), ‘‘A critical study of TQM and TPM approaches on
business performance of Indian manufacturing industry’’, Total Quality
Management, Vol. 17 No. 7, pp. 811-24.
Shamsuddin, A., Hassan, M.H. & Taha, Z. (2005), “TPM can go beyond maintenance:
excerpt from a case implementation”, Journal of Quality in Maintenance
Engineering, Vol. 11 No. 1, pp. 19-42.
Sharma, R.K., Kumar, D. & Kumar, P. (2005), “FLM to select suitable maintenance
strategy in process industries using MISO model”, Journal of Quality in
Maintenance Engineering, Vol. 11 No. 4, pp. 359-74.
Sharma, R.K., Kumar, D. & Kumar, P. (2006), ‘‘Manufacturing excellence through TPM
implementation: a practical analysis’’, Industrial Management & Data Systems,
Vol. 106 No. 2, pp. 256-80.
Shirose, K. (1996), Total Productive Maintenance: New Implementation Program in
Fabrication and Assembly Industries, Japan Institute of Plant Maintenance,
Tokyo.
Shields, J. (2007), Managing Employee Performance and Reward: Concepts, Practices,
Strategies,Cambridge University Press, New York, NY.
Singh, B.J. & Khanduja, D. (2010), “SMED: for quick changeovers in foundry SMEs”,
The International Journal of Productivity and Performance Management, Vol.
59, No. 1, pp. 98-116.

45
Singh, K. & Ahuja, I.S. (2012), “Justification of TQM–TPM implementations in
manufacturing organizations using analytical hierarchy process: a decision-
making approach under uncertainty,”The International Journal of Productivity
and Quality Management, Vol. 10, No. 1, pp. 69-84.
Tajiri, M. & Gotoh, F. (1992), TPM Implementation: A Japanese Approach, McGraw-
Hill Inc., New York, NY.
Tripathi, D. (2005), “Influence of experience and collaboration on effectiveness of
quality management practices: the case of Indian manufacturing”, International
Journal of Productivity and Performance Management, Vol. 54 No. 1, pp. 23-33.
Vasilash, G.S (1999), ‘Getting Lean at Ford Windsor operations’,
Automotivemanufacturing and production, vol.111 No. 8 pp 52
Voss, C.A. (1995), “Alternative paradigms for manufacturing strategy”, International
Journal of Operations & Production Management, Vol. 15 No. 4, pp. 5-16.
Voss, C.A. (2005), “Paradigms of manufacturing strategy re-visited”, International
Journal of Operations & Production Management, Vol. 25 No. 12, pp. 1223-7.
Wang, F.K. (2006), “Evaluating the efficiency of implementing total productive
maintenance”, Total Quality Management, Vol. 17 No. 5, pp. 655-67.
Wireman, T. (2004), Total Productive Maintenance, Industrial Press Inc., New York,
NY.

46
APPENDICES
Appendix I: Questionnaire
Declaration
This research intends to examine the extent to which level the food processing firms have
adopted Total Productive Maintenance (TPM) affects manufacturing performance in the
Kenyan manufacturing sector. It aims to identify the key success factors, benefits and
challenges of TPM in the food processing firms. The information obtained from this
survey shall be kept confidential, and shall be used strictly for academic purposes only.
Your participation in this survey shall be highly appreciated.
SECTION A: Company Profile
Name of Organization _________________________________________
Position held _________________________________________
Department/ Function _________________________________________
1. How long has the firm been in operation?
0-5 ( ) 6-10 ( ) 10-15( ) Over 15 years ( )
2. What is the total number of employees in your organization?
1-50 ( ) 51-100 ( ) 101-150 ( ) 151-200 ( ) Above 200 ( )
3. Which processing sector does your organization belong to? Indicate by ticking
Food processing type
Grain milling ( )
Bakery and confection ( )
Dairy ( )
Fruit processing ( )
47
Spirits ( )
Beer and tobacco ( )
Sugar ( )
Soft drinks and carbonated water ( )
Animal feeds ( )
Edible oil ( )
Others ( )
Section B: Total Productive Maintenance Practices
4. Do you think the maintenance techniques currently used by your organization are appropriate?
Yes ( ) No ( ) Not Sure ( )
5. How would you describe your organization’s maintenance philosophy?
a) Reactive ( )
b) Somewhat Reactive ( )
c) Neither Reactive nor proactive ( )
d) Somewhat proactive ( )
e) Proactive ( )
6. To what extent is Autonomous Maintenance practiced in your organization? 1. Low ( ) 2. Fairly low( ) 3. Average ( ) 4. Fairly high ( ) 5. High( )
7. Does your organization do outsourcing of maintenance activities?
Yes ( ) No ( ) Not Sure ( )

48
8. What is the level of operator involvement in following maintenance activities?
Scale ranging from (1) Very Low (2) Low (3) Moderate (4) High (5) Very High
Level of operator Involvement in Maintenance SCALE
1 2 3 4 5
Machine cleaning
Lubrication: oil checks, greasing etc
Basic condition monitoring
Tightening of loose connections (spannering)
Machine inspection
9. What is the extent of Health, Safety and Environment measuresas incorporated in
yourmaintenance activities?
1. Low ( ) 2. Fairly low ( ) 3. Average ( ) 4. Fairly high ( ) 5. High ( )
10. To what extent is everyone involved in the maintenance activities inyour organization? 1. Low ( ) 2. Fairly low( ) 3. Average ( ) 4. Fairly high ( ) 5. High ( )

49
Section C: TPM and Processing Performance
11. To what extent has continuous improvement initiatives in maintenance management
helped in achieving the following organizational manufacturing priorities and goals?
Scale ranging from (1) Very Low (2) Low (3) Moderate (4) High (5)Very High
Manufacturing Performance Measure SCALE
1 2 3 4 5
What is the levels of product quality
(higher levels of conformance to specifications)
What is the delivery performance(higher percentage
of on-time deliveries and by faster speedsof delivery)
What is the Cost improvements e.g. materials, labour
What is the level in customer complaints
What is the manufacturing cycle time.
What is the level of inventory
What is the level of Improved environmental
responsibility
What is the Improvement in overall productivity
What is the level of reduction in lead time
What is the Reduction in processing time
What is the level of Continuous flow production
What is the level of Improved equipment efficiency
What is the level of health and safety standards
What is the level of Elimination of waste
What is the level of Overall processing flexibility
improvements

50
Section D: Level of TPM adoption
12. To what extent are the following maintenance management practices/
factorsimplemented in your organization?
Scale ranging from (1) Very Low (2) Low (3) Moderate (4) High (5) Very High
Critical success factors for TPM
SCALE 1 2 3 4 5
What is the management support and commitment What is the sense of ownership and responsibility from theoperators
What is the level of Co-operation and involvement of both the operators and the maintenance workers, and importantly
What is the level of An attitude change by everybody from “that's not my job” to “this is what I can do to help”
What is the level of Alignment of management initiatives
What is the level of Financial support for maintenance activities
What is the level of Cultural change for the operators What is the level of Operators’ autonomy What is the level of Greater communication and cooperation between operations and maintenance departments
What is the level of Training and education What is the level of Introduction of major maintenance activities by use ofcommittees/ task teams
What is the level of Open communication and creating a climate of trust
What is the level of Employee participation What is the level of Teamwork

51
Section E: Factors to successful TPM implementation
13. To what extent have the following practices/ factors been witnessed in
yourorganization’s maintenance activities?
Scale ranging from (1) Very Low (2) Low (3) Moderate (4) High (5)Very High
Challenge
SCALE 1 2 3 4 5
What is the level of top management support and commitment
What is the level of maintenanceactivities – controlled by tight budget
What is the level on the Pressure of workload What is the level ofUnion/ Worker resistance to new maintenance initiatives
What is the level of Senior management’s tolerance of poor behavior
What is the level of Contradiction of management’s initiatives
What is the level of Overly optimistic expectations What is the level of Lack of a well-defined routine for attaining theobjectives of implementation
What is the level of Cultural resistance to change towards new maintenancemethodologies
What is the level of Lack of training and education What is the level of Lack of organizational communication
What is the level of Skilled trades feeling indispensable (e.g. thinking thatany new maintenance activity threatens their jobs)
What is the level of Organizational focus on results rather than on activities
What is the level of Inability to change organizational roles and culture
What is the level of Deployment of inexperienced consultants
What is the level of Deviations between officially laid out maintenancepolicies and actual practices deployed at workplace

52
Appendix II: Letter of Introduction